Embed Size (px)
Citation preview
___________________________________________________________________________
2011/SCSC/WKSP2/012 Session 3
Green Buildings Regulation Project - A Partnership of Jakarta Government and IFC
Submitted by: IFC
Green Buildings and Green Growth: Approaches to Encouraging a Positive
Green Building Climate Singapore
12-13 September 2011
10/20/2011
1
Green Buildings Regulation ProjectGreen Buildings Regulation Projecta partnership of Jakarta Government and IFC
Presentation for APEC‐ASEAN Green Buildings ConferenceSingapore, 12 September, 2011
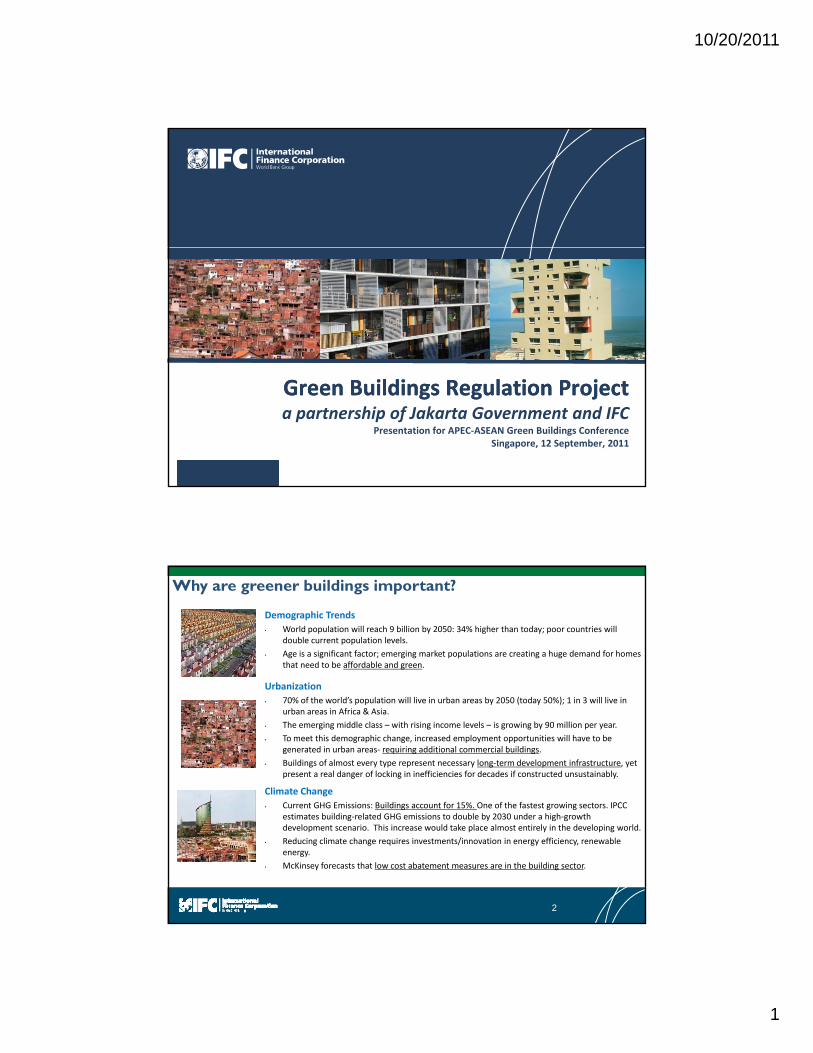
Why are greener buildings important?
Urbanization
Demographic Trends
• World population will reach 9 billion by 2050: 34% higher than today; poor countries will double current population levels.
• Age is a significant factor; emerging market populations are creating a huge demand for homes that need to be affordable and green.
Climate Change
Current GHG Emissions: Buildings account for 15% One of the fastest growing sectors IPCC
Urbanization
• 70% of the world’s population will live in urban areas by 2050 (today 50%); 1 in 3 will live in urban areas in Africa & Asia.
• The emerging middle class – with rising income levels – is growing by 90 million per year.
• To meet this demographic change, increased employment opportunities will have to be generated in urban areas‐ requiring additional commercial buildings.
• Buildings of almost every type represent necessary long‐term development infrastructure, yet present a real danger of locking in inefficiencies for decades if constructed unsustainably.
• Current GHG Emissions: Buildings account for 15%. One of the fastest growing sectors. IPCC estimates building‐related GHG emissions to double by 2030 under a high‐growth development scenario. This increase would take place almost entirely in the developing world.
• Reducing climate change requires investments/innovation in energy efficiency, renewable energy.
• McKinsey forecasts that low cost abatement measures are in the building sector.
2
10/20/2011
2
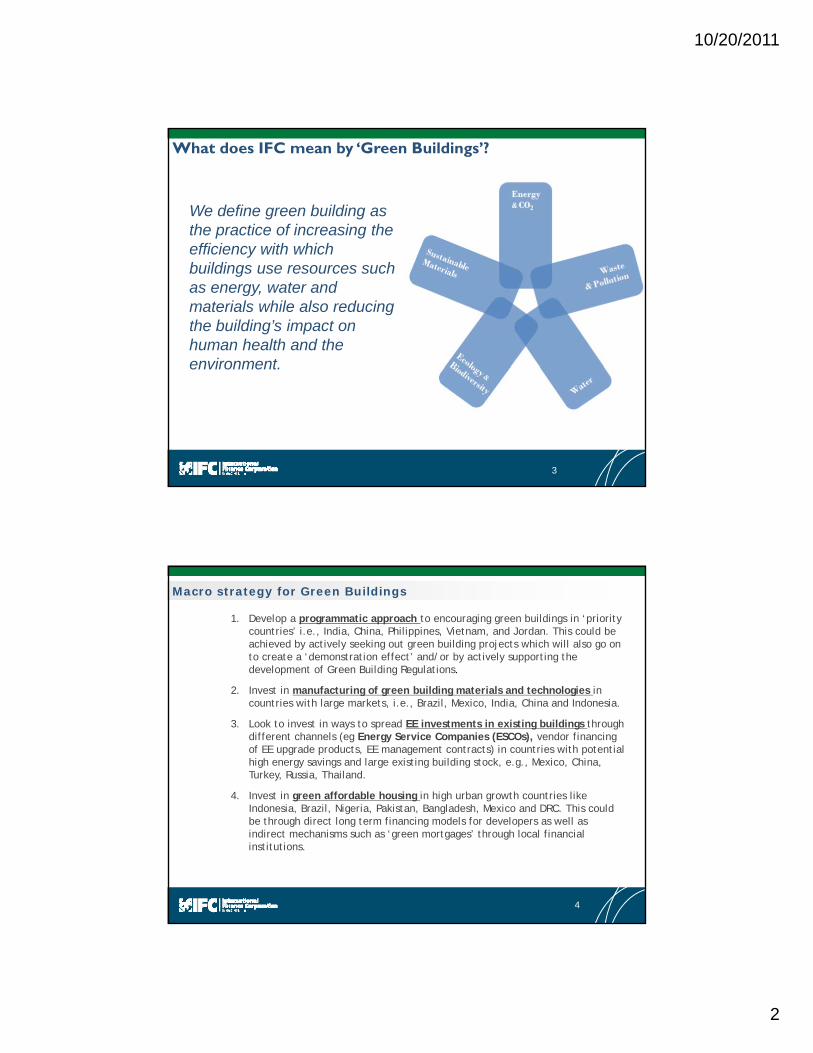
What does IFC mean by ‘Green Buildings’?
We define green building as the practice of increasing the efficiency with whichefficiency with which buildings use resources such as energy, water and materials while also reducing the building’s impact on human health and the environmentenvironment.
3
Macro strategy for Green Buildings
1. Develop a programmatic approach to encouraging green buildings in ‘priority countries’ i.e., India, China, Philippines, Vietnam, and Jordan. This could be achieved by actively seeking out green building projects which will also go on to create a ‘demonstration effect’ and/or by actively supporting the development of Green Building Regulations.
2. Invest in manufacturing of green building materials and technologies in countries with large markets, i.e., Brazil, Mexico, India, China and Indonesia.
3. Look to invest in ways to spread EE investments in existing buildings through different channels (eg Energy Service Companies (ESCOs), vendor financing of EE upgrade products, EE management contracts) in countries with potential high energy savings and large existing building stock, e.g., Mexico, China, Turkey, Russia, Thailand.
4. Invest in green affordable housing in high urban growth countries like I d i B il Ni i P ki B l d h M i d DRC Thi ld Indonesia, Brazil, Nigeria, Pakistan, Bangladesh, Mexico and DRC. This could be through direct long term financing models for developers as well as indirect mechanisms such as ‘green mortgages’ through local financial institutions.
4
10/20/2011
3
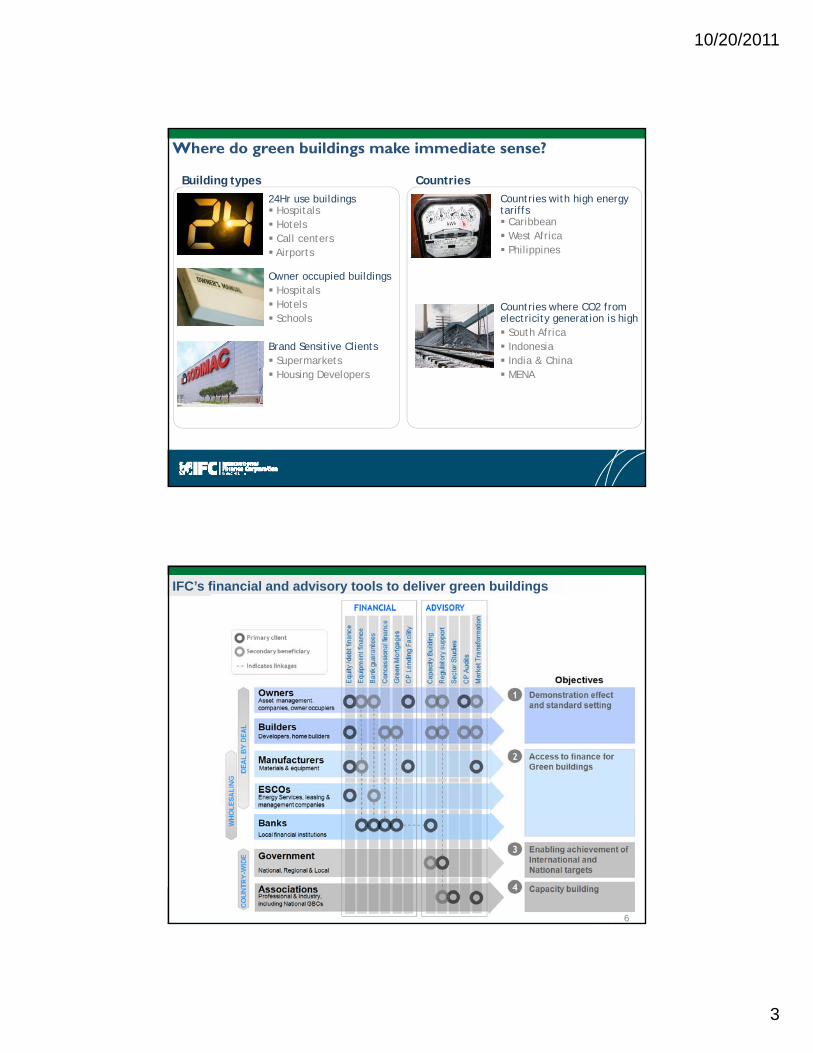
Where do green buildings make immediate sense?
24Hr use buildings Hospitals Hotels Call centers
Countries with high energy tariffs Caribbean West Africa
Phili i
Building types Countries
Airports
Owner occupied buildings Hospitals Hotels Schools
Brand Sensitive Clients Supermarkets
Philippines
Countries where CO2 from electricity generation is high South Africa Indonesia India & China
Housing Developers MENA
IFC’s financial and advisory tools to deliver green buildings
6
10/20/2011
4
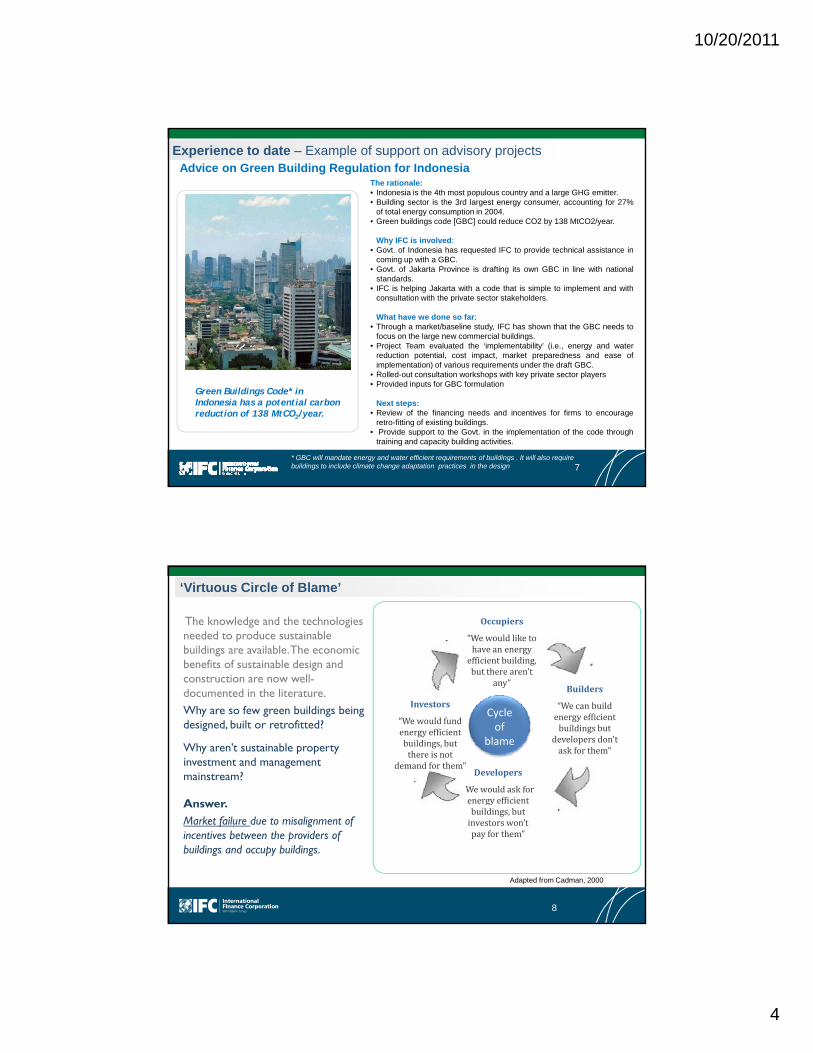
Experience to date – Example of support on advisory projects
The rationale:• Indonesia is the 4th most populous country and a large GHG emitter.• Building sector is the 3rd largest energy consumer, accounting for 27%
of total energy consumption in 2004.• Green buildings code [GBC] could reduce CO2 by 138 MtCO2/year.
Why IFC is involved:G t f I d i h t d IFC t id t h i l i t i
Advice on Green Building Regulation for Indonesia
• Govt. of Indonesia has requested IFC to provide technical assistance incoming up with a GBC.
• Govt. of Jakarta Province is drafting its own GBC in line with nationalstandards.
• IFC is helping Jakarta with a code that is simple to implement and withconsultation with the private sector stakeholders.
What have we done so far:• Through a market/baseline study, IFC has shown that the GBC needs to
focus on the large new commercial buildings.• Project Team evaluated the ‘implementability’ (i.e., energy and water
reduction potential, cost impact, market preparedness and ease ofimplementation) of various requirements under the draft GBC.
Green Buildings Code* in Indonesia has a potential carbon reduction of 138 MtCO2/year.
* GBC will mandate energy and water efficient requirements of buildings . It will also require buildings to include climate change adaptation practices in the design
implementation) of various requirements under the draft GBC.• Rolled-out consultation workshops with key private sector players• Provided inputs for GBC formulation
Next steps:• Review of the financing needs and incentives for firms to encourage
retro-fitting of existing buildings.• Provide support to the Govt. in the implementation of the code through
training and capacity building activities.
7
‘Virtuous Circle of Blame’
Occupiers
“Wewouldliketohaveanenergyefficientbuilding,buttherearen’t
any”
The knowledge and the technologies needed to produce sustainable buildings are available. The economic benefits of sustainable design and construction are now well- any
Builders
“Wecanbuildenergyefficientbuildingsbut
developersdon’taskforthem”
Developers
“Wewouldaskforenergyefficient
Investors
“Wewouldfundenergyefficientbuildings,butthereisnot
demandforthem”
Cycle of
blame
documented in the literature.Why are so few green buildings being designed, built or retrofitted?
Why aren’t sustainable property investment and management mainstream?
Answer gybuildings,butinvestorswon’tpayforthem”
Answer.Market failure due to misalignment of incentives between the providers of buildings and occupy buildings.
Adapted from Cadman, 2000
8
10/20/2011
5
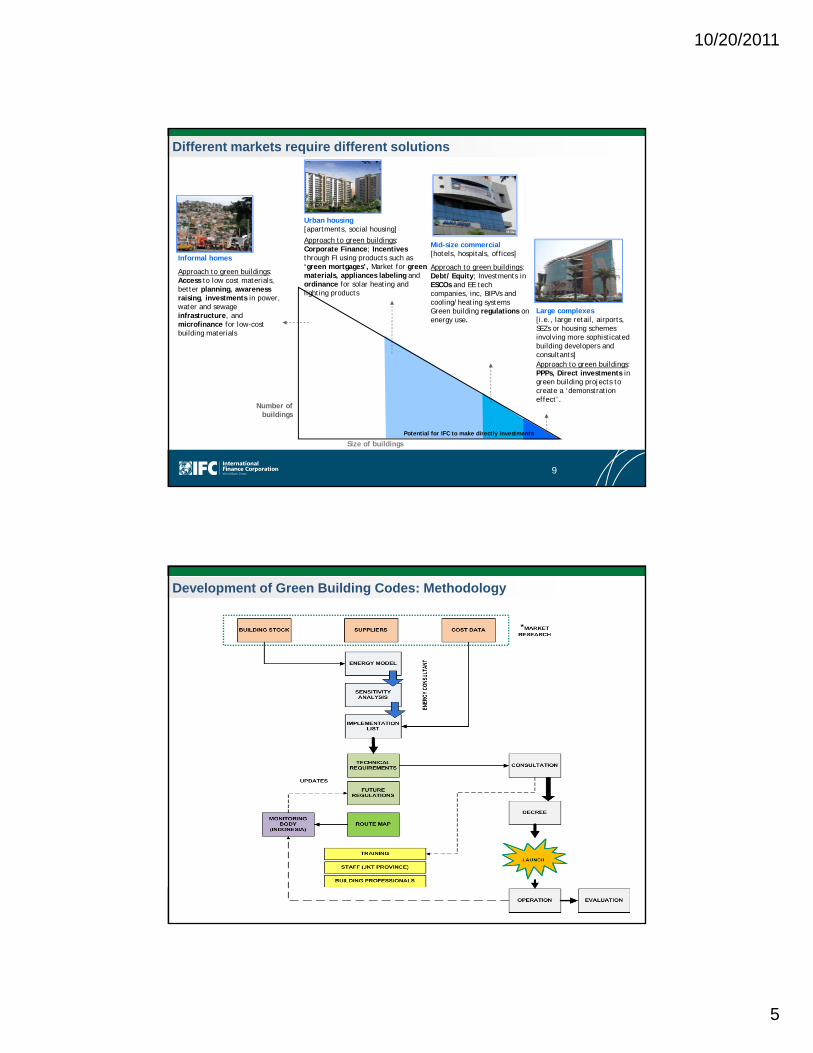
Different markets require different solutions
Mid-size commercial
Urban housing [apartments, social housing]
Approach to green buildings: Corporate Finance; Incentives
[hotels, hospitals, offices]
Approach to green buildings: Debt/ Equity; Investments in ESCOs and EE tech companies, inc, BIPVs and cooling/heating systems Green building regulations on energy use.
Large complexes [i.e., large retail, airports, SEZs or housing schemes involving more sophisticated building developers and consultants]Approach to green buildings:
Informal homes
Approach to green buildings: Access to low cost materials, better planning, awarenessraising, investments in power, water and sewage infrastructure, and microfinance for low-cost building materials
Corporate Finance; Incentives through FI using products such as ‘green mortgages’, Market for green materials, appliances labeling and ordinance for solar heating and lighting products
Number of buildings
pp g gPPPs, Direct investments in green building projects to create a ‘demonstration effect’.
Potential for IFC to make directly investments
Size of buildings
9
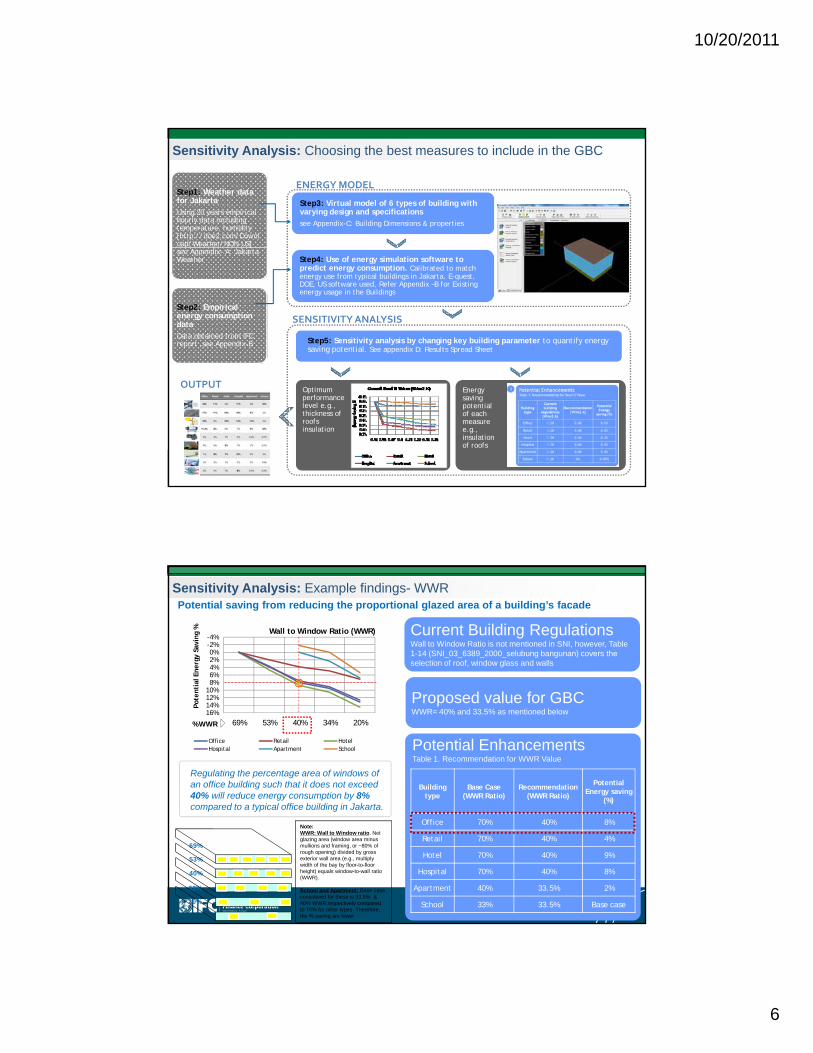
Development of Green Building Codes: Methodology
10/20/2011
6
Step1: Weather data for JakartaUsing 20 years empirical hourly data including temperature, humidity [http://doe2.com/Download/Weather/NON-US]
ENERGY MODEL
Step3: Virtual model of 6 types of building with varying design and specifications see Appendix-C: Building Dimensions & properties
Sensitivity Analysis: Choosing the best measures to include in the GBC
]see Appendix- A: Jakarta Weather
Step2: Empirical energy consumption dataData obtained from IFC report ,see Appendix-B
Step4: Use of energy simulation software to predict energy consumption. Calibrated to match energy use from typical buildings in Jakarta. E-quest, DOE, US software used, Refer Appendix –B for Existing energy usage in the Buildings
Step5: Sensitivity analysis by changing key building parameter to quantify energy saving potential. See appendix D: Results Spread Sheet
SENSITIVITY ANALYSIS
Optimum performance level e.g., thickness of roofs insulation
Energy saving potential of each measure e.g., insulation of roofs
OUTPUT
-4%-2%0%2%4%6%8%ia
l Ener
gy S
avin
g % Wall to Window Ratio (WWR) Current Building Regulations
Wall to Window Ratio is not mentioned in SNI, however, Table 1-14 (SNI_03_6389_2000_selubung bangunan) covers the selection of roof, window glass and walls
Wall to Window RatioSensitivity Analysis: Example findings- WWRPotential saving from reducing the proportional glazed area of a building’s facade
10%12%14%16%
69% 53% 40% 34% 20%
Pot
enti
Office Retail Hotel Hospital Apartment School
Proposed value for GBC WWR= 40% and 33.5% as mentioned below
Building type
Base Case (WWR Ratio)
Recommendation (WWR Ratio)
Potential Energy saving
(%)
Potential EnhancementsTable 1. Recommendation for WWR Value
%WWR
Regulating the percentage area of windows of an office building such that it does not exceed 40% will reduce energy consumption by 8%
d t t i l ffi b ildi i J k t
Office 70% 40% 8%
Retail 70% 40% 4%
Hotel 70% 40% 9%
Hospital 70% 40% 8%
Apartment 40% 33.5% 2%
School 33% 33.5% Base case
33%
40%
53%
69%
20%
Note:WWR: Wall to Window ratio. Net glazing area (window area minus mullions and framing, or ~80% of rough opening) divided by gross exterior wall area (e.g., multiply width of the bay by floor-to-floor height) equals window-to-wall ratio (WWR).
School and Apartment: Base case considered for these is 33.5% & 40% WWR respectively compared to 70% for other types. Therefore, the % saving are lower
compared to a typical office building in Jakarta.
10/20/2011
7
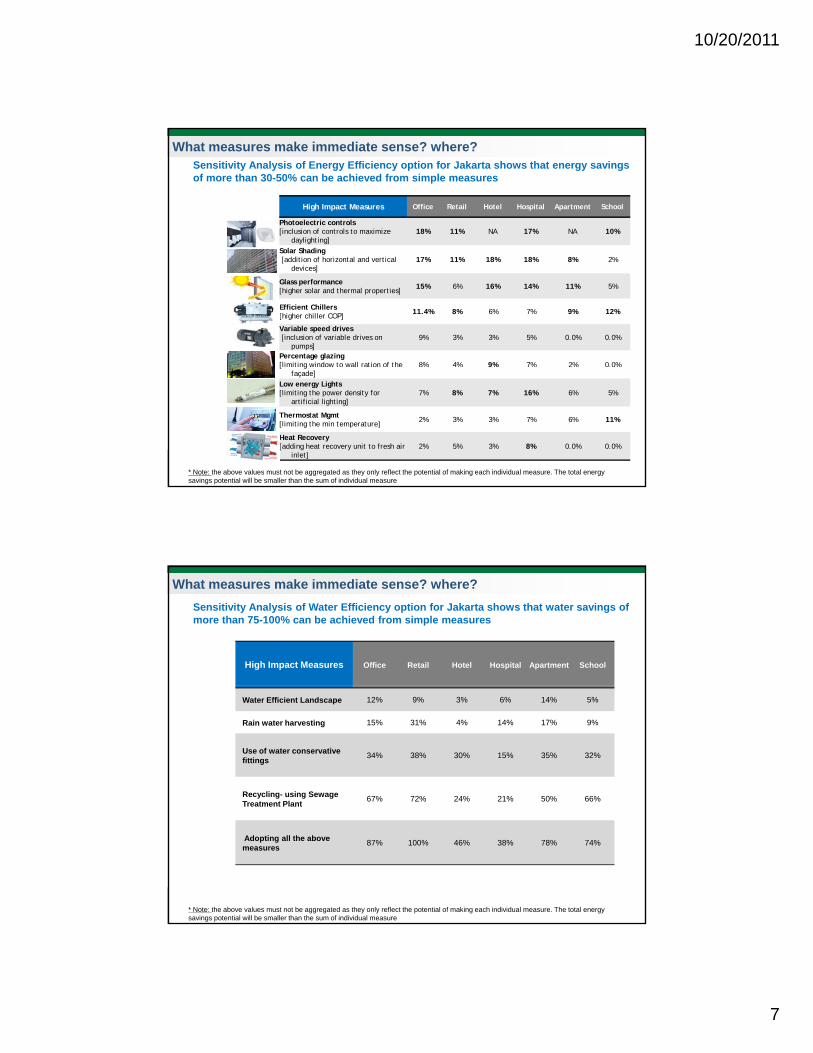
Sensitivity Analysis of Energy Efficiency option for Jakarta shows that energy savings of more than 30-50% can be achieved from simple measures
High Impact Measures Office Retail Hotel Hospital Apartment School
Photoelectric controls[inclusion of controls to maximize
daylighting]18% 11% NA 17% NA 10%
What measures make immediate sense? where?
Solar Shading[addition of horizontal and vertical
devices]17% 11% 18% 18% 8% 2%
Glass performance[higher solar and thermal properties]
15% 6% 16% 14% 11% 5%
Efficient Chillers[higher chiller COP]
11.4% 8% 6% 7% 9% 12%
Variable speed drives[inclusion of variable drives on
pumps]9% 3% 3% 5% 0.0% 0.0%
Percentage glazing[limiting window to wall ration of the 8% 4% 9% 7% 2% 0.0%[ g
façade]Low energy Lights[limiting the power density for
artificial lighting]7% 8% 7% 16% 6% 5%
Thermostat Mgmt [limiting the min temperature]
2% 3% 3% 7% 6% 11%
Heat Recovery [adding heat recovery unit to fresh air
inlet]2% 5% 3% 8% 0.0% 0.0%
* Note: the above values must not be aggregated as they only reflect the potential of making each individual measure. The total energy savings potential will be smaller than the sum of individual measure
Sensitivity Analysis of Water Efficiency option for Jakarta shows that water savings of more than 75-100% can be achieved from simple measures
What measures make immediate sense? where?
High Impact Measures Office Retail Hotel Hospital Apartment School
Water Efficient Landscape 12% 9% 3% 6% 14% 5%
Rain water harvesting 15% 31% 4% 14% 17% 9%
Use of water conservative fittings
34% 38% 30% 15% 35% 32%
Recycling- using Sewage Treatment Plant
67% 72% 24% 21% 50% 66%
* Note: the above values must not be aggregated as they only reflect the potential of making each individual measure. The total energy savings potential will be smaller than the sum of individual measure
Treatment Plant
Adopting all the above measures
87% 100% 46% 38% 78% 74%
10/20/2011
8
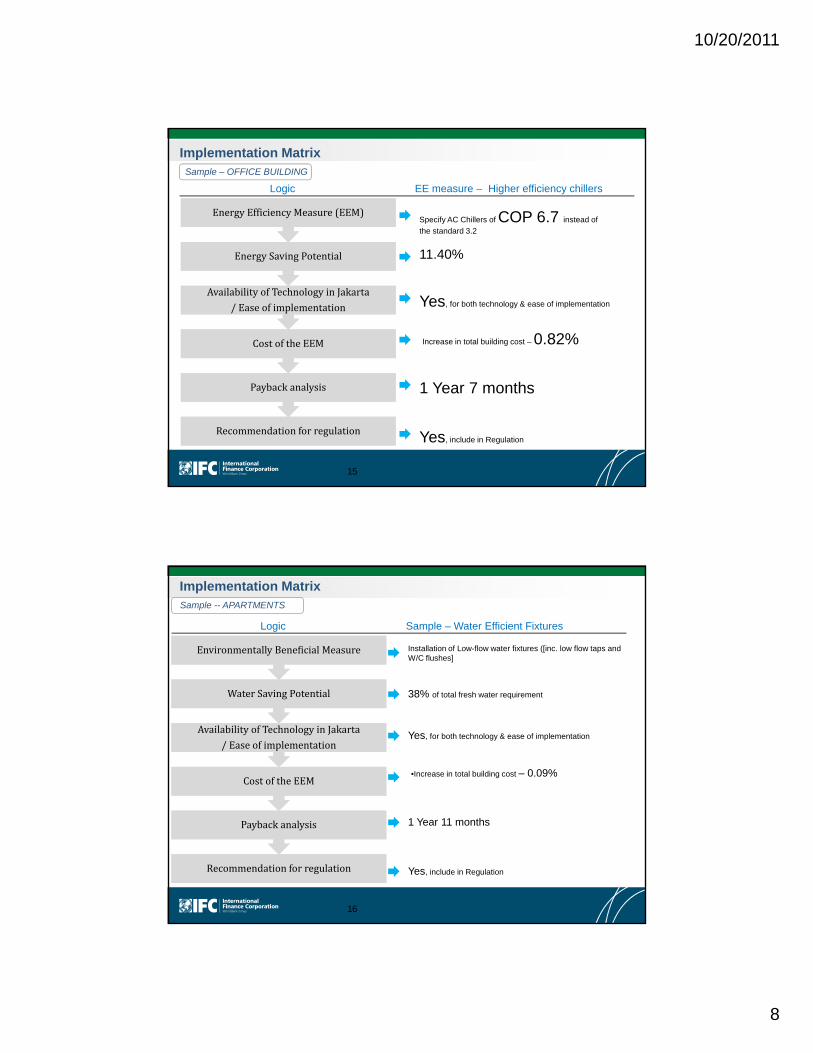
EnergyEfficiencyMeasure(EEM)EnergyEfficiencyMeasure(EEM)Specify AC Chillers of COP 6.7 instead of
the standard 3.2
Logic EE measure – Higher efficiency chillers
Implementation MatrixSample – OFFICE BUILDING
CostoftheEEMCostoftheEEM
AvailabilityofTechnologyinJakarta
/Easeofimplementation
AvailabilityofTechnologyinJakarta
/Easeofimplementation
EnergySavingPotentialEnergySavingPotential 11.40%
Yes, for both technology & ease of implementation
Increase in total building cost – 0.82%
15
RecommendationforregulationRecommendationforregulation
PaybackanalysisPaybackanalysis 1 Year 7 months
Yes, include in Regulation
EnvironmentallyBeneficialMeasureEnvironmentallyBeneficialMeasure Installation of Low-flow water fixtures ([inc. low flow taps and W/C flushes]
Logic Sample – Water Efficient Fixtures
Implementation MatrixSample -- APARTMENTS
CostoftheEEMCostoftheEEM
AvailabilityofTechnologyinJakarta
/Easeofimplementation
AvailabilityofTechnologyinJakarta
/Easeofimplementation
WaterSavingPotentialWaterSavingPotential 38% of total fresh water requirement
Yes, for both technology & ease of implementation
•Increase in total building cost – 0.09%
16
RecommendationforregulationRecommendationforregulation
PaybackanalysisPaybackanalysis 1 Year 11 months
Yes, include in Regulation
10/20/2011
9
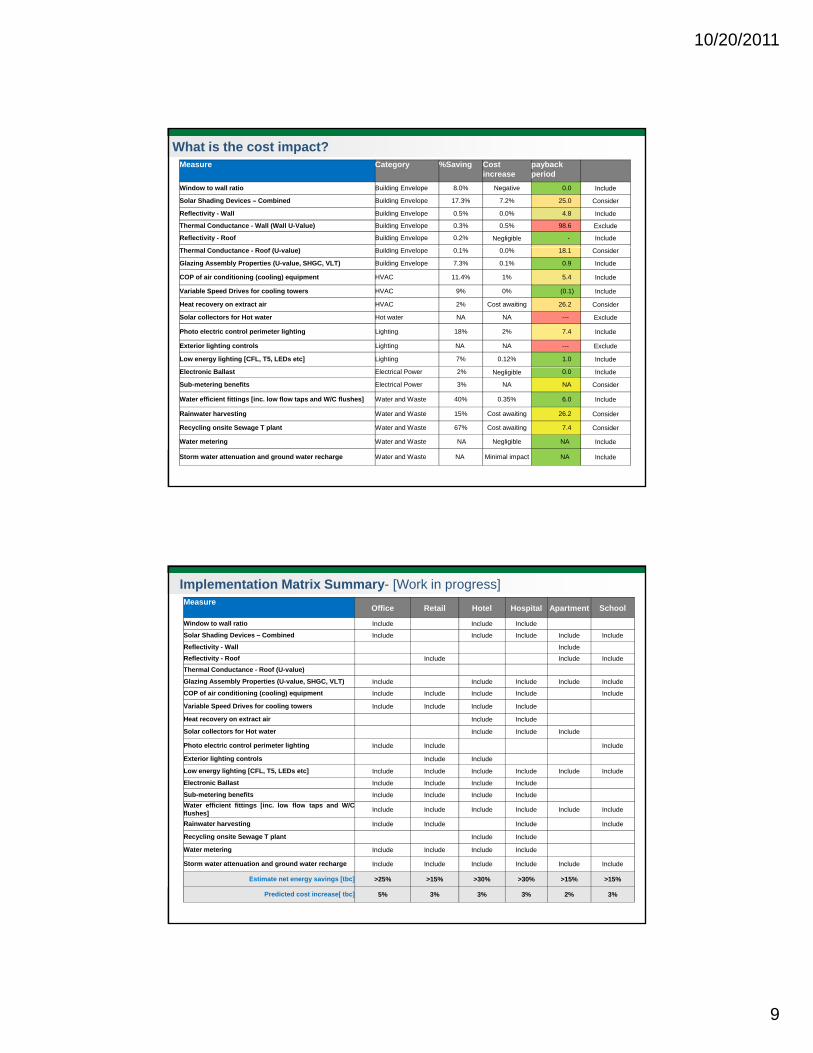
What is the cost impact?Measure Category %Saving Cost
increasepayback period
Window to wall ratio Building Envelope 8.0% Negative 0.0 Include
Solar Shading Devices – Combined Building Envelope 17.3% 7.2% 25.0 Consider
Reflectivity - Wall Building Envelope 0.5% 0.0% 4.8 Include
Thermal Conductance - Wall (Wall U-Value) Building Envelope 0.3% 0.5% 98.6 Exclude
Reflectivity - Roof Building Envelope 0.2% Negligible - Include
Thermal Conductance - Roof (U-value) Building Envelope 0.1% 0.0% 18.1 Consider
Glazing Assembly Properties (U-value, SHGC, VLT) Building Envelope 7.3% 0.1% 0.9 Include
COP of air conditioning (cooling) equipment HVAC 11.4% 1% 5.4 Include
Variable Speed Drives for cooling towers HVAC 9% 0% (0.1) Include
Heat recovery on extract air HVAC 2% Cost awaiting 26.2 Consider
Solar collectors for Hot water Hot water NA NA --- Exclude
Photo electric control perimeter lighting Lighting 18% 2% 7.4 Include
Exterior lighting controls Lighting NA NA --- Exclude
Low energy lighting [CFL, T5, LEDs etc] Lighting 7% 0.12% 1.0 Include
Electronic Ballast Electrical Power 2% Negligible 0.0 Include
Sub-metering benefits Electrical Power 3% NA NA Consider
Water efficient fittings [inc. low flow taps and W/C flushes] Water and Waste 40% 0.35% 6.0 Include
Rainwater harvesting Water and Waste 15% Cost awaiting 26.2 Consider
Recycling onsite Sewage T plant Water and Waste 67% Cost awaiting 7.4 Consider
Water metering Water and Waste NA Negligible NA Include
Storm water attenuation and ground water recharge Water and Waste NA Minimal impact NA Include
Implementation Matrix Summary- [Work in progress]Measure
Office Retail Hotel Hospital Apartment School
Window to wall ratio Include Include Include
Solar Shading Devices – Combined Include Include Include Include Include
Reflectivity - Wall Include
Reflectivity - Roof Include Include Include
Thermal Conductance - Roof (U-value)
Glazing Assembly Properties (U-value, SHGC, VLT) Include Include Include Include Include
COP of air conditioning (cooling) equipment Include Include Include Include Include
Variable Speed Drives for cooling towers Include Include Include Include
Heat recovery on extract air Include Include
Solar collectors for Hot water Include Include Include
Photo electric control perimeter lighting Include Include Include
Exterior lighting controls Include Include
Low energy lighting [CFL, T5, LEDs etc] Include Include Include Include Include Include
Electronic Ballast Include Include Include Include
Sub-metering benefits Include Include Include Include
Water efficient fittings [inc low flow taps and W/CWater efficient fittings [inc. low flow taps and W/Cflushes]
Include Include Include Include Include Include
Rainwater harvesting Include Include Include Include
Recycling onsite Sewage T plant Include Include
Water metering Include Include Include Include
Storm water attenuation and ground water recharge Include Include Include Include Include Include
Estimate net energy savings [tbc] >25% >15% >30% >30% >15% >15%
Predicted cost increase[ tbc] 5% 3% 3% 3% 2% 3%
10/20/2011
10
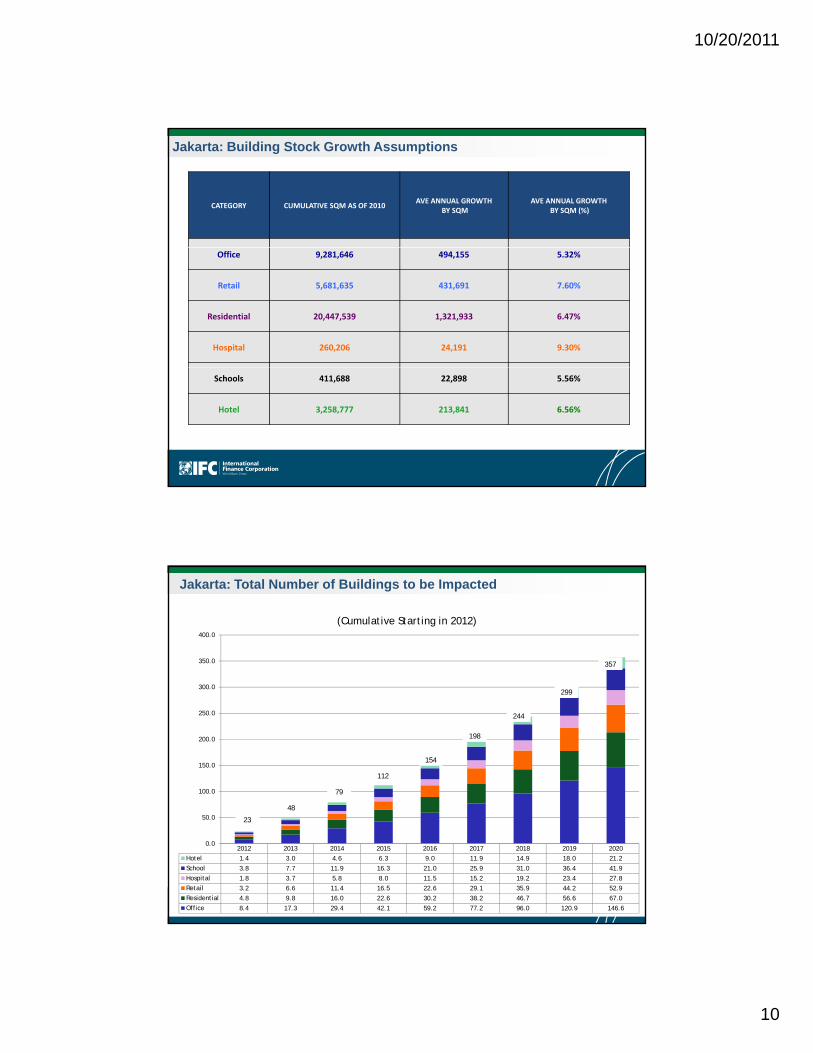
GROWTH & PROJECTIONS
CATEGORY CUMULATIVE SQM AS OF 2010AVE ANNUAL GROWTH
BY SQMAVE ANNUAL GROWTH
BY SQM (%)
Jakarta: Building Stock Growth Assumptions
Office 9,281,646 494,155 5.32%
Retail 5,681,635 431,691 7.60%
Residential 20,447,539 1,321,933 6.47%
Hospital 260,206 24,191 9.30%
Schools 411,688 22,898 5.56%
Hotel 3,258,777 213,841 6.56%
300 0
350.0
400.0
(Cumulative Starting in 2012)
357
Jakarta: Total Number of Buildings to be Impacted
100.0
150.0
200.0
250.0
300.0
244
299
154
112
198
79
2012 2013 2014 2015 2016 2017 2018 2019 2020
Hotel 1.4 3.0 4.6 6.3 9.0 11.9 14.9 18.0 21.2
School 3.8 7.7 11.9 16.3 21.0 25.9 31.0 36.4 41.9
Hospital 1.8 3.7 5.8 8.0 11.5 15.2 19.2 23.4 27.8
Retail 3.2 6.6 11.4 16.5 22.6 29.1 35.9 44.2 52.9
Residential 4.8 9.8 16.0 22.6 30.2 38.2 46.7 56.6 67.0
Office 8.4 17.3 29.4 42.1 59.2 77.2 96.0 120.9 146.6
0.0
50.0 23
48
10/20/2011
11
450,000
500,000
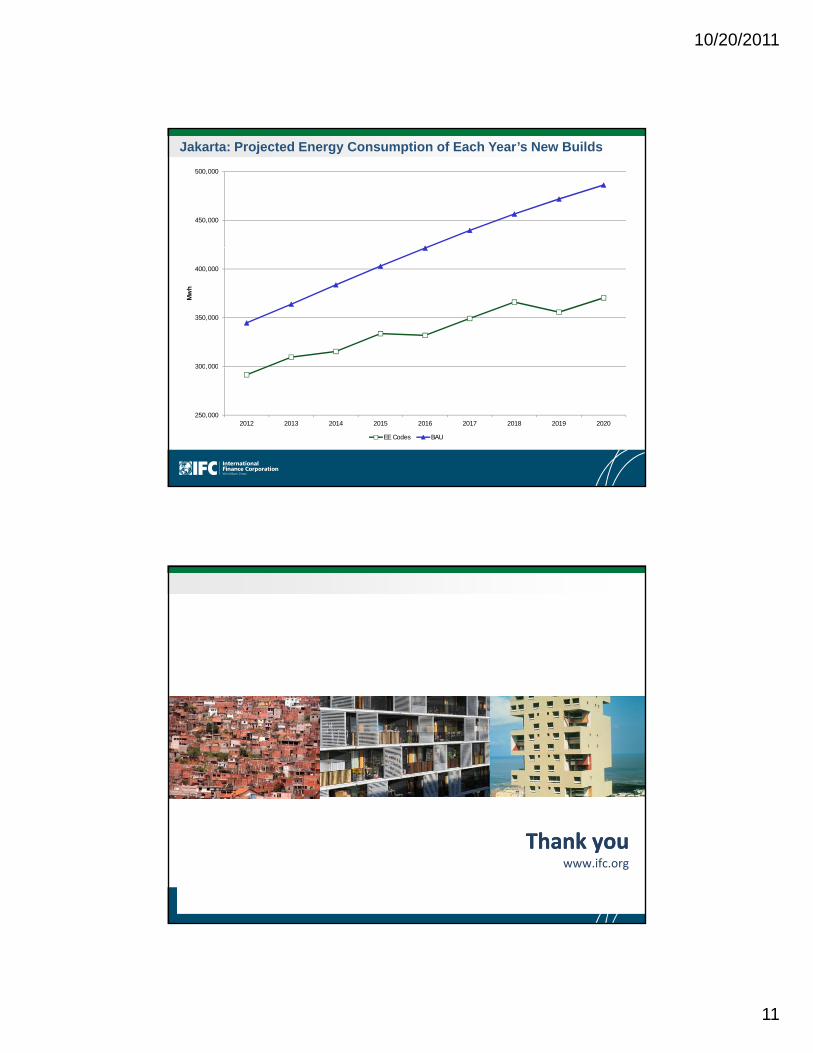
Jakarta: Projected Energy Consumption of Each Year’s New Builds
300 000
350,000
400,000
Mw
h
250,000
300,000
2012 2013 2014 2015 2016 2017 2018 2019 2020
EE Codes BAU
Thank youThank youwww.ifc.org