Embed Size (px)
Citation preview

8/6/2019 Greece Final by Sudhnya
http://slidepdf.com/reader/full/greece-final-by-sudhnya 1/15
Welcome

8/6/2019 Greece Final by Sudhnya
http://slidepdf.com/reader/full/greece-final-by-sudhnya 2/15
We are«
Section-B, Group#18
Sudhnya Amrita Islam ID#084
Shuvra Das ID#124
Md. Morshedul Haq ID#142
Tanvir Hasan ID#068
Md. Zahidul Bashar ID#140
8/6/2019 Greece Final by Sudhnya
http://slidepdf.com/reader/full/greece-final-by-sudhnya 3/15
Financial developmentand Economic Growth
An empirical Analysis
for Greece
8/6/2019 Greece Final by Sudhnya
http://slidepdf.com/reader/full/greece-final-by-sudhnya 4/15
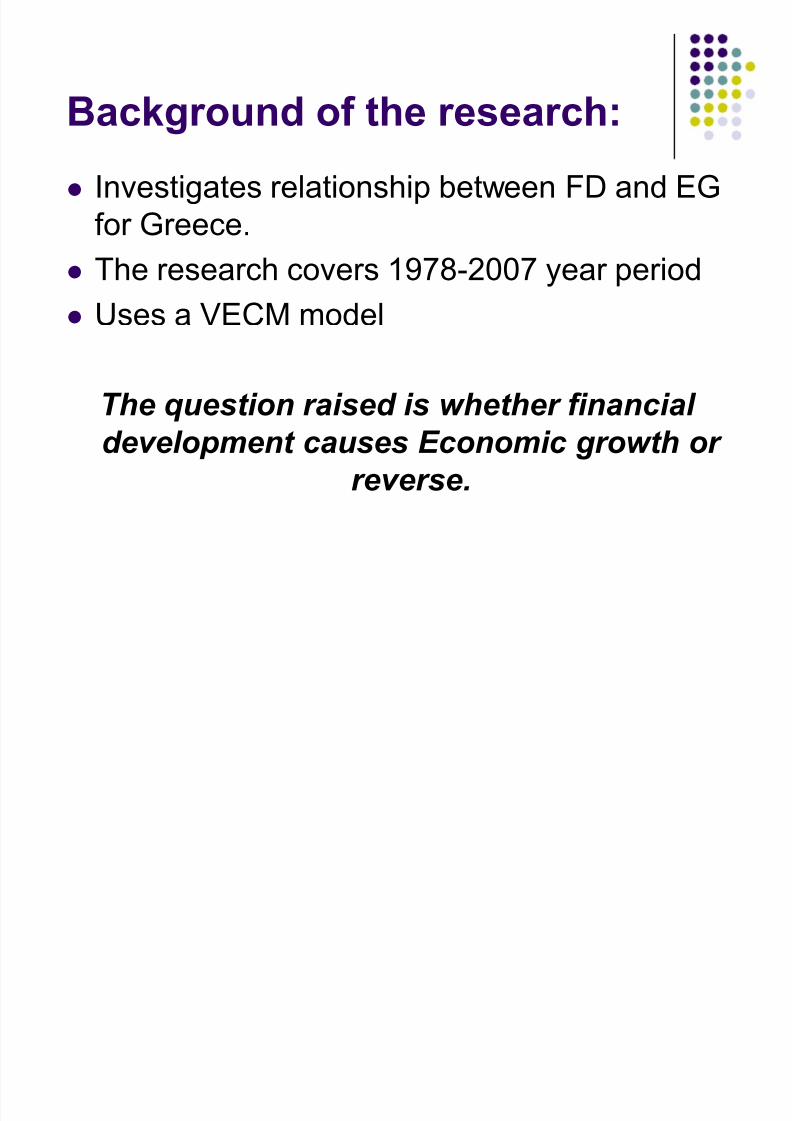
Background of the research:
Investigates relationship between FD and EG
for Greece.
The research covers 1978-2007 year period Uses a VECM model
The question raised is whether financial development causes Economic growth or
reverse.
8/6/2019 Greece Final by Sudhnya
http://slidepdf.com/reader/full/greece-final-by-sudhnya 5/15
The Objective
To examine the casual
relationship between the
variables
8/6/2019 Greece Final by Sudhnya
http://slidepdf.com/reader/full/greece-final-by-sudhnya 6/15
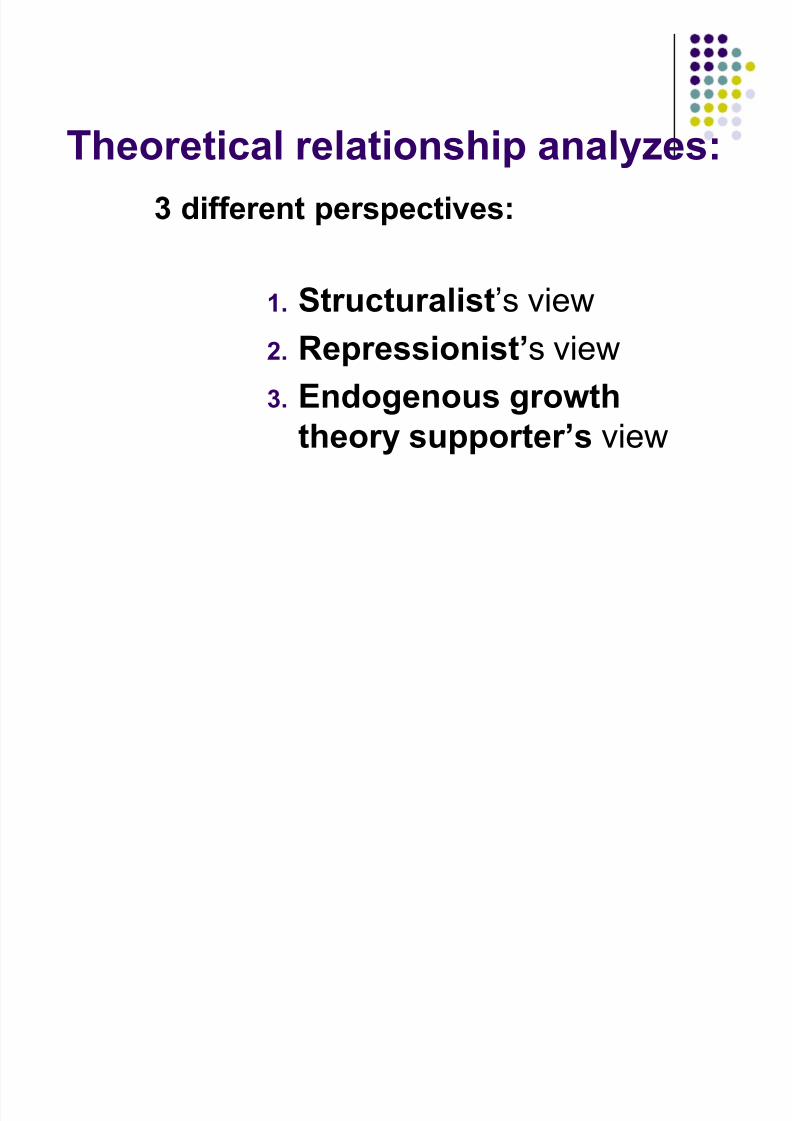
Theoretical relationship analyzes:
3 different perspectives:
1. Structuralist¶s view
2. Repressionist¶s view
3. Endogenous growth
theory supporter¶s view
8/6/2019 Greece Final by Sudhnya
http://slidepdf.com/reader/full/greece-final-by-sudhnya 7/15
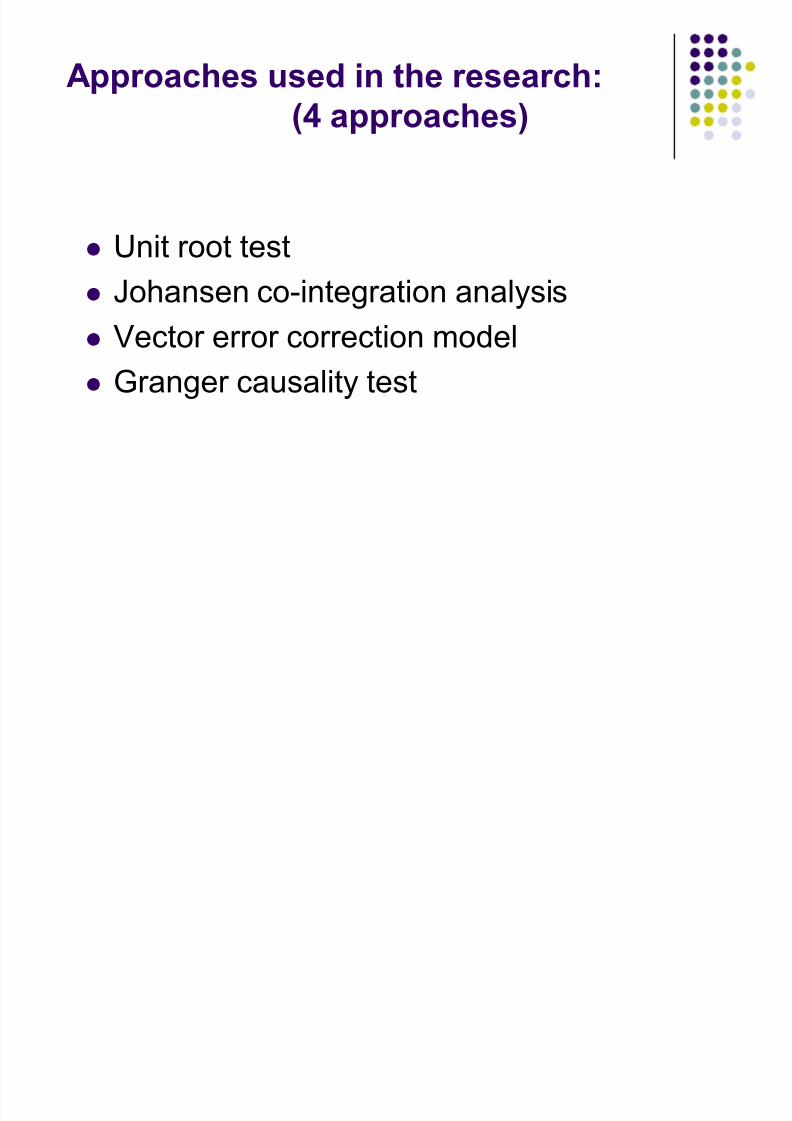
Approaches used in the research:
(4 approaches)
Unit root test
Johansen co-integration analysis
Vector error correction model
Granger causality test
8/6/2019 Greece Final by Sudhnya
http://slidepdf.com/reader/full/greece-final-by-sudhnya 8/15
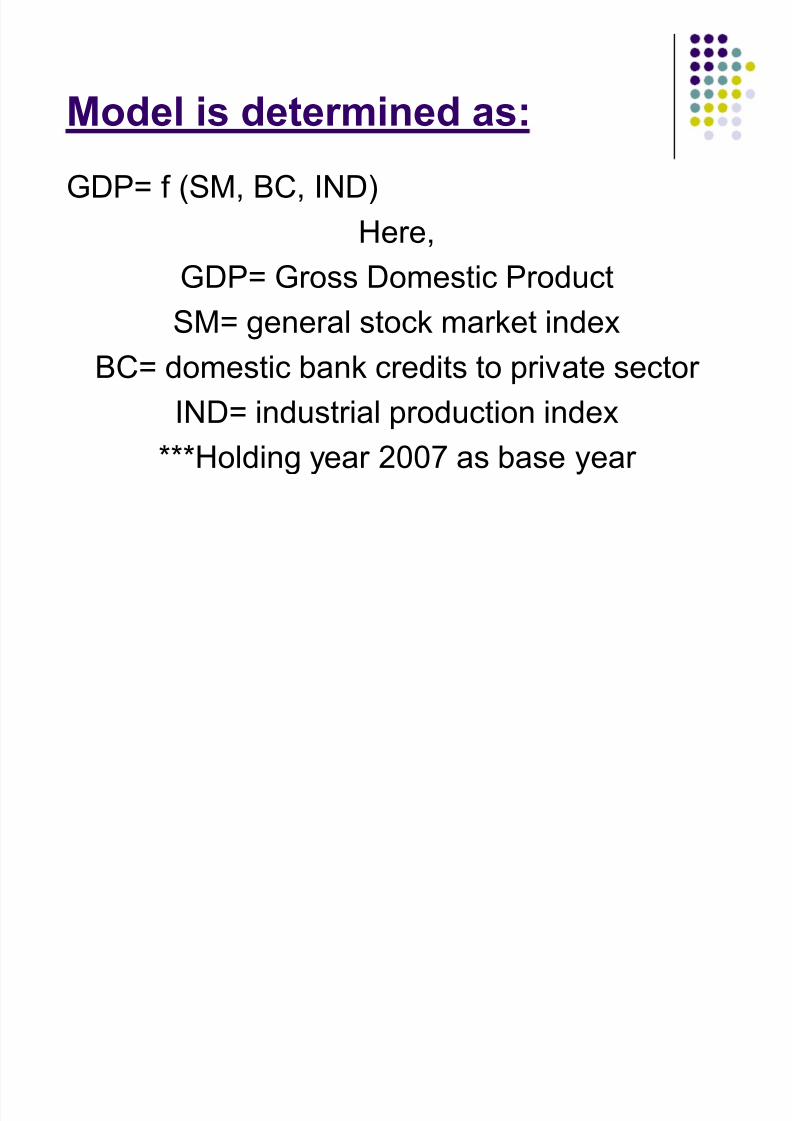
Model is determined as:
GDP= f (SM, BC, IND)
Here,
GDP= Gross Domestic ProductSM= general stock market index
BC= domestic bank credits to private sector
IND= industrial production index***Holding year 2007 as base year
8/6/2019 Greece Final by Sudhnya
http://slidepdf.com/reader/full/greece-final-by-sudhnya 9/15
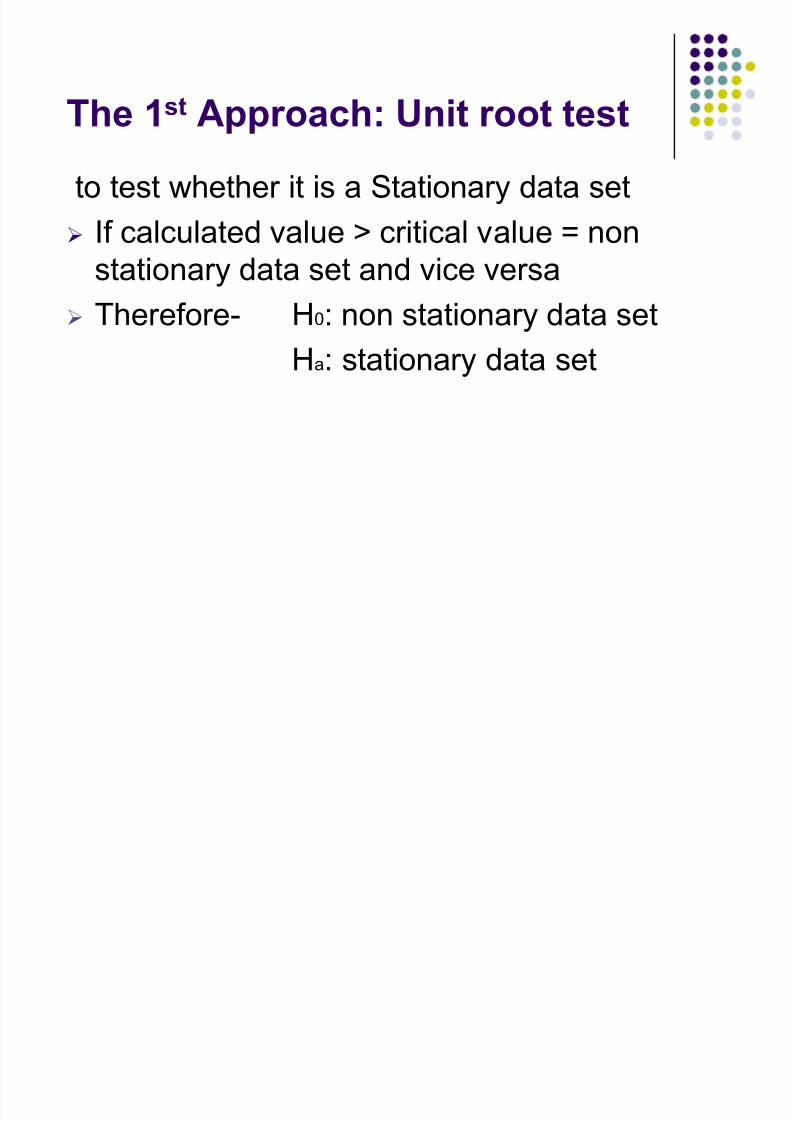
The 1st Approach: Unit root test
to test whether it is a Stationary data set
If calculated value > critical value = non
stationary data set and vice versa Therefore- H0: non stationary data set
Ha: stationary data set
8/6/2019 Greece Final by Sudhnya
http://slidepdf.com/reader/full/greece-final-by-sudhnya 10/15
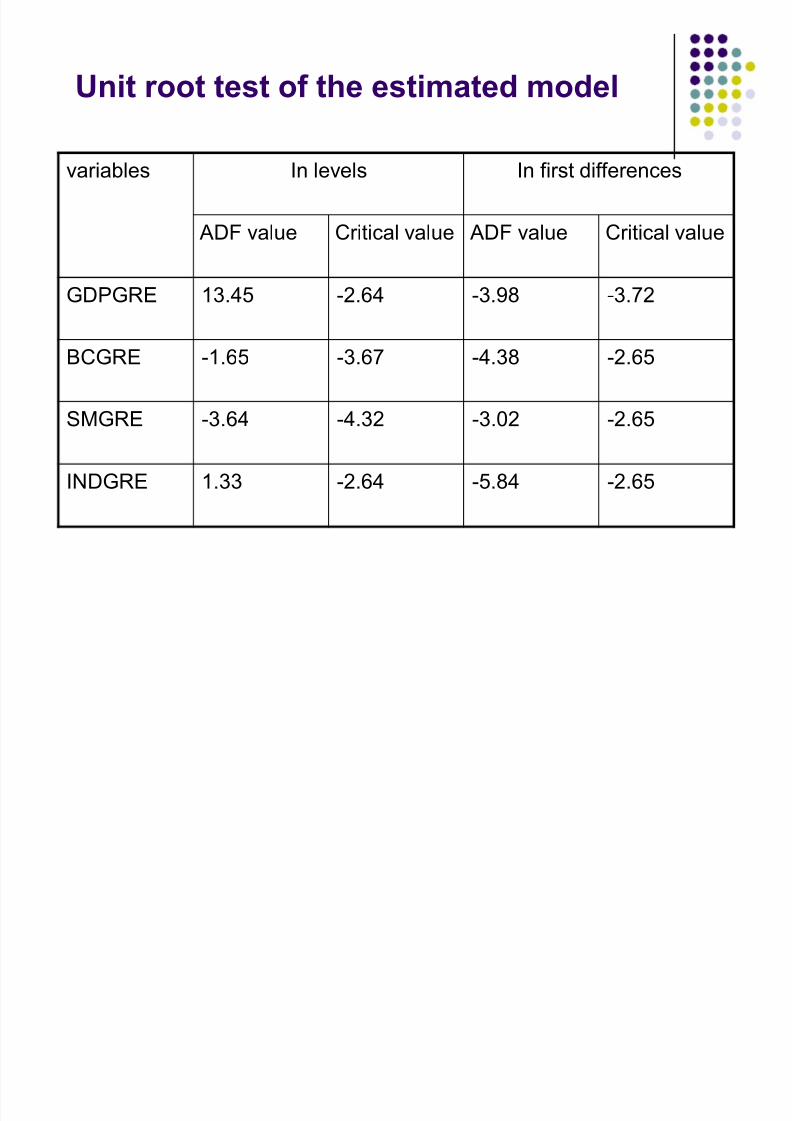
Unit root test of the estimated model
variables In levels In first differences
ADF value Critical value ADF value Critical value
GDPGRE 13.45 -2.64 -3.98 -3.72
BCGRE -1.65 -3.67 -4.38 -2.65
SMGRE -3.64 -4.32 -3.02 -2.65
INDGRE 1.33 -2.64 -5.84 -2.65
8/6/2019 Greece Final by Sudhnya
http://slidepdf.com/reader/full/greece-final-by-sudhnya 11/15
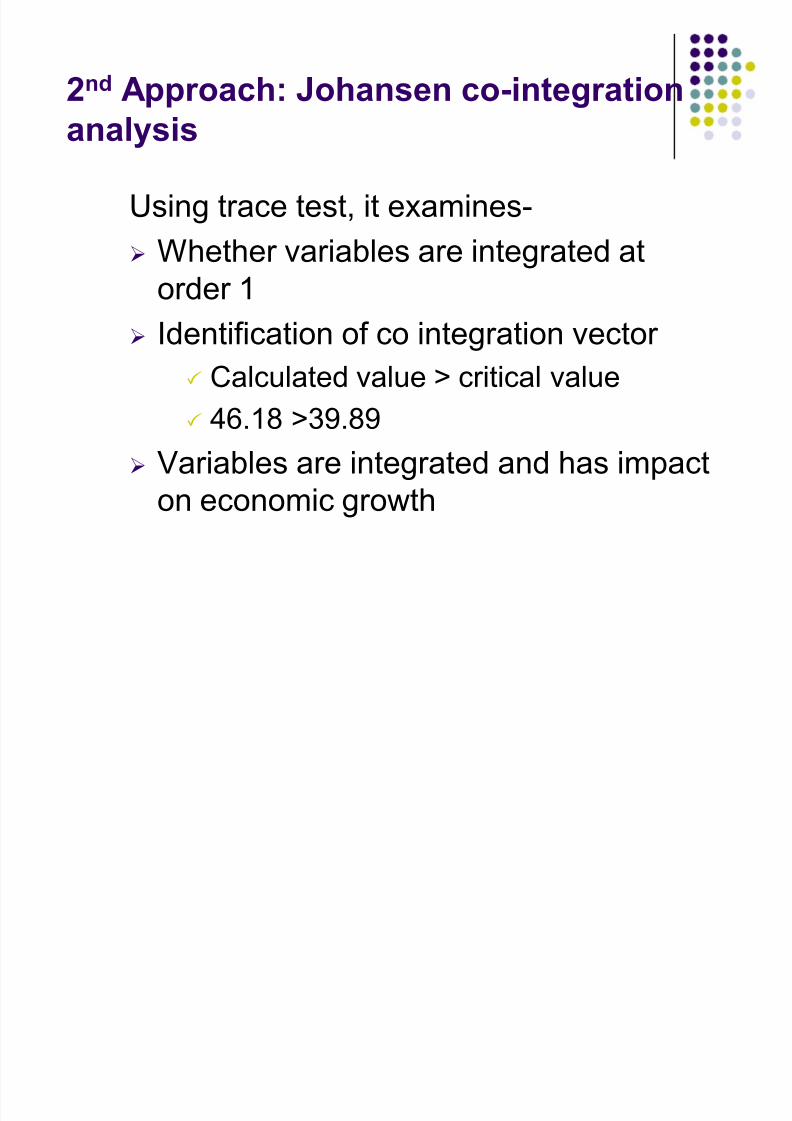
2nd Approach: Johansen co-integration
analysis
Using trace test, it examines-
Whether variables are integrated at
order 1
Identification of co integration vector
Calculated value > critical value
46.18 >39.89
Variables are integrated and has impact
on economic growth
8/6/2019 Greece Final by Sudhnya
http://slidepdf.com/reader/full/greece-final-by-sudhnya 12/15
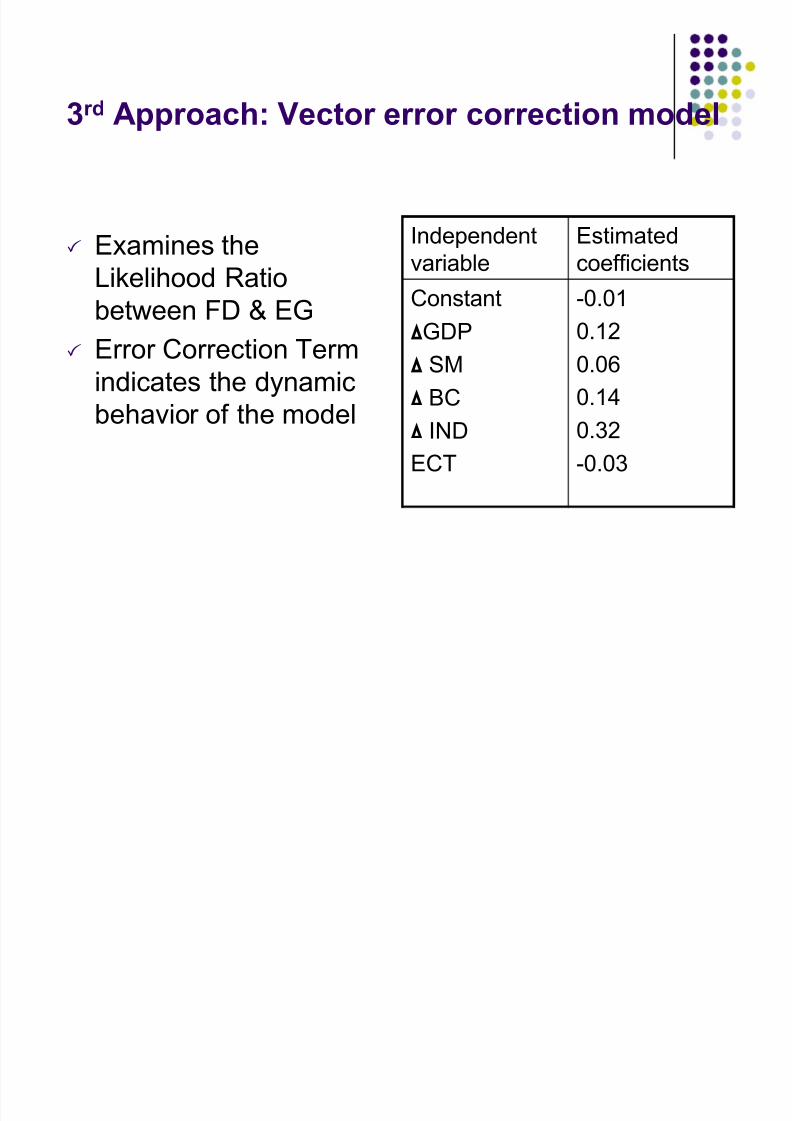
3rd Approach: Vector error correction model
Examines the
Likelihood Ratiobetween FD & EG
Error Correction Term
indicates the dynamic
behavior of the model
Independent
variable
Estimated
coefficients
Constant
¨GDP
¨ SM
¨ BC
¨ IND
ECT
-0.01
0.12
0.06
0.14
0.32
-0.03
8/6/2019 Greece Final by Sudhnya
http://slidepdf.com/reader/full/greece-final-by-sudhnya 13/15
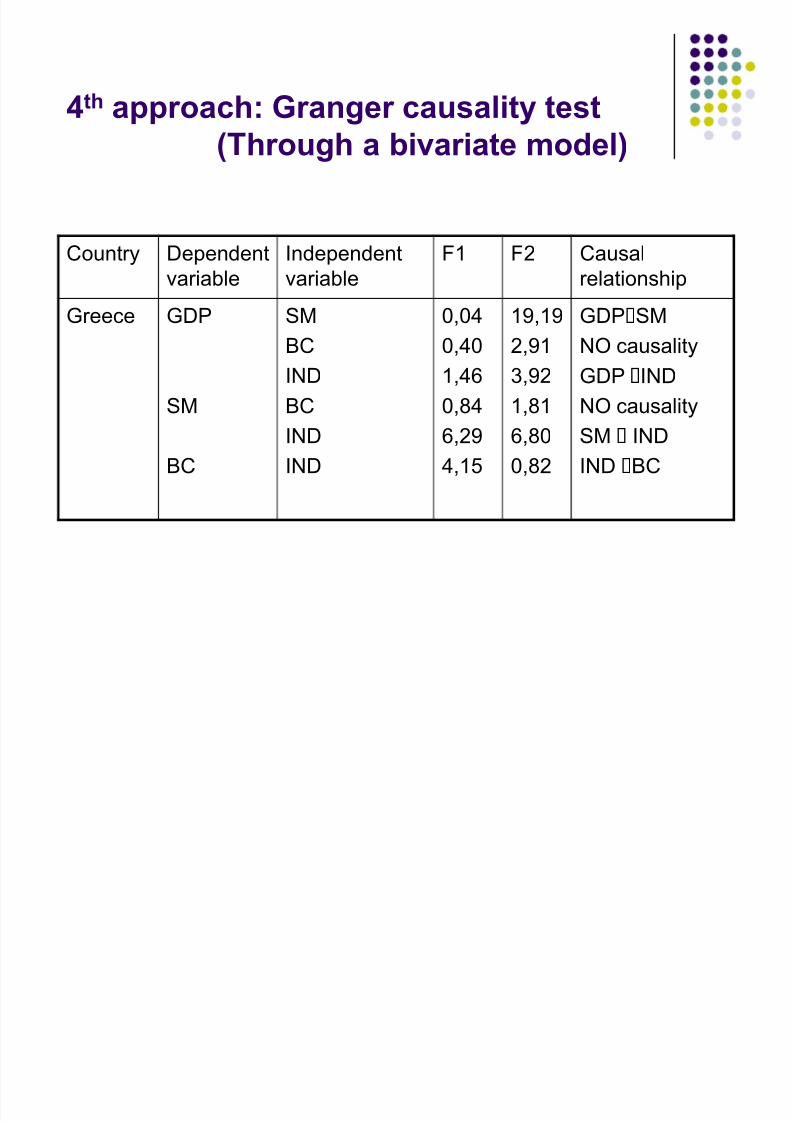
4th approach: Granger causality test
(Through a bivariate model)
Country Dependent
variable
Independent
variable
F1 F2 Causal
relationship
Greece GDP
SM
BC
SM
BC
IND
BCIND
IND
0,04
0,40
1,46
0,846,29
4,15
19,19
2,91
3,92
1,816,80
0,82
GDPSM
NO causality
GDP IND
NO causalitySM IND
IND BC
8/6/2019 Greece Final by Sudhnya
http://slidepdf.com/reader/full/greece-final-by-sudhnya 14/15
CONCLUSION
Economic growth causes
Financial development inGreece (Robinson)

8/6/2019 Greece Final by Sudhnya
http://slidepdf.com/reader/full/greece-final-by-sudhnya 15/15
Thanks to all