Embed Size (px)
Citation preview

43161759
Greater Vancouver Water District 2020 Water Quality Annual Report
Volume 1 of 2
March 2021

Greater Vancouver Water District 2020 Water Quality Annual Report | i
Table of Contents Table of Contents ........................................................................................................................................................... i
List of Tables .................................................................................................................................................................. ii
List of Figures ................................................................................................................................................................. ii
List of Appendices ......................................................................................................................................................... ii
1.0. Source Water Quality........................................................................................................................................ 4 1.1. Bacteriological Quality of the Source Water ..................................................................................................... 5 1.2. Source Water Monitoring for Giardia and Cryptosporidium ............................................................................ 6 1.3. Turbidity ............................................................................................................................................................ 7 1.4. Chemistry .......................................................................................................................................................... 8
1.4.1. Chemical and Physical Characteristics of Source Water ................................................................................... 8 1.4.2. Herbicides, Pesticides, Volatile Organic Compounds, Radioactivity, and Uranium .......................................... 8 1.4.3. PFOS and PFAS .................................................................................................................................................. 8 1.4.4. Limnology .......................................................................................................................................................... 9
2.0. Quality Control Assessment of Water Treatment ........................................................................................... 10 2.1. Seymour Capilano Filtration Plant ................................................................................................................... 10
2.1.1. Filtration .......................................................................................................................................................... 10 2.1.2. Ultraviolet Treatment ..................................................................................................................................... 13
2.1.3. Chlorination…….……………………….………………………………………………………………………………………………………………. 14 2.2. Coquitlam Water Treatment Plant .................................................................................................................. 14
2.2.1. Ultraviolet Treatment..…….………………………………………………………………………………………………………………………. 14 2.2.2. Chlorination……………...…….………………………………………………………………………………………………………………………. 16
2.3. Secondary Disinfection.................................................................................................................................... 17 2.4. Corrosion Control ............................................................................................................................................ 19
3.0. Transmission/Distribution System Water Quality ........................................................................................... 20 3.1. Microbiological Water Quality in the GVWD System ...................................................................................... 21
3.1.1. GVWD Water Mains ........................................................................................................................................ 21 3.1.2. GVWD Reservoirs ............................................................................................................................................ 21
3.2. Microbiological Water Quality in Local Government Systems ........................................................................ 24 3.3. Disinfection By-Products in the Transmission/Distribution Systems .............................................................. 25
4.0. Quality Control/Quality Assurance .................................................................................................................. 27

Greater Vancouver Water District 2020 Water Quality Annual Report | ii
List of Tables Table 1: Percent of Samples in Six Continual Months with E. coli/100 mL Exceeding 20 ........................... 5
Table 2: Percent of Samples Positive for Giardia ......................................................................................... 7
Table 3: Percent of Samples Positive of Cryptosporidium ........................................................................... 7
Table 4: Monthly Filter Effluent Turbidity Summary ................................................................................. 13
Table 5: Percent of Volume Meeting Ultraviolet Dosage Requirements at SCFP ...................................... 14
Table 6: Percent of Volume Meeting Ultraviolet Dosage Requirements at CWTP .................................... 15
Table 7: Peformance of Coquitlam Disinfection Facilities ......................................................................... 16
Table 8: Performance of Secondary Disinfection Facilities ........................................................................ 18
Table 9: Performance of Corrosion Control Facilities ................................................................................ 19
Table 10: Status of GVWD Reservoirs (2017-2020) .................................................................................... 23
Table 11: Local Government Water Quality Compared to the Provincial Bacteriological Standards ........ 25
List of Figures Figure 1: Percent of Samples Exceeding 20 E. coli/100 mL at all Three Sources (2016 to 2020) ................ 6
Figure 2: Average Daily Turbidity of Source Water (From In-line Readings) ............................................... 8
Figure 3: Apparent Colour Levels Before and After Filtration ................................................................... 11
Figure 4: Average Daily Turbidity Levels Before and After Filtration ........................................................ 12
Figure 5: Bacteriological Quality of Water in GVWD Mains ....................................................................... 21
Figure 6: Bacteriological Quality of Water in GVWD Reservoirs ................................................................ 22
Figure 7: Percent of Samples per Month Positive for Total Coliform Bacteria (2017 to 2020) ................. 24
Figure 8: Average Total Trihalomethane Levels ......................................................................................... 26
Figure 9: Average Total Haloacetic Acid Levels .......................................................................................... 27
List of Appendices Appendix A — Chemical and Physical Analysis Summaries
Appendix B — Analysis of Water for Organic/Inorganic Components and Radionuclides
Appendix C — Analysis of Source Waters for the Reservoir Monitoring Program
Appendix D — Report to Metro Vancouver on Giardia and Cryptosporidium Study

Greater Vancouver Water District 2020 Water Quality Annual Report | 1
EXECUTIVE SUMMARY
Source Water Quality
In 2020, the turbidity levels of the delivered water met the requirements of the Guidelines for Canadian Drinking Water Quality (GCDWQ).
The Capilano supply was in service for the entire year. Heavy rainfall events in early January and late September resulted in Capilano source water turbidity peaking at 7.3 Nephelometric Turbidity Unit (NTU). Even with the higher turbidity, the delivered filtered Capilano water was less than 0.1 NTU as measured by online instruments for the entire year.
The Seymour supply was in service for the entire year. Heavy rainfall events in January resulted in Seymour source water turbidity peaking at 23 NTU. The delivered filtered Seymour water was less than 0.1 NTU as measured by online instruments for the entire year.
The Coquitlam supply was in service for the entire year. The unfiltered Coquitlam source water was greater than 1 NTU for 7 days in 2020 and did not exceed 5 NTU throughout the year.
The microbiological quality of the three source waters was excellent in 2020. The levels of bacteria and protozoa detected were low and indicative of high quality source water.
Coquitlam source water quality met the bacteriological requirements for avoiding filtration outlined in the turbidity section of the GCDWQ.
Results of the analyses of the source water for herbicides, pesticides, volatile organic compounds and radionuclides were all found to be below the recommended limits for these substances as listed in the GCDWQ.
Water Treatment
The Seymour Capilano Filtration Plant (SCFP) performance, as measured by the quality of the delivered water, was excellent in 2020. The daily average turbidity of water leaving the clearwells to enter the Greater Vancouver Water District (GVWD) transmission system was an average of 0.09 NTU in 2020.
Turbidity levels for Individual Filter Effluent (IFE) met the turbidity requirements of the GCDWQ.
Filtration consistently removed iron, colour and organics from the Capilano and Seymour source water.
Levels of total aluminum in filtered water were consistently below the GCDWQ operational guideline value of 0.2 mg/L for direct filtration plants using aluminum-based coagulants. The maximum value for 2020 was 0.06 mg/L.
There were no outages of ultraviolet treatment at the SCFP and the Coquitlam Water Treatment Plant (CWTP).
The SCFP and CWTP operated the full year using sodium hypochlorite for chlorination.
The secondary disinfection stations boosted chlorine when required.
Transmission/Distribution System Water Quality
Bacteriological water quality was excellent in the GVWD transmission mains.
No E. coli was detected. The detection of an E. coli triggers a protocol which involves
immediate notification to health and local government officials, re-sampling, and a thorough
investigation into the possible causes.
Bacteriological water quality was excellent in the GVWD in-system storage reservoirs. There
was no E. coli detected in any of the associated samples.

Greater Vancouver Water District 2020 Water Quality Annual Report | 2
Bacteriological water quality was excellent in the distribution systems of the local
governments. Of approximately 20,000 local government samples collected for testing in
2020, a high percentage (99.8%) were free of total coliforms, which was the same as 2019
(99.8%). No E. coli were detected in any of the samples taken in 2020.
The running average levels of the Trihalomethane (THM) group of chlorine disinfection by-
products detected in the delivered water in the GVWD and local government systems were
below the Maximum Acceptable Concentration (MAC) in the GCDWQ of 100 µg/L (0.1 mg/L).
The running average levels for the Haloacetic Acid (HAA) group of chlorine disinfection by-
products were below the GCDWQ Maximum Acceptable Concentration (MAC) of 80 µg/L
(0.08 mg/L).
ACRONYMS
ACU Apparent Color Unit AO Aesthetic Objective (characteristics such as taste, colour, appearance, temperature that are not health
related) BCDWPR British Columbia Drinking Water Protection Regulation BHT Break Head Tank BTEX Benzene, Ethylbenzene, Toluene, Xylene CALA Canadian Association for Laboratory Accreditation CRWPS Capilano Raw Water Pump Station CFE Combined Filter Effluent CFU Colony Forming Units CO2 Carbon Dioxide CTD CWTP
Conductivity, Temperature, Depth Coquitlam Water Treatment Plant
DS Distribution System DBP Disinfection By-product DOC Dissolved Organic Carbon DWTP DWTO
Drinking Water Treatment Program Drinking Water Treatment Objectives (Microbiological) for Surface Water Supplies in British Columbia
E. coli Escherichia coli ERF Energy Recovery Facility EPA Environmental Protection Agency (USA) ESWTR Enhanced Surface Water Treatment Rule (USA) GCDWQ Guidelines for Canadian Drinking Water Quality GVWD Greater Vancouver Water District HAA Haloacetic Acid HPC Heterotrophic Plate Count IFE Individual Filter Effluent MAC Maximum Acceptable Concentration MCL Maximum Contaminant Level MDA Minimum Detectable Activity MDL Method Detection Limit mg/L Milligram per liter (0.001 g/L) µg/L Microgram per litre (0.000001 g/L) mL Milliliter MF Membrane Filtration mJ/cm2 Millijoule per centimeter squared MPN Most Probable Number N/A Not Available NTU Nephelometric Turbidity Unit PAH PFOA
Polycyclic Aromatic Hydrocarbons Perfluorooactanoic Acid

Greater Vancouver Water District 2020 Water Quality Annual Report | 3
PFOS Perfluorooctane Sulfonate pH Measure of acidity or basicity of water; pH 7 is neutral ppb Parts per Billion (Equivalent of microgram per litre) ppm Parts per Million (Equivalent of microgram per litre) RCW Recycled Clarified Water RWT Raw Water Tunnel SCADA Supervisory Control and Data Acquisition SCFP Seymour Capilano Filtration Plant TS Transmission System THAA5 Total Haloacetic5 Acids THM Trihalomethane TOC Total Organic Carbon TTHM Total Trihalomethane TWT Treated Water Tunnel UV254 Ultraviolet Absorbance at 254 nm WHO World Health Organization WQMRP Water Quality Monitoring and Reporting Plan for Metro Vancouver (GVWD) and Local Government
Members

Greater Vancouver Water District 2020 Water Quality Annual Report | 4
WATER SAMPLING AND TESTING PROGRAM
Water Type Parameter Frequency
Untreated, Source Water
Total coliform and E. coli Daily
Turbidity Daily
Giardia and Cryptosporidium Monthly at Capilano and Coquitlam
Ammonia, colour, iron, organic carbon, pH Weekly
Alkalinity, chloride, calcium, hardness, magnesium, manganese, nitrate, potassium, phosphate, sulphate
Monthly
Aluminum, copper, sodium, total and suspended solids Bi-monthly
Trihalomethanes, haloacetic acids Quarterly
Antimony, arsenic, barium, boron, cadmium, cyanide, chromium, lead, mercury, nickel, phenols, selenium, silver, zinc
Semi-annually
Pesticides and herbicides Annually
PAHs, BTEXs Annually
VOC Annually
Radioisotopes Annually
Treated water
Total coliform and E. coli Daily
Turbidity Daily
Temperature Daily
Ammonia, colour, iron, organic carbon, pH, aluminum at SCFP Weekly
Aluminum, copper, sodium, total and suspended solids Bi-Monthly
Trihalomethanes, haloacetic acids Quarterly at selected sites
Antimony, arsenic, barium, boron, cadmium, cyanide, chromium, lead, mercury, nickel, phenols, selenium, silver, zinc
Semi-annually
GVWD Water Mains
Total coliform and E. coli Weekly per site
Heterotrophic plate count Weekly per site
Free chlorine Weekly per site
Trihalomethanes, haloacetic acids, pH Quarterly at selected sites
PAHs, BTEXs Semi-annually at selected sites
GVWD Reservoirs
Total coliform and E. coli Weekly per site
Heterotrophic plate count Weekly per site
Free chlorine Weekly per site
Local Government Distribution System
Total coliform and E. coli Weekly per site
Heterotrophic plate count Weekly per site
Free chlorine Weekly per site
Turbidity Weekly per site
Trihalomethanes, haloacetic acids, pH Quarterly at selected sites
1.0 SOURCE WATER QUALITY The first barrier in place to protect the quality of drinking water supply is the protection of the watershed to ensure the best quality source water. Source water monitoring provides ongoing confirmation that the barrier is effective, identifies seasonal changes and provides the monitoring information necessary to adjust the level of water treatment that is in place. Regular monitoring of the water sources is also a requirement of the Water Quality Monitoring and Reporting Plan for Metro Vancouver (GVWD) and Local Government Members (WQMRP).
Greater Vancouver Water District 2020 Water Quality Annual Report | 5
1.1. Bacteriological Quality of the Source Water
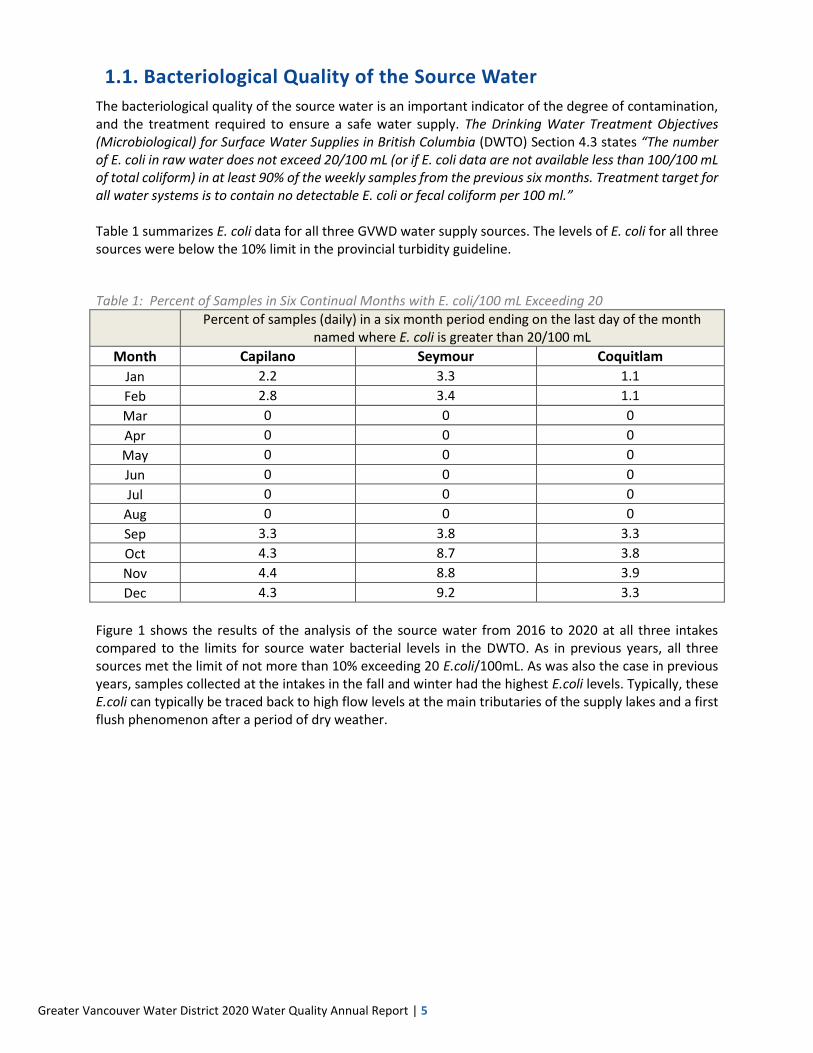
The bacteriological quality of the source water is an important indicator of the degree of contamination, and the treatment required to ensure a safe water supply. The Drinking Water Treatment Objectives (Microbiological) for Surface Water Supplies in British Columbia (DWTO) Section 4.3 states “The number of E. coli in raw water does not exceed 20/100 mL (or if E. coli data are not available less than 100/100 mL of total coliform) in at least 90% of the weekly samples from the previous six months. Treatment target for all water systems is to contain no detectable E. coli or fecal coliform per 100 ml.” Table 1 summarizes E. coli data for all three GVWD water supply sources. The levels of E. coli for all three sources were below the 10% limit in the provincial turbidity guideline.
Table 1: Percent of Samples in Six Continual Months with E. coli/100 mL Exceeding 20
Percent of samples (daily) in a six month period ending on the last day of the month
named where E. coli is greater than 20/100 mL
Month Capilano Seymour Coquitlam
Jan 2.2 3.3 1.1
Feb 2.8 3.4 1.1
Mar 0 0 0
Apr 0 0 0
May 0 0 0
Jun 0 0 0
Jul 0 0 0
Aug 0 0 0
Sep 3.3 3.8 3.3
Oct 4.3 8.7 3.8
Nov 4.4 8.8 3.9
Dec 4.3 9.2 3.3
Figure 1 shows the results of the analysis of the source water from 2016 to 2020 at all three intakes compared to the limits for source water bacterial levels in the DWTO. As in previous years, all three sources met the limit of not more than 10% exceeding 20 E.coli/100mL. As was also the case in previous years, samples collected at the intakes in the fall and winter had the highest E.coli levels. Typically, these E.coli can typically be traced back to high flow levels at the main tributaries of the supply lakes and a first flush phenomenon after a period of dry weather.

Greater Vancouver Water District 2020 Water Quality Annual Report | 6
Figure 1: Percent of Samples Exceeding 20 E. coli/100 mL at all Three Sources (2016 to 2020)
Note: Metro Vancouver has protected watersheds and therefore the source of E.coli is most likely originating from endemic animals in the watersheds.
1.2. Source Water Monitoring for Giardia and Cryptosporidium
Unfiltered surface water supplies have the potential of containing the protozoan pathogens Giardia and Cryptosporidium. Outbreaks of Giardiasis occurred in a number of locations in B.C. and Washington State in the late 1980s, and Metro Vancouver has been monitoring raw water for Giardia since 1987. Since 1992, Metro Vancouver has participated in a program with the BC Centre of Disease Control Enhanced Water Testing Laboratory, to gather more information about the number and nature of cysts found in the GVWD water supplies. The program involves collecting samples from the Capilano and Coquitlam supplies upstream of disinfection. At the SCFP, monitoring for Giardia and Cryptosporidium has focused on the recycled water returning to the head of the plant and this monitoring has confirmed that the procedures in place effectively control the levels of Giardia and Cryptosporidium in the recycled wash water from the filters. The results of the 2020 testing program are contained in the “Report to Metro Vancouver – Giardia and Cryptosporidium Annual Report January – December, 2020”, which was prepared by the BC Public Health Microbiology & Reference Laboratories, Environmental Microbiology, and can be found in Appendix D. Four of twelve (33%) samples collected at Capilano and three of the twelve (25%) collected at Coquitlam were positive for Giardia (Table 2). As discussed previously, Seymour samples for 2020 are all process control samples and not Seymour source water, as they were prior to 2011 (shown as N/A in the table).
0
5
10
15
20
Jan
Mar
May Ju
l
Sep
No
v
Jan
Mar
May Ju
l
Sep
No
v
Jan
Mar
May Ju
l
Sep
No
v
Jan
Mar
May Ju
l
Sep
No
v
Jan
Mar
May Ju
l
Sep
No
v
2016 2017 2018 2019 2020
Pe
rcen
t o
f Sa
mp
les
Capilano Seymour Coquitlam

Greater Vancouver Water District 2020 Water Quality Annual Report | 7
Table 2: Percent of Samples Positive for Giardia 2011 2012 2013 2014 2015 2016 2017 2018 2019 2020
Capilano 50 75 50 18 18 50 58 33 33 33
Seymour N/A N/A N/A N/A N/A N/A N/A NA NA NA
Coquitlam 51 50 23 8 0 17 67 8 25 25
Zero of twelve (0%) samples collected at Capilano were positive for Cryptosporidium, and 0 of twelve (0%) were positive at Coquitlam (Table 3). As discussed in the section on Giardia above, Seymour samples for 2020 are all process control samples and not Seymour source water, as they were prior to 2011 (shown as N/A in the table).
Table 3: Percent of Samples Positive of Cryptosporidium 2011 2012 2013 2014 2015 2016 2017 2018 2019 2020
Capilano 6 16 9 9 9 25 17 8 0 0
Seymour N/A N/A N/A N/A N/A N/A N/A NA NA NA
Coquitlam 3 8 9 0 0 0 0 0 0 0
Year to year fluctuations are demonstrated for Giardia and Cryptosporidium and there has always been considerable variation in the results.
1.3. Turbidity
GVWD water sources have been susceptible to turbidity upsets due to high runoff from storms which can cause slides and stream scouring in the watersheds, or from re-suspension of sediment from the edges of the lakes during periods of low water levels. The DWTO allows a utility to be exempt from filtration if the turbidity does not exceed specific water quality parameters requirements and provided that a number of other provisions, including source water protection and two forms of water treatment requirements, are in place. Historically the turbidity levels on both the Capilano and Seymour sources would not meet these criteria, therefore plans were developed and implemented to filter both supplies.
Filtration of 100% of the Seymour supply began in January 2010, and filtration and distribution of the Capilano supply through the Twin Tunnels connecting the Capilano and Seymour source supplies commenced in February 2015. Both the raw and treated water tunnels were fully operational in April 2015.
Section 4.4 of the DWTO (Version 1.1, November 2012) contains the following provision for filtration exemption:
“For nonfiltered surface water to be acceptable as a drinking water source supply, average daily turbidity levels should be established through sampling at equal intervals (at least every four hours) immediately before the disinfectant is applied. Turbidity levels of around 1.0 NTU but not exceeding 5.0 NTU for more than two days in a 12-month period should be demonstrated in the absence of filtration. In addition, source water turbidity also should not show evidence of harbouring microbiological contaminants in excess of the exemption criteria.”
Capilano and Seymour water is filtered so these source water criteria don’t apply to the delivered water. Coquitlam, which is unfiltered, was in service for all of 2020 in accordance with the DWTO.

Greater Vancouver Water District 2020 Water Quality Annual Report | 8
Figure 2: Average Daily Turbidity of Source Water (From In-line Readings)
1.4. Chemistry
1.4.1. Chemical and Physical Characteristics of Source Water
The chemical and physical characteristics of the GVWD source water are summarized in Appendix A of this report; detailed analytical results are provided in Volume II. The results from the chemical and physical analyses of the source water in 2020 were similar to those for other years.
1.4.2. Herbicides, Pesticides, Volatile Organic Compounds, Radioactivity, and Uranium
Analyses of the source water for a variety of organic compounds, including all of the compounds with an specified MAC in the Guidelines of Drinking Water Quality (GCDWQ), is carried out on an annual basis in accordance with the WQMRP. The results are contained in Appendix B of this report and in Volume II. Uranium was the only parameter detected and it was below the applicable GCDWQ health based limits; these levels are indicative of erosion of natural deposits, meaning the contribution to total radiation exposure from our drinking water is low.
1.4.3. PFOS and PFAS
The GCDWQ have added the parameters of Perfluorooctane Sulfonate(PFOS) and Perfluorooactanoic Acid (PFAS) for testing of the source and treated waters. The results are in Appendix B of this report and in Volume II. None of the chemicals in these categories were detected. Common sources of these synthetic chemicals are from consumer products and fire-fighting foam for their water and oil repellant properties.
0.00
5.00
10.00
15.00
20.00
25.00
30.00
Jan Jan Mar Mar Apr May Jun Jul Aug Sep Oct Nov Dec
Turb
idit
y (N
TU)
Capilano Seymour Coquitlam

Greater Vancouver Water District 2020 Water Quality Annual Report | 9
1.4.4. Limnology
The Reservoir Water Quality Monitoring Program was started in 2014 as a sampling and analysis structure for the limnology (physical, chemical, and biological parameters) of the Capilano, Seymour and Coquitlam Reservoirs. Reservoir monitoring information is important in the proactive management of the GVWD reservoirs, as water quality could be impacted by environmental variability and climate change. This program assists in ensuring that variation and trends in reservoir quality are scientifically tracked over time. Water sampling of the primary source reservoirs and inflow rivers is conducted between April and November each year. Biological productivity that can influence water quality is the highest during this time of year, making it an important time for sampling and measurements. Monthly sampling of the source water is conducted by Metro Vancouver staff and sample analysis is undertaken by accredited laboratories. Water quality measurements are compiled by arrays of scientific instruments in each reservoir. The GVWD employs the services of a limnology consultant to review the annual program data, interpret physical, chemical, and biological conditions and examine long term trends. Results in 2020, as in previous years, confirmed the three reservoirs are ultra-oligotrophic (see Appendix C), which means they have low levels of available nutrients and low levels of biological production. This ultra-oligotrophic classification is highly desirable for source drinking water supply and shows that the GVWD watersheds and reservoirs continue to provide a high quality raw water source. In many parts of North America there is interest in blue green algae (also known as cyanobacteria) in water reservoirs. These algae can produce toxins that are collectively known as microcystins. A common cyanobacterium in GVWD source reservoirs is called Merismopedia spp., which is thought to produce these microcystins. Despite the presence of cyanobacteria, the concentration of microcystins in GVWD source reservoirs remains well below levels known to affect human health and are far below the GCDWQ. This desirable condition is due to the ultra-oligotrophic status of the reservoirs (low nutrient availability to fuel algal growth). Algae blooms have not been observed in the source water supply reservoirs. Metro Vancouver continues to monitor cyanobacteria, including Merismopedia spp. as well as processes in the reservoirs that control the growth of cyanobacteria and other algae. This data is used to help predict changes to water quality over time related to climatic and environmental change and aid in making proactive decisions about ongoing reservoir management strategies.

Greater Vancouver Water District 2020 Water Quality Annual Report | 10
2.0 QUALITY CONTROL ASSESSMENT OF WATER TREATMENT
Water treatment is the second barrier (after source water protection) relied on to assure the quality of the water supply. Completion of the Twin Tunnels Project in 2015 successfully concluded GVWD’s regional long-range water treatment enhancement plans which spanned more than ten years. Each tunnel is 3.8 meters in diameter, 7.1 kilometers long, and 160 to 640 meters below ground level, running beneath Grouse Mountain and Mount Fromme. The water from the Raw Water Tunnel (RWT) is filtered and treated alongside the Seymour source water at the Seymour Capilano Filtration Plant (SCFP). Both treated sources enter the Clearwell at the SCFP for further treatment before the blended water is distributed to the region. Blended treated water returns to Capilano through the Treated Water Tunnel (TWT) and provides high quality drinking water to the Capilano area while the remainder is distributed through the Seymour system.
2.1. Seymour Capilano Filtration Plant
The SCFP is a chemically assisted direct filtration plant which uses poly aluminum chloride as a coagulant with polymers to improve particle removal. These substances help aggregate particles to form visible floc. The flocculated particles are removed by passing this water through a filter medium of anthracite and sand. The result is the production of filtered water which is then exposed to ultraviolet light as the water leaves each filter. Post ultraviolet filtered water has sodium hypochlorite (chlorine) and lime added before the water enters the Clearwells. The West and East Clearwells are large water storage reservoirs that store and allow controlled passage of water with some mixing (or blending) of the lime and chlorine that have been added. Clearwells allow sufficient retention (or contact time) with chlorine to provide any further disinfection required after filtration and ultraviolet light treatment. Carbon dioxide (CO2) in solution is added to trim pH once the desired alkalinity is reached. After stabilization of the filtered water in the Clearwells, the finished water enters the transmission system at the Seymour Treated Water Valve Chamber. The SCFP has been operational since January 2010 and the quality of the water produced has been excellent.
2.1.1. Filtration
As a result of filtration treatment of the Capilano and Seymour water sources, there have been a number of changes to the characteristics of the delivered water. Some of these changes are visible, and some are not. The most obvious visible change in the water is the decrease in colour and increase in clarity. There is a total loss of brown hue that can sometimes characterize Capilano and Seymour waters before filtration. This improvement in colour is a result of removal of the natural components that cause the brown hue by the filtration process. Suspended particles in water that cause light to scatter (turbidity) are also removed. The end product is water that is very clear. Due to the purity of the water, it may have a slight bluish tinge. Figure 3 compares the apparent colour of SCFP filtered water and Capilano and Seymour source waters for 2020. During the fall rainfall events, the apparent colour of the Seymour source water feeding the SCFP had a reading over 50 ACU. After the removal of the organic material through filtration, the colour of the filtered water delivered to the public was never greater than 2 ACU.

Greater Vancouver Water District 2020 Water Quality Annual Report | 11
Figure 3: Apparent Colour Levels Before and After Filtration
Note: The Seymour intake sampling site was unavailable due to maintenance from November until year end.
0
10
20
30
40
50
60
Jan Feb Mar Apr May Jun Jul Aug Sep Oct Nov Dec
Ap
par
ent
Co
lou
r (A
CU
)
Capilano Seymour SCFP Finished

Greater Vancouver Water District 2020 Water Quality Annual Report | 12
Figure 4 compares turbidity of the two source waters that feed the SCFP to the turbidity level of the finished water. The Seymour source experienced an average daily turbidity greater than 1 NTU for 116 days. The Capilano source exceeded 1 NTU on 114 days. Since both sources were filtered at the SCFP, the maximum average daily turbidity of the delivered water was 0.19 NTU and the average was 0.09 NTU.
Figure 4: Average Daily Turbidity Levels Before and After Filtration
Removal of turbidity in the source water improves the aesthetic qualities of the water, but it also has the benefit of removing certain types of pathogenic microorganisms that may be present. At a minimum, properly run direct filtration plants such as the SCFP will remove up to 2.5 log (two log is a 99% reduction) of Giardia and Cryptosporidium plus 1 log of viruses. To ensure this removal, it is critical that the performance of each filter determined by the turbidity of its effluent is monitored on a continuous basis. The GCDWQ (2019) states: “For conventional and direct filtration, less than or equal to 0.3 nephelometric turbidity units (NTU) in at least 95% of measurements either per filter cycle or per month and never to exceed 1.0 NTU.” Ideally the turbidity from each filter would never exceed 0.1 NTU; however, there are rare occurrences of turbidity readings that exceed this ideal level. The turbidity performance of all 24 filters is measured by examining the percent of time that the turbidity of each Individual Filter Effluent (IFE) met the turbidity guidelines of not greater than 1.0 NTU and at least 95% of time less than 0.3 NTU. This is summarized in Table 4. In 2020, there were no incidents where the IFE was greater than 1.0 NTU and the few incidences of filter turbidity readings that were greater than 0.3 NTU, were well within the 95% limit.
0
5
10
15
20
25
Jan Feb Mar Apr May Jun Jul Aug Sep Oct Nov Dec
Turb
idit
y (N
TU)
Capilano Seymour SCFP finished

Greater Vancouver Water District 2020 Water Quality Annual Report | 13
Table 4: Monthly Filter Effluent Turbidity Summary Month Occurrence of IFE Turbidity greater
than 1.0 NTU (None Allowed) Percent of Time IFE Turbidity was less
than 0.3 NTU (Minimum 95% Required)
January 0 99.99%
February 0 99.72%
March 0 99.94%
April 0 100%
May 0 100%
June 0 100%
July 0 100%
August 0 100%
September 0 99.99%
October 0 100%
November 0 100%
December 0 100%
A water treatment facility such as the SCFP should be able to produce a filter effluent that is less than 0.1 NTU. Under normal operating conditions the turbidity of the filtered water at SCFP is less than 0.09 NTU. All water that flows through the filters immediately passes through the ultraviolet units. The intensity of the ultraviolet lamps automatically increases when there is an increase in turbidity of the water exiting each filter. After ultraviolet treatment, the water is chlorinated as it enters the clearwell, where more than one hour of contact time is provided.
2.1.2. Ultraviolet Treatment
The effluent from each filter is treated with ultraviolet light as the water exits the filter. Ultraviolet treatment is effective in altering the DNA structure of Giardia and Cryptosporidium. thus rendering cysts and oocysts, respectively, of these parasites non-infectious. Other disinfectants, especially chlorine, are ineffective against Cryptosporidium oocysts at reasonable dosages. In the unlikely event of a breakthrough of Cryptosporidium oocysts, especially at the end of a filter run, ultraviolet light is present to render any parasites that may be present as non-infectious. Oocysts are not able to proliferate inside the intestines of human hosts to cause illness after a sufficient dose of ultraviolet light. The target dosage for ultraviolet light is to achieve 2-Log (99%) Giardia and Cryptosporidium inactivation is 21 mJ/cm2. Under normal operating conditions, two rows of lamps operating at 75% power provide sufficient ultraviolet light to meet the dosage requirement for 2-log reduction of Giardia and Cryptosporidium Table 5 summarizes the performance of the SCFP ultraviolet system in 2020.

Greater Vancouver Water District 2020 Water Quality Annual Report | 14
Table 5: Percent of Volume Meeting Ultraviolet Dosage Requirements at SCFP
Month Percent of Monthly Volume ≥ 2-log of Giardia and Cryptosporidium Inactivation
(95% of monthly volume required)
January 99.82%
February 99.89%
March 99.90%
April 99.84%
May 99.91%
June 99.95%
July 99.97%
August 99.95%
September 99.89%
October 99.92%
November 99.92%
December 99.62%
2.1.3. Chlorination
Chlorination is used for secondary disinfection at the source as well as at secondary disinfection stations to minimize bacterial regrowth in the GVWD transmission and local government distribution systems. Chlorination provides 4-log virus inactivation with liquid sodium hypochlorite.
2.2. Coquitlam Water Treatment Plant
The Coquitlam Water Treatment Plant (CWTP) uses ozonation, ultraviolet treatment, soda ash and chlorination to treat water from the Coquitlam source. Ozonation provides pre-treatment and helps remove micro-organisms from the water, reduces disinfection by-products and improves water clarity, which increases the efficiency of the subsequent ultraviolet process. Ozonation provides an additional 4-log virus inactivation to chlorination. Soda ash is then added for pH and alkalinity adjustment for corrosion control, followed by chlorination.
2.2.1. Ultraviolet Treatment
Ultraviolet treatment (operational since 2014) provides for primary disinfection, and achieves 3-log inactivation of chlorine-resistant micro-organisms for Giardia and Cryptosporidium. The water is directed into 8 ultraviolet units, each containing 40 ultraviolet lamps encased in protective sleeves. Ultraviolet light emitted from the lamps passes through the water. The US Environmental Protection Agency (USEPA) requires that the ultraviolet disinfection process results in target Giardia and Cryptosporidium inactivation in at least 95% of the treated water volume on a monthly basis, which is summarized in Table 6. The USEPA standard is used because there is no Canadian standard.

Greater Vancouver Water District 2020 Water Quality Annual Report | 15
Table 6: Percent of Volume Meeting Ultraviolet Dosage Requirements at CWTP
Month Percent of Monthly Volume ≥ 3-log
Giardia and Cryptosporidium Inactivation (Minimum 95% Required)
January 99.87%
February 99.88%
March 99.89%
April 99.85%
May 99.87%
June 99.85%
July 99.85%
August 99.81%
September 99.81%
October 99.90%
November 99.82%
December 99.91%

Greater Vancouver Water District 2020 Water Quality Annual Report | 16
2.2.2. Chlorination
Chlorination is used for secondary disinfection at the source as well as at secondary disinfection stations to minimize bacterial regrowth in the GVWD transmission and local government distribution systems. Chlorination provides 4-log virus inactivation with liquid sodium hypochlorite, which replaced the compressed chlorine gas system in 2017. Table 7 summarizes the performance of all the Coquitlam disinfection systems in 2020.
Table 7: Performance of Coquitlam Disinfection Facilities Facility Performance Discussion
Ozonation Operated 99.6% of time Acts as a pretreatment, enhancing the removal of organics and increasing the UV Transmittance making Ultraviolet treatment more effective. Ozone outages were due to electrical or instrument maintenance, ozone outage test, or ozone generator faults.
Ultraviolet No loss of ultraviolet in 2020. 99.86 % of volume was treated to ultraviolet specifications
UV performance met USEPA requirements. (95% of monthly volume required).
Chlorination 100% of water was chlorinated
This facility uses chlorine as a secondary disinfectant except during an outage of the ultraviolet system when it is used for primary disinfection.

Greater Vancouver Water District 2020 Water Quality Annual Report | 17
2.3. Secondary Disinfection
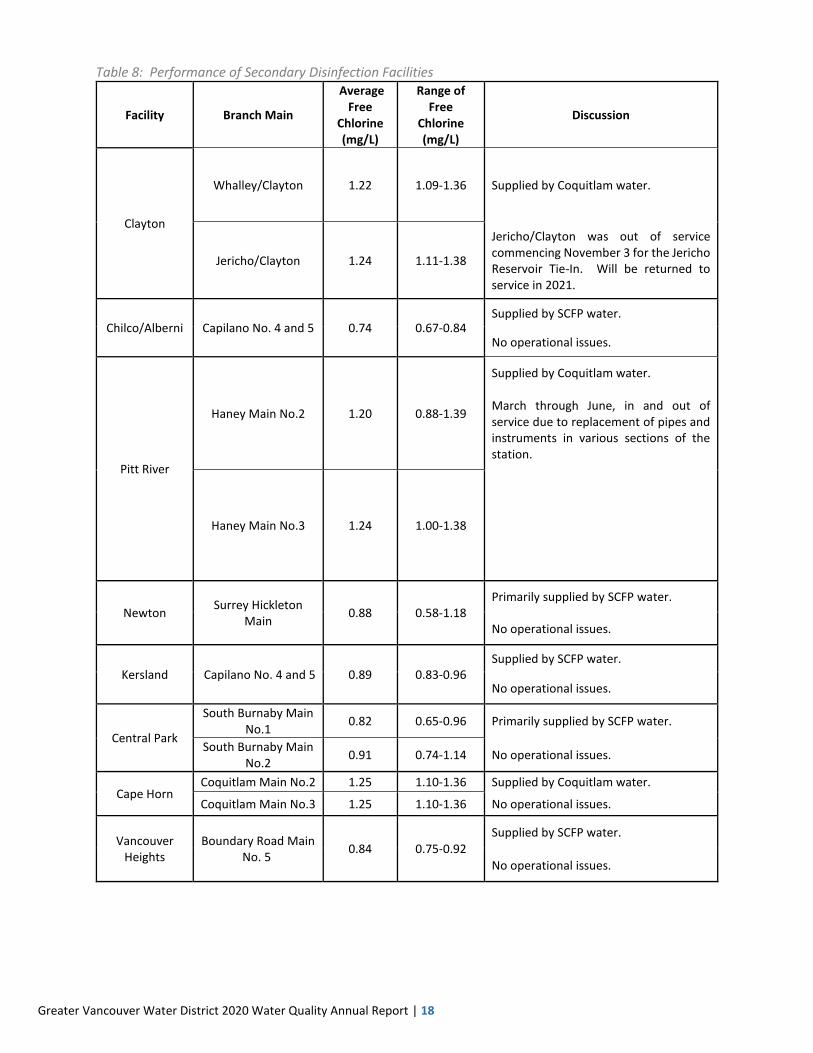
There are 8 secondary disinfection stations operated by Metro Vancouver. The purpose of these stations is to increase the chlorine residual in the water transmission and distribution systems to meet a target residual based on a number of factors, including source water turbidity, the amount of bacterial regrowth detected in the local government distribution system samples and the chlorine demand in the water. The rate of chlorine decay is lower in the areas receiving filtered water from the SCFP and consequently, lower chlorine dosage levels are required to maintain desired chlorine residual levels. The target chlorine dose leaving the secondary facilities receiving SCFP water is 0.8 mg/L. These facilities frequently have an incoming chlorine residual high enough that boosting is not required. The target chlorine dose leaving the secondary facilities receiving CWTP water ranges from 1.20 to 1.50 mg/L. Table 8 summarizes the performance of the secondary disinfection facilities in 2020.
Greater Vancouver Water District 2020 Water Quality Annual Report | 18
Table 8: Performance of Secondary Disinfection Facilities
Facility Branch Main
Average Free
Chlorine (mg/L)
Range of Free
Chlorine (mg/L)
Discussion
Clayton
Whalley/Clayton 1.22 1.09-1.36 Supplied by Coquitlam water.
Jericho/Clayton 1.24 1.11-1.38
Jericho/Clayton was out of service commencing November 3 for the Jericho Reservoir Tie-In. Will be returned to service in 2021.
Chilco/Alberni Capilano No. 4 and 5 0.74 0.67-0.84 Supplied by SCFP water.
No operational issues.
Pitt River
Haney Main No.2 1.20 0.88-1.39
Supplied by Coquitlam water. March through June, in and out of service due to replacement of pipes and instruments in various sections of the station.
Haney Main No.3 1.24 1.00-1.38
Newton Surrey Hickleton
Main 0.88 0.58-1.18
Primarily supplied by SCFP water.
No operational issues.
Kersland Capilano No. 4 and 5 0.89 0.83-0.96 Supplied by SCFP water.
No operational issues.
Central Park
South Burnaby Main No.1
0.82 0.65-0.96 Primarily supplied by SCFP water.
South Burnaby Main No.2
0.91 0.74-1.14 No operational issues.
Cape Horn Coquitlam Main No.2 1.25 1.10-1.36 Supplied by Coquitlam water.
Coquitlam Main No.3 1.25 1.10-1.36 No operational issues.
Vancouver Heights
Boundary Road Main No. 5
0.84 0.75-0.92 Supplied by SCFP water.
No operational issues.

Greater Vancouver Water District 2020 Water Quality Annual Report | 19
2.4. Corrosion Control
Metro Vancouver’s Corrosion Control Program began in the 1990s and involves several steps to reduce pipe corrosion. As part of the current Corrosion Control Program: Copper Pipes Protection initiative, further proposed changes in pH and alkalinity in 2021 will reduce pipe corrosion through the addition of natural minerals. The untreated water from all three sources had a pH lower than the aesthetic limit of the GCDWQ of pH 7.0. In the SCFP process, filtered water is dosed with hydrated lime (calcium bicarbonate) to raise its pH and alkalinity before it enters the clearwells. To achieve the desired alkalinity, the resultant pH is trimmed using CO2 to bring it down to target levels. Since 2015, by way of the Twin Tunnels, Capilano raw source water is transferred to the SCFP for treatment. At the Coquitlam source, the commissioning of the CO2 system at the CWTP began in 2019 and continued in 2020. When it is fully operational, the CO2 system with the addition of soda ash will allow the GVWD to meet new target pH and alkalinity values across the entire system. Similar to the SCFP, the CO2 system is used to trim the resultant pH to desired target levels. The average pH of the treated water leaving Seymour Capilano and Coquitlam Water Treatment Plants was 7.7 and 7.8, respectively, during 2020, which met the aesthetic objective of the GCDWQ. Performance of the corrosion control facilities is summarized in Table 9.
Table 9: Performance of Corrosion Control Facilities Facility Performance Discussion
SCFP Corrosion Control pH ranged from 6.9 – 9.0 The annual average pH was 7.7 and was continually monitored with online instrumentation. The pH fluctuated in March from 6.9 to 9. During this time one clearwell was being bypassed for maintenance resulting in pH fluctuations while bringing this clearwell back into service.
CWTP Corrosion Control pH ranged from 6.8 – 9.6 The annual average pH was 7.8. On a couple of occasions in January the pH was <7.0 for a short period due to a soda ash equipment fault. In January and also in June the pH was > 9 for a short period related to testing of the soda ash system.
The chemical and physical characteristics of the GVWD treated water are summarized in Appendix A of this report and detailed analytical results are provided in Volume II.

Greater Vancouver Water District 2020 Water Quality Annual Report | 20
3.0 TRANSMISSION/DISTRIBUTION SYSTEM WATER QUALITY
Schedule A of the BC Drinking Water Protection Regulation (BCDWPR) contains standards for the bacteriological quality of potable water in the Province. There are three components of this standard that apply to large utilities such as GVWD and its members. These are: Part 1: No sample should be positive for E. coli. Part 2: Not more than 10% of the samples in a 30-day period should be positive for total coliform bacteria when more than 1 sample is collected. Part 3: No sample should contain more than 10 total coliform bacteria per 100 mL. The BCDWPR does not contain any water standards other than the three limits for E. coli and total coliform bacteria. Information on the significance of the detection of these organisms can be found in the GCDWQ – Supporting Documents, specifically: “E. coli is a member of the total coliform group of bacteria and is the only member that is found exclusively in the faeces of humans and other animals. Its presence in water indicates not only recent faecal contamination of the water but also the possible presence of intestinal disease-causing bacteria, viruses and protozoa.” “The presence of total coliform bacteria in water in the distribution system (but not in water leaving the treatment plant) indicates that the distribution system may be vulnerable to contamination or may simply be experiencing bacterial regrowth.” To summarize, the detection of an E. coli bacteria in a sample of treated water is an indication of a potentially serious risk. The detection of total coliform bacteria may indicate intrusion into the system, or it may indicate that these bacteria are growing in the distribution system itself (regrowth). The number of E. coli detected in both the GVWD and the local government drinking water samples is typically very low. Out of more than 27,000 samples collected from the GVWD and local government systems analyzed in 2020, no samples were positive for E. coli. The detection of an E. coli triggers a protocol which involves immediate notification to health and local government officials, re-sampling, and a thorough investigation into the possible causes. In the GVWD transmission system, only 27 out of the approximately 7,100 samples collected, tested positive for total coliforms. Only 38 of the approximately 20,000 samples collected from the local government distribution systems tested positive for total coliforms in 2020. The majority of the coliforms (67%) in the local government system appeared in the warmer water months of June through October. The most likely source of these organisms can be attributed to bacterial regrowth. It should be emphasized that 99.8% of the samples in 2020 had no coliforms present, which is a good indicator of effective water treatment and good transmission/distribution system water quality.

Greater Vancouver Water District 2020 Water Quality Annual Report | 21
3.1. Microbiological Water Quality in the GVWD System
3.1.1. GVWD Water Mains
Water quality in water mains is monitored from the point leaving the source and throughout the transmission system. In 2020 there were approximately 5,080 samples collected and tested for the presence of indicator bacteria. The percentage of samples from the GVWD water mains that were positive for total coliform bacteria was very low, well below the 10% standard. Of the approximately 5080 samples processed, only 21 samples tested positive for total coliforms and no samples were positive for E. coli bacteria. The compliance of monitoring results from GVWD transmission mains with the criteria in the BCDWPR is shown in Figure 5. There were another 540 samples collected from stations where only chlorine residuals are measured. In addition, there are inline stations collecting data every 10-minutes after chlorination at each source, but these samples are not included in the calculations for compliance monitoring.
Figure 5: Bacteriological Quality of Water in GVWD Mains
3.1.2. GVWD Reservoirs
In 2020, over 2,000 samples were collected from 21 reservoirs and tanks that are located throughout the GVWD water system. Only 6 samples were positive for total coliforms. No sample from a reservoir was positive for E. coli.
0
5
10
15
20
1-Jan 31-Jan 2-Mar 1-Apr 1-May 31-May 30-Jun 30-Jul 29-Aug 28-Sep 28-Oct 27-Nov 27-Dec
% S
amp
les
Po
siti
ve
Percent of samples positive for coliform bacteria in a 30 day period ending on date shown(10% allowed)
Number of samples positive for E. coli bacteria (none allowed)
Number of samples per month containing more than 10 coliform bacteria per 100 mL (noneallowed)
10% STANDARD

Greater Vancouver Water District 2020 Water Quality Annual Report | 22
The compliance of 2020 monitoring results from GVWD reservoirs with the criteria in the BCDWPR is shown in Figure 6.
Figure 6: Bacteriological Quality of Water in GVWD Reservoirs
Reservoir water quality is optimized by the use of secondary disinfection coupled with an active reservoir exercising program that includes a minimum of weekly monitoring of chlorine residuals and bacteriology results, which can result in changes to filling levels, if necessary. Table 10 provides an overview of the status of the GVWD reservoirs from 2017 to 2020. During certain times of the year, it is not possible to cycle reservoirs as much as would be desired due to operational constraints. Despite these constraints, water quality as determined by coliform bacteria, was satisfactory in all reservoirs.
0
5
10
15
20
1-Jan 31-Jan 2-Mar 1-Apr 1-May 31-May 30-Jun 30-Jul 29-Aug 28-Sep 28-Oct 27-Nov 27-Dec
% S
am
ple
s P
ositiv
e
Percent of samples positive for coliform bacteria in a 30 day period ending on date shown (10%allowed)
Number of samples positive for E. coli bacteria (none allowed)
Number of samples per month containing more than 10 coliform bacteria per 100 mL (noneallowed)
10% STANDARD

Greater Vancouver Water District 2020 Water Quality Annual Report | 23
Table 10: Status of GVWD Reservoirs (2017-2020)
Reservoir
(Capacity in Million Litres)
Average Free Chlorine (mg/L) Discussion
2017 2018 2019 2020
Burnaby Mtn. Reservoir
(14.1)
0.44 0.49 0.53
0.57 No operational issues
Burnaby Tank (2.4) 0.53 0.54 0.58 0.60 The tank was cleaned March 30-April 3 while
remaining in service.
Cape Horn Reservoir (42.2) 0.53 0.78 0.61 0.78 No operational issues
Clayton Reservoir (22.4) N/A 1.1 1.02 1.08 Drainage improvement project was
completed in January. Cell 1 removed from
service in the fall to reduce low use season
storage.
Central Park Reservoir
(37.0)
0.54 0.53 0.51 0.66 No operational issues
Glenmore Tanks (1.0) 0.64 0.66 0.68 0.77 No operational issues
Grandview Reservoir (14.3) 0.71 0.71 0.73 0.80 No operational issues
Greenwood Reservoir (9.2) 0.63 0.66 0.68 0.75 No operational issues
Hellings Tank (4.4) 0.45 0.47 0.48 0.54 No operational issues
Kennedy Reservoir (17.3) 0.52 0.56 0.52 0.58 No operational issues
Kersland Reservoir (78.7) 0.56 0.55 0.55 0.66 No operational issues
Little Mountain Reservoir
(177.4)
0.66 0.64 0.67 0.72 No operational issues
Maple Ridge Reservoir
(24.2)
0.52 0.53 0.52 0.44 New sampling kiosk installed in July.
Newton Reservoir (33.6) 0.56 0.45 0.46 0.55 No operational issues
Pebble Hill Reservoir (44.8) 0.64 0.63 0.60 0.66 Cell 1 taken out of service in the fall to reduce
low use season storage.
Prospect Reservoir (4.6) 0.63 0.64 0.66 0.76 No operational issues
Sasamat Reservoir (27.6) 0.52 0.54 0.54 0.65 No operational issues
Sunnyside Reservoir (28.8) 0.65 0.58 0.47 0.73 Upgrade work on cell 1 and 2 throughout
the year.
Vancouver Heights
Reservoir (45.6)
0.68 0.66 0.75 0.82 No operational issues
Westburnco Reservoir
(77.1)
0.50 0.58 0.58 0.64 No operational issues
Whalley Reservoir (35.7) 0.46 0.60 0.59 0.73 No operational issues
Greater Vancouver Water District 2020 Water Quality Annual Report | 24
3.2. Microbiological Water Quality in Local Government Systems
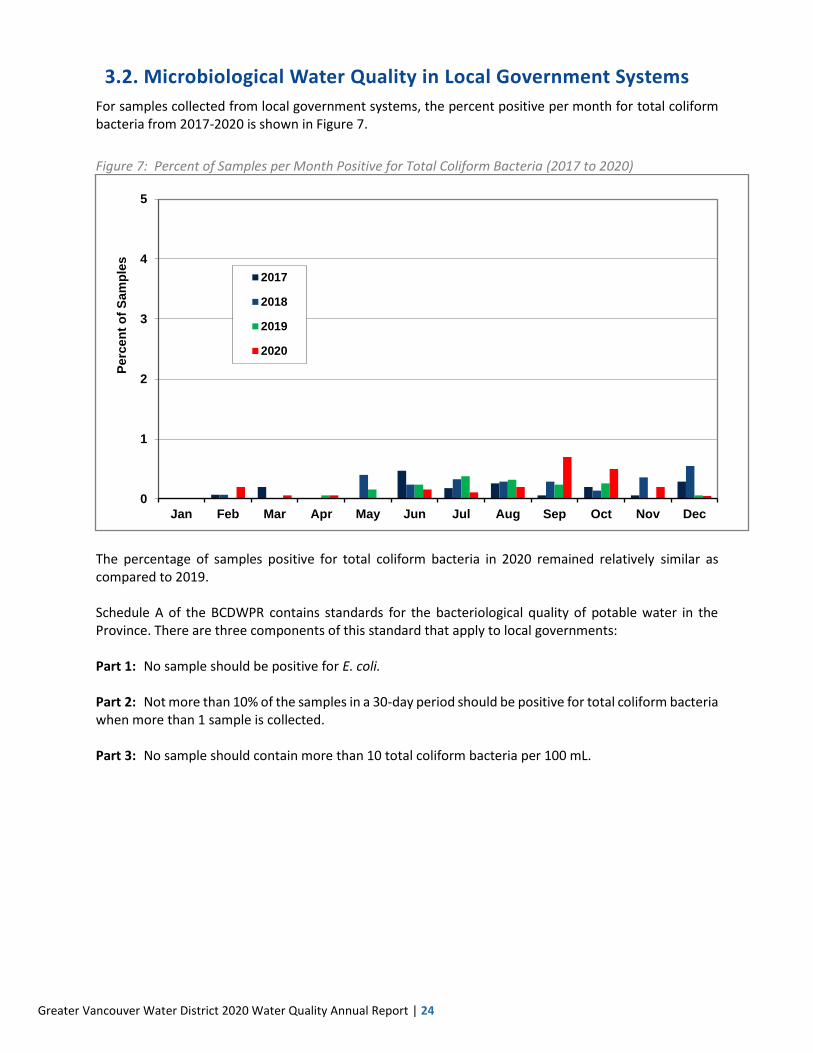
For samples collected from local government systems, the percent positive per month for total coliform bacteria from 2017-2020 is shown in Figure 7.
Figure 7: Percent of Samples per Month Positive for Total Coliform Bacteria (2017 to 2020)
The percentage of samples positive for total coliform bacteria in 2020 remained relatively similar as compared to 2019. Schedule A of the BCDWPR contains standards for the bacteriological quality of potable water in the Province. There are three components of this standard that apply to local governments: Part 1: No sample should be positive for E. coli. Part 2: Not more than 10% of the samples in a 30-day period should be positive for total coliform bacteria when more than 1 sample is collected. Part 3: No sample should contain more than 10 total coliform bacteria per 100 mL.
0
1
2
3
4
5
Jan Feb Mar Apr May Jun Jul Aug Sep Oct Nov Dec
Perc
en
t o
f S
am
ple
s
2017
2018
2019
2020

Greater Vancouver Water District 2020 Water Quality Annual Report | 25
For samples from local government systems, this requirement was met in 2020 with the following exceptions:
Two samples in June contained more than 10 total coliform bacteria.
Three samples in September contained more than 10 total coliform bacteria.
Two samples in October contained more than 10 total coliform bacteria. Table 11 shows the compliance with the bacteriological standards (3 parts) in the BCDWPR for samples taken within the distribution systems of the 20 local governments that are supplied with GVWD water.
Table 11: Local Government Water Quality Compared to the Provincial Bacteriological Standards Month Number that met
Part 1 Number that met
Part 2 Number that met
Part 3 Number that met all
requirements
January 20 20 20 20
February 20 20 20 20
March 20 20 20 20
April 20 20 20 20
May 20 20 20 20
June 20 20 18 18
July 20 20 20 20
August 20 20 20 20
September 20 20 17 17
October 20 20 18 18
November 20 20 20 20
December 20 20 20 20
3.3. Disinfection By-Products in the Transmission/Distribution Systems
As the treated water moves through the GVWD Transmission system and into the local government distribution system infrastructure of pipes and reservoirs. Changes in water quality occur mainly due to the reaction between the chlorine in the water (added during primary and secondary disinfection) and naturally occurring organic matter in the water. One of the most significant changes is the production of chlorinated disinfection by-products (DBPs). DBPs is a term used to describe a group of organic and inorganic compounds formed during water disinfection. Reactions between dissolved natural organic matter and chlorine can lead to the formation of a variety of halogenated DBPs. There are two major groups of chlorinated DBPs: The Total Trihalomethanes (TTHMs) and the Total Haloacetic Acids (THAA5). Factors that affect DBP formation include: amount of chlorine added to water, reaction time, concentration and characteristics of dissolved organic materials (precursors), water temperature, and water pH. In general, DBPs continue to form as long as chlorine and reactive DBP precursors are present in water. The Maximum Acceptable Concentration (MAC) in the GCDWQ for TTHMs is a locational yearly running average of 100 µg/L (0.1 mg/L) based on quarterly samples. A comparison of TTHM levels in the GVWD and local government systems in 2020 is shown in Figure 8. All THM results from GVWD water mains and local government systems were below the MAC of 100 µg/L.

Greater Vancouver Water District 2020 Water Quality Annual Report | 26
Figure 8: Average Total Trihalomethane Levels
2020 Average GVWD TTHM = 22 µg/L 2020 Average Local Governments TTHM = 31 µg/L
The other group of disinfection by-products of interest is the Total Haloacetic Acid (THAA5) group. Comparison of THAA5 in the GVWD and local government systems in 2020 is shown in Figure 9. In 2020, eight locations had a single quarterly sample with THAA5 readings above 80 µg/L. The MAC is calculated on a locational yearly running average based on quarterly samples and despite the higher single readings, no location exceeded the yearly 80 µg/L MAC.

Greater Vancouver Water District 2020 Water Quality Annual Report | 27
Figure 9: Average Total Haloacetic Acid Levels
2020 Average GVWD THAA = 24 µg/L 2020 Average Local Governments THAA = 30 µg/L
4.0 QUALITY CONTROL/QUALITY ASSURANCE In 1994, as required by a new BC Ministry of Health program, the bacteriology section of the GVWD Laboratory received approval from the Provincial Medical Health Officer to perform bacteriological analysis of potable water as required in the BCDWPR. An ongoing requirement of this approval is successful participation in the provincial Clinical Microbiology Proficiency Testing Program or its equivalent. Representatives of the Approval Committee for Bacteriology Laboratories have carried out an inspection of the GVWD Laboratory facilities at the Lake City Operations Centre in February 2019 as part of the process leading up to approval of the laboratory by the Provincial Health Officer. The next inspection is scheduled for 2022.
In addition to the approval process discussed above, the GVWD Laboratory is accredited by the Canadian Association for Laboratory Accreditation (CALA) for the analysis of parameters for which the laboratory

Greater Vancouver Water District 2020 Water Quality Annual Report | 28
has requested certification. The GVWD Laboratory has been inspected by representatives from CALA bi-annually since 1995.
Accreditation for the laboratory from the Standards Council of Canada was first received early in 1996 and continued until the middle of 2005, when accreditation was granted by CALA directly.
The most recent on-site audit took place in November 2019, and CALA issued accreditation approval in February 2020. The next CALA inspection will take place in the fall of 2021.

Greater Vancouver Water District 2020 Water Quality Annual Report | 29
APPENDIX A — CHEMICAL AND PHYSICAL ANALYSIS SUMMARIES
This page has been intentionally left blank.

Greater Vancouver Water District 2020 Water Quality Annual Report | 30
Physical and Chemical Analysis of Water Supply
2020 – Capilano Water System
Untreated Treated Canadian Guideline
Parameter Average Average Range Days
Exceeded
Limit Reason
Established
Alkalinity as CaCO3 (mg/L) 2.9 10 5.8-12 none
Aluminum Dissolved (µg/L) 81 29 20-48 none
Aluminum Total (µg/L) 143 29 18-58 none
Antimony Total (µg/L) <0.5 <0.5 <0.5 0 6 Health
Arsenic Total (µg/L) <0.5 <0.5 <0.5 0 10 Health
Barium Total (µg/L) 2.7 2.9 2.1-3.6 0 1000 Health
Boron Total (µg/L) <10 <10 <10 0 5000 Health
Bromate (mg/L) <0.01 <0.01 <0.01 0 0.1 Health
Bromide (mg/L) <0.01 <0.01 <0.01 none
Cadmium Total (µg/L) <0.2 <0.2 <0.2 0 5 Health
Calcium Total (µg/L) 1160 4180 2460-4640 none
Carbon Organic - Dissolved (mg/L) 1.9 0.7 0.4-1.0 none
Carbon Organic - Total (mg/L) 1.9 0.7 0.5-1.0 none
Chlorate (mg/L) <0.01 0.02 0.02-0.03 0 1 Health
Chloride (mg/L) <0.5 2.5 2.0-3.2 0 ≤250 Aesthetic
Chromium Total (µg/L) <0.07 <0.05 <0.05 0 50 Health
Cobalt Total (µg/L) <0.5 <0.5 <0.5 none
Color - Apparent (ACU) 17 <2 <2-2 none
Color - True (TCU) 12 <1 <1-1 0 ≤15 Aesthetic
Conductivity (µmhos/cm) 10 32 22-37 none
Copper Total (µg/L) 3.1 <0.5 <0.5 0 ≤1000 Aesthetic
Cyanide Total (mg/L) <0.02 <0.02 <0.02 0 0.2 Health
Fluoride (mg/L) <0.05 <0.05 <0.05 0 1.5 Health
Hardness as CaCO3 (mg/L) 3.6 11.1 6.7-12.3 none
Iron Dissolved (µg/L) 34 <5 <5-8 none
Iron Total (µg/L) 91 <5 <5-14 0 ≤300 Aesthetic
Lead Total (µg/L) <0.5 <0.5 <0.5 0 5 Health
Magnesium Total (µg/L) 167 171 122-200 none
Manganese Dissolved (µg/L) 3.8 1.7 0.9-3.7 none
Manganese Total (µg/L) 5.1 2.9 1.9-5.2 0 ≤120 Health
Mercury Total (µg/L) <0.05 <0.05 <0.05 0 1 Health
Molybdenum Total (µg/L) <0.5 <0.5 <0.5 none
Nickel Total (µg/L) <0.5 <0.5 <0.5 none
Nitrogen - Ammonia as N (mg/L) <0.02 <0.02 <0.02 none
Nitrogen - Nitrate as N (mg/L) 0.07 0.06 0.03-0.12 0 45 Health
Nitrogen - Nitrite as N (mg/L) <0.01 <0.01 <0.01 0 1 Health
pH (pH units) 6.5 7.4 7.2-7.7 0 7.0 to 10.5 Aesthetic
Phenol (mg/L) <0.005 <0.005 <0.005 none
Phosphorus Dissolved (µg/L) <10 <10 <10 none
Phosphorus Total (µg/L) <10 <10 <5-<10 none
Potassium Total (µg/L) 159 170 153-200 none
Residue Total (mg/L) 18 28 23-32 none
Residue Total Dissolved (mg/L) 10 20 20-30 0 ≤500 Aesthetic
Residue Total Fixed (mg/L) 8 20 14-24 none
Residue Total Volatile (mg/L) 10 8 6-11 none
Selenium Total (µg/L) <0.5 <0.5 <0.5 0 50 Health
Silica as SiO2 (mg/L) 3.4 3.4 2.5-3.9 none
Silver Total (µg/L) <0.5 <0.5 <0.5 none
Sodium Total (µg/L) 595 1580 1290-1800 0 ≤200000 Aesthetic
Sulphate (mg/L) 0.7 1 0.7-1.4 0 ≤500 Aesthetic
Turbidity (NTU) 1 0.12 0.08-0.21 none
Turbidity IFE (NTU) - - - 0 ≤ 1.0 Health
UV Absorbance 254 nm (Abs/cm) 0.08 0.011 0.008-0.021 none
Zinc Total (µg/L) <3 <3 <3 0 ≤5000 Aesthetic
These figures are averaged values from a number of laboratory analyses done throughout the year. Where the range is a single value no variation was
measured for the samples analyzed. Average values containing one or more results below the detection limit are preceded with “<” symbol. Minimum range
values than “<” denotes not detectable with the technique used for determination. Methods and terms are based on those of the most current on-line version of "Standard Methods for the Examination of Water and Waste Water". Untreated water is from the intake prior to the raw water tunnel, treated water is from a
single site in the GVWD distribution system after the treated water tunnel and before the breakhead tank. Guidelines are taken from the most current
Guidelines for Canadian Drinking Water Quality summary table updated in September 2020. Capilano Source was operational for 365 days in 2020. 1Treated turbidity guideline and the number of exceedances applies to Individual Filter Effluent readings; measured in events and not days.

Greater Vancouver Water District 2020 Water Quality Annual Report | 31
Physical and Chemical Analysis of Water Supply
2020 – Seymour Water System
Untreated Treated Canadian Guideline
Parameter Average Average Range Days
Exceeded
Limit Reason
Established
Alkalinity as CaCO3 (mg/L) 3.6 10 5.9-12 none
Aluminum Dissolved (µg/L) 70 30 19-57 none
Aluminum Total (µg/L) 199 29 18-66 none
Antimony Total (µg/L) <0.5 <0.5 <0.5 0 6 Health
Arsenic Total (µg/L) <0.5 <0.5 <0.5 0 10 Health
Barium Total (µg/L) 3.7 3 2.1-3.5 0 1000 Health
Boron Total (µg/L) <10 <10 <10 0 5000 Health
Bromate (mg/L) <0.01 <0.01 <0.01 0 0.1 Health
Bromide (mg/L) <0.01 <0.01 <0.01 none
Cadmium Total (µg/L) <0.2 <0.2 <0.2 0 5 Health
Calcium Total (µg/L) 1670 4210 2420-4820 none
Carbon Organic - Dissolved (mg/L) 1.7 0.7 0.5-1.0 none
Carbon Organic - Total (mg/L) 1.7 0.7 0.5-1.0 none
Chlorate (mg/L) <0.01 0.02 0.02-0.03 0 1 Health
Chloride (mg/L) <0.5 2.5 2.0-3.2 0 ≤250 Aesthetic
Chromium Total (µg/L) 0.06 <0.05 <0.05 0 50 Health
Cobalt Total (µg/L) <0.5 <0.5 <0.5 none
Color - Apparent (ACU) 19 <2 <2-2 none
Color - True (TCU) 12 <1 <1-1 0 ≤15 Aesthetic
Conductivity (µmhos/cm) 13 32 22-36 none
Copper Total (µg/L) 19.9 <0.5 <0.5-0.7 0 ≤1000 Aesthetic
Cyanide Total (mg/L) <0.02 <0.02 <0.02 0 0.2 Health
Fluoride (mg/L) <0.05 <0.05 <0.05 0 1.5 Health
Hardness as CaCO3 (mg/L) 4.9 11.2 6.6-12.9 none
Iron Dissolved (µg/L) 80 <5 <5-7 none
Iron Total (µg/L) 214 <6 <5-11 0 ≤300 Aesthetic
Lead Total (µg/L) <0.5 <0.5 <0.5 0 5 Health
Magnesium Total (µg/L) 182 173 121-204 none
Manganese Dissolved (µg/L) 5.5 3.9 2.4-7.8 none
Manganese Total (µg/L) 11.4 4.6 3.4-8.4 0 ≤120 Health
Mercury Total (µg/L) <0.05 <0.05 <0.05 0 1 Health
Molybdenum Total (µg/L) <0.5 <0.5 <0.5 none
Nickel Total (µg/L) <0.5 <0.5 <0.5 none
Nitrogen - Ammonia as N (mg/L) <0.02 <0.02 <0.02 none
Nitrogen - Nitrate as N (mg/L) 0.06 0.06 0.03-0.12 0 45 Health
Nitrogen - Nitrite as N (mg/L) <0.01 <0.01 <0.01 0 1 Health
pH (pH units) 6.5 7.4 7.2-7.6 0 7.0 to 10.5 Aesthetic
Phenol (mg/L) <0.005 <0.005 <0.005 none
Phosphorus Dissolved (µg/L) <10 <10 <10 none
Phosphorus Total (µg/L) <10 <10 <5-<10 none
Potassium Total (µg/L) 188 175 142-203 none
Residue Total (mg/L) 20 25 23-27 none
Residue Total Dissolved (mg/L) 10 20 10-20 0 ≤500 Aesthetic
Residue Total Fixed (mg/L) 12 17 14-20 none
Residue Total Volatile (mg/L) 9 8 5-11 none
Selenium Total (µg/L) <0.5 <0.5 <0.5 0 50 Health
Silica as SiO2 (mg/L) 3.4 3.3 2.5-3.9 none
Silver Total (µg/L) <0.5 <0.5 <0.5 none
Sodium Total (µg/L) 571 1580 1300-1810 0 ≤200000 Aesthetic
Sulphate (mg/L) 1.2 1 0.7-1.4 0 ≤500 Aesthetic
Turbidity (NTU) 1.6 0.12 0.07-0.59 none
Turbidity IFE (NTU) - - - 0 ≤ 1.0 Health
UV Absorbance 254 nm (Abs/cm) 0.074 0.011 0.008-0.016 none
Zinc Total (µg/L) <3 <3 <3 0 ≤5000 Aesthetic
These figures are averaged values from a number of laboratory analyses done throughout the year. Where the range is a single value no variation was
measured for the samples analyzed. Average values containing one or more results below the detection limit are preceded with “<” symbol. Minimum range values than “<” denotes not detectable with the technique used for determination. Methods and terms are based on those of the most current on-line version of
"Standard Methods for the Examination of Water and Waste Water". Untreated water is from a sample site prior to coagulation, treated water is from a
sample site downstream of the SCFP clearwell. Guidelines are taken from the most current Guidelines for Canadian Drinking Water Quality summary table updated in September 2020. Seymour Source was operational for 365 days in 2020. 1Treated turbidity guideline and the number of exceedances applies to Individual Filter Effluent readings; measured in events and not days.

Greater Vancouver Water District 2020 Water Quality Annual Report | 32
Physical and Chemical Analysis of Water Supply
2020 – Coquitlam Water System
Untreated Treated Canadian Guideline
Parameter Average Average Range Days
Exceeded
Limit Reason
Established
Alkalinity as CaCO3 (mg/L) 2 8.6 7.5-11 none
Aluminum Dissolved (µg/L) 63 62 59-66 none
Aluminum Total (µg/L) 100 96 77-166 none
Antimony Total (µg/L) <0.5 <0.5 <0.5 0 6 Health
Arsenic Total (µg/L) <0.5 <0.5 <0.5 0 10 Health
Barium Total (µg/L) 2.4 2.3 2.1-2.5 0 1000 Health
Boron Total (µg/L) <10 <10 <10 0 5000 Health
Bromate (mg/L) <0.01 <0.01 <0.01 0 0.1 Health
Bromide (mg/L) <0.01 <0.01 <0.01 none
Cadmium Total (µg/L) <0.2 <0.2 <0.2 0 5 Health
Calcium Total (µg/L) 837 834 799-873 none
Carbon Organic - Dissolved (mg/L) 1.6 1.5 0.2-2.1 none
Carbon Organic - Total (mg/L) 1.8 1.5 1.3-2.1 none
Chlorate (mg/L) <0.01 0.06 0.04-0.08 0 1 Health
Chloride (mg/L) <0.5 2.2 1.8-2.5 0 ≤250 Aesthetic
Chromium Total (µg/L) <0.05 <0.05 <0.05 0 50 Health
Cobalt Total (µg/L) <0.5 <0.5 <0.5 none
Color - Apparent (ACU) 14 <2 <2-3 none
Color - True (TCU) 10 <1 <1-1 0 ≤15 Aesthetic
Conductivity (µmhos/cm) 8 27 25-33 none
Copper Total (µg/L) 4.2 <0.5 <0.5 0 ≤1000 Aesthetic
Cyanide Total (mg/L) <0.02 <0.02 <0.02 0 0.2 Health
Fluoride (mg/L) <0.05 <0.05 <0.05 0 1.5 Health
Hardness as CaCO3 (mg/L) 2.5 2.5 2.3-2.6 none
Iron Dissolved (µg/L) 21 23 15-43 none
Iron Total (µg/L) 52 52 35-97 0 ≤300 Aesthetic
Lead Total (µg/L) <0.5 <0.5 <0.5 0 5 Health
Magnesium Total (µg/L) 98 97 84-109 none
Manganese Dissolved (µg/L) 4.1 2.3 1.5-3.0 none
Manganese Total (µg/L) 4.6 3.2 2.4-4.6 0 ≤120 Health
Mercury Total (µg/L) <0.05 <0.05 <0.05 0 1 Health
Molybdenum Total (µg/L) <0.5 <0.5 <0.5 none
Nickel Total (µg/L) <0.5 <0.5 <0.5 none
Nitrogen - Ammonia as N (mg/L) <0.02 <0.02 <0.02 none
Nitrogen - Nitrate as N (mg/L) 0.07 0.07 0.04-0.09 0 45 Health
Nitrogen - Nitrite as N (mg/L) <0.01 <0.01 <0.01 0 1 Health
pH (pH units) 6.3 7.6 7.1-8.1 0 7.0 to 10.5 Aesthetic
Phenol (mg/L) <0.005 <0.005 <0.005 none
Phosphorus Dissolved (µg/L) <10 <10 <10 none
Phosphorus Total (µg/L) <10 <10 <5-<10 none
Potassium Total (µg/L) 113 114 106-122 none
Residue Total (mg/L) 14 26 21-30 none
Residue Total Dissolved (mg/L) 10 20 8-30 0 ≤500 Aesthetic
Residue Total Fixed (mg/L) 7 16 11-22 none
Residue Total Volatile (mg/L) 7 10 7-12 none
Selenium Total (µg/L) <0.5 <0.5 <0.5 0 50 Health
Silica as SiO2 (mg/L) 2.6 2.6 2.4-2.9 none
Silver Total (µg/L) <0.5 <0.5 <0.5 none
Sodium Total (µg/L) 470 5100 4640-5650 0 ≤200000 Aesthetic
Sulphate (mg/L) 0.5 <0.6 <0.5-0.6 0 ≤500 Aesthetic
Turbidity (NTU) 0.49 0.42 0.19-1.4 none
UV 254 - Apparent (Abs/cm) 0.073 0.023 0.014-0.059 none
UV Absorbance 254 nm (Abs/cm) 0.067 0.019 0.015-0.024 none
Zinc Total (µg/L) <3 <3 <3 0 ≤5000 Aesthetic
These figures are averaged values from a number of laboratory analyses done throughout the year. Where the range is a single value no variation
was measured for the samples analyzed. Average values containing one or more results below the detection limit are preceded with “<” symbol.
Minimum range values than “<” denotes not detectable with the technique used for determination. Methods and terms are based on those of the most current on-line version of "Standard Methods for the Examination of Water and Waste Water". Untreated water is from the intake prior to
treatment, treated water is from a single site in the GVWD distribution system downstream of CWTP. Guidelines are taken from the most current
Guidelines for Canadian Drinking Water Quality summary table updated in September 2020. Recommended turbidity guidelines applies to finished treated water from an un-filtered source. Coquitlam source was operational for 365 days in 2020.

Greater Vancouver Water District 2020 Water Quality Annual Report | 33
APPENDIX B — ANALYSIS OF WATER FOR ORGANIC/INORGANIC COMPONENTS AND RADIONUCLIDES
Analysis of Source Waters for Herbicides, Pesticides, Volatile Organic Compounds and Uranium Units Date Sampled MAC AO Capilano Seymour Coquitlam
Atrazine µg/L 27-Oct-20 5 <0.50 <0.50 <0.50
Azinphos-Methyl µg/L 27-Oct-20 20 <1.0 <1.0 <1.0
Benzene µg/L 11-Dec-20 5 <0.50 <0.50 <0.50
Benzo(a)pyrene µg/L 16-Jun-20 0.04 <0.0050 <0.0050 <0.0050
Bromoxynil µg/L 27-Oct-20 Oct-
2020020202020202202026-
Nov-19
5 <0.50 <0.50 <0.50
Carbaryl µg/L 27-Oct-20 90 <5.0 <5.0 <5.0
Carbofuran µg/L 27-Oct-20 90 <5.0 <5.0 <5.0
Carbon Tetrachloride µg/L 11-Dec-20 2 <0.50 <0.50 <0.50
Cyanobacterial toxins—Microcystin-LR
µg/L Apr–Nov-20 1.5 <0.20 <0.20 <0.20
Chlorpyrifos µg/L 27-Oct-20 90 <2.0 <2.0 <2.0
Diazinon µg/L 27-Oct-20 20 <2.0 <2.0 <2.0
Dicamba µg/L 27-Oct-20 120 <1.0 <1.0 <1.0
Dichlofop-Methyl µg/L 27-Oct-20 9 <0.90 <0.90 <0.90
Dichlorobenzene, 1,2- µg/L 11-Dec-20 200 ≤ 3 <0.50 <0.50 <0.50
Dichlorobenzene, 1,4- µg/L 11-Dec-20 5 ≤ 1 <0.50 <0.50 <0.50
Dichloroethane, 1,2- µg/L 11-Dec-20 5 <0.50 <0.50 <0.50
Dichloroethylene, 1,1- µg/L 11-Dec-20 14 <0.50 <0.50 <0.50
Dichloromethane µg/L 11-Dec-20 50 <1.0 <1.0 <1.0
Dichlorophenol, 2,4- µg/L 27-Oct-20 900 ≤ 0.3 <0.33 <0.10 <0.10
Dichlorophenoxyacetic acid, 2,4-(2,4-D)
µg/L 27-Oct-20 100 <1.0 <1.0 <1.0
Dimethoate µg/L 27-Oct-20 20 <2.0 <2.0 <2.0
Diquat µg/L 27-Oct-20 70 <7.0 <7.0 <7.0
Diuron µg/L 27-Oct-20 150 <10.0 <10.0 <10.0
Ethylbenzene µg/L 11-Dec-20 140 ≤ 1.6 <0.5 <0.5 <0.5
Glyphosate µg/L 27-Oct-20 280 <10.0 <10.0 <10.0
Malathion µg/L 27-Oct-20 190 <2.0 <2.0 <2.0
2-Methyl-4-chlorophenoxyacetic acid (MCPA)
µg/L 27-Oct-20 100 <2.0 <2.0 <2.0
Methyl t-butyl ether (MTBE) µg/L 11-Dec-20 None ≤ 15 <0.50 <0.50 <0.50
Metolachlor µg/L 27-Oct-20 50 <5.0 <5.0 <5.0
Metribuzin µg/L 27-Oct-20 80 <5.0 <5.0 <5.0
Monochlorobenzene µg/L 11-Dec-20 80 ≤ 30 <0.50 <0.50 <0.50
N-Nitroso dimethylamine (NDMA)
µg/L 27-Oct-20 0.04 <0.0021 <0.0021 <0.0021
Nitrilotriacetic Acid (NTA) µg/L 27-Oct-20 400 <50.0 <50.0 380
Paraquat (as Dichloride) µg/L 27-Oct-20 10 <1.0 <1.0 <1.0
Pentachlorophenol µg/L 27-Oct-20 60 ≤30 <0.33 <0.10 <0.10

Greater Vancouver Water District 2020 Water Quality Annual Report | 34
Units Date Sampled MAC AO Capilano Seymour Coquitlam
Phorate µg/L 27-Oct-20 2 <1.0 <1.0 <1.0
Picloram µg/L 27-Oct-20 190 <5.0 <5.0 <5.0
Simazine µg/L 27-Oct-20 10 <2.0 <2.0 <2.0
Terbufos µg/L 27-Oct-20 1 <1.0 <1.0 <1.0
Tetrachloroethylene µg/L 11-Dec-20 10 <0.50 <0.50 <0.50
Tetrachlorophenol, 2,3,4,6- µg/L 27-Oct-20 100 ≤ 1 <0.33 <0.10 <0.10
Toluene µg/L 11-Dec-20 60 24 <0.50 <0.50 <0.50
Trichloroethylene µg/L 11-Dec-20 5 <0.50 <0.50 <0.50
Trichlorophenol, 2,4,6- µg/L 27-Oct-20 5 ≤ 2 <0.33 <0.10 <0.10
Trifluralin µg/L 27-Oct-20 45 <5.0 <5.0 <5.0
Uranium (Total) µg/L 27-Oct-20 20 0.0298 0.0231 0.0489
Vinyl Chloride µg/L 11-Dec-20 2 <1.0 <1.0 <1.0
Xylene (Total) µg/L 11-Dec-20 90 ≤ 20 <1.0 <1.0 <1.0
Monitoring of Selected GVWD Water Mains for BTEXs
Parameters Units MAC AO Maple Ridge Main
at Reservoir
Barnston Island Main at
Willoughby PS
Jericho-Clayton Main
South Burnaby Main #2
15-Jun 23-Nov- 17-Jun 25-Nov 17-Jun 25-Nov 18-Jun 25-Nov
Benzene µg/L 5 - <0.5 <0.5 <0.5 <0.5 <0.5 <0.5 <0.5 <0.5
Ethylbenzene µg/L 140 1.6 <0.5 <0.5 <0.5 <0.5 <0.5 <0.5 <0.5 <0.5
Toluene µg/L 60 24 <0.5 0.5 <0.5 <0.5 <0.5 <0.5 <0.5 <0.5
Xylenes Total) µg/L 90 20 1.0 1.0 1.0 1.0 1.0 1.0 1.0 1.0

Greater Vancouver Water District 2020 Water Quality Annual Report | 35
Analysis of Source Water for PAH’s
Parameters Units Capilano Seymour Coquitlam
16-Jun 24-Nov 16-Jun 24-Nov 16-Jun 24-Nov
Acenaphthene µg/L <0.010 <0.010 <0.010 <0.010 <0.010 <0.010
Acenaphthylene µg/L <0.010 <0.010 <0.010 <0.010 <0.010 <0.010
Acridine µg/L <0.010 <0.010 <0.010 <0.010 <0.010 <0.010
Anthracene µg/L <0.010 <0.010 <0.010 <0.010 <0.010 <0.010
Benzo(a)anthracene µg/L <0.010 <0.010 <0.010 <0.010 <0.010 <0.010
Benzo(a)pyrene1 µg/L <0.0050 <0.0050 <0.0050 <0.0050 <0.0050 <0.0050
Benzo(b+j)fluoranthene µg/L <0.010 <0.010 <0.010 <0.010 <0.010 <0.010
Benzo(b+j+k)fluoranthene µg/L <0.015 <0.015 <0.015 <0.015 <0.015 <0.015
Benzo(g,h,i)perylene µg/L <0.010 <0.010 <0.010 <0.010 <0.010 <0.010
Benzo(k)fluoranthene µg/L <0.010 <0.010 <0.010 <0.010 <0.010 <0.010
Chrysene µg/L <0.010 <0.010 <0.010 <0.010 <0.010 <0.010
Dibenzo(a,h)anthracene µg/L <0.0050 <0.0050 <0.0050 <0.0050 <0.0050 <0.0050
Fluoranthene µg/L <0.010 <0.010 <0.010 <0.010 <0.010 <0.010
Fluorene µg/L <0.010 <0.010 <0.010 <0.010 <0.010 <0.010
Indeno(1,2,3-c,d)pyrene µg/L <0.010 <0.010 <0.010 <0.010 <0.010 <0.010
methylnaphthalene, 1- µg/L <0.010 <0.010 <0.010 <0.010 <0.010 <0.010
methylnaphthalene, 2- µg/L <0.010 <0.010 <0.010 <0.010 <0.010 <0.010
Naphthalene µg/L <0.050 <0.050 <0.050 <0.050 <0.050 <0.050
Phenanthrene µg/L <0.020 <0.020 <0.020 <0.020 <0.020 <0.020
Pyrene µg/L <0.010 <0.010 <0.010 <0.010 <0.010 <0.010
Quinoline µg/L <0.050 <0.050 <0.050 <0.050 <0.050 <0.050

Greater Vancouver Water District 2020 Water Quality Annual Report | 36
Analysis of Selected GVWD Mains for PAHs
Parameters Units Coquitlam Main #2
Westburnco Reservoir
Barnston Island
Queensborough Whalley Kennedy
Link Main Haney Main #2
36th Ave
Main 16-Jun 25-Nov 17-Jun 25-Nov 18-Jun 24-Nov 16-Jun 23-Nov 15-Jun 23-Nov 17-Jun 26-Nov
Acenaphthene µg/L <0.010 <0.010 <0.010 <0.010 <0.010 <0.010 <0.010 <0.010 <0.010 <0.010 <0.010 <0.010
Acenaphthylene µg/L <0.010 <0.010 <0.010 <0.010 <0.010 <0.010 <0.010 <0.010 <0.010 <0.010 <0.010 <0.010
Acridine µg/L <0.010 <0.010 <0.010 <0.010 <0.010 <0.010 <0.010 <0.010 <0.010 <0.010 <0.010 <0.010
Anthracene µg/L <0.010 <0.010 <0.010 <0.010 <0.010 <0.010 <0.010 <0.010 <0.010 <0.010 <0.010 <0.010
Benzo(a)anthracene µg/L <0.010 <0.010 <0.010 <0.010 <0.010 <0.010 <0.010 <0.010 <0.010 <0.010 <0.010 <0.010
Benzo(a)pyrene1 µg/L <0.0050 <0.0050 <0.0050 <0.0050 <0.0050 <0.0050 <0.0050 <0.0050 <0.0050 <0.0050 <0.0050 <0.0050
Benzo(b+j)fluoranthene µg/L <0.010 <0.010 <0.010 <0.010 <0.010 <0.010 <0.010 <0.010 <0.010 <0.010 <0.010 <0.010
Benzo(b+j+k)fluoranthene µg/L <0.015 <0.015 <0.015 <0.015 <0.015 <0.015 <0.015 <0.015 <0.015 <0.015 <0.015 <0.015
Benzo(g,h,i)perylene µg/L <0.010 <0.010 <0.010 <0.010 <0.010 <0.010 <0.010 <0.010 <0.010 <0.010 <0.010 <0.010
Benzo(k)fluoranthene µg/L <0.010 <0.010 <0.010 <0.010 <0.010 <0.010 <0.010 <0.010 <0.010 <0.010 <0.010 <0.010
Chrysene µg/L <0.010 <0.010 <0.010 <0.010 <0.010 <0.010 <0.010 <0.010 <0.010 <0.010 <0.010 <0.010
Dibenzo(a,h)anthracene µg/L <0.0050 <0.0050 <0.0050 <0.0050 <0.0050 <0.0050 <0.0050 <0.0050 <0.0050 <0.0050 <0.0050 <0.0050
Fluoranthene µg/L <0.010 <0.010 <0.010 <0.010 <0.010 <0.010 <0.010 <0.010 <0.010 <0.010 <0.010 <0.010
Fluorene µg/L <0.010 <0.010 <0.010 <0.010 <0.010 <0.010 <0.010 <0.010 <0.010 <0.020 <0.010 <0.010
Indeno(1,2,3-c,d)pyrene µg/L <0.010 <0.010 <0.010 <0.000 <0.010 <0.010 <0.010 <0.010 <0.010 <0.010 <0.010 <0.010
methylnaphthalene, 1- µg/L <0.010 <0.010 <0.010 <0.010 <0.010 <0.010 <0.010 <0.010 <0.010 <0.010 <0.010 <0.010
methylnaphthalene, 2- µg/L <0.010 <0.010 <0.010 <0.010 <0.010 <0.010 <0.010 <0.010 <0.010 <0.010 <0.010 <0.010
Naphthalene µg/L <0.050 <0.050 <0.050 <0.050 <0.050 <0.050 <0.050 <0.050 <0.050 <0.050 <0.050 <0.050
Phenanthrene µg/L <0.020 <0.020 <0.020 <0.020 <0.020 <0.020 <0.020 <0.020 <0.020 <0.020 <0.020 <0.020
Pyrene µg/L <0.010 <0.010 <0.010 <0.010 <0.010 <0.010 <0.010 <0.010 <0.010 <0.010 <0.010 <0.010
Quinoline µg/L <0.050 <0.050 <0.050 <0.050 <0.050 <0.050 <0.050 <0.050 <0.050 <0.050 <0.050 <0.050
1Benzo(a)pyrene is the only PAH compound that has guideline limit. Maximum Acceptable Concentration of Benzo(a)pyrene is 0.04µg/L

Greater Vancouver Water District 2020 Water Quality Annual Report | 37
Monitoring of Source Waters for PFOS and PFOA 1
Parameters Units MAC Capilano Seymour Coquitlam
PFOS ng/L 600 <0.765 <0.756 <0.757
PFOA ng/L 200 <0.765 <0.756 <0.757
ANALYTE Capilano Seymour Coquitlam
PFBA <3.06 <3.03 <3.03
PFPeA <1.53 <1.51 <1.51
PFHxA <0.765 <0.756 <0.757
PFHpA <0.765 <0.756 <0.757
PFOA <0.765 <0.756 <0.757
PFNA <0.765 <0.756 <0.757
PFDA <0.765 <0.756 <0.757
PFUnA <0.765 <0.756 <0.757
PFDoA <0.765 <0.756 <0.757
PFTrDA <0.765 <0.756 <0.757
PFTeDA <0.765 <0.756 <0.757
PFBS <0.765 <0.756 <0.757
PFPeS <0.765 <0.756 <0.757
PFHxS <0.765 <0.756 <0.757
PFHpS <0.765 <0.756 <0.757
PFOS <0.765 <0.756 <0.757
PFNS <0.765 <0.756 <0.757
PFDS <0.765 <0.756 <0.757
PFDoS <0.765 <0.756 <0.757
4:2 FTS <3.06 <3.03 <3.03
6:2 FTS <2.75 <2.72 <2.73
8:2 FTS <3.06 <3.03 <3.03
PFOSA <0.765 <0.756 <0.757
N-MeFOSA <0.88 <0.87 <0.871
N-EtFOSA <1.91 <1.89 <1.89
MeFOSAA <0.765 <0.756 <0.757
EtFOSAA <0.765 <0.756 <0.757
N-MeFOSE <7.65 <7.56 <7.57
N-EtFOSE <5.74 <5.67 <5.68
HFPO-DA <2.91 <2.87 <2.88
ADONA <3.06 <3.03 <3.03
9Cl-PF3ONS <3.06 <3.03 <3.03
11Cl-PF3OUdS <3.06 <3.03 <3.03
1Samples analyzed on April 27th.

Greater Vancouver Water District 2020 Water Quality Annual Report | 38
Analysis of Source Water for Radioactivity
1The October 6, 2020 Radon-222 result for the Capilano Source was unusual. A repeat of the test was done with a sample taken on December 15, 2020.
Radioactivity
Units
Date Sampled
MAC1
Capilano Seymour Coquitlam
Activity Activity Activity
Gross Alpha Bq/L 06-Oct-20 <0.5 <0.10 <0.10 <0.10
Gross Beta Bq/L 06-Oct-20 <1.0 <0.10 <0.10 <0.10
Cobalt-60 Bq/L 06-Oct-20 2 <1 <1 <1
Cesium-134 Bq/L 06-Oct-20 7 <1 <1 <1
Cesium-137 Bq/L 06-Oct-20 10 <1 <1 <1
Iodine-131 Bq/L 06-Oct-20 6 <1 <1 <1
Lead-210 Bq/L 06-Oct-20 0.2 <0.10 <0.10 <0.10
Radium-226 Bq/L 06-Oct-20 0.5 <1.0 <1.0 <1.0
Radon-222 Bq/L 06-Oct-20 None 16 <10 <10
Strontium-90 Bq/L 06-Oct-20 5 <0.10 <0.10 <0.10
Tritium (H-3) Bq/L 06-Oct-20 7000 <20 <20 <20
Radon-222 Repeat1 Bq/L 15-Dec-20 None <10 <10 <10
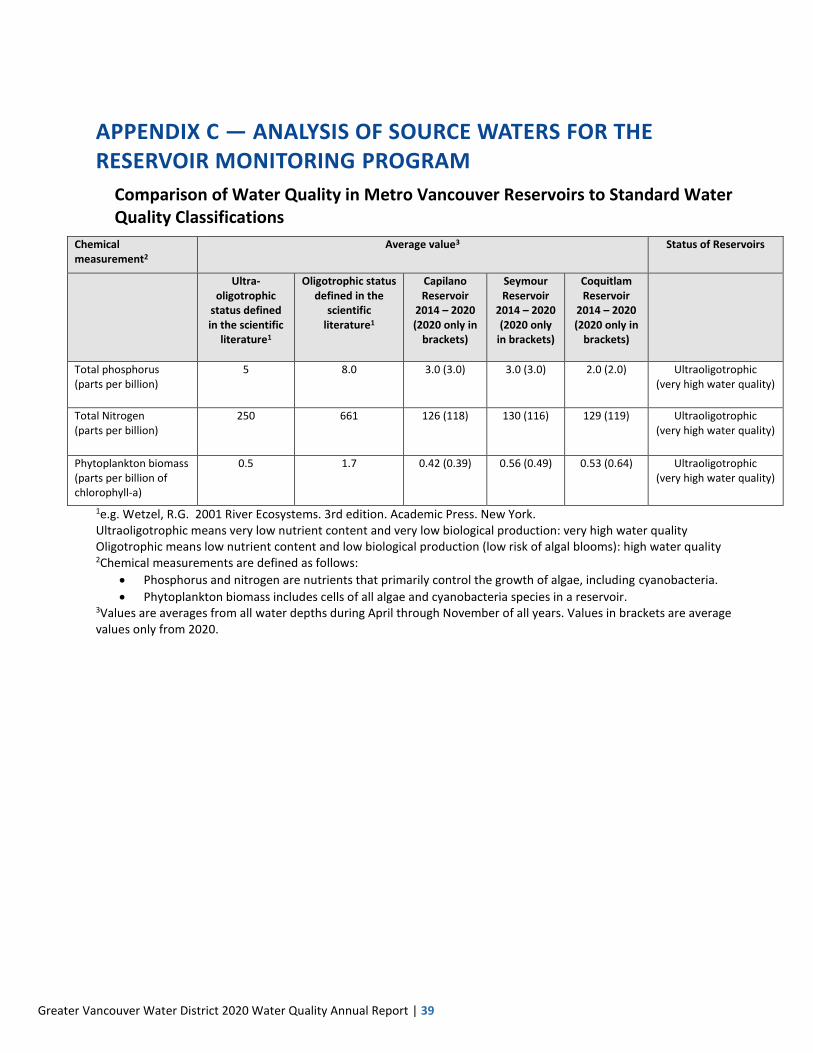
Greater Vancouver Water District 2020 Water Quality Annual Report | 39
APPENDIX C — ANALYSIS OF SOURCE WATERS FOR THE RESERVOIR MONITORING PROGRAM
Comparison of Water Quality in Metro Vancouver Reservoirs to Standard Water Quality Classifications
Chemical measurement2
Average value3 Status of Reservoirs
Ultra-oligotrophic
status defined in the scientific
literature1
Oligotrophic status defined in the
scientific literature1
Capilano Reservoir
2014 – 2020 (2020 only in
brackets)
Seymour Reservoir
2014 – 2020 (2020 only
in brackets)
Coquitlam Reservoir
2014 – 2020 (2020 only in
brackets)
Total phosphorus (parts per billion)
5 8.0 3.0 (3.0) 3.0 (3.0) 2.0 (2.0) Ultraoligotrophic (very high water quality)
Total Nitrogen (parts per billion)
250 661 126 (118) 130 (116) 129 (119) Ultraoligotrophic (very high water quality)
Phytoplankton biomass (parts per billion of chlorophyll-a)
0.5 1.7 0.42 (0.39) 0.56 (0.49) 0.53 (0.64) Ultraoligotrophic (very high water quality)
1e.g. Wetzel, R.G. 2001 River Ecosystems. 3rd edition. Academic Press. New York. Ultraoligotrophic means very low nutrient content and very low biological production: very high water quality Oligotrophic means low nutrient content and low biological production (low risk of algal blooms): high water quality 2Chemical measurements are defined as follows:
Phosphorus and nitrogen are nutrients that primarily control the growth of algae, including cyanobacteria.
Phytoplankton biomass includes cells of all algae and cyanobacteria species in a reservoir. 3Values are averages from all water depths during April through November of all years. Values in brackets are average values only from 2020.

Greater Vancouver Water District 2020 Water Quality Annual Report | 40
Consistently low TSI values over time show sustained high water quality

Greater Vancouver Water District 2020 Water Quality Annual Report | 41
APPENDIX D — REPORT TO METRO VANCOUVER ON GIARDIA AND CRYPTOSPORIDIUM STUDY This page has been intentionally left blank

Greater Vancouver Water District 2020 Water Quality Annual Report | 42

Greater Vancouver Water District 2020 Water Quality Annual Report | 43
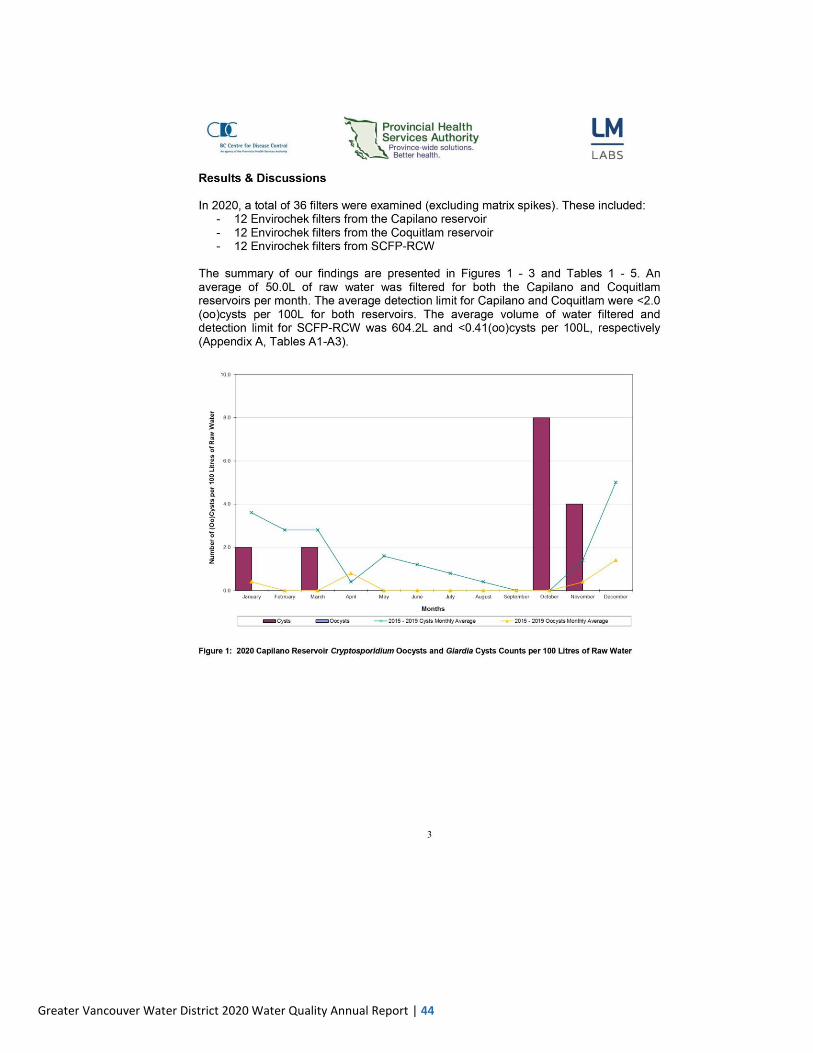
Greater Vancouver Water District 2020 Water Quality Annual Report | 44

Greater Vancouver Water District 2020 Water Quality Annual Report | 45

Greater Vancouver Water District 2020 Water Quality Annual Report | 46

Greater Vancouver Water District 2020 Water Quality Annual Report | 47

Greater Vancouver Water District 2020 Water Quality Annual Report | 48

Greater Vancouver Water District 2020 Water Quality Annual Report | 49

Greater Vancouver Water District 2020 Water Quality Annual Report | 50

Greater Vancouver Water District 2020 Water Quality Annual Report | 51

Greater Vancouver Water District 2020 Water Quality Annual Report | 52

Greater Vancouver Water District 2020 Water Quality Annual Report | 53