Embed Size (px)
Citation preview
Section 5.3 – Graphs of the Cosecant and Secant Functions 1
Section 5.3 Graphs of the Cosecant, Secant, Tangent, and Cotangent Functions
The Cosecant Graph
RECALL: 1
cscsin
xx
so where sin 0x , csc x has an asymptote.
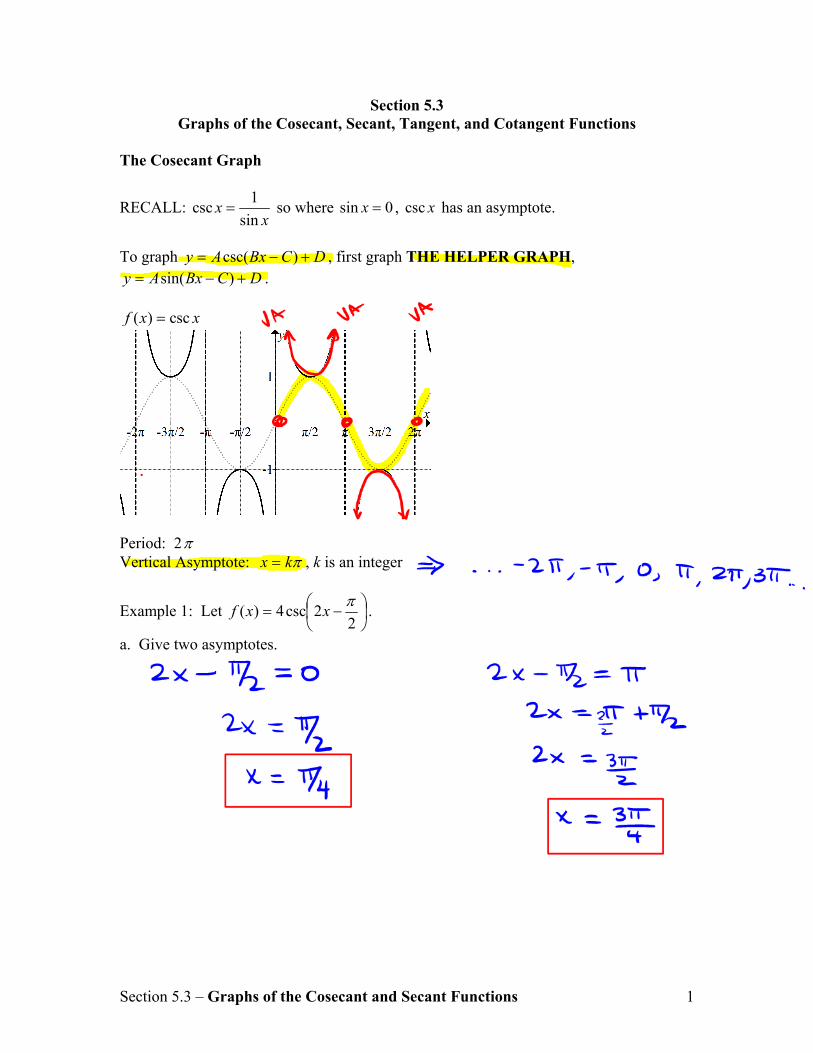
To graph DCBxAy )csc( , first graph THE HELPER GRAPH,
DCBxAy )sin( .
( ) cscf x x
Period: 2 Vertical Asymptote: kx , k is an integer
Example 1: Let
22csc4)(
xxf .
a. Give two asymptotes.
Section 5.3 – Graphs of the Cosecant and Secant Functions 2
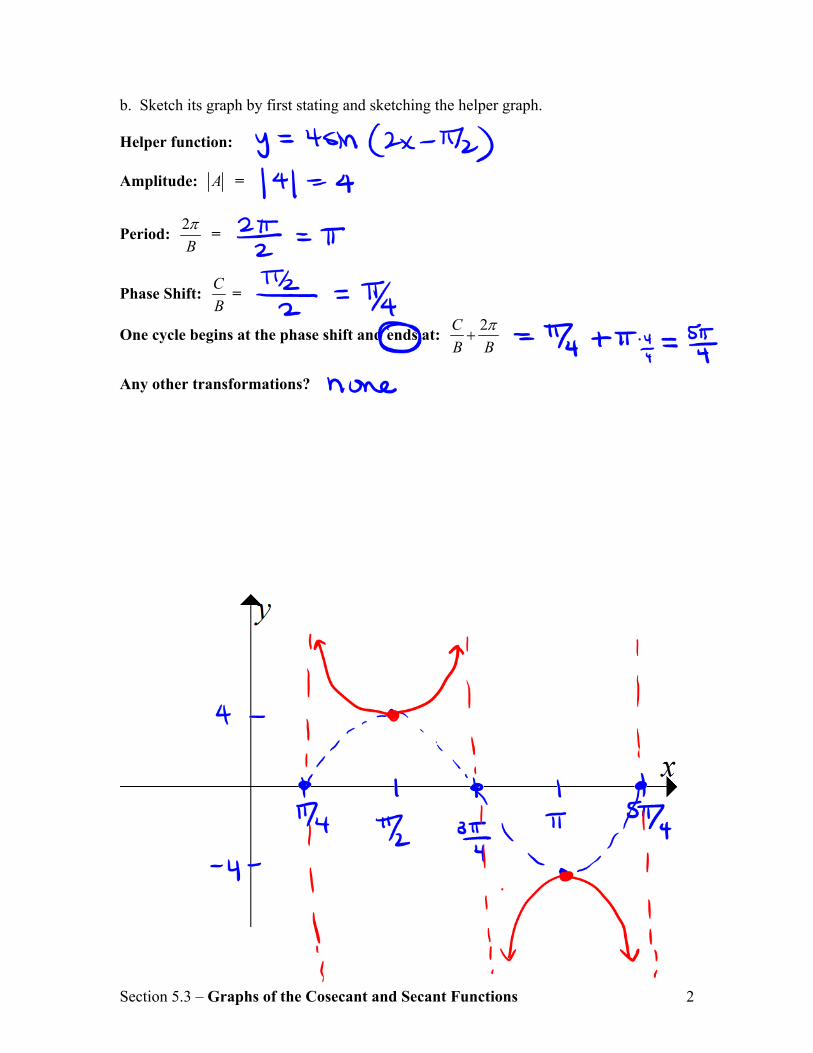
b. Sketch its graph by first stating and sketching the helper graph. Helper function: Amplitude: A =
Period: 2
B
=
Phase Shift: C
B =
One cycle begins at the phase shift and ends at: 2C
B B
Any other transformations?
Section 5.3 – Graphs of the Cosecant and Secant Functions 3
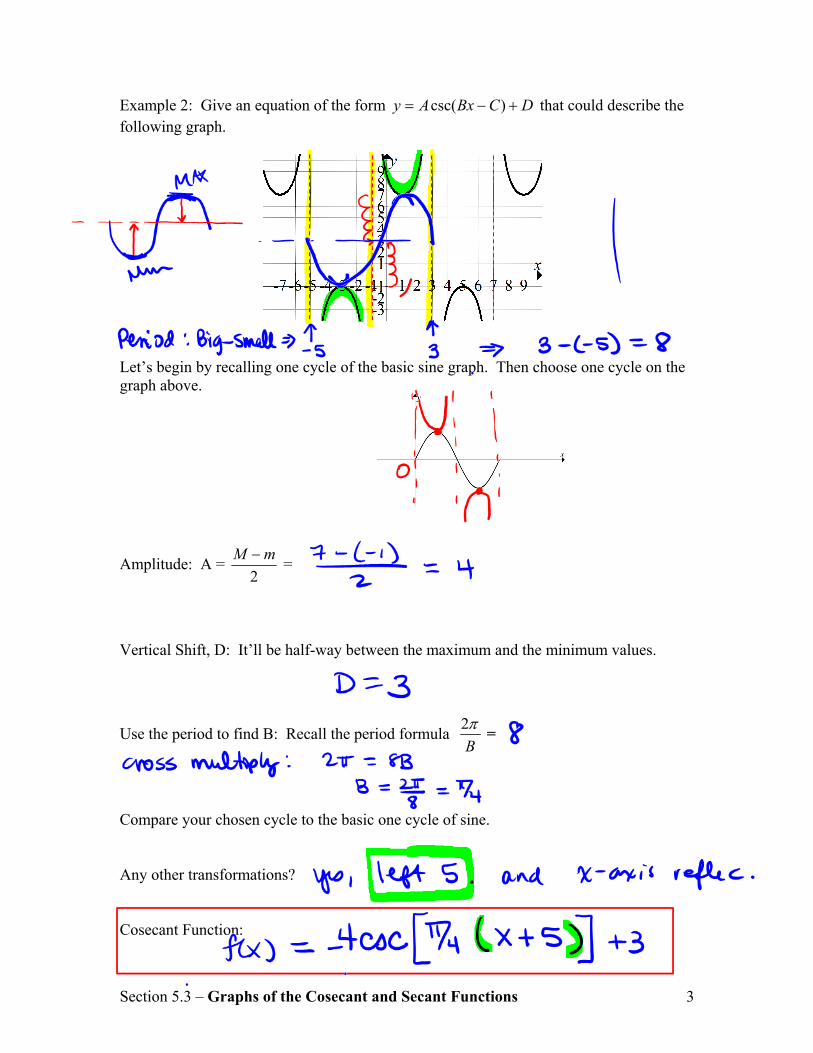
Example 2: Give an equation of the form DCBxAy )csc( that could describe the following graph.
Let’s begin by recalling one cycle of the basic sine graph. Then choose one cycle on the graph above.
Amplitude: A = 2
mM =
Vertical Shift, D: It’ll be half-way between the maximum and the minimum values.
Use the period to find B: Recall the period formula 2
B
=
Compare your chosen cycle to the basic one cycle of sine. Any other transformations? Cosecant Function:
Section 5.3 – Graphs of the Cosecant and Secant Functions 4
The Secant Graph
RECALL: 1
seccos
xx
so where cos 0x , sec x has an asymptote.
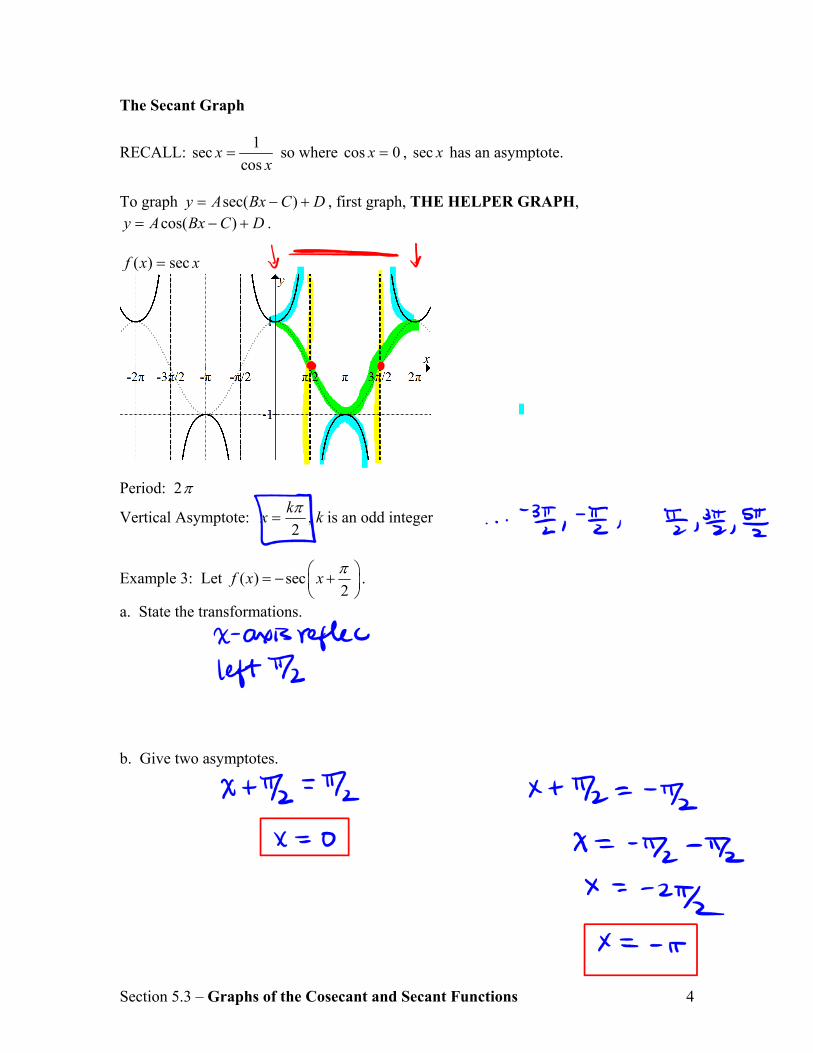
To graph DCBxAy )sec( , first graph, THE HELPER GRAPH,
DCBxAy )cos( .
( ) secf x x
Period: 2
Vertical Asymptote: 2
kx , k is an odd integer
Example 3: Let ( ) sec2
f x x
.
a. State the transformations. b. Give two asymptotes.
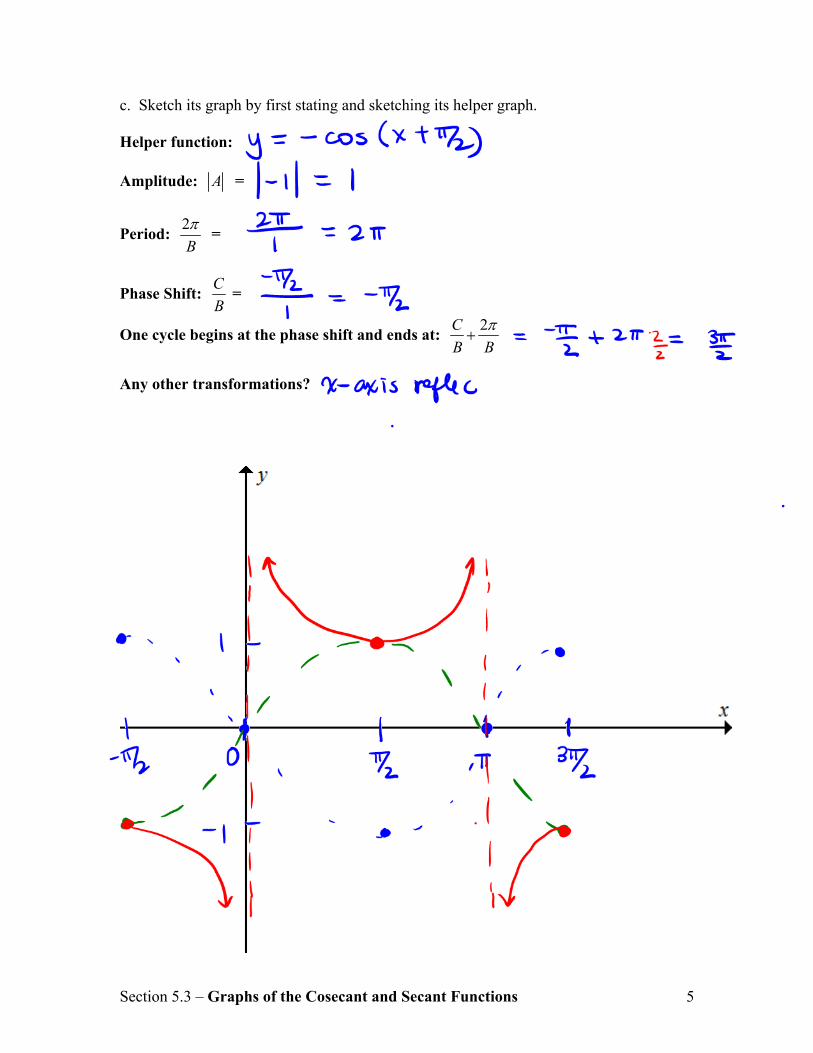
Section 5.3 – Graphs of the Cosecant and Secant Functions 5
c. Sketch its graph by first stating and sketching its helper graph. Helper function: Amplitude: A =
Period: 2
B
=
Phase Shift: C
B =
One cycle begins at the phase shift and ends at: 2C
B B
Any other transformations?
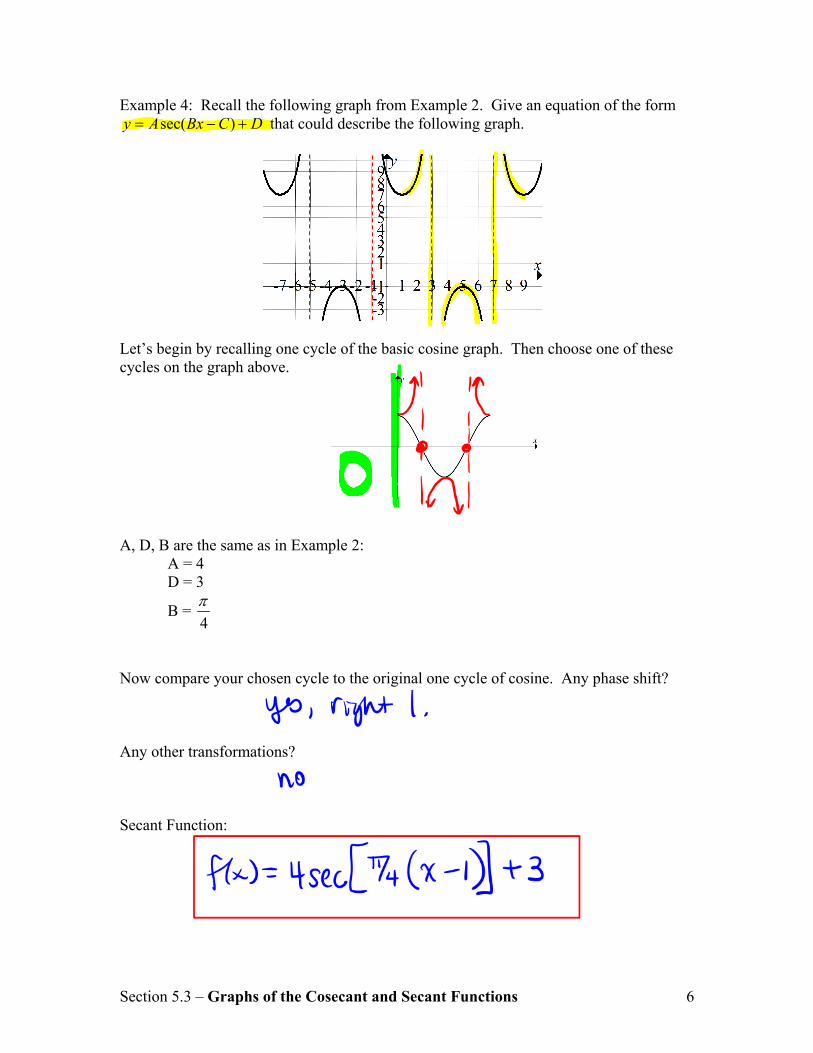
Section 5.3 – Graphs of the Cosecant and Secant Functions 6
Example 4: Recall the following graph from Example 2. Give an equation of the form DCBxAy )sec( that could describe the following graph.
Let’s begin by recalling one cycle of the basic cosine graph. Then choose one of these cycles on the graph above.
A, D, B are the same as in Example 2:
A = 4 D = 3
B = 4
Now compare your chosen cycle to the original one cycle of cosine. Any phase shift? Any other transformations? Secant Function:
Section 5.3 – Graphs of the Cosecant and Secant Functions 7
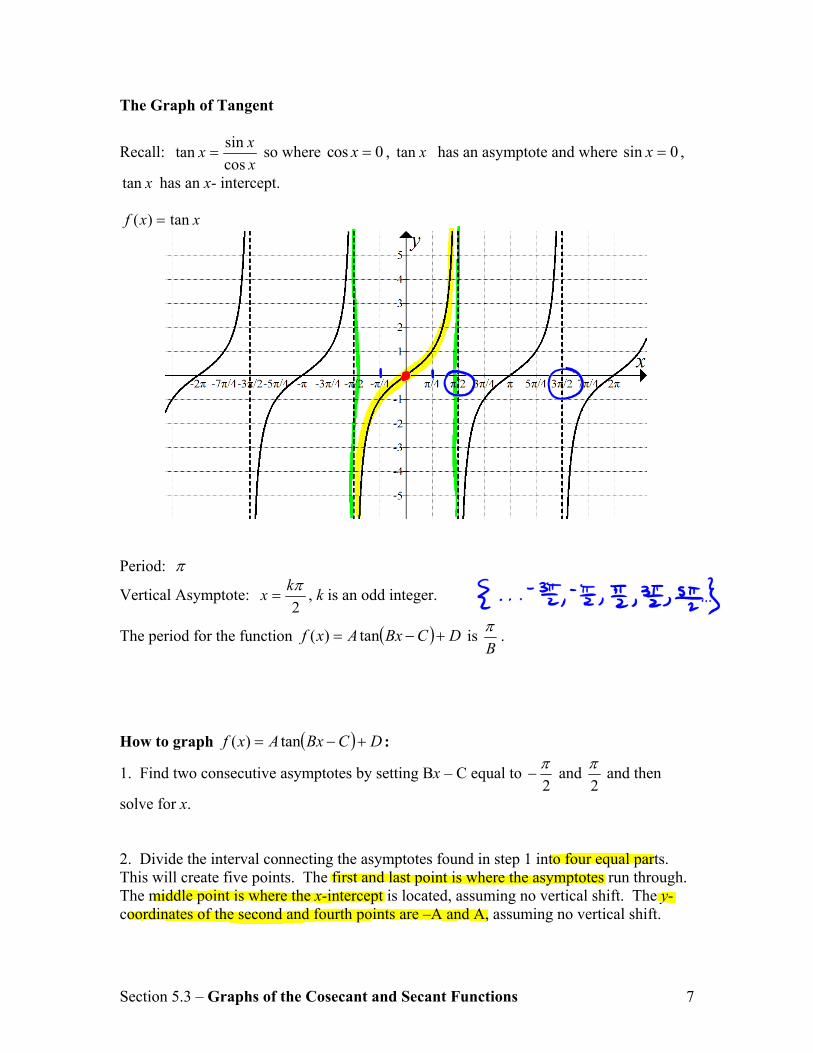
The Graph of Tangent
Recall: sin
tancos
xx
x so where cos 0x , tan x has an asymptote and where sin 0x ,
tan x has an x- intercept.
( ) tanf x x
Period:
Vertical Asymptote: 2
kx , k is an odd integer.
The period for the function DCBxAxf tan)( is B
.
How to graph DCBxAxf tan)( :
1. Find two consecutive asymptotes by setting Bx – C equal to 2
and
2
and then
solve for x. 2. Divide the interval connecting the asymptotes found in step 1 into four equal parts. This will create five points. The first and last point is where the asymptotes run through. The middle point is where the x-intercept is located, assuming no vertical shift. The y-coordinates of the second and fourth points are –A and A, assuming no vertical shift.
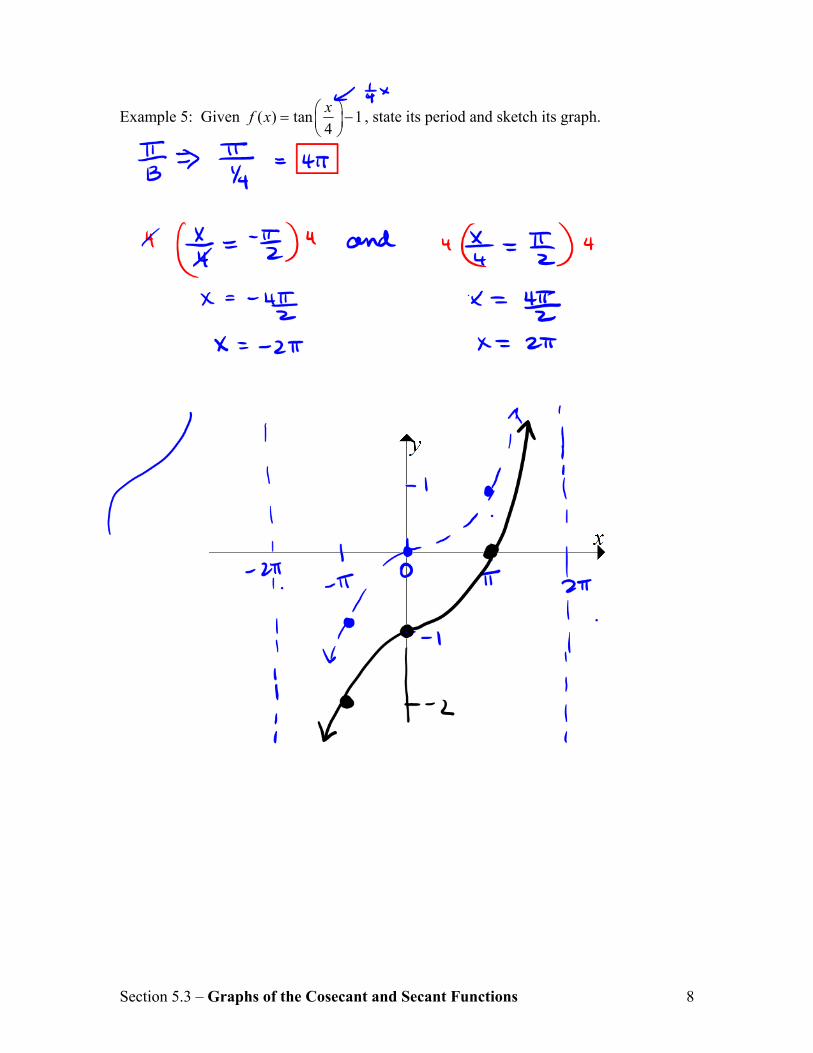
Section 5.3 – Graphs of the Cosecant and Secant Functions 8
Example 5: Given ( ) tan 14
xf x
, state its period and sketch its graph.
Section 5.3 – Graphs of the Cosecant and Secant Functions 9
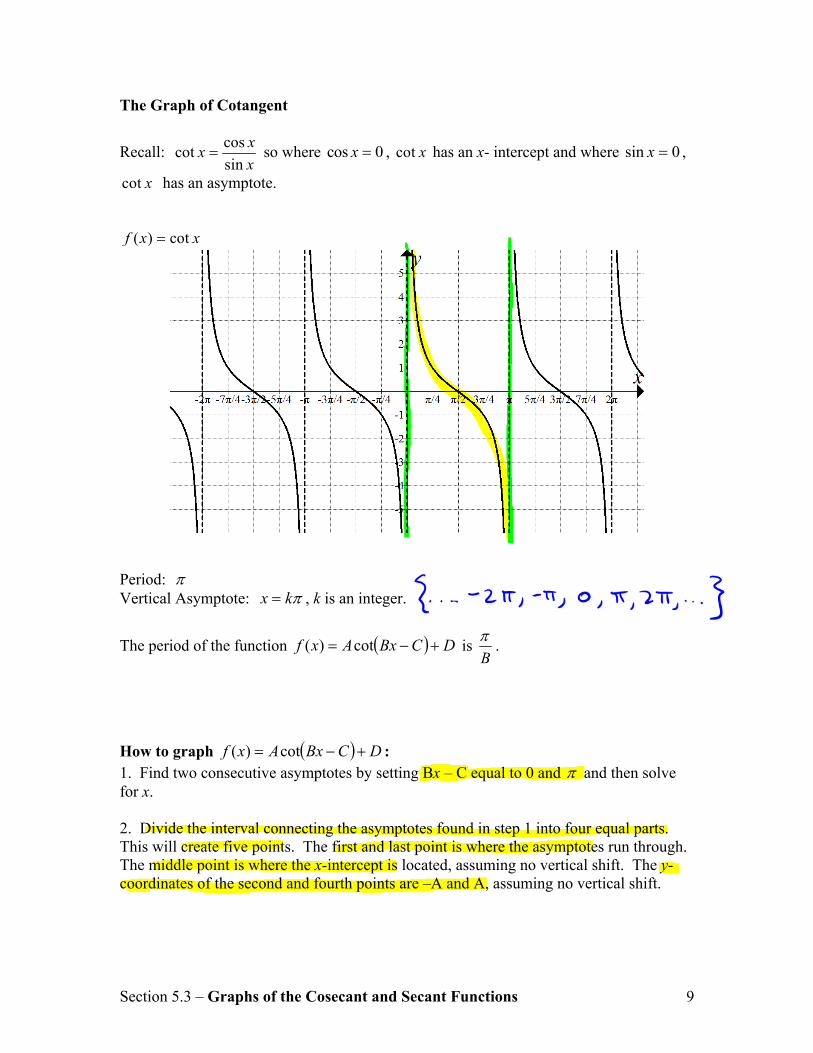
The Graph of Cotangent
Recall: cos
cotsin
xx
x so where cos 0x , cot x has an x- intercept and where sin 0x ,
cot x has an asymptote.
( ) cotf x x
Period: Vertical Asymptote: kx , k is an integer.
The period of the function DCBxAxf cot)( is B
.
How to graph DCBxAxf cot)( : 1. Find two consecutive asymptotes by setting Bx – C equal to 0 and and then solve for x. 2. Divide the interval connecting the asymptotes found in step 1 into four equal parts. This will create five points. The first and last point is where the asymptotes run through. The middle point is where the x-intercept is located, assuming no vertical shift. The y-coordinates of the second and fourth points are –A and A, assuming no vertical shift.
Section 5.3 – Graphs of the Cosecant and Secant Functions 10
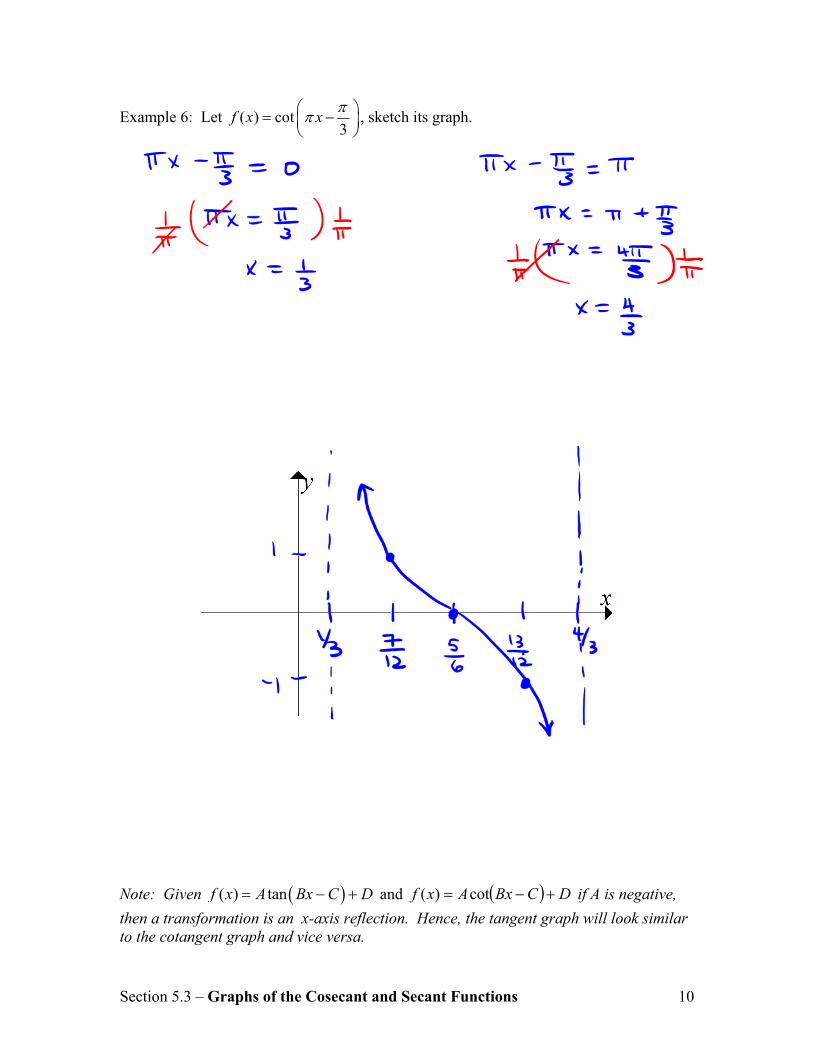
Example 6: Let ( ) cot3
f x x
, sketch its graph.
Note: Given ( ) tanf x A Bx C D and DCBxAxf cot)( if A is negative,
then a transformation is an x-axis reflection. Hence, the tangent graph will look similar to the cotangent graph and vice versa.
Section 5.3 – Graphs of the Cosecant and Secant Functions 11
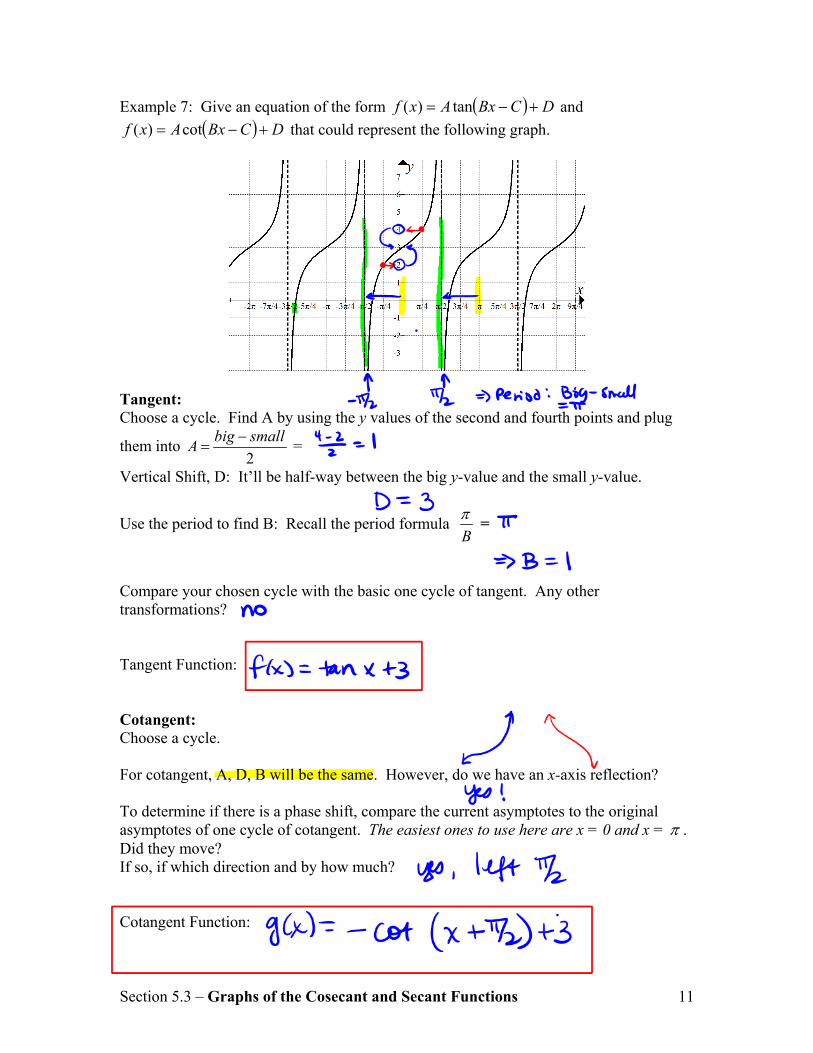
Example 7: Give an equation of the form DCBxAxf tan)( and
DCBxAxf cot)( that could represent the following graph.
Tangent: Choose a cycle. Find A by using the y values of the second and fourth points and plug
them into 2
big smallA
=
Vertical Shift, D: It’ll be half-way between the big y-value and the small y-value.
Use the period to find B: Recall the period formula B
=
Compare your chosen cycle with the basic one cycle of tangent. Any other transformations? Tangent Function: Cotangent: Choose a cycle. For cotangent, A, D, B will be the same. However, do we have an x-axis reflection? To determine if there is a phase shift, compare the current asymptotes to the original asymptotes of one cycle of cotangent. The easiest ones to use here are x = 0 and x = . Did they move? If so, if which direction and by how much? Cotangent Function:
Section 5.3 – Graphs of the Cosecant and Secant Functions 12
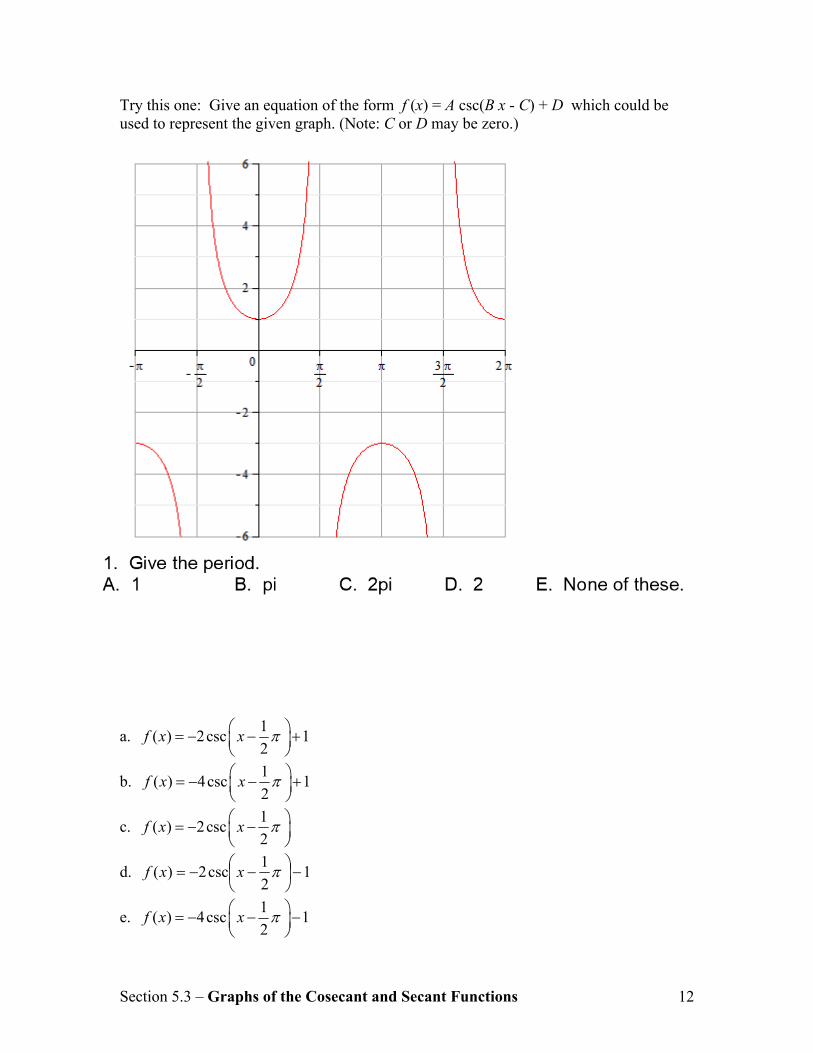
Try this one: Give an equation of the form f (x) = A csc(B x - C) + D which could be used to represent the given graph. (Note: C or D may be zero.)
a. 1
( ) 2csc 12
f x x
b. 1
( ) 4csc 12
f x x
c. 1
( ) 2csc2
f x x
d. 12
1csc2)(
xxf
e. 1
( ) 4csc 12
f x x