Embed Size (px)
DESCRIPTION
Grant Park Fund 10Q 09.30.07
Citation preview
UNITED STATES SECURITIES AND EXCHANGE COMMISSION
Washington, D.C. 20549
FORM 10-Q
QUARTERLY REPORT PURSUANT TO SECTION 13 OR 15(d) OF THE SECURITIES EXCHANGE ACT OF 1934
For the Quarterly Period Ended: September 30, 2007
TRANSITION REPORT PURSUANT TO SECTION 13 OR 15(d) OF
THE SECURITIES EXCHANGE ACT OF 1934
For the Transition Period From to .
Commission File Number: 0-50316
Grant Park Futures Fund Limited Partnership
(Exact name of registrant as specified in its charter)
Illinois 36-3596839 (State or other jurisdiction of incorporation or organization)
(I.R.S. Employer Identification No.)
c/o Dearborn Capital Management, L.L.C.
555 West Jackson Boulevard, Suite 600 Chicago, Illinois 60661
(Address of principal executive offices, including zip code) Registrant’s telephone number, including area code: (312) 756-4450
Indicate by check mark whether the Registrant: (1) has filed all reports required to be filed by Section 13 or 15(d) of the
Securities Exchange Act of 1934 during the preceding 12 months (or for such shorter period that the registrant was required to file such reports), and (2) has been subject to such filing requirements for the past 90 days. Yes No
Indicate by check mark whether the Registrant is a large accelerated filer, an accelerated filer, or a non-accelerated filer. See
definition of “accelerated filer and large accelerated filer” in Rule 12b-2 of the Exchange Act. (Check one): Large accelerated filer Accelerated filer Non-accelerated filer Indicate by check mark whether the Registrant is a shell company (as defined in Rule 12b-2 of the Securities Exchange Act
of 1934). Yes No
GRANT PARK FUTURES FUND LIMITED PARTNERSHIP
QUARTER ENDED September 30, 2007
INDEX
PART I - FINANCIAL INFORMATION Item 1. Financial Statements Statements of Financial Condition as of September 30, 2007 (unaudited)
and December 31, 2006 (audited) 1
Condensed Schedule of Investments as of September 30, 2007 (unaudited) 2 Condensed Schedule of Investments as of December 31, 2006 (audited) 4 Statements of Operations for the three months and nine months ended
September 30, 2007 and 2006 (unaudited) 6
Statements of Changes in Partners’ Capital (Net Asset Value)
for the three and nine months ended September 30, 2007 and 2006 (unaudited) 7
Notes to Financial Statements (unaudited) 9 Item 2. Management’s Discussion and Analysis of Financial Condition and Results of Operations 15 Item 3. Quantitative and Qualitative Disclosures About Market Risk 23 Item 4. Controls and Procedures 26 PART II - OTHER INFORMATION Item 1A. Risk Factors 27 Item 2. Unregistered Sales of Equity Securities and Use of Proceeds 27 Item 6. Exhibits 29 SIGNATURES 30CERTIFICATIONS 31
PART I - FINANCIAL INFORMATION
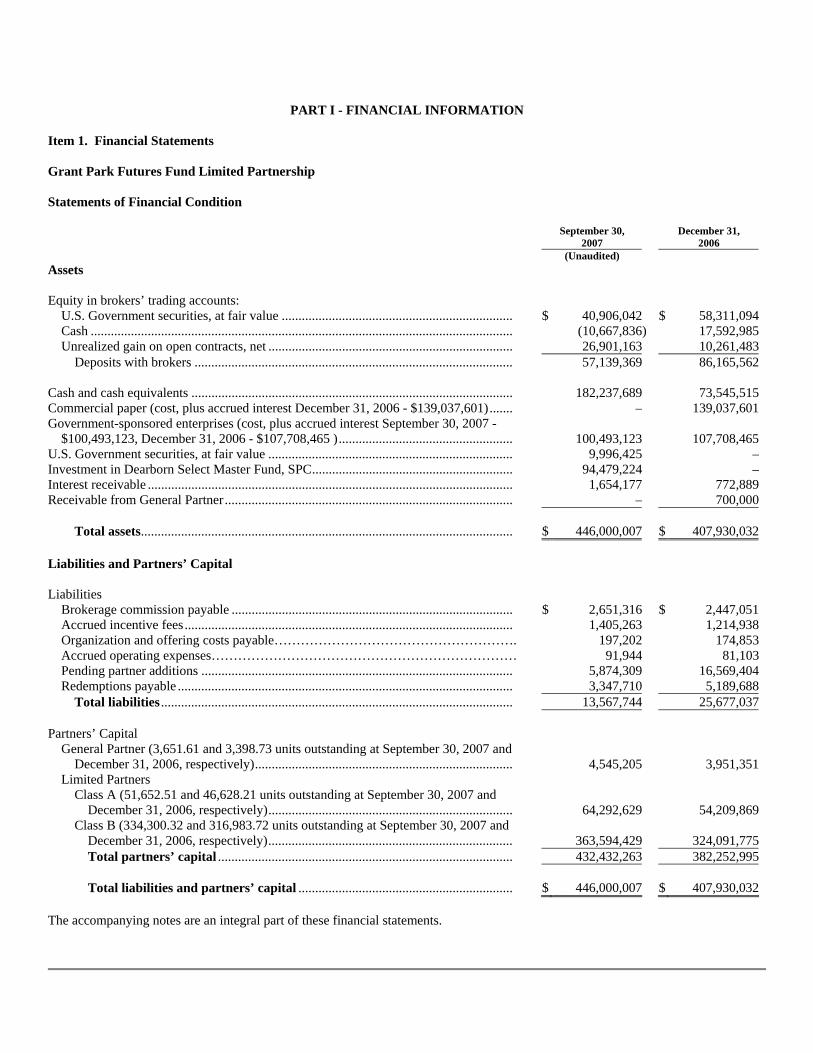
Item 1. Financial Statements Grant Park Futures Fund Limited Partnership Statements of Financial Condition
September 30,
2007 December 31,
2006 (Unaudited) Assets Equity in brokers’ trading accounts:
U.S. Government securities, at fair value ..................................................................... $ 40,906,042 $ 58,311,094 Cash .............................................................................................................................. (10,667,836) 17,592,985 Unrealized gain on open contracts, net ......................................................................... 26,901,163 10,261,483
Deposits with brokers ............................................................................................... 57,139,369 86,165,562 Cash and cash equivalents ................................................................................................ 182,237,689 73,545,515 Commercial paper (cost, plus accrued interest December 31, 2006 - $139,037,601)....... – 139,037,601 Government-sponsored enterprises (cost, plus accrued interest September 30, 2007 -
$100,493,123, December 31, 2006 - $107,708,465 ).................................................... 100,493,123 107,708,465 U.S. Government securities, at fair value ......................................................................... 9,996,425 – Investment in Dearborn Select Master Fund, SPC............................................................ 94,479,224 – Interest receivable ............................................................................................................. 1,654,177 772,889 Receivable from General Partner...................................................................................... – 700,000
Total assets............................................................................................................... $ 446,000,007 $ 407,930,032 Liabilities and Partners’ Capital Liabilities
Brokerage commission payable .................................................................................... $ 2,651,316 $ 2,447,051 Accrued incentive fees.................................................................................................. 1,405,263 1,214,938 Organization and offering costs payable………………………………………………. 197,202 174,853 Accrued operating expenses…………………………………………………………… 91,944 81,103 Pending partner additions ............................................................................................. 5,874,309 16,569,404 Redemptions payable .................................................................................................... 3,347,710 5,189,688
Total liabilities ......................................................................................................... 13,567,744 25,677,037 Partners’ Capital
General Partner (3,651.61 and 3,398.73 units outstanding at September 30, 2007 and December 31, 2006, respectively)............................................................................. 4,545,205 3,951,351
Limited Partners Class A (51,652.51 and 46,628.21 units outstanding at September 30, 2007 and
December 31, 2006, respectively)......................................................................... 64,292,629 54,209,869 Class B (334,300.32 and 316,983.72 units outstanding at September 30, 2007 and
December 31, 2006, respectively)......................................................................... 363,594,429 324,091,775 Total partners’ capital ........................................................................................ 432,432,263 382,252,995
Total liabilities and partners’ capital ................................................................ $ 446,000,007 $ 407,930,032
The accompanying notes are an integral part of these financial statements.
2
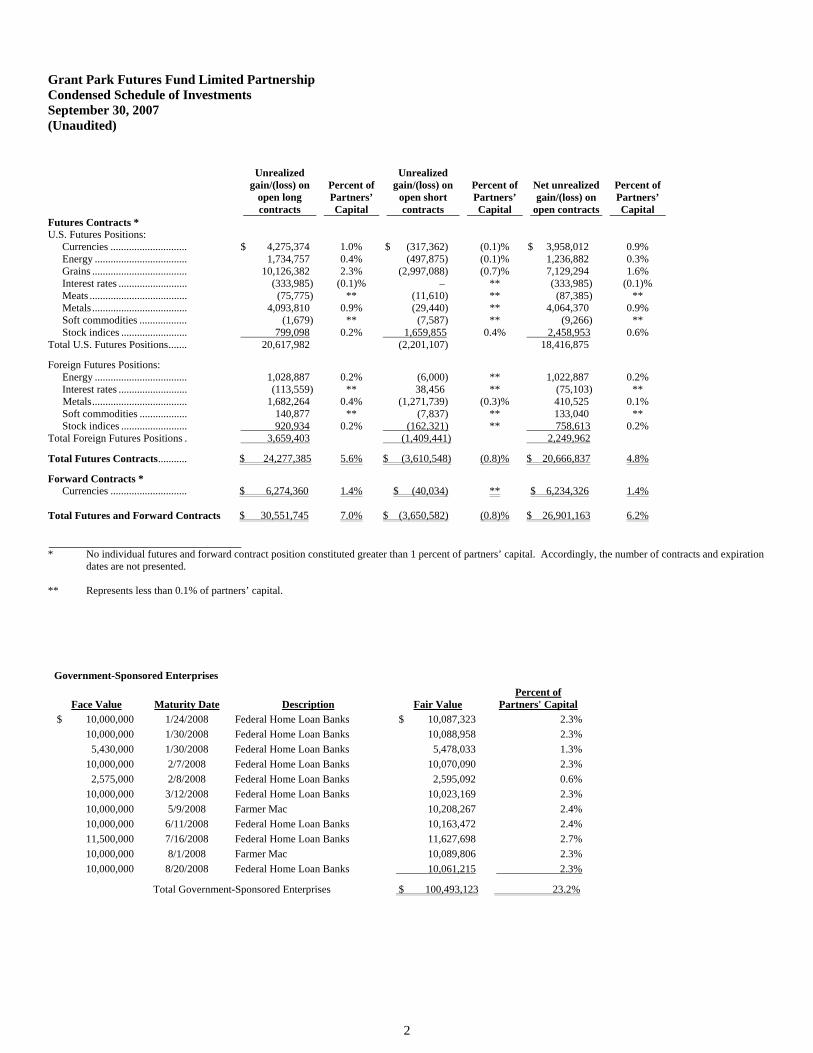
Grant Park Futures Fund Limited Partnership Condensed Schedule of Investments September 30, 2007 (Unaudited)
Unrealized gain/(loss) on
open long contracts
Percent of Partners’ Capital
Unrealized gain/(loss) on
open short contracts
Percent of Partners’ Capital
Net unrealized gain/(loss) on
open contracts
Percent of Partners’ Capital
Futures Contracts * U.S. Futures Positions:
Currencies ............................. $ 4,275,374 1.0% $ (317,362) (0.1)% $ 3,958,012 0.9% Energy ................................... 1,734,757 0.4% (497,875) (0.1)% 1,236,882 0.3% Grains .................................... 10,126,382 2.3% (2,997,088) (0.7)% 7,129,294 1.6% Interest rates .......................... (333,985) (0.1)% – ** (333,985) (0.1)% Meats ..................................... (75,775) ** (11,610) ** (87,385) ** Metals .................................... 4,093,810 0.9% (29,440) ** 4,064,370 0.9% Soft commodities .................. (1,679) ** (7,587) ** (9,266) ** Stock indices ......................... 799,098 0.2% 1,659,855 0.4% 2,458,953 0.6%
Total U.S. Futures Positions....... 20,617,982 (2,201,107) 18,416,875
Foreign Futures Positions: Energy ................................... 1,028,887 0.2% (6,000) ** 1,022,887 0.2% Interest rates .......................... (113,559) ** 38,456 ** (75,103) ** Metals.................................... 1,682,264 0.4% (1,271,739) (0.3)% 410,525 0.1% Soft commodities .................. 140,877 ** (7,837) ** 133,040 ** Stock indices ......................... 920,934 0.2% (162,321) ** 758,613 0.2%
Total Foreign Futures Positions . 3,659,403 (1,409,441) 2,249,962
Total Futures Contracts........... $ 24,277,385 5.6% $ (3,610,548) (0.8)% $ 20,666,837 4.8%
Forward Contracts * Currencies ............................. $ 6,274,360 1.4% $ (40,034) ** $ 6,234,326 1.4%
Total Futures and Forward Contracts $ 30,551,745 7.0% $ (3,650,582) (0.8)% $ 26,901,163 6.2%
* No individual futures and forward contract position constituted greater than 1 percent of partners’ capital. Accordingly, the number of contracts and expiration
dates are not presented.
** Represents less than 0.1% of partners’ capital.
Government-Sponsored Enterprises
Face Value Maturity Date Description Fair Value Percent of
Partners' Capital $ 10,000,000 1/24/2008 Federal Home Loan Banks $ 10,087,323 2.3% 10,000,000 1/30/2008 Federal Home Loan Banks 10,088,958 2.3% 5,430,000 1/30/2008 Federal Home Loan Banks 5,478,033 1.3% 10,000,000 2/7/2008 Federal Home Loan Banks 10,070,090 2.3% 2,575,000 2/8/2008 Federal Home Loan Banks 2,595,092 0.6% 10,000,000 3/12/2008 Federal Home Loan Banks 10,023,169 2.3% 10,000,000 5/9/2008 Farmer Mac 10,208,267 2.4% 10,000,000 6/11/2008 Federal Home Loan Banks 10,163,472 2.4% 11,500,000 7/16/2008 Federal Home Loan Banks 11,627,698 2.7% 10,000,000 8/1/2008 Farmer Mac 10,089,806 2.3% 10,000,000 8/20/2008 Federal Home Loan Banks 10,061,215 2.3%
Total Government-Sponsored Enterprises $ 100,493,123 23.2%
3
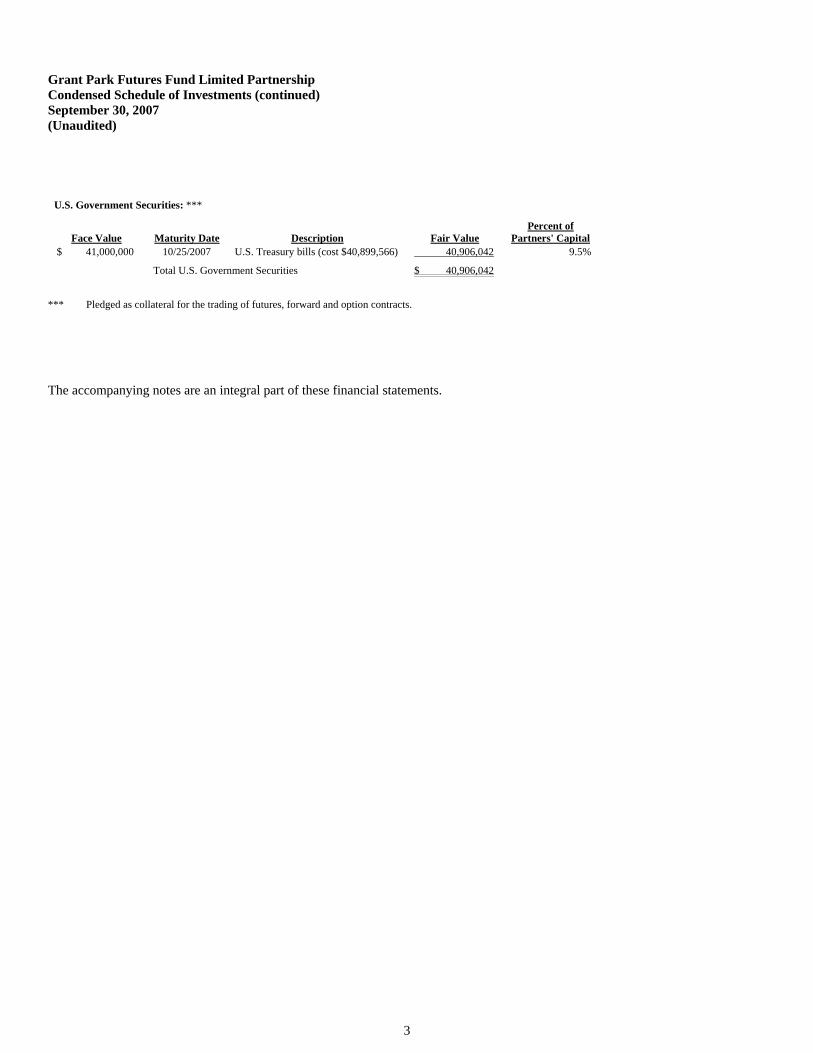
Grant Park Futures Fund Limited Partnership Condensed Schedule of Investments (continued) September 30, 2007 (Unaudited)
U.S. Government Securities: ***
Face Value Maturity Date Description Fair Value Percent of
Partners' Capital $ 41,000,000 10/25/2007 U.S. Treasury bills (cost $40,899,566) 40,906,042 9.5%
Total U.S. Government Securities $ 40,906,042
*** Pledged as collateral for the trading of futures, forward and option contracts.
The accompanying notes are an integral part of these financial statements.
4
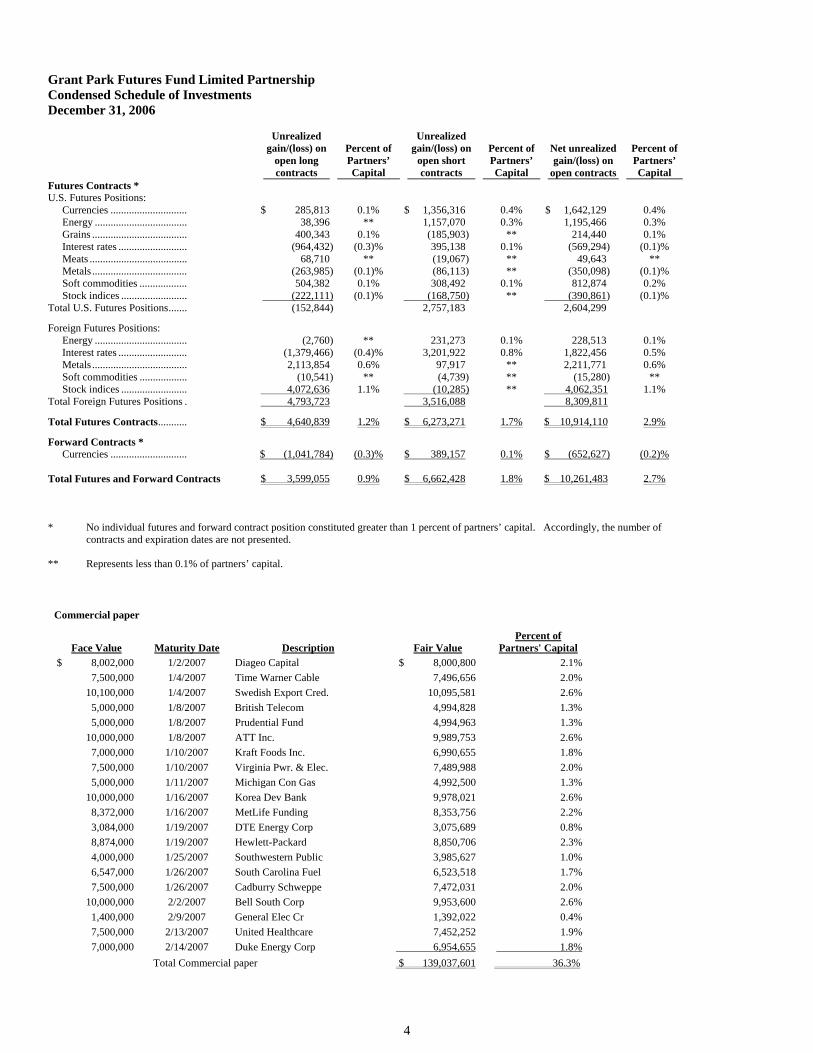
Grant Park Futures Fund Limited Partnership Condensed Schedule of Investments December 31, 2006
Unrealized gain/(loss) on
open long contracts
Percent of Partners’ Capital
Unrealized gain/(loss) on
open short contracts
Percent of Partners’ Capital
Net unrealized gain/(loss) on
open contracts
Percent of Partners’ Capital
Futures Contracts * U.S. Futures Positions:
Currencies ............................. $ 285,813 0.1% $ 1,356,316 0.4% $ 1,642,129 0.4% Energy ................................... 38,396 ** 1,157,070 0.3% 1,195,466 0.3% Grains .................................... 400,343 0.1% (185,903) ** 214,440 0.1% Interest rates .......................... (964,432) (0.3)% 395,138 0.1% (569,294) (0.1)% Meats ..................................... 68,710 ** (19,067) ** 49,643 ** Metals .................................... (263,985) (0.1)% (86,113) ** (350,098) (0.1)% Soft commodities .................. 504,382 0.1% 308,492 0.1% 812,874 0.2% Stock indices ......................... (222,111) (0.1)% (168,750) ** (390,861) (0.1)%
Total U.S. Futures Positions....... (152,844) 2,757,183
2,604,299
Foreign Futures Positions: Energy ................................... (2,760) ** 231,273 0.1% 228,513 0.1% Interest rates .......................... (1,379,466) (0.4)% 3,201,922 0.8% 1,822,456 0.5% Metals .................................... 2,113,854 0.6% 97,917 ** 2,211,771 0.6% Soft commodities .................. (10,541) ** (4,739) ** (15,280) ** Stock indices ......................... 4,072,636 1.1% (10,285) ** 4,062,351 1.1%
Total Foreign Futures Positions . 4,793,723 3,516,088 8,309,811
Total Futures Contracts........... $ 4,640,839 1.2% $ 6,273,271 1.7% $ 10,914,110 2.9%
Forward Contracts * Currencies ............................. $ (1,041,784) (0.3)% $ 389,157 0.1% $ (652,627) (0.2)%
Total Futures and Forward Contracts $ 3,599,055 0.9% $ 6,662,428 1.8% $ 10,261,483 2.7%
* No individual futures and forward contract position constituted greater than 1 percent of partners’ capital. Accordingly, the number of contracts and expiration dates are not presented.
** Represents less than 0.1% of partners’ capital.
Commercial paper
Face Value Maturity Date Description Fair Value Percent of
Partners' Capital $ 8,002,000 1/2/2007 Diageo Capital $ 8,000,800 2.1% 7,500,000 1/4/2007 Time Warner Cable 7,496,656 2.0% 10,100,000 1/4/2007 Swedish Export Cred. 10,095,581 2.6% 5,000,000 1/8/2007 British Telecom 4,994,828 1.3% 5,000,000 1/8/2007 Prudential Fund 4,994,963 1.3% 10,000,000 1/8/2007 ATT Inc. 9,989,753 2.6% 7,000,000 1/10/2007 Kraft Foods Inc. 6,990,655 1.8% 7,500,000 1/10/2007 Virginia Pwr. & Elec. 7,489,988 2.0% 5,000,000 1/11/2007 Michigan Con Gas 4,992,500 1.3% 10,000,000 1/16/2007 Korea Dev Bank 9,978,021 2.6% 8,372,000 1/16/2007 MetLife Funding 8,353,756 2.2% 3,084,000 1/19/2007 DTE Energy Corp 3,075,689 0.8% 8,874,000 1/19/2007 Hewlett-Packard 8,850,706 2.3% 4,000,000 1/25/2007 Southwestern Public 3,985,627 1.0% 6,547,000 1/26/2007 South Carolina Fuel 6,523,518 1.7% 7,500,000 1/26/2007 Cadburry Schweppe 7,472,031 2.0% 10,000,000 2/2/2007 Bell South Corp 9,953,600 2.6% 1,400,000 2/9/2007 General Elec Cr 1,392,022 0.4% 7,500,000 2/13/2007 United Healthcare 7,452,252 1.9% 7,000,000 2/14/2007 Duke Energy Corp 6,954,655 1.8% Total Commercial paper $ 139,037,601 36.3%
5
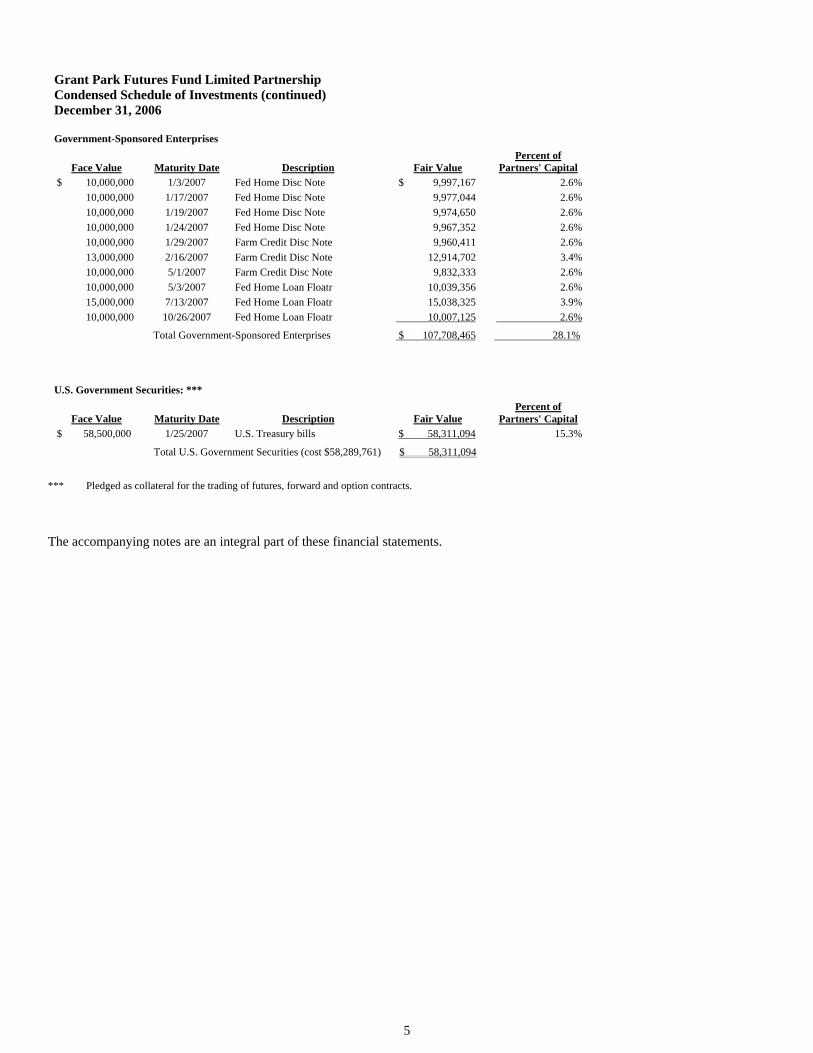
Grant Park Futures Fund Limited Partnership Condensed Schedule of Investments (continued) December 31, 2006 Government-Sponsored Enterprises
Face Value Maturity Date Description Fair Value Percent of
Partners' Capital $ 10,000,000 1/3/2007 Fed Home Disc Note $ 9,997,167 2.6% 10,000,000 1/17/2007 Fed Home Disc Note 9,977,044 2.6% 10,000,000 1/19/2007 Fed Home Disc Note 9,974,650 2.6% 10,000,000 1/24/2007 Fed Home Disc Note 9,967,352 2.6% 10,000,000 1/29/2007 Farm Credit Disc Note 9,960,411 2.6% 13,000,000 2/16/2007 Farm Credit Disc Note 12,914,702 3.4% 10,000,000 5/1/2007 Farm Credit Disc Note 9,832,333 2.6% 10,000,000 5/3/2007 Fed Home Loan Floatr 10,039,356 2.6% 15,000,000 7/13/2007 Fed Home Loan Floatr 15,038,325 3.9% 10,000,000 10/26/2007 Fed Home Loan Floatr 10,007,125 2.6%
Total Government-Sponsored Enterprises $ 107,708,465 28.1%
U.S. Government Securities: ***
Face Value Maturity Date Description Fair Value Percent of
Partners' Capital $ 58,500,000 1/25/2007 U.S. Treasury bills $ 58,311,094 15.3% Total U.S. Government Securities (cost $58,289,761) $ 58,311,094
*** Pledged as collateral for the trading of futures, forward and option contracts.
The accompanying notes are an integral part of these financial statements.
6
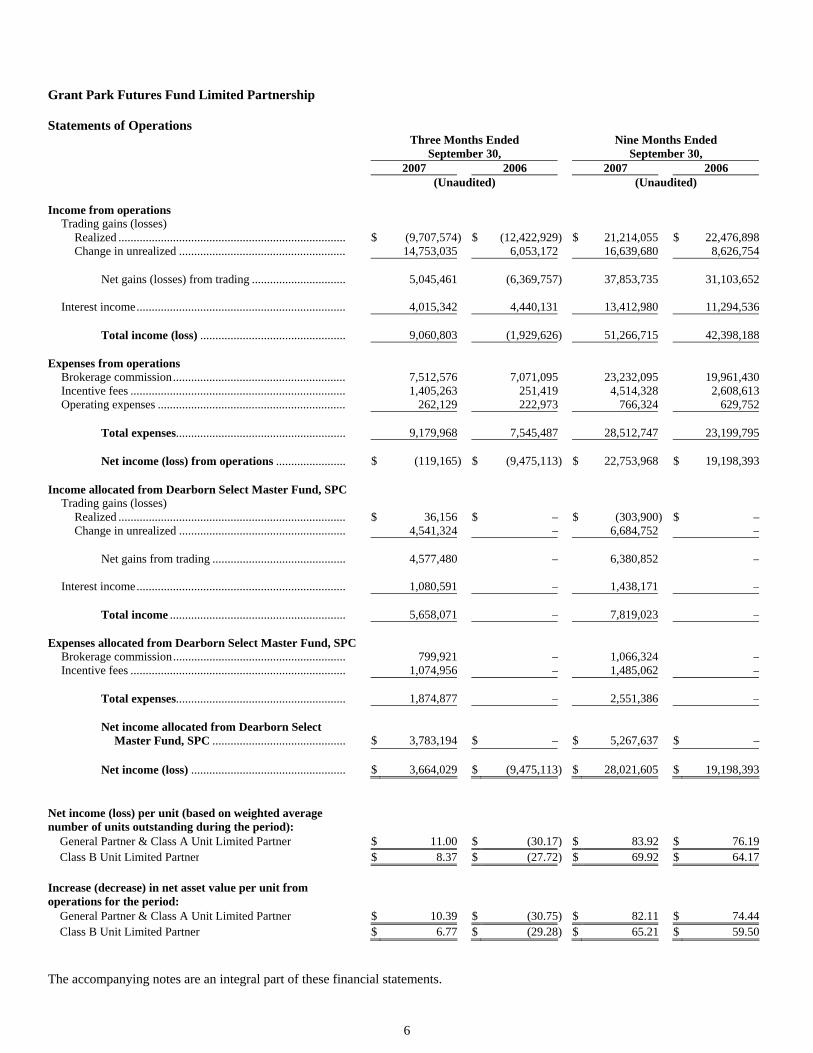
Grant Park Futures Fund Limited Partnership Statements of Operations
Three Months Ended
September 30, Nine Months Ended
September 30, 2007 2006 2007 2006 (Unaudited) (Unaudited) Income from operations
Trading gains (losses) Realized ........................................................................... $ (9,707,574) $ (12,422,929) $ 21,214,055 $ 22,476,898 Change in unrealized ....................................................... 14,753,035 6,053,172 16,639,680 8,626,754
Net gains (losses) from trading ............................... 5,045,461 (6,369,757) 37,853,735 31,103,652
Interest income..................................................................... 4,015,342 4,440,131 13,412,980 11,294,536
Total income (loss) ................................................ 9,060,803 (1,929,626) 51,266,715 42,398,188
Expenses from operations
Brokerage commission......................................................... 7,512,576 7,071,095 23,232,095 19,961,430 Incentive fees ....................................................................... 1,405,263 251,419 4,514,328 2,608,613 Operating expenses .............................................................. 262,129 222,973 766,324 629,752
Total expenses........................................................ 9,179,968 7,545,487 28,512,747 23,199,795 Net income (loss) from operations ....................... $ (119,165) $ (9,475,113) $ 22,753,968 $ 19,198,393
Income allocated from Dearborn Select Master Fund, SPC
Trading gains (losses) Realized ........................................................................... $ 36,156 $ – $ (303,900) $ – Change in unrealized ....................................................... 4,541,324 – 6,684,752 –
Net gains from trading ............................................ 4,577,480 – 6,380,852 –
Interest income..................................................................... 1,080,591 – 1,438,171 –
Total income .......................................................... 5,658,071 – 7,819,023 –
Expenses allocated from Dearborn Select Master Fund, SPC
Brokerage commission......................................................... 799,921 – 1,066,324 – Incentive fees ....................................................................... 1,074,956 – 1,485,062 –
Total expenses........................................................ 1,874,877 – 2,551,386 – Net income allocated from Dearborn Select
Master Fund, SPC ............................................ $ 3,783,194 $ – $ 5,267,637 $ – Net income (loss) ................................................... $ 3,664,029 $ (9,475,113) $ 28,021,605 $ 19,198,393
Net income (loss) per unit (based on weighted average number of units outstanding during the period):
General Partner & Class A Unit Limited Partner $ 11.00 $ (30.17) $ 83.92 $ 76.19Class B Unit Limited Partner $ 8.37 $ (27.72) $ 69.92 $ 64.17
Increase (decrease) in net asset value per unit from operations for the period:
General Partner & Class A Unit Limited Partner $ 10.39 $ (30.75) $ 82.11 $ 74.44Class B Unit Limited Partner $ 6.77 $ (29.28) $ 65.21 $ 59.50
The accompanying notes are an integral part of these financial statements.
7
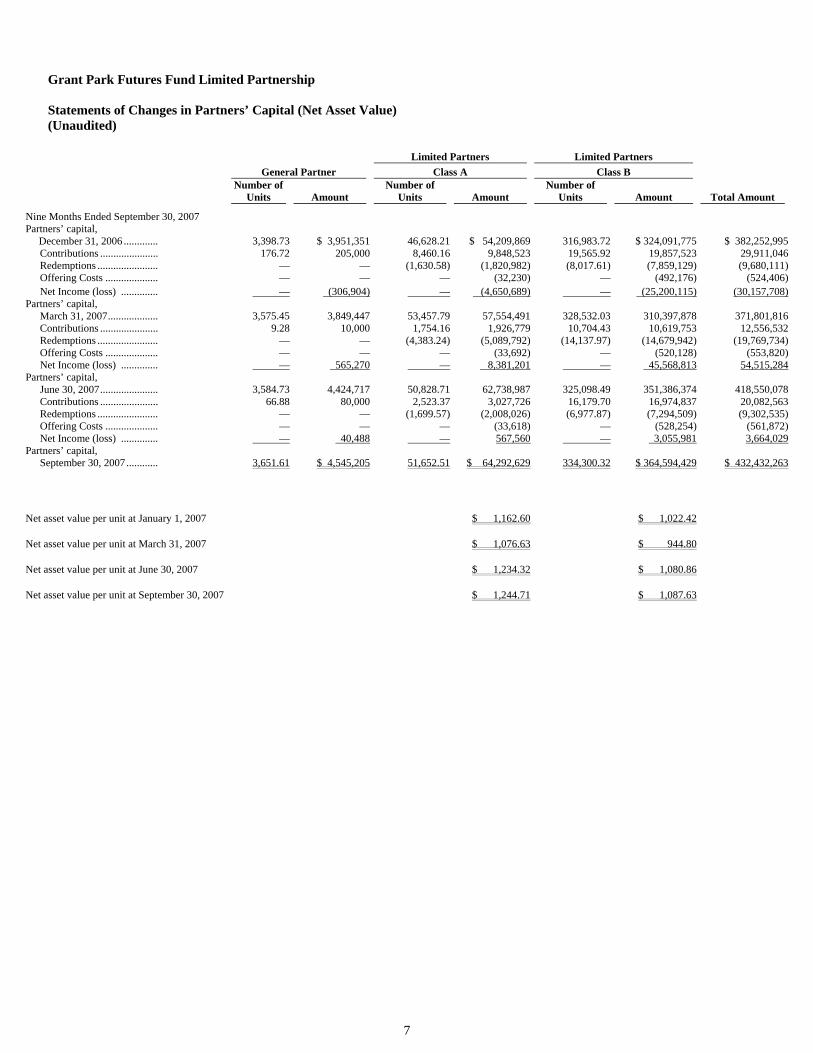
Grant Park Futures Fund Limited Partnership Statements of Changes in Partners’ Capital (Net Asset Value) (Unaudited)
Limited Partners Limited Partners General Partner Class A Class B
Number of
Units Amount Number of
Units Amount Number of
Units Amount Total Amount
Nine Months Ended September 30, 2007 Partners’ capital, December 31, 2006 ............. 3,398.73 $ 3,951,351 46,628.21 $ 54,209,869 316,983.72 $ 324,091,775 $ 382,252,995
Contributions ...................... 176.72 205,000 8,460.16 9,848,523 19,565.92 19,857,523 29,911,046Redemptions ....................... — — (1,630.58) (1,820,982) (8,017.61) (7,859,129) (9,680,111)Offering Costs .................... — — — (32,230) — (492,176) (524,406)Net Income (loss) .............. — (306,904) — (4,650,689) — (25,200,115) (30,157,708)
Partners’ capital, March 31, 2007................... 3,575.45 3,849,447 53,457.79 57,554,491 328,532.03 310,397,878 371,801,816Contributions ...................... 9.28 10,000 1,754.16 1,926,779 10,704.43 10,619,753 12,556,532Redemptions ....................... — — (4,383.24) (5,089,792) (14,137.97) (14,679,942) (19,769,734)Offering Costs .................... — — — (33,692) — (520,128) (553,820)Net Income (loss) .............. — 565,270 — 8,381,201 — 45,568,813 54,515,284
Partners’ capital, June 30, 2007...................... 3,584.73 4,424,717 50,828.71 62,738,987 325,098.49 351,386,374 418,550,078Contributions ...................... 66.88 80,000 2,523.37 3,027,726 16,179.70 16,974,837 20,082,563Redemptions ....................... — — (1,699.57) (2,008,026) (6,977.87) (7,294,509) (9,302,535)Offering Costs .................... — — — (33,618) — (528,254) (561,872)Net Income (loss) .............. — 40,488 — 567,560 — 3,055,981 3,664,029
Partners’ capital, September 30, 2007............ 3,651.61 $ 4,545,205 51,652.51 $ 64,292,629 334,300.32 $ 364,594,429 $ 432,432,263
Net asset value per unit at January 1, 2007 $ 1,162.60 $ 1,022.42
Net asset value per unit at March 31, 2007 $ 1,076.63 $ 944.80
Net asset value per unit at June 30, 2007 $ 1,234.32 $ 1,080.86
Net asset value per unit at September 30, 2007 $ 1,244.71 $ 1,087.63
8
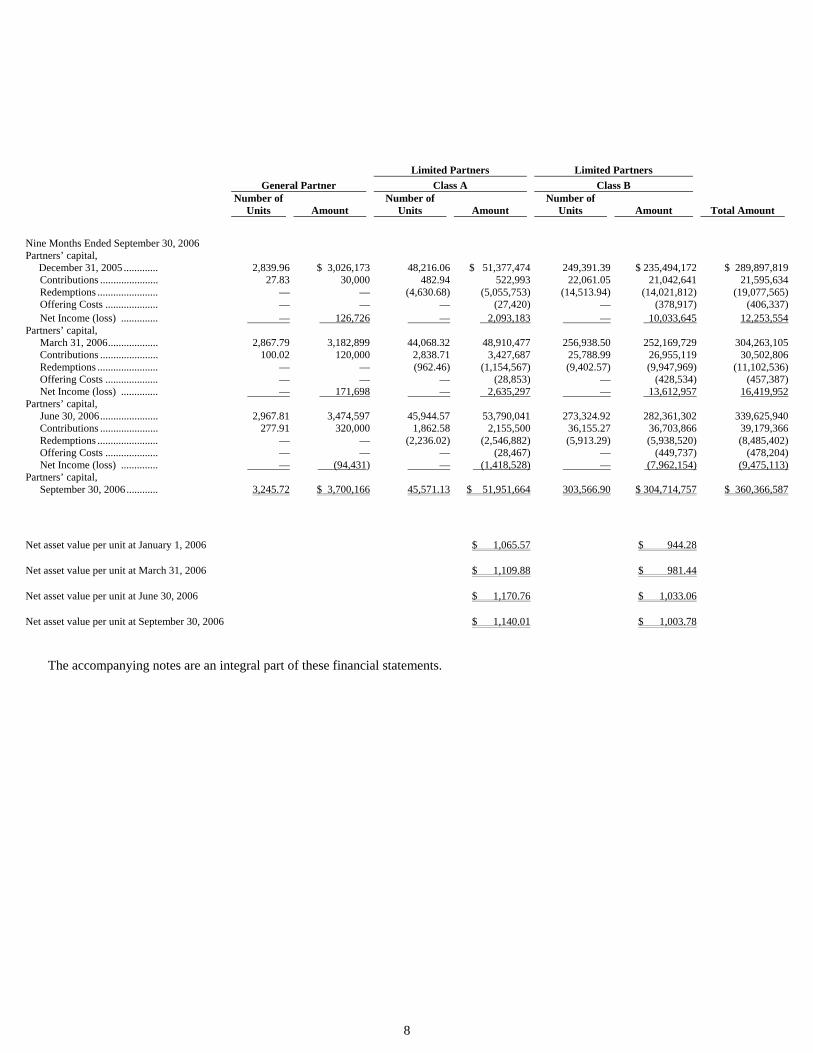
Limited Partners Limited Partners General Partner Class A Class B
Number of
Units Amount Number of
Units Amount Number of
Units Amount Total Amount
Nine Months Ended September 30, 2006
Partners’ capital, December 31, 2005 ............. 2,839.96 $ 3,026,173 48,216.06 $ 51,377,474 249,391.39 $ 235,494,172 $ 289,897,819
Contributions ...................... 27.83 30,000 482.94 522,993 22,061.05 21,042,641 21,595,634Redemptions ....................... — — (4,630.68) (5,055,753) (14,513.94) (14,021,812) (19,077,565)Offering Costs .................... — — — (27,420) — (378,917) (406,337)Net Income (loss) .............. — 126,726 — 2,093,183 — 10,033,645 12,253,554
Partners’ capital, March 31, 2006................... 2,867.79 3,182,899 44,068.32 48,910,477 256,938.50 252,169,729 304,263,105Contributions ...................... 100.02 120,000 2,838.71 3,427,687 25,788.99 26,955,119 30,502,806Redemptions ....................... — — (962.46) (1,154,567) (9,402.57) (9,947,969) (11,102,536)Offering Costs .................... — — — (28,853) — (428,534) (457,387)Net Income (loss) .............. — 171,698 — 2,635,297 — 13,612,957 16,419,952
Partners’ capital, June 30, 2006...................... 2,967.81 3,474,597 45,944.57 53,790,041 273,324.92 282,361,302 339,625,940Contributions ...................... 277.91 320,000 1,862.58 2,155,500 36,155.27 36,703,866 39,179,366Redemptions ....................... — — (2,236.02) (2,546,882) (5,913.29) (5,938,520) (8,485,402)Offering Costs .................... — — — (28,467) — (449,737) (478,204)Net Income (loss) .............. — (94,431) — (1,418,528) — (7,962,154) (9,475,113)
Partners’ capital, September 30, 2006 ............ 3,245.72 $ 3,700,166 45,571.13 $ 51,951,664 303,566.90 $ 304,714,757 $ 360,366,587
Net asset value per unit at January 1, 2006 $ 1,065.57 $ 944.28
Net asset value per unit at March 31, 2006 $ 1,109.88 $ 981.44
Net asset value per unit at June 30, 2006 $ 1,170.76 $ 1,033.06
Net asset value per unit at September 30, 2006 $ 1,140.01 $ 1,003.78
The accompanying notes are an integral part of these financial statements.
9
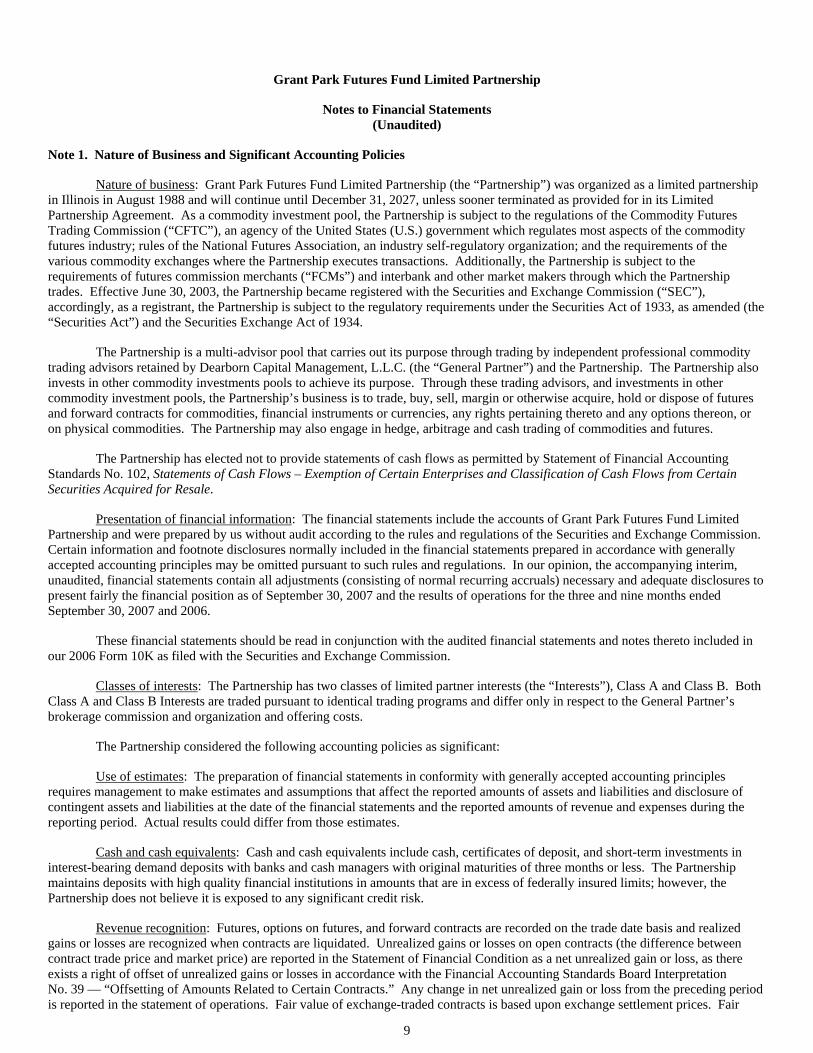
Grant Park Futures Fund Limited Partnership
Notes to Financial Statements (Unaudited)
Note 1. Nature of Business and Significant Accounting Policies
Nature of business: Grant Park Futures Fund Limited Partnership (the “Partnership”) was organized as a limited partnership in Illinois in August 1988 and will continue until December 31, 2027, unless sooner terminated as provided for in its Limited Partnership Agreement. As a commodity investment pool, the Partnership is subject to the regulations of the Commodity Futures Trading Commission (“CFTC”), an agency of the United States (U.S.) government which regulates most aspects of the commodity futures industry; rules of the National Futures Association, an industry self-regulatory organization; and the requirements of the various commodity exchanges where the Partnership executes transactions. Additionally, the Partnership is subject to the requirements of futures commission merchants (“FCMs”) and interbank and other market makers through which the Partnership trades. Effective June 30, 2003, the Partnership became registered with the Securities and Exchange Commission (“SEC”), accordingly, as a registrant, the Partnership is subject to the regulatory requirements under the Securities Act of 1933, as amended (the “Securities Act”) and the Securities Exchange Act of 1934.
The Partnership is a multi-advisor pool that carries out its purpose through trading by independent professional commodity trading advisors retained by Dearborn Capital Management, L.L.C. (the “General Partner”) and the Partnership. The Partnership also invests in other commodity investments pools to achieve its purpose. Through these trading advisors, and investments in other commodity investment pools, the Partnership’s business is to trade, buy, sell, margin or otherwise acquire, hold or dispose of futures and forward contracts for commodities, financial instruments or currencies, any rights pertaining thereto and any options thereon, or on physical commodities. The Partnership may also engage in hedge, arbitrage and cash trading of commodities and futures.
The Partnership has elected not to provide statements of cash flows as permitted by Statement of Financial Accounting Standards No. 102, Statements of Cash Flows – Exemption of Certain Enterprises and Classification of Cash Flows from Certain Securities Acquired for Resale.
Presentation of financial information: The financial statements include the accounts of Grant Park Futures Fund Limited Partnership and were prepared by us without audit according to the rules and regulations of the Securities and Exchange Commission. Certain information and footnote disclosures normally included in the financial statements prepared in accordance with generally accepted accounting principles may be omitted pursuant to such rules and regulations. In our opinion, the accompanying interim, unaudited, financial statements contain all adjustments (consisting of normal recurring accruals) necessary and adequate disclosures to present fairly the financial position as of September 30, 2007 and the results of operations for the three and nine months ended September 30, 2007 and 2006.
These financial statements should be read in conjunction with the audited financial statements and notes thereto included in our 2006 Form 10K as filed with the Securities and Exchange Commission.
Classes of interests: The Partnership has two classes of limited partner interests (the “Interests”), Class A and Class B. Both Class A and Class B Interests are traded pursuant to identical trading programs and differ only in respect to the General Partner’s brokerage commission and organization and offering costs.
The Partnership considered the following accounting policies as significant:
Use of estimates: The preparation of financial statements in conformity with generally accepted accounting principles requires management to make estimates and assumptions that affect the reported amounts of assets and liabilities and disclosure of contingent assets and liabilities at the date of the financial statements and the reported amounts of revenue and expenses during the reporting period. Actual results could differ from those estimates.
Cash and cash equivalents: Cash and cash equivalents include cash, certificates of deposit, and short-term investments in interest-bearing demand deposits with banks and cash managers with original maturities of three months or less. The Partnership maintains deposits with high quality financial institutions in amounts that are in excess of federally insured limits; however, the Partnership does not believe it is exposed to any significant credit risk.
Revenue recognition: Futures, options on futures, and forward contracts are recorded on the trade date basis and realized gains or losses are recognized when contracts are liquidated. Unrealized gains or losses on open contracts (the difference between contract trade price and market price) are reported in the Statement of Financial Condition as a net unrealized gain or loss, as there exists a right of offset of unrealized gains or losses in accordance with the Financial Accounting Standards Board Interpretation No. 39 — “Offsetting of Amounts Related to Certain Contracts.” Any change in net unrealized gain or loss from the preceding period is reported in the statement of operations. Fair value of exchange-traded contracts is based upon exchange settlement prices. Fair
10
value of non-exchange-traded contracts is based on third party quoted dealer values on the Interbank market. Government-sponsored enterprises and commercial paper are stated at cost plus accrued interest, which approximates fair value.
The Partnership’s investment in the Dearborn Select Master Fund, SPC – Winton Segregated Portfolio – Class GP (the “GP
Class”) is reported in the statement of financial condition at fair value. Fair value ordinarily is the value determined by the management of the GP Class in accordance with the valuation policies of the GP Class and as reported at the time of the Partnership’s valuation. Generally, the fair value of the Partnership’s investment in the GP Class represents the amount that the Partnership could reasonably expect to receive from the GP Class if the Partnership’s investment was redeemed at the time of valuation, based on information reasonably available at the time the valuation is made and that the Partnership believes to be reliable.
Redemptions payable: Pursuant to the provisions of Statement of Financial Accounting Standards No. 150, Accounting for Certain Financial Instruments with Characteristics of both Liabilities and Equity (“SFAS 150”), redemptions approved by the General Partner prior to month end with a fixed effective date and fixed amount are recorded as redemptions payable as of month end.
Income taxes: No provision for income taxes has been made in these financial statements as each partner is individually responsible for reporting income or loss based on its respective share of the Partnership’s income and expenses as reported for income tax purposes.
Organization and offering costs: All expenses incurred in connection with the organization and the initial and ongoing public offering of partnership interests are paid by the “General Partner” and are reimbursed to the General Partner by the Partnership. This reimbursement is made monthly. Class A units bear organization and offering expenses at an annual rate of 20 basis points (0.20 percent) of the adjusted net assets of the Class A units, calculated and payable monthly on the basis of month-end adjusted net assets. Class B units incur these expenses at an annual rate of 60 basis points (0.60 percent) of the adjusted net assets of the Class B units, calculated and payable monthly on the basis of month-end adjusted assets. “Adjusted net assets” is defined as the month-end net assets of the particular class before accruals for fees and expenses and redemptions. In its discretion, the General Partner may require the Partnership to reimburse the General Partner in any subsequent calendar year for amounts that exceed these limits in any calendar year, provided that the maximum amount reimbursed by the Partnership will not exceed the overall limit. Amounts reimbursed by the Partnership with respect to the initial and ongoing public offering expenses are charged against partners’ capital at the time of reimbursement or accrual. Any amounts reimbursed by the Partnership with respect to organization expenses are expensed at the time the reimbursement is incurred or accrued. If the Partnership terminates prior to completion of payment of the calculated amounts to the General Partner, the General Partner will not be entitled to any additional payments, and the Partnership will have no further obligation to the General Partner. At September 30, 2007, all organization and offering costs incurred by the General Partner have been reimbursed.
Foreign currency transactions: The Partnership’s functional currency is the U.S. dollar, however, it transacts business in currencies other than the U.S. dollar. Assets and liabilities denominated in currencies other than the U.S. dollar are translated into U.S. dollars at the rates in effect at the date of the statement of financial condition. Income and expense items denominated in currencies other than the U.S. dollar are translated into U.S. dollars at the rates in effect during the period. Gains and losses resulting from the translation to U.S. dollars are reported in income currently.
Recently adopted accounting pronouncements: On July 13, 2006, the FASB released FASB Interpretation No. 48 Accounting for Uncertainty in Income Taxes (“FIN 48”). FIN 48 provides guidance for how uncertain tax positions should be recognized, measured, presented and disclosed in the financial statements. FIN 48 requires the evaluation of tax positions taken or expected to be taken in the course of preparing the Partnership’s tax returns to determine whether the tax positions are “more-likely-than-not” of being sustained by the applicable tax authority. Tax positions not deemed to meet the more-likely-than-not threshold would be recorded as a tax benefit or expense in the current year. The adoption of FIN 48 was effective for the Partnership on January 1, 2007, and did not impact our financial position or results of operations.
Recent accounting pronouncements: In September 2006, the FASB issued SFAS No. 157, Fair Value Measurements (“SFAS
157”). SFAS 157, among other things, defines fair value, establishes a framework for measuring fair value and enhances disclosures about fair value measurements required under other accounting pronouncements, but does not change existing guidance as to whether or not an instrument is carried at fair value. SFAS 157 is effective for the Partnership on January 1, 2008. Management is currently evaluating the provisions of SFAS 157 and its potential effect on its financial statements.
In February 2007, the FASB issued SFAS No. 159, The Fair Value Option for Financial Assets and Financial Liabilities
(“SFAS 159”), which permits entities to choose to measure many financial instruments and certain other items at fair value that are not currently required to be measured at fair value. SFAS 159 is effective for the Partnership on January 1, 2008. Management is currently evaluating the provisions of SFAS 159 and its potential effects on its financial statements.
11
Note 2. Investments
Effective June 1, 2007, the General Partner reallocated the portion of the Partnership’s net assets allocated to Winton Capital Management Limited (“Winton”) to the GP Class of Dearborn Select Master Fund, SPC (“Dearborn Select”). Dearborn Select was incorporated under the laws of the Cayman Islands on April 7, 2006 and is a private investment fund organized as a segregated portfolio company with limited liability. The GP Class allocates the assets invested by the Partnership to Winton through one or more managed accounts, to be traded pursuant to Winton’s Diversified Program, the same trading program Winton previously traded for the Partnership. The GP Class entered into an advisory agreement with Winton with respect to the managed account which is substantially similar to the Partnership’s previous trading advisory agreement with Winton. The Partnership owns all of the outstanding Class GP units of the GP Class. There have been no changes to the existing clearing broker arrangements/brokerage charge and no material changes to the other fees and expenses allocated to the Partnership as a result of this reallocation. The General Partner of the Partnership is also the Investment Manager of Dearborn Select.
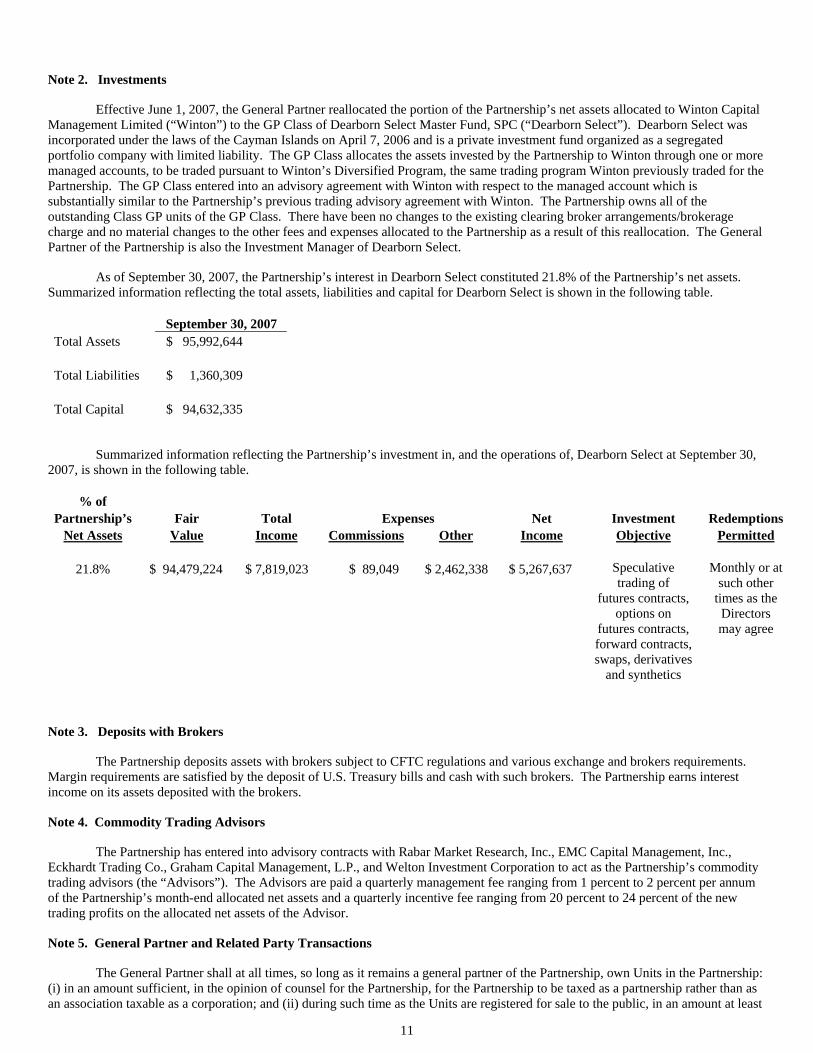
As of September 30, 2007, the Partnership’s interest in Dearborn Select constituted 21.8% of the Partnership’s net assets. Summarized information reflecting the total assets, liabilities and capital for Dearborn Select is shown in the following table.
September 30, 2007 Total Assets $ 95,992,644 Total Liabilities $ 1,360,309 Total Capital $ 94,632,335
Summarized information reflecting the Partnership’s investment in, and the operations of, Dearborn Select at September 30, 2007, is shown in the following table.
% of Partnership’s Fair Total Expenses Net Investment Redemptions
Net Assets Value Income Commissions Other Income Objective Permitted
21.8% $ 94,479,224 $ 7,819,023 $ 89,049 $ 2,462,338 $ 5,267,637
Speculative trading of
futures contracts, options on
futures contracts, forward contracts, swaps, derivatives
and synthetics
Monthly or at such other
times as the Directors may agree
Note 3. Deposits with Brokers
The Partnership deposits assets with brokers subject to CFTC regulations and various exchange and brokers requirements. Margin requirements are satisfied by the deposit of U.S. Treasury bills and cash with such brokers. The Partnership earns interest income on its assets deposited with the brokers.
Note 4. Commodity Trading Advisors
The Partnership has entered into advisory contracts with Rabar Market Research, Inc., EMC Capital Management, Inc., Eckhardt Trading Co., Graham Capital Management, L.P., and Welton Investment Corporation to act as the Partnership’s commodity trading advisors (the “Advisors”). The Advisors are paid a quarterly management fee ranging from 1 percent to 2 percent per annum of the Partnership’s month-end allocated net assets and a quarterly incentive fee ranging from 20 percent to 24 percent of the new trading profits on the allocated net assets of the Advisor.
Note 5. General Partner and Related Party Transactions
The General Partner shall at all times, so long as it remains a general partner of the Partnership, own Units in the Partnership: (i) in an amount sufficient, in the opinion of counsel for the Partnership, for the Partnership to be taxed as a partnership rather than as an association taxable as a corporation; and (ii) during such time as the Units are registered for sale to the public, in an amount at least
12
equal to the greater of: (a) 1% of all capital contributions of all Partners to the Partnership; or (b) $25,000; or such other amount satisfying the requirements then imposed by the North American Securities Administrators Association, Inc. (NASAA) Guidelines. Further, during such time as the Units are registered for sale to the public, the General Partner shall, so long as it remains a general partner of the Partnership, maintain a net worth (as such term may be defined in the NASAA Guidelines) at least equal to the greater of: (i) 5 percent of the total capital contributions of all partners and all limited partnerships to which it is a general partner (including the Partnership) plus 5 percent of the Units being offered for sale in the Partnership; or (ii) $50,000; or such other amount satisfying the requirements then imposed by the NASAA Guidelines. In no event, however, shall the General Partner be required to maintain a net worth in excess of $1,000,000 or such other maximum amount satisfying the requirements then imposed by the NASAA Guidelines.
Effective June 1, 2003, 10 percent of the General Partner limited partnership interest in the Grant Park Futures Fund Limited Partnership is characterized as a general partnership interest. Notwithstanding, the general partnership interest will continue to pay all fees associated with a limited partnership interest.
The Partnership pays the General Partner a monthly brokerage commission equal to one twelfth of 7.55 percent (7.55 percent annualized) of month-end net assets for Class A units and one twelfth of 8.00 percent (8.00 percent annualized) of month-end net assets for Class B units. Included in the brokerage commission are amounts paid to the clearing brokers for execution and clearing costs, management fees paid to the Advisors, compensation to the selling agents and an amount to the General Partner for management services rendered.
Note 6. Operating Expenses
Operating expenses of the Partnership are paid for by the General Partner and reimbursed by the Partnership. The operating expenses of the Partnership are limited to 0.25 percent per year of the average month-end net assets of the Partnership. To the extent operating expenses are less than 0.25 percent of the Partnership’s average month-end net assets during the year, the difference may be reimbursed pro rata to record-holders as of December 31 of each year.
Note 7. Redemptions
Limited Partners have the right to redeem units as of any month-end upon ten (10) days’ prior written notice to the Partnership. The General Partner, however, may permit earlier redemptions in its discretion. There are no redemption fees applicable to Class A Limited Partners or to Class B Limited Partners who redeem their units on or after the one-year anniversary of their subscription. Class B Limited Partners who redeem their units prior to the one-year anniversary of their subscriptions for the redeemed units will pay the applicable early redemption fee. Redemptions will be made on the last day of the month for an amount equal to the net asset value per unit, as defined, represented by the units to be redeemed.
In addition, the General Partner may at any time cause the redemption of all or a portion of any Limited Partner’s units upon fifteen (15) days written notice. The General Partner may also immediately redeem any Limited Partner’s units without notice if the General Partner believes that (i) the redemption is necessary to avoid having the assets of the Partnership deemed Plan Assets under the Employee Retirement Income Security Act of 1974, as amended (“ERISA”), (ii) the Limited Partner made a misrepresentation in connection with its subscription for the units, or (iii) the redemption is necessary to avoid a violation of law by the Partnership or any Partner.
Note 8. Financial Highlights
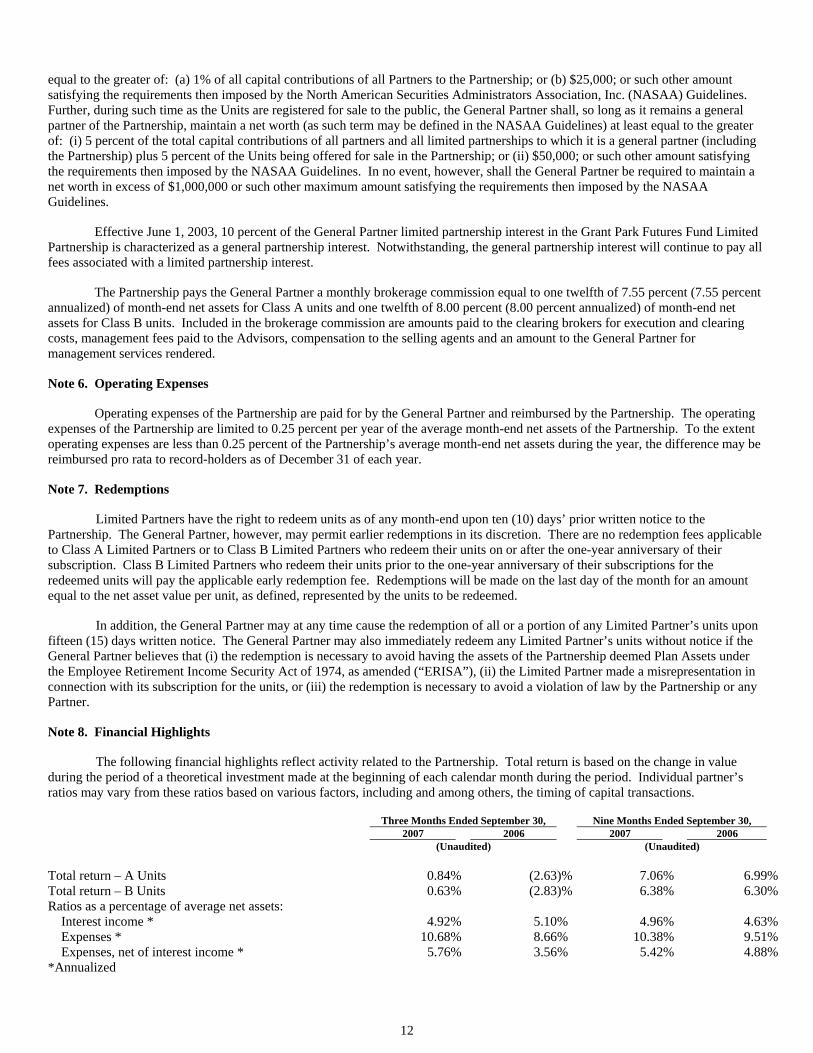
The following financial highlights reflect activity related to the Partnership. Total return is based on the change in value during the period of a theoretical investment made at the beginning of each calendar month during the period. Individual partner’s ratios may vary from these ratios based on various factors, including and among others, the timing of capital transactions.
Three Months Ended September 30, Nine Months Ended September 30, 2007 2006 2007 2006 (Unaudited) (Unaudited) Total return – A Units 0.84% (2.63)% 7.06% 6.99% Total return – B Units 0.63% (2.83)% 6.38% 6.30% Ratios as a percentage of average net assets:
Interest income * 4.92% 5.10% 4.96% 4.63% Expenses * 10.68% 8.66% 10.38% 9.51% Expenses, net of interest income * 5.76% 3.56% 5.42% 4.88%
*Annualized
13
The interest income and expense ratios above which include the investment in the Dearborn Select Master Fund SPC – Winton Segregated Portfolio are computed based upon the weighted average net assets of the Partnership for the three and nine months ended September 30, 2007 and 2006 (annualized).
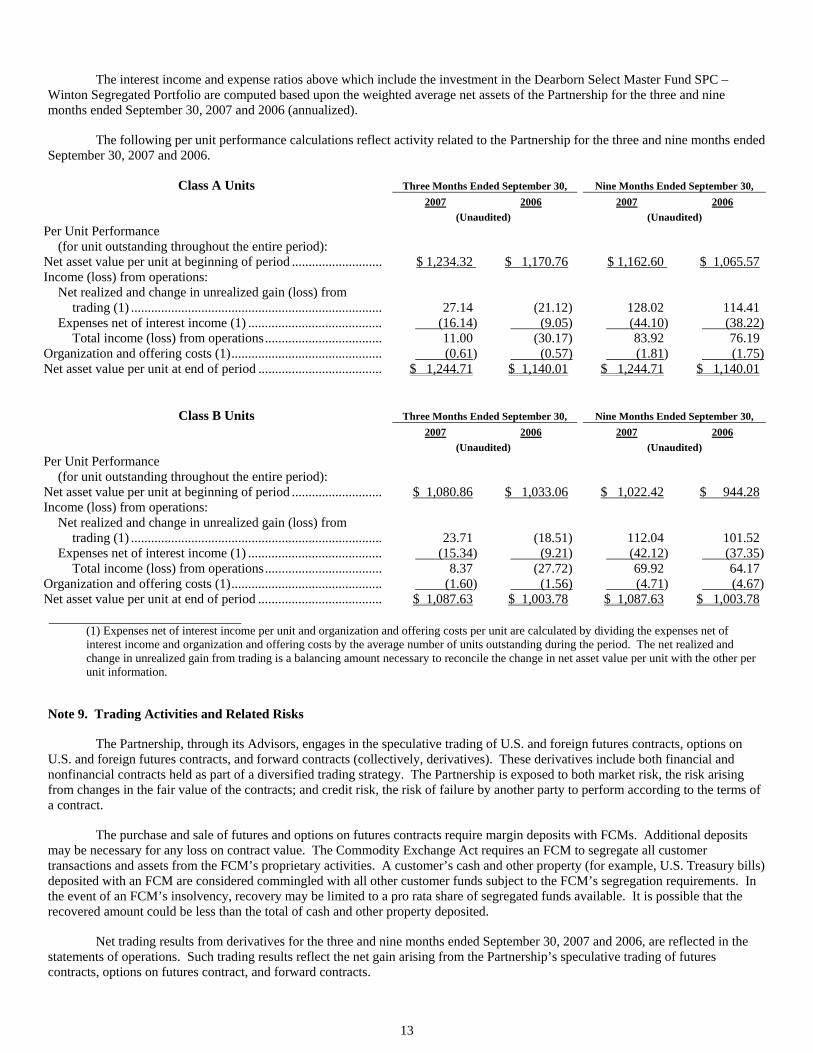
The following per unit performance calculations reflect activity related to the Partnership for the three and nine months ended September 30, 2007 and 2006.
Class A Units Three Months Ended September 30, Nine Months Ended September 30, 2007 2006 2007 2006 (Unaudited) (Unaudited) Per Unit Performance
(for unit outstanding throughout the entire period):
Net asset value per unit at beginning of period ........................... $ 1,234.32 $ 1,170.76 $ 1,162.60 $ 1,065.57 Income (loss) from operations:
Net realized and change in unrealized gain (loss) from trading (1) ........................................................................... 27.14 (21.12) 128.02 114.41
Expenses net of interest income (1) ........................................ (16.14) (9.05) (44.10) (38.22)Total income (loss) from operations................................... 11.00 (30.17) 83.92 76.19
Organization and offering costs (1)............................................. (0.61) (0.57) (1.81) (1.75)Net asset value per unit at end of period ..................................... $ 1,244.71 $ 1,140.01 $ 1,244.71 $ 1,140.01
Class B Units Three Months Ended September 30, Nine Months Ended September 30, 2007 2006 2007 2006 (Unaudited) (Unaudited) Per Unit Performance
(for unit outstanding throughout the entire period):
Net asset value per unit at beginning of period ........................... $ 1,080.86 $ 1,033.06 $ 1,022.42 $ 944.28 Income (loss) from operations:
Net realized and change in unrealized gain (loss) from trading (1) ........................................................................... 23.71 (18.51) 112.04 101.52
Expenses net of interest income (1) ........................................ (15.34) (9.21) (42.12) (37.35)Total income (loss) from operations................................... 8.37 (27.72) 69.92 64.17
Organization and offering costs (1)............................................. (1.60) (1.56) (4.71) (4.67)Net asset value per unit at end of period ..................................... $ 1,087.63 $ 1,003.78 $ 1,087.63 $ 1,003.78
(1) Expenses net of interest income per unit and organization and offering costs per unit are calculated by dividing the expenses net of
interest income and organization and offering costs by the average number of units outstanding during the period. The net realized and change in unrealized gain from trading is a balancing amount necessary to reconcile the change in net asset value per unit with the other per unit information.
Note 9. Trading Activities and Related Risks
The Partnership, through its Advisors, engages in the speculative trading of U.S. and foreign futures contracts, options on U.S. and foreign futures contracts, and forward contracts (collectively, derivatives). These derivatives include both financial and nonfinancial contracts held as part of a diversified trading strategy. The Partnership is exposed to both market risk, the risk arising from changes in the fair value of the contracts; and credit risk, the risk of failure by another party to perform according to the terms of a contract.
The purchase and sale of futures and options on futures contracts require margin deposits with FCMs. Additional deposits may be necessary for any loss on contract value. The Commodity Exchange Act requires an FCM to segregate all customer transactions and assets from the FCM’s proprietary activities. A customer’s cash and other property (for example, U.S. Treasury bills) deposited with an FCM are considered commingled with all other customer funds subject to the FCM’s segregation requirements. In the event of an FCM’s insolvency, recovery may be limited to a pro rata share of segregated funds available. It is possible that the recovered amount could be less than the total of cash and other property deposited.
Net trading results from derivatives for the three and nine months ended September 30, 2007 and 2006, are reflected in the statements of operations. Such trading results reflect the net gain arising from the Partnership’s speculative trading of futures contracts, options on futures contract, and forward contracts.
14
For derivatives, risks arise from changes in the fair value of the contracts. Theoretically, the Partnership is exposed to a market risk equal to the value of futures and forward contracts purchased and unlimited liability on such contracts sold short. As both a buyer and seller of options, the Partnership pays or receives a premium at the outset and then bears the risk of unfavorable changes in the price of the contract underlying the option. Written options expose the Partnership to potentially unlimited liability; for purchased options the risk of loss is limited to the premiums paid.
In addition to market risk, in entering into commodity contracts there is a credit risk that a counterparty will not be able to meet its obligations to the Partnership. The counterparty for futures and options on futures contracts traded in the United States and on most non-U.S. futures exchanges is the clearinghouse associated with such exchange. In general, clearinghouses are backed by the members of the clearinghouse who are required to share any financial burden resulting from the nonperformance by one of their members and, as such, should significantly reduce this credit risk. In cases where the clearinghouse is not backed by the clearing members, like some non-U.S. exchanges, it is normally backed by a consortium of banks or other financial institutions.
In the case of forward contracts, over-the-counter options contracts or swap contracts, which are traded on the interbank or other institutional market rather than on exchanges, the counterparty is generally a single bank or other financial institution, rather than a clearinghouse backed by a group of financial institutions; thus, there likely will be greater counterparty credit risk. The Partnership trades only with those counterparties that it believes to be creditworthy. All positions of the Partnership are valued each day on a mark-to-market basis. There can be no assurance that any clearing member, clearinghouse or other counterparty will be able to meet its obligations to the Partnership.
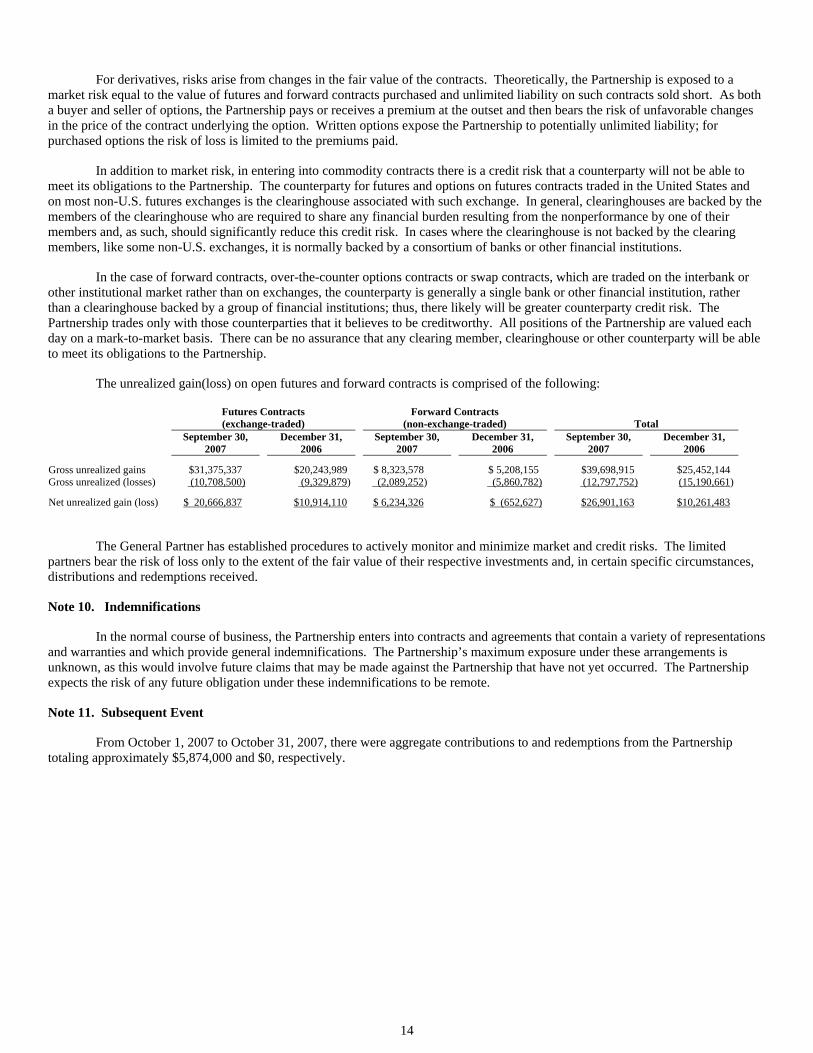
The unrealized gain(loss) on open futures and forward contracts is comprised of the following:
Futures Contracts (exchange-traded)
Forward Contracts (non-exchange-traded) Total
September 30,
2007 December 31,
2006 September 30,
2007 December 31,
2006 September 30,
2007 December 31,
2006
Gross unrealized gains $31,375,337 $20,243,989 $ 8,323,578 $ 5,208,155 $39,698,915 $25,452,144 Gross unrealized (losses) (10,708,500) (9,329,879) (2,089,252) (5,860,782) (12,797,752) (15,190,661)
Net unrealized gain (loss) $ 20,666,837 $10,914,110 $ 6,234,326 $ (652,627) $26,901,163 $10,261,483
The General Partner has established procedures to actively monitor and minimize market and credit risks. The limited partners bear the risk of loss only to the extent of the fair value of their respective investments and, in certain specific circumstances, distributions and redemptions received.
Note 10. Indemnifications
In the normal course of business, the Partnership enters into contracts and agreements that contain a variety of representations and warranties and which provide general indemnifications. The Partnership’s maximum exposure under these arrangements is unknown, as this would involve future claims that may be made against the Partnership that have not yet occurred. The Partnership expects the risk of any future obligation under these indemnifications to be remote.
Note 11. Subsequent Event
From October 1, 2007 to October 31, 2007, there were aggregate contributions to and redemptions from the Partnership totaling approximately $5,874,000 and $0, respectively.
15
Item 2. Management’s Discussion and Analysis of Financial Condition and Results of Operations Introduction
Grant Park is a multi-advisor commodity pool organized to pool assets of its investors for purposes of investing those assets in U.S. and international commodity futures and forward contracts and other commodity interests, including options contracts on futures, forwards and commodities, spot contracts, swap contracts and security futures. The commodities underlying these contracts may include stock indices, interest rates, currencies or physical commodities, such as agricultural products, energy products or metals. Grant Park has been in continuous operation since it commenced trading on January 1, 1989. Grant Park’s general partner, commodity pool operator and sponsor is Dearborn Capital Management, L.L.C., an Illinois limited liability company. The managing member of Dearborn Capital Management, L.L.C. is Dearborn Capital Management, Ltd., an Illinois corporation whose sole shareholder is David M. Kavanagh.
Grant Park invests through independent professional commodity trading advisors retained by the general partner. Rabar
Market Research, Inc., EMC Capital Management, Inc., Eckhardt Trading Company, or ETC, Graham Capital Management, L.P., Winton Capital Management Limited, and Welton Investment Corporation serve as Grant Park’s commodity trading advisors. Each of the trading advisors is registered as a commodity trading advisor under the Commodity Exchange Act and is a member of the NFA. As of September 30, 2007, the general partner allocated Grant Park’s net assets among the trading advisors as follows: 19% to Rabar, 20% to EMC, 9% to ETC, 9% to Graham, 22% to Winton, and 18% to Welton. The general partner may terminate or replace the trading advisors or retain additional trading advisors in its sole discretion.
Effective June 1, 2007, the general partner reallocated the portion of Grant Park’s net assets allocated to Winton Capital
Management Limited (“Winton”) to the Dearborn Select Master Fund, SPC – Winton Segregated Portfolio – Class GP (the “GP Class”). Dearborn Select Master Fund, SPC (“Dearborn Select”) was incorporated under the laws of the Cayman Islands on April 7, 2006 and is a private investment fund organized as a segregated portfolio company with limited liability. The GP Class allocates the assets invested by Grant Park to Winton through one or more managed accounts, to be traded pursuant to Winton’s Diversified Program, the same trading program Winton previously traded for Grant Park. Grant Park owns all of the outstanding Class GP units of the GP Class. There have been no changes to the existing clearing broker arrangements/brokerage charge and no material changes to the other fees and expenses allocated to Grant Park as a result of this reallocation. The general partner of Grant Park is also the Investment Manager of Dearborn Select. Critical Accounting Policies
Grant Park’s most significant accounting policy is the valuation of its assets invested in U.S. and international futures and forward contracts, options contracts and other interests in commodities. The majority of the investments are exchange-traded contracts, valued based upon exchange settlement prices. The remainder of its investments are non-exchange-traded contracts with valuation of those investments based on third-party quoted dealer values on the Interbank market. With the valuation of the investments easily obtained, there is little or no judgment or uncertainty involved in the valuation of investments, and accordingly, it is unlikely that materially different amounts would be reported under different conditions using different but reasonably plausible assumptions. Grant Park’s significant accounting policies are described in detail in Note 1 of the Financial Statements. Capital Resources
Grant Park plans to raise additional capital only through the sale of units pursuant to the continuous offering and does not intend to raise any capital through borrowing. Due to the nature of Grant Park’s business, it does not make any capital expenditures and does not have any capital assets that are not operating capital or assets. Liquidity
Most U.S. futures exchanges limit fluctuations in some futures and options contract prices during a single day by regulations referred to as daily price fluctuation limits or daily limits. During a single trading day, no trades may be executed at prices beyond the daily limit. Once the price of a contract has reached the daily limit for that day, positions in that contract can neither be taken nor liquidated. Futures prices have occasionally moved to the daily limit for several consecutive days with little or no trading. Similar occurrences could prevent Grant Park from promptly liquidating unfavorable positions and subject Grant Park to substantial losses that could exceed the margin initially committed to those trades. In addition, even if futures or options prices do not move to the daily limit, Grant Park may not be able to execute trades at favorable prices, if little trading in the contracts is taking place. Other than these limitations on liquidity, which are inherent in Grant Park’s futures and options trading operations, Grant Park’s assets are expected to be highly liquid.
Results of Operations
Grant Park’s net return, which consists of Grant Park’s trading gains plus interest income less brokerage fees, performance
16
fees, operating costs and offering costs borne by Grant Park, for the quarter ended September 30, 2007 was approximately 0.8% for the Class A units and 0.6% for the Class B units. The net asset value at September 30, 2007 was approximately $432.4 million, at December 31, 2006 was approximately $382.3 million and at September 30, 2006 was approximately $360.4 million.
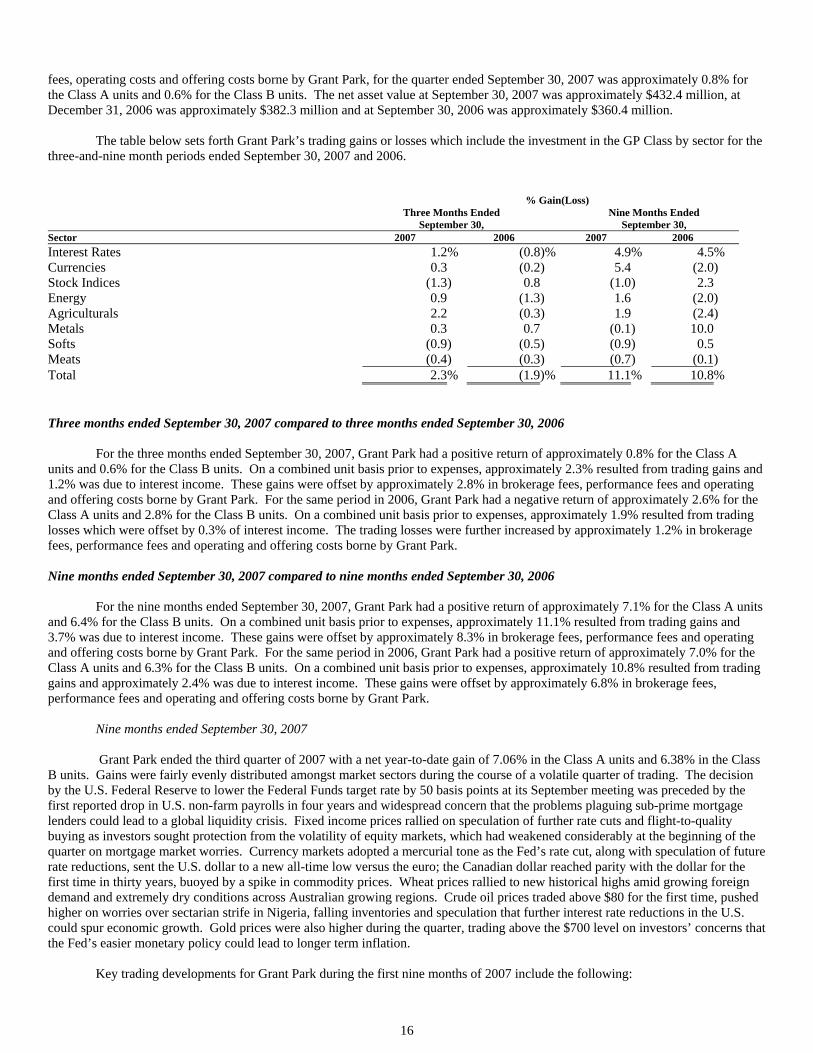
The table below sets forth Grant Park’s trading gains or losses which include the investment in the GP Class by sector for the
three-and-nine month periods ended September 30, 2007 and 2006.
% Gain (Loss)
Three Months Ended
September 30, Nine Months Ended
September 30, Sector 2007 2006 2007 2006 Interest Rates 1.2% (0.8)% 4.9 % 4.5% Currencies 0.3 (0.2) 5.4 (2.0) Stock Indices (1.3) 0.8 (1.0 ) 2.3 Energy 0.9 (1.3) 1.6 (2.0) Agriculturals 2.2 (0.3) 1.9 (2.4) Metals 0.3 0.7 (0.1 ) 10.0 Softs (0.9) (0.5) (0.9 ) 0.5 Meats (0.4) (0.3) (0.7 ) (0.1) Total 2.3% (1.9)% 11.1 % 10.8%
Three months ended September 30, 2007 compared to three months ended September 30, 2006
For the three months ended September 30, 2007, Grant Park had a positive return of approximately 0.8% for the Class A units and 0.6% for the Class B units. On a combined unit basis prior to expenses, approximately 2.3% resulted from trading gains and 1.2% was due to interest income. These gains were offset by approximately 2.8% in brokerage fees, performance fees and operating and offering costs borne by Grant Park. For the same period in 2006, Grant Park had a negative return of approximately 2.6% for the Class A units and 2.8% for the Class B units. On a combined unit basis prior to expenses, approximately 1.9% resulted from trading losses which were offset by 0.3% of interest income. The trading losses were further increased by approximately 1.2% in brokerage fees, performance fees and operating and offering costs borne by Grant Park.
Nine months ended September 30, 2007 compared to nine months ended September 30, 2006
For the nine months ended September 30, 2007, Grant Park had a positive return of approximately 7.1% for the Class A units and 6.4% for the Class B units. On a combined unit basis prior to expenses, approximately 11.1% resulted from trading gains and 3.7% was due to interest income. These gains were offset by approximately 8.3% in brokerage fees, performance fees and operating and offering costs borne by Grant Park. For the same period in 2006, Grant Park had a positive return of approximately 7.0% for the Class A units and 6.3% for the Class B units. On a combined unit basis prior to expenses, approximately 10.8% resulted from trading gains and approximately 2.4% was due to interest income. These gains were offset by approximately 6.8% in brokerage fees, performance fees and operating and offering costs borne by Grant Park.
Nine months ended September 30, 2007 Grant Park ended the third quarter of 2007 with a net year-to-date gain of 7.06% in the Class A units and 6.38% in the Class
B units. Gains were fairly evenly distributed amongst market sectors during the course of a volatile quarter of trading. The decision by the U.S. Federal Reserve to lower the Federal Funds target rate by 50 basis points at its September meeting was preceded by the first reported drop in U.S. non-farm payrolls in four years and widespread concern that the problems plaguing sub-prime mortgage lenders could lead to a global liquidity crisis. Fixed income prices rallied on speculation of further rate cuts and flight-to-quality buying as investors sought protection from the volatility of equity markets, which had weakened considerably at the beginning of the quarter on mortgage market worries. Currency markets adopted a mercurial tone as the Fed’s rate cut, along with speculation of future rate reductions, sent the U.S. dollar to a new all-time low versus the euro; the Canadian dollar reached parity with the dollar for the first time in thirty years, buoyed by a spike in commodity prices. Wheat prices rallied to new historical highs amid growing foreign demand and extremely dry conditions across Australian growing regions. Crude oil prices traded above $80 for the first time, pushed higher on worries over sectarian strife in Nigeria, falling inventories and speculation that further interest rate reductions in the U.S. could spur economic growth. Gold prices were also higher during the quarter, trading above the $700 level on investors’ concerns that the Fed’s easier monetary policy could lead to longer term inflation.
Key trading developments for Grant Park during the first nine months of 2007 include the following:
17
Grant Park recorded gains for the month of January. Class A units were up 1.25% and Class B units were up 1.18%. Positions in the interest rate sector recorded the largest gains for the month, particularly in the foreign markets. Short positions in the British short sterling and long gilt contracts reported gains after an unexpected rate hike by the Bank of England resulted in lower prices for interest rate instruments. Short positions in the domestic market were also profitable after prices for Eurodollars fell in response to data that suggested some inflationary risk for the U.S. economy. Prices for crude oil sank to 18-month lows, resulting in gains for short positions in the energy sector. Comments by the Saudi ambassador to the U.S. indicating that oil prices could go lower forced a sell off in crude as investors speculated that OPEC might not push for further production cuts. The U.S. Department of Energy reported an unexpected rise in gasoline inventories, resulting in gains for short positions in unleaded gasoline. Positions in the stock indices reported gains as lower energy prices boosted global share markets. Long positions in the German DAX and S&P Composite Index registered the largest gains. Long positions in nickel resulted in gains as the threat of a strike at a Canadian mine kept prices for the raw material at higher levels; short positions in copper also gained ground as prices fell in response to a downturn in the U.S. housing market. Long positions in the currency sector sustained losses as the New Zealand and Australian dollars depreciated against the U.S. dollar, mainly due to weakness in the majority of base metal markets. Lastly, losses were incurred from long positions in the soft/agricultural commodities markets where prices for corn fell after weakness in the energy markets led to the perception of lessening demand for ethanol distillates; an upward revision in U.S. beef production resulted in losses for long positions in the livestock markets.
Grant Park sustained losses for the month of February. Class A units were down 4.18% while Class B units were down 4.25%. Long positions in the stock indices sustained substantial losses as a result of the plunge in global share prices near the end of the month. Chinese stock prices fell more than 8% in a single session as investors became concerned that the Chinese government might introduce new regulations designed to discourage illegal share offerings and investments using borrowed money. The weakness spilled over into Europe and the United States as program trading on behalf of institutional investors resulted in massive liquidation of stocks. Short positions in the interest rate sector incurred losses as falling share prices caused investors to reallocate assets to fixed income instruments. Additionally, prices along every part of the yield curve rallied in response to weaker than expected data on US durable goods and new home sales. Positions in Eurodollars and LIFFE Euribor experienced the largest setbacks. The currency sector reported negative performance after the Bank of Japan raised short-term rates, resulting in losses to short positions in the Japanese yen; the yen was also higher as the result of investors unwinding “carry” trades in which they initially sold the yen to buy currencies from economies offering a better rate of return. Short positions in the energy sector incurred losses as a combination of cold weather and renewed concerns over Iran’s nuclear ambitions resulted in higher prices for crude oil and related products. Long positions in the base metals resulted in gains, particularly in the nickel market where increased demand from steel mills combined with supply concerns resulted in a 14% price increase during the month. Lastly, long positions in the soybean complex recorded gains after prices there rallied on strong demand for US exports, especially from China. Prices were also higher on speculation that farmers would dedicate less acreage to soybean production and more to corn as a result of the growing demand for ethanol. Live cattle prices were also higher, benefiting long positions.
Grant Park recorded losses for the month of March. Class A units were down 4.55% and Class B units were down 4.62%.
Positions in the global stock indices reported losses as equity markets continued to trade lower in the wake of the massive stock liquidation at the end of February. Concerns over the tense situation between the West and Iran, rising energy prices and a slowing U.S. housing market all contributed to lower share prices. Reports from the U.S. Department of Agriculture indicating that U.S. farmers planned on increasing corn crop acreage by 15% in 2007 resulted in losses for long positions in corn. Prices in the soybean complex also fell during the month, resulting in net losses for the soft/agricultural commodity sector. Short positions in the Eurodollar market experienced setbacks as prices for interest rate instruments rallied in response to a lower-than-expected reading on U.S. fourth-quarter GDP, a plunge in new home sales and a contraction in U.S. manufacturing. Indications that the U.S. Federal Reserve Bank might drop its tightening bias on short-term interest rates also pushed prices higher. Falling equity markets continued to have a negative effect on precious metals prices, sending gold to lower levels as investors liquidated positions in order to offset losses from equity positions. Concerns over slow U.S. economic growth also contributed to lower prices. Positions in the currency sector registered losses after the U.S. dollar traded higher relative to its major counterparts. A lower-than-anticipated release of the February unemployment rate helped push the dollar higher, resulting in losses to long positions in the Canadian dollar. Positions in the cross rates also lost ground as the euro depreciated against the Japanese yen. Lastly, long positions in the energy sector reported gains as prices for unleaded gasoline rallied in response to strong U.S. demand and reports of shrinking inventories. Unleaded gas prices were up a little more than 9% for the month.
Grant Park recorded gains for the month of April. Class A units were up 5.23% and Class B units were up 5.15%. Positions
in the currency sector resulted in the largest gains during April as the U.S. dollar depreciated relative to its major trading partners. Weak U.S. economic data combined with the perception that European interest rates could be headed higher caused the dollar to lose ground to the euro and British pound. Profits also came from cross rate positions as the euro traded higher against the Japanese yen after lower-than-expected data on Japanese consumer prices and industrial production was released. Global share markets traded higher throughout the month, resulting in gains for stock index positions. Forecasts for increased global economic growth along with positive earnings reports were the main drivers of the upside move in stocks. The largest gains came from positions in the S&P Composite Index and German DAX. Base metal positions reported gains as prices for raw materials continued to trade higher during April. A 17% rise in Chinese demand for copper from the same period one year ago spurred that contract to five-month highs on the London Metals Exchange. Nickel prices were also higher as worries over supply continued to concern traders. Rising inventories
18
combined with technically based selling were profitable for short positions in the cotton market, leading to gains for the soft/agricultural commodities sector. Sugar prices were also lower resulting in gains for short positions. Long positions in the energy sector were profitable as unleaded gasoline prices moved higher on reports of falling inventories. Speculation that warmer weather could result in increased fuel demand also contributed to the rally. Lastly, short positions in the U.S. fixed income markets were dealt losses as prices for Treasury instruments and interest rate products traded higher in response to weaker-than-expected data on U.S. consumer prices.
Grant Park recorded gains for the month of May. Class A units were up 4.60% and Class B units were up 4.52%. Short
positions in the global fixed income markets were responsible for the majority of gains during the month. Prices for European fixed income products were lower on expectations that better-than-expected economic growth in the Euro zone would prompt the European Central Bank to tighten monetary policy at least twice more during 2007. Short positions in the Canadian bill market were profitable after prices fell in response to a government report showing that inflation accelerated during April, causing the Bank of Canada to signal a rate hike. Global share prices were higher by month’s end, resulting in gains for Grant Park’s long positions in the sector. The rally in stock prices was fueled by a combination of strong corporate earnings, continued merger and acquisition activity, and reports of slowing inflation in the United States. Positions in the currency sector posted gains as the news of higher inflation in Canada sent the Canadian dollar higher against the U.S. dollar. Long positions in the Mexican peso were also profitable after that currency settled the month higher relative to the dollar. Prices in the soybean complex were higher, resulting in gains for Grant Park. Reports that key growing regions have received less than a quarter of their average moisture drove bean prices higher as investors became concerned with the possibility of crop damage. The prospect of increased consumption of bio-diesel fuel added a bid to the soybean oil market. Metals positions sustained losses during the month as prices for industrial metals fell in response to China’s efforts to cool stock market speculation by increasing the stamp tax. Long positions in copper lost ground as prices fell on lower Chinese imports. Nickel longs were dealt losses following reports of growing inventories. Lastly, weakness in global energy prices resulted in losses for long positions in the sector. Natural gas positions incurred the largest setbacks.
Grant Park posted gains for the month of June. Class A units were up 4.16% and Class B units were up 4.09%. Short
positions in the currency sector gained ground after the Japanese yen weakened against most of its major counterparts. The yen depreciated relative to the U.S. dollar and the euro as investors sold the yen in order to purchase assets denominated in higher yielding currencies. Long positions in the New Zealand dollar were also profitable. Short positions in the interest rate sector yielded gains as prices for Australian fixed income products fell on news that the Australian economy grew at its fastest pace in three years, increasing the likelihood of a rate hike by the Reserve Bank of Australia. The release of a stronger-than-anticipated employment report put further downward pressure on prices. Additionally, short positions in Euro bunds were also profitable. Soybean prices rallied during the month, resulting in gains for long positions in the soft/agricultural commodities sector. The rally in the bean complex came after the USDA announced that U.S farmers had planted 64 million acres of soybeans, considerably less than analysts’ estimates. An increase in the amount of acreage dedicated to corn production was a contributing factor, analysts said. Short positions in the natural gas market led to gains for the energy sector. Analysts suggested that moderate temperatures across much of the United States led to rising inventories and lower prices. Long positions in the metals sector reported losses after reports of higher nickel inventories forced prices for the industrial metal lower. Lastly, long positions in the stock index sector incurred losses after global share markets settled the month lower on concerns over the possibility of higher inflation. The S&P Composite Index and Spanish IBEX sustained the largest losses as investors worried that the U.S. Federal Reserve and European Central Bank might be forced to raise short-term interest rates in the event of higher prices.
Grant Park sustained losses during the month of July. Class A units were down 3.72% and Class B units were down 3.79%.
Short positions in the interest rate sector were dealt losses after Standard and Poor’s lowered ratings on some European collateralized debt obligations. The decision pushed prices for foreign government-backed securities higher as investors reduced their exposure to corporate debt. Weakness in global equities at month’s end caused flight-to-quality buying in global government fixed income markets, resulting in further losses. Long positions in the stock indices reported losses after further worries over the state of U.S. sub-prime loans caused a massive sell-off in domestic and foreign equities markets. Disappointing earnings reports also pushed share markets lower. Currency positions lost ground after the Japanese yen rallied materially against virtually all of its trading partners. Investors, looking for protection from losses incurred in equity markets, unwound positions in which they initially borrowed yen in order to invest in assets denominated in higher-yielding currencies, sending the yen higher relative to the euro and New Zealand dollar. Concerns over a possible credit squeeze sent metals prices lower, resulting in losses for long positions. Gold prices fell as investors sought to reduce their exposure to commodities risk; a rally in the U.S. dollar also contributed to weakness in gold prices. Weakness in commodity prices extended to the soft/agricultural sector where favorable growing conditions and well-timed rains resulted in lower grain prices. Long positions in the soybean complex sustained the largest losses in the sector. Lastly, positions in the energy sector were profitable during the month. Long positions in crude oil gained as prices rallied amid reports of falling U.S. inventories and the possibility of renewed sectarian strife in Nigeria. Natural gas prices fell, benefiting short positions.
Grant Park posted trading losses during the month of August. Class A units were down 3.71% and Class B units were down
3.78%. Currency positions sustained the largest setbacks. Foreign currencies fell relative to the dollar after investors fled some emerging market currencies for the relative safety of the greenback; long positions in the euro lost ground after the European Central Bank added liquidity to the banking system in order to head off a possible credit squeeze. Short positions in the Japanese yen were dealt losses as investors, seeking to preserve capital, liquidated massive positions in the yen carry trade, leading to losses from cross-
19
rate positions in the New Zealand dollar. Long positions in the energy sector reported losses as prices for crude oil fell on speculation that a possible credit crunch could result in an expanded economic slowdown. Further selling occurred after Hurricane Dean failed to disrupt refinery operations in the Gulf of Mexico. Similar to the energy sector, long positions in the base metals sustained losses as prices for copper and aluminum fell on concerns that a broader economic slowdown would reduce demand for raw materials. Long positions in the soft/agricultural commodities sector experienced losses as prices for soybean oil fell after rains across key growing regions improved the outlook for the current crop. Coffee prices also fell, adding to losses. Long positions in the wheat market mitigated losses in the sector as strong demand for U.S. exports pushed prices higher for the month. Reduced long positions in the global stock indices sustained losses as share prices weakened further on concerns that U.S. subprime mortgage defaults could have a material effect on credit availability. Lastly, long positions in the fixed income sector recorded gains as prices for Japanese Government Bonds rallied as investors sought protection from the volatility of the equity and corporate bond markets. The likelihood that the Bank of Japan would refrain from raising interest rates in the current environment also resulted in higher prices.
Grant Park recorded gains for the month of September. Class A units were up 8.78% and Class B units were up 8.70%. The
release of the U.S. non-farm payrolls number sent the U.S. dollar lower against most of its foreign counterparts, resulting in gains for the currency sector. Analysts had estimated that the economy had grown by 110,000 jobs during August but the report showed that 4,000 jobs had actually been lost and that previously released July and June jobs data had been downwardly revised. The news prompted the U.S. Federal Reserve Bank to lower the federal funds rate by 50 basis points, putting further pressure on the dollar, which established all-time lows against the euro and reached parity with the Canadian dollar for the first time in 30 years. Positions in the soft/agricultural commodities sector were profitable as grain prices rallied throughout the month. Wheat markets provided the bulk of gains as strong demand from India and the Middle East combined with extremely dry conditions in Australian growing regions pushed prices higher. Soybean prices also gained after the USDA reported that the amount of acreage dedicated to soybean production would probably shrink over the next few years. The initial payrolls report and the subsequent rate cut by the Federal Reserve benefited long positions in the metals sector as gold prices traded above the $700 level for the first time in 16 months. The precious metal moved closer to the $750 range after the rate cut as investors, worried about the prospects of rising prices, purchased gold as a possible protection against longer term inflation. Long positions in the energy sector gained ground as prices rallied during the month on strong demand from all directions. The Fed’s decision to cut rates pushed crude oil above $80 for the first time as traders speculated that the rate cut would stimulate the economy and lead to stronger demand. Gains also came from the stock index sector after the Hong Kong Hang Seng rallied on the news that China’s currency regulator had relaxed investment restrictions, allowing more Chinese citizens to invest in Hong Kong share markets. Lastly, long positions in the interest rate sector posted gains after the Federal Reserve’s aggressive rate cut sent prices for domestic fixed income instruments higher. Long positions in the Eurodollar contract posted the largest profits as prices at the short end of the yield curve gained the most ground.
Nine months ended September 30, 2006 Grant Park ended the third quarter of 2006 down 2.63% in the Class A units and down 2.83% in the Class B units. This
brings the year to date performance for Class A and Class B units through September 30, 2006 to 6.99% and 6.30%, respectively. The quarter was characterized by the same themes that dominated the second quarter: choppy currency markets and strong metals and international equity markets. However, Grant Park had to contend with liquidating its long energy holdings as oil declined 20% from its high during the quarter.
Currency markets continued to be dominated by two way trading with the exception of the yen, which weakened during the
quarter. Positions in the sector were light as most currencies continued to trade in a narrow range. Both domestic and international equity indices continued their strength. Suggestions from the U.S. Federal Reserve that they
may be ready to pause their rate hike cycle helped fuel higher equity prices around the globe. Metal prices also continued their strength as low stock piles and strong demand helped send prices higher in the base metal
sector. Work stoppages in China and Canada helped contribute to strong gains early in the quarter. As these labor issues were settled later in the quarter, base metals started to give back some of their previous gains.
Finally the dominant theme affecting Grant Park was the large correction in the energy markets. After hitting a high of $80
in early July, December ’07 oil experienced a 20% correction during the quarter. Accordingly, Grant Park was forced to liquidate all of its long positions in the energy markets at a loss.
Key trading developments for Grant Park during the first six months of 2006 include the following: Grant Park recorded gains for the month of January. Class A units were up 3.49% for the month while Class B units were up
3.41% for the month. Positions in the metals, stock indices, agricultural/soft commodities and energies were profitable. Losses came from positions in the interest rate and currency sectors. Long positions in gold and silver recorded gains as precious metals rallied on news that Iran had removed U.N. seals from uranium purification equipment, sparking fears of a possible military showdown. Longs in aluminum and zinc were profitable as word that China’s economy grew at a greater-than-expected pace sent prices for base metals higher. Long positions in the stock indices were profitable as a rise in German business confidence led to higher prices on the German
20
DAX. The London FTSE-100 gained ground on strength from steel shares while the S&P Composite Index traded higher after it was reported that U.S. durable goods orders grew for a third straight month in December. Continued South American demand for sugar-based ethanol resulted in profits to long positions in the soft/agricultural commodities as sugar prices settled higher for the month. Longs in the coffee market gained as strong demand during the holiday season pushed prices higher for the month. Longs in the energy sector were profitable as the situation in Iran sparked worries over crude oil and gasoline supplies. Reports that militants had targeted Nigerian refinery operations further added to concerns, driving prices higher. Long positions in the London long gilt and British short sterling sustained losses as prices for interest rate instruments fell on news that December retail sales in the U.K. were better-than-anticipated. Losses also came from short positions in the Canadian bills. Lastly, positions in the currency sector were unprofitable as speculation regarding the direction of interest rates in the U.S. and Europe dominated the sector. Long positions in the Swiss franc lost ground as the currency fell versus the U.S. dollar. Losses also came from positions in the Australian and New Zealand dollars. Grant Park sustained losses for the month of February. Class A units had a negative return of 3.28% for the month and Class B units had a negative return of 3.35% for the month. Positions in the metal, energy and currency sectors experienced the largest setbacks. Losses were also the result of positions in the agricultural/soft commodities and interest rate products. Profits came from positions in the stock indices. Base and precious metals prices fell during the month, resulting in losses to long positions in the sector. Lower than expected U.S. industrial production data for January sent prices for copper, zinc and aluminum lower. Analysts suggested that an expected increase in mining activity in 2006 was also responsible for the weakness in base metals. Gold and silver were weaker as the possibility of further interest rate increases in the U.S. forced precious metals prices lower. Long positions in the crude oil market led to losses in the energy sector after data showed crude inventories to be at higher levels than the same period last year. This was possibly the result of unseasonably warm weather in the Northeastern United States. Gasoline prices were also lower, causing losses to long positions. Short positions in the currency sector lost ground as the Japanese yen rallied on comments from Bank of Japan officials suggesting that the Central Bank might gradually increase short-term interest rates which have hovered near zero percent since 2001. This caused the currency to appreciate against the euro, British pound and U.S. dollar. Coffee and sugar prices were lower during the month, resulting in losses for long positions in the soft/agricultural sector. Analysts suggested that the weakness stemmed from the expectation that global production of coffee would rise, particularly in Africa, causing investors to take profits on long positions. Long positions in the foreign interest rate products reported losses as prices for the Australia Ten and Three-year bonds closed lower. Losses also came from positions in the U.S Thirty-year Treasury bond. Lastly, long positions in the stock indices made gains on the strength of utility and banking stocks. The German DAX and Spanish IBEX settled higher, benefiting long positions.
Grant Park recorded gains for the month of March. Class A units were up 4.06% for the month while Class B units were up 3.98% for the month. Positions in the interest rates, metals and stock indices posted profits; losses came from positions in the currency, soft/agricultural commodity and energy sectors. Short positions in the Eurodollars and U.S. Treasury instruments benefited as prices for fixed income products fell on the possibility of higher interest rates in the U.S. After raising short term rates for the 15th consecutive time, the Federal Open Market Committee cautioned that further increases could be needed to balance economic growth and price stability. Short positions in the Eurobund and Euribor benefited as prices fell after the European Central Bank boosted short term interest rates early in the month and then indicated that conditions remained favorable for continued economic expansion. Long positions in silver posted gains as the prospect of the U.S. Securities and Exchange Commission’s approval of a silver-based Exchange Traded Fund sent prices higher on speculation that the approval of the fund would deplete supplies of the precious metal. Long positions in the copper market profited as prices were higher on the expectation that current levels of physical demand could outpace inventories of the base metal. Favorable earnings forecasts for automobile and real estate stocks helped push foreign stock indices higher during the month, which benefited long positions in the London FTSE-100, Paris CAC and German DAX. Gains also came from long positions in the Tokyo Nikkei. Short positions in the foreign currencies recorded losses as the euro and Swiss franc appreciated against the U.S. dollar on the expectation that there might be more room for interest rate hikes in Europe as opposed to the U.S. Wet weather across the Midwestern U.S. led to losses from long positions in the soft/agricultural commodity sector as prices for Kansas City wheat fell after heavy rains blanketed the growing region. Corn prices also fell, resulting in losses for long positions. Finally, short positions in the energy sector reported losses as concerns over supply sent prices for heating oil and gasoline higher for the month.
Grant Park posted gains during the month of April. Class A units were up 9.46% and Class B units were up 9.38%. The
majority of sectors were profitable, with the largest advances the result of positions in the metals sector, followed by gains in interest rates, energies, stock indices and currencies. Losses were confined to positions in the soft/agricultural commodity sector. Long positions in the metals markets reported gains as prices for base metals appreciated during the month. Supply concerns dominated the marketplace as reports of work stoppages at mines in Mexico sent copper prices higher. Forecasts for increased global economic growth also boosted base metals, spurring nickel and aluminum prices to higher levels for the month. Long positions in the gold market benefited as the precious metal traded above $600 per ounce after investors became concerned over claims that Iran had begun to produce enriched uranium. Short positions in the interest rate sector were rewarded as fixed income prices fell on concerns over inflation in Europe and the United States. Short positions in the U.S. Treasury bond, London long gilt and Euro bund benefited as the possibility of interest rate increases on both sides of the Atlantic pushed fixed income prices lower. Short positions in the Australian 90-day bills and ten-year bonds also posted earnings. Worries over supply led to gains in the energy complex as the news regarding Iran’s uranium enrichment program sent crude oil prices higher on concerns that a showdown with the U.S. /U.N might hamper
21
production. Rebel attacks on petroleum facilities in Nigeria also resulted in higher prices. Gains from technology and mining stocks sent the Tokyo Nikkei and Australian Share Price Index higher, resulting in gains to long positions in the stock index sector. Long positions in the currency sector reported gains as the euro currency appreciated against the dollar after the Qatar Central Bank indicated that it would buy euros to diversify its currency holdings. The British pound and Swiss franc also appreciated against the dollar, benefiting long positions in those currencies. Finally, long positions in the sugar market resulted in losses for the soft/agricultural commodity sector as analysts attributed the weakness to liquidation of long positions by investors seeking to protect recent gains. Grant Park experienced minor trading losses during the month of May. Class A units had a negative return of 0.81% while Class B units had a negative return of 0.88%. Stock index positions incurred the largest setbacks, followed by losses to positions in the energy and soft/agricultural commodity sectors. Positions in metals, currencies and interest rates reported gains for the month. Long positions in the stock indices sustained losses as global stock markets experienced a volatile month. Concerns over the prospect of higher inflation, rising interest rates and the possibility of slowing economic growth led to losses from long positions in the German DAX, Nasdaq-100 Index and Tokyo Nikkei. Positions in the energy sector reported setbacks after a report earlier in the month announced that U.S. gasoline inventories had experienced a weekly increase for the first time since February of this year, leading to speculation of lessened demand during the summer driving season. Long positions in the crude oil, heating oil and gasoline markets reported losses. Short positions in the soft/agricultural commodity sector resulted in losses as prices for live cattle were higher during the month on what analysts described as a technical driven rally, with investors pushing prices higher as they moved to liquidate short positions. Long positions in the sugar market also reported losses as prices there were lower for the month. Long positions in the metals sector recorded gains as reports of tight supplies combined with continued economic growth in India, China and South America sent base metals prices higher. Reports of supply disruptions in Mexico and Chile also pushed industrial metal prices higher. Long positions in the foreign currencies profited as the U.S. dollar lost ground to the euro, Swiss franc and British pound amid speculation that short term interest rates could rise faster in Europe than in the United States. Lastly, short positions in the domestic interest rate market were profitable as the Eurodollar contract traded lower after the U.S. Federal Open Market Committee raised the federal funds target rate to 5% and issued a statement saying that any additional rate hikes would depend upon economic data going forward.
Grant Park posted trading losses during the month of June. Class A units were down 2.85% while Class B units were down 2.92%. Positions in the currencies, metals, soft/agricultural commodities and stock indices accounted for the majority of losses; energy positions also sustained setbacks. Gains came from positions in the interest rate sector. Long positions in the currency sector incurred losses as the U.S. dollar moved higher during the month, buoyed by the U.S. Federal Reserve Bank’s decision to continue its series of interest rate hikes. Long positions in the euro, British pound and Swiss franc experienced the largest losses as investors were concerned that the interest rate differential between the U.S. and Europe could possibly widen despite the news that the European Central Bank boosted short term rates for the third time in the last six months. The prospect of rising global interest rates sent prices for base metals lower, resulting in losses to long positions in the nickel and copper markets. Precious metal positions also posted losses as gold and silver settled at lower levels. Positions in soybeans and wheat led to losses in the soft/agricultural sector. Long positions in soybeans lost ground during a month of volatile price action driven by technical factors, according to analysts. Long positions in the wheat market experienced losses as favorable weather permitted the U.S. harvest to proceed at a quicker rate than usual, resulting in an excess of supply coming to the market. Positions in the stock indices sustained losses as the possibility of rising interest rates pushed share prices lower. Earlier in the month, long positions in the NASDAQ and German DAX sustained setbacks in response to this downside price action. Long positions in the energy sector experienced losses as the possibility of higher interest rates worried investors that any resulting slow down in economic growth could lessen the demand for fuel, resulting in losses to crude oil positions. Long positions in heating oil also lost ground. Lastly, positions in the interest rate sector reported gains as the prospect of further interest rate hikes across the globe sent prices lower. Short positions in the Eurodollar contract and LIFFE Euribor posted the largest gains in the sector.
Grant Park sustained losses during July. Class A units were down 3.66% while Class B units were down 3.73%. Positions in
the interest rates, soft agricultural commodities and energies incurred the largest setbacks, followed by losses in the currency sector. Gains came from the metals and stock indices. Short positions in the interest rate sector reported losses as prices for fixed income instruments rallied around the globe. Domestically, prices for Eurodollars and U.S. Ten-year notes rose after it was reported that U.S. non-farm payrolls were lower than expected during June; comments by Federal Reserve Chairman Ben Bernanke suggesting that the central bank expects moderate inflation going forward also sent prices higher. Open hostilities between Israel and Hezbollah put upward pressure on global fixed income prices as investors worried that the conflict could evolve into a wider war in the Middle East. Short positions in the corn market resulted in losses to the soft/agricultural commodity sector as prices rose in response to scorching heat in Midwestern growing regions and an increase in demand for corn mash for use in distilling gasoline additive ethanol. Long positions in crude oil and unleaded gasoline lost ground after prices fell in response to reports that showed inventories at higher than expected levels. Short positions in natural gas lost ground as soaring temperatures in the U.S. led to an increase in energy demand from gas-fueled power stations. News that the U.S. trade deficit was lower than expected in May resulted in losses to positions in the currency sector. Long positions in the Canadian dollar and euro experienced setbacks as the U.S. dollar rallied on the report. Long positions in the metals sector were profitable as a combination of high demand and waning inventories sent prices for copper and nickel higher for the month. Reports of work stoppages at mines in Chile and Canada gave investors concern that demand could further outpace supply. Lastly, long positions in the foreign stock indices were profitable for the month. Language suggesting that the
22
U.S. Federal Reserve might consider a pause in the central bank’s rate tightening schedule sent share markets higher, particularly the Hong Kong Hang Seng which registered the largest gains in the sector. Grant Park reported trading gains during August. Class A units were up 2.20% while Class B units were up 2.12%. Profits came from a majority of sectors, with the biggest advances stemming from positions in the currency and interest rate markets. Positions in the metals, stock indices and soft/agricultural commodities also garnered gains. Losses came solely from the energy sector. Short positions in the Japanese yen resulted in gains for the currency sector as the yen depreciated against the British pound and the euro after the Bank of England and the European Central Bank elected to tighten short term interest rates earlier in the month. Weaker than expected economic data out of Japan also benefited yen short positions. Long positions in the interest rate sector were profitable as the weak Japanese economic data pushed Japanese Government bonds higher for the month. U.S. Treasury products were higher as a slowing U.S. housing market combined with lower personal consumption data to push prices higher. Long positions in the metal sector posted gains as inventories of nickel at the London Metals Exchange sank to approximately two days of market consumption, pushing the price of the base metal considerably higher on the month. Long positions in the stock indices produced gains as global share markets were higher after the U.S. Federal Reserve Bank decided not to raise short-term interest rates for the first time in seventeen consecutive meetings. The Hong Kong Hang Seng posted material gains as analysts suggested that exporters benefited the most from the U.S. central bank’s decision. Long positions in the live stock markets resulted in gains for the soft/agricultural commodity sector. Analysts suggested that strong commercial demand sent prices for live hogs higher and the resumption of beef exports from the United States to Japan pushed prices for live cattle higher. Lastly, long positions in the energy sector sustained losses for the month. Crude oil prices fell after a plot to blow up U.S. airliners was foiled by British intelligence, resulting in speculation that worries over terrorism and strict new travel guidelines would result in less air travel and lower demand for jet fuel.
Grant Park sustained trading losses during September. Class A units were down 1.10% while Class B units were down 1.17%. Setbacks were the result of positions in the currencies, metals, soft/agricultural commodities and interest rates. Gains came from the energy and stock index sectors. Long positions in the British pound lost ground after Bank of England officials stated that they expected growth and inflation to be lower than anticipated in the coming months, an indication that the central bank may continue to hold off on any further interest rate hikes. Canadian dollar longs incurred losses as that currency weakened in response to falling energy prices. Losses were incurred to long positions in the copper and aluminum markets as investors’ concerns over a slow down in global economic growth sent prices for raw materials lower. Long positions in the livestock markets sustained losses as prices for beef fell on expectations that the number of cattle on U.S. feedlots would increase; losses to long positions in the hog market occurred after reports of increased pork production and a decrease in U.S. exports. Short positions in the LIFFE euribor contract sustained losses as prices for the short-term interest rate product rose in response to the aforementioned comments by Bank of England officials. Energy prices fell during the month, resulting in gains to short positions in the sector. An increase in U.S. commercial supplies of crude oil coupled with the perception of a lessening in geopolitical risks in the Middle East sent prices for crude, natural gas and heating oil lower for the month. Lastly, long positions in global equity markets were profitable as analysts suggested that the decision by the U.S. Federal Reserve Bank to keep short-term interest rates steady combined with benign U.S. economic data resulted in higher prices for the S&P Composite Index. Longs in the Spanish IBEX were profitable after the index traded higher on merger and acquisition activity from the utility sector. Off-Balance Sheet Risk
Off-balance sheet risk refers to an unrecorded potential liability that, even though it does not appear on the balance sheet, may result in future obligation or loss. Grant Park trades in futures and other commodity interest contracts and is therefore a party to financial instruments with elements of off-balance sheet market and credit risk. In entering into these contracts, Grant Park faces the market risk that these contracts may be significantly influenced by market conditions, such as interest rate volatility, resulting in such contracts being less valuable. If the markets should move against all of the commodity interest positions of Grant Park at the same time, and if Grant Park were unable to offset positions, Grant Park could lose all of its assets and the limited partners would realize a 100% loss. Grant Park minimizes market risk through real-time monitoring of open positions, diversification of the portfolio and maintenance of a margin-to-equity ratio that rarely exceeds 25%. All positions of Grant Park are valued each day on a mark-to-market basis.
In addition to market risk, in entering into commodity interest contracts there is a credit risk that a counterparty will not be
able to meet its obligations to Grant Park. The counterparty for futures and options on futures contracts traded in the United States and on most non-U.S. futures exchanges is the clearing organization associated with such exchange. In general, clearing organizations are backed by the corporate members of the clearing organization who are required to share any financial burden resulting from the non-performance by one of their members and, as such, should significantly reduce this credit risk. In cases where the clearing organization is not backed by the clearing members, like some non-U.S. exchanges, it is normally backed by a consortium of banks or other financial institutions.
In the case of forward contracts, over-the-counter options contracts or swap contracts, which are traded on the interbank or
other institutional market rather than on exchanges, the counterparty is generally a single bank or other financial institution, rather than a central clearing organization backed by a group of financial institutions. As a result, there will likely be greater counterparty
23
credit risk in these transactions. Grant Park trades only with those counterparties that it believes to be creditworthy. Nonetheless, the clearing member, clearing organization or other counterparty to these transactions may not be able to meet its obligations to Grant Park, in which case Grant Park could suffer significant losses on these contracts.
In the normal course of business, Grant Park enters into contracts and agreements that contain a variety of representations and
warranties and which provide general indemnifications. Grant Park’s maximum exposure under these arrangements is unknown, as this would involve future claims that may be made against Grant Park that have not yet occurred. Grant Park expects the risk of any future obligation under these indemnifications to be remote.
Item 3. Quantitative and Qualitative Disclosures About Market Risk Introduction
Grant Park is a speculative commodity pool. The market sensitive instruments held by it are acquired for speculative trading purposes, and all or a substantial amount of Grant Park’s assets are subject to the risk of trading loss. Unlike an operating company, the risk of market sensitive instruments is integral, not incidental, to Grant Park’s business.
Market movements result in frequent changes in the fair value of Grant Park’s open positions and, consequently, in its
earnings and cash flow. Grant Park’s market risk is influenced by a wide variety of factors, including the level and volatility of exchange rates, interest rates, equity price levels, the fair value of financial instruments and contracts, market prices for base and precious metals, energy complexes and other commodities, the diversification effects among Grant Park’s open positions and the liquidity of the markets in which it trades.
Grant Park rapidly acquires and liquidates both long and short positions in a wide range of different markets. Consequently,
it is not possible to predict how a particular future market scenario will affect performance. Grant Park’s current trading advisors all employ trend-following strategies that rely on sustained movements in price. Erratic, choppy, sideways trading markets and sharp reversals in movements can materially and adversely affect Grant Park’s results. Grant Park’s past performance is not necessarily indicative of its future results.
Value at risk is a measure of the maximum amount that Grant Park could reasonably be expected to lose in a given market
sector in a given day. However, the inherent uncertainty of Grant Park’s speculative trading and the recurrence in the markets traded by Grant Park of market movements far exceeding expectations could result in actual trading or non-trading losses far beyond the indicated value at risk or Grant Park’s experience to date. This risk is often referred to as the risk of ruin. In light of the foregoing as well as the risks and uncertainties intrinsic to all future projections, the inclusion of the quantification included in this section should not be considered to constitute any assurance or representation that Grant Park’s losses in any market sector will be limited to value at risk or by Grant Park’s attempts to manage its market risk. Moreover, value at risk may be defined differently as used by other commodity pools or in other contexts.
Materiality, as used in this section, is based on an assessment of reasonably possible market movements and the potential losses caused by such movements, taking into account the leverage, and multiplier features of Grant Park’s market sensitive instruments.
The following quantitative and qualitative disclosures regarding Grant Park’s market risk exposures contain forward-looking statements. All quantitative and qualitative disclosures in this section are deemed to be forward-looking statements, except for statements of historical fact and descriptions of how Grant Park manages its risk exposure. Grant Park’s primary market risk exposures, as well as the strategies used and to be used by its trading advisors for managing such exposures are subject to numerous uncertainties, contingencies and risks, any one of which could cause the actual results of Grant Park’s risk controls to differ materially from the objectives of such strategies. Government interventions, defaults and expropriations, illiquid markets, the emergence of dominant fundamental factors, political upheavals, changes in historical price relationships, an influx of new market participants, increased regulation and many other factors could result in material losses as well as in material changes to the risk exposures and the risk management strategies of Grant Park. Grant Park’s current market exposure and/or risk management strategies may not be effective in either the short- or long-term and may change materially. Quantitative Market Risk Trading Risk
Grant Park’s approximate risk exposure in the various market sectors traded by its trading advisors is quantified below in terms of value at risk. Due to Grant Park’s mark-to-market accounting, any loss in the fair value of Grant Park’s open positions is directly reflected in Grant Park’s earnings, realized or unrealized.
Exchange maintenance margin requirements have been used by Grant Park as the measure of its value at risk. Maintenance
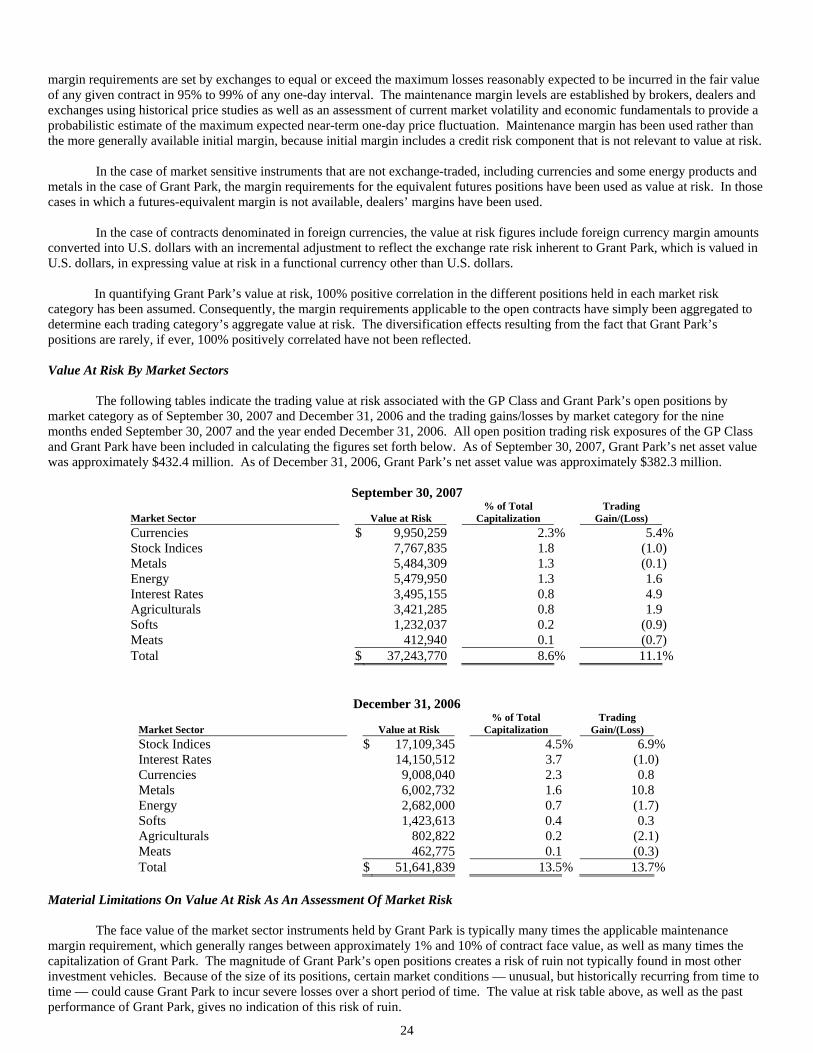
24
margin requirements are set by exchanges to equal or exceed the maximum losses reasonably expected to be incurred in the fair value of any given contract in 95% to 99% of any one-day interval. The maintenance margin levels are established by brokers, dealers and exchanges using historical price studies as well as an assessment of current market volatility and economic fundamentals to provide a probabilistic estimate of the maximum expected near-term one-day price fluctuation. Maintenance margin has been used rather than the more generally available initial margin, because initial margin includes a credit risk component that is not relevant to value at risk.
In the case of market sensitive instruments that are not exchange-traded, including currencies and some energy products and metals in the case of Grant Park, the margin requirements for the equivalent futures positions have been used as value at risk. In those cases in which a futures-equivalent margin is not available, dealers’ margins have been used.
In the case of contracts denominated in foreign currencies, the value at risk figures include foreign currency margin amounts converted into U.S. dollars with an incremental adjustment to reflect the exchange rate risk inherent to Grant Park, which is valued in U.S. dollars, in expressing value at risk in a functional currency other than U.S. dollars.
In quantifying Grant Park’s value at risk, 100% positive correlation in the different positions held in each market risk
category has been assumed. Consequently, the margin requirements applicable to the open contracts have simply been aggregated to determine each trading category’s aggregate value at risk. The diversification effects resulting from the fact that Grant Park’s positions are rarely, if ever, 100% positively correlated have not been reflected. Value At Risk By Market Sectors
The following tables indicate the trading value at risk associated with the GP Class and Grant Park’s open positions by market category as of September 30, 2007 and December 31, 2006 and the trading gains/losses by market category for the nine months ended September 30, 2007 and the year ended December 31, 2006. All open position trading risk exposures of the GP Class and Grant Park have been included in calculating the figures set forth below. As of September 30, 2007, Grant Park’s net asset value was approximately $432.4 million. As of December 31, 2006, Grant Park’s net asset value was approximately $382.3 million.
September 30, 2007
Market Sector Value at Risk % of Total
Capitalization Trading
Gain/(Loss)
Currencies $ 9,950,259 2.3% 5.4% Stock Indices 7,767,835 1.8 (1.0) Metals 5,484,309 1.3 (0.1) Energy 5,479,950 1.3 1.6 Interest Rates 3,495,155 0.8 4.9 Agriculturals 3,421,285 0.8 1.9 Softs 1,232,037 0.2 (0.9) Meats 412,940 0.1 (0.7) Total $ 37,243,770 8.6% 11.1%
December 31, 2006
Market Sector Value at Risk % of Total
Capitalization Trading
Gain/(Loss)
Stock Indices $ 17,109,345 4.5% 6.9% Interest Rates 14,150,512 3.7 (1.0) Currencies 9,008,040 2.3 0.8 Metals 6,002,732 1.6 10.8 Energy 2,682,000 0.7 (1.7) Softs 1,423,613 0.4 0.3 Agriculturals 802,822 0.2 (2.1) Meats 462,775 0.1 (0.3) Total $ 51,641,839 13.5% 13.7%
Material Limitations On Value At Risk As An Assessment Of Market Risk
The face value of the market sector instruments held by Grant Park is typically many times the applicable maintenance margin requirement, which generally ranges between approximately 1% and 10% of contract face value, as well as many times the capitalization of Grant Park. The magnitude of Grant Park’s open positions creates a risk of ruin not typically found in most other investment vehicles. Because of the size of its positions, certain market conditions — unusual, but historically recurring from time to time — could cause Grant Park to incur severe losses over a short period of time. The value at risk table above, as well as the past performance of Grant Park, gives no indication of this risk of ruin.
25
Non-Trading Risk
Grant Park has non-trading market risk on its foreign cash balances not needed for margin. However, these balances, as well as the market risk they represent, are immaterial. Grant Park also has non-trading market risk as a result of investing a substantial portion of its available assets in U.S. Treasury bills and short term investments. The market risk represented by these investments is also immaterial.
Qualitative Market Risk Trading Risk
The following were the primary trading risk exposures of Grant Park as of September 30, 2007, by market sector. Currencies
Exchange rate risk is a significant market exposure of Grant Park. Grant Park’s currency exposure is due to exchange rate
fluctuations, primarily fluctuations that disrupt the historical pricing relationships between different currencies and currency pairs. These fluctuations are influenced by interest rate changes as well as political and general economic conditions. Grant Park trades in a large number of currencies, including cross-rates, which are positions between two currencies other than the U.S. dollar. The general partner anticipates that the currency sector will remain one of the primary market exposures for Grant Park for the foreseeable future. As of September 30, 2007, Grant Park was positioned to benefit from the effects of a weakening dollar against most major and minor currencies. The exceptions to this were long positions versus the U.S. dollar in the Japanese yen and the South African rand.
Stock Indices
Grant Park’s primary equity exposure is due to equity price risk in the G-7 countries as well as other jurisdictions including
Hong Kong, Taiwan, and Australia. The stock index futures contracts currently traded by Grant Park are generally limited to futures on broadly based indices, although Grant Park may trade narrow-based stock index futures contracts in the future. As of September 30, 2007, Grant Park’s primary exposures were in the Asian markets; long the Hang Sang and Nikkei and long the U.S. indices. Grant Park is primarily exposed to the risk of adverse price trends or static markets in the major U.S., European and Asian indices. Static markets would not cause major market changes but would make it difficult for Grant Park to avoid being “whipsawed” into numerous small losses.
Metals
Grant Park’s metals market exposure is due to fluctuations in the price of both precious metals, including gold and silver, as
well as base metals including aluminum, copper, nickel and zinc. As of September 30, 2007, long positions in gold, silver, platinum and copper accounted for Grant Park’s metal exposure in the precious metals while minor short positions in aluminum and zinc represented Grant Park’s exposure in the base metals.
Energy
Grant Park’s primary energy market exposure is due to gas and oil price movements, often resulting from political
developments in the Middle East, Nigeria, Russia and Venezuela. As of September 30, 2007, the energy market exposure of Grant Park consisted of minor short positions in natural gas and minor long positions in crude and crude products. Oil and gas prices can be volatile and substantial profits and losses have been and are expected to continue to be experienced in this market.
Interest Rates
Interest rate risk is the principal market exposure of Grant Park. Interest rate movements directly affect the price of the
futures positions held by Grant Park and indirectly the value of its stock index and currency positions. Interest rate movements in one country as well as relative interest rate movements between countries materially impact Grant Park’s profitability. Grant Park’s primary interest rate exposure is due to interest rate fluctuations in the United States and the other G-7 countries. However, Grant Park also takes futures positions on the government debt of smaller nations, such as Australia. The general partner anticipates that G-7 interest rates will remain the primary market exposure of Grant Park for the foreseeable future. As of September 30, 2007, Grant Park’s interest rate exposure was predominantly long both the long end and the short end of the yield curve around the globe with the exception of Australia where Grant Park was short interest rates across the curve.
Agricultural / Softs
Grant Park’s primary commodities exposure is due to agricultural price movements, which are often directly affected by
26
severe or unexpected weather conditions. Corn, soybean oil, soybeans, wheat and coffee accounted for Grant Park’s long commodity exposure while sugar, hogs and pork bellies accounted for Grant Park’s short positions as of September 30, 2007. Non-Trading Risk Exposure
The following were the only non-trading risk exposures of Grant Park as of September 30, 2007.
Foreign Currency Balances
Grant Park’s primary foreign currency balances are in Japanese yen, British pounds, Euros and Australian dollars. The trading advisors regularly convert foreign currency balances to U.S. dollars in an attempt to control Grant Park’s non-trading risk.
Cash Management
Grant Park maintains a portion of its assets at its clearing brokers as well as at Lake Forest Bank & Trust Company and from time to time at Harris N.A. These assets, which may range from 5% to 25% of Grant Park’s value, are held in U.S. Treasury securities and/or Treasury repurchase agreements. The balance of Grant Park’s assets, which range from 75% to 95%, are invested in investment grade money market instruments purchased and managed at Middleton Dickinson Capital Management, LLC which are held in a separate, segregated account at State Street Bank and Trust Company or are purchased directly through BMO Capital Markets Corporation, a member of BMO Financial Group. Violent fluctuations in prevailing interest rates could cause immaterial mark-to-market losses on Grant Park’s cash management income.
Managing Risk Exposure
The general partner monitors and controls Grant Park’s risk exposure on a daily basis through financial, credit and risk management monitoring systems and, accordingly, believes that it has effective procedures for evaluating and limiting the credit and market risks to which Grant Park is subject.
The general partner monitors Grant Park’s performance and the concentration of its open positions and consults with the trading advisors concerning Grant Park’s overall risk profile. If the general partner felt it necessary to do so, the general partner could require the trading advisors to close out individual positions as well as enter positions traded on behalf of Grant Park. However, any intervention would be a highly unusual event. The general partner primarily relies on the trading advisors’ own risk control policies while maintaining a general supervisory overview of Grant Park’s market risk exposures. The trading advisors apply their own risk management policies to their trading. The trading advisors often follow diversification guidelines, margin limits and stop loss points to exit a position. The trading advisors’ research of risk management often suggests ongoing modifications to their trading programs.
As part of the general partner’s risk management, the general partner periodically meets with the trading advisors to discuss their risk management and to look for any material changes to the trading advisors’ portfolio balance and trading techniques. The trading advisors are required to notify the general partner of any material changes to their programs. General
From time to time, certain regulatory or self-regulatory organizations have proposed increased margin requirements on futures contracts. Because Grant Park generally will use a small percentage of assets as margin, Grant Park does not believe that any increase in margin requirements, as proposed, will have a material effect on Grant Park’s operations.
Item 4. Controls and Procedures
As of the end of the period covered by this report, the general partner carried out an evaluation, under the supervision and with the participation of the general partner’s management, including its principal executive officer and principal financial officer, of the effectiveness of the design and operation of Grant Park’s disclosure controls and procedures as contemplated by Rule 13a-15 of the Securities Exchange Act of 1934, as amended. Based on and as of the date of that evaluation, the general partner’s principal executive officer and principal financial officer concluded that Grant Park’s disclosure controls and procedures are effective, in all material respects, in timely alerting them to material information relating to Grant Park required to be included in the reports required to be filed or submitted by Grant Park with the SEC under the Exchange Act.
There was no change in Grant Park's internal control over financial reporting in the quarter ended September 30, 2007 that
has materially affected, or is reasonably likely to materially affect, Grant Park's internal control over financial reporting.
27
PART II- OTHER INFORMATION
Item 1A. Risk Factors There have been no material changes to the risk factors relating to Grant Park from those previously disclosed in Grant Park’s Form 10-K for its fiscal year ended December 31, 2006, in response to Item 1A to Part 1 of Form 10-K.
Item 2. Unregistered Sales of Equity Securities and Use of Proceeds On June 30, 2003, the Securities and Exchange Commission declared effective Grant Park’s Registration Statement on Form S-1 (Reg. No. 333-104317), pursuant to which Grant Park registered for public offering $20 million in aggregate amount of Class A Limited Partnership Units and $180 million in aggregate amount of Class B Limited Partnership Units. Also as of June 30, 2003, Grant Park adopted the Third Amended and Restated Limited Partnership Agreement, which included modifications required under the Guidelines for the Registration of Commodity Pool Programs promulgated by the North American Securities Administrators Association, Inc. and requested by various state securities regulators in connection with Grant Park’s public offering. Grant Park subsequently registered up to an additional $200 million in aggregate amount of Class A and Class B Limited Partnership Units for sale on a Registration Statement on Form S-1 (Reg. No. 333-113297) on March 30, 2004, and an additional $700 million in aggregate amount of Class A and Class B Limited Partnership Units for sale on a Registration Statement on Form S-1 (File No. 333-119338) on December 1, 2004. Class A Limited Partnership Units and Class B Limited Partnership Units are being offered on a continuous basis at subsequent closing dates at a price equal to the net asset value per unit as of the close of business on each applicable closing date, which is the last business day of each month. The close of business on July 31, 2003 marked the initial closing date of the public offering. The lead selling agents for the offering are UBS Financial Services Inc., A.G. Edwards & Sons, Inc. and Oppenheimer & Co. Inc. As of the close of business on July 1, 2007, the Class A Limited Partnership Units were offered at $1,234.32 with 1,457.72 units being sold, and the Class B Limited Partnership Units were offered at $1,080.86 with 7,551.91 units being sold. As of the close of business on August 1, 2007, the Class A Limited Partnership Units were offered at $1,188.36 with 283.59 units being sold, and the Class B Limited Partnership Units were offered at $1,039.87 with 4,566.69 units being sold. As of the close of business on September 1, 2007, the Class A Limited Partnership Units were offered at $1,144.28 with 848.94 units being sold, and the Class B Limited Partnership Units were offered at $1,000.59 with 4,061.10 units being sold. Expenses incurred in connection with the organization and offering of the units, which are paid by the general partner and then reimbursed by Grant Park on a monthly basis (with such reimbursement limited to 0.2% annually of the net asset value of the Class A Units and through August 31, 2005, 0.9% annually, and effective September 1, 2005, 0.6% annually of the Class B Units) amounted to a total of approximately $248,854 for the three months ended September 30, 2007. The proceeds of the offering are deposited in Grant Park’s bank and brokerage accounts for the purpose of engaging in trading activities in accordance with Grant Park’s trading policies and its trading advisors’ respective trading strategies.
28
Issuer Purchases of Equity Securities
(e) The following table provides information regarding the total Class A and Class B units redeemed by Grant Park during the three months ended September 30, 2007.
(a) (b) (a) (b) (c) (d)
Period
Total Number
of Class A Units
Redeemed
Average Price Paid per Unit
Total Number
of Class B Units
Redeemed
Average Price Paid per Unit
Total Number of Units Redeemed as
Part of Publicly Announced Plans or
Programs(1)
Maximum Number of Units that May Yet Be Redeemed Under
the Plans/Program(1)
07/01/07 through 07/31/07
139.25
$1,188.36
2,577.42
$1,039.87
2,716.67
(2)
08/01/07 through 08/31/07
991.83
$1,144.28
1,973.06
$1,000.59
2,964.89
(2)
09/01/07 through 09/30/07
568.49
$1,244.71
2,427.39
$1,087.63
2,995.88
(2)
Total
1,699.57
$1,192.45
6,977.87
$1,042.70
8,677.44
(2)
_________________ (1) As previously disclosed, pursuant to Grant Park’s Limited Partnership Agreement, investors in Grant Park may redeem their units for an amount equal to the net asset value per unit at the close of business on the last business day of any calendar month if at least 10 days prior to the redemption date, or at an earlier date if required by the investor’s selling agent, the General Partner receives a written request for redemption from the investor. The General Partner may permit earlier redemptions in its discretion. (2) Not determinable.
29
Item 6. Exhibits (a) Exhibits
31.1 Certification of Principal Executive Officer Pursuant to Rule 13a-14(a) under the Securities Exchange Act
of 1934
31.2 Certification of Principal Financial Officer Pursuant to Rule 13a-14(a) under the Securities Exchange Act
of 1934
32.1 Certification Pursuant to 18 U.S.C. Section 1350, As Adopted Pursuant to Section 906 of the Sarbanes-
Oxley Act of 2002
1
30
SIGNATURES
Pursuant to the requirements of the Securities Exchange Act of 1934, the Registrant has duly caused this report to be signed
on its behalf by the undersigned thereunto duly authorized. GRANT PARK FUTURES FUND LIMITED PARTNERSHIP Date: November 2, 2007 by: Dearborn Capital Management, L.L.C. its general partner By: /s/ David M. Kavanagh David M. Kavanagh President (principal executive officer) By: /s/ Maureen O’Rourke Maureen O’Rourke Chief Financial Officer (principal financial and accounting officer)
2
31
EXHIBIT 31.1
CERTIFICATION I, David M. Kavanagh, certify that: 1. I have reviewed this quarterly report on Form 10-Q of Grant Park Futures Fund Limited Partnership; 2. Based on my knowledge, this report does not contain any untrue statement of a material fact or omit to state a material fact
necessary to make the statements made, in light of the circumstances under which such statements were made, not misleading with respect to the period covered by this report;
3. Based on my knowledge, the financial statements, and other financial information included in this report, fairly present in all
material respects the financial condition, results of operations and cash flows of the registrant as of, and for, the periods presented in this report;
4. The registrant’s other certifying officer and I are responsible for establishing and maintaining disclosure controls and
procedures (as defined in Exchange Act Rules 13a-15(e) and 15d-15(e)) for the registrant and have: a) Designed such disclosure controls and procedures, or caused such disclosure controls and procedures to be designed
under our supervision, to ensure that material information relating to the registrant, including its consolidated subsidiaries, is made known to us by others within those entities, particularly during the period in which this report is being prepared;
b) Evaluated the effectiveness of the registrant’s disclosure controls and procedures and presented in this report our
conclusions about the effectiveness of the disclosure controls and procedures, as of the end of the period covered by this report based on such evaluation; and
c) Disclosed in this report any change in the registrant’s internal control over financial reporting that occurred during
the registrant’s most recent fiscal quarter (the registrant’s fourth fiscal quarter in the case of an annual report) that has materially affected, or is reasonably likely to materially affect, the registrant’s internal control over financial reporting; and
5. The registrant’s other certifying officer and I have disclosed, based on our most recent evaluation of internal control over
financial reporting, to the registrant’s auditors and the audit committee of registrant’s board of directors (or persons performing the equivalent functions): a) All significant deficiencies and material weaknesses in the design or operation of internal control over financial
reporting which are reasonably likely to adversely affect the registrant’s ability to record, process, summarize and report financial information; and
b) Any fraud, whether or not material, that involves management or other employees who have a significant role in the
registrant’s internal control over financial reporting.
Date: November 2, 2007 /s/ DAVID M. KAVANAGH David M. Kavanagh President (principal executive officer) Dearborn Capital Management, L.L.C. General Partner
32
EXHIBIT 31.2
CERTIFICATION
I, Maureen O’Rourke, certify that: 1. I have reviewed this quarterly report on Form 10-Q of Grant Park Futures Fund Limited Partnership; 2. Based on my knowledge, this report does not contain any untrue statement of a material fact or omit to state a material fact
necessary to make the statements made, in light of the circumstances under which such statements were made, not misleading with respect to the period covered by this report;
3. Based on my knowledge, the financial statements, and other financial information included in this report, fairly present in all
material respects the financial condition, results of operations and cash flows of the registrant as of, and for, the periods presented in this report;
4. The registrant’s other certifying officer and I are responsible for establishing and maintaining disclosure controls and
procedures (as defined in Exchange Act Rules 13a-15(e) and 15d-15(e)) for the registrant and have: a) Designed such disclosure controls and procedures, or caused such disclosure controls and procedures to be designed
under our supervision, to ensure that material information relating to the registrant, including its consolidated subsidiaries, is made known to us by others within those entities, particularly during the period in which this quarterly report is being prepared;
b) Evaluated the effectiveness of the registrant’s disclosure controls and procedures and presented in this report our
conclusions about the effectiveness of the disclosure controls and procedures, as of the end of the period covered by this report based on such evaluation; and
c) Disclosed in this report any change in the registrant’s internal control over financial reporting that occurred during
the registrant’s most recent fiscal quarter (the registrant’s fourth fiscal quarter in the case of an annual report) that has materially affected, or is reasonably likely to materially affect, the registrant’s internal control over financial reporting; and
5. The registrant’s other certifying officer and I have disclosed, based on our most recent evaluation of internal control over
financial reporting, to the registrant’s auditors and the audit committee of registrant’s board of directors (or persons performing the equivalent functions): a) All significant deficiencies and material weaknesses in the design or operation of internal control over financial
reporting which are reasonably likely to adversely affect the registrant’s ability to record, process, summarize and report financial information; and
b) Any fraud, whether or not material, that involves management or other employees who have a significant role in the
registrant’s internal control over financial reporting. Date: November 2, 2007 /s/ MAUREEN O’ROURKE Maureen O’Rourke Chief Financial Officer Dearborn Capital Management, L.L.C. General Partner
33
EXHIBIT 32.1
CERTIFICATION PURSUANT TO 18 U.S.C. SECTION 1350,
AS ADOPTED PURSUANT TO SECTION 906 OF THE SARBANES-OXLEY ACT OF 2002
Pursuant to 18 U.S.C. § 1350, as created by Section 906 of the Sarbanes-Oxley Act of 2002, each
of the undersigned principal executive officer of Dearborn Capital Management, L.L.C., the general partner (the “General Partner”) of Grant Park Futures Fund Limited Partnership (“Grant Park”), and principal financial officer of the General Partner hereby certifies that:
(1) the accompanying Quarterly Report on Form 10-Q of Grant Park for the quarterly period ended September 30, 2007 (the “Report”) fully complies with the requirements of section 13(a) or 15(d), as applicable, of the Securities Exchange Act of 1934, as amended; and
(2) the information contained in the Report fairly presents, in all material respects, the
financial condition and results of operations of Grant Park. Dated: November 2, 2007 /s/ David M. Kavanagh David M. Kavanagh President (principal executive officer) Dearborn Capital Management, L.L.C. General Partner /s/ Maureen O’Rourke Maureen O’Rourke Chief Financial Officer Dearborn Capital Management, L.L.C. General Partner
This certification accompanies this Report pursuant to Section 906 of the Sarbanes-Oxley Act of 2002 and shall not be deemed filed by Grant Park for purposes of Section 18 of the Securities Exchange Act of 1934, as amended.