Embed Size (px)
DESCRIPTION
Grant Park Fund 10Q 09.30.08
Citation preview
UNITED STATES SECURITIES AND EXCHANGE COMMISSION
Washington, D.C. 20549
FORM 10-Q
ý QUARTERLY REPORT PURSUANT TO SECTION 13 OR 15(d) OF THE SECURITIES EXCHANGE ACT OF 1934
For the Quarterly Period Ended: September 30, 2008
o TRANSITION REPORT PURSUANT TO SECTION 13 OR 15(d) OF
THE SECURITIES EXCHANGE ACT OF 1934
For the Transition Period From to .
Commission File Number: 0-50316
Grant Park Futures Fund Limited Partnership
(Exact name of registrant as specified in its charter)
Illinois 36-3596839 (State or other jurisdiction of incorporation or organization)
(I.R.S. Employer Identification No.)
c/o Dearborn Capital Management, L.L.C.
555 West Jackson Boulevard, Suite 600 Chicago, Illinois 60661
(Address of principal executive offices, including zip code) Registrant’s telephone number, including area code: (312) 756-4450
Indicate by check mark whether the Registrant: (1) has filed all reports required to be filed by Section 13 or 15(d) of the
Securities Exchange Act of 1934 during the preceding 12 months (or for such shorter period that the registrant was required to file such reports), and (2) has been subject to such filing requirements for the past 90 days. Yes ý No o
Indicate by check mark whether the Registrant is a large accelerated filer, an accelerated filer, a non-accelerated filer or a
small reporting company. See definition of “accelerated filer”, “large accelerated filer” and “smaller reporting company” in Rule 12b-2 of the Exchange Act. (Check one): Large accelerated filer o Accelerated filer o Non-accelerated filer ý Smaller reporting company o
Indicate by check mark whether the Registrant is a shell company (as defined in Rule 12b-2 of the Securities Exchange Act
of 1934). Yes o No ý
GRANT PARK FUTURES FUND LIMITED PARTNERSHIP
QUARTER ENDED September 30, 2008
INDEX
PART I - FINANCIAL INFORMATION Item 1. Financial Statements Statements of Financial Condition as of September 30, 2008 (unaudited)
and December 31, 2007 (audited) 1
Condensed Schedule of Investments as of September 30, 2008 (unaudited) 2 Condensed Schedule of Investments as of December 31, 2007 (audited) 5 Statements of Operations for the three and nine months ended September 30, 2008 and 2007 (unaudited) 7 Statements of Cash Flows for the nine months ended September 30, 2008 and 2007 (unaudited) 8 Statements of Changes in Partners’ Capital (Net Asset Value)
for the three and nine months ended September 30, 2008 and 2007 (unaudited) 9
Notes to Financial Statements (unaudited) 10 Item 2. Management’s Discussion and Analysis of Financial Condition and Results of Operations 18 Item 3. Quantitative and Qualitative Disclosures About Market Risk 26 Item 4T. Controls and Procedures 30 PART II - OTHER INFORMATION Item 1A. Risk Factors 31 Item 2. Unregistered Sales of Equity Securities and Use of Proceeds 31 Item 6. Exhibits 33 SIGNATURES 34CERTIFICATIONS 35
2
PART I - FINANCIAL INFORMATION
Item 1. Financial Statements Grant Park Futures Fund Limited Partnership Statements of Financial Condition
September 30,
2008 December 31,
2007 (Unaudited) (Audited) Assets Equity in brokers’ trading accounts:
U.S. Government securities, at fair value .................................................................. $ 68,598,497 $ 61,148,504 Cash ........................................................................................................................ 8,113,222 5,227,545 Unrealized gain on open contracts, net...................................................................... 1,196,482 6,136,840
Deposits with brokers........................................................................................... 77,908,201 72,512,889 Cash and cash equivalents............................................................................................ 206,725,128 160,199,532 Commercial paper (cost, plus accrued interest at September 30, 2008 - $9,902,203, and
December 31, 2007 - $27,869,290)........................................................................... 9,902,203 27,869,290 Government-sponsored enterprises (cost, plus accrued interest at September 30, 2008 -
$184,612,965, and December 31, 2007 - $105,413,285)............................................ 184,612,965 105,413,285 Investment in Dearborn Select Master Fund, SPC......................................................... 105,171,951 98,629,036 Interest receivable ........................................................................................................ 672,536 1,838,411 Receivable from General Partner.................................................................................. – 750,000
Total assets ......................................................................................................... $ 584,992,984 $ 467,212,443 Liabilities and Partners’ Capital Liabilities
Brokerage commission payable ................................................................................ $ 3,346,456 $ 2,769,915 Accrued incentive fees ............................................................................................. 111,614 2,503,135 Organization and offering costs payable ................................................................... 259,695 206,208 Accrued operating expenses ..................................................................................... 119,492 96,082 Pending partner additions......................................................................................... 11,666,029 3,426,126 Redemptions payable ............................................................................................... 3,670,412 2,525,181
Total liabilities.................................................................................................... 19,173,698 11,526,647 Partners’ Capital
General Partner (4,149.96 and 3,671.69 units outstanding at September 30, 2008 and December 31, 2007, respectively) ......................................................................... 5,988,355 4,807,965
Limited Partners Class A (50,727.30 and 51,371.93 units outstanding at September 30, 2008 and
December 31, 2007, respectively) ..................................................................... 73,199,023 67,269,942 Class B (388,962.03 and 335,708.69 units outstanding at September 30, 2008 and
December 31, 2007, respectively) ..................................................................... 486,631,908 383,607,889 Total partners’ capital.................................................................................... 565,819,286 455,685,796
Total liabilities and partners’ capital ............................................................. $ 584,992,984 $ 467,212,443
The accompanying notes are an integral part of these financial statements.
3
Grant Park Futures Fund Limited Partnership Condensed Schedule of Investments September 30, 2008 (Unaudited)
Unrealized gain/(loss) on
open long contracts
Percent of Partners’ Capital
Unrealized gain/(loss) on
open short contracts
Percent of Partners’ Capital
Net unrealized gain/(loss) on
open contracts
Percent of Partners’ Capital
Futures Contracts * U.S. Futures Positions:
Currencies............................... $ 36,468 ** $ 283,395 0.1% $ 319,863 0.1% Energy..................................... (1,838,492) (0.3)% 1,980,094 0.3% 141,602 ** Grains ..................................... (3,674,729) (0.7)% 3,947,127 0.7% 272,398 ** Interest rates ........................... (614,486) (0.1)% (1,871) ** (616,357) (0.1)% Meats ...................................... 25,630 ** 493,166 0.1% 518,796 0.1% Metals ..................................... (39,980) ** 197,010 ** 157,030 ** Soft commodities ................... 8,108 ** 1,528,452 0.3% 1,536,560 0.3% Stock indices .......................... 40,430 ** 809,776 0.1% 850,206 0.1%
Total U.S. Futures Positions ....... (6,057,051) 9,237,149
3,180,098
Foreign Futures Positions: Energy..................................... (979,305) (0.2)% 1,513,850 0.3% 534,545 0.1% Grains ..................................... − ** 44,477 ** 44,477 ** Interest rates ........................... 1,134,077 0.2% (247,300) ** 886,777 0.2% Metals ..................................... (8,750,428) (1.5)% 10,170,419 1.7% 1,419,991 0.2% Soft commodities ................... (10,400) ** 29,280 ** 18,880 ** Stock indices .......................... (491,276) (0.1)% 2,679,821 0.5% 2,188,545 0.4%
Total Foreign Futures Positions.. (9,097,332)
14,190,547
5,093,215
Total Futures Contracts ........... $ (15,154,383) (2.7)% $ 23,427,696 4.1% $ 8,273,313 1.4%
Forward Contracts * Currencies............................... $ (9,032,577) (1.6)% $ 2,051,231 0.4% $ (6,981,346) (1.2)%
Total Futures and Forward Contracts $ (24,186,960) (4.3)% $ 25,478,927 4.5% $ 1,291,967 0.2% * No individual futures, forward and option on futures contract position constituted greater than 1 percent of partners’ capital. Accordingly, the
number of contracts and expiration dates are not presented.
** Represents less than 0.1% of partners’ capital.
Commercial paper
Face Value Maturity
Date Description Fair Value Percent of
Partners' Capital
$ 4,345,000 10/14/2008 Bank of America Corp. $ 4,340,544 0.8% 5,600,000 12/19/2008 Diageo Capital PLC 5,561,659 1.0%
Total Commercial paper $ 9,902,203 1.8%
4
Grant Park Futures Fund Limited Partnership Condensed Schedule of Investments (Continued) September 30, 2008 (Unaudited)
Government-sponsored enterprises
Face Value Maturity
Date Description Fair Value Percent of
Partners' Capital
$ 12,000,000 11/24/2008 Federal Home Loan Banks $ 12,006,323 2.1% 8,000,000 12/1/2008 Federal Home Loan Banks 8,017,200 1.4%
11,500,000 12/5/2008 Federal Home Loan Banks 11,450,374 2.0% 10,000,000 12/26/2008 Federal Home Loan Mortgage Corp. 10,004,592 1.8% 10,000,000 1/2/2009 Federal Farm Credit Banks 10,062,278 1.8%
8,000,000 1/14/2009 Federal Home Loan Banks 8,045,434 1.4% 8,000,000 4/1/2009 Federal Agricultural Mortgage Corp. 8,088,723 1.4% 8,000,000 4/7/2009 Federal Home Loan Mortgage Corp. 8,090,867 1.4%
10,000,000 4/15/2009 Federal Home Loan Banks 9,844,289 1.8% 10,000,000 4/24/2009 Federal Home Loan Banks 10,000,108 1.8%
8,000,000 4/24/2009 Federal Agricultural Mortgage Corp. 8,079,733 1.4% 10,000,000 4/30/2009 Federal Home Loan Banks 10,110,104 1.8% 12,000,000 5/20/2009 Federal Home Loan Banks 12,033,031 2.1%
8,000,000 6/30/2009 Federal Home Loan Banks 8,060,667 1.4% 8,000,000 7/14/2009 Federal Home Loan Banks 8,052,755 1.4%
10,000,000 8/20/2009 Federal Home Loan Banks 10,034,167 1.8% 8,000,000 8/28/2009 Federal Home Loan Banks 8,022,367 1.4%
12,500,000 10/19/2009 Federal Home Loan Mortgage Corp. 12,511,370 2.2% 12,000,000 12/30/2009 Federal Home Loan Banks 12,098,583 2.2%
Total Government-sponsored enterprises $ 184,612,965 32.6%
U.S. Government Securities ***
Face Value Maturity
Date Description Fair Value Percent of
Partners' Capital
$ 43,900,000 10/2/2008 U.S. Treasury bills (cost $43,849,240) $ 43,899,732 7.8% 24,700,000 10/9/2008 U.S. Treasury bills (cost $24,653,688) 24,698,765 4.3%
Total U.S. Government Securities $ 68,598,497 12.1%
*** Pledged as collateral for the trading of futures, forward and option on futures contracts.
Investment in Dearborn Select Master Fund, SPC
Percent of Partners' Capital Cost Fair Value Investment Objective
Liquidity Provision
18.6% $ 89,211,588 $ 105,171,951
Speculative trading of
futures contracts, options on
futures contracts, forward contracts, swaps, derivatives
and synthetics
Monthly or at such other times as the
Directors may agree
5
Grant Park Futures Fund Limited Partnership Condensed Schedule of Investments (Continued) September 30, 2008 (Unaudited) Proportional Share of Investments in Dearborn Select Master Fund, SPC as of September 30, 2008 (1)
U.S. Government Securities
Face Value Maturity
Date Description Fair Value Percent of
Partners' Capital
$ 7,500,000 10/9/2008 U.S. Treasury bills (cost $7,491,533) $ 7,499,625 1.3%
Total U.S. Government Securities $ 7,499,625
(1) Represents Grant Park Futures Fund Limited Partnership’s proportional share of Dearborn Select Master Fund, SPC’s individual underlying investments which exceed 1% of Grant Park Futures Fund Limited Partnership’s partners’ capital at September 30, 2008. The accompanying notes are an integral part of these financial statements.
6
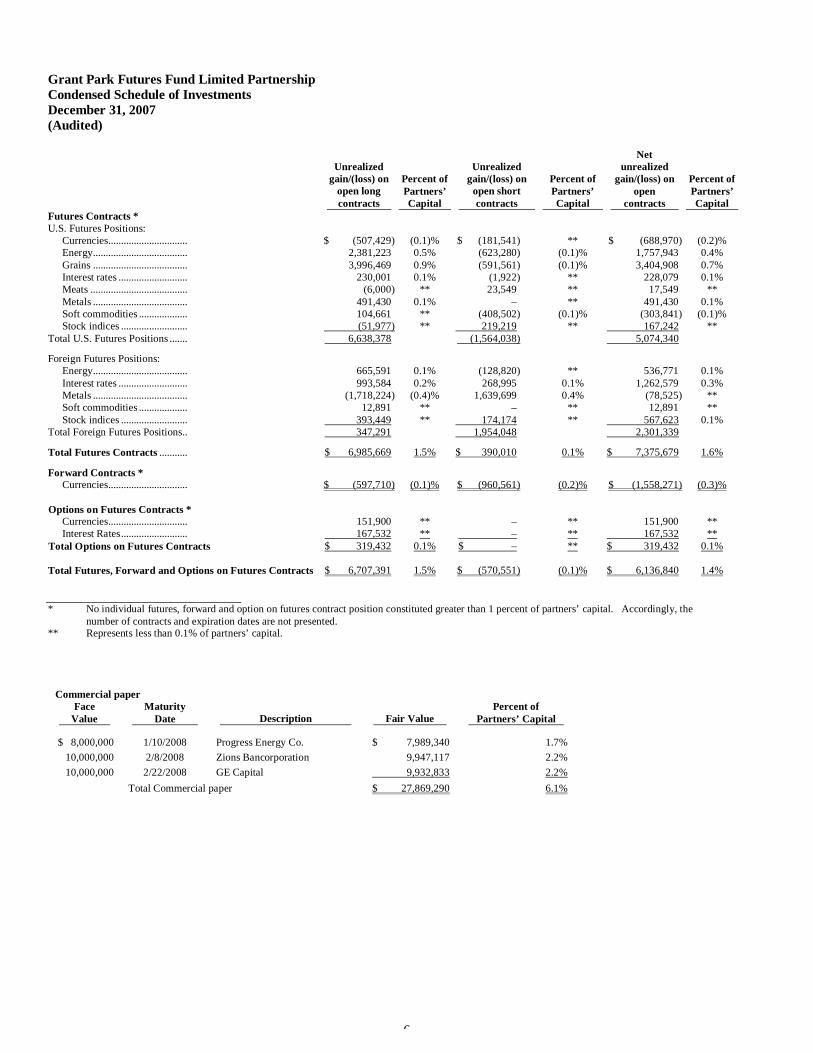
Grant Park Futures Fund Limited Partnership Condensed Schedule of Investments December 31, 2007 (Audited)
Unrealized gain/(loss) on
open long contracts
Percent of Partners’ Capital
Unrealized gain/(loss) on
open short contracts
Percent of Partners’ Capital
Net unrealized
gain/(loss) on open
contracts
Percent of Partners’ Capital
Futures Contracts * U.S. Futures Positions:
Currencies............................... $ (507,429) (0.1)% $ (181,541) ** $ (688,970) (0.2)% Energy..................................... 2,381,223 0.5% (623,280) (0.1)% 1,757,943 0.4% Grains ..................................... 3,996,469 0.9% (591,561) (0.1)% 3,404,908 0.7% Interest rates ........................... 230,001 0.1% (1,922) ** 228,079 0.1% Meats ...................................... (6,000) ** 23,549 ** 17,549 ** Metals ..................................... 491,430 0.1% – ** 491,430 0.1% Soft commodities ................... 104,661 ** (408,502) (0.1)% (303,841) (0.1)% Stock indices .......................... (51,977) ** 219,219 ** 167,242 **
Total U.S. Futures Positions ....... 6,638,378 (1,564,038)
5,074,340
Foreign Futures Positions: Energy..................................... 665,591 0.1% (128,820) ** 536,771 0.1% Interest rates ........................... 993,584 0.2% 268,995 0.1% 1,262,579 0.3% Metals ..................................... (1,718,224) (0.4)% 1,639,699 0.4% (78,525) ** Soft commodities ................... 12,891 ** – ** 12,891 ** Stock indices .......................... 393,449 ** 174,174 ** 567,623 0.1%
Total Foreign Futures Positions.. 347,291
1,954,048
2,301,339
Total Futures Contracts ........... $ 6,985,669 1.5% $ 390,010 0.1% $ 7,375,679 1.6%
Forward Contracts * Currencies............................... $ (597,710) (0.1)% $ (960,561) (0.2)% $ (1,558,271) (0.3)%
Options on Futures Contracts * Currencies............................... 151,900 ** – ** 151,900 ** Interest Rates.......................... 167,532 ** – ** 167,532 **
Total Options on Futures Contracts $ 319,432 0.1% $ – ** $ 319,432 0.1%
Total Futures, Forward and Options on Futures Contracts $ 6,707,391 1.5% $ (570,551) (0.1)% $ 6,136,840 1.4% * No individual futures, forward and option on futures contract position constituted greater than 1 percent of partners’ capital. Accordingly, the
number of contracts and expiration dates are not presented. ** Represents less than 0.1% of partners’ capital.
Commercial paper Face
Value Maturity
Date Description Fair Value Percent of
Partners’ Capital
$ 8,000,000 1/10/2008 Progress Energy Co. $ 7,989,340 1.7% 10,000,000 2/8/2008 Zions Bancorporation 9,947,117 2.2% 10,000,000 2/22/2008 GE Capital 9,932,833 2.2% Total Commercial paper $ 27,869,290 6.1%
7
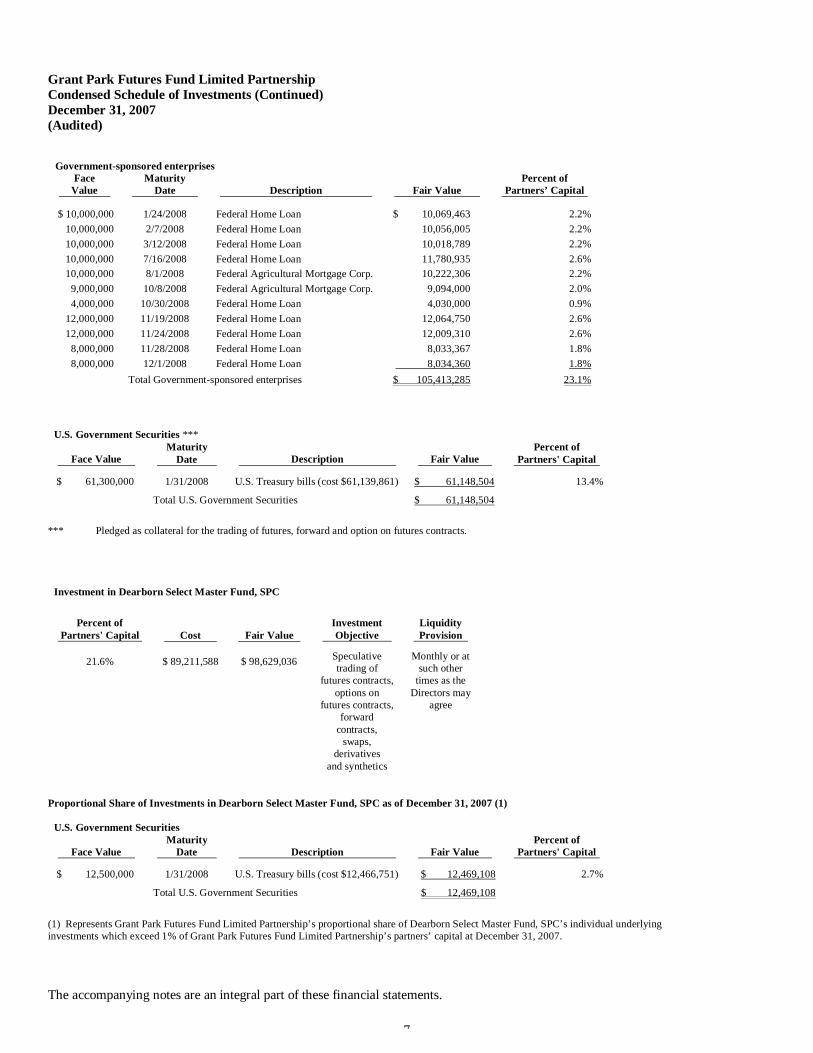
Grant Park Futures Fund Limited Partnership Condensed Schedule of Investments (Continued) December 31, 2007 (Audited)
Government-sponsored enterprises
Face Value
Maturity Date Description Fair Value
Percent of Partners’ Capital
$ 10,000,000 1/24/2008 Federal Home Loan $ 10,069,463 2.2% 10,000,000 2/7/2008 Federal Home Loan 10,056,005 2.2% 10,000,000 3/12/2008 Federal Home Loan 10,018,789 2.2% 10,000,000 7/16/2008 Federal Home Loan 11,780,935 2.6% 10,000,000 8/1/2008 Federal Agricultural Mortgage Corp. 10,222,306 2.2% 9,000,000 10/8/2008 Federal Agricultural Mortgage Corp. 9,094,000 2.0% 4,000,000 10/30/2008 Federal Home Loan 4,030,000 0.9% 12,000,000 11/19/2008 Federal Home Loan 12,064,750 2.6% 12,000,000 11/24/2008 Federal Home Loan 12,009,310 2.6% 8,000,000 11/28/2008 Federal Home Loan 8,033,367 1.8% 8,000,000 12/1/2008 Federal Home Loan 8,034,360 1.8% Total Government-sponsored enterprises $ 105,413,285 23.1%
U.S. Government Securities ***
Face Value Maturity
Date Description Fair Value Percent of
Partners' Capital
$ 61,300,000 1/31/2008 U.S. Treasury bills (cost $61,139,861) $ 61,148,504 13.4%
Total U.S. Government Securities $ 61,148,504
*** Pledged as collateral for the trading of futures, forward and option on futures contracts.
Investment in Dearborn Select Master Fund, SPC
Percent of Partners' Capital Cost Fair Value
Investment Objective
Liquidity Provision
21.6% $ 89,211,588 $ 98,629,036
Speculative trading of
futures contracts, options on
futures contracts, forward
contracts, swaps,
derivatives and synthetics
Monthly or at such other
times as the Directors may
agree
Proportional Share of Investments in Dearborn Select Master Fund, SPC as of December 31, 2007 (1)
U.S. Government Securities
Face Value Maturity
Date Description Fair Value Percent of
Partners' Capital
$ 12,500,000 1/31/2008 U.S. Treasury bills (cost $12,466,751) $ 12,469,108 2.7%
Total U.S. Government Securities $ 12,469,108
(1) Represents Grant Park Futures Fund Limited Partnership’s proportional share of Dearborn Select Master Fund, SPC’s individual underlying investments which exceed 1% of Grant Park Futures Fund Limited Partnership’s partners’ capital at December 31, 2007.
The accompanying notes are an integral part of these financial statements.
8
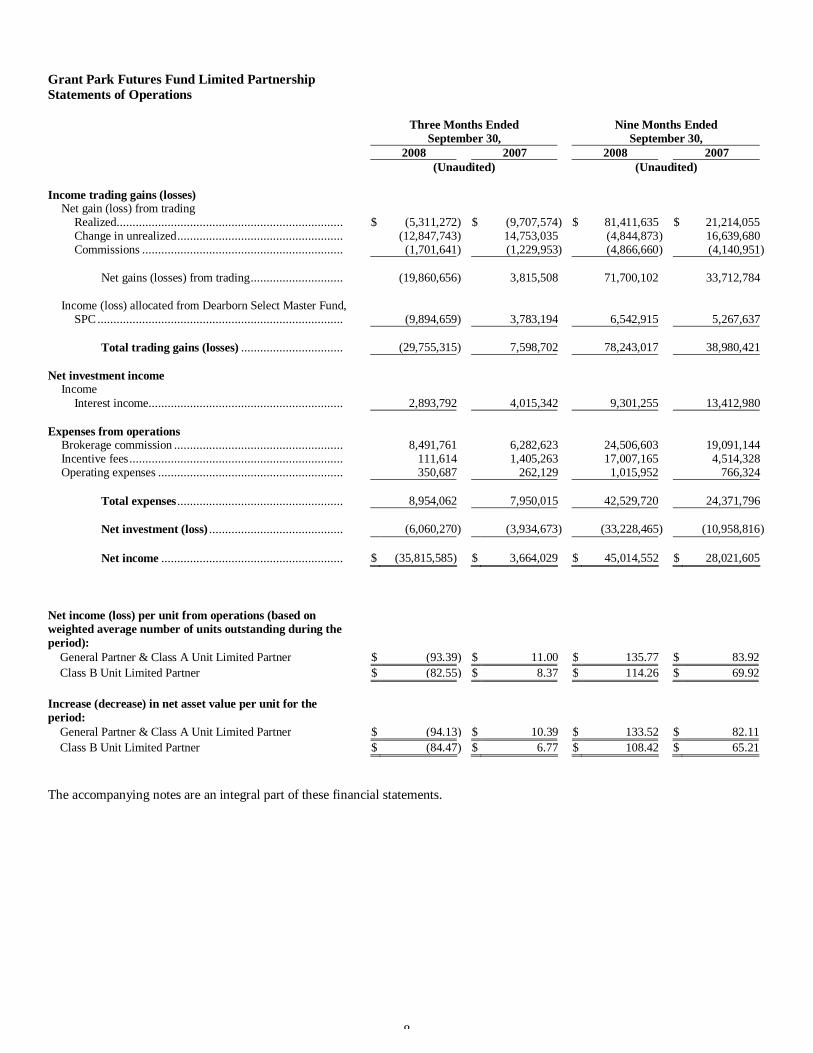
Grant Park Futures Fund Limited Partnership Statements of Operations
Three Months Ended
September 30, Nine Months Ended
September 30, 2008 2007 2008 2007 (Unaudited) (Unaudited) Income trading gains (losses)
Net gain (loss) from trading Realized....................................................................... $ (5,311,272) $ (9,707,574) $ 81,411,635 $ 21,214,055 Change in unrealized.................................................... (12,847,743) 14,753,035 (4,844,873 ) 16,639,680 Commissions ............................................................... (1,701,641) (1,229,953) (4,866,660 ) (4,140,951)
Net gains (losses) from trading............................. (19,860,656) 3,815,508 71,700,102 33,712,784
Income (loss) allocated from Dearborn Select Master Fund,
SPC............................................................................. (9,894,659) 3,783,194 6,542,915 5,267,637
Total trading gains (losses) ................................ (29,755,315) 7,598,702 78,243,017 38,980,421 Net investment income
Income Interest income............................................................. 2,893,792 4,015,342 9,301,255 13,412,980
Expenses from operations
Brokerage commission ..................................................... 8,491,761 6,282,623 24,506,603 19,091,144 Incentive fees................................................................... 111,614 1,405,263 17,007,165 4,514,328 Operating expenses .......................................................... 350,687 262,129 1,015,952 766,324
Total expenses .................................................... 8,954,062 7,950,015 42,529,720 24,371,796 Net investment (loss) .......................................... (6,060,270) (3,934,673) (33,228,465) (10,958,816 ) Net income ......................................................... $ (35,815,585) $ 3,664,029 $ 45,014,552 $ 28,021,605
Net income (loss) per unit from operations (based on weighted average number of units outstanding during the period):
General Partner & Class A Unit Limited Partner $ (93.39) $ 11.00 $ 135.77 $ 83.92 Class B Unit Limited Partner $ (82.55) $ 8.37 $ 114.26 $ 69.92
Increase (decrease) in net asset value per unit for the period:
General Partner & Class A Unit Limited Partner $ (94.13) $ 10.39 $ 133.52 $ 82.11 Class B Unit Limited Partner $ (84.47) $ 6.77 $ 108.42 $ 65.21
The accompanying notes are an integral part of these financial statements.
9
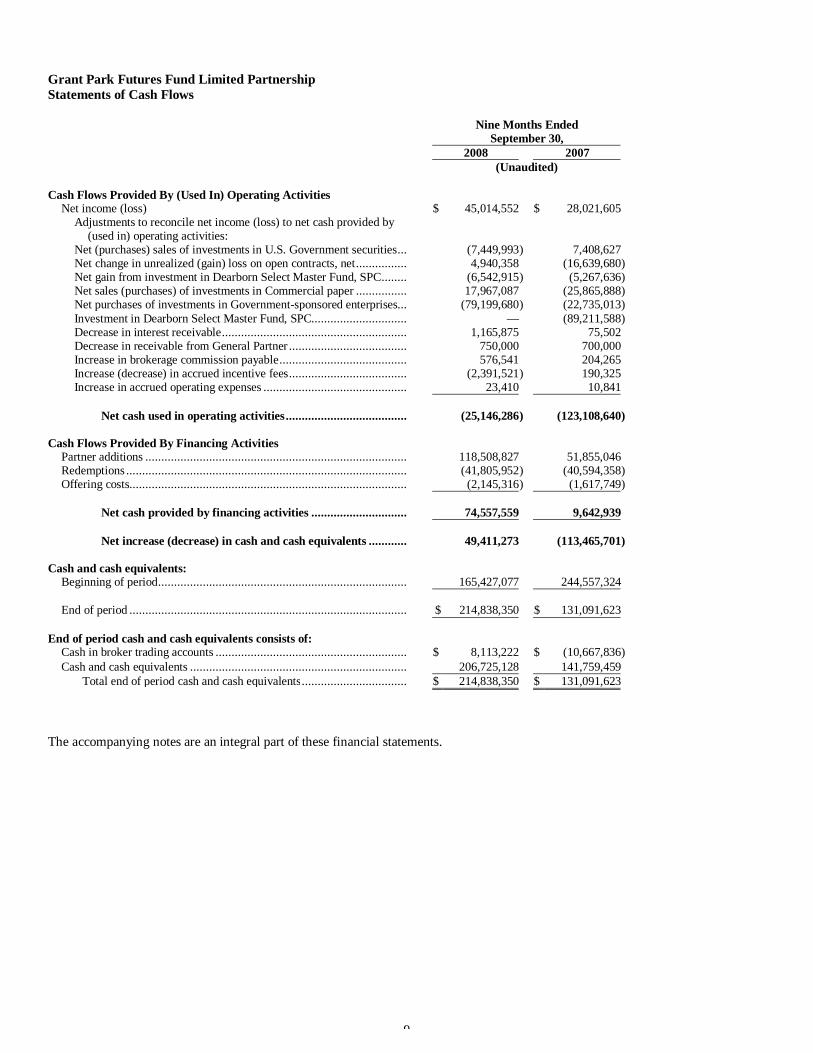
Grant Park Futures Fund Limited Partnership Statements of Cash Flows
Nine Months Ended
September 30, 2008 2007 (Unaudited) Cash Flows Provided By (Used In) Operating Activities
Net income (loss) $ 45,014,552 $ 28,021,605 Adjustments to reconcile net income (loss) to net cash provided by
(used in) operating activities: Net (purchases) sales of investments in U.S. Government securities... (7,449,993 ) 7,408,627 Net change in unrealized (gain) loss on open contracts, net................ 4,940,358 (16,639,680) Net gain from investment in Dearborn Select Master Fund, SPC........ (6,542,915 ) (5,267,636) Net sales (purchases) of investments in Commercial paper ................ 17,967,087 (25,865,888) Net purchases of investments in Government-sponsored enterprises... (79,199,680 ) (22,735,013) Investment in Dearborn Select Master Fund, SPC.............................. — (89,211,588) Decrease in interest receivable.......................................................... 1,165,875 75,502 Decrease in receivable from General Partner ..................................... 750,000 700,000 Increase in brokerage commission payable........................................ 576,541 204,265 Increase (decrease) in accrued incentive fees..................................... (2,391,521 ) 190,325 Increase in accrued operating expenses ............................................. 23,410 10,841
Net cash used in operating activities...................................... (25,146,286 ) (123,108,640)
Cash Flows Provided By Financing Activities
Partner additions .................................................................................. 118,508,827 51,855,046 Redemptions ........................................................................................ (41,805,952 ) (40,594,358) Offering costs....................................................................................... (2,145,316 ) (1,617,749)
Net cash provided by financing activities .............................. 74,557,559 9,642,939
Net increase (decrease) in cash and cash equivalents ............ 49,411,273 (113,465,701)
Cash and cash equivalents:
Beginning of period.............................................................................. 165,427,077 244,557,324 End of period ....................................................................................... $ 214,838,350 $ 131,091,623
End of period cash and cash equivalents consists of:
Cash in broker trading accounts ............................................................ $ 8,113,222 $ (10,667,836) Cash and cash equivalents .................................................................... 206,725,128 141,759,459
Total end of period cash and cash equivalents................................. $ 214,838,350 $ 131,091,623 The accompanying notes are an integral part of these financial statements.
10
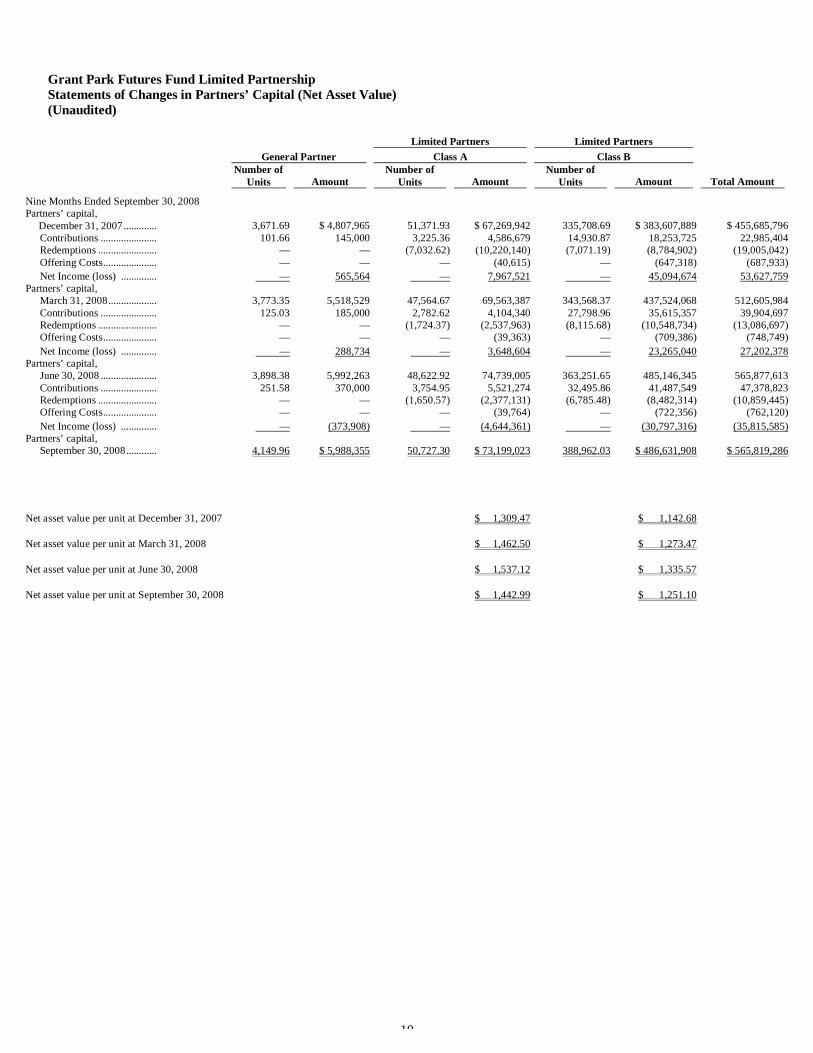
Grant Park Futures Fund Limited Partnership Statements of Changes in Partners’ Capital (Net Asset Value) (Unaudited)
Limited Partners Limited Partners General Partner Class A Class B
Number of
Units Amount Number of
Units Amount Number of
Units Amount Total Amount
Nine Months Ended September 30, 2008 Partners’ capital, December 31, 2007............. 3,671.69 $ 4,807,965 51,371.93 $ 67,269,942 335,708.69 $ 383,607,889 $ 455,685,796
Contributions ...................... 101.66 145,000 3,225.36 4,586,679 14,930.87 18,253,725 22,985,404Redemptions ....................... — — (7,032.62) (10,220,140) (7,071.19) (8,784,902) (19,005,042)Offering Costs..................... — — — (40,615) — (647,318) (687,933)Net Income (loss) .............. — 565,564 — 7,967,521 — 45,094,674 53,627,759
Partners’ capital, March 31, 2008................... 3,773.35 5,518,529 47,564.67 69,563,387 343,568.37 437,524,068 512,605,984Contributions ...................... 125.03 185,000 2,782.62 4,104,340 27,798.96 35,615,357 39,904,697Redemptions ....................... — — (1,724.37) (2,537,963) (8,115.68) (10,548,734) (13,086,697)Offering Costs..................... — — — (39,363) — (709,386) (748,749)Net Income (loss) .............. — 288,734 — 3,648,604 — 23,265,040 27,202,378
Partners’ capital, June 30, 2008 ...................... 3,898.38 5,992,263 48,622.92 74,739,005 363,251.65 485,146,345 565,877,613Contributions ...................... 251.58 370,000 3,754.95 5,521,274 32,495.86 41,487,549 47,378,823Redemptions ....................... — — (1,650.57) (2,377,131) (6,785.48) (8,482,314) (10,859,445)Offering Costs..................... — — — (39,764) — (722,356) (762,120)Net Income (loss) .............. — (373,908) — (4,644,361) — (30,797,316) (35,815,585)
Partners’ capital, September 30, 2008............ 4,149.96 $ 5,988,355 50,727.30 $ 73,199,023 388,962.03 $ 486,631,908 $ 565,819,286
Net asset value per unit at December 31, 2007
$ 1,309.47 $ 1,142.68
Net asset value per unit at March 31, 2008
$ 1,462.50 $ 1,273.47
Net asset value per unit at June 30, 2008
$ 1,537.12 $ 1,335.57
Net asset value per unit at September 30, 2008
$ 1,442.99 $ 1,251.10
11
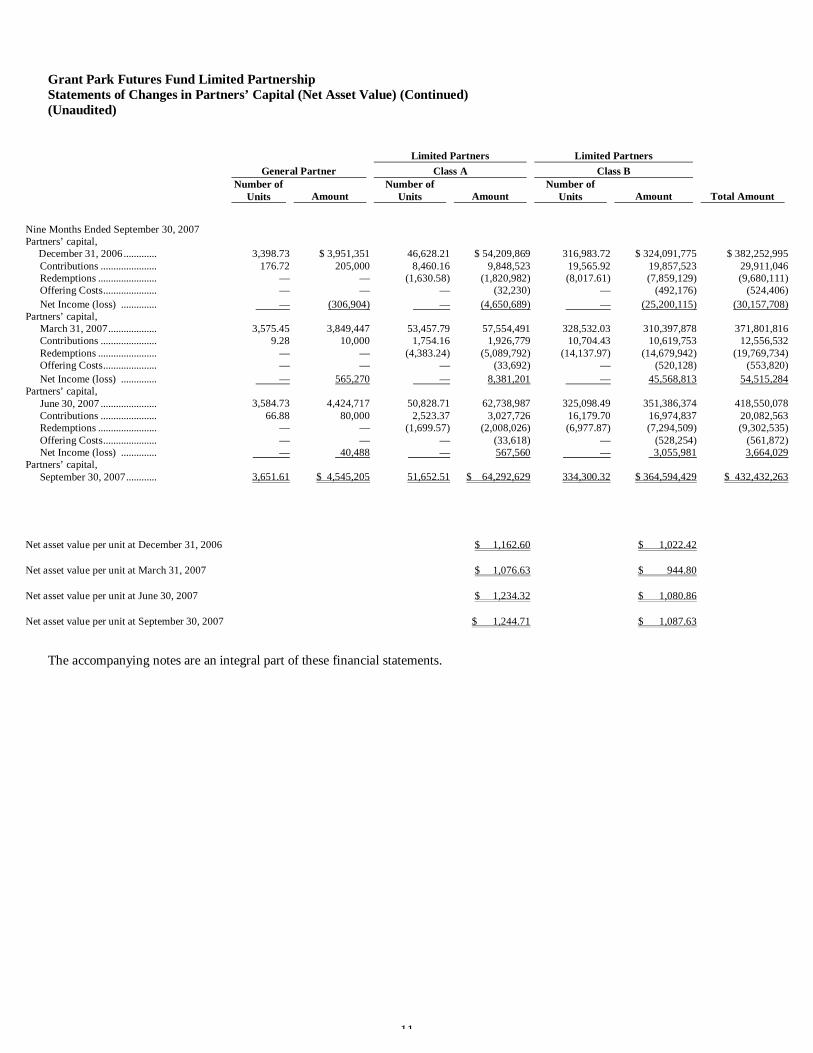
Grant Park Futures Fund Limited Partnership Statements of Changes in Partners’ Capital (Net Asset Value) (Continued) (Unaudited)
Limited Partners Limited Partners General Partner Class A Class B
Number of
Units Amount Number of
Units Amount Number of
Units Amount Total Amount
Nine Months Ended September 30, 2007
Partners’ capital, December 31, 2006............. 3,398.73 $ 3,951,351 46,628.21 $ 54,209,869 316,983.72 $ 324,091,775 $ 382,252,995
Contributions ...................... 176.72 205,000 8,460.16 9,848,523 19,565.92 19,857,523 29,911,046Redemptions ....................... — — (1,630.58) (1,820,982) (8,017.61) (7,859,129) (9,680,111)Offering Costs..................... — — — (32,230) — (492,176) (524,406)Net Income (loss) .............. — (306,904) — (4,650,689) — (25,200,115) (30,157,708)
Partners’ capital, March 31, 2007................... 3,575.45 3,849,447 53,457.79 57,554,491 328,532.03 310,397,878 371,801,816Contributions ...................... 9.28 10,000 1,754.16 1,926,779 10,704.43 10,619,753 12,556,532Redemptions ....................... — — (4,383.24) (5,089,792) (14,137.97) (14,679,942) (19,769,734)Offering Costs..................... — — — (33,692) — (520,128) (553,820)Net Income (loss) .............. — 565,270 — 8,381,201 — 45,568,813 54,515,284
Partners’ capital, June 30, 2007 ...................... 3,584.73 4,424,717 50,828.71 62,738,987 325,098.49 351,386,374 418,550,078Contributions ...................... 66.88 80,000 2,523.37 3,027,726 16,179.70 16,974,837 20,082,563Redemptions ....................... — — (1,699.57) (2,008,026) (6,977.87) (7,294,509) (9,302,535)Offering Costs..................... — — — (33,618) — (528,254) (561,872)Net Income (loss) .............. — 40,488 — 567,560 — 3,055,981 3,664,029
Partners’ capital, September 30, 2007............ 3,651.61 $ 4,545,205 51,652.51 $ 64,292,629 334,300.32 $ 364,594,429 $ 432,432,263
Net asset value per unit at December 31, 2006
$ 1,162.60 $ 1,022.42
Net asset value per unit at March 31, 2007
$ 1,076.63 $ 944.80
Net asset value per unit at June 30, 2007
$ 1,234.32 $ 1,080.86
Net asset value per unit at September 30, 2007
$ 1,244.71 $ 1,087.63
The accompanying notes are an integral part of these financial statements.
12
Grant Park Futures Fund Limited Partnership
Notes to Financial Statements (Unaudited)
Note 1. Nature of Business and Significant Accounting Policies
Nature of business: Grant Park Futures Fund Limited Partnership (the “Partnership”) was organized as a limited partnership under Illinois law in August 1988 and will continue until December 31, 2027, unless sooner terminated as provided for in its Limited Partnership Agreement. As a commodity investment pool, the Partnership is subject to the regulations of the Commodity Futures Trading Commission (“CFTC”), an agency of the United States (U.S.) government which regulates most aspects of the commodity futures industry; rules of the National Futures Association, an industry self-regulatory organization; and the requirements of the various commodity exchanges where the Partnership executes transactions. Additionally, the Partnership is subject to the requirements of futures commission merchants (“FCMs”) and interbank and other market makers through which the Partnership trades. Effective June 30, 2003, the Partnership became registered with the Securities and Exchange Commission (“SEC”), accordingly, as a registrant, the Partnership is subject to the regulatory requirements under the Securities Act of 1933, as amended and the Securities Exchange Act of 1934.
The Partnership is a multi-advisor pool that carries out its purpose through trading by independent professional commodity trading advisors retained by Dearborn Capital Management, L.L.C. (the “General Partner”) and the Partnership. The Partnership also invests in other commodity investment pools to achieve its purpose. Through these trading advisors, and investments in other commodity investment pools, the Partnership’s business is to trade, buy, sell, margin or otherwise acquire, hold or dispose of futures and forward contracts for commodities, financial instruments or currencies, any rights pertaining thereto and any options thereon, or on physical commodities. The Partnership may also engage in hedge, arbitrage and cash trading of commodities and futures.
Presentation of financial information: The financial statements include the accounts of the Partnership and were prepared by us without audit according to the rules and regulations of the SEC. Certain information and footnote disclosures normally included in the financial statements prepared in accordance with generally accepted accounting principles may be omitted pursuant to such rules and regulations. In our opinion, the accompanying interim, unaudited, financial statements contain all adjustments (consisting of normal recurring accruals) necessary and adequate disclosures to present fairly the financial position as of September 30, 2008 and the results of operations for the three and nine months ended September 30, 2008 and 2007.
These financial statements should be read in conjunction with the audited financial statements and notes thereto included in our 2007 Annual Report on Form 10-K as filed with the SEC.
Classes of interests: The Partnership has two classes of limited partner interests (the “Interests”), Class A and Class B. Both Class A and Class B Interests are traded pursuant to identical trading programs and differ only in respect to the General Partner’s brokerage commission and organization and offering costs.
Significant accounting policies are as follows:
Use of estimates: The preparation of financial statements in conformity with generally accepted accounting principles requires management to make estimates and assumptions that affect the reported amounts of assets and liabilities and disclosure of contingent assets and liabilities at the date of the financial statements and the reported amounts of revenue and expenses during the reporting period. Actual results could differ from those estimates.
Cash and cash equivalents: Cash and cash equivalents include cash, certificates of deposit, and short-term investments in interest-bearing demand deposits with banks and cash managers with original maturities of three months or less. The Partnership maintains deposits with high quality financial institutions in amounts that are in excess of federally insured limits; however, the Partnership does not believe it is exposed to any significant credit risk.
Revenue recognition and investments: Futures, options on futures, and forward contracts are recorded on the trade date basis and realized gains or losses are recognized when contracts are liquidated. Unrealized gains or losses on open contracts (the difference between contract trade price and fair value) are reported in the statement of financial condition as a net unrealized gain or loss, as there exists a right of offset of unrealized gains or losses in accordance with the Financial Accounting Standards Board (“FASB”) Interpretation No. 39 — Offsetting of Amounts Related to Certain Contracts, as amended by FASB FSP No. FIN 39-1, Amendment of FASB Interpretation No. 39. Any change in net unrealized gain or loss from the preceding period is reported in the statement of operations. Fair value of exchange-traded contracts is based upon exchange settlement prices. Fair value of non-exchange-traded contracts is based on third party quoted dealer values on the Interbank market. Government-sponsored enterprises and commercial paper are stated at cost plus accrued interest, which approximates fair value.
13
The Partnership’s investment in the Dearborn Select Master Fund, SPC – Winton Segregated Portfolio – Class GP (the “GP Class”) is reported in the statement of financial condition at fair value. Fair value ordinarily is the value determined by the management of the GP Class in accordance with the valuation policies of the GP Class and as reported at the time of the Partnership’s valuation. Generally, the fair value of the Partnership’s investment in the GP Class represents the amount that the Partnership could reasonably expect to receive from the GP Class if the Partnership’s investment was redeemed at the time of valuation, based on information reasonably available at the time the valuation is made and that the Partnership believes to be reliable.
Redemptions payable: Pursuant to the provisions of Statement of Financial Accounting Standards No. 150, Accounting for Certain Financial Instruments with Characteristics of both Liabilities and Equity (“SFAS 150”), redemptions approved by the General Partner prior to month end are recorded as redemptions payable as of month end.
Fair value of financial instruments: All of the Partnership’s assets and liabilities are considered financial instruments and are reflected at fair value, or at carrying amounts that approximate fair value because of the short maturity of the instruments.
Income taxes: No provision for income taxes has been made in these financial statements as each partner is individually responsible for reporting income or loss based on its respective share of the Partnership’s income and expenses as reported for income tax purposes.
Organization and offering costs: All expenses incurred in connection with the organization and the initial and ongoing public offering of Partnership Interests are paid by the General Partner and are reimbursed to the General Partner by the Partnership. This reimbursement is made monthly. Class A units bear organization and offering expenses at an annual rate of 20 basis points (0.20 percent) of the adjusted net assets of the Class A units, calculated and payable monthly on the basis of month-end adjusted net assets. Class B units incur these expenses at an annual rate of 60 basis points (0.60 percent) of the adjusted net assets of the Class B units, calculated and payable monthly on the basis of month-end adjusted net assets. “Adjusted net assets” is defined as the month-end net assets of the particular class before accruals for fees and expenses and redemptions. In its discretion, the General Partner may require the Partnership to reimburse the General Partner in any subsequent calendar year for amounts that exceed these limits in any calendar year, provided that the maximum amount reimbursed by the Partnership will not exceed the overall limit. Amounts reimbursed by the Partnership with respect to the initial and ongoing public offering expenses are charged against partners’ capital at the time of reimbursement or accrual. Any amounts reimbursed by the Partnership with respect to organization expenses are expensed at the time the reimbursement is incurred or accrued. If the Partnership terminates prior to completion of payment of the calculated amounts to the General Partner, the General Partner will not be entitled to any additional payments, and the Partnership will have no further obligation to the General Partner. At September 30, 2008, all organization and offering costs incurred by the General Partner have been reimbursed.
Foreign currency transactions: The Partnership’s functional currency is the U.S. dollar, however, it transacts business in currencies other than the U.S. dollar. Assets and liabilities denominated in currencies other than the U.S. dollar are translated into U.S. dollars at the rates in effect at the date of the statement of financial condition. Income and expense items denominated in currencies other than the U.S. dollar are translated into U.S. dollars at the rates in effect during the period. Gains and losses resulting from the translation to U.S. dollars are reported in income currently.
Reclassification: Certain amounts in the 2007 financial statements have been reclassified to conform with the 2008 presentation.
Recently adopted accounting pronouncements: In September 2006, the FASB issued Statement of Financial Accounting Standards No. 157, Fair Value Measurements (“SFAS No. 157”). SFAS No. 157 defines fair value, establishes a framework for measuring fair value and expands disclosures about fair value measurement and also emphasizes that fair value is a market-based measurement, not an entity-specific measurement. SFAS No. 157 is effective for fiscal years beginning after November 15, 2007, except for nonfinancial assets and nonfinancial liabilities that are recognized or disclosed at fair value in the financial statements on a nonrecurring basis for which delayed application is permitted until fiscal years beginning after November 15, 2008. The adoption of SFAS No. 157 was effective for the Partnership on January 1, 2008, and did not impact our financial position, results of operations or cash flows.
SFAS No. 157 defines fair value as the price that would be received to sell an asset or paid to transfer a liability in an orderly
transaction between market participants at the measurement date and sets out a fair value hierarchy. The fair value hierarchy gives the highest priority to quoted prices in active markets for identical assets or liabilities (Level 1) and the lowest priority to unobservable inputs (Level 3). Inputs are broadly defined under SFAS 157 as assumptions market participants would use in pricing an asset or liability. The three levels of the fair value hierarchy under SFAS 157 are described below:
Level 1. Unadjusted quoted prices in active markets for identical assets or liabilities that the reporting entity has the ability to
access at the measurement date.
14
Level 2. Inputs other than quoted prices within Level 1 that are observable for the asset or liability, either directly or indirectly. A significant adjustment to a Level 2 input could result in the Level 2 measurement becoming a Level 3 measurement.
Level 3. Inputs are unobservable for the asset or liability. The following section describes the valuation techniques used by the Partnership to measure different financial instruments at
fair value and includes the level within the fair value hierarchy in which the financial instrument is categorized. Fair value of exchange-traded contracts is based upon exchange settlement prices. Fair value of non-exchange-traded contracts is based on third party quoted dealer values on the Interbank market. Government-sponsored enterprises and commercial paper are stated at cost plus accrued interest, which approximates fair value. These financial instruments are classified in Level 1 of the fair value hierarchy. The Partnership’s investment in the Dearborn Select Master Fund, SPC – Winton Segregated Portfolio – Class GP (the “GP Class”) is reported in the statement of financial condition at fair value. Fair value ordinarily is the value determined by the management of the GP Class in accordance with the valuation policies of the GP Class and as reported at the time of the Partnership’s valuation. Generally, the fair value of the Partnership’s investment in the GP Class represents the amount that the Partnership could reasonably expect to receive from the GP Class if the Partnership’s investment was redeemed at the time of valuation, based on information reasonably available at the time the valuation is made and that the Partnership believes to be reliable. This financial instrument is classified in Level 3 of the fair value hierarchy.
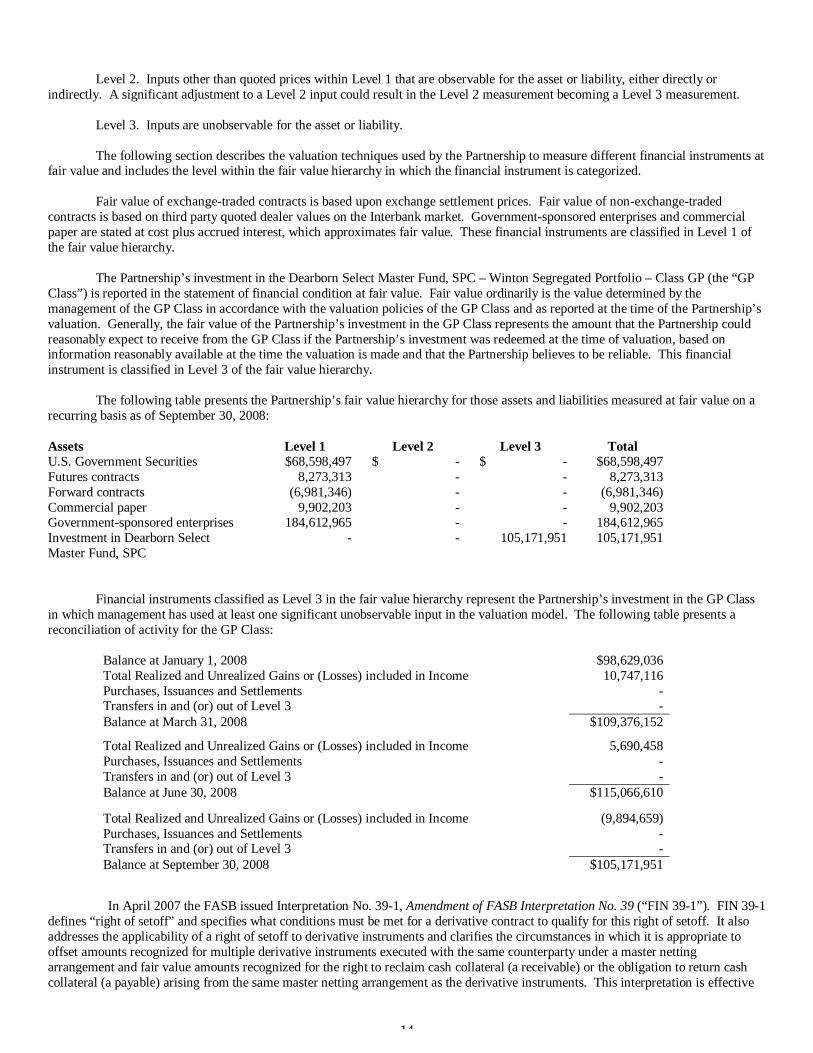
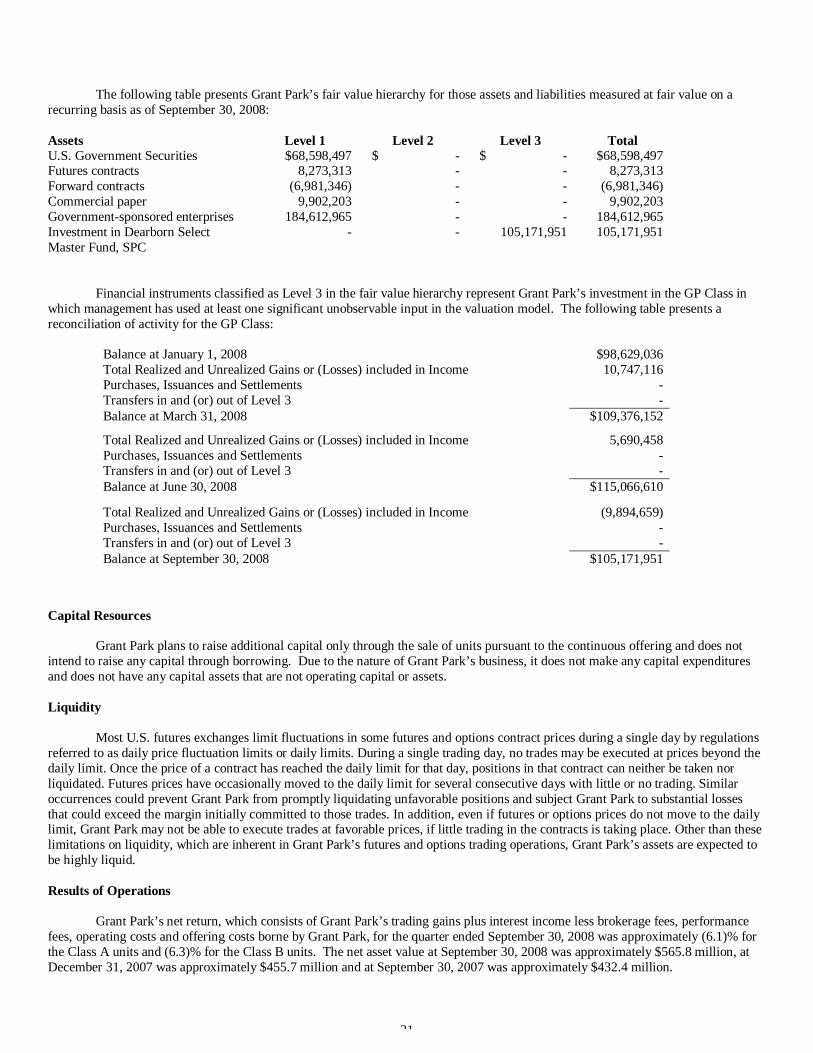
The following table presents the Partnership’s fair value hierarchy for those assets and liabilities measured at fair value on a
recurring basis as of September 30, 2008:
Assets Level 1 Level 2 Level 3 Total U.S. Government Securities $68,598,497 $ - $ - $68,598,497 Futures contracts 8,273,313 - - 8,273,313 Forward contracts (6,981,346) - - (6,981,346) Commercial paper 9,902,203 - - 9,902,203 Government-sponsored enterprises 184,612,965 - - 184,612,965 Investment in Dearborn Select Master Fund, SPC
- - 105,171,951 105,171,951
Financial instruments classified as Level 3 in the fair value hierarchy represent the Partnership’s investment in the GP Class
in which management has used at least one significant unobservable input in the valuation model. The following table presents a reconciliation of activity for the GP Class:
Balance at January 1, 2008 $98,629,036 Total Realized and Unrealized Gains or (Losses) included in Income 10,747,116 Purchases, Issuances and Settlements - Transfers in and (or) out of Level 3 - Balance at March 31, 2008 $109,376,152
Total Realized and Unrealized Gains or (Losses) included in Income 5,690,458 Purchases, Issuances and Settlements - Transfers in and (or) out of Level 3 - Balance at June 30, 2008 $115,066,610
Total Realized and Unrealized Gains or (Losses) included in Income (9,894,659) Purchases, Issuances and Settlements - Transfers in and (or) out of Level 3 - Balance at September 30, 2008 $105,171,951
In April 2007 the FASB issued Interpretation No. 39-1, Amendment of FASB Interpretation No. 39 (“FIN 39-1”). FIN 39-1
defines “right of setoff” and specifies what conditions must be met for a derivative contract to qualify for this right of setoff. It also addresses the applicability of a right of setoff to derivative instruments and clarifies the circumstances in which it is appropriate to offset amounts recognized for multiple derivative instruments executed with the same counterparty under a master netting arrangement and fair value amounts recognized for the right to reclaim cash collateral (a receivable) or the obligation to return cash collateral (a payable) arising from the same master netting arrangement as the derivative instruments. This interpretation is effective
15
for fiscal years beginning after November 15, 2007. The adoption of FIN 39-1 did not have a material impact on the Partnership’s financial statements.
Recent accounting pronouncements: In March 2008, the FASB issued SFAS No. 161, Disclosure about Derivative
Instruments and Hedging Activities, an Amendment of FASB Statement No. 133 (“SFAS No. 161”). SFAS No. 161 is intended to improve transparency in financial reporting by requiring enhanced disclosures of an entity’s derivative instruments and hedging activities and their effects on the entity’s financial position, financial performance, and cash flows. SFAS No. 161 applies to all derivative instruments within the scope of SFAS No. 133. It also applies to non-derivative hedging instruments and all hedged items designated and qualifying as hedges under SFAS No. 133. SFAS No. 161 amends the current qualitative and quantitative disclosure requirements for derivative instruments and hedging activities set forth in SFAS No. 133 and generally increases the level of disaggregation that will be required in an entity’s financial statements. SFAS No. 161 requires qualitative disclosures about objectives and strategies for using derivatives, quantitative disclosures about fair value amounts of gains and losses on derivative instruments, and disclosures about credit-risk related contingent features in derivative agreements. SFAS No. 161 is effective prospectively for financial statements issued for fiscal years and interim periods beginning after November 15, 2008.
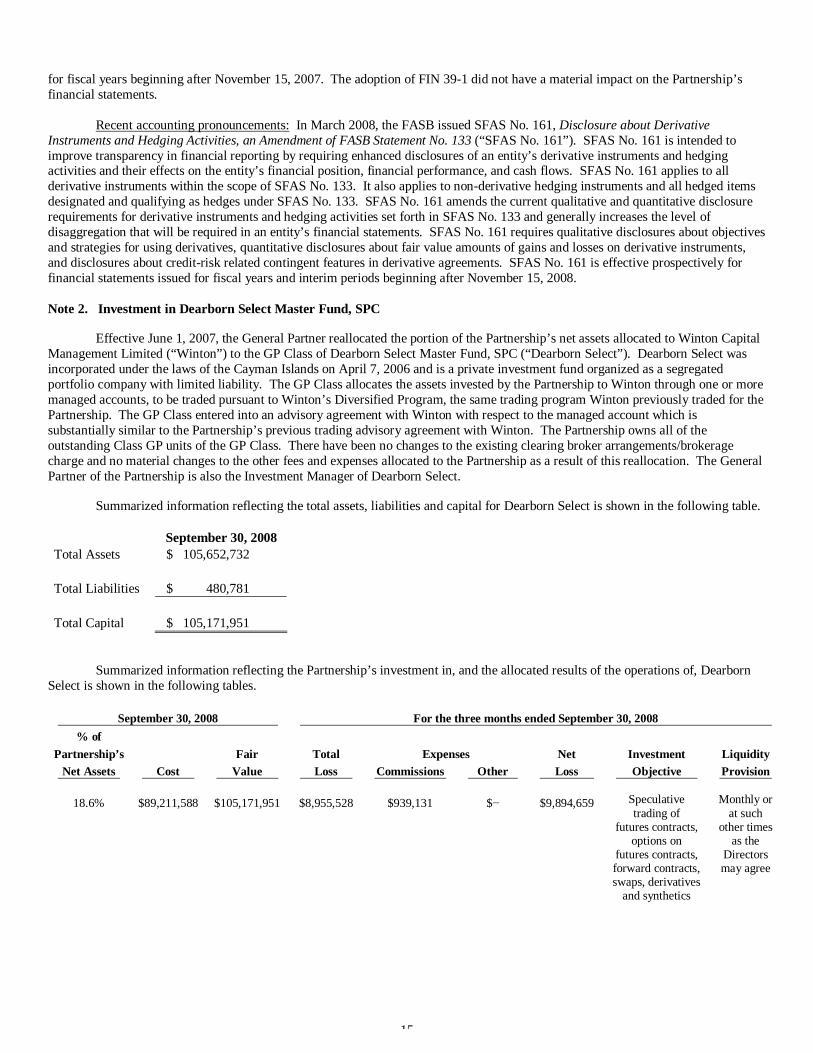
Note 2. Investment in Dearborn Select Master Fund, SPC
Effective June 1, 2007, the General Partner reallocated the portion of the Partnership’s net assets allocated to Winton Capital Management Limited (“Winton”) to the GP Class of Dearborn Select Master Fund, SPC (“Dearborn Select”). Dearborn Select was incorporated under the laws of the Cayman Islands on April 7, 2006 and is a private investment fund organized as a segregated portfolio company with limited liability. The GP Class allocates the assets invested by the Partnership to Winton through one or more managed accounts, to be traded pursuant to Winton’s Diversified Program, the same trading program Winton previously traded for the Partnership. The GP Class entered into an advisory agreement with Winton with respect to the managed account which is substantially similar to the Partnership’s previous trading advisory agreement with Winton. The Partnership owns all of the outstanding Class GP units of the GP Class. There have been no changes to the existing clearing broker arrangements/brokerage charge and no material changes to the other fees and expenses allocated to the Partnership as a result of this reallocation. The General Partner of the Partnership is also the Investment Manager of Dearborn Select.
Summarized information reflecting the total assets, liabilities and capital for Dearborn Select is shown in the following table.
September 30, 2008 Total Assets $ 105,652,732 Total Liabilities $ 480,781 Total Capital $ 105,171,951
Summarized information reflecting the Partnership’s investment in, and the allocated results of the operations of, Dearborn Select is shown in the following tables.
September 30, 2008 For the three months ended September 30, 2008 % of
Partnership’s Fair Total Expenses Net Investment Liquidity Net Assets Cost Value Loss Commissions Other Loss Objective Provision
18.6% $89,211,588 $105,171,951 $8,955,528 $939,131 $− $9,894,659
Speculative trading of
futures contracts, options on
futures contracts, forward contracts, swaps, derivatives
and synthetics
Monthly or at such
other times as the
Directors may agree
16
September 30, 2008 For the nine months ended September 30, 2008 % of
Partnership’s Fair Total Expenses Net Investment Liquidity Net Assets Cost Value Income Commissions Other Income Objective Provision
18.6% $89,211,588 $ 105,171,951 $13,840,910 $ 2,867,791 $ 4,430,204 $6,542,915
Speculative trading of
futures contracts, options on
futures contracts, forward contracts, swaps, derivatives
and synthetics
Monthly or at such
other times as the
Directors may agree
Note 3. Deposits with Brokers
The Partnership deposits assets with brokers subject to CFTC regulations and various exchange and brokers requirements. Margin requirements are satisfied by the deposit of U.S. Treasury bills and cash with such brokers. The Partnership earns interest income on its assets deposited with the brokers.
Note 4. Commodity Trading Advisors
In addition to its investment in Dearborn Select through which a portion of its assets are managed by Winton, as of September 30, 2008, the Partnership has entered into advisory contracts with Rabar Market Research, Inc., EMC Capital Management, Inc., Eckhardt Trading Co., Graham Capital Management, L.P., Welton Investment Corporation, Global Advisors L.P. and Transtrend B.V. to act as the Partnership’s commodity trading advisors (the “Advisors”). The Advisors are paid a quarterly management fee ranging from 1 percent to 2 percent per annum of the Partnership’s month-end allocated net assets and a quarterly incentive fee ranging from 20 percent to 30 percent of the new trading profits on the allocated net assets of the Advisor.
Note 5. General Partner and Related Party Transactions
The General Partner shall at all times, so long as it remains a general partner of the Partnership, own units in the Partnership: (i) in an amount sufficient, in the opinion of counsel for the Partnership, for the Partnership to be taxed as a partnership rather than as an association taxable as a corporation; and (ii) during such time as the units are registered for sale to the public, in an amount at least equal to the greater of: (a) 1% of all capital contributions of all Partners to the Partnership; or (b) $25,000; or such other amount satisfying the requirements then imposed by the North American Securities Administrators Association, Inc. (NASAA) Guidelines. Further, during such time as the units are registered for sale to the public, the General Partner shall, so long as it remains a general partner of the Partnership, maintain a net worth (as such term may be defined in the NASAA Guidelines) at least equal to the greater of: (i) 5 percent of the total capital contributions of all partners and all limited partnerships to which it is a general partner (including the Partnership) plus 5 percent of the units being offered for sale in the Partnership; or (ii) $50,000; or such other amount satisfying the requirements then imposed by the NASAA Guidelines. In no event, however, shall the General Partner be required to maintain a net worth in excess of $1,000,000 or such other maximum amount satisfying the requirements then imposed by the NASAA Guidelines.
Ten percent of the General Partner limited partnership interest in the Grant Park Futures Fund Limited Partnership is characterized as a general partnership interest. Notwithstanding, the general partnership interest will continue to pay all fees associated with a limited partnership interest.
The Partnership pays the General Partner a monthly brokerage commission equal to one twelfth of 7.55 percent (7.55 percent annualized) of month-end net assets for Class A units and one twelfth of 8.00 percent (8.00 percent annualized) of month-end net assets for Class B units. Included in the brokerage commission are management fees paid to the Advisors, compensation to the selling agents and an amount to the General Partner for management services rendered.
Note 6. Operating Expenses
Operating expenses of the Partnership are paid for by the General Partner and reimbursed by the Partnership. The operating expenses of the Partnership are limited to 0.25 percent per year of the average month-end net assets of the Partnership.
17
Note 7. Redemptions
Limited Partners have the right to redeem units as of any month-end upon ten (10) days’ prior written notice to the Partnership. The General Partner, however, may permit earlier redemptions in its discretion. There are no redemption fees applicable to Class A Limited Partners or to Class B Limited Partners who redeem their units on or after the one-year anniversary of their subscription. Class B Limited Partners who redeem their units prior to the one-year anniversary of their subscriptions for the redeemed units will pay the applicable early redemption fee. Redemptions will be made on the last day of the month for an amount equal to the net asset value per unit, as defined, represented by the units to be redeemed. The right to obtain redemption is also contingent upon the Partnership’s having property sufficient to discharge its liabilities on the redemption date and may be delayed if the General Partner determines that earlier liquidation of commodity interest positions to meet redemption payments would be detrimental to the Partnership or nonredeeming Limited Partners.
In addition, the General Partner may at any time cause the redemption of all or a portion of any Limited Partner’s units upon fifteen (15) days written notice. The General Partner may also immediately redeem any Limited Partner’s units without notice if the General Partner believes that (i) the redemption is necessary to avoid having the assets of the Partnership deemed Plan Assets under the Employee Retirement Income Security Act of 1974, as amended (“ERISA”), (ii) the Limited Partner made a misrepresentation in connection with its subscription for the units, or (iii) the redemption is necessary to avoid a violation of law by the Partnership or any Partner.
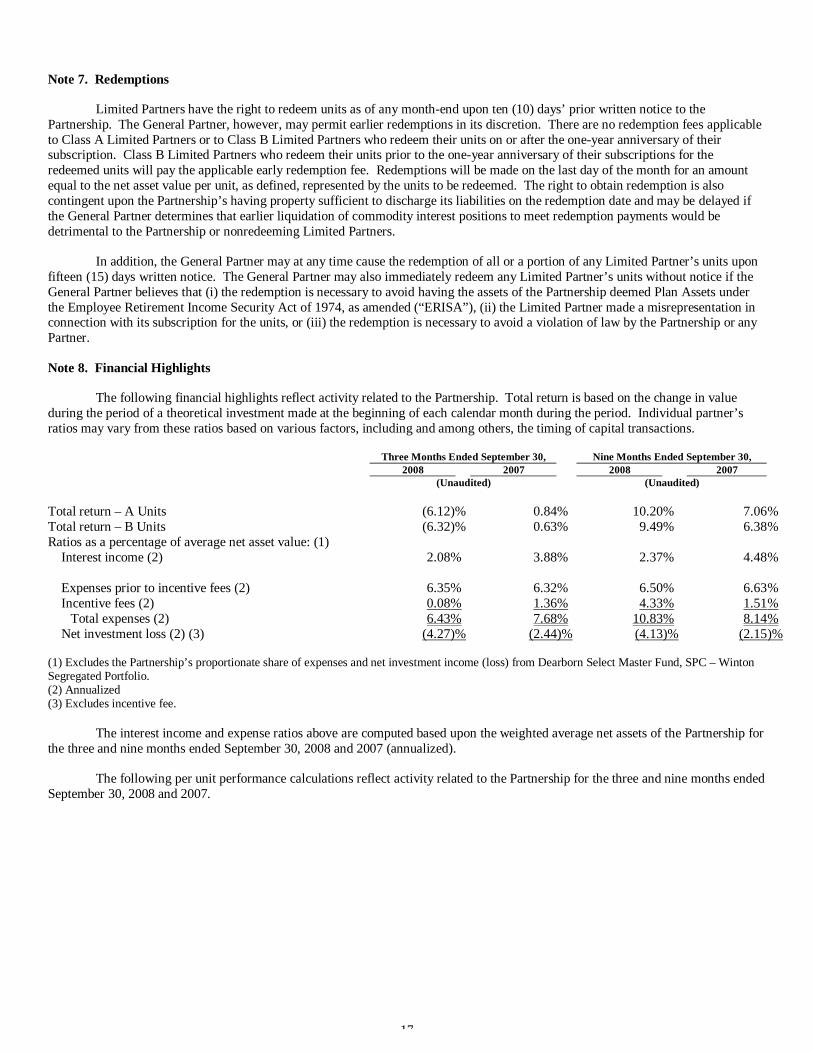
Note 8. Financial Highlights
The following financial highlights reflect activity related to the Partnership. Total return is based on the change in value during the period of a theoretical investment made at the beginning of each calendar month during the period. Individual partner’s ratios may vary from these ratios based on various factors, including and among others, the timing of capital transactions.
Three Months Ended September 30, Nine Months Ended September 30, 2008 2007 2008 2007 (Unaudited) (Unaudited) Total return – A Units (6.12)% 0.84% 10.20% 7.06 % Total return – B Units (6.32)% 0.63% 9.49% 6.38 % Ratios as a percentage of average net asset value: (1)
Interest income (2) 2.08% 3.88% 2.37% 4.48 % Expenses prior to incentive fees (2) 6.35% 6.32% 6.50% 6.63 % Incentive fees (2) 0.08% 1.36% 4.33% 1.51 %
Total expenses (2) 6.43% 7.68% 10.83% 8.14 % Net investment loss (2) (3) (4.27)% (2.44)% (4.13)% (2.15 )%
(1) Excludes the Partnership’s proportionate share of expenses and net investment income (loss) from Dearborn Select Master Fund, SPC – Winton Segregated Portfolio. (2) Annualized (3) Excludes incentive fee.
The interest income and expense ratios above are computed based upon the weighted average net assets of the Partnership for the three and nine months ended September 30, 2008 and 2007 (annualized).
The following per unit performance calculations reflect activity related to the Partnership for the three and nine months ended September 30, 2008 and 2007.
18
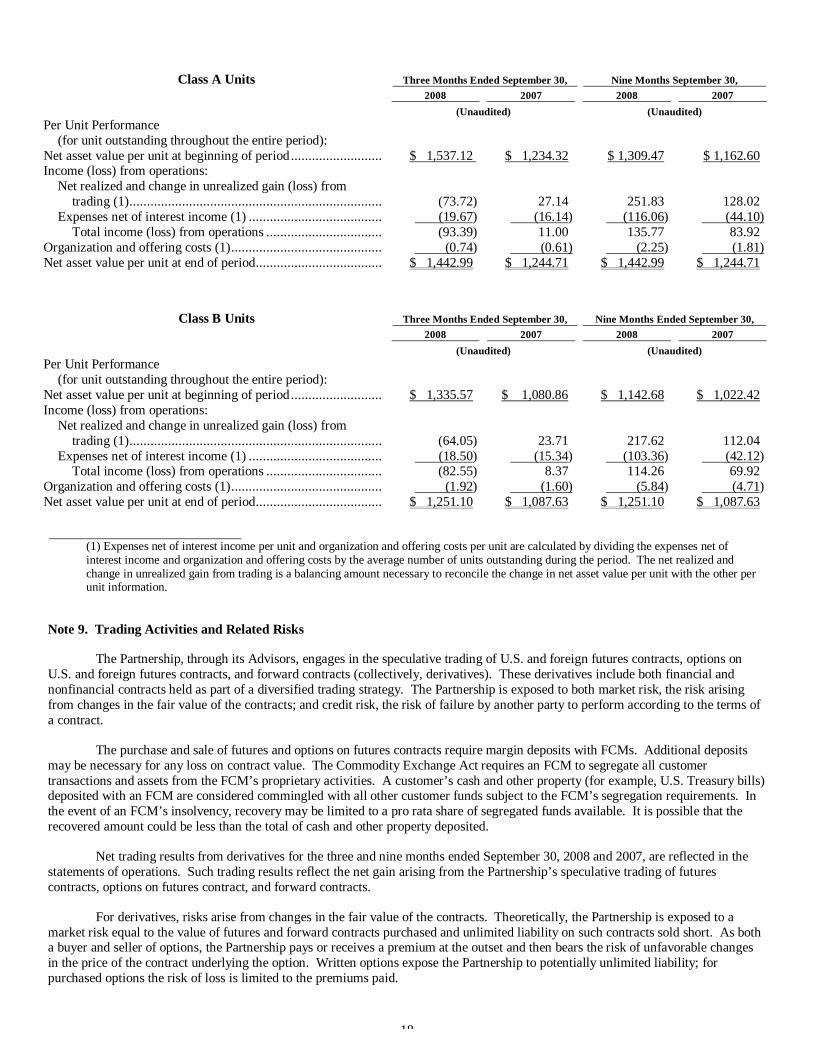
Class A Units Three Months Ended September 30, Nine Months September 30, 2008 2007 2008 2007 (Unaudited) (Unaudited) Per Unit Performance
(for unit outstanding throughout the entire period):
Net asset value per unit at beginning of period.......................... $ 1,537.12 $ 1,234.32 $ 1,309.47 $ 1,162.60 Income (loss) from operations:
Net realized and change in unrealized gain (loss) from trading (1)........................................................................ (73.72) 27.14 251.83 128.02
Expenses net of interest income (1) ...................................... (19.67) (16.14) (116.06) (44.10) Total income (loss) from operations ................................. (93.39) 11.00 135.77 83.92
Organization and offering costs (1)........................................... (0.74) (0.61) (2.25) (1.81) Net asset value per unit at end of period.................................... $ 1,442.99 $ 1,244.71 $ 1,442.99 $ 1,244.71
Class B Units Three Months Ended September 30, Nine Months Ended September 30, 2008 2007 2008 2007 (Unaudited) (Unaudited) Per Unit Performance
(for unit outstanding throughout the entire period):
Net asset value per unit at beginning of period.......................... $ 1,335.57 $ 1,080.86 $ 1,142.68 $ 1,022.42 Income (loss) from operations:
Net realized and change in unrealized gain (loss) from trading (1)........................................................................ (64.05) 23.71 217.62 112.04
Expenses net of interest income (1) ...................................... (18.50) (15.34) (103.36) (42.12) Total income (loss) from operations ................................. (82.55) 8.37 114.26 69.92
Organization and offering costs (1)........................................... (1.92) (1.60) (5.84) (4.71) Net asset value per unit at end of period.................................... $ 1,251.10 $ 1,087.63 $ 1,251.10 $ 1,087.63
(1) Expenses net of interest income per unit and organization and offering costs per unit are calculated by dividing the expenses net of
interest income and organization and offering costs by the average number of units outstanding during the period. The net realized and change in unrealized gain from trading is a balancing amount necessary to reconcile the change in net asset value per unit with the other per unit information.
Note 9. Trading Activities and Related Risks
The Partnership, through its Advisors, engages in the speculative trading of U.S. and foreign futures contracts, options on U.S. and foreign futures contracts, and forward contracts (collectively, derivatives). These derivatives include both financial and nonfinancial contracts held as part of a diversified trading strategy. The Partnership is exposed to both market risk, the risk arising from changes in the fair value of the contracts; and credit risk, the risk of failure by another party to perform according to the terms of a contract.
The purchase and sale of futures and options on futures contracts require margin deposits with FCMs. Additional deposits may be necessary for any loss on contract value. The Commodity Exchange Act requires an FCM to segregate all customer transactions and assets from the FCM’s proprietary activities. A customer’s cash and other property (for example, U.S. Treasury bills) deposited with an FCM are considered commingled with all other customer funds subject to the FCM’s segregation requirements. In the event of an FCM’s insolvency, recovery may be limited to a pro rata share of segregated funds available. It is possible that the recovered amount could be less than the total of cash and other property deposited.
Net trading results from derivatives for the three and nine months ended September 30, 2008 and 2007, are reflected in the statements of operations. Such trading results reflect the net gain arising from the Partnership’s speculative trading of futures contracts, options on futures contract, and forward contracts.
For derivatives, risks arise from changes in the fair value of the contracts. Theoretically, the Partnership is exposed to a market risk equal to the value of futures and forward contracts purchased and unlimited liability on such contracts sold short. As both a buyer and seller of options, the Partnership pays or receives a premium at the outset and then bears the risk of unfavorable changes in the price of the contract underlying the option. Written options expose the Partnership to potentially unlimited liability; for purchased options the risk of loss is limited to the premiums paid.
19
In addition to market risk, in entering into commodity contracts there is a credit risk that a counterparty will not be able to meet its obligations to the Partnership. The counterparty for futures and options on futures contracts traded in the United States and on most non-U.S. futures exchanges is the clearinghouse associated with such exchange. In general, clearinghouses are backed by the members of the clearinghouse who are required to share any financial burden resulting from the nonperformance by one of their members and, as such, should significantly reduce this credit risk. In cases where the clearinghouse is not backed by the clearing members, like some non-U.S. exchanges, it is normally backed by a consortium of banks or other financial institutions.
In the case of forward contracts, over-the-counter options contracts or swap contracts, which are traded on the interbank or other institutional market rather than on exchanges, the counterparty is generally a single bank or other financial institution, rather than a clearinghouse backed by a group of financial institutions; thus, there likely will be greater counterparty credit risk. The Partnership trades only with those counterparties that it believes to be creditworthy. All positions of the Partnership are valued each day on a mark-to-market basis. There can be no assurance that any clearing member, clearinghouse or other counterparty will be able to meet its obligations to the Partnership.
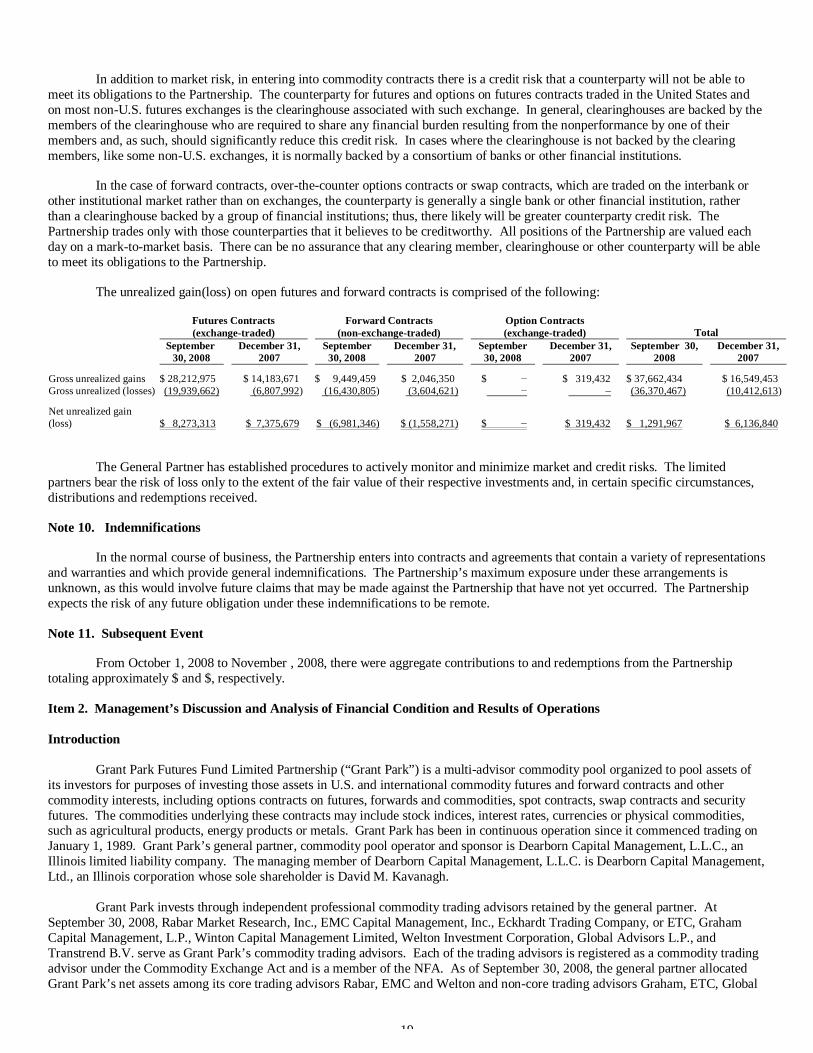
The unrealized gain(loss) on open futures and forward contracts is comprised of the following:
Futures Contracts (exchange-traded)
Forward Contracts (non-exchange-traded)
Option Contracts (exchange-traded) Total
September
30, 2008 December 31,
2007 September
30, 2008 December 31,
2007 September
30, 2008 December 31,
2007 September 30,
2008 December 31,
2007
Gross unrealized gains $ 28,212,975 $ 14,183,671 $ 9,449,459 $ 2,046,350 $ − $ 319,432 $ 37,662,434 $ 16,549,453 Gross unrealized (losses) (19,939,662) (6,807,992) (16,430,805) (3,604,621) − – (36,370,467) (10,412,613)
Net unrealized gain (loss) $ 8,273,313 $ 7,375,679 $ (6,981,346) $ (1,558,271) $ − $ 319,432 $ 1,291,967 $ 6,136,840
The General Partner has established procedures to actively monitor and minimize market and credit risks. The limited partners bear the risk of loss only to the extent of the fair value of their respective investments and, in certain specific circumstances, distributions and redemptions received.
Note 10. Indemnifications
In the normal course of business, the Partnership enters into contracts and agreements that contain a variety of representations and warranties and which provide general indemnifications. The Partnership’s maximum exposure under these arrangements is unknown, as this would involve future claims that may be made against the Partnership that have not yet occurred. The Partnership expects the risk of any future obligation under these indemnifications to be remote.
Note 11. Subsequent Event
From October 1, 2008 to November , 2008, there were aggregate contributions to and redemptions from the Partnership totaling approximately $ and $, respectively.
Item 2. Management’s Discussion and Analysis of Financial Condition and Results of Operations Introduction
Grant Park Futures Fund Limited Partnership (“Grant Park”) is a multi-advisor commodity pool organized to pool assets of its investors for purposes of investing those assets in U.S. and international commodity futures and forward contracts and other commodity interests, including options contracts on futures, forwards and commodities, spot contracts, swap contracts and security futures. The commodities underlying these contracts may include stock indices, interest rates, currencies or physical commodities, such as agricultural products, energy products or metals. Grant Park has been in continuous operation since it commenced trading on January 1, 1989. Grant Park’s general partner, commodity pool operator and sponsor is Dearborn Capital Management, L.L.C., an Illinois limited liability company. The managing member of Dearborn Capital Management, L.L.C. is Dearborn Capital Management, Ltd., an Illinois corporation whose sole shareholder is David M. Kavanagh.
Grant Park invests through independent professional commodity trading advisors retained by the general partner. At
September 30, 2008, Rabar Market Research, Inc., EMC Capital Management, Inc., Eckhardt Trading Company, or ETC, Graham Capital Management, L.P., Winton Capital Management Limited, Welton Investment Corporation, Global Advisors L.P., and Transtrend B.V. serve as Grant Park’s commodity trading advisors. Each of the trading advisors is registered as a commodity trading advisor under the Commodity Exchange Act and is a member of the NFA. As of September 30, 2008, the general partner allocated Grant Park’s net assets among its core trading advisors Rabar, EMC and Welton and non-core trading advisors Graham, ETC, Global
20
Advisors and Transtrend. No more than twenty five percent of Grant Park’s assets are allocated to any one trading advisor. The general partner may terminate or replace the trading advisors or retain additional trading advisors in its sole discretion.
Effective June 1, 2007, the general partner reallocated the portion of Grant Park’s net assets previously allocated to Winton
Capital Management Limited (“Winton”) to the Dearborn Select Master Fund, SPC – Winton Segregated Portfolio – Class GP (the “GP Class”). Dearborn Select Master Fund, SPC (“Dearborn Select”) was incorporated under the laws of the Cayman Islands on April 7, 2006 and is a private investment fund organized as a segregated portfolio company with limited liability. The GP Class allocates the assets invested by Grant Park to Winton through one or more managed accounts, to be traded pursuant to Winton’s Diversified Program, the same trading program Winton previously traded for Grant Park. Grant Park owns all of the outstanding Class GP units of the GP Class. There have been no changes to the existing clearing broker arrangements/brokerage charge and no material changes to the other fees and expenses allocated to Grant Park as a result of this reallocation. The general partner of Grant Park is also the Investment Manager of Dearborn Select. Critical Accounting Policies
Grant Park’s most significant accounting policy is the valuation of its assets invested in other commodity investment pools and in U.S. and international futures and forward contracts, options contracts and other interests in commodities. Grant Park primarily invests in exchange-traded contracts, valued based upon exchange settlement prices. The remainder of its investments are non-exchange-traded contracts with valuation of those investments based on third-party quoted dealer values on the Interbank market. With the valuation of the investments easily obtained, there is little or no judgment or uncertainty involved in the valuation of investments, and accordingly, it is unlikely that materially different amounts would be reported under different conditions using different but reasonably plausible assumptions. Grant Park’s significant accounting policies are described in detail in Note 1 of the Financial Statements.
Valuation of Financial Instruments Proper valuation of financial instruments is a critical component of Grant Park’s financial statement preparation. On January 1, 2008, Grant Park adopted Statement of Financial Accounting Standards No. 157, Fair Value Measurements (“SFAS No. 157”) as it relates to financial assets and financial liabilities. SFAS No. 157 is effective for fiscal years beginning after November 15, 2007, except for nonfinancial assets and nonfinancial liabilities that are recognized or disclosed at fair value in the financial statements on a nonrecurring basis for which delayed application is permitted until fiscal years beginning after November 15, 2008.
SFAS No. 157 defines fair value as the price that would be received to sell an asset or paid to transfer a liability in an orderly transaction between market participants at the measurement date and sets out a fair value hierarchy. The fair value hierarchy gives the highest priority to quoted prices in active markets for identical assets or liabilities (Level 1) and the lowest priority to unobservable inputs (Level 3). Inputs are broadly defined under SFAS 157 as assumptions market participants would use in pricing an asset or liability. The three levels of the fair value hierarchy under SFAS 157 are described below:
Level 1. Unadjusted quoted prices in active markets for identical assets or liabilities that the reporting entity has the ability to
access at the measurement date. Level 2. Inputs other than quoted prices within Level 1 that are observable for the asset or liability, either directly or
indirectly. A significant adjustment to a Level 2 input could result in the Level 2 measurement becoming a Level 3 measurement. Level 3. Inputs are unobservable for the asset or liability. The following section describes the valuation techniques used by Grant Park to measure different financial instruments at fair
value and includes the level within the fair value hierarchy in which the financial instrument is categorized. Fair value of exchange-traded contracts is based upon exchange settlement prices. Fair value of non-exchange-traded contracts is based on third party quoted dealer values on the Interbank market. Government-sponsored enterprises and commercial paper are stated at cost plus accrued interest, which approximates fair value. These financial instruments are classified in Level 1 of the fair value hierarchy. Grant Park’s investment in the Dearborn Select Master Fund, SPC – Winton Segregated Portfolio – Class GP (the “GP Class”) is reported in the statement of financial condition at fair value. Fair value ordinarily is the value determined by the management of the GP Class in accordance with the valuation policies of the GP Class and as reported at the time of Grant Park’s valuation. Generally, the fair value of Grant Park’s investment in the GP Class represents the amount that Grant Park could reasonably expect to receive from the GP Class if Grant Park’s investment was redeemed at the time of valuation, based on information reasonably available at the time the valuation is made and that Grant Park believes to be reliable. This financial instrument is classified in Level 3 of the fair value hierarchy.
21
The following table presents Grant Park’s fair value hierarchy for those assets and liabilities measured at fair value on a
recurring basis as of September 30, 2008:
Assets Level 1 Level 2 Level 3 Total U.S. Government Securities $68,598,497 $ - $ - $68,598,497 Futures contracts 8,273,313 - - 8,273,313 Forward contracts (6,981,346) - - (6,981,346) Commercial paper 9,902,203 - - 9,902,203 Government-sponsored enterprises 184,612,965 - - 184,612,965 Investment in Dearborn Select Master Fund, SPC
- - 105,171,951 105,171,951
Financial instruments classified as Level 3 in the fair value hierarchy represent Grant Park’s investment in the GP Class in
which management has used at least one significant unobservable input in the valuation model. The following table presents a reconciliation of activity for the GP Class:
Balance at January 1, 2008 $98,629,036 Total Realized and Unrealized Gains or (Losses) included in Income 10,747,116 Purchases, Issuances and Settlements - Transfers in and (or) out of Level 3 - Balance at March 31, 2008 $109,376,152
Total Realized and Unrealized Gains or (Losses) included in Income 5,690,458 Purchases, Issuances and Settlements - Transfers in and (or) out of Level 3 - Balance at June 30, 2008 $115,066,610
Total Realized and Unrealized Gains or (Losses) included in Income (9,894,659) Purchases, Issuances and Settlements - Transfers in and (or) out of Level 3 - Balance at September 30, 2008 $105,171,951
Capital Resources
Grant Park plans to raise additional capital only through the sale of units pursuant to the continuous offering and does not intend to raise any capital through borrowing. Due to the nature of Grant Park’s business, it does not make any capital expenditures and does not have any capital assets that are not operating capital or assets. Liquidity
Most U.S. futures exchanges limit fluctuations in some futures and options contract prices during a single day by regulations referred to as daily price fluctuation limits or daily limits. During a single trading day, no trades may be executed at prices beyond the daily limit. Once the price of a contract has reached the daily limit for that day, positions in that contract can neither be taken nor liquidated. Futures prices have occasionally moved to the daily limit for several consecutive days with little or no trading. Similar occurrences could prevent Grant Park from promptly liquidating unfavorable positions and subject Grant Park to substantial losses that could exceed the margin initially committed to those trades. In addition, even if futures or options prices do not move to the daily limit, Grant Park may not be able to execute trades at favorable prices, if little trading in the contracts is taking place. Other than these limitations on liquidity, which are inherent in Grant Park’s futures and options trading operations, Grant Park’s assets are expected to be highly liquid.
Results of Operations
Grant Park’s net return, which consists of Grant Park’s trading gains plus interest income less brokerage fees, performance fees, operating costs and offering costs borne by Grant Park, for the quarter ended September 30, 2008 was approximately (6.1)% for the Class A units and (6.3)% for the Class B units. The net asset value at September 30, 2008 was approximately $565.8 million, at December 31, 2007 was approximately $455.7 million and at September 30, 2007 was approximately $432.4 million.
22
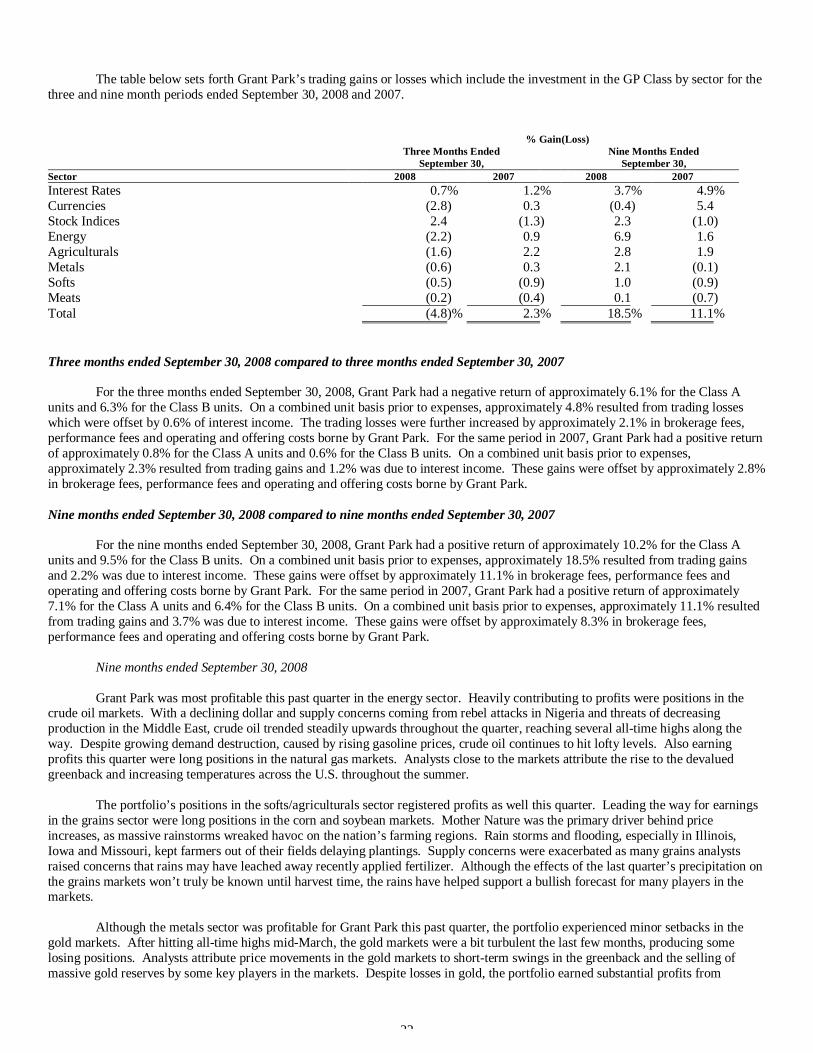
The table below sets forth Grant Park’s trading gains or losses which include the investment in the GP Class by sector for the three and nine month periods ended September 30, 2008 and 2007.
% Gain (Loss)
Three Months Ended
September 30, Nine Months Ended
September 30, Sector 2008 2007 2008 2007 Interest Rates 0.7% 1.2% 3.7% 4.9% Currencies (2.8) 0.3 (0.4) 5.4 Stock Indices 2.4 (1.3) 2.3 (1.0) Energy (2.2) 0.9 6.9 1.6 Agriculturals (1.6) 2.2 2.8 1.9 Metals (0.6) 0.3 2.1 (0.1) Softs (0.5) (0.9) 1.0 (0.9) Meats (0.2) (0.4) 0.1 (0.7) Total (4.8)% 2.3% 18.5% 11.1%
Three months ended September 30, 2008 compared to three months ended September 30, 2007
For the three months ended September 30, 2008, Grant Park had a negative return of approximately 6.1% for the Class A units and 6.3% for the Class B units. On a combined unit basis prior to expenses, approximately 4.8% resulted from trading losses which were offset by 0.6% of interest income. The trading losses were further increased by approximately 2.1% in brokerage fees, performance fees and operating and offering costs borne by Grant Park. For the same period in 2007, Grant Park had a positive return of approximately 0.8% for the Class A units and 0.6% for the Class B units. On a combined unit basis prior to expenses, approximately 2.3% resulted from trading gains and 1.2% was due to interest income. These gains were offset by approximately 2.8% in brokerage fees, performance fees and operating and offering costs borne by Grant Park. Nine months ended September 30, 2008 compared to nine months ended September 30, 2007
For the nine months ended September 30, 2008, Grant Park had a positive return of approximately 10.2% for the Class A units and 9.5% for the Class B units. On a combined unit basis prior to expenses, approximately 18.5% resulted from trading gains and 2.2% was due to interest income. These gains were offset by approximately 11.1% in brokerage fees, performance fees and operating and offering costs borne by Grant Park. For the same period in 2007, Grant Park had a positive return of approximately 7.1% for the Class A units and 6.4% for the Class B units. On a combined unit basis prior to expenses, approximately 11.1% resulted from trading gains and 3.7% was due to interest income. These gains were offset by approximately 8.3% in brokerage fees, performance fees and operating and offering costs borne by Grant Park.
Nine months ended September 30, 2008 Grant Park was most profitable this past quarter in the energy sector. Heavily contributing to profits were positions in the
crude oil markets. With a declining dollar and supply concerns coming from rebel attacks in Nigeria and threats of decreasing production in the Middle East, crude oil trended steadily upwards throughout the quarter, reaching several all-time highs along the way. Despite growing demand destruction, caused by rising gasoline prices, crude oil continues to hit lofty levels. Also earning profits this quarter were long positions in the natural gas markets. Analysts close to the markets attribute the rise to the devalued greenback and increasing temperatures across the U.S. throughout the summer.
The portfolio’s positions in the softs/agriculturals sector registered profits as well this quarter. Leading the way for earnings in the grains sector were long positions in the corn and soybean markets. Mother Nature was the primary driver behind price increases, as massive rainstorms wreaked havoc on the nation’s farming regions. Rain storms and flooding, especially in Illinois, Iowa and Missouri, kept farmers out of their fields delaying plantings. Supply concerns were exacerbated as many grains analysts raised concerns that rains may have leached away recently applied fertilizer. Although the effects of the last quarter’s precipitation on the grains markets won’t truly be known until harvest time, the rains have helped support a bullish forecast for many players in the markets.
Although the metals sector was profitable for Grant Park this past quarter, the portfolio experienced minor setbacks in the gold markets. After hitting all-time highs mid-March, the gold markets were a bit turbulent the last few months, producing some losing positions. Analysts attribute price movements in the gold markets to short-term swings in the greenback and the selling of massive gold reserves by some key players in the markets. Despite losses in gold, the portfolio earned substantial profits from
23
positions in the base metals sectors, especially in those markets traded at the London Metals Exchange.
Adding further gains to the portfolio this quarter were Grant Park’s equity indices positions. Turmoil in the equity markets, caused by the lingering effects of last year’s credit crisis, caused most major indices to decline over the course of the quarter moving in line with Grant Park’s short positions. Both domestically and abroad equities suffered due to declining consumer spending, growing unemployment, increasing commodity prices, and the lack of investor confidence in today’s equity markets. The most profitable were positions in the European Dax and Eurostoxx 50 Indices, and the Nasdaq and S&P 500 here in the U.S.
Grant Park’s short dollar position fared particularly well this past quarter. Among the top performers in the currency sector were dollar positions against the Great British pound, Mexican peso, and Australian dollar. As mentioned earlier, turmoil in the U.S. equity markets and rising inflation due to rising energy and food prices pushed the greenback to near all-time lows against many of its peers. Although profits were more heavily geared towards major currencies, Grant Park reaped profits on positions in various emerging market currencies such as the Colombian peso, Hungarian forint, Brazilian real, and the Peruvian nuevo sol.
The majority of the portfolio’s losses this quarter came from the fixed income markets. After reaching lofty levels in the first quarter, the Japanese Government Bond markets experienced various price swings through the quarter accounting for much of the losses in the sector. A combination of rallying Japanese equity markets and the appointment of a new Bank of Japan Governor caused a near 5% slide in JGB prices moving against Grant Park’s long positions early in the quarter. As Grant Park’s positions reversed and became long JGBs, the portfolio was again met by adverse price moves as the JGB rallied back when speculators sought out a safer investment during a near 6% drop in Japan’s Nikkei Index. Here in the U.S., with a very similar exposure throughout the quarter, positions in the Eurodollar market produced similar results to that of those in the JGBs. Long Eurodollar positions in the first half of the quarter experienced setbacks during a downwards trend due to plummeting equity indices, while at the tail-end of the quarter, recently flipped short Eurodollar positions were met with adverse market moves. The month-end surge in prices was attributed to speculators driving up yields in response to an announcement from Fed Chairman, Ben Bernanke, stating that the U.S. could be adopting a firmer monetary policy in the months to come.
Key trading developments for Grant Park during the first nine months of 2008 include the following: Grant Park recorded gains for the month of January. Class A units were up 2.49% and Class B units were up 2.42%. Grant
Park’s long positions in the interest rate sector posted gains after the US Federal Reserve cut short-term interest rates by 75 basis points during a rare inter-meeting move on January 22nd. Positions in the shorter dated products benefited as prices for Eurodollars soared on the news and rallied further after the central bank elected to reduce rates by an additional 50 basis points during its regularly scheduled meeting at the end of the month. A report showing a drop in December payrolls also pushed fixed income prices higher. Grain prices rallied during the month, resulting in gains to Grant Park’s long positions in the soft/agricultural commodity sector. The largest profits came from the corn market after prices rallied in response to a US Department of Agriculture report that estimated the size of US corn inventories to be 20% lower than previous USDA forecasts. Soybean and wheat prices were also higher on speculation that falling grain stockpiles could substantially increase competition for planting acreage. Long positions in the metals sector benefited as gold prices soared during the month, rallying more than 9% as investors continued to purchase the precious metal in an effort to protect themselves from the uncertainty of global financial markets and a weaker US dollar. The decision by the Fed to ease interest rates also contributed to higher gold prices. Energy prices sagged during January, resulting in losses to long positions in the sector. Crude oil and unleaded gasoline positions sustained the largest setbacks as investors speculated that an economic downturn in the US could translate into decreased demand. Short positions in natural gas reported losses after prices rose in response to falling temperatures across the country. Currency positions sustained losses, particularly in the cross-rate markets where the euro depreciated against the Japanese yen on speculation that European interest rates could be headed lower during 2008. Long positions in the Canadian and Australian dollars were dealt losses on speculation that a slowdown in the US economy could lessen the demand for raw materials from those countries. Lastly, long positions in the stock indices posted losses as continued concerns over financial institutions’ exposure to sub-prime debt and the possibility of a US recession sent global equity markets lower by month’s end.
Grant Park recorded gains for the month of February. Class A units were up 9.66% and Class B units were up 9.58%. Long
positions in the soft/agricultural commodities sector provided the largest gains for Grant Park during February after soybean, corn and wheat prices finished the month at or near record levels on concerns over the availability of grain stocks. Prices initially rose after the USDA reduced its forecasts for 2008 ending wheat inventories by 20 million bushels. The rally continued into the end of the month, fueled by reports of damage to Chinese crops and weakness in the US dollar. Coffee also rallied during the period, resulting in gains as analysts suggested that investors were purchasing soft commodities as a possible hedge against inflation. Energy prices also rose during the month, resulting in gains for the sector. Production problems out of Nigeria combined with forecasts of bitterly cold temperatures across the US pushed crude and heating oil prices higher at the onset of February; prices continued higher throughout the month on the weak US dollar and comments from Federal Reserve Chairman Ben Bernanke indicating the central bank’s willingness to implement additional rate cuts in order to combat a sluggish economy. Base and precious metals markets rallied during the month, resulting in profits. Reports that copper inventories were at their lowest levels since November spurred the red metal higher by month’s end. Platinum and palladium prices also gained. Long positions in gold reported gains after prices rose in response to a higher-than-expected reading on US consumer prices. Short positions in the US dollar advanced as the greenback weakened against
24
its major trading partners on the Fed Chairman’s comments regarding the economy and monetary policy. The dollar continued its slide, reaching new historical lows against the euro on reports of falling US home prices, a drop in durable goods orders, weak consumer confidence data and stagnant manufacturing numbers. Prices for interest rate instruments were higher during the month, resulting in gains. The largest profits in the sector came from long positions in the Japanese Government Bond market after prices there rose in response to falling industrial production and inflation data. Talk of further rate cuts in the US benefited long positions in the Eurodollar market. Lastly, short positions in the stock index sector reported gains as global equities markets finished February at lower levels. Uncertainty as to the depth of the ongoing credit crisis, along with tepid service sector data and disappointing earnings reports out of the US and Europe, pushed stock prices lower as investors fretted over the possibility of a recession in the US.
Grant Park recorded losses in the month of March. Class A units were down 0.63% and Class B units were down 0.70%. Long positions in the softs/agricultural commodities sector were the primary contributors to this month’s losses. Positions in the soybean complex sustained setbacks as soybean prices closed at a new 3-month low after reports showed an increase in 2008 U.S. planting estimates. A sell-off in the coffee market added to losses as analysts suggested that investors liquidated profitable long positions in the wake of February’s rally in commodity prices. Long metals positions, both in the industrial and precious sectors, registered losses as a mid-month rally in the U.S. dollar drove commodity prices lower. Positions in gold, copper, palladium, and platinum were the biggest contributors to sector losses. Grant Park experienced modest gains in the equity indices sector, as profitable positions in the European indices outweighed losses incurred from positions in the U.S. and Japanese equity markets. Fueled by a falling Japanese government bond market, the fixed income sector registered gains this past month. After a powerful surge in February, analysts charged the sell-off in the Japanese fixed income markets to poor results posted from the most recent Japanese bond auction. Next to the currency sector, positions in the energy markets were the most profitable for Grant Park. A late-month rally across the sector added gains to long positions. Analysts suggest that the linchpin to rising energy prices was a March 21st Department of Energy Report that quoted big drops in refinery utilization rates. Lastly, currency positions were profitable with the bulk of the gains coming from the euro and Japanese yen markets. Despite the brief mid-month dollar rally, the euro reached new all-time highs against the greenback, as talk of a U.S. recession was accompanied by the news of J.P. Morgan’s buyout of Bear Stearns. The Japanese yen fluctuated intra-month on increased fears of a U.S. recession and falling demand for Japanese fixed income products, before finishing the month lower against the dollar, producing modest gains for the portfolio’s short yen positions.
Grant Park recorded losses in April. Class A units were down 0.13% and Class B units were down 0.20%. Grant Park’s positions in fixed income registered losses in April. The majority of the setbacks came from long positions in the Japanese Government Bond (JGB) markets. After an impressive rally in March, JGBs plummeted early in the month due to technical profit-taking by traders looking to get a jump on performance early in the new Japanese fiscal year. Adding to the decline was a drop in demand for Japanese fixed income products as was witnessed through the poor results of 2008’s first Japanese bond auction. Rallies in the U.S. equity markets moved against Grant Park’s short positions last month. Speculators drove equity markets upwards on beliefs that the U.S. economy is slowly turning a corner. Supporting these beliefs was news of large capital infusions at financial firms such as Lehman Brothers and UBS, and strong earnings reports from technology firms such as Google, IBM, and Intel. Short positions in international equity indices, namely the Dax and Nikkei 225, also experienced setbacks on visions of an improving economy. Long positions in the metals markets, namely gold, finished slightly negative this month. Despite a steady uptrend in the first half of the month, gold ended April slightly lower. Gold prices were driven down by many speculators liquidating their positions in response to a strengthening U.S. dollar. Despite losses in the livestock sector, the softs/agriculturals portion of the portfolio produced modest gains this month. Long positions in the corn and soybean markets became profitable as ongoing poor weather conditions tormented Midwest farming regions. Delayed plantings due to heavy rains and cool temperatures fueled the upsurge. Grant Park’s currency positions posted gains this month. The effects of a rally in the U.S. dollar against the portfolio’s short positions were offset by profitable uptrends in various minor currency crosses. Positions in the Mexican peso, Singapore dollar, South African rand, and Columbian peso contributed to the sector’s gains. Long positions across the entire energy sector proved to be profitable this month as many of the energy markets hit new all-time highs. Crude oil was the biggest contributor to the sector as it reached a high of $119.93 per barrel. The rally in the crude markets was driven by supply concerns from some of the globe’s biggest oil producing nations. Violence in Nigeria against various Exxon Mobil production facilities and refusal of OPEC to increase crude supply were the main drivers behind this month’s energy moves.
Grant Park recorded gains in the month of May. Class A units were up 2.11% and Class B units were up 2.03%. Grant
Park’s positions in the energy complex were again the drivers in the portfolio’s performance this month. Still predominantly long across the sector, Grant Park earned substantial profits as the energy markets endured a strong sector-wide uptrend. The biggest contributions came from rallies in the crude oil markets. Despite some intra-month price swings, crude oil finished the month $14.62 per barrel (or 12.97%) higher than last month’s close. Although the price of crude was most heavily affected this month by swings in the U.S. dollar, price shifts in the energy markets were also caused by increased energy demand from China after a horrid earthquake rattled the nation’s hydroelectric power markets. Due to short positions in the European financial markets, the portfolio performed particularly well in the fixed income sector. The most notable positions were those in the Euro bund and Euribor (European Interbank Offered Rate) markets. On strong economic data throughout the month, speculators began to adopt a view that the European economy may be in an upswing. This renewed confidence drove up yields on most major financial instruments, pushing prices in the futures markets (which move inversely to yields) downwards. Although ultimately profitable in the sector, short positions in U.S. fixed income markets experienced setbacks. Continued domestic economic distress moved the U.S. based Eurodollar market upwards
25
against the portfolio’s short positions. The continuing woes of a weakened global economy helped Grant Park’s currency positions in May. Mixed economic reports from the U.S., Great Britain, the Eurozone, and Australia caused big moves in the currency markets both with and against the portfolio’s positions. Grant Park fared well as profits stemming from short dollar positions against the Aussie dollar, Turkish lira, and Mexican peso outweighed losses sustained from the more established currencies such as the British pound, euro, and Canadian dollar. The bulk of the portfolio’s setbacks in May stemmed from positions in the equity indices markets. Grant Park’s continued short exposure to the U.S. equity markets experienced losses as the front contract in the e-mini S&P 500 rallied 5.82%. Short positions in France’s CAC40 and Germany’s Dax indices also produced losses, as better-than expected economic data released near month’s end spurred a boost in the equity markets. Grant Park’s positions in the metals markets provided mixed results for the portfolio, but were net negative for May. Losses incurred due to steady decreases in copper prices against the portfolio’s long positions accounted for most of the setbacks in the sector. Analysts attribute the move to the recent firming of the U.S. dollar and decreased demand from China due to a recent earthquake. On the short side however, modest profits were earned on a 22.77% slide in the nickel markets, which moved alongside Grant Park’s short positions. Lastly, the softs/agriculturals sector did not prove profitable this past month, as the portfolio registered minor losses in the grains markets. Corn prices dipped more than 2%, moving against long positions, in May in response to a strengthening dollar. Many analysts also attribute declines in grains prices to a late-month drop in energy prices.
Grant Park recorded gains in June. Class A units were up 3.06% and Class B units were up 2.99%. Grant Park’s long
positions in the energy sector performed well as they rode a sector wide surge in prices this past month. A combination of a weakening greenback and production concerns were the biggest contributors to the heightened prices in the sector. The rebel group, MEND (The Movement for the Emancipation of the Niger Delta), continued their attacks on major oil producers in Africa, putting a clamp on the region’s ability to produce the highly sought after light sweet crude oil. The comments made by two separate figureheads in the Middle East that oil prices could reach as high as $170 by summer’s end and that oil producer Libya may reduce oil production caused a big question mark to appear over the supply-side of the crude oil markets in the region, which drove prices upwards. Another profitable sector for Grant Park this past month was the softs/agriculturals sector. Leading the way was the portfolio’s long corn positions. Massive rains sweeping across the Midwest, especially in Illinois, Iowa, and Missouri, kept many farmers out of their fields, as their corn crop spent a good portion of June under as much as six inches of water in certain areas. In the face of weakening ethanol demand, Mother Nature drove corn prices up 20.45% before month’s end. Short positions in the domestic and foreign equity indices markets fared well in June as well, due to the lingering effects of last year’s credit crisis on global stocks. At home in the U.S., equity markets waned throughout the month on the heels of poor earning reports from some of the nation’s biggest financial firms. Sky-rocketing oil prices and fleeting consumer confidence, both domestically and abroad, surely had an effect on the equity markets as well. Grant Park performed well in the base metals sector in the month of June. Fueled by supply constraints, price increases in the aluminum and copper markets were the main causes for profits in the sector. A labor strike in Peru, a major producer of copper, and a temporary shutdown of a crucial aluminum producing plant here in the U.S. caused a shock in the market pushing the price of both metals up more than 7% for the month. Also having a positive impact on the metals markets (as with most other commodities) was a decline in the value of the U.S. dollar. Investments into the European fixed income markets experienced gains this past month. Price movements were primarily driven by the announcement from the European Central Bank, stating they would be adopting a firmer monetary policy in the coming months to combat inflation. The statement, which came as a surprise to many speculators given the poor economic outlook in Europe, pushed interest rate yields to near all-time highs, diving financial futures downwards in line with Grant Park’s short positions. Despite losses in the domestic fixed income, short positions in the European markets, mainly the Euribor and German bund markets, overcame the setbacks and made the sector profitable for June. The bulk of the setbacks this month came from the currency markets. Contributing to losses were long positions in the New Zealand dollar. Despite a slight retracement mid-month, the kiwi declined against the greenback on poor consumer confidence and unemployment figures in the region. Dips in the kiwi can also be attributed to the announcement made by the Reserve Bank of New Zealand’s Governor saying that although rates remained steady in June, they would most likely be cut in the months to come. Further adding to setbacks for the sector were losses in various minor currency positions, including the Colombian peso, Czech koruna, and Icelandic krona.
Grant Park recorded losses in July. Class A units were down 5.06% and Class B units were down 5.12%. Long positions in
the energy sector incurred the fund’s largest losses during July after crude oil prices fell more than 11% by month’s end. Prices broke after Hurricane Bertha moved away from crude oil platforms in the Gulf of Mexico and continued lower throughout the month as reports released in the U.S and abroad indicated that high prices were driving the demand for fuel lower. A near-sector wide downshift in softs/agriculturals moved against Grant Park’s positions. After several months of positive performance, our positions in corn and soybeans declined by 20% and 12%, respectively. After substantial rains and flooding restricted planting activities earlier in the summer, improved weather since has allowed farmers to plant more acreage. Analysts are therefore expecting a more bountiful grain harvest, with a corresponding decrease in future prices. Grant Park’s positions in this sector created losses during July, including short positions in the German bund and Euribor (European Interbank Offered Rate) markets. The release of a poor economic outlook for the European economy drove prices upward. Falling consumer confidence levels, poor growth data for Germany, and record high inflation all helped paint the backdrop for rallies in the fixed income markets. Position in the metals sector registered minor losses. A month-end rally in the US dollar put pressure on the sector and had a large impact on the 5.7% decrease in copper prices. Further, Congress’ discussion of intervening in the grain and energy markets caused many larger institutions to liquidate positions and move to the sidelines of the commodity markets. Grant Park posted gains in the equity indices markets, driven
26
by our short positions in the European and U.S. equity markets. In the U.S., the possible failure of Fannie Mae and Freddie Mac sent ripples through the markets, causing many speculators to lose confidence and begin liquidating their equity positions. Prices declined and the markets quieted after Congress voted to protect the two mortgage lenders. Abroad, European indices, including the CAC 40 and IBEX 35, declined as poor economic conditions in the Eurozone continued. The ECB President’s failure to raise rates, coupled with Germany’s announcement that the second quarter would produce another quarter of negative growth played a big part in putting downward pressure on share prices. Grant Park’s positions across a variety of non-major currencies registered profits. Early in the month, the portfolio’s short dollar positions earned modest gains. The biggest contributors to the sector were the long positions in the Colombian and Mexican pesos. In response to rising inflation across Mexico and Latin America, both the Colombian and Mexican Central Banks opted to raise rates, giving their respective currencies a boost. These positions along with long positions in the Brazilian real and Turkish lira lifted sector performance and offset minor losses in the euro and Great British pound.
Grant Park recorded losses for August. Class A units were down 2.41% and Class B units were down 2.48%. Least
profitable for Grant Park this past month were positions in the currency markets. A steady weakening of the Australian dollar against the greenback was the primary driver behind setbacks in the sector. The large dip in the currency was the result of declining gold prices (one of Australia’s biggest exports) and speculation that the Reserve Bank of Australia would soon be cutting interest rates to aid the nation’s slowing economy. Heavy volatility in the grains and softs markets proved trying for performance throughout August. Long positions in the soybean market experienced losses on a 15.92% mid-month decline in prices, only to recoup much of the setbacks on a strong upwards retracement by month’s end. In the gold markets, Grant Park endured setbacks both on long and short positions. Like many other commodities in August, gold prices were primarily driven by moves in crude oil and the U.S. dollar. Early in the month, decreasing energy prices and a strengthening dollar, caused gold prices to move against the portfolio’s long positions and touch the lowest level of 2008 at $774.0 per ounce. As Grant Park’s positions became short mid-month, they were quickly met with reversals. Grant Park’s positions in the energy sector also underperformed this past month. The bulk of the sector’s setbacks were predominantly found in the crude oil markets. Crude slipped 7.27% in August, moving in contrast to positions. A boost in the greenback was most likely the primary cause for declines in the energy markets. Although finishing lower for the month, the markets experienced a strong pullback in the last week of trading due to concerns that Hurricane Gustav would impede energy production in the Gulf of Mexico, which helped offset some losses. Despite modest profits in the Stockholm OMX 30 Index, Grant Park finished August negative in the equity index sector. Setbacks were diversified amongst positions in the largest indices in North America, Europe, Asia, and Austria. Further adding to losses was an upwards revision of U.S. GDP growth for the second quarter, which gave share prices a boost. Finally, the Asia/Pacific fixed income markets accounted for the bulk of Grant Park’s profits this past month, with long positions in the Japanese and Australian markets performing particularly well. Persisting concerns about the status of the Japanese economy was the primary driver in the JGB markets.
Grant Park recorded gains in September. Class A units were up 1.31% and Class B units were up 1.24%. Grant Park’s short
positions in the equity indices markets were the largest factor in our positive performance in this sector during September. Share prices declined because of on-going uncertainty about the global economy. The collapse of major financial institutions, including Washington Mutual and Lehman Brothers, and the need for a $700 billion government restructuring program reinforced the negative performance of equities. Our short positions in the base metals markets created strong gains for the portfolio throughout the month. The slide in metals prices was likely caused by a sharp decrease in the demand for raw materials as a result of tightening credit markets. The devastating effect of the credit crunch on the economies of the BRIC nations (Brazil, Russia, India, and China) was especially key, as this group of nations has accounted for much of the demand in base metals over the past several years. The portfolio earned modest gains in the livestock markets this past month. A strengthening dollar and the declines in the prices of grains and feeds combined to create substantial pressure on the live cattle and lean hogs markets. Results in the fixed income sector were mixed this past month. Long positions in the European and U.S. debt markets earned modest profits as declining equities prices drove investors into the more risk-averse debt markets. Profits were slightly offset, however, as long positions in the Asian equity markets endured setbacks in the Japanese Government Bond and Euroyen markets. After heavy volatility in the energy sector, Grant Park finished slightly lower for the month. Predominantly following moves in the U.S. dollar all throughout September, the crude oil markets experienced a rally mid-month, resulting in minor losses for the portfolio’s short positions. The currency sector was not profitable during September. Losses were generally caused due to short positions on the U.S. dollar against a number of emerging market currencies, including the Brazilian real, Indonesian rupiah, Indian rupee, and Turkish lira. The consequences of the on-going credit crisis have been felt around the world and its impact is most clearly visible in the emerging nations. Speculators have been driving these emerging currencies down against the dollar with the expectation that the U.S. will be able to recover faster than other less established nations.
Nine months ended September 30, 2007 Grant Park ended the third quarter of 2007 with a net year-to-date gain of 7.06% in the Class A units and 6.38% in the Class
B units. Gains were fairly evenly distributed amongst market sectors during the course of a volatile quarter of trading. The decision by the U.S. Federal Reserve to lower the Federal Funds target rate by 50 basis points at its September meeting was preceded by the first reported drop in U.S. non-farm payrolls in four years and widespread concern that the problems plaguing sub-prime mortgage lenders could lead to a global liquidity crisis. Fixed income prices rallied on speculation of further rate cuts and flight-to-quality buying as investors sought protection from the volatility of equity markets, which had weakened considerably at the beginning of the
27
quarter on mortgage market worries. Currency markets adopted a mercurial tone as the Fed’s rate cut, along with speculation of future rate reductions, sent the U.S. dollar to a new all-time low versus the euro; the Canadian dollar reached parity with the dollar for the first time in thirty years, buoyed by a spike in commodity prices. Wheat prices rallied to new historical highs amid growing foreign demand and extremely dry conditions across Australian growing regions. Crude oil prices traded above $80 for the first time, pushed higher on worries over sectarian strife in Nigeria, falling inventories and speculation that further interest rate reductions in the U.S. could spur economic growth. Gold prices were also higher during the quarter, trading above the $700 level on investors’ concerns that the Fed’s easier monetary policy could lead to longer term inflation.
Key trading developments for Grant Park during the first nine months of 2007 include the following:
Grant Park recorded gains for the month of January. Class A units were up 1.25% and Class B units were up 1.18%. Positions in the interest rate sector recorded the largest gains for the month, particularly in the foreign markets. Short positions in the British short sterling and long gilt contracts reported gains after an unexpected rate hike by the Bank of England resulted in lower prices for interest rate instruments. Short positions in the domestic market were also profitable after prices for Eurodollars fell in response to data that suggested some inflationary risk for the U.S. economy. Prices for crude oil sank to 18-month lows, resulting in gains for short positions in the energy sector. Comments by the Saudi ambassador to the U.S. indicating that oil prices could go lower forced a sell off in crude as investors speculated that OPEC might not push for further production cuts. The U.S. Department of Energy reported an unexpected rise in gasoline inventories, resulting in gains for short positions in unleaded gasoline. Positions in the stock indices reported gains as lower energy prices boosted global share markets. Long positions in the German DAX and S&P Composite Index registered the largest gains. Long positions in nickel resulted in gains as the threat of a strike at a Canadian mine kept prices for the raw material at higher levels; short positions in copper also gained ground as prices fell in response to a downturn in the U.S. housing market. Long positions in the currency sector sustained losses as the New Zealand and Australian dollars depreciated against the U.S. dollar, mainly due to weakness in the majority of base metal markets. Lastly, losses were incurred from long positions in the soft/agricultural commodities markets where prices for corn fell after weakness in the energy markets led to the perception of lessening demand for ethanol distillates; an upward revision in U.S. beef production resulted in losses for long positions in the livestock markets.
Grant Park sustained losses for the month of February. Class A units were down 4.18% while Class B units were down 4.25%. Long positions in the stock indices sustained substantial losses as a result of the plunge in global share prices near the end of the month. Chinese stock prices fell more than 8% in a single session as investors became concerned that the Chinese government might introduce new regulations designed to discourage illegal share offerings and investments using borrowed money. The weakness spilled over into Europe and the United States as program trading on behalf of institutional investors resulted in massive liquidation of stocks. Short positions in the interest rate sector incurred losses as falling share prices caused investors to reallocate assets to fixed income instruments. Additionally, prices along every part of the yield curve rallied in response to weaker than expected data on US durable goods and new home sales. Positions in Eurodollars and LIFFE Euribor experienced the largest setbacks. The currency sector reported negative performance after the Bank of Japan raised short-term rates, resulting in losses to short positions in the Japanese yen; the yen was also higher as the result of investors unwinding “carry” trades in which they initially sold the yen to buy currencies from economies offering a better rate of return. Short positions in the energy sector incurred losses as a combination of cold weather and renewed concerns over Iran’s nuclear ambitions resulted in higher prices for crude oil and related products. Long positions in the base metals resulted in gains, particularly in the nickel market where increased demand from steel mills combined with supply concerns resulted in a 14% price increase during the month. Lastly, long positions in the soybean complex recorded gains after prices there rallied on strong demand for US exports, especially from China. Prices were also higher on speculation that farmers would dedicate less acreage to soybean production and more to corn as a result of the growing demand for ethanol. Live cattle prices were also higher, benefiting long positions.
Grant Park recorded losses for the month of March. Class A units were down 4.55% and Class B units were down 4.62%.
Positions in the global stock indices reported losses as equity markets continued to trade lower in the wake of the massive stock liquidation at the end of February. Concerns over the tense situation between the West and Iran, rising energy prices and a slowing U.S. housing market all contributed to lower share prices. Reports from the U.S. Department of Agriculture indicating that U.S. farmers planned on increasing corn crop acreage by 15% in 2007 resulted in losses for long positions in corn. Prices in the soybean complex also fell during the month, resulting in net losses for the soft/agricultural commodity sector. Short positions in the Eurodollar market experienced setbacks as prices for interest rate instruments rallied in response to a lower-than-expected reading on U.S. fourth-quarter GDP, a plunge in new home sales and a contraction in U.S. manufacturing. Indications that the U.S. Federal Reserve Bank might drop its tightening bias on short-term interest rates also pushed prices higher. Falling equity markets continued to have a negative effect on precious metals prices, sending gold to lower levels as investors liquidated positions in order to offset losses from equity positions. Concerns over slow U.S. economic growth also contributed to lower prices. Positions in the currency sector registered losses after the U.S. dollar traded higher relative to its major counterparts. A lower-than-anticipated release of the February unemployment rate helped push the dollar higher, resulting in losses to long positions in the Canadian dollar. Positions in the cross rates also lost ground as the euro depreciated against the Japanese yen. Lastly, long positions in the energy sector reported gains as prices for unleaded gasoline rallied in response to strong U.S. demand and reports of shrinking inventories. Unleaded gas prices were up a little more than 9% for the month.
28
Grant Park recorded gains for the month of April. Class A units were up 5.23% and Class B units were up 5.15%. Positions
in the currency sector resulted in the largest gains during April as the U.S. dollar depreciated relative to its major trading partners. Weak U.S. economic data combined with the perception that European interest rates could be headed higher caused the dollar to lose ground to the euro and British pound. Profits also came from cross rate positions as the euro traded higher against the Japanese yen after lower-than-expected data on Japanese consumer prices and industrial production was released. Global share markets traded higher throughout the month, resulting in gains for stock index positions. Forecasts for increased global economic growth along with positive earnings reports were the main drivers of the upside move in stocks. The largest gains came from positions in the S&P Composite Index and German DAX. Base metal positions reported gains as prices for raw materials continued to trade higher during April. A 17% rise in Chinese demand for copper from the same period one year ago spurred that contract to five-month highs on the London Metals Exchange. Nickel prices were also higher as worries over supply continued to concern traders. Rising inventories combined with technically based selling were profitable for short positions in the cotton market, leading to gains for the soft/agricultural commodities sector. Sugar prices were also lower resulting in gains for short positions. Long positions in the energy sector were profitable as unleaded gasoline prices moved higher on reports of falling inventories. Speculation that warmer weather could result in increased fuel demand also contributed to the rally. Lastly, short positions in the U.S. fixed income markets were dealt losses as prices for Treasury instruments and interest rate products traded higher in response to weaker-than-expected data on U.S. consumer prices.
Grant Park recorded gains for the month of May. Class A units were up 4.60% and Class B units were up 4.52%. Short
positions in the global fixed income markets were responsible for the majority of gains during the month. Prices for European fixed income products were lower on expectations that better-than-expected economic growth in the Euro zone would prompt the European Central Bank to tighten monetary policy at least twice more during 2007. Short positions in the Canadian bill market were profitable after prices fell in response to a government report showing that inflation accelerated during April, causing the Bank of Canada to signal a rate hike. Global share prices were higher by month’s end, resulting in gains for Grant Park’s long positions in the sector. The rally in stock prices was fueled by a combination of strong corporate earnings, continued merger and acquisition activity, and reports of slowing inflation in the United States. Positions in the currency sector posted gains as the news of higher inflation in Canada sent the Canadian dollar higher against the U.S. dollar. Long positions in the Mexican peso were also profitable after that currency settled the month higher relative to the dollar. Prices in the soybean complex were higher, resulting in gains for Grant Park. Reports that key growing regions have received less than a quarter of their average moisture drove bean prices higher as investors became concerned with the possibility of crop damage. The prospect of increased consumption of bio-diesel fuel added a bid to the soybean oil market. Metals positions sustained losses during the month as prices for industrial metals fell in response to China’s efforts to cool stock market speculation by increasing the stamp tax. Long positions in copper lost ground as prices fell on lower Chinese imports. Nickel longs were dealt losses following reports of growing inventories. Lastly, weakness in global energy prices resulted in losses for long positions in the sector. Natural gas positions incurred the largest setbacks.
Grant Park posted gains for the month of June. Class A units were up 4.16% and Class B units were up 4.09%. Short
positions in the currency sector gained ground after the Japanese yen weakened against most of its major counterparts. The yen depreciated relative to the U.S. dollar and the euro as investors sold the yen in order to purchase assets denominated in higher yielding currencies. Long positions in the New Zealand dollar were also profitable. Short positions in the interest rate sector yielded gains as prices for Australian fixed income products fell on news that the Australian economy grew at its fastest pace in three years, increasing the likelihood of a rate hike by the Reserve Bank of Australia. The release of a stronger-than-anticipated employment report put further downward pressure on prices. Additionally, short positions in Euro bunds were also profitable. Soybean prices rallied during the month, resulting in gains for long positions in the soft/agricultural commodities sector. The rally in the bean complex came after the USDA announced that U.S farmers had planted 64 million acres of soybeans, considerably less than analysts’ estimates. An increase in the amount of acreage dedicated to corn production was a contributing factor, analysts said. Short positions in the natural gas market led to gains for the energy sector. Analysts suggested that moderate temperatures across much of the United States led to rising inventories and lower prices. Long positions in the metals sector reported losses after reports of higher nickel inventories forced prices for the industrial metal lower. Lastly, long positions in the stock index sector incurred losses after global share markets settled the month lower on concerns over the possibility of higher inflation. The S&P Composite Index and Spanish IBEX sustained the largest losses as investors worried that the U.S. Federal Reserve and European Central Bank might be forced to raise short-term interest rates in the event of higher prices.
Grant Park sustained losses during the month of July. Class A units were down 3.72% and Class B units were down 3.79%.
Short positions in the interest rate sector were dealt losses after Standard and Poor’s lowered ratings on some European collateralized debt obligations. The decision pushed prices for foreign government-backed securities higher as investors reduced their exposure to corporate debt. Weakness in global equities at month’s end caused flight-to-quality buying in global government fixed income markets, resulting in further losses. Long positions in the stock indices reported losses after further worries over the state of U.S. sub-prime loans caused a massive sell-off in domestic and foreign equities markets. Disappointing earnings reports also pushed share markets lower. Currency positions lost ground after the Japanese yen rallied materially against virtually all of its trading partners. Investors, looking for protection from losses incurred in equity markets, unwound positions in which they initially borrowed yen in order to invest in assets denominated in higher-yielding currencies, sending the yen higher relative to the euro and New Zealand
29
dollar. Concerns over a possible credit squeeze sent metals prices lower, resulting in losses for long positions. Gold prices fell as investors sought to reduce their exposure to commodities risk; a rally in the U.S. dollar also contributed to weakness in gold prices. Weakness in commodity prices extended to the soft/agricultural sector where favorable growing conditions and well-timed rains resulted in lower grain prices. Long positions in the soybean complex sustained the largest losses in the sector. Lastly, positions in the energy sector were profitable during the month. Long positions in crude oil gained as prices rallied amid reports of falling U.S. inventories and the possibility of renewed sectarian strife in Nigeria. Natural gas prices fell, benefiting short positions.
Grant Park posted trading losses during the month of August. Class A units were down 3.71% and Class B units were down
3.78%. Currency positions sustained the largest setbacks. Foreign currencies fell relative to the dollar after investors fled some emerging market currencies for the relative safety of the greenback; long positions in the euro lost ground after the European Central Bank added liquidity to the banking system in order to head off a possible credit squeeze. Short positions in the Japanese yen were dealt losses as investors, seeking to preserve capital, liquidated massive positions in the yen carry trade, leading to losses from cross-rate positions in the New Zealand dollar. Long positions in the energy sector reported losses as prices for crude oil fell on speculation that a possible credit crunch could result in an expanded economic slowdown. Further selling occurred after Hurricane Dean failed to disrupt refinery operations in the Gulf of Mexico. Similar to the energy sector, long positions in the base metals sustained losses as prices for copper and aluminum fell on concerns that a broader economic slowdown would reduce demand for raw materials. Long positions in the soft/agricultural commodities sector experienced losses as prices for soybean oil fell after rains across key growing regions improved the outlook for the current crop. Coffee prices also fell, adding to losses. Long positions in the wheat market mitigated losses in the sector as strong demand for U.S. exports pushed prices higher for the month. Reduced long positions in the global stock indices sustained losses as share prices weakened further on concerns that U.S. subprime mortgage defaults could have a material effect on credit availability. Lastly, long positions in the fixed income sector recorded gains as prices for Japanese Government Bonds rallied as investors sought protection from the volatility of the equity and corporate bond markets. The likelihood that the Bank of Japan would refrain from raising interest rates in the current environment also resulted in higher prices.
Grant Park recorded gains for the month of September. Class A units were up 8.78% and Class B units were up 8.70%. The
release of the U.S. non-farm payrolls number sent the U.S. dollar lower against most of its foreign counterparts, resulting in gains for the currency sector. Analysts had estimated that the economy had grown by 110,000 jobs during August but the report showed that 4,000 jobs had actually been lost and that previously released July and June jobs data had been downwardly revised. The news prompted the U.S. Federal Reserve Bank to lower the federal funds rate by 50 basis points, putting further pressure on the dollar, which established all-time lows against the euro and reached parity with the Canadian dollar for the first time in 30 years. Positions in the soft/agricultural commodities sector were profitable as grain prices rallied throughout the month. Wheat markets provided the bulk of gains as strong demand from India and the Middle East combined with extremely dry conditions in Australian growing regions pushed prices higher. Soybean prices also gained after the USDA reported that the amount of acreage dedicated to soybean production would probably shrink over the next few years. The initial payrolls report and the subsequent rate cut by the Federal Reserve benefited long positions in the metals sector as gold prices traded above the $700 level for the first time in 16 months. The precious metal moved closer to the $750 range after the rate cut as investors, worried about the prospects of rising prices, purchased gold as a possible protection against longer term inflation. Long positions in the energy sector gained ground as prices rallied during the month on strong demand from all directions. The Fed’s decision to cut rates pushed crude oil above $80 for the first time as traders speculated that the rate cut would stimulate the economy and lead to stronger demand. Gains also came from the stock index sector after the Hong Kong Hang Seng rallied on the news that China’s currency regulator had relaxed investment restrictions, allowing more Chinese citizens to invest in Hong Kong share markets. Lastly, long positions in the interest rate sector posted gains after the Federal Reserve’s aggressive rate cut sent prices for domestic fixed income instruments higher. Long positions in the Eurodollar contract posted the largest profits as prices at the short end of the yield curve gained the most ground. Off-Balance Sheet Risk
Off-balance sheet risk refers to an unrecorded potential liability that, even though it does not appear on the balance sheet, may result in future obligation or loss. Grant Park trades in futures and other commodity interest contracts and is therefore a party to financial instruments with elements of off-balance sheet market and credit risk. In entering into these contracts, Grant Park faces the market risk that these contracts may be significantly influenced by market conditions, such as interest rate volatility, resulting in such contracts being less valuable. If the markets should move against all of the commodity interest positions of Grant Park at the same time, and if Grant Park were unable to offset positions, Grant Park could lose all of its assets and the limited partners would realize a 100% loss. Grant Park minimizes market risk through real-time monitoring of open positions, diversification of the portfolio and maintenance of a margin-to-equity ratio that rarely exceeds 25%. All positions of Grant Park are valued each day on a mark-to-market basis.
In addition to market risk, in entering into commodity interest contracts there is a credit risk that a counterparty will not be
able to meet its obligations to Grant Park. The counterparty for futures and options on futures contracts traded in the United States and on most non-U.S. futures exchanges is the clearing organization associated with such exchange. In general, clearing organizations are backed by the corporate members of the clearing organization who are required to share any financial burden resulting from the non-performance by one of their members and, as such, should significantly reduce this credit risk. In cases where the clearing
30
organization is not backed by the clearing members, like some non-U.S. exchanges, it is normally backed by a consortium of banks or other financial institutions.
In the case of forward contracts, over-the-counter options contracts or swap contracts, which are traded on the interbank or
other institutional market rather than on exchanges, the counterparty is generally a single bank or other financial institution, rather than a central clearing organization backed by a group of financial institutions. As a result, there will likely be greater counterparty credit risk in these transactions. Grant Park trades only with those counterparties that it believes to be creditworthy. Nonetheless, the clearing member, clearing organization or other counterparty to these transactions may not be able to meet its obligations to Grant Park, in which case Grant Park could suffer significant losses on these contracts.
In the normal course of business, Grant Park enters into contracts and agreements that contain a variety of representations and
warranties and which provide general indemnifications. Grant Park’s maximum exposure under these arrangements is unknown, as this would involve future claims that may be made against Grant Park that have not yet occurred. Grant Park expects the risk of any future obligation under these indemnifications to be remote. Item 3. Quantitative and Qualitative Disclosures About Market Risk Introduction
Grant Park is a speculative commodity pool. The market sensitive instruments held by it are acquired for speculative trading purposes, and all or a substantial amount of Grant Park’s assets are subject to the risk of trading loss. Unlike an operating company, the risk of market sensitive instruments is integral, not incidental, to Grant Park’s business.
Market movements result in frequent changes in the fair value of Grant Park’s open positions and, consequently, in its
earnings and cash flow. Grant Park’s market risk is influenced by a wide variety of factors, including the level and volatility of exchange rates, interest rates, equity price levels, the fair value of financial instruments and contracts, market prices for base and precious metals, energy complexes and other commodities, the diversification effects among Grant Park’s open positions and the liquidity of the markets in which it trades.
Grant Park rapidly acquires and liquidates both long and short positions in a wide range of different markets. Consequently,
it is not possible to predict how a particular future market scenario will affect performance. Grant Park’s current trading advisors all employ trend-following strategies that rely on sustained movements in price. Erratic, choppy, sideways trading markets and sharp reversals in movements can materially and adversely affect Grant Park’s results. Grant Park’s past performance is not necessarily indicative of its future results.
Value at risk is a measure of the maximum amount that Grant Park could reasonably be expected to lose in a given market
sector in a given day. However, the inherent uncertainty of Grant Park’s speculative trading and the recurrence in the markets traded by Grant Park of market movements far exceeding expectations could result in actual trading or non-trading losses far beyond the indicated value at risk or Grant Park’s experience to date. This risk is often referred to as the risk of ruin. In light of the foregoing as well as the risks and uncertainties intrinsic to all future projections, the inclusion of the quantification included in this section should not be considered to constitute any assurance or representation that Grant Park’s losses in any market sector will be limited to value at risk or by Grant Park’s attempts to manage its market risk. Moreover, value at risk may be defined differently as used by other commodity pools or in other contexts.
Materiality, as used in this section, is based on an assessment of reasonably possible market movements and the potential losses caused by such movements, taking into account the leverage, and multiplier features of Grant Park’s market sensitive instruments.
The following quantitative and qualitative disclosures regarding Grant Park’s market risk exposures contain forward-looking statements. All quantitative and qualitative disclosures in this section are deemed to be forward-looking statements, except for statements of historical fact and descriptions of how Grant Park manages its risk exposure. Grant Park’s primary market risk exposures, as well as the strategies used and to be used by its trading advisors for managing such exposures are subject to numerous uncertainties, contingencies and risks, any one of which could cause the actual results of Grant Park’s risk controls to differ materially from the objectives of such strategies. Government interventions, defaults and expropriations, illiquid markets, the emergence of dominant fundamental factors, political upheavals, changes in historical price relationships, an influx of new market participants, increased regulation and many other factors could result in material losses as well as in material changes to the risk exposures and the risk management strategies of Grant Park. Grant Park’s current market exposure and/or risk management strategies may not be effective in either the short- or long-term and may change materially. Quantitative Market Risk
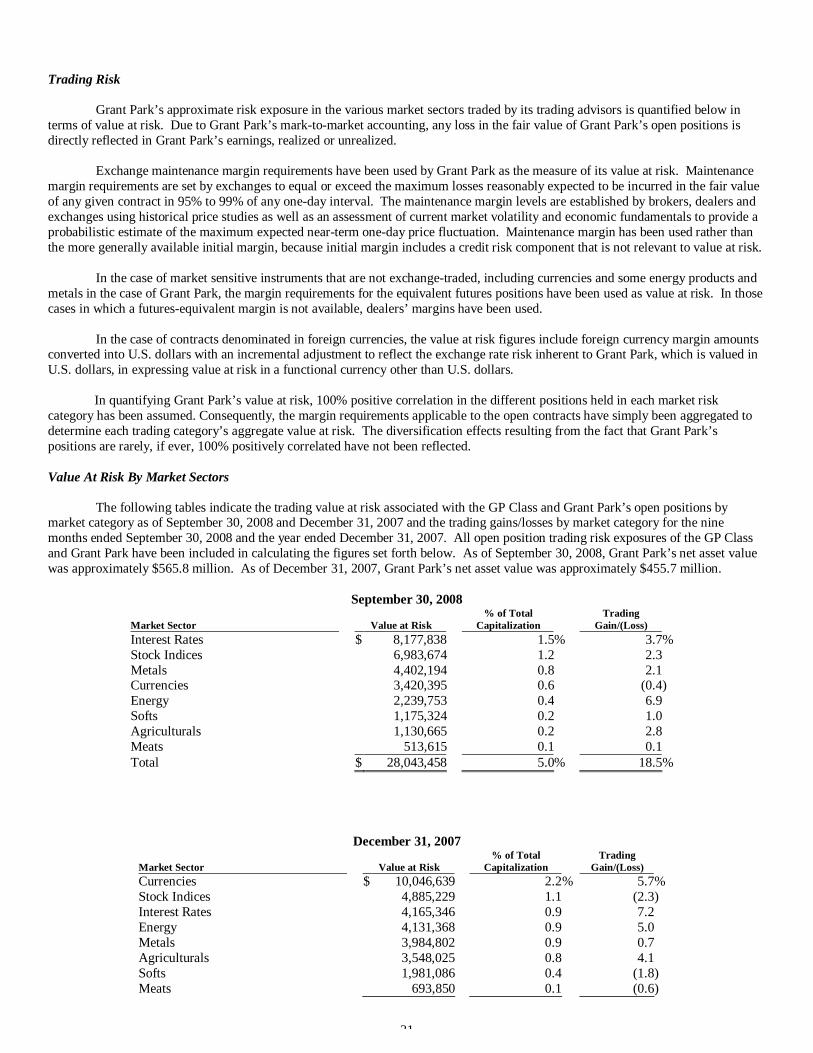
31
Trading Risk
Grant Park’s approximate risk exposure in the various market sectors traded by its trading advisors is quantified below in terms of value at risk. Due to Grant Park’s mark-to-market accounting, any loss in the fair value of Grant Park’s open positions is directly reflected in Grant Park’s earnings, realized or unrealized.
Exchange maintenance margin requirements have been used by Grant Park as the measure of its value at risk. Maintenance margin requirements are set by exchanges to equal or exceed the maximum losses reasonably expected to be incurred in the fair value of any given contract in 95% to 99% of any one-day interval. The maintenance margin levels are established by brokers, dealers and exchanges using historical price studies as well as an assessment of current market volatility and economic fundamentals to provide a probabilistic estimate of the maximum expected near-term one-day price fluctuation. Maintenance margin has been used rather than the more generally available initial margin, because initial margin includes a credit risk component that is not relevant to value at risk.
In the case of market sensitive instruments that are not exchange-traded, including currencies and some energy products and metals in the case of Grant Park, the margin requirements for the equivalent futures positions have been used as value at risk. In those cases in which a futures-equivalent margin is not available, dealers’ margins have been used.
In the case of contracts denominated in foreign currencies, the value at risk figures include foreign currency margin amounts converted into U.S. dollars with an incremental adjustment to reflect the exchange rate risk inherent to Grant Park, which is valued in U.S. dollars, in expressing value at risk in a functional currency other than U.S. dollars.
In quantifying Grant Park’s value at risk, 100% positive correlation in the different positions held in each market risk
category has been assumed. Consequently, the margin requirements applicable to the open contracts have simply been aggregated to determine each trading category’s aggregate value at risk. The diversification effects resulting from the fact that Grant Park’s positions are rarely, if ever, 100% positively correlated have not been reflected. Value At Risk By Market Sectors
The following tables indicate the trading value at risk associated with the GP Class and Grant Park’s open positions by market category as of September 30, 2008 and December 31, 2007 and the trading gains/losses by market category for the nine months ended September 30, 2008 and the year ended December 31, 2007. All open position trading risk exposures of the GP Class and Grant Park have been included in calculating the figures set forth below. As of September 30, 2008, Grant Park’s net asset value was approximately $565.8 million. As of December 31, 2007, Grant Park’s net asset value was approximately $455.7 million.
September 30, 2008
Market Sector Value at Risk % of Total
Capitalization Trading
Gain/(Loss)
Interest Rates $ 8,177,838 1.5% 3.7% Stock Indices 6,983,674 1.2 2.3 Metals 4,402,194 0.8 2.1 Currencies 3,420,395 0.6 (0.4) Energy 2,239,753 0.4 6.9 Softs 1,175,324 0.2 1.0 Agriculturals 1,130,665 0.2 2.8 Meats 513,615 0.1 0.1 Total $ 28,043,458 5.0% 18.5%
December 31, 2007
Market Sector Value at Risk % of Total
Capitalization Trading
Gain/(Loss)
Currencies $ 10,046,639 2.2 % 5.7% Stock Indices 4,885,229 1.1 (2.3) Interest Rates 4,165,346 0.9 7.2 Energy 4,131,368 0.9 5.0 Metals 3,984,802 0.9 0.7 Agriculturals 3,548,025 0.8 4.1 Softs 1,981,086 0.4 (1.8) Meats 693,850 0.1 (0.6)
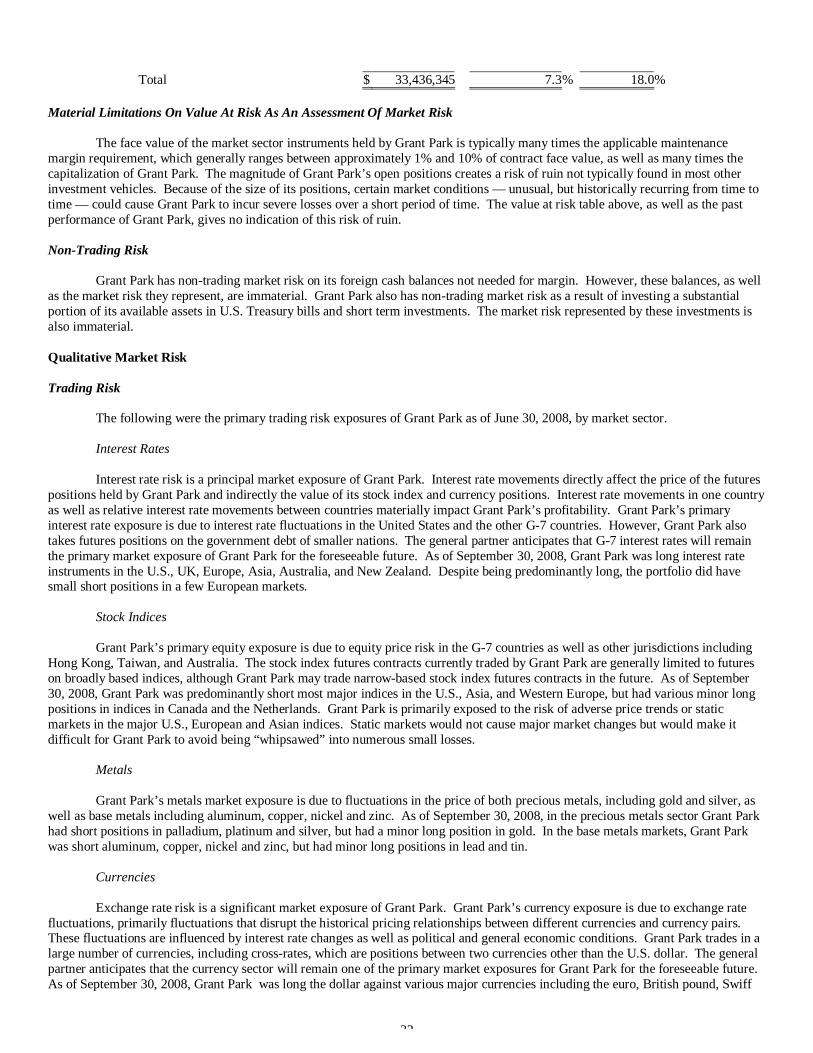
32
Total $ 33,436,345 7.3 % 18.0%
Material Limitations On Value At Risk As An Assessment Of Market Risk
The face value of the market sector instruments held by Grant Park is typically many times the applicable maintenance margin requirement, which generally ranges between approximately 1% and 10% of contract face value, as well as many times the capitalization of Grant Park. The magnitude of Grant Park’s open positions creates a risk of ruin not typically found in most other investment vehicles. Because of the size of its positions, certain market conditions — unusual, but historically recurring from time to time — could cause Grant Park to incur severe losses over a short period of time. The value at risk table above, as well as the past performance of Grant Park, gives no indication of this risk of ruin. Non-Trading Risk
Grant Park has non-trading market risk on its foreign cash balances not needed for margin. However, these balances, as well as the market risk they represent, are immaterial. Grant Park also has non-trading market risk as a result of investing a substantial portion of its available assets in U.S. Treasury bills and short term investments. The market risk represented by these investments is also immaterial.
Qualitative Market Risk Trading Risk
The following were the primary trading risk exposures of Grant Park as of June 30, 2008, by market sector. Interest Rates
Interest rate risk is a principal market exposure of Grant Park. Interest rate movements directly affect the price of the futures
positions held by Grant Park and indirectly the value of its stock index and currency positions. Interest rate movements in one country as well as relative interest rate movements between countries materially impact Grant Park’s profitability. Grant Park’s primary interest rate exposure is due to interest rate fluctuations in the United States and the other G-7 countries. However, Grant Park also takes futures positions on the government debt of smaller nations. The general partner anticipates that G-7 interest rates will remain the primary market exposure of Grant Park for the foreseeable future. As of September 30, 2008, Grant Park was long interest rate instruments in the U.S., UK, Europe, Asia, Australia, and New Zealand. Despite being predominantly long, the portfolio did have small short positions in a few European markets.
Stock Indices
Grant Park’s primary equity exposure is due to equity price risk in the G-7 countries as well as other jurisdictions including
Hong Kong, Taiwan, and Australia. The stock index futures contracts currently traded by Grant Park are generally limited to futures on broadly based indices, although Grant Park may trade narrow-based stock index futures contracts in the future. As of September 30, 2008, Grant Park was predominantly short most major indices in the U.S., Asia, and Western Europe, but had various minor long positions in indices in Canada and the Netherlands. Grant Park is primarily exposed to the risk of adverse price trends or static markets in the major U.S., European and Asian indices. Static markets would not cause major market changes but would make it difficult for Grant Park to avoid being “whipsawed” into numerous small losses.
Metals
Grant Park’s metals market exposure is due to fluctuations in the price of both precious metals, including gold and silver, as
well as base metals including aluminum, copper, nickel and zinc. As of September 30, 2008, in the precious metals sector Grant Park had short positions in palladium, platinum and silver, but had a minor long position in gold. In the base metals markets, Grant Park was short aluminum, copper, nickel and zinc, but had minor long positions in lead and tin.
Currencies
Exchange rate risk is a significant market exposure of Grant Park. Grant Park’s currency exposure is due to exchange rate
fluctuations, primarily fluctuations that disrupt the historical pricing relationships between different currencies and currency pairs. These fluctuations are influenced by interest rate changes as well as political and general economic conditions. Grant Park trades in a large number of currencies, including cross-rates, which are positions between two currencies other than the U.S. dollar. The general partner anticipates that the currency sector will remain one of the primary market exposures for Grant Park for the foreseeable future. As of September 30, 2008, Grant Park was long the dollar against various major currencies including the euro, British pound, Swiff
33
franc and Canadian dollar, but was short the dollar against the Japanese yen and Mexican peso. In general, with the exception of the Japanese yen and Mexican peso, a stronger dollar against most major currencies would benefit Grant Park.
Energy
Grant Park’s primary energy market exposure is due to gas and oil price movements, often resulting from political
developments in the Middle East, Nigeria, Russia and Venezuela. As of September 30, 2008, the energy market exposure of Grant Park was predominantly short. Short energy positions included brent crude, gas oil, unleaded gasoline, natural gas, and a minor positions in crude oil. Oil and gas prices can be volatile and substantial profits and losses have been and are expected to continue to be experienced in this market.
Agricultural/Meat/Softs
Grant Park’s primary commodities exposure is due to agricultural price movements, which are often directly affected by
severe or unexpected weather conditions as well as other factors. As of September 30, 2008, in the grains markets, Grant Park had short positions in soybeans, corn, and wheat and a long position in soybean meal. The portfolio was predominantly short the livestock markets with positions in feeder cattle, live cattle and lean hogs. In the softs/industrials sectors, Grant Park was short cocoa, sugar, and cotton, while Grant Park had minor long positions in cocoa. Non-Trading Risk Exposure
The following were the only non-trading risk exposures of Grant Park as of September 30, 2008.
Foreign Currency Balances
Grant Park’s primary foreign currency balances are in Japanese yen, British pounds, Euros and Australian dollars. The trading advisors regularly convert foreign currency balances to U.S. dollars in an attempt to control Grant Park’s non-trading risk.
Cash Management
Grant Park maintains a portion of its assets at its clearing brokers as well as at Lake Forest Bank & Trust Company. These assets, which may range from 5% to 25% of Grant Park’s value, are held in U.S. Treasury securities and/or Treasury repurchase agreements. The balance of Grant Park’s assets, which range from 75% to 95%, are invested in investment grade money market instruments purchased and managed at Middleton Dickinson Capital Management, LLC which are held in a separate, segregated account at State Street Bank and Trust Company or are purchased directly through BMO Capital Markets Corporation, a member of BMO Financial Group. Violent fluctuations in prevailing interest rates or changes in other economic conditions could cause mark-to-market losses on Grant Park’s cash management income.
Managing Risk Exposure
The general partner monitors and controls Grant Park’s risk exposure on a daily basis through financial, credit and risk management monitoring systems and, accordingly, believes that it has effective procedures for evaluating and limiting the credit and market risks to which Grant Park is subject.
The general partner monitors Grant Park’s performance and the concentration of its open positions and consults with the trading advisors concerning Grant Park’s overall risk profile. If the general partner felt it necessary to do so, the general partner could require the trading advisors to close out individual positions as well as enter positions traded on behalf of Grant Park. However, any intervention would be a highly unusual event. The general partner primarily relies on the trading advisors’ own risk control policies while maintaining a general supervisory overview of Grant Park’s market risk exposures. The trading advisors apply their own risk management policies to their trading. The trading advisors often follow diversification guidelines, margin limits and stop loss points to exit a position. The trading advisors’ research of risk management often suggests ongoing modifications to their trading programs.
As part of the general partner’s risk management, the general partner periodically meets with the trading advisors to discuss their risk management and to look for any material changes to the trading advisors’ portfolio balance and trading techniques. The trading advisors are required to notify the general partner of any material changes to their programs. General
From time to time, certain regulatory or self-regulatory organizations have proposed increased margin requirements on futures contracts. Because Grant Park generally will use a small percentage of assets as margin, Grant Park does not believe that any
34
increase in margin requirements, as proposed, will have a material effect on Grant Park’s operations.
Item 4T. Controls and Procedures
As of the end of the period covered by this report, the general partner carried out an evaluation, under the supervision and with the participation of the general partner’s management, including its principal executive officer and principal financial officer, of the effectiveness of the design and operation of Grant Park’s disclosure controls and procedures as contemplated by Rule 13a-15 of the Securities Exchange Act of 1934, as amended. Based on and as of the date of that evaluation, the general partner’s principal executive officer and principal financial officer concluded that Grant Park’s disclosure controls and procedures are effective, in all material respects, in timely alerting them to material information relating to Grant Park required to be included in the reports required to be filed or submitted by Grant Park with the SEC under the Exchange Act.
There was no change in Grant Park's internal control over financial reporting in the quarter ended September 30, 2008 that
has materially affected, or is reasonably likely to materially affect, Grant Park's internal control over financial reporting.
PART II- OTHER INFORMATION
Item 1A. Risk Factors There have been no material changes to the risk factors relating to Grant Park from those previously disclosed in Grant Park’s Annual Report on Form 10-K for its fiscal year ended December 31, 2007, in response to Item 1A to Part 1 of Form 10-K.
Item 2. Unregistered Sales of Equity Securities and Use of Proceeds On June 30, 2003, the Securities and Exchange Commission declared effective Grant Park’s Registration Statement on Form S-1 (Reg. No. 333-104317), pursuant to which Grant Park registered for public offering $20 million in aggregate amount of Class A Limited Partnership Units and $180 million in aggregate amount of Class B Limited Partnership Units. Also as of June 30, 2003, Grant Park adopted the Third Amended and Restated Limited Partnership Agreement, which included modifications required under the Guidelines for the Registration of Commodity Pool Programs promulgated by the North American Securities Administrators Association, Inc. and requested by various state securities regulators in connection with Grant Park’s public offering. Grant Park subsequently registered up to an additional $200 million in aggregate amount of Class A and Class B Limited Partnership Units for sale on a Registration Statement on Form S-1 (Reg. No. 333-113297) on March 30, 2004, and an additional $700 million in aggregate amount of Class A and Class B Limited Partnership Units for sale on a Registration Statement on Form S-1 (File No. 333-119338) on December 1, 2004. Class A Limited Partnership Units and Class B Limited Partnership Units are being offered on a continuous basis at subsequent closing dates at a price equal to the net asset value per unit as of the close of business on each applicable closing date, which is the last business day of each month. The close of business on July 31, 2003 marked the initial closing date of the public offering. The lead selling agents for the offering are UBS Financial Services Inc., A.G. Edwards & Sons, Inc. and Oppenheimer & Co. Inc. As of the close of business on July 1, 2008, the Class A Limited Partnership Units were offered at $1,537.12 with 1,392.87 units being sold, and the Class B Limited Partnership Units were offered at $1,335.57 with 9,114.99 units being sold. As of the close of business on August 1, 2008, the Class A Limited Partnership Units were offered at $1,459.41 with 789.26 units being sold, and the Class B Limited Partnership Units were offered at $1,267.14 with 13,409.71 units being sold. As of the close of business on September 1, 2008, the Class A Limited Partnership Units were offered at $1,424.27 with 1,824.40 units being sold, and the Class B Limited Partnership Units were offered at $1,235.75 with 9,971.16 units being sold. Expenses incurred in connection with the organization and offering of the units, which are paid by the general partner and then reimbursed by Grant Park on a monthly basis (with such reimbursement limited to 0.2% annually of the net asset value of the Class A Units and through August 31, 2005, 0.9% annually, and effective September 1, 2005, 0.6% annually of the Class B Units) amounted to a total of approximately $539,855 for the three months ended September 30, 2008. The proceeds of the offering are deposited in Grant Park’s bank and brokerage accounts for the purpose of engaging in trading activities in accordance with Grant Park’s trading policies and its trading advisors’ respective trading strategies.
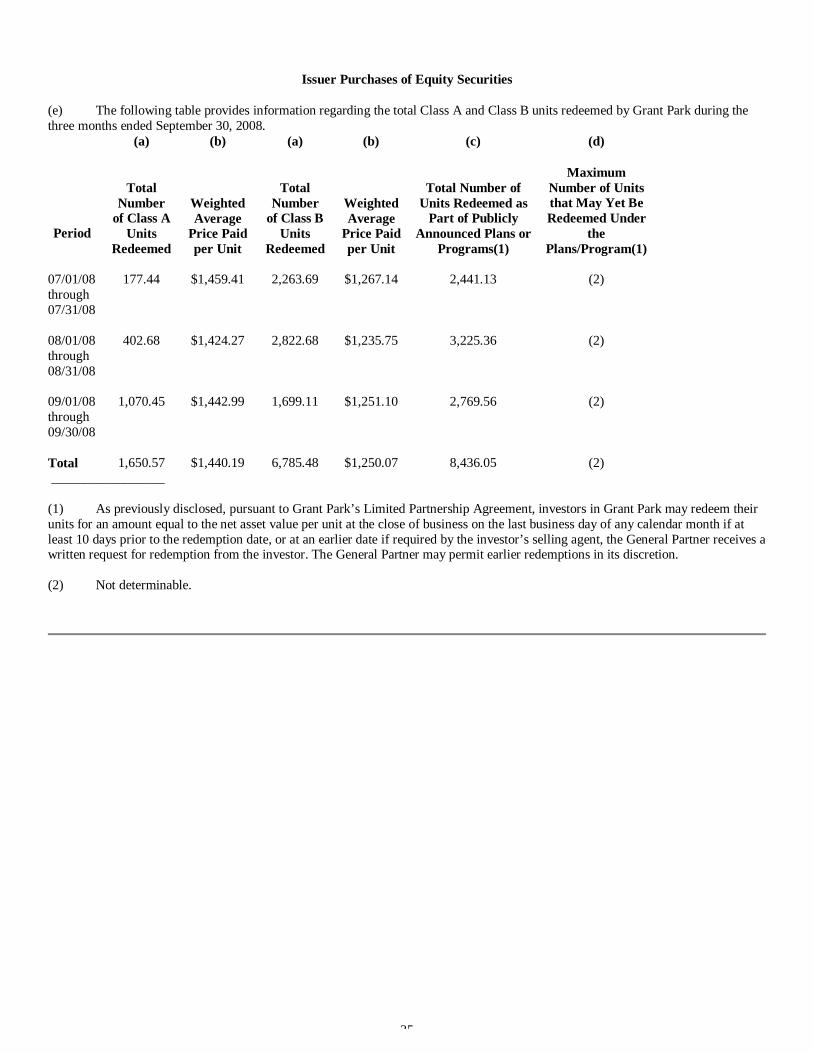
35
Issuer Purchases of Equity Securities
(e) The following table provides information regarding the total Class A and Class B units redeemed by Grant Park during the three months ended September 30, 2008.
(a) (b) (a) (b) (c) (d)
Period
Total Number
of Class A Units
Redeemed
Weighted Average
Price Paid per Unit
Total Number
of Class B Units
Redeemed
Weighted Average
Price Paid per Unit
Total Number of Units Redeemed as
Part of Publicly Announced Plans or
Programs(1)
Maximum Number of Units that May Yet Be Redeemed Under
the Plans/Program(1)
07/01/08 through 07/31/08
177.44
$1,459.41
2,263.69
$1,267.14
2,441.13
(2)
08/01/08 through 08/31/08
402.68
$1,424.27
2,822.68
$1,235.75
3,225.36
(2)
09/01/08 through 09/30/08
1,070.45
$1,442.99
1,699.11
$1,251.10
2,769.56
(2)
Total
1,650.57
$1,440.19
6,785.48
$1,250.07
8,436.05
(2)
_________________ (1) As previously disclosed, pursuant to Grant Park’s Limited Partnership Agreement, investors in Grant Park may redeem their units for an amount equal to the net asset value per unit at the close of business on the last business day of any calendar month if at least 10 days prior to the redemption date, or at an earlier date if required by the investor’s selling agent, the General Partner receives a written request for redemption from the investor. The General Partner may permit earlier redemptions in its discretion. (2) Not determinable.
36
Item 6. Exhibits (a) Exhibits
31.1 Certification of Principal Executive Officer Pursuant to Rule 13a-14(a) under the Securities Exchange Act
of 1934
31.2 Certification of Principal Financial Officer Pursuant to Rule 13a-14(a) under the Securities Exchange Act
of 1934
32.1 Certification Pursuant to 18 U.S.C. Section 1350, As Adopted Pursuant to Section 906 of the Sarbanes-
Oxley Act of 2002
1
37
SIGNATURES
Pursuant to the requirements of the Securities Exchange Act of 1934, the Registrant has duly caused this report to be signed
on its behalf by the undersigned thereunto duly authorized. GRANT PARK FUTURES FUND LIMITED PARTNERSHIP Date: November , 2008 by: Dearborn Capital Management, L.L.C. its general partner By: /s/ David M. Kavanagh David M. Kavanagh President (principal executive officer) By: /s/ Maureen O’Rourke Maureen O’Rourke Chief Financial Officer (principal financial and accounting officer)
2
38
EXHIBIT 31.1
CERTIFICATION I, David M. Kavanagh, certify that: 1. I have reviewed this quarterly report on Form 10-Q of Grant Park Futures Fund Limited Partnership; 2. Based on my knowledge, this report does not contain any untrue statement of a material fact or omit to state a material fact
necessary to make the statements made, in light of the circumstances under which such statements were made, not misleading with respect to the period covered by this report;
3. Based on my knowledge, the financial statements, and other financial information included in this report, fairly present in all
material respects the financial condition, results of operations and cash flows of the registrant as of, and for, the periods presented in this report;
4. The registrant’s other certifying officer and I are responsible for establishing and maintaining disclosure controls and
procedures (as defined in Exchange Act Rules 13a-15(e) and 15d-15(e)) and internal control over financial reporting (as defined in Exchange Act Rules 13a-15(f) and 15d-15(f)) for the registrant and have: a) Designed such disclosure controls and procedures, or caused such disclosure controls and procedures to be designed
under our supervision, to ensure that material information relating to the registrant, including its consolidated subsidiaries, is made known to us by others within those entities, particularly during the period in which this quarterly report is being prepared;
b) Designed such internal control over financial reporting, or caused such internal control over financial reporting to be
designed under our supervision, to provide reasonable assurance regarding the reliability of financial reporting and the preparation of financial statements for external purposes in accordance with generally accepted accounting principles;
c) Evaluated the effectiveness of the registrant’s disclosure controls and procedures and presented in this report our
conclusions about the effectiveness of the disclosure controls and procedures, as of the end of the period covered by this report based on such evaluation; and
d) Disclosed in this report any change in the registrant’s internal control over financial reporting that occurred during
the registrant’s most recent fiscal quarter (the registrant’s fourth fiscal quarter in the case of an annual report) that has materially affected, or is reasonably likely to materially affect, the registrant’s internal control over financial reporting; and
5. The registrant’s other certifying officer and I have disclosed, based on our most recent evaluation of internal control over
financial reporting, to the registrant’s auditors and the audit committee of registrant’s board of directors (or persons performing the equivalent functions): a) All significant deficiencies and material weaknesses in the design or operation of internal control over financial
reporting which are reasonably likely to adversely affect the registrant’s ability to record, process, summarize and report financial information; and
b) Any fraud, whether or not material, that involves management or other employees who have a significant role in the
registrant’s internal control over financial reporting.
Date: November , 2008 /s/ DAVID M. KAVANAGH David M. Kavanagh President (principal executive officer) Dearborn Capital Management, L.L.C. General Partner
39
EXHIBIT 31.2
CERTIFICATION
I, Maureen O’Rourke, certify that: 1. I have reviewed this quarterly report on Form 10-Q of Grant Park Futures Fund Limited Partnership; 2. Based on my knowledge, this report does not contain any untrue statement of a material fact or omit to state a material fact
necessary to make the statements made, in light of the circumstances under which such statements were made, not misleading with respect to the period covered by this report;
3. Based on my knowledge, the financial statements, and other financial information included in this report, fairly present in all
material respects the financial condition, results of operations and cash flows of the registrant as of, and for, the periods presented in this report;
4. The registrant’s other certifying officer and I are responsible for establishing and maintaining disclosure controls and
procedures (as defined in Exchange Act Rules 13a-15(e) and 15d-15(e)) and internal control over financial reporting (as defined in Exchange Act Rules 13a-15(f) and 15d-15(f)) for the registrant and have: a) Designed such disclosure controls and procedures, or caused such disclosure controls and procedures to be designed
under our supervision, to ensure that material information relating to the registrant, including its consolidated subsidiaries, is made known to us by others within those entities, particularly during the period in which this quarterly report is being prepared;
b) Designed such internal control over financial reporting, or caused such internal control over financial reporting to be
designed under our supervision, to provide reasonable assurance regarding the reliability of financial reporting and the preparation of financial statements for external purposes in accordance with generally accepted accounting principles;
c) Evaluated the effectiveness of the registrant’s disclosure controls and procedures and presented in this report our
conclusions about the effectiveness of the disclosure controls and procedures, as of the end of the period covered by this report based on such evaluation; and
d) Disclosed in this report any change in the registrant’s internal control over financial reporting that occurred during
the registrant’s most recent fiscal quarter (the registrant’s fourth fiscal quarter in the case of an annual report) that has materially affected, or is reasonably likely to materially affect, the registrant’s internal control over financial reporting; and
5. The registrant’s other certifying officer and I have disclosed, based on our most recent evaluation of internal control over
financial reporting, to the registrant’s auditors and the audit committee of registrant’s board of directors (or persons performing the equivalent functions): a) All significant deficiencies and material weaknesses in the design or operation of internal control over financial
reporting which are reasonably likely to adversely affect the registrant’s ability to record, process, summarize and report financial information; and
b) Any fraud, whether or not material, that involves management or other employees who have a significant role in the
registrant’s internal control over financial reporting. Date: November , 2008 /s/ MAUREEN O’ROURKE Maureen O’Rourke Chief Financial Officer Dearborn Capital Management, L.L.C. General Partner
40
EXHIBIT 32.1
CERTIFICATION PURSUANT TO 18 U.S.C. SECTION 1350,
AS ADOPTED PURSUANT TO SECTION 906 OF THE SARBANES-OXLEY ACT OF 2002
Pursuant to 18 U.S.C. § 1350, as created by Section 906 of the Sarbanes-Oxley Act of 2002, each
of the undersigned principal executive officer of Dearborn Capital Management, L.L.C., the general partner (the “General Partner”) of Grant Park Futures Fund Limited Partnership (“Grant Park”), and principal financial officer of the General Partner hereby certifies that:
(1) the accompanying Quarterly Report on Form 10-Q of Grant Park for the quarterly period ended September 30, 2008 (the “Report”) fully complies with the requirements of section 13(a) or 15(d), as applicable, of the Securities Exchange Act of 1934, as amended; and
(2) the information contained in the Report fairly presents, in all material respects, the
financial condition and results of operations of Grant Park. Dated: November , 2008 /s/ David M. Kavanagh David M. Kavanagh President (principal executive officer) Dearborn Capital Management, L.L.C. General Partner /s/ Maureen O’Rourke Maureen O’Rourke Chief Financial Officer Dearborn Capital Management, L.L.C. General Partner
This certification accompanies this Report pursuant to Section 906 of the Sarbanes-Oxley Act of 2002 and shall not be deemed filed by Grant Park for purposes of Section 18 of the Securities Exchange Act of 1934, as amended.