Embed Size (px)
Citation preview

GRAND ETHIOPIAN RENAISSANCE DAM
1
Paper prepared for the 16th Annual Conference on Global Economic Analysis, “New Challenges for
Global Trade in a Rapidly Changing World” Information Building, Shanghai Institute of Foreign
Trade, June 2013
GRAND ETHIOPIAN RENAISSANCE DAM: A GLOBAL CGE MODEL TO ASSESS THE ECONOMIC
EFFECTS ON THE ETHIOPIAN ECONOMY
EMANUELE FERRARI*, SCOTT MCDONALD
*, REHAB OSMAN*
*Oxford Brookes University
Department of Accounting, Finance and Economics – Faculty of Business
WORK IN PROGRESS: PRELIMINARY DRAFT.
PLEASE DO NOT QUOTE WITHOUT PRIOR AGREEMENT WITH THE AUTHORS.
Address for correspondence: Emanuele Ferrari Business School Department of Accounting, Finance and Economics Oxford Brookes University Wheatley Campus Oxford OX33 1HX Email: [email protected] Tel: +44 (0)1865 485671

GRAND ETHIOPIAN RENAISSANCE DAM
2
Abstract The Grand Ethiopian Renaissance DAM (GERD) will become the largest dam and hydroelectric
scheme in Africa; it is also one of the world’s most controversial dam projects and one of four large
scale hydropower projects currently under construction in Ethiopia. Ethiopia’s endowment of water
resources, with its 12 major river basins, is impressive but its potential to exploit is scarcely
developed (AQUASTAT, 2005). It is estimated that over 85% of the Nile waters and sediment
reaching Egypt originate from the Ethiopian highlands. Nevertheless the 1959 Nile Waters Treaty,
between Egypt and Sudan, allocated well over 95% of the estimated available Nile waters to Egypt
(75%) and Sudan (25%) thereby leaving very little to the other 8 states in the Nile basin. This study
uses a variant of the GLOBE_EN, extended by segmenting the electricity generating sector between
hydro and fossil fuel powered electricity generating sections in Ethiopia, Egypt and Rest of Eastern
Africa (that includes Sudan). The simulations are conducted using the recursive dynamic variant of
the GLOBE_EN model. Preliminary results indicate that GERD investments would slow down
development in Ethiopia and that the exports of hydroelectricity need to expand rapidly straight
after the completion of GERD if the project is to be successful.
Table of Contents Abstract ................................................................................................................................................... 2
1. Introduction .................................................................................................................................... 3
2. Literature review ............................................................................................................................. 5
3. The model and the database .......................................................................................................... 5
3.1 Model Description ................................................................................................................... 6
3.2 Dynamics and Baseline ........................................................................................................... 8
4. Scenarios description and results ................................................................................................... 9
5. Results ........................................................................................................................................... 10
5.1 Sensitivity analysis ...................................................................................................................... 10
6. Policy Implications ........................................................................................................................ 10
7. Conclusions ................................................................................................................................... 10
8. Bibliography .................................................................................................................................. 10

GRAND ETHIOPIAN RENAISSANCE DAM
3
1. Introduction According to the Ethiopian government, potential hydro capacity of the country exceeds 45,000MW.
This great potential is mainly attributed to the huge surface water resources flow from highlands.
Despite such potential, the majority of Ethiopians has no access to electricity or experiences energy
insecurity. In addition, the use of traditional fuels, e.g. fire wood, to produce energy aggravates the
issues of soil erosion and forest destruction.
Despite the increasing public investments, the current utilization of hydropower resources is limited
to 2,000 MW which is less than 4.5% of the estimated hydropower potential. Effective development
and management of hydropower is central for sustainable development and economic growth of the
country. The government has embarked in energy production development projects by constructing
various hydropower plants. Amongst is the Grand Ethiopian Renaissance Dam (GERD) project. GERD
is anticipated to be the biggest hydroelectric power project in Africa with a planned installed
capacity of 6,000 MW and 15,128 GW annual. The project would satisfy the increasing domestic
demand for electricity and provide reliable hydropower supply, which are part of support the
country’s Universal Electrification Access Program. Besides, GERD project would enable Ethiopia to
export power through regional interconnection system. In addition to foreign currency earnings,
exporting electricity to the neighbouring countries would enhance the country’s economic
integration in the region . Nevertheless, exports increase could cause the typical Dutch disease
effect; i.e. appreciation of real exchange rate, which can lead to shrinkage in the current exporting
sectors. Given that Ethiopia main exports are agricultural commodities, agricultural may be
negatively affect and consequently the poorer part of the Ethiopian population may suffer negative
outcomes.
Ethiopia has great potentials to develop its water resources since the country is richly endowed with
12 major river basins, even if scarcely developed (AQUASTAT, 2005). Hydropower and irrigation are
the two main future uses of these potential water resources. This paper considers the issue of
energy production from hydropower. It does not deal with other related issues like irrigation
development and distributing Nile water among other riparian states.
The sustained growth of the Ethiopian economy (on average the GDP grew 10% annually between
2004 and 2011 (WDI, 2012)) and the subsequent increased in demand for energy input is
emphasizing the lack of power creation capacity in the country. In the past years, the Ethiopian
Electric Power Corporation (EEPco) had to rationalize power supply once or twice a week as
immediate solution to power shortage (Engida, Eyasu, & Seneshaw , 2011). This energy rationing
policy adversely affected many industrial sectors and obstructed the economy-wide growth.
Currently, 87% of the electricity production comes from hydroelectric sources while the remaining
13% is generated from oil . Out of the 30372.986 thousand tonnes of oil equivalent (ktoe) on a net
calorific value basis, around 7% of energy is imported. In order to meet the increasing demand for
electricity by the growing Ethiopian economy, , the government launched a plan to exploit the
electricity generation potentials in the country. The government has adopted additional five
hydroelectric dams and one wind farm. These projects would magnify power supply from 2,000MW
to 3,270 MW and provide electricity access to 50% of the Ethiopian households. In addition, the
dams would regulate water flows, control floods, and channel water for irrigation purposes (World
Bank, 2010).

GRAND ETHIOPIAN RENAISSANCE DAM
4
The potential expansion of hydropower electricity generation, through the constructions of new
dams, might yield favourable effects in the economy. The sustainable increase in domestic demand
for power supports the expansion of Ethiopia’s hydropower sector. In addition, with possible
expansion of foreign demand, Ethiopia has a great opportunity to become a net electricity exporter,
which in turn strongly accelerates the country’s economic growth. According to the World Bank
(2010): “strengthened hydropower development can both increase near term economic growth and
make the energy system more climate resilient. More reservoir storage distributed over the country
would provide more reliability and protection from regional droughts”. The related water issues,
such as the potential effects on the Ethiopian agriculture as a result of better control of floods and
droughts and the possible consequences of constructing the dam on the two downstream riparian
countries (i.e. Egypt and Sudan), requires more detailed analysis which goes beyond the scope of
this paper.
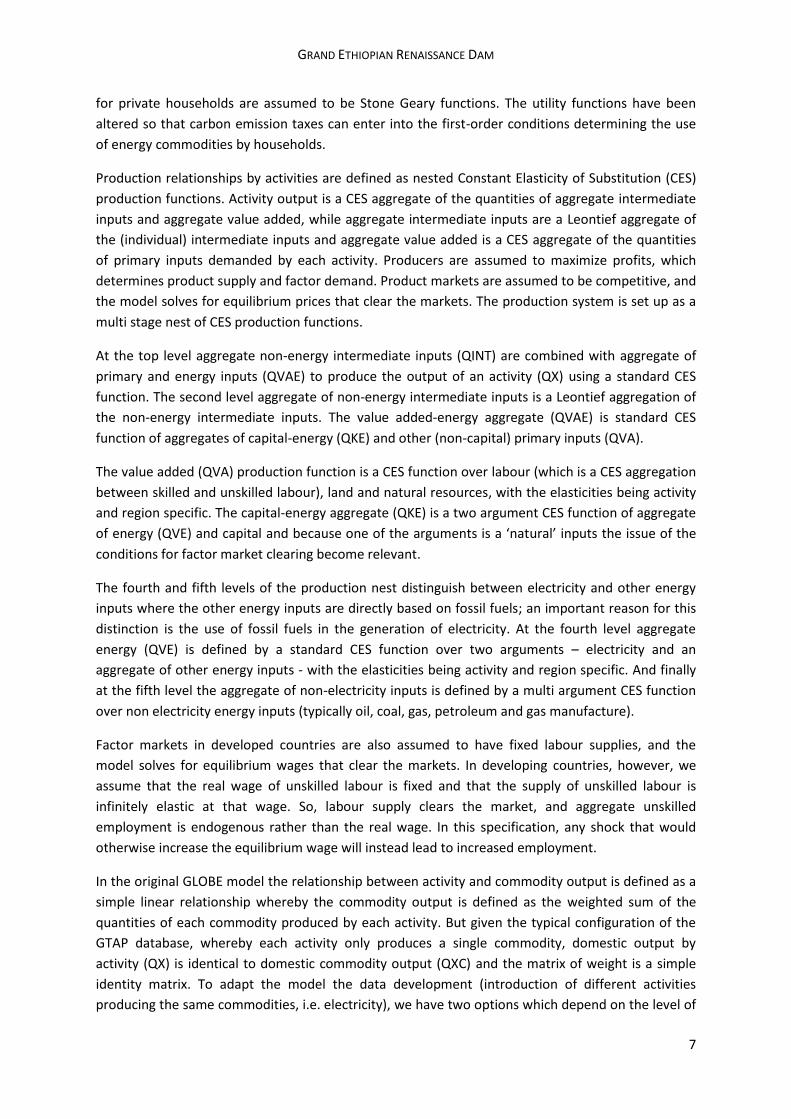
Among the financed projects (
Table 1), the most ambitious one is the construction of the Grand Ethiopian Renaissance Dam
(formerly known as Millennium dam). Launched on April 2nd 2011, by the Ethiopian Prime Minister
Meles Zenawi, the dam is the biggest hydroelectric power project in Africa with an installed capacity
of 6,000 MW and 15,128 GW annual energy. The dam is currently under construction and is
anticipated to be completed in 44 months. The dam is built on the Blue Nile River, in the western
part of Ethiopia about 40 kilometres from Sudan's border. The government reports that the project
costs $4.8 billion; around 15% of the Ethiopian GDP. According to former Prime Minister Zenawi, the
construction of the dam can be completed without any foreign aid. The Economist (2011) reports
that Chinese banks are underwriting the cost of turbines and other electrical equipment. Yet, this
means that there is need to cover a financial gap of $3 billion of establishment investment. Not to
mention that some engineers believe that the construction cost is much higher than the government
estimation. Ethiopians are urged to subscribe to bonds issued on patriotic grounds. This, however,
would not generate more than a small fraction of the required fund. Neither the World Bank nor
private investors are willing to contribute, since Ethiopia has failed to establish partnership ties with
the power generating companies in neighbouring countries, who are the future consumers of the
Dam’s electricity (The Economist, 2011).
The reservoir capacity of the dam is roughly equivalent to the annual flow of the Nile water at the
Sudanese-Egyptian border (65.5 billion cubic meters). This loss to the downstream countries’ water
share would take place only over the reservoir filling period. However, this water loss might continue
to induce noticeable long term effects on the downstream countries. Evaporative losses from the
dam’s reservoir would permanently reduce the flow of the Blue Nile. The magnitude of these losses
is not accurately estimated yet. The three Eastern Nile Countries (Egypt, Ethiopia, and Sudan) have
formed an International Panel of Experts to review and assess the potential effects of the Ethiopian
Great Renaissance Dam on the Blue Nile. In his speech at the official commencement of the
Millennium Dam project, the former Ethiopian PM has assured that the dam will greatly reduce the
problems of silt and sediment that have been consistently affecting the dams in Egypt and Sudan
and that communities along the riverbanks in Sudan will be permanently relieved from centuries of
flooding. In light of these potential benefits from GRED for Egypt and Sudan as well as the Ethiopian
offer to export electricity at a price lower than the world price, Zenawi has demanded for their
contribution to the project costs (according to his calculation, Sudan might offer to cover 30 per cent

GRAND ETHIOPIAN RENAISSANCE DAM
5
and Egypt 20 per cent) even if he recognized that the current political climate does not allow to
reach this agreement.
In addition, the construction of the dam and the creation of new electricity potential would
strengthen the Eastern Africa Power Pool (EAPP), created in 2005 by seven Eastern Africa countries (
Burundi, Democratic Republic of Congo (DRC), Egypt, Ethiopia, Kenya, Rwanda and Sudan) which
recognized as the potential benefits from developing a regional power pool. The mission of the EAPP
is secure an affordable, sustainable and reliable source of electricity for the Eastern Africa region by
the pooling of electrical energy resources in coordinated and optimized manner with an ultimate
goal of increase the rate of access to electricity in the region and thereby promoting regional
integration. Other objectives include optimizing the usage of energy resources available in the
region, increase power supply in the region, reduce electricity production cost and create attractive
investment climate.
This study aims at analysing the possible economic effects of GRED on the Ethiopian economy, the
Nile basin Ethiopian neighbours and the rest of the world. The study uses a global Computable
General equilibrium model with a focus on energy issue; GLOBE-E. The rest of the paper is organized
as follows: Sections 2 provides a brief literature review of the main issues under consideration.
Sections 3 presents the employed model, and the underlying database and its aggregation. Section 4
describes the simulation scenarios and the simulation results. Section 5 discusses the policy
implications. Section 6 concludes.
2. Literature review The issue of energy production, in particular in his relationship with climate change and climate
policy, has been extensively analysed in the CGE literature. Several CGE models analysed the issue of
electricity generation and its link with hydropower. Some of the relevant studies are: the
development a dynamic, multisectoral and applied general equilibrium model of the Turkish
economy (Aydın, 2010), for Taiwan (Shih-Hsun , Ping-Cheng, & Chung-Huang, 2000) or Russia (Orlov ,
Grethe, & McDonald, 2011). Most of these studies employ the so called technology bundle to model
electricity generation from different sources (ABARE , 1996), in their attempt to increase realism of
the model and reconcile top-down models with typical characteristics of bottom-up energy models.
In addition, a similar study is related to the value of the high Aswan dam in Egypt (Strzepek, Yohe,
Tol, & Rosegrant, 2008) where the authors employed an extended version of the IFPRI standard
static single-country CGE model (Lofgren, Hariss, & Robinson, 2001).
These models are single-country approach to the issue of hydropower. In this paper, we want to
address multicounty issue as the trade of electricity or the impact on the exchange rate and on
Ethiopian export of the dam construction. For this reason we use an extensively modified version of
the global CGE model GLOBE (McDonald, Thierfelder, & Robinson, 2007).
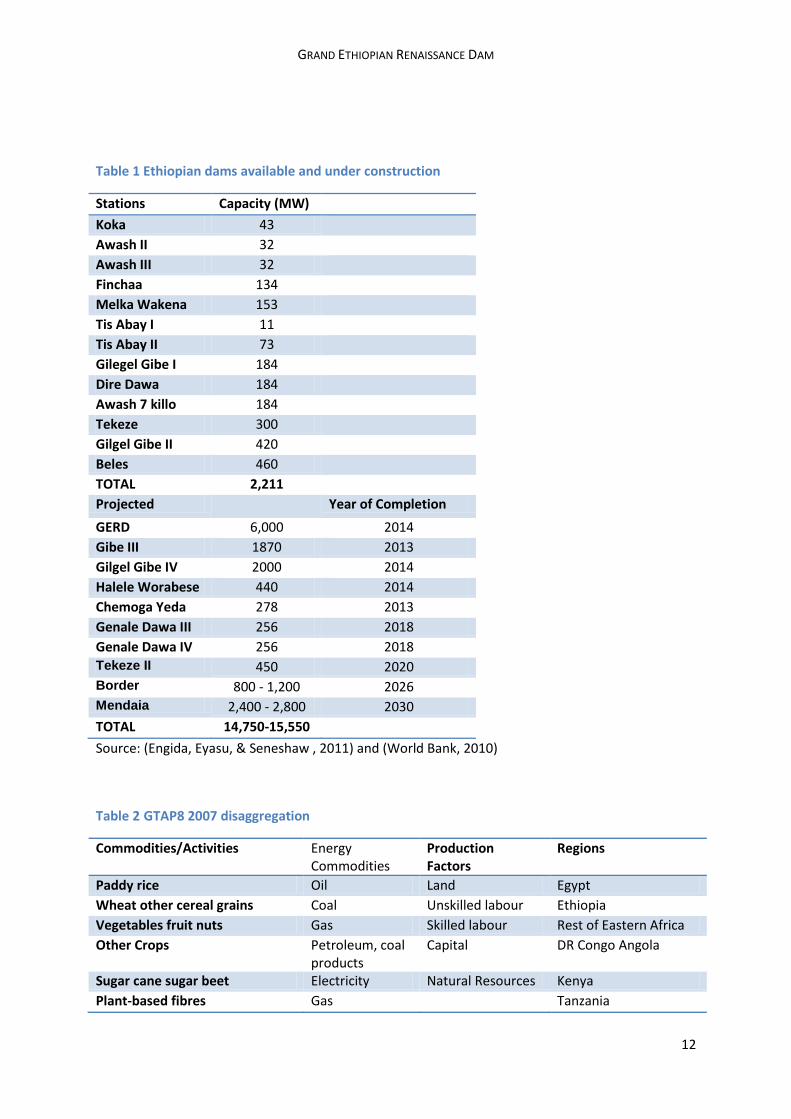
3. The model and the database The GTAP database version 8 (Narayanan, Aguiar, & McDougall, 2012) boasts 129 regions and 57
sectors for the years 2004 and 2007. In this study, the database for the year 2007 has been
aggregated into 28 sectors and 15 regions (Table 2). Among the regions, all the Nile basin countries

GRAND ETHIOPIAN RENAISSANCE DAM
6
have been considered as disaggregated as possible: Egypt, Ethiopia, Kenya, Tanzania, Uganda, South
central Africa countries (Angola and Democratic Republic of Congo) and Rest of Eastern Africa
(Sudan among others). In addition, main trade partners of the region have been selected: USA, the
EU (with 27 member states), China, India, Japan, rest of Africa, rest of Asia while all the remaining
countries have been aggregated into a rest of the world (row) region. In terms of activities and
commodities, rice, wheat, vegetable and fruit, sugar cane and beet, plant fibres, other crops and
livestock represent the primary agricultural sector. The aggregation of the fish and forestry sectors
and the mineral sector represent the natural resource accounts. In terms of food industries, rice,
meat (aggregation of red and white meat), raw sugar, beverages and tobacco and other food sector
have been disaggregated. Five manufacture sectors (textile, chemical, metals, electronic and other
manufacture), a trade and transportation sector, water and a service sector aggregating all the other
service accounts. The energy sectors are: oil, coal, gas, energy, petroleum and coal products and gas
manufacture. In addition, the database counts on the usual five production factors: skilled and
unskilled labour, agricultural land, natural resources and capital.
The GTAP database has been augmented with data on electricity production from World
Development Indicator. This database provides data on electricity production (kWh) and production
from different sources: renewable source (excluding hydroelectric), coal, hydroelectric, natural gas,
nuclear and oil sources.
In the case of Ethiopia, in 2007 electricity production was of 3547000000 (kWh), more than 95% of
which (3385000000 kWh) from hydroelectric sources and the rest from oil sources. The original
Ethiopian SAM has been substituted by a new one where electricity is produced by two activities: oil
sources and hydroelectric.
3.1 Model Description The version of GLOBE employed for this paper is a dynamic modified version of the GLOBE_EN CGE
model (McDonald & Thierfelder, 2008) which is a development of the GLOBE model (McDonald,
Thierfelder, & Robinson, 2007) where the major changes relate to the modelling of production
relationships and the recording of taxes on energy use. The GLOBE model is a member of the class of
multi-country, computable general equilibrium (CGE) models that are descendants of the approach
to CGE modeling described by Dervis et al. (1982). The model is a SAM-based CGE model, wherein
the SAM serves to identify the agents in the economy and provides the database with which the
model is calibrated. The SAM also serves an important organizational role since the groups of agents
identified in the SAM structure are also used to define sub-matrices of the SAM for which
behavioural relationships need to be defined. The implementation of this model, using the GAMS
(General Algebraic Modelling System) software, is a direct descendant and extension of the single-
country and multi-country CGE models developed in the late 1980s and early 1990s.
The modelling of trade employs the Armington insight in the form of two-level nests of constant
elasticity of substitution (CES) functions for imports and two-level nests of constant elasticity of
transformation (CET) functions for export.
Final demand by the government and for investment is modelled under the assumption that the
relative quantities of each commodity demand by these two institutions is fixed. For the household
the model contains the assumption that households are utility maximisers and the utility functions
GRAND ETHIOPIAN RENAISSANCE DAM
7
for private households are assumed to be Stone Geary functions. The utility functions have been
altered so that carbon emission taxes can enter into the first-order conditions determining the use
of energy commodities by households.
Production relationships by activities are defined as nested Constant Elasticity of Substitution (CES)
production functions. Activity output is a CES aggregate of the quantities of aggregate intermediate
inputs and aggregate value added, while aggregate intermediate inputs are a Leontief aggregate of
the (individual) intermediate inputs and aggregate value added is a CES aggregate of the quantities
of primary inputs demanded by each activity. Producers are assumed to maximize profits, which
determines product supply and factor demand. Product markets are assumed to be competitive, and
the model solves for equilibrium prices that clear the markets. The production system is set up as a
multi stage nest of CES production functions.
At the top level aggregate non-energy intermediate inputs (QINT) are combined with aggregate of
primary and energy inputs (QVAE) to produce the output of an activity (QX) using a standard CES
function. The second level aggregate of non-energy intermediate inputs is a Leontief aggregation of
the non-energy intermediate inputs. The value added-energy aggregate (QVAE) is standard CES
function of aggregates of capital-energy (QKE) and other (non-capital) primary inputs (QVA).
The value added (QVA) production function is a CES function over labour (which is a CES aggregation
between skilled and unskilled labour), land and natural resources, with the elasticities being activity
and region specific. The capital-energy aggregate (QKE) is a two argument CES function of aggregate
of energy (QVE) and capital and because one of the arguments is a ‘natural’ inputs the issue of the
conditions for factor market clearing become relevant.
The fourth and fifth levels of the production nest distinguish between electricity and other energy
inputs where the other energy inputs are directly based on fossil fuels; an important reason for this
distinction is the use of fossil fuels in the generation of electricity. At the fourth level aggregate
energy (QVE) is defined by a standard CES function over two arguments – electricity and an
aggregate of other energy inputs - with the elasticities being activity and region specific. And finally
at the fifth level the aggregate of non-electricity inputs is defined by a multi argument CES function
over non electricity energy inputs (typically oil, coal, gas, petroleum and gas manufacture).
Factor markets in developed countries are also assumed to have fixed labour supplies, and the
model solves for equilibrium wages that clear the markets. In developing countries, however, we
assume that the real wage of unskilled labour is fixed and that the supply of unskilled labour is
infinitely elastic at that wage. So, labour supply clears the market, and aggregate unskilled
employment is endogenous rather than the real wage. In this specification, any shock that would
otherwise increase the equilibrium wage will instead lead to increased employment.
In the original GLOBE model the relationship between activity and commodity output is defined as a
simple linear relationship whereby the commodity output is defined as the weighted sum of the
quantities of each commodity produced by each activity. But given the typical configuration of the
GTAP database, whereby each activity only produces a single commodity, domestic output by
activity (QX) is identical to domestic commodity output (QXC) and the matrix of weight is a simple
identity matrix. To adapt the model the data development (introduction of different activities
producing the same commodities, i.e. electricity), we have two options which depend on the level of

GRAND ETHIOPIAN RENAISSANCE DAM
8
homogeneity of the commodities produced. If different activities produce heterogeneous
commodities, we employ a Constant Elasticity of Substitution (CES) function which allows imperfect
substitutability among commodities, once provided an exogenously given elasticity of substitution.
In case the commodities produced are homogenous, we aggregate the production of different
activities by a simple summation while the producer price of the composite domestic output is equal
to the activity commodity prices (in the case of CES, the prices are given by the CES first order
condition). When commodities are homogenous, all the production is rapidly absorbed by the most
efficient activity sector. To avoid this problem in the electricity production sector, the demand of
capital for electricity produced by hydro sources is kept constant in the baseline and shocked
exogenously in the simulations. This mimics the short-medium run asset fixity of a sector like
electricity production where, once physical capital is in place (e.g. an electricity power plant) its
mobility is quite reduced given the high costs to adapt the plant to different uses.
3.2 Dynamics and Baseline In order to reproduce the most likely future developments of the economy in the future, several
economic variables are exogenously shocked to build a baseline. The baseline represents the
business as usual scenario to which all the policy scenarios will be compared.
To establish a baseline for GLOBE, selected macroeconomic variables are updated each year, using
forecasts to 2030 from GTAP (GDyn Data Base;
www.gtap.agecon.purdue.edu/databases/Utilities/default.asp). The model is solved in a loop over
time periods with annual updates. The following macroeconomic variables are updated for each
region: GDP, total investment, the internal balance (fiscal deficit), the external balance (trade
deficit), total supply of land, total supply of skilled labour, and total supply of unskilled labour.
Baseline projections provide growth rates for GDP, non-capital factor supplies, and investment. Each
variable is held constant and assigned a value in each year consistent with the baseline. The external
(current account balance) and the internal balance (government budget deficit) are assumed to be a
fixed share of GDP over time, maintaining the ratio observed in the base year. For baseline updates,
all tax rates are held constant while the nominal exchange rate adjusts to achieve the required
external balance. The model is investment driven, with the level of investment by region set to
match GTAP forecasts.
In factor markets, the total supply of land, skilled labour, and unskilled labour are held constant and
assigned forecast values. The nominal wage adjusts to satisfy equilibrium in these factor markets.
Likewise, the total supply of capital is held constant and the nominal payment adjusts. Unlike land
and labour, capital levels are not from GTAP forecasts. Instead, capital available each period is
determined from private investment and depreciation. However, the closure rule is the same – fix
the supply of capital each period at the computed level and allow the nominal wage to adjust. In
each period, in each region, demand for commodities used in investment is assumed to be in fixed
volumes multiplied by an investment-scaling variable that can accommodate changes in the
exogenously determined level of investment and/or changes in the availability of funds for
investment. The total value of investment, or gross fixed capital formation, is the sum of investment
volumes time prices. The value of new capital by region is a weighted average of the price of the
goods used in investment; the weights are each commodity’s share in the volume of investment. In
the baseline loop experiment, the values from the previous period are the data stored in levels.

GRAND ETHIOPIAN RENAISSANCE DAM
9
These levels are used to compute the new value of the capital available to be assigned in the current
period when the model solves.
When GDP by region is set exogenously, total factor productivity by region must be endogenous.
Anyway, there are well documented reasons to assume that the rates of sectoral productivity
growth differ; for instance it is commonly estimated that agricultural productivity grows faster than
productivity in other sectors in each region. In this work we assume that agriculture in all regions
experiences productivity gains that are 10% greater than those in other sectors.
4. Scenarios description and results The policy scenarios will be compared with the result of the baseline run. A firs changed compared
to the baseline is the increase of government savings to internally finance the construction of the
GERD dam.
At the same time, the capital endowment of the hydropower electricity production is expanded to
mimic the building of the GERD dam. Given the nature of such capital (i.e. a dam), the capital is
considered as immobile, without the possibility to move to other sectors.
An additional scenario considers an increase of Ethiopian electricity exports to neighbour countries.
Currently Ethiopia is not exporting electricity. According to the Ethiopian former Prime Minister,
Ethiopia will earn significant hard-currency (or at least bartering leverage) with its neighbours who
import the generated power. The following arrangements have already been made with
neighbouring countries to supply electricity. Ethiopia might export 200 MW to Djibouti, which would
enable Ethiopia to pay for port usage, 500 MW to Kenya, which would enable Ethiopia to pay for its
port usage at Mombasa, and 200 MW to Sudan which would enable Ethiopia to buy fuel oil from
Sudan in exchange. In order to simulate a scenario in which Ethiopia becomes a net electricity
exporter, we modify the Armington Constant Elasticity of Substitution (CES) demand function of the
Nile basin countries which are supposed to import electricity from Ethiopia. Following Philippidis
(2010), changes in imports are associated with changes in consumer preference towards different
imports origin. This modification allows modelling an increase of demand of Ethiopian electricity by
other Nile basin countries (i.e. Sudan or Egypt) without shocking policy instruments as import or
export taxes which indirectly modify price of imports.
In the third scenario, the increase of Ethiopian demand for electricity will be simulated on top of the
construction of the GERD dam. Main sources of this increase are: the Rural Electrification Access
Project, which is a project under the Universal Electrification Access program (UEAP), designed to
enable towns and villages to have access to electric supply through low and medium voltage
distribution lines. Electrification will eliminate the need for gas butane which is supplied in gas
cylinders. For those in countryside, there will be no need for burning wood or kerosene. Another
source of increasing demand is the possibility to electrify the transportation system (e.g. the Addis
Ababa Light Rail Transport system which is still based on electric power. Its electrification will reduce
the dependence on fossil fuel).
From these scenarios, we will analyse results in terms of GDP and welfare for Ethiopia and other Nile
Basin countries. Then, we concentrate on change of trade pattern, particularly in Ethiopia, to
examine whether the increase of electricity production and export will cause a significant

GRAND ETHIOPIAN RENAISSANCE DAM
10
appreciation of the Ethiopian exchange rate and negatively affect other export, i.e. agriculture. Then,
results on production will be presented to analyse which sectors will benefit the most from the
increase of energy production and the decrease of energy price. Then we concentrate on production
factors. Finally, given the energy and environmental focus of the model, the likely change in country
and regional emission due to the increased availability of electricity from hydro source will be taken
into account.
5. Results Preliminary results indicate that GERD investments would slow down development in Ethiopia and
that the exports of hydroelectricity need to expand rapidly straight after the completion of GERD if
the project is to be successful. As expected the ‘Dutch disease’ implications are not trivial and are
likely to hold back Ethiopian development with adverse effects on rural households.
5.1 Sensitivity analysis
6. Policy Implications
7. Conclusions
8. Bibliography ABARE . (1996). The MEGABARE model: interim documentation. Canberra: ABARE (Australian Bureau
of Agricultural and Resource Economics).
Arndt, C., Robinson, S., & Willenbockel, D. (2011). Ethiopia’s growth prospects in a changing climate:
A stochastic general equilibrium approach. Global Environmental Change, 701–710.
Aydın, L. (2010). The Economic and Environmental Impacts of Constructing Hydro Power Plants in
Turkey: A Dynamic CGE Analysis (2004-2020). Natural Resources, 69-79.
Burniaux, J., & Truong , T. (2002). GTAP-E: An Energy-Environmental Version of the GTAP Model.
Center for Global Trade Analysis - Purdue University. West Lafayette: GTAP Technical Paper
No. 16.
Engida, E., Eyasu, T., & Seneshaw , T. (2011, December). Does Electricity Supply Strategy Matter?
Shortage and Investment: Reflections based on CGE Analysis. EDRI Working Paper 006.
International Energy Agency. (2010). World Energy Outlook.
Lofgren, H., Hariss, R. L., & Robinson, S. (2001). A Standard Computable General Equilibrium (CGE)
Model in GAMS. International Food Policy Researc Institute. Washington, D.C.: TMD
Discussion Paper No. 75.

GRAND ETHIOPIAN RENAISSANCE DAM
11
McDonald, S., Thierfelder, K., & Robinson, S. (2007). GLOBE: A SAM Based Global CGE Model using
GTAP Data. United States Naval Academy. Department of Economics Working Paper 14.
Narayanan, B. G., Aguiar, A., & McDougall, R. (. (2012). Global Trade, Assistance, and Production: The
GTAP 8 Data Base. Center for Global Trade Analysis, Purdue University.
Orlov , A., Grethe, H., & McDonald, S. (2011). Energy Policy and Carbon Emission in Russia: A Short
Run CGE Analysis. 14th Annual Conference on Global Economic Analysis "Governing Global
Challenges: Climate Change, Trade, Finance and Development" . Ca' Foscari University of
Venice, Venice, Italy: GTAP.
Philippidis, G. (2010). EU import restrictions on genetically modified feeds: impacts on Spanish, EU
and global livestock sectors. Spanish Journal of Agricultural Research, 8, 3-17.
Robinson, S., Willenbockel, D., & Strzepek, K. (2012). A Dynamic General Equilibrium Analysis of
Adaptation to Climate Change in Ethiopia. Review of Development Economics, 489-502.
Shih-Hsun , H., Ping-Cheng, L., & Chung-Huang, H. (2000). Energy Substitution in CGE Modeling Using
the "Technology Bundle" Approach:. Third Annual Conference on Global Economic Analysis.
Monash University, Australia: GTAP.
Strzepek, K., Yohe, G. W., Tol, R. S., & Rosegrant, M. W. (2008). The value of the high Aswan Dam to
the Egyptian economy. Ecological Economics, 118-1226.
The Economist. (2011, April 20th). A dam nuisance - Egypt and Ethiopia quarrel over water. The
Economist.
World Bank. (2010). Ethiopia, Economics of Adaptation to Climate Change. Washington, DC: The
World Bank Group.
GRAND ETHIOPIAN RENAISSANCE DAM
12
Table 1 Ethiopian dams available and under construction
Stations Capacity (MW)
Koka 43
Awash II 32
Awash III 32
Finchaa 134
Melka Wakena 153
Tis Abay I 11
Tis Abay II 73
Gilegel Gibe I 184
Dire Dawa 184
Awash 7 killo 184
Tekeze 300
Gilgel Gibe II 420
Beles 460
TOTAL 2,211
Projected Year of Completion
GERD 6,000 2014
Gibe III 1870 2013
Gilgel Gibe IV 2000 2014
Halele Worabese 440 2014
Chemoga Yeda 278 2013
Genale Dawa III 256 2018
Genale Dawa IV 256 2018 Tekeze II 450 2020 Border 800 - 1,200 2026 Mendaia 2,400 - 2,800 2030
TOTAL 14,750-15,550
Source: (Engida, Eyasu, & Seneshaw , 2011) and (World Bank, 2010)
Table 2 GTAP8 2007 disaggregation
Commodities/Activities Energy Commodities
Production Factors
Regions
Paddy rice Oil Land Egypt
Wheat other cereal grains Coal Unskilled labour Ethiopia
Vegetables fruit nuts Gas Skilled labour Rest of Eastern Africa
Other Crops Petroleum, coal products
Capital DR Congo Angola
Sugar cane sugar beet Electricity Natural Resources Kenya
Plant-based fibres Gas Tanzania

GRAND ETHIOPIAN RENAISSANCE DAM
13
manufacture
Livestock products Uganda
Fishing and forestry USA
Minerals EU-27
Meat products Japan
Dairy products China
Sugar India
Other food products Rest of Asia
Beverages and tobacco products Rest of SSA
Textiles wearing and leather Rest of the World
Chemical and mineral products
Metals and metal products
Vehicle electronic equipment
Other manufactures
Trade, Construction, Transport & Communication
Water
Other Services
Source: authors elaboration.