Embed Size (px)
Citation preview

Design of Grand Ethiopian Renaissance
RCC Main Dam (H=175m)
Giorgio Pietrangeli Alberto Bezzi Claudio Rossini Alessandro Masciotta Davide D’Alberti
Studio Ing. G. Pietrangeli Srl, Via Cicerone 28, 00193 Rome;
Introduction
The Grand Ethiopian Renaissance Dam (GERD) Project is located 700 km northeast of the Ethiopian capital of
Addis Abeba, in the Benishangul – Gumaz region, along the Blue Nile River.
The Ethiopian Electric Power company (EEP) is the employer, Salini-Impregilo SpA the EPC Contractor and Studio
Pietrangeli Srl the designer.
The plant, with its 6’000 MW of installed power and 15.7 TWh of annual energy production, is one the most
important projects in the Ethiopian Government’s commitment to meet the country’s present and future power
requirements. The hydropower plant is currently under construction. When completed, GERD will be the largest
plant in Africa.
Fig. 1 – View of the GERD project under construction (October 2016)
This paper is focused on the most important technical aspects of the design of the RCC Main Dam, including dam
geometry and stability analysis, RCC and bedding mix zoning, grouting activities, drainage system layout, stepped
spillway design and temperature control measures.
1. Key Characteristics of the Project
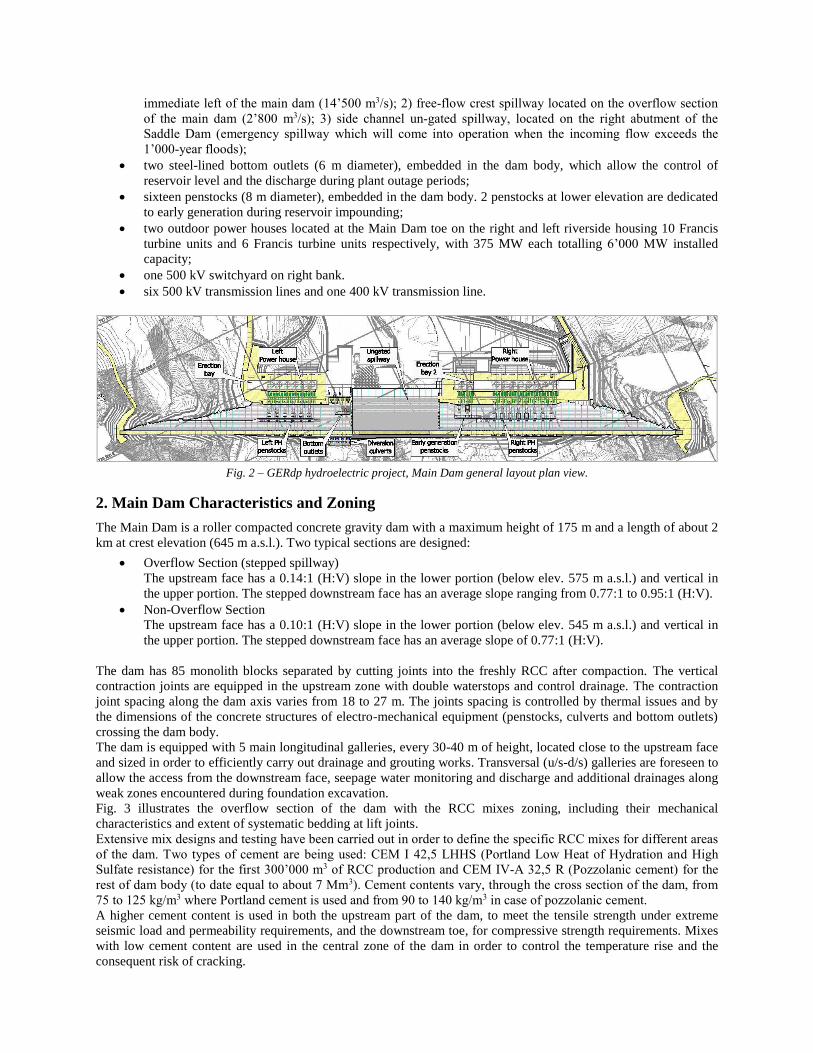
The general layout of GER Main Dam is illustrated in Fig. 2. The key components of the project are:
the river diversion system, designed to discharge up to 14’700 m3/s, includes 4 culverts (octagonal section
7.5x8.3m) for discharging during the dry season up to 2700 m3/s (December to June) and a temporary
stepped spillway located in the central part of the dam (see Fig. 1), for dam overtopping during the wet
season. The first stage of river diversion envisaged the excavation of a channel, 1100 m long and 120 m
width, on the right bank to allow the construction of the dam in the 30 m deep gorge at river thalweg and of
the culverts on the left bank;
a roller compacted concrete (RCC) Main Dam with a maximum height of 175 m and a total volume of RCC
of about 10.2 million cubic meters;
a concrete faced rockfill (CFRD) Saddle Dam 60 m high and 5 km long, with an embankment volume of 17
million m3;
a system of three spillways safeguards the project against the Probable Maximum Flood (30’200 m3/s peak
and 18’000 m3/s routed discharge): id est: 1) main service gated spillway, located on a saddle area to the
immediate left of the main dam (14’500 m3/s); 2) free-flow crest spillway located on the overflow section
of the main dam (2’800 m3/s); 3) side channel un-gated spillway, located on the right abutment of the
Saddle Dam (emergency spillway which will come into operation when the incoming flow exceeds the
1’000-year floods);
two steel-lined bottom outlets (6 m diameter), embedded in the dam body, which allow the control of
reservoir level and the discharge during plant outage periods;
sixteen penstocks (8 m diameter), embedded in the dam body. 2 penstocks at lower elevation are dedicated
to early generation during reservoir impounding;
two outdoor power houses located at the Main Dam toe on the right and left riverside housing 10 Francis
turbine units and 6 Francis turbine units respectively, with 375 MW each totalling 6’000 MW installed
capacity;
one 500 kV switchyard on right bank.
six 500 kV transmission lines and one 400 kV transmission line.
Fig. 2 – GERdp hydroelectric project, Main Dam general layout plan view.
2. Main Dam Characteristics and Zoning
The Main Dam is a roller compacted concrete gravity dam with a maximum height of 175 m and a length of about 2
km at crest elevation (645 m a.s.l.). Two typical sections are designed:
Overflow Section (stepped spillway)
The upstream face has a 0.14:1 (H:V) slope in the lower portion (below elev. 575 m a.s.l.) and vertical in
the upper portion. The stepped downstream face has an average slope ranging from 0.77:1 to 0.95:1 (H:V).
Non-Overflow Section
The upstream face has a 0.10:1 (H:V) slope in the lower portion (below elev. 545 m a.s.l.) and vertical in
the upper portion. The stepped downstream face has an average slope of 0.77:1 (H:V).
The dam has 85 monolith blocks separated by cutting joints into the freshly RCC after compaction. The vertical
contraction joints are equipped in the upstream zone with double waterstops and control drainage. The contraction
joint spacing along the dam axis varies from 18 to 27 m. The joints spacing is controlled by thermal issues and by
the dimensions of the concrete structures of electro-mechanical equipment (penstocks, culverts and bottom outlets)
crossing the dam body.
The dam is equipped with 5 main longitudinal galleries, every 30-40 m of height, located close to the upstream face
and sized in order to efficiently carry out drainage and grouting works. Transversal (u/s-d/s) galleries are foreseen to
allow the access from the downstream face, seepage water monitoring and discharge and additional drainages along
weak zones encountered during foundation excavation.
Fig. 3 illustrates the overflow section of the dam with the RCC mixes zoning, including their mechanical
characteristics and extent of systematic bedding at lift joints.
Extensive mix designs and testing have been carried out in order to define the specific RCC mixes for different areas
of the dam. Two types of cement are being used: CEM I 42,5 LHHS (Portland Low Heat of Hydration and High
Sulfate resistance) for the first 300’000 m3 of RCC production and CEM IV-A 32,5 R (Pozzolanic cement) for the
rest of dam body (to date equal to about 7 Mm3). Cement contents vary, through the cross section of the dam, from
75 to 125 kg/m3 where Portland cement is used and from 90 to 140 kg/m3 in case of pozzolanic cement.
A higher cement content is used in both the upstream part of the dam, to meet the tensile strength under extreme
seismic load and permeability requirements, and the downstream toe, for compressive strength requirements. Mixes
with low cement content are used in the central zone of the dam in order to control the temperature rise and the
consequent risk of cracking.
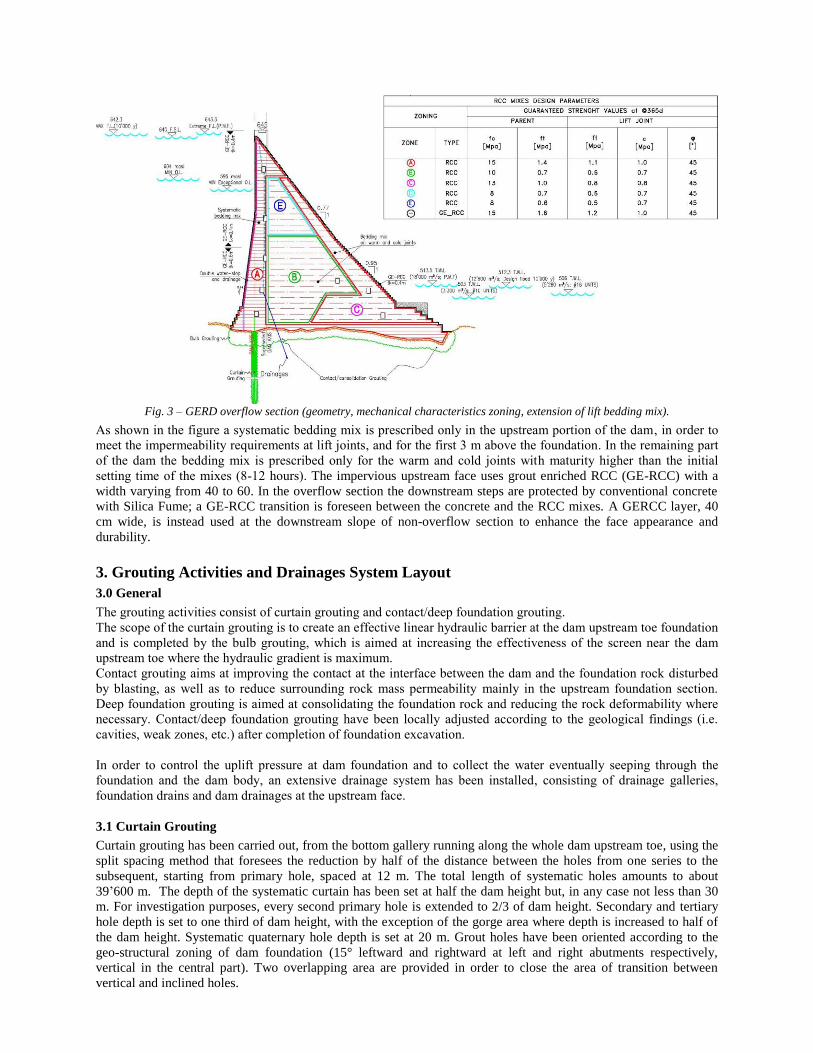
Fig. 3 – GERD overflow section (geometry, mechanical characteristics zoning, extension of lift bedding mix).
As shown in the figure a systematic bedding mix is prescribed only in the upstream portion of the dam, in order to
meet the impermeability requirements at lift joints, and for the first 3 m above the foundation. In the remaining part
of the dam the bedding mix is prescribed only for the warm and cold joints with maturity higher than the initial
setting time of the mixes (8-12 hours). The impervious upstream face uses grout enriched RCC (GE-RCC) with a
width varying from 40 to 60. In the overflow section the downstream steps are protected by conventional concrete
with Silica Fume; a GE-RCC transition is foreseen between the concrete and the RCC mixes. A GERCC layer, 40
cm wide, is instead used at the downstream slope of non-overflow section to enhance the face appearance and
durability.
3. Grouting Activities and Drainages System Layout
3.0 General
The grouting activities consist of curtain grouting and contact/deep foundation grouting.
The scope of the curtain grouting is to create an effective linear hydraulic barrier at the dam upstream toe foundation
and is completed by the bulb grouting, which is aimed at increasing the effectiveness of the screen near the dam
upstream toe where the hydraulic gradient is maximum.
Contact grouting aims at improving the contact at the interface between the dam and the foundation rock disturbed
by blasting, as well as to reduce surrounding rock mass permeability mainly in the upstream foundation section.
Deep foundation grouting is aimed at consolidating the foundation rock and reducing the rock deformability where
necessary. Contact/deep foundation grouting have been locally adjusted according to the geological findings (i.e.
cavities, weak zones, etc.) after completion of foundation excavation.
In order to control the uplift pressure at dam foundation and to collect the water eventually seeping through the
foundation and the dam body, an extensive drainage system has been installed, consisting of drainage galleries,
foundation drains and dam drainages at the upstream face.
3.1 Curtain Grouting
Curtain grouting has been carried out, from the bottom gallery running along the whole dam upstream toe, using the
split spacing method that foresees the reduction by half of the distance between the holes from one series to the
subsequent, starting from primary hole, spaced at 12 m. The total length of systematic holes amounts to about
39’600 m. The depth of the systematic curtain has been set at half the dam height but, in any case not less than 30
m. For investigation purposes, every second primary hole is extended to 2/3 of dam height. Secondary and tertiary
hole depth is set to one third of dam height, with the exception of the gorge area where depth is increased to half of
the dam height. Systematic quaternary hole depth is set at 20 m. Grout holes have been oriented according to the
geo-structural zoning of dam foundation (15° leftward and rightward at left and right abutments respectively,
vertical in the central part). Two overlapping area are provided in order to close the area of transition between
vertical and inclined holes.
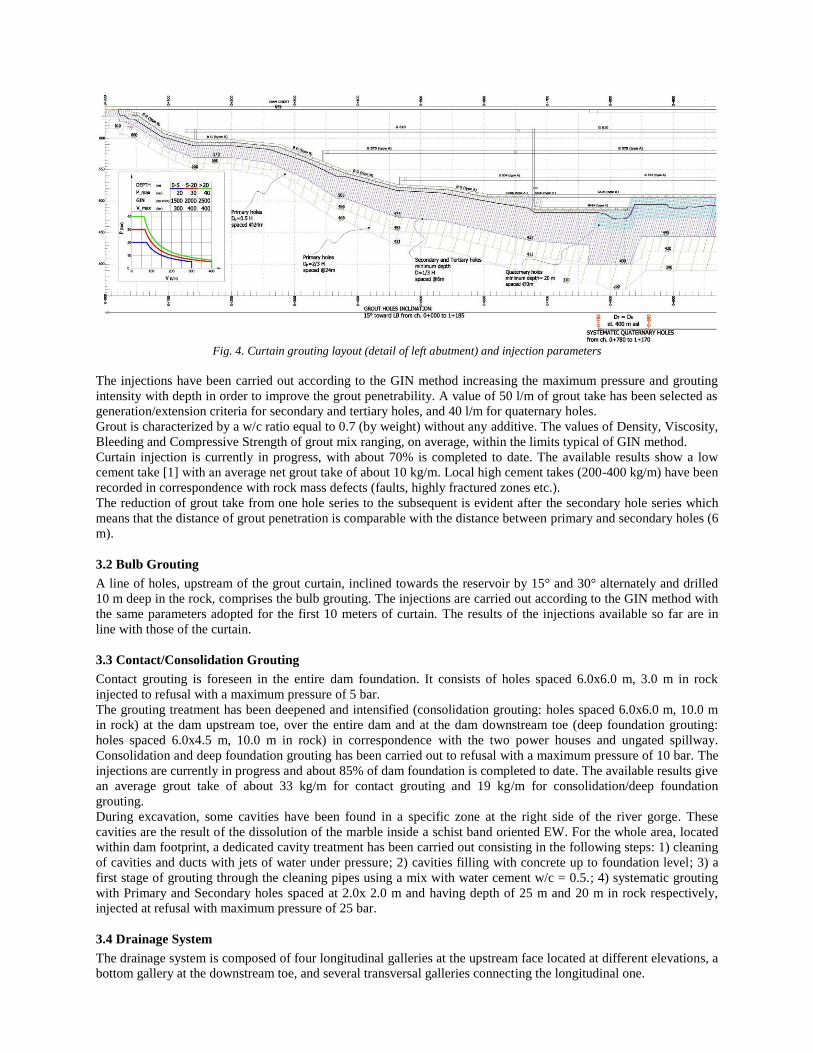
Fig. 4. Curtain grouting layout (detail of left abutment) and injection parameters
The injections have been carried out according to the GIN method increasing the maximum pressure and grouting
intensity with depth in order to improve the grout penetrability. A value of 50 l/m of grout take has been selected as
generation/extension criteria for secondary and tertiary holes, and 40 l/m for quaternary holes.
Grout is characterized by a w/c ratio equal to 0.7 (by weight) without any additive. The values of Density, Viscosity,
Bleeding and Compressive Strength of grout mix ranging, on average, within the limits typical of GIN method.
Curtain injection is currently in progress, with about 70% is completed to date. The available results show a low
cement take [1] with an average net grout take of about 10 kg/m. Local high cement takes (200-400 kg/m) have been
recorded in correspondence with rock mass defects (faults, highly fractured zones etc.).
The reduction of grout take from one hole series to the subsequent is evident after the secondary hole series which
means that the distance of grout penetration is comparable with the distance between primary and secondary holes (6
m).
3.2 Bulb Grouting
A line of holes, upstream of the grout curtain, inclined towards the reservoir by 15° and 30° alternately and drilled
10 m deep in the rock, comprises the bulb grouting. The injections are carried out according to the GIN method with
the same parameters adopted for the first 10 meters of curtain. The results of the injections available so far are in
line with those of the curtain.
3.3 Contact/Consolidation Grouting
Contact grouting is foreseen in the entire dam foundation. It consists of holes spaced 6.0x6.0 m, 3.0 m in rock
injected to refusal with a maximum pressure of 5 bar.
The grouting treatment has been deepened and intensified (consolidation grouting: holes spaced 6.0x6.0 m, 10.0 m
in rock) at the dam upstream toe, over the entire dam and at the dam downstream toe (deep foundation grouting:
holes spaced 6.0x4.5 m, 10.0 m in rock) in correspondence with the two power houses and ungated spillway.
Consolidation and deep foundation grouting has been carried out to refusal with a maximum pressure of 10 bar. The
injections are currently in progress and about 85% of dam foundation is completed to date. The available results give
an average grout take of about 33 kg/m for contact grouting and 19 kg/m for consolidation/deep foundation
grouting.
During excavation, some cavities have been found in a specific zone at the right side of the river gorge. These
cavities are the result of the dissolution of the marble inside a schist band oriented EW. For the whole area, located
within dam footprint, a dedicated cavity treatment has been carried out consisting in the following steps: 1) cleaning
of cavities and ducts with jets of water under pressure; 2) cavities filling with concrete up to foundation level; 3) a
first stage of grouting through the cleaning pipes using a mix with water cement w/c = 0.5.; 4) systematic grouting
with Primary and Secondary holes spaced at 2.0x 2.0 m and having depth of 25 m and 20 m in rock respectively,
injected at refusal with maximum pressure of 25 bar.
3.4 Drainage System
The drainage system is composed of four longitudinal galleries at the upstream face located at different elevations, a
bottom gallery at the downstream toe, and several transversal galleries connecting the longitudinal one.
The bottom gallery collects the water coming from the foundation drains and from the lower part of the dam
upstream face drains.
Upstream and dam foundation drain holes are drilled with a 150 mm diameter at spacing ranging between 4 m and 2
m. Drainage hole spacing is selected on the basis of geological and geotechnical characteristics in foundation and on
dam body permeability resulting from RCC investigation (k-monitoring) as well as seepage observations during first
impounding.
The upstream face drain holes are vertical; the foundation drain holes are inclined accordingly to the curtain holes.
The water collected from all the drainage galleries is partially discharged by gravity above elevation 518 m.a.s.l, and
partially by pumps housed in two drainage pits located close to the powerhouses on the left and right banks
respectively. The capacity of drainage pumps has been dimensioned in consideration of the results of the seepage
analysis illustrated hereinafter, assuming the worst scenario and proper redundancy.
4. 2D and 3D Seepage Analysis
The seepage through the dam body and foundation after impounding, has been studied by means of two different
type of analysis:
3D analysis: in order to estimate the pore pressures in foundation and within the dam body, evaluating
also the efficiency of the drains as well as seepages discharged by a single drain
2D analysis: in order to estimate the overall seepages collected by the dam u/s face and foundation
drainages and conveyed through the galleries at the outlet points of the drainage system
3D and 2D seepage analyses have been carried out by means of FEM, using MIDAS GTS NX and PHASE2
software, respectively. The calculations have been performed in steady-state conditions, in correspondence with
several selected sections and in different scenarios aimed at investigating the sensitivity of seepage results under
varying basic parameters such as the RCC permeability and cut-off and foundation drainage system efficiency.
The following pictures illustrate the 2D and 3D model at Early Generation (ch. 1+110) calculation section.
Fig. 5. Ch. 1+110 – 2D and 3D FEM models
The results of 2D and 3D seepage analyses were compared and found to be consistent. In a few cases the 2D
analysis provided lower discharge values than the 3D analysis.
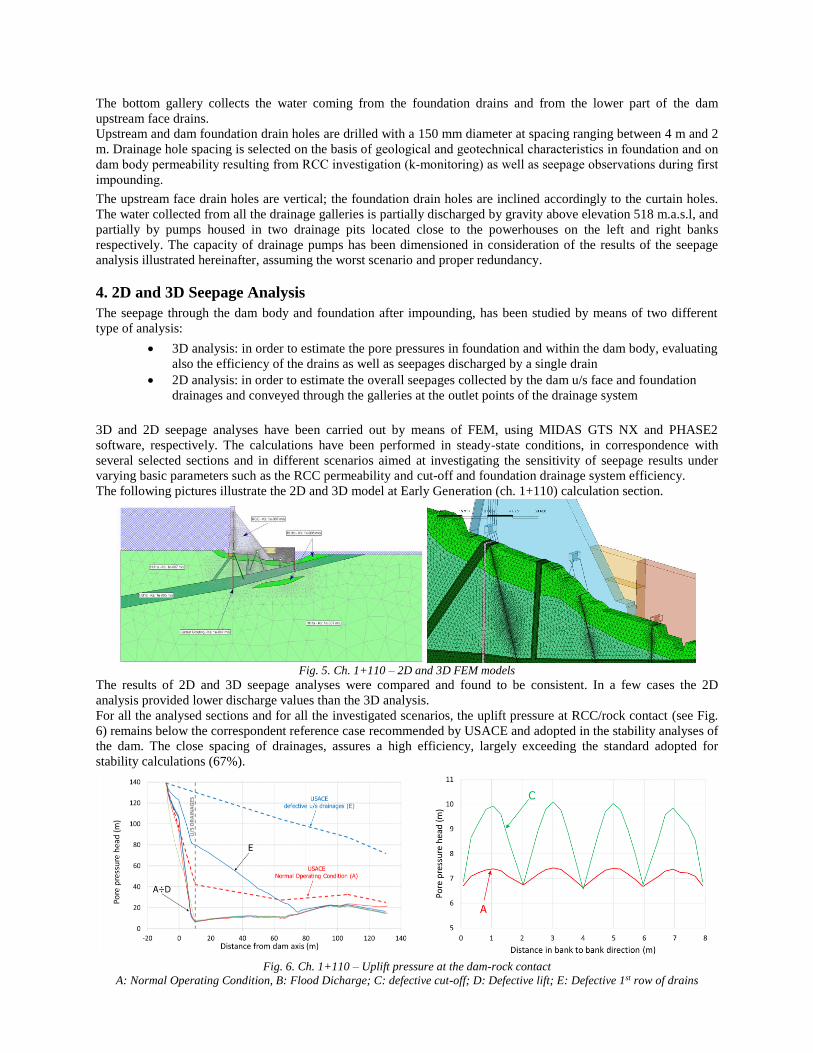
For all the analysed sections and for all the investigated scenarios, the uplift pressure at RCC/rock contact (see Fig.
6) remains below the correspondent reference case recommended by USACE and adopted in the stability analyses of
the dam. The close spacing of drainages, assures a high efficiency, largely exceeding the standard adopted for
stability calculations (67%).
Fig. 6. Ch. 1+110 – Uplift pressure at the dam-rock contact
A: Normal Operating Condition, B: Flood Dicharge; C: defective cut-off; D: Defective lift; E: Defective 1st row of drains
The specific seepage flow for the overall section ranges between 0.15 and 0.30 l/s/m in normal conditions.
For all scenarios, the total discharges calculated at the left and right drainage pits are largely lower than the total
capacity of the drainage pits pumps (450 l/s).The basic design scenario foresees that about 90 l/s are discharged by
the pumps housed in the two drainage pits, and 100 l/s are discharged by gravity through the dam galleries.
The increase of RCC permeability in a horizontal direction (defective RCC lifts), involves a significant increase in
the expected discharges, being more than three times those in normal conditions.
The assumptions of high RCC permeability values, leads to an increase of about 5 times the total amount of
seepages. About 260 l/s/m are discharged by the two drainage pits through pumps, and about 800 l/s are discharged
by gravity through the dam galleries. This scenario which assumes the permeability of the entire dam body greater
than the design values is rather unrealistic but it is presented to investigate the upper limit of seepage in case of
anomalous permeability in the RCC.
In case of deficiencies of grouting works, it has been assumed, in a stretch of the dam about 130 m long where the
permeability of rock mass is higher, that the seepages to be discharged from the left and right drainage pit increase
by about 50% (from 45 to 65 l/s) and about 140% (from 40 to 95 l/s), respectively.
5. Static and Dynamic Analysis
The stability analyses of the RCC dam were performed following an increasing degree complexity, as usual in
engineering practice.
The basic geometry of the dam was preliminarily established by a simple Rigid Body Analysis, verifying the
overturning and the sliding stability in accordance with international standards.
At Level One Design, FEM analyses were performed to define a more reliable and complete stress distribution
within the dam body, to optimize the shape of the dam and to outline the RCC and bedding mix zoning. The
behaviour of the dam under seismic loads was evaluated by means of Response Spectrum Analysis for the
calculation of maximum expected tensile and compressive stresses under earthquake, and by means of Equivalent
Lateral Force method for the purposes of sliding stability analysis. The dam behaviour was assumed to be essentially
two-dimensional, being the height of the dam much smaller than the length of the crest and therefore considering the
3D effects almost negligible. The simplified Equivalent Lateral Force Method proved to be very reliable and it
allowed to establish the final geometry of the dam, since all the investigated 2D cross sections respected the
requirement that the first vibration mode contributed as much as 80-percent or more to the total seismic response of
structure.
At the Level Two Design stage, further and more accurate analyses were performed in order to confirm the final
dimensions of the dam and to study local effects with the most refined procedures proposed by literature.
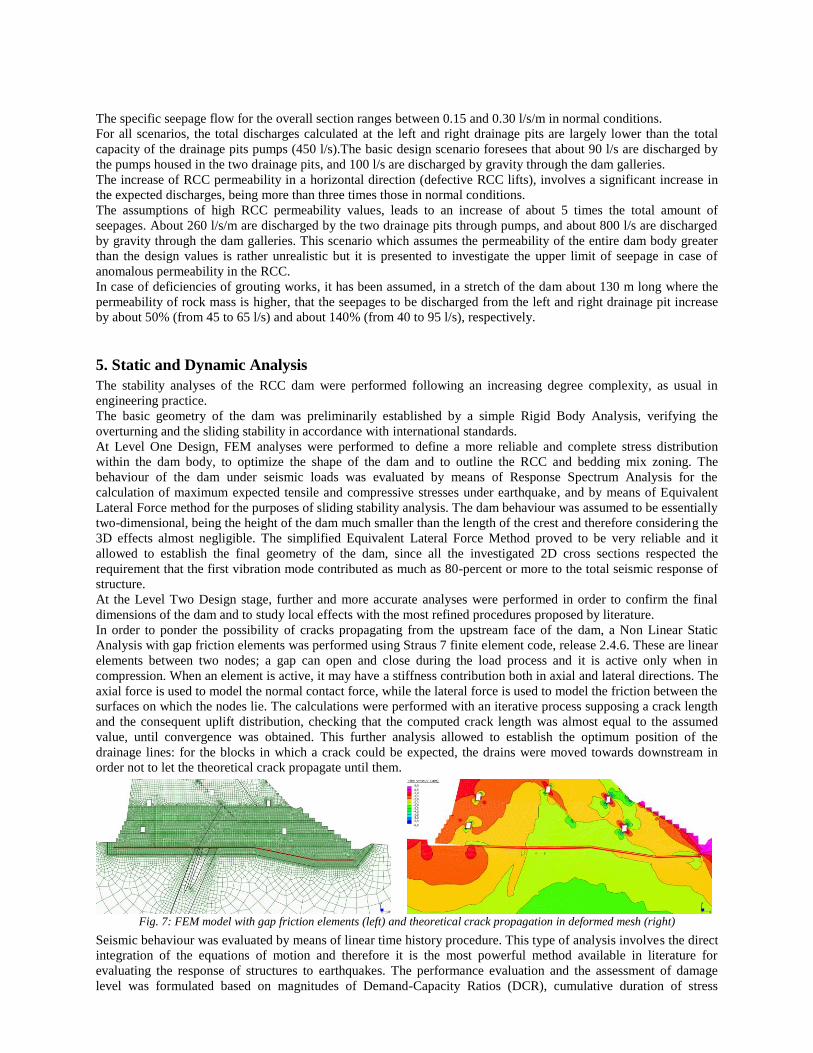
In order to ponder the possibility of cracks propagating from the upstream face of the dam, a Non Linear Static
Analysis with gap friction elements was performed using Straus 7 finite element code, release 2.4.6. These are linear
elements between two nodes; a gap can open and close during the load process and it is active only when in
compression. When an element is active, it may have a stiffness contribution both in axial and lateral directions. The
axial force is used to model the normal contact force, while the lateral force is used to model the friction between the
surfaces on which the nodes lie. The calculations were performed with an iterative process supposing a crack length
and the consequent uplift distribution, checking that the computed crack length was almost equal to the assumed
value, until convergence was obtained. This further analysis allowed to establish the optimum position of the
drainage lines: for the blocks in which a crack could be expected, the drains were moved towards downstream in
order not to let the theoretical crack propagate until them.
Fig. 7: FEM model with gap friction elements (left) and theoretical crack propagation in deformed mesh (right)
Seismic behaviour was evaluated by means of linear time history procedure. This type of analysis involves the direct
integration of the equations of motion and therefore it is the most powerful method available in literature for
evaluating the response of structures to earthquakes. The performance evaluation and the assessment of damage
level was formulated based on magnitudes of Demand-Capacity Ratios (DCR), cumulative duration of stress
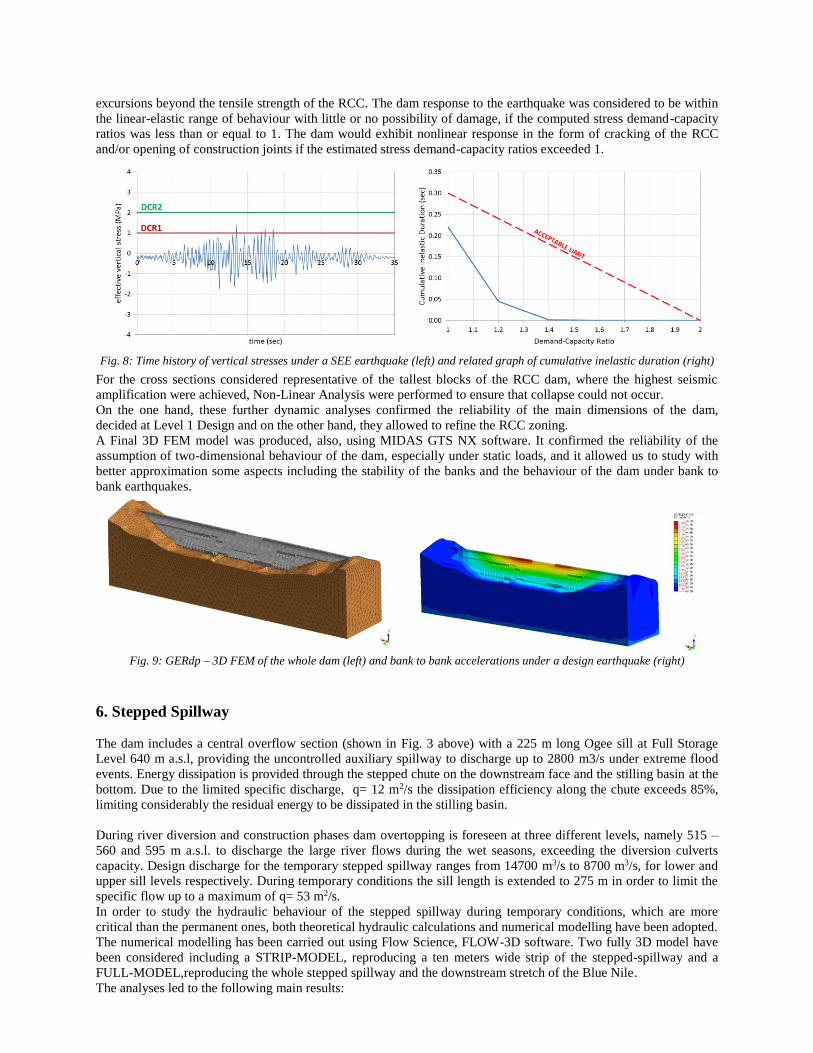
excursions beyond the tensile strength of the RCC. The dam response to the earthquake was considered to be within
the linear-elastic range of behaviour with little or no possibility of damage, if the computed stress demand-capacity
ratios was less than or equal to 1. The dam would exhibit nonlinear response in the form of cracking of the RCC
and/or opening of construction joints if the estimated stress demand-capacity ratios exceeded 1.
Fig. 8: Time history of vertical stresses under a SEE earthquake (left) and related graph of cumulative inelastic duration (right)
For the cross sections considered representative of the tallest blocks of the RCC dam, where the highest seismic
amplification were achieved, Non-Linear Analysis were performed to ensure that collapse could not occur.
On the one hand, these further dynamic analyses confirmed the reliability of the main dimensions of the dam,
decided at Level 1 Design and on the other hand, they allowed to refine the RCC zoning.
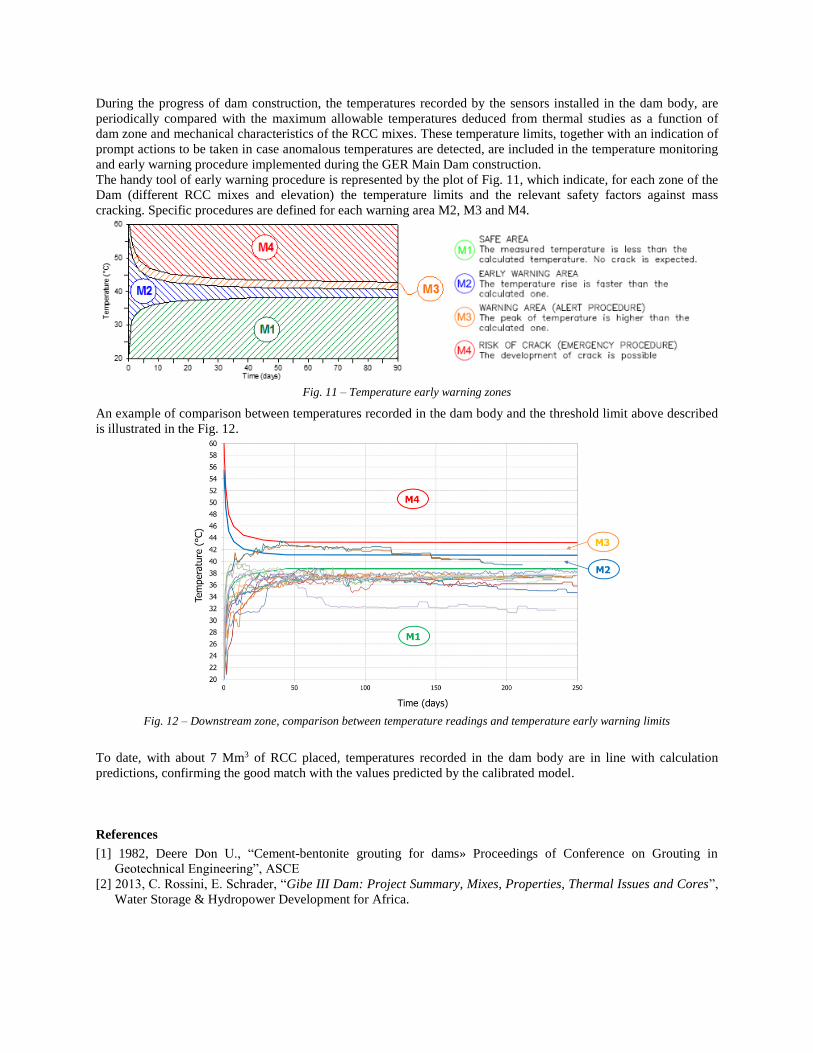
A Final 3D FEM model was produced, also, using MIDAS GTS NX software. It confirmed the reliability of the
assumption of two-dimensional behaviour of the dam, especially under static loads, and it allowed us to study with
better approximation some aspects including the stability of the banks and the behaviour of the dam under bank to
bank earthquakes.
Fig. 9: GERdp – 3D FEM of the whole dam (left) and bank to bank accelerations under a design earthquake (right)
6. Stepped Spillway
The dam includes a central overflow section (shown in Fig. 3 above) with a 225 m long Ogee sill at Full Storage
Level 640 m a.s.l, providing the uncontrolled auxiliary spillway to discharge up to 2800 m3/s under extreme flood
events. Energy dissipation is provided through the stepped chute on the downstream face and the stilling basin at the
bottom. Due to the limited specific discharge, q= 12 m2/s the dissipation efficiency along the chute exceeds 85%,
limiting considerably the residual energy to be dissipated in the stilling basin.
During river diversion and construction phases dam overtopping is foreseen at three different levels, namely 515 –
560 and 595 m a.s.l. to discharge the large river flows during the wet seasons, exceeding the diversion culverts
capacity. Design discharge for the temporary stepped spillway ranges from 14700 m3/s to 8700 m3/s, for lower and
upper sill levels respectively. During temporary conditions the sill length is extended to 275 m in order to limit the
specific flow up to a maximum of q= 53 m2/s.
In order to study the hydraulic behaviour of the stepped spillway during temporary conditions, which are more
critical than the permanent ones, both theoretical hydraulic calculations and numerical modelling have been adopted.
The numerical modelling has been carried out using Flow Science, FLOW-3D software. Two fully 3D model have
been considered including a STRIP-MODEL, reproducing a ten meters wide strip of the stepped-spillway and a
FULL-MODEL,reproducing the whole stepped spillway and the downstream stretch of the Blue Nile.
The analyses led to the following main results:

aeration devices were deemed neither necessary nor effective;
energy dissipation efficiency ranges from 60% up to 75% for the larger and smaller design flow,
respectively;
the lowest values of cavitation indexes vary, from 0,65 to 1,1 therefore greater than critical values
estimated for incipient cavitation assumed for stepped spillway (i.e. 0.6). However considering that
cavitation may mainly appear on the vertical riser just below the step tips, where the lowest pressures can
be observed, the vapour bubbles tend invariably to be swept away by the stream-wise flow and to collapse
far from the steps surface, thus reducing the risk of actual damages;
the hydraulic jump at the bottom of the spillway is invariably submerged. The majority of residual stream
power entering in the jump, is dissipated in the first 30 m of the stilling basin. The analysis of dynamic
pressures distribution, allowed also the verification of proper dimensioning of the protection slab and
relevant anchoring system at the dam toe;
due to aeration effect and water surface oscillation the maximum tailwater level results to be 3 m higher
than black water profile resulting from theoretical calculations (516 against 513 m a.s.l.).
Fig. 10 – FLOW 3D Analysis for Temporary stepped-spillway with crest at 560 m asl. - Velocity field for Q= 12’000 m3/s.
7. Thermal Analysis and Temperature Control
Considering the RCC volume (higher than 10 Mm3) and production rates (up to 370’000 m3/month) of GER Main
Dam, temperature control has been one of the most important issues during construction of this project.
The main measures to control temperature rise in the dam consist in: pre-cooling of materials (i.e. aggregates,
water), utilization of cement with lower hydration heat, mixes with low cement content, appropriate construction
schedule, solar radiation protection by continuous curing.
The degree of pre-cooling (i.e. maximum allowable placing temperature of RCC) is defined by accurate thermal
study. Transient thermal analysis has been conducted by finite differences software developed by Studio Pietrangeli
[2] in order to evaluate the temperature distribution histories in the dam. SP’s in-house thermal model considers the
main parameters that influence thermal behaviour of an RCC dam, including: time-dependent ambient conditions
(fluctuation of air temperature and solar radiation, heat transfer by convection from the external surface of RCC lift);
time variation of thermal properties of the RCC/Grout Enriched-RCC mixes and production parameters (placing
temperature, construction start, lift height and lift placement rate).
The thermal properties of the mixes, preliminary estimated by conventional laboratory tests, are calibrated by back
analysis of the first RCC dam block partially placed and used in the river diversion scheme. This block, measuring
approximately 130 x 14 x 20 m (40’000 m3), is on purpose equipped with 31 thermocouples.
The results of transient analysis together with the thermo-mechanical properties and degree of restraint present in the
different locations of the dam are used to evaluate mass and surface cracking in the RCC mass and upstream face.
During the progress of dam construction, the temperatures recorded by the sensors installed in the dam body, are
periodically compared with the maximum allowable temperatures deduced from thermal studies as a function of
dam zone and mechanical characteristics of the RCC mixes. These temperature limits, together with an indication of
prompt actions to be taken in case anomalous temperatures are detected, are included in the temperature monitoring
and early warning procedure implemented during the GER Main Dam construction.
The handy tool of early warning procedure is represented by the plot of Fig. 11, which indicate, for each zone of the
Dam (different RCC mixes and elevation) the temperature limits and the relevant safety factors against mass
cracking. Specific procedures are defined for each warning area M2, M3 and M4.
Fig. 11 – Temperature early warning zones
An example of comparison between temperatures recorded in the dam body and the threshold limit above described
is illustrated in the Fig. 12.
Fig. 12 – Downstream zone, comparison between temperature readings and temperature early warning limits
To date, with about 7 Mm3 of RCC placed, temperatures recorded in the dam body are in line with calculation
predictions, confirming the good match with the values predicted by the calibrated model.
References
[1] 1982, Deere Don U., “Cement-bentonite grouting for dams» Proceedings of Conference on Grouting in
Geotechnical Engineering”, ASCE
[2] 2013, C. Rossini, E. Schrader, “Gibe III Dam: Project Summary, Mixes, Properties, Thermal Issues and Cores”,
Water Storage & Hydropower Development for Africa.

The Authors:
Giorgio Pietrangeli, civil hydraulic engineer, is the founder and managing director of Studio Pietrangeli, a leading European
engineering consultancy firm, based in Italy, specialized in the design of dams and hydropower projects. Over the past 50 years
he has been personally responsible for finding innovative solutions and using non-conventional methodology to ensure successful
implementation of the firm’s entire range of engineering services. His numerous projects include the feasibility, design and/or
technical supervision of construction of 219 dams and 68 hydropower projects worldwide, particularly in Africa.
Alberto Bezzi is GERD Project Coordinator for Studio Pietrangeli. He graduated with honors in civil and hydraulic engineering
at the University of Rome “La Sapienza”. Working with Studio Pietrangeli, he has acquired over 20 years of experience in the
field of design and project management of large dam and hydropower projects.
Claudio Rossini graduated with honors in civil engineering from the University of Rome “La Sapienza”. He specialized in rock
mechanics and since working with Studio Pietrangeli has been deeply involved in the study and design of RCC mixes for the
large dams of Gibe III and GERdp. He also has gained important experience through working closely in the field with major
international experts during the construction of Gibe III.
Alessandro Masciotta, obtained his degree in Civil & Hydraulic Engineering from the University of Rome “La Sapienza”.He
has more than 20 years’ experience as a designer for large civil works including dams and hydropower projects. He has a
remarkable expertise in the design of large hydraulic structures thanks to his knowledge both of hydraulic and structural
engineering. He has been involved for Studio Pietrangeli in the design of several of the firm’s most important projects, gaining
remarkable experience in the structural modeling and design for very high dams and hydraulic structures.
Davide D’Alberti, obtained his degree in Civil/Environmental Engineering from the University of Rome “La Sapienza”, has
acquired experience in geotechnical engineering for large civil works and dams and hydropower projects both in Italy and Africa.
Since 2010, as one of Studio Pietrangeli’s geotechnical specialists, he has been closely involved in all the phases of large dam
projects from feasibility to final design and supervision during construction, acquiring remarkable experience in rock mechanics
and grouting works.