Embed Size (px)
Citation preview
Grade Failure, Drop out and Subsequent School Outcomes: Quasi-Experimental Evidence from Uruguayan Administrative Data
Marco Manacorda This version: November 2006
QMUL, CEP and STICERD (LSE) and CEPR This paper uses administrative longitudinal micro data on about 100,000 Uruguayan students in public non-vocational Junior High school (grades 7-9) to identify the effect of grade failure on students' subsequent school outcomes. Exploiting the discontinuity in promotion rates induced by a rule that establishes that a pupil missing more than 25 days during the school year will automatically fail that grade I show that grade failure leads to substantial drop out and lower educational attainment after 4 to 5 years since the time when failure first occurred. Complementary evidence based on a change in the regime of grade promotion provides additional support for this conclusion. Keywords: grade retention, school drop out, age-grade distortion, regression discontinuity. JEL codes: I21, I22, J20 I am grateful to Jerome Adda, David Card, Chang-Tai Hsieh, Thomas Lemieux, Alan Manning, Guy Michael, Justin McCrary, Enrico Moretti, Barbara Petrongolo, Tommaso Valletti, Steve Pischke, and seminar participants at UC Berkeley, IFS, LSE, Univerity of Paris-Jourdan, Univerity of Toulouse, Bocconi University, the Universidad de la Republica Montevideo and ANEP for many helpful comments and suggestions. I am also grateful to Federico Bachino, Darwin Caraballo, Santiago Cardozo, Fernando Filgueira, Laura Galletti, Cecilia Llambi, Estela Montado, Renato Opertti, Marcelo Pereira, Andres Peri, Alejandro Retamoso, Carmen Tornaria and especially to Hilda Surraco and Andrea Vigorito for many helpful discussions about the school system in Uruguay and help with the data. Diego Aboal and Cecilia Vera provided excellent research assistance. Financial help from the Nuffield Foundation (New Career Development Fellowship in the Social Sciences) and ESRC (grant no. 000-22-0131) is very gratefully acknowledged. Address for correspondence: Marco Manacorda, CEP, London School of Economics, Houghton Street WC2A 2AE, London, GB, email: [email protected].
1
Grade repetition is particularly widespread in Latin America in both primary and Secondary school. In
Brazil for example repetition rates in primary school are in the order of 20%. Nicaragua, Peru and
Uruguay follow suit with repetition rates between 8% and 10%. In lower secondary education
repetition rates are the highest in Brazil (17%) followed by Uruguay (12%).1 Similar or higher
repetition rates can be found in other regions of the world. Repetition rates are of similar magnitude in
North Africa and the Middle East. In Tunisia for example repetition rates in Junior secondary are 21%
and similar rates can be observed in Morocco. By far repetition rates are the highest in Sub-Saharan
Africa. In Burundi for example repetition in Junior secondary is 37% and in South Africa is 13%.
Although repetition is not a phenomenon unique to developing countries, rates in developed countries
are generally much lower. In Italy and Germany, two developed countries where repetition occurs, for
example, repetition rates in lower secondary education are between 2% and 3%. The USA is probably
an exception among developed countries. Although the US Department of Education does not provide
official figures on repetition, estimates from the CPS for the 1990s show that around 12% of
individuals aged 12-15 have repeated at least a grade (Cascio (2005)). This despite widespread (but
declining) 'social promotion', i.e. the practice of passing students failing to meet performance standards.
In many developing countries grade retention policies are often accompanied by low enrollment
and high drop out, the combination of the two often referred to as 'wastage' (for evidence on Latin
America see Urquiola and Calderon (2004)). Figure 1 plots gross enrollment rates in secondary school
on average (across grades) repetition rates in primary school for 61 countries. Data come from
UNESCO (2002) and refer only to those countries that report positive repetition rates, since there is no
way in the data to ascertain if missing data on grade repetition are due to lack of data or lack of
repetition. Sub-Saharan Africa shows both the lowest enrollment rate (31%) and the highest repetition
rate (around 20%). At the other end of the spectrum Central Asia, Eastern and Western Europe and
1 Data refer to 2002 and come from the World Bank EdStats (http://www1.worldbank.org/education/edstats/index.html).
2
North America, display repetition rates that vary between 1% and 2% and enrollment rates that vary
between 86% and 112%. North-Africa, Middle East and South East Asia locate somewhere halfway
with repetition rates between 8% and 9% and enrollment rates between 62% and 66%. Latin American
countries locate just to the right of these countries, with an average enrollment rate of 73% and an
average repetition rate of 6%.2
Figure 2 provides additional evidence on one of the factors correlated with repetition. This
figure plots the average repetition rate in primary school over PPP per capita GDP in 1999. The figure
shows clearly that not only do repetition rates in primary school tend to be strongly negatively related
to enrollment in secondary school but also with GDP per capita.
The evidence in Figures 1 and 2 immediately raises the question of whether the correlation
between grade repetition and subsequent school enrollment is by any means causal. Do repetition
policies bear a responsibility for low educational attainment of the population in developing countries?
In particular, do the hurdles that this policy creates for the transition through the school system explain
why a large fraction of students eventually drop out? Or is it the case that the correlation in Figure 1 is
just spurious, due for example to the circumstance that where the demand for education is low, as
possibly in many developing countries, the efficiency of the system (as measured by grade promotion)
is also low, perhaps due to low public expenditure on education? Do poor teachers' quality and lack of
school infrastructures - often cited as two main problems of the school systems in developing countries
- explain both high failure rates and students' incentives to abandon the system? Or is it the case that
where poverty is widespread students find it harder to progress through the system due to malnutrition,
lack of financial resources (coupled with credit constrains), residential overcrowding, or the higher
opportunity cost of attending school, hence leading to both repetition and drop out.
2 Results (not reported) are very similar if one uses repetition in secondary school as opposed to repetition in primary school.

3
This paper aims at estimating the causal effect of grade failure on students' subsequent school
outcomes and rates using administrative micro data for Uruguay from 1996 to 2000.
The desirability of a grade retention policy in schools is a controversial issue and one to which
there is no obvious and unequivocal response. There is large disagreement among education experts
and the general public on whether on the whole grade repetition is beneficial to students and the society
at large. On the one hand, there is a widespread view among psychologists and part of the pedagogical
profession that early grade failure does not lead to any improvement in school achievement (McCoy
and Reynolds (1999)), while raising drop out (Jimerson et al. (2002)), with negative - or at least non-
positive - effects on socio-emotional adjustment (Jimerson et al. (1997)).3 Low self-esteem - possibly
due to a student being disenfranchised or stigmatized by peers, teachers or family -, lower expectations
on the part of the student or the environment around him, or the cost of having to readjust to a new
class (and possibly a new teacher) as a result of repetition, might worsen a student's school outcomes.
This might even result in a student dropping out of school if he is older than compulsory schooling age
(or above compulsory schooling level), or even before it when enforcement of compulsory schooling
laws is lax, as in many developing countries. Whether due to disenfranchisement, stigmatization or
pure rational calculation,4 the potential effect of grade failure on drop out makes the problem of grade
repetition less apparent - if drop out happens immediately after grade failure - but the consequences of
grade failure not less serious.
A different view emphasizes the benefits of grade repetition. Grade retention might reinforce a
student's knowledge or discipline, with potential beneficial effects on his outcomes. Additional
exposure to teaching might strengthen a student's background making him more apt - and hence
presumably more likely - to pursue higher levels of education. Experiencing the penalty of repeating a 3 For a less negative view of the effect of grade repetition see Alexander et al. (2003). 4 Grade repetition increases the time required to achieve a desired level of education and hence the horizon over which the returns to education accrue to the individual. In a simple human capital model, assuming that grade repetition is uncorrelated with future school and labor market outcomes other than through the extra year required to achieve a desired level of education, grade repetition should lower an individual's optimal level of education.
4
grade might also make a student less likely to want to experience this again hence creating an incentive
for him to improve his school performance, possibly because of the increasing marginal cost of
repeating an additional grade. Repetition might also potentially help improve the quality of the match
between the school and the student. This might happen if a child's development makes him more apt to
attend a certain grade at a later age or if changing peers (and possibly teachers) leads to an increase in a
child's productivity. According to this view grade repetition is potentially an efficient mechanism to
reallocate students to classes.
Possibly, however, the strongest argument in favor of grade repetition is that this might act as a
deterrent against students' poor school performance. By inflicting a high penalty to underperformers,
this policy creates an incentive for students to increase their school effort, although this might come at
a cost, since students take longer to transit through the school system, possibly in part compensated by
the productivity gains of repetition and the savings due to lower attendance at higher grades when
failure results in drop out.5
Although there is a rather copious body of research on the determinants of grade repetition,
convincing evidence on its effect on students' outcomes is still scarce, especially for developing
countries and this paper aims at filling this gap.6 The main difficulty in identifying the effect of grade
5 The debate follows very closely an only apparently unrelated discussion among economists and social scientists at large, on the effect of public punishment of crime on individuals' well being and the well being of the society at large. The questions are very similar. Is there a rehabilitation effect of punishment (Ehrlich (1981))? Does punishment deter crime (Kessler and Levitt (1999), Lee and McCrary (2005))? What is the optimal level of punishment (Polinsky and Shavell (2000))? One major difference between these two phenomena is that while externalities from crime (to the detriment of the victims) are often cited as a rationale for policy intervention in the area of justice, such rationale is less clear cut when school underperformance becomes the target of the policy, unless one believes that there are negative externalities associated to underperformers remaining in a certain class. 6 Evidence from more developed countries on the determinants of grade repetition illustrates a causal relationship between family socio-economic status (Oreopoulos et al. (2003) for evidence on parental education, Maurin and Goux (2005) for evidence on residential overcrowding), educational inputs (Pischke (2003) for evidence on the length of the school year) and early childhood interventions (Currie and Neidel (2004) for evidence on Head Start) on the one hand and grade retention (often measured as age-grade distortion) on the other. For less developed countries, there is also ample evidence that family background and school inputs are important determinants of grade failure (Gomes-Neto and Hanushek, (1994) for Brazil). Evidence from Colombia based on a randomized school voucher program illustrates the positive effect of increased school choice and the ability to afford private education on promotion rates (Angrist et al. (2002)). Conditional and unconditional cash transfers also appear to have a positive effect on grade promotion (Behrman et al. (2001); Schady and Araujo (2005)).

5
failure on a student's subsequent school outcomes is that a student's latent school outcomes - i.e. the
ones which would be observed in the absence of grade retention - and the propensity to fail a grade are
likely to be simultaneously determined. Characteristics of the pupil - such as his ability or motivation -
together with characteristics of his environment - such as his family or neighborhood – and school are
all likely to affect both the probability that a student will fail a grade and this student's probability of
being in school and, conditional on this, his school outcomes. In addition, current poor school
performance might itself be a cause of both grade failure and future poor school outcomes. Similarly, a
student's decision to drop out of school during a certain school year might simply result in this student
failing that grade, inducing some reverse causality between drop out rates and subsequent educational
attainment on the one hand and grade retention on the other hand. Because many of the variables
simultaneously affecting grade failure and latent school outcomes are typically unobservable on the
part of a researcher and because of the potential reverse causality between drop out and grade failure,
simple (conditional or unconditional) correlations between grade failure and school outcomes are
unlikely to provide a good indication of the causal effect of grade failure on subsequent school
outcomes. Because of the confounding effects listed above, most likely such correlations would tend to
overestimate the impact of grade failure on subsequent school outcomes.
In order to circumvent the classical identification problem highlighted above, in this paper I
suggest using a rule in force in secondary Junior High school in Uruguay that establishes automatic
grade failure for those pupils missing more than 25 days during the school year. This rule induces a
sharp discontinuity in the relationship between the probability of passing a grade and the number of
missed school days at 26 days of absence. I exploit the discontinuity in grade advancement induced by
this rule to asses the causal impact of grade failure on drop out rates and school attainment later in life.
Effectively I compare individuals to the left and to the right to the discontinuity point in a given year
and follow their school progression over time. As discussed in the text, this design attempts to mimic
random assignment of grade failure in the students' population and under some assumptions allows us

6
to answer the question of what effect grade failure has on a student's performance net of any other
confounding factors or reverse causality.
For the purpose of this exercise I use administrative data on a sample of around 100,000
students in public non-vocational Junior High school (grades 7-9) in Uruguay between 1996 and 1997.
I am able to follow these students' progression in the public non-vocational secondary (both Junior and
Senior, i.e. up to grade 12) school system until 2001.
The estimates below show pronounced and statistically significant negative effects of grade
failure on later school outcomes. Not only does grade failure induce students to drop out at the end of
the school year when failure occurs but its effects appear long lasting. Both failers and repeaters, i.e.
those who fail a grade and stay on, stay a shorter time in school than non failers and end up with less
accumulated education.
Although, as said, the evidence on the causal effect of repetition on performance is scarce,
others have attempted to tackle this issue. Two papers, both for the US, account explicitly for the
potential endogeneity of failure rates. Jacob and Lefgren (2004) use the discontinuous relationship
between test scores and promotion to assess the casual impact of grade repetition on achievement
among Chicago public school students in third and sixth grade. Their results show a positive short-term
effect of grade retention on third graders' achievement. Eide and Showalter (2001) use the US high
School and Beyond Survey to assess the impact of grade retention (by grade 10) on drop out rates and
earnings later in life. Using the variation in age of entry into kindergarten across US states as an
instrument for repetition - an instrument whose validity appears questionable - they conclude that for
white students grade repetition tends to lower the drop out rate and increase earnings, although results
cannot be told statistically apart from zero.
The empirical estimates in this paper suggest by converse a significantly negative effect of
grade failure on later school outcomes, largely working through higher drop out. In the conclusions to
the paper I attempt to reconcile my results with the previous evidence quoted above.

7
The structure of the paper is as follows. Section 1 provides background information on the
school system in Uruguay. Section 2 presents the basic data. Section 3 presents evidence on the
correlation between grade failure, absenteeism and school outcomes. Section 4 discusses the
specification of the regression model and the identification behind the empirical strategy proposed.
Section 5 presents the regression results and Section 6 finally concludes.
I. THE SCHOOL SYSTEM IN URUGUAY: BACKGROUND
Uruguay is one of the smallest (176,220 km2) countries in Latin America, Population in 2005 was
about 3.4 million, approximately half of which reside in the metropolitan area of Montevideo, the
capital city. Despite Uruguay being an early starter in the process of development, over the last century
the country has grown at a very slow pace. While per capita GDP in 1870 was approximately equal to
the contemporaneous per capita income in the USA, in 1920 this figure was about 50% and by the end
of the last century this was around 30% (Maddison, 2004). Nowadays the share of population below the
poverty line is about 21% (CIA, 2005).
Uruguay boasts a long tradition of publicly provided education and social inclusion. Primary
school was made compulsory in 1877, universal primary schooling was achieved in the 1950s and the
literacy rate is among the highest in the region (97% for men and 98% for women).
The Uruguayan school system is organized into three basic cycles: Primary Education
(Education Primaria, grades 1-6), Junior High (Ciclo Básico, grades 7-9) and Senior High (Education
Secundaria, grades 10-12).7 8 School starting age is 6 and Primary and Junior high school (or the
equivalent vocational course of studies) are compulsory. Minimum working age is 14 (hence lower
7 Since 2002 an additional year of primary education for students aged 5 has been made compulsory. 8 A parallel path to Ciclo Básico after Primaria leads directly to vocational training (Educación Professional).
8
than the minimum age required to complete compulsory education).9 Junior and Senior secondary
education is offered in both Liceos, similar to the French Lycées, i.e. non vocational secondary schools
typically leading to university enrolment, and in vocational colleges, UTUs (Universidad del Trabajo
del Uruguay, literally the Uruguayan Employment University) that offer both Secondary and Tertiary
level education. The rest of tertiary education is offered in Universities and teacher training colleges
(Magisterios). In 2000, enrollment in Ciclo Básico in Liceos was in the order of 115,154 students.
Around 14,700 were attending Ciclo Básico in UTUs.10 Not dissimilar from many other Latin
American countries, private fee-based education is widespread at all levels. This covers respectively
9% of primary school enrolment and about 15% of secondary school enrolment.
Even if, as said, Uruguay still ranks high in terms of its educational outcomes compared to the
rest of Latin America (with only Argentina, Chile and Peru showing higher average years of
education), its education system is not problem free.11 Over the last decades growth in educational
attainment of the population has been rather modest. From 1960 to 2000 for example, while average
years of education in the population over 25 in the USA has risen by around 4.5 years (from 8.7 to
12.2), growth in Uruguay has been in the order of 2.1 years (from 5.1 to 7.2) (Barro and Lee (2001)).
Data from a specific education module administered in conjunction with the National
Household Survey (Encuesta Continua des Hogares) of 2001 illustrate a long delay in the transition
through the school system and widespread drop out before completion of the compulsory school
cycle.12 For example, between the ages of 15 and 17, when theoretically all youths should have
9 Recently, minimum working age has been increased to 15. The circumstance that minimum working age is lower than minimum compulsory age is not unique to Uruguay. Similar disciplines were in force in several US states at the beginning of the last Century. Special provisions are made for working students in terms of continuation (night) schools. 10 Source www.utu.edu.uy. Enrolment in basic professional courses in UTU, (excluding Ciclo Básico) was in the order of 20,500 students. 11 See also Bucheli and Casacuberta (2000). Starting from the mid 1990s and in recognition of these problems a very ambitious reform of the educational system has taken place, the main ingredients of the reform being: school construction, curricula redesign and teacher training (ANEP (2000)). 12 There is a consensus among experts of the Uruguayan educational system that the democratization of Secondary education and the ensuing increase in access to this level of education that took place over the 1980s-1990s did not translate

9
completed Ciclo Básico, the proportion with less than completed Ciclo Básico is about 42%. In the age
group 24-29 around 20% of individuals declare never having started Junior high school. Among those
who started this school cycle around 16% declare not having completed it. This possibly suggests that
students get discouraged or find their poor school ability revealed as they cross the system. One of the
hurdles that students find during their progression through the school system is the high probability of
failing a grade. Very notable is the difference in completion rates between repeaters and non-repeaters.
Completion rates in Ciclo Básico amount to 87% for those with normal progression but only to 63% for
those who repeat at least a grade. The data illustrate hence a very clear correlation between grade
repetition and subsequent school outcomes at the individual level. As already hinted at in the
introduction, though, it is premature to conclude from these figures that grade repetition is itself
responsible for such poor outcomes. In the rest of the paper I will try to devise a strategy that attempts
to isolate the causal effect of grade failure on subsequent school outcomes net of other confounding
factors and the potential endogeneity of grade failure with respect to subsequent school outcomes.
II. DATA
In this section I present information on an administrative data set referring to a large sample of
individuals in Ciclo Básico. Before presenting the data, it is useful to provide a few more details on the
rules disciplining grade progression in Ciclo Básico. These details refer to the school years 1996 and
1997.13 The discipline changed somewhat in 1998. I will return to this later in the paper when I exploit
the differential intensity of the rule across years as an additional source of identification.
into an equal increase in educational attainment due to the inability of the system to retain these students before completion of the school cycle (Furtado (2003), Da Silveira and Queirolo (1998b)). 13 The discipline mentioned here refers to old curriculum (Plan 86). In 1996 a new curriculum was introduced (Plan 96) that changed both the content and the structure of teaching, the length of the school day (from 3.5 hours to 5 hours) and the rules determining promotion. As Plan 96 was introduced experimentally in a few schools (Liceos Pilotos, literally Pilot High Schools), the majority of students in 1996 and 1997 were still under the old Plan. Regression results below refer to both Liceos Pilotos and those in Plan 86. Results (not reported) are virtually unchanged if I only restrict to Liceos Plan 86. This information comes from ANEP, Circular 2306, 1996.

10
At the end of each school year that goes from March to December, students are assigned a mark
for each of the 12 taught subjects based on their performance during the year. In theory, grade
advancement depends on the student fulfilling two conditions. First, it is required that at beginning of
each school year the student owes no more than three subjects from any previous year, i.e. has no more
than three accumulated fails that he has not in the meantime cleared. Those who fail a subject can re-
take it during subsequent re-take sessions, provided they have no more than six accumulated debts, in
which case they fail automatically. The first opportunity for retaking exams is just before the beginning
of the subsequent school year, in February, following a short remedial course. Subsequent re-take
exams take place in July and December of each year. Grade promotion depends on the number of debts
after the February re-take session. So if a student ends the school year in December with four debts but
he clears one of these debts in the following February re-take session he will still be allowed to
progress to the next grade. Hence, a student with no more than three pending subjects is allowed to
progress but will eventually need to pass exams in all the pending subjects before graduating. Students
with more than three debts after the February re-take session will have to repeat that grade.
The second condition that must be simultaneously fulfilled is that the student has missed no
more than 20 school days during the year.14 A student fulfilling both conditions is automatically
entitled to grade advancement. Discretion on the part of the school is allowed provided the student has
missed no more than 25 days of school.
Hence, in practice, repetition is warranted with no more than three pending subjects and at most
20 missed school days. Students with between 20 and 25 missed days of school and no more than three
pending subjects can pass at the school discretion. Over 25 days of absence or with more than three
pending subjects grade failure is unavoidable.
14 For the purpose of computing missed school days, any justified absence for medical reasons or any other serious reason counts half a day. Missed school days are approximated to the lowest integer for the purpose of grade promotion.

11
For the purpose of this analysis I have assembled administrative micro data on students in
(almost) all public non vocational high schools in the country. The data refer to the school years 1996,
1997, 1998 and 2000 (no data is available for the year 1999). The data report information on the
institution and grade attended in a school year and whether the student passed or failed that grade. Data
for each year have a longitudinal component since they also report information on whether a student
registered the following year. Data on passing or failure refer to the beginning of the following school
year after the February re-take session. If the student remains in the system in the following year, one
also knows in what grade he registers next (but not in what institution). This means that for those
observed in the year 1998 one is also able to see whether they registered in 1999 and if they did in
which grade. The same applies to the year 2001 for which one can derive information on attendance
based on year 2000 data. Because a unique identifier refers to each pupil, one can link observations
across years. In this way – and despite administrative records for the years 1999 and 2001 not being
available- one can follow individuals as they progress through the public non-vocational secondary
school system from 1996 to 2001. Rather important for the purposes of this analysis, the data also
provide information on the number of recorded missed school days during the school year (1996, 1997,
1998 and 2000) for each student. Finally, data for 1996 and 1997 (but not for later years) report also
information on a student's sex and age.
Because a student's age is an important variable in my analysis and because promotion rules
changed in 1998, below I only restrict to those individuals who transited through Ciclo Básico
sometime between 1996 and 1997 and I follow their school progression over time. Given the available
data, I do not know whether those who registered in a certain grade in 1999 or 2001 eventually passed

12
or failed that school grade.15 Because of this, in the following I measure school progression in terms of
number of years in the sample and maximum grade attended (rather than maximum grade passed).
There are some important limitations to the data. First, the data exclude UTU's and private
institutions. Because of this, I can only measure whether a student is retained within the public non-
vocational system (whether Junior or Senior high) but I am unable to distinguish those leaving the
educational system tout court from those moving to private institutions or to public vocational
intuitions. Second, some schools happen not to be included in the sample although this problem tends
to be less serious at the end of the period: the number of missing institutions is 56 in 1996, 59 in 1997,
13 in 1998 and 4 in 2000 (out of around 250 schools). This might be a problem if grade failers are more
likely to move school than non failers. Third, students' progression in the school system can only be
measured with error since data for 1999 and 2001 only refer to the grade attended by those who were
registered in the previous year (1998 and 2000 respectively) and hence exclude those who enter for the
first time or re-enter the system in 1999 or 2001. If repeaters are more likely to attend intermittently,
again my estimates might overstate the gap in educational achievement between grade failers and grade
passers.
None of these problems though is likely to seriously affect my results. First, students are largely
assigned ex-oficio to a public school depending on their residence and school catchment areas (Da
Silveira and Queirolo (1998a)), and changing school within the public non-vocational education system
is far from easy. Second, evidence from a follow-up phone survey of 660 individuals who dropped out
of first year of Ciclo Básico in a Liceo in 1997 and reported in ANEP (2000) shows that only around
1.6% had moved to a private institution and 15% had moved to a UTU by 1998.16 What these results
suggest is that misclassification of school movers as drop outs is unlikely to be a serious problem in my
15 In principle this information could be recovered in 1999 conditional on being enrolled in 2000 but this obviously refers to a selected sample. 16 60% of these individuals had not re-registered. Another 4.5% had moved to another public Liceo. The residual 19% was registered in informal education (most likely professional education).

13
data, although this is obviously no proof of this misclassification not affecting selectively more grade
failers than grade passers.
A final weakness of the data at hand is they do not provide information on students' school
outcomes (e.g. final marks and/or number of pending subjects) other than whether they fail or pass (in
1996, 1997, 1998 and 2000), whether they stay on and, conditional on this, on the grade attended each
year. This makes it hard to investigate what channels lead to possibly different outcomes for grade
failers compared to non failers. Progression following grade failure might depend on both a student's
and a school's changes in opportunities, constraints or behavior. Grade repetition for example might
affect a pupil's outcomes through repeated exposure to teaching, changes in effort or improved match
with teachers or peers. Schools on their side might stigmatize or favor early repeaters even conditional
on their year performance. In the following I will try where possible to shed some light on the role of
these different mechanisms.
Table 1 provides some descriptive statistics based on the administrative records. The left part of
the table refers to the entire sample, the middle part to those who fail a grade and the right part to those
who pass. Each observation refers to an individual-grade observation. Overall, there are 148,038
observations in the sample and 100,862 individuals, implying that I have on average just below 1.5
observations per individual. Each column of the table refers to a separate grade. The number of
individuals falls from seventh grade (accounting for about 40% of the sample) to ninth grade
(accounting for about 29% of the sample). This reflects the pyramidal structure of secondary school
system in Uruguay. This in turn is largely due to school drop out rather than - as shown below- to
differential retention rates across grades. Average age increases from around 12.5 in seventh grade to
14.8 in ninth grades, a sign of a modest delay in school progression. Arguably, those in ninth grade are
more likely to have started at an earlier age and not to have repeated before compared to those who
never reach ninth grade, so this number provides a lower bound estimate of the delay in school
progression in the absence of selective drop out. Girls tend to be more represented the higher the grade,

14
suggesting larger drop out among boys. There is some variation in number of missed school days or
repetition rates across grades, the first varying between 18 and 20, and the second varying between
27% and 31%. Since the school year is approximately 180 days, this suggests an average absenteeism
rate in the order of 10-12%. Both repetition and absenteeism are the highest in ninth grade and the
lowest in eighth grade.
As an outcome variable at this stage I examine a student's additional school grades attended by
the end of the period of observation. This is the difference between maximum grade attended by 2001
and the grade where the student was observed in Ciclo Básico. Additional grades attended potentially
range from zero (for those who drop out immediately or repeaters who fail again) to 5 (if individuals
are observed in 1996 in seventh grade and progress smoothly to twelfth grade in 2001). The variable is
right censored since some individuals will still be in school in 2001 and because this variable can at
most take value 4 for those observed in 1997. Censored observations include both those who have not
dropped out and are still in school because they could not have theoretically done so under normal
progression (e.g. those in seventh grade in 1997) or those who are still in school because of later failure
(e.g. those in eighth grade in 1997 who fail ninth grade in 1998). The data clearly illustrate the extent of
censoring. The proportion of individuals still in the sample in year 2001 varies from 47% to 16%
moving from seventh to ninth grade. Additional grades attended increase from 2.3 for those observed in
seventh grade to 1.6 for those observed attending ninth grade. This is obviously a reflection of the fact
that the number of grades left falls as the grade attended increases. However, because this variable does
not fall one to one with the grade attended in Ciclo Básico, as it would be the case if drop out happened
at the same rate after each grade, this also suggests a larger drop out rate at earlier grades. This is most
likely the reflection of those attending ninth grade being a selected sample of individuals (those with
higher probability of staying on).
Rather than looking at the number of additional grades the student has gone through one can
examine the number of additional years the student has spent in school. Because progression is not
15
automatic even at later grades, one would expect duration to be longer than the number of additional
grades. Duration is a variable that ranges from zero (for those who drop out immediately) to 5 (if
individuals first observed in 1996 are observed continuously up to 2001). This variable is again right
censored since some individuals will still be in school at the end of the period. Again, the extent of
censoring will depend on the year of first observation since those observed in 1997 can at most stay in
the sample for an additional 4 years. Average duration in the sample is about 3, suggesting that some
individuals drop out before 2001, so that censoring is far from universal (in which case duration would
be around 4.5), consistent with the observation that the proportion of censored individuals is strictly
less than one. Rather important, duration is longer than additional grades attended. This is an indication
of slow progression later in school.
An analysis of the differences between grade failers and non failers illustrates that along the
observable dimensions failers perform worse than non-failers. Compared to non-failers, failers are in
between 0.5 and 0.9 year older and they tend on average to miss 4 to 5 times more school days. Rather
interestingly, boys are much more likely to repeat a grade than girls (34% compared to 26%). This fact
is not unique to Uruguay although it is not obvious whether this is due to differential school ability,
differential socio-emotional development, differential opportunity costs (e.g. boys having better current
labor market opportunities than girls) or other factors. When I move to outcomes, failers perform much
worse than non failers. If failers were identical to non-failers, grade failure only delayed progression in
the school system and there were no censoring (i.e. one could follow individuals until the end of their
school career), one would expect failers and non-failers to attain the same number of additional grades.
In the case of complete censoring (i.e. if everybody were still at school in the last period), one would
expect the difference in grade attended to be equal to minus one. In fact the data show that failers
attend on average between 2.5 and 1.5 less years in school than non failers suggesting unequivocally
worse outcomes for failers than non failers. This difference is likely to underestimate the true gap
between failers and non failers in the number of additional grades attended by the end of their school

16
career since the proportion of censored observations is much lower for failers than non failers (between
56 and 8 percentage points depending on grade).
Another way of looking at the data is to allow failers to be followed for one more year
compared to non failers. In this case, in the absence of differential drop out rates and if grade
progression is similar across groups, one would expect maximum grade attended to be equal for failers
and non failers. If failers tend to drop out earlier than non failers, as shown this being the case, one
would expect this difference to be negative. If drop out happens largely in the early years, i.e. away
from the censoring point, then it should make little difference whether one follows failers for one extra
year or not. To check for this I have computed a series for grade failers that allows them to be observed
one year longer than grade passers. In practice I artificially censor the sample by following non failers
up to 2000 (and failers up to 2001). Data reported in the table show clearly that the censored series is
below the uncensored one for non failers (for failers this is obviously the same). Differences between
grade failers and passers now range between 2 and 1.5 grades. An analysis of duration and number of
additional grades attended shows rather clearly that non failers tend to stay longer and to accumulate
more years of education. Failers tend in general to accumulate only half a grade more while non failers
accumulate between 2 and 3 more additional years depending on which grade they were originally
observed in. Duration is obviously higher for non failers (between 2.5 and 3.5) suggesting some
accumulated delay of around half a year due probably to further grade repetition. For failers the
difference between duration and number of additional grades is around 1 year, so higher than for non-
failers. This possibly suggests that failers are more likely to repeat an additional grade. I will try to
disentangle these two forces later on when I present my regression results.
III. GRADE FAILURE AND SCHOOL OUTCOMES: BASIC EVIDENCE
Although Table 1 is suggestive of a strong correlation between grade failure and subsequent school
outcomes in the administrative sample of pupils in public non-vocational Ciclo Básico, as already said,

17
this is by no means an indication of a causal relationship between the former and the latter variable. I
have shown that along a number of observable dimensions failers are different from non failers and, as
already discussed, reverse causality might also be a contributing factor explaining the negative
correlation apparent in the data.
In order to ascertain this casual effect in the rest of the paper I exploit the discontinuity in grade
failure induced by the rules disciplining grade promotion that I have discussed in the previous section.
Figure 3 plots the probability of failing a grade on the number of missed school days for those with a
number of missed school days between 1 and 35. I exclude individuals with zero missed school days
(around 20% of the sample) and individuals with more than 35 missed school days of absences (about
11% of the sample) since for reasons that will become clearer later I will not use them in my
regressions. The picture shows some interesting features. First, repetition is a positive function of
number of absences. While the probability of failing a grade is less than 0.5% for those with 1 missed
school day, this raises to around 51% at 25 days of absence. This might be an indication of number of
missed school days proxying for a student's unobserved motivation or opportunity of attending school,
or might mask the fact that those performing worse might have a lower incentive to attend school
because they expect to fail the grade anyway. Rather interestingly, there seems to be some acceleration
in the failure profile after 20 days of missed school. This is consistent with the rule that establishes
some discretion on the part of the schools for those with more than 20 (but at most 25) missed days of
school. What is potentially more interesting is that after the 25 missed school days the probability of
repetition jumps to around 95% and it stays flat afterwards. This is consistent with the rule establishing
automatic grade failure after 25 days of absence.
Since grade failure is a discontinuous function of missed school days, for failure rates to have
an effect on school outcomes, one would expect outcomes to vary discontinuously at 26 missed school
days too. Figure 4 analyzes the correlation between additional grades attended (up to 2001) and missed
school days for those who cross Ciclo Básico sometimes between 1996 and 1997. As said, there is no

18
way to measure a student's maximum grade achieved so one has to be somewhat cautions in
interpreting the results from this variable. Additional grades attended (the solid line) falls
monotonically with number of missed school days in Ciclo Básico. While those with 1 missed school
day accumulate on average almost 3.3 additional years of schooling, this quantity is about 0.4 for those
with 35 days of absence. If missed school days proxy for a pupil's ability, motivation or opportunity to
attend school, this correlation is expected. More interesting, though, is the sharp discontinuity in the
outcome variable that is apparent between 25 and 26 missed school days. This is the greatest jump in
the outcome variable, with a fall of just less than half a year from around 1.1 at 25 days of absence to
0.7 years for those with 26 days. Because this is the mirror image of the effect of missed school days on
grade failure in Figure 3 and because it is hard to imagine that maximum education achieved should
display a discontinuity at 26 missed school days in Ciclo Básico for reasons other than the effect of the
rule on grade failure, this can be taken as evidence of grade failure having a causal negative effect on
school outcomes.
As said, maximum grade achieved is censored and censoring is potentially a more serious
problem for grade failers. Rather than plotting the gap between maximum grade and current grade
attended, I have computed the same series by censoring it artificially to the year 2000 for non failers.
This series is plotted in Figure 4 as a dotted line. The censored distribution is systematically below the
uncensored one to the left of 25 missed school days and the difference tends to fall as the number of
missed school days increases, consistent with the observation that the failure rate increases as the
number of missed school days rises. However, at around 25 days of missed school days the difference
between the two series is virtually zero, so that the jump in the number of additional grades attended
between 25 and 26 missed school days remains in the order of 0.4. Effectively this suggests that
censoring is unlikely to be a problem around the discontinuity point, i.e. that most of the individuals
around that point will have dropped out by 2001. This is confirmed in Figure 5 where I plot average
duration in the sample by number of missed school days in Ciclo Básico. Again duration falls with

19
number of missed school days in Ciclo Básico. Average duration is about 3.6 for those who missed one
school day in Ciclo Básico and it falls to around 1.3 for those with 35 days of missed school. Again
there seems to be a sharp discontinuity in average duration between 25 and 26 missed school days. This
is again the greatest jump in duration in the sample, with a fall of just less than half a year from around
2 at 25 days of absence to 1.6 for those with 26 days.
In sum, Figures 3-5 show a clear discontinuity in grade repetition in Ciclo Básico at 26 missed
school days. This is consistent with the rule disciplining grade promotion. I also find evidence that
school duration and additional grades attended present the same (but opposite in sign) discontinuity as
the one observed on failure rates. Because it is hard to imagine that students' progression in the school
system depends systematically on whether they missed 25 or 26 school days in Ciclo Básico if not for
the effect of the promotion rule in Ciclo Básico, one can take this evidence as suggestive that failure
affects negatively subsequent school outcomes. I will go back to alternative explanations for the
discontinuity in the outcome variables later on in the paper.
IV. SPECIFICATION AND IDENTIFICATION
In this section I devise a regression strategy aimed at assessing the impact of grade failure on school
outcomes that is based on the discontinuity in failure rates that I have illustrated above. By using a
regression model, this allows us to control for the observed characteristics of students and their schools
and for the potentials biases in the regression coefficients that stem from differential censoring in
school outcomes across individuals originally observed in different grades (7, 8 or 9) or different years
(1996 or 1997). In this section I also discuss the identification assumption underlying the consistency
of the proposed estimator.
Suppose that school outcomes depend additively on a continuous function of number of missed
school days in Ciclo Básico and on grade failure. I ignore for the time being other covariates. If Y
20
denotes the outcome variable, D the number of missed school days and F grade failure, this is
equivalent to postulating that:
(1) Y = β0 + β1F + f(D) + u
where f(. ) is a continuous function over the support of D and u an error term. This error term
potentially includes a student's past attainment as well as other unobserved determinants of
performance. As already pointed out, the OLS estimates of equation (1) are likely to be biased. This
happens if, conditional on f(D), the error term is correlated with F. As already pointed out in the
introduction this might be due to unobserved co-determinants of grade failure and later school
outcomes or possibly to reverse causality.
In order to circumvent this problem, I suggest using the discontinuity in the failure rate at 26
missed school days as an instrument for failure rates in (1). Consistent with the rule, I assume that the
failure rate is a continuous function of missed school days g(D) plus a term that picks up the
discontinuity in failure rates at 26 missed school days:
(2) F = γ0 + γ1P+ g(D) + v
where P=I(D>=26) is a dummy for 26 or more missed school days in Ciclo Básico. By substituting (2)
into (1) one can derive the reduced form equation:
(3) Y = θ0 + θ1P + h(D) + e
If P is uncorrelated with u in (1), the IV estimate of β1 will be consistent. The identification
assumption underlying the consistency of the IV estimate is that school progression varies continuously
around 26 missed school days if not for the rule governing grade failure.17
Before presenting the estimates of models (1) to (3) it is useful to highlight the likely
implications that the missed-days rule has on pupils' and schools' behavior to see how the differences
between those to the left and those at 26 days can generate some variation in repetition rates that is 17 A similar empirical strategy (fuzzy regression discontinuity) is used – among others – by Angrist and Lavy (1999) in their analysis of the effect of class size on pupils' attainment.

21
arguably exogenous to the outcome equation (1). What is crucial to this discussion is that missed
school days is to a large extent a choice variable on the part of students, which might invalidate its
variation around the 26 days threshold as a valid instrument.
To fix ideas, assume that pupils maximize their school outcomes at minimum cost. If each
school day has some cost but it also enters as an input into the student's education production function,
and pupils have perfect control on their consumption of school days, then one will find that the
variation in number of school days across pupils will only reflect differences in returns to or costs of
one extra day of school. This is arguably a variation that one does not want to use to infer the effect of
grade failure on school outcomes, since most likely differential returns to and costs of an additional day
of schooling across students will also be correlated with their future school outcomes. I try to account
for this variation in the regressions controlling for a smooth function of missed school days. If a rule
like the one that I have described above is introduced, and the cost of attending one extra day of school
is high or the returns from it low, one would see some concentration of students at 25 missed days. A
number of pupils might still decide to miss more than 25 days, in which case they would have an
incentive to miss the entire school year, i.e. not to attend at all. If the decision to withdraw is taken
sometimes over the year, one will find that each student who drops out will accumulate a number of
missed days equal to 25 plus whatever the number of days still needed to complete the school year at
the time this decision is taken. Again, those to the left and to the right of the discontinuity point will be
intrinsically different and this would hardly make the discontinuity a good source of identification.
In fact, missed school days are also likely to be partly outside pupils' control. Sickness, bad
weather, transport difficulties or family responsibilities might prevent a student from attending school
on a certain day. Similar, the unexpectedly high cost of attending school on a specific day due for
example to the unplanned circumstance that a teacher might want to monitor a student's performance
on that day might deter a student from attending despite his original plans. What this suggests is that
shocks to attendance rates (or to the variables that influence it) are likely to be partly unexpected. A

22
student with less than 25 days of accumulated absence who intends or expects to pass the year will
remain in school and decide whether to miss a specific day or not taking into account how many missed
school days he has accumulated so far and his expectations of missing extra school days in the future
due to either bad luck or the expected net gain from it. This implies that most pupils at 26 missed
school days are likely to have suffered from unexpected shocks despite their expectation or desire to
pass the year. Had a pupil decided to withdraw sometimes during the year one would expect to find
him rather away from the discontinuity point. Similarly, had he expected to fail the grade due to poor
performance, one would also likely not find him in the proximity of 26 missed school days, since the
chances of passing the grade by failing less than 26 missed school days are low for this student and the
rule hence has no bite on him.
If this is the case, differences between those with 25 and 26 missed school days will be to a
large extent random, i.e. they will be due to differences between two otherwise similar pupils
(presumably with low school attachment) one of whom was lucky enough not to experience a bad
shock and the other was unlucky and just overcame the 25 days threshold. This is arguably the
variation in school days around the discontinuity point that one wants to exploit to identify the causal
effect of grade failure. In this case one can legitimately interpret the evidence in Figure 3 as the casual
effect of the rule on failure rate. One can also legitimately use the variation around the discontinuity
point as an instrument for grade failure in (1). This strategy would also presumably control for the fact
that some students end up failing a grade because of their earlier decision to drop out during the year.
For the reasons outlined above these students will presumably be substantially above the 26 days
threshold. Because I am using those in the neighborhood of 26 missed school days, one would not
expect these students to be in large numbers in that neighborhood. In this case the IV estimates will
have a LATE interpretation, in the sense that they will identify the effect of failure rates on outcomes
among those with high absenteeism rate.
23
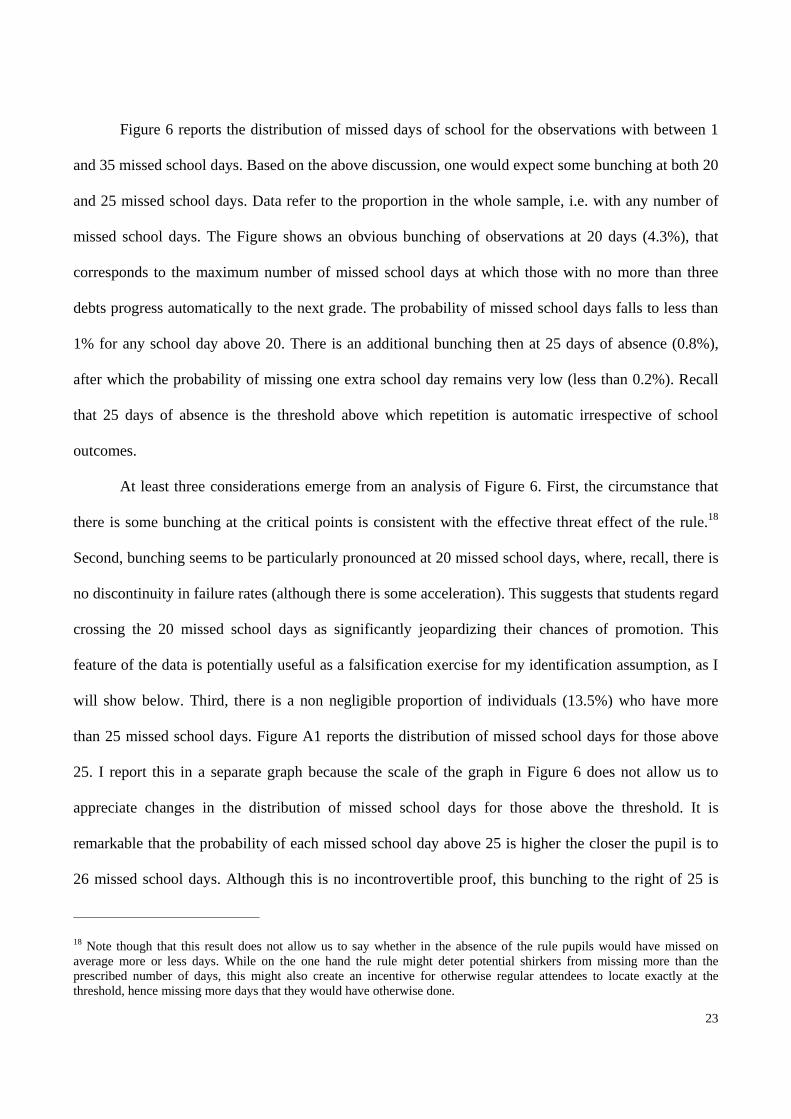
Figure 6 reports the distribution of missed days of school for the observations with between 1
and 35 missed school days. Based on the above discussion, one would expect some bunching at both 20
and 25 missed school days. Data refer to the proportion in the whole sample, i.e. with any number of
missed school days. The Figure shows an obvious bunching of observations at 20 days (4.3%), that
corresponds to the maximum number of missed school days at which those with no more than three
debts progress automatically to the next grade. The probability of missed school days falls to less than
1% for any school day above 20. There is an additional bunching then at 25 days of absence (0.8%),
after which the probability of missing one extra school day remains very low (less than 0.2%). Recall
that 25 days of absence is the threshold above which repetition is automatic irrespective of school
outcomes.
At least three considerations emerge from an analysis of Figure 6. First, the circumstance that
there is some bunching at the critical points is consistent with the effective threat effect of the rule.18
Second, bunching seems to be particularly pronounced at 20 missed school days, where, recall, there is
no discontinuity in failure rates (although there is some acceleration). This suggests that students regard
crossing the 20 missed school days as significantly jeopardizing their chances of promotion. This
feature of the data is potentially useful as a falsification exercise for my identification assumption, as I
will show below. Third, there is a non negligible proportion of individuals (13.5%) who have more
than 25 missed school days. Figure A1 reports the distribution of missed school days for those above
25. I report this in a separate graph because the scale of the graph in Figure 6 does not allow us to
appreciate changes in the distribution of missed school days for those above the threshold. It is
remarkable that the probability of each missed school day above 25 is higher the closer the pupil is to
26 missed school days. Although this is no incontrovertible proof, this bunching to the right of 25 is
18 Note though that this result does not allow us to say whether in the absence of the rule pupils would have missed on average more or less days. While on the one hand the rule might deter potential shirkers from missing more than the prescribed number of days, this might also create an incentive for otherwise regular attendees to locate exactly at the threshold, hence missing more days that they would have otherwise done.

24
consistent with some students attempting to stick to the 25 days limit and somewhat being unable to do
so.
Obviously, although there might be some random variation in the assignment of students to the
left and to the right of the discontinuity point that one wants to exploit for identification, there is no
guarantee that students on either side are identical in terms of latent outcomes. The apparent
discontinuity in the distribution of the variable 'missed school days' is potentially (but not necessarily)
indicative of the failure of the random assignment (i.e. continuity in unobservables) hypothesis around
the discontinuity point that is required for a consistent estimate of the parameter of interest in an RD
context (McCrary (2005); for an application of this test see also DiNardo and Lee (2004)). Students'
ability or willingness to sort around the discontinuity point might vary in a fashion that is correlated
with latent outcomes. For example, if pupils with better latent school outcomes are more able to sort
strategically just at the 25 missed school days threshold, perhaps because unexpected shocks to their
attendance rates outside their controls are less likely to hit them or because they have a greater ability
to keep track of how many missed school days they accumulate day by day, the IV estimate will tend to
overestimate the effect of grade failure on school outcomes. Similarly, records of missed school days
could be manipulated by schools or teachers. Anecdotic evidence suggests that teachers and schools are
not alien to this type of strategic behavior. This might happen if teachers have a preference for some
students or if teachers or schools have a return to passing or failing a pupil (see also Jacob and Levitt
(2003) for evidence on teachers' cheating as a response to incentives). This in turn might be due to a
teacher being corrupt or if high failure rates act as a signal to pupils, parents, colleagues or the head-
teacher of this teacher's quality, which the teacher would rather conceal and in an attempt to do so will
favor some students. In addition, teachers or schools might decide to circumvent this rule in order to
adjust class sizes across grades and avoid ending up with some very large classes and some very small
classes in the same school. Again, this might impact on different students differentially. Ex-ante it is
not obvious which direction the bias in the IV estimates would go, since teachers' behavior might lead

25
to positive or negative sorting of students around the discontinuity point. This last case for example
would happen if teachers passed a student with low chances of later progression due to compassion, the
recognition that grade repetition might be of little help to this student or simply the fact that by passing
worse performing students teachers hope to get rid of them quickly as they progress further through the
system.
Effectively a better look at Figure 3 shows that the failure rate appears to increase
monotonically up to 24 days of absence but falls slightly (by about 3 percentage points) at 25 before
jumping to about one at 26. There is some bunching of students with low probability of failure at 25
days of absence. This suggests in turn that students with 25 missed school days have possibly better
school outcomes than those with 24 days. One reason why this might be the case is that teachers record
25 missed school days for those with more than 25 but whom they want to pass anyway due to their
otherwise good school performance (most likely records adulterations has a cost so teachers will not
tend to underestimate missed school days more than necessary) or perhaps to the fact that better
performing students are more able to locate exactly at 25 missed school days. I will try to deal with
these issues at my best in the regressions below.
V. REGRESSION RESULTS
V.a Missed School Days and Grade Failure
In this section I present estimates for the first stage equation (2). The objective is to estimate the gap in
grade failure at 26 missed school days due to the operation of the rule. To do so I need to estimate the
actual and counterfactual failure rate at 26 missed school days. The counterfactual failure rate is by
definition not observable since those at 26 missed school days are subject to the rule. Following Card
and Lee's (2004) suggestion in the context of regression discontinuity when the support for the
treatment variable is discrete, I estimate this counterfactual failure rate at 26 days by extrapolating the
estimated failure rate below 26 missed school days. I measure the effect of the rule on failure rate as the

26
estimated difference between the actual failure rate and this counterfactual failure rate. In practice, in
the regressions I model f(D), the continuous function in the number of missed school days, as a
parametric spline and I allow both the shape and the intercept of this spline to vary between
observations with less than 26 missed school days and those with 26 or more missed school days.
In this and the following regressions I restrict to those with 1 to 35 missed school days. I also
pool observations for 1996 and 1997 and treat individuals who appear in the sample more than once as
two separate observations. The estimates mix first time attendees with (potentially multiple-times)
repeaters. Ideally, one would want to be able to distinguish between first time attendees and repeaters.
Prior grade failure might affect the probability of staying on as well as pupils' and schools' behavior
and hence subsequent grade failure conditional on staying on. Unfortunately, because the data are left
censored (in 1996, or for those first observed in 1997), these is no way to ascertain for all individuals in
the sample whether they failed the year before and, in this case, how many times. In order to avoid
treating censored and uncensored observations differently, I ignore for the time being the dynamics in
grade advancement between 1996 and 1997 and I treat individuals observed in both years as two
separate observations. I will go back to the short term dynamics of grade failure later on.
In order to account for the fact that the counterfactual at 26 missed school days is estimated
based on an extrapolation and hence potentially affected by specification error, I also follow Card and
Lee's (2004) suggestion and I cluster standards errors by number of missed school days.19
Columns (1) ands (2) of Table 2 present the results of the first stage regression. Column (1)
includes no controls if not the splines in missed school days. Here I constraint this spline to be a second
order polynomial in the number of missed school days. The jump in the failure rate at the discontinuity
point is estimated to be 38 percentage points. Column (2) includes additional controls. If sorting around 19 Because some observations refer to the same individuals, I should account for this in computing the standard errors. To check for this I have rerun regressions in Tables 2 and 3 only on individuals who are observed for the first time in the sample (76,904 observations) again clustering the standard errors by number of missed school days. Point estimates are very similar and standard errors are generally lower than those reported in Tables 2 and 3, suggesting that the estimated standard errors reported in the paper are unlikely to be severely biased.

27
the discontinuity point is a serious concern, one would expect the OLS estimate of γ1 to be affected by
the inclusion of variables that affect directly a student's school outcomes. This is a test for random
assignment around the discontinuity point (Lee (2004)). Unfortunately the data set is not very rich in
terms of covariates. I include the following controls: dummies for year of observation, grade where
failure occurred, age, sex and initial age-grade distortion (age minus grade). By including grade and
year dummies I only exploit the variation in missed school days around the discontinuity point for
individuals in the same year and grade and potentially control for the fact that grade failure and the
intensity of the rule are correlated across years and grades. By controlling for initial age-grade
distortion I attempt to condition for a pupil's past school history that might itself affect failure rates. In
doing so I implicitly assume that those with the same accumulated delay in school progression so far
(independent on when they failed a grade or even if they temporarily dropped out) should perform
similarly if not for their level of absenteeism in the current year. Finally, I include school dummies.
These wash out heterogeneity across schools in the application of the rule as well as differences in
students' socio–economic characteristics and teachers' and schools' characteristics that are common to
those in the same school. These are appropriate controls to include in the regressions if assignment to
schools is largely outside a student's control, as it appears to be the case in the Uruguayan public
system. When all controls are included the estimated effect remains virtually unchanged (37 percentage
points) suggesting that the observed covariates are unlikely to be correlated with the probability of
being on either side of the threshold and hence lending some support to the notion that sorting is
unlikely to severely affect my results. As a way to confirm visually the circumstance that the
discontinuity in missed school days is uncorrelated with the observed covariates in Figure A2 I plot
average age-grade distortion on number of missed school days. Although those with more accumulated
delay also tend to display on average higher distortion, there is no appreciable discontinuous change in
this variable between 25 and 26 missed school days.
28
As already pointed out, a better look at the data in Figure 3 shows some acceleration in the
probability of grade failure after 20 missed school days and some subsequent deceleration before
jumping to around 1 after 25 missed school days. Regressions that pool individuals with 1 to 25 missed
school days are unlikely to fit the data in the 21-25 range very well because most of the mass of the
distribution is to the left of 21 missed school days, which will tend to drive the fit of the model. This
can be clearly seen in Figure A3, top panel, in the appendix where I have superimposed to the actual
series the predicted series from column (1), Table 2. One can see that the fit of the model is far from
perfect in the range 21-25 missed school days. Because of the concavity in failure rates after 20 missed
schools, the predicted series tends to underestimate the gap in failure rates between 25 and 26 missed
school days. The potential advantage of taking all individuals in the range 1 to 25 though is that one
bases the extrapolation on observations not in the immediate neighborhood of the discontinuity point.
In this sense, the estimates are less likely to suffer from potential sorting and in particular from the
possible bunching of otherwise better performing students exactly at 25 missed school days. As an
alternative specification, in the bottom part of Table 2 I present regression results where I allow the
spline in number of missed days to further change its shape and intercept between 20 and 21 missed
school days. I do so by adding a dummy for missed school days below 21 and interacting it further with
a second order polynomial in number of missed school days. In practice the identification of the
discontinuity at 26 missed school days is only based on observations between 21 and 35 missed school
days only (although when controls are included I constraint their effect to be monotonic over the whole
range of missed school days 1 to 35). As expected from a simple inspection of Figure 3, point estimates
increase substantially. When no controls are included, the estimated gap at 26 missed school days is
0.47. The inclusion of controls in this specification makes again little difference to the results. Point
estimates in column (2) show an estimated gap of 0.45. Figure A3, bottom panel, in the appendix
shows that this model fits the data remarkably well and illustrates that the estimated gap is higher when
29
a separate spline is used for the observations in the range 21-25 because of the concavity in the failure
rates over that range.
In the Appendix I present results that are based on different parametric assumption about the
shape of f( ). In particular I use parametric splines of first and third order. Estimates in Table A1 show
that the results are different when a linear spline over the range 1-25 missed school days is used. In
particular the regression tends to lead to a larger estimated effect of the rule on failure rates (0.50).
When a spline only in the range 21-25 is used the estimate is in line with the one in Table 2 (0.37).
Regressions based on a cubic spline lead to opposite results. When a linear spline is used the point
estimates is lower than in Table 2 (0.31) while the reverse happens when a separate spline is used in the
range 21-25 (0.43).
In sum, point estimates of the gap in failure rates at 26 missed school days appear to be
somewhat sensitive to whether one uses observations between 1 and 25 missed school days or only
observations between 21 and 25 missed school days to estimate the counterfactual failure rate at 26
missed school days in the absence of the rule. The estimated impact of the rule on failure rate ranges
from 0.31 to 0.50. In any event, results are always positive and strongly significant.
V.b Grade Failure and Final School Outcomes
I now move on to estimating the effect of grade failure on the number of additional grades attended
using the IV strategy proposed above. As in Figure 4, this variable is artificially adjusted to account for
differential censoring between failers and non failers. Column (3) Table 2 presents point estimates of
the reduced form equation where the dependent variable is regressed on the discontinuity at 26 missed
school days without any additional controls if not for a second order spline in missed school days
interacted with the dummy for missed school days greater than 25. The reduced form in column (3)
shows that the estimated gap in additional grades attended at 26 missed school days in Ciclo Básico is -
0.16. This suggests that on average those with 26 or more missed school days in Ciclo Básico end up

30
with about a sixth of a year less in educational attainment than those with less than 26 missed school
days. Because the failure rate is estimated to increase at the discontinuity point by about 38 percentage
points (column (1)), the implied effect of failing a grade in Ciclo Básico on the number of additional
grades attended is about -0.42 (=-0.16/0.38), i.e. slightly less than half a grade less in educational
attainment. This IV coefficient is shown in column (5).
Columns (4) and (6) present reduced form and IV estimates with the inclusion of controls. As
before, I include dummies for year of observation, grade where failure occurred, age, sex, initial age-
grade distortion (age minus grade) and school dummies. The inclusion of some of these controls might
account for potential biases in the IV estimates and provide an indication that the random assignment
hypothesis is violated in my data. First, as before, I include grade and year dummies potentially
controlling for the fact that grade failure and subsequent school outcomes might be correlated across
years and grades for reasons other than the rule. The inclusion of these dummies also controls for the
potential bias in the IV estimates that is generated by the fact that observations referring to individuals
in different grades and years might be differently affected by censoring. As already pointed out, given
that the last year of observation is 2001, observations in the sample in the year 1997 can only at most
accumulate 4 more grades as opposed to those in 1996 who can accumulate up to 5 more school grades.
Similarly, given that the highest grade in secondary school is twelfth grade, those in seventh grade in
1996, say, can accumulate up to 5 more grades while those in ninth grade can accumulate up to 3 more
grades. To the extent that the intensity of the rule varies across grades and years, then one might end up
with a biased estimate of the effect of grade failure on the outcome variable. For example, if the rule
tends to have a stronger effect in 1996 than in 1997, one might end up overestimating the effect of
grade failure on future outcomes, because those in the sample in 1996 are mechanically more likely to
attend additional grades in secondary school.
Again, in order to account for previous grade repetition, I include controls for initial age-grade
distortion. Finally, by including school dummies I control for the fact that potential outcomes and the
31
probability of grade failure due to the promotion rule might be correlated across schools. This would be
for example the case if poor teachers' quality increases the chances of failing a grade as well as the
subsequent progression in school. When all controls are included, the reduced form estimate falls by
about 8 percentage points (from -0.16 to -0.24) and the IV estimate falls to about -0.64. If anything, the
inclusion of controls makes the estimated effect larger in absolute value suggesting some negative
selection of students around the discontinuity point (those with worse potential outcomes are more
likely to be to the left of 25 missed school days) hence suggesting that the regressions with no controls
tend to underestimate the effect of grade failure on later educational attainment.20
If one uses just the observations in the range 21-25 to extrapolate the gap in educational
attainment at 26 missed school days, the estimated coefficient for the reduced form equation more than
doubles. As column (1) in the bottom part of Table 2 shows, regressions with no controls show that the
estimated gap is around -0.38 implying that on average those with 26 missed school days accumulate
less than a year in education compared to those with 25 missed school days. The implied IV estimate is
-0.83, suggesting that grade failers tend on average to lose just below a year relative to non-failers.
When controls are included the IV estimates shows again a negative and significant effect of grade
failure on extra education acquired. The point estimate is around -0.91, around 8 percentage points less
than the corresponding IV estimate with no controls. In any case, point estimates are not statistically
different from each other. Figure A4 plots that actual and estimated reduced form equations based
respectively on a single quadratic spline between 1 and 25 missed school days and a spline between 21
and 25 missed school days. Again one can notice that the estimated gap is lower when a single spline
over the range 1-25 is used for identification compared to the case when a spline only over the range
21-25 is used. The reason for this is that the first regression ignores the apparently abnormally high (i.e.
off trend) performance of those with exactly 25 missed school days. The second regression instead fits 20 By comparison, OLS estimates of grade failure on the number of additional grades attended lead to a point estimate of -1.327 (s.e. 0.049) with no controls and -1.173 (s.e. 0.032) with controls, suggesting a negative correlation between failure and the error term in equation (1).

32
the data better but in doing so it also fully fits the series at 25 missed school days. The convexity in the
series between 21 and 25 missed school days tends to lead to higher estimates of the gap.
In the Appendix I present reduced form and IV results that are based on different parametric
assumption about the shape of f( ). Estimates in Table A1 show that not only do different specifications
affect the estimated first stage, but this is also true for the reduced form equation and hence the IV
estimates. However, differences in specifications appear to lead to similar proportional differences in
the estimated coefficients of the reduced form and first stage equations, so that the implied IV estimates
do not differ greatly from those in Table 2. Estimates with a linear spline and the full set of controls
lead to an estimated IV effect of between -0.67 and -0.87. Estimates with a cubic spline lead to an
estimated IV coefficient of between -0.75 to -0.81.
Table 2 pools all individuals from different grades together. One might wonder if the effect of
grade failure on later educational attainment varies depending on the grade where failure occurs. Table
3 hence investigates the effect of the rule and the consequences of grade failure separately by grade. In
order to save space, I only present regressions with controls since I have already shown that these tend
to make little difference to my results. The left hand side of the table uses a common spline over the
support 1-25 missed school days while the right hand side uses two separate splines for observations in
the range 1-20 and 21-25. The effect of the rule appears to be stronger in eighth grade (where repetition
is lower) than in seventh or ninth grade. Results are again sensitive to whether one uses all the
observations in the range 1-25 to extrapolate the value at point 26 or only observations in the range 21-
25. When one moves to the instrumental variable estimates it appears that the effect of grade failure is
negative at each grade, although this is smaller for those who fail in eighth grade. It appears that failing
at the beginning or at the end of Ciclo Básico tends to have a relatively stronger effect. IV estimates
imply between 0.71 and 1 less additional grades attended for failure in seventh grade, depending on
which specification one uses for the spline. Failure in ninth grade appears to lead to a loss of between
0.65 and 1.1 years again depending on the specification used. For those who fail in eighth grade the
33
associated penalty is between 0.32 and 0.65 but coefficients cannot be told apart from zero at
conventional levels when a single spline for observations in the range 1-25 is used.
In sum, the data lead to an estimated effect of failure rate in Ciclo Básico on the number of
additional grades attended that range from -0.42 to -0.91, i.e. in between approximately half and one
less grade attended. The inclusion of controls tends in general to lead to larger estimates (in absolute
value). So does the inference based on observations only in the range 21-35 missed school days
compared to those in the range 1-35. If one truly believes that using the whole support in the range 1-25
is an adequate way of controlling for endogenous sorting, what the result suggests is that possibly
endogenous sorting around the discontinuity point leads to overestimating the negative impact of grade
failure on later school outcomes, consistent with positive sorting (otherwise better performing students
being more likely to locate below 26 missed school days). Results based on the addition of observables
though seem to imply the opposite, since their inclusion tends to lead to larger estimates in absolute
value. The most plausible explanation is that on average there is some negative sorting around the
discontinuity, with otherwise worse (better) performing students locating to the left (right) of 26 missed
school days. At the same time, however, there is a disproportionate clustering of individuals with better
latent outcomes exactly at 25 missed school days. It is reassuring though that whatever the point
estimates is, the estimated effect is consistently negative and statistically significant at conventional
levels.
V.c Short Term Dynamics
Having ascertained that grade failure has a negative impact on the additional years of school attended, I
now investigate the dynamics of this process. Nothing so far allows us to understand why failers appear
to lag behind non failers. Is this due to drop out or subsequent grade failure? And if drop out
contributes to explain this result, where does this precisely occurs? Is it drop out just following grade
failure or do instead grade failers tend to drop out of the system at a higher rate than non failers even
34
after a certain number of years? If it is later failure to explain these results, is this due to repeaters
tending to exercise less effort, possibly because of the disenfranchisement or stigma associated to their
condition or is it that schools tend to discriminate against these students? Or is instead the case that
lower educational attainment four to five years down the line among those who failed in Ciclo Básico
is due to neither these students failing nor dropping out more but to the circumstance that grade failers
are more likely to temporarily exit the system and then renter, so that the estimated gap in educational
attainment masks a higher probability of intermittent attendance (and hence more censoring) among
non failers?
In Table 4 I start by analyzing the dynamics of grade failure year by year. Similarly to columns
(2), (4) and (6) of Table 2, all the regression in the table include the whole set of controls (age, sex,
initial age-grade distortion and school dummies). I again model the effect of missed school days as a
second order spline that is allowed to change its shape and intercept to the left and the right of 26
missed school days. Results with a different spline for those just between 21 and 25 missed school days
are reported in Table A2 in the appendix.
Columns (1) to (5) show the survival probability at time t+1 (t=0, 4). The coefficient in the table
is the effect of grade failure in Ciclo Básico (t=0) instrumented by the discontinuity at 26 missed school
days. One can see that grade failure is followed by high drop out rates. Grade failers are on average 25
percentage points less likely to be in school after one year compared to non-failers. Over time, as non
failers drop out or end their school cycle, the two distributions tend to converge, although even after 4
to 5 years failers have not completely caught up with non failers. Although the results at time 5 appear
generally not in line with the pre-trends, some caution must be used in making inference based on these
data because these only refer to around half of the sample (those observed in 1996).
Column (6) reports the overall duration in the sample. This as said is a variable that ranges from
0 to 4 (for those observed in 1997) or 5 (for those observed in 1996). If there was no intermittent

35
attendance, this variable would be the sum of the coefficients in columns (1)-(5). On average failers
spend about 0.8 less years in the sample than non failers.
As an additional outcome variable I analyze the effect of grade failure on intermittent
attendance. I am particularly interested in checking if those who drop out following grade failure re-
enter the system at any later time, i.e. if drop out is just a temporary phenomenon. This variable mixes
true intermittent attendance with the fact that some schools not observed at the beginning of the period
(1996-1997) are included in the sample in 1998 or 2000. In column (7) I report the probability of being
in the sample after between 2 and 5 periods after failure conditional on not being in the sample 1 year
after. The data show evidence of failers being less likely to attend intermittently than non failers. The
estimated effect is about -7 percentage points implying that drop out is a more permanent phenomenon
for failers than non failers.
The subsequent rows of the table report separate estimates by grade where failure occurred.
Similar to the results on educational attainment, I find a less pronounced effect of early grade failure on
later educational outcomes for those who failed in eighth grade compared to those who failed in
seventh or ninth grade. Point estimates suggest a shorter stay among failers compared to non failers in
the order of 0.35 to 0.94 years depending on whether failure occurred in eighth or seventh grade.
Results based on a spline for observations in the range 21-25 in Table A2 show qualitatively similar
results. If anything, the estimated impact of failure on survival, duration and intermittent attendance is
larger, consistent with a similarly larger estimated negative effects on maximum grade attended.
Having ascertained that failure rates tend to affect negatively the probability of being in school
in any subsequent year, overall duration and intermittent attendance, I now study school progression of
those who originally failed compared to those who did not. Because individuals can accumulate some
delay later in school, a simple inspection of the data in columns (1) to (6) does not provide a clear
indication of the school progression of failers versus non failers year by year. The following columns
of the table report information on the number of additional grades achieved by failers and non failers,

36
whether still in school or not, at any time t (=1,.., 5). Because, as said, attendance is measured in term
of highest grade attended (rather than successfully completed), it does not make any difference to the
result for the first period if failers drop out or not following grade failure. In either case their maximum
grade attended will be the one they failed. Some non failers though can also drop out so the difference
in maximum grade attended the year after grade failure will be strictly less than one. As expected,
grade failers have just below one year gap compared to the non failers at time t=1 consistent with
positive but low drop out rates among non failers. Rather interestingly, after two years failers partially
catch up with non failers. The estimated gap is -0.64. This implies that the proportion of those passing
the grade at time t=1 and staying on between time t=1 and t=2 (and ignoring re-entry) is greater for
those who failed at time t=0 compared to those who did not. After time 2 the differences between
failers and non failers widens up again. This is possibly the result of differential drop out rates or
possibly the effect of further grade failure among those who originally failed at time t=0. The data are
unable to provide an answer to this (expect in the very short run as I discuss below). After 5 years, the
difference in maximum grades attended is -0.79. This is close to, but as expected lower than, the effect
on the censored distribution reported in Table 2 (-0.64). Compared to the estimated effect of grade
failure in Ciclo Básico on duration (column (6)), the data illustrate the differential school progression
between the two groups, as measured by the difference in the additional years spent in school and the
additional grades attended, i.e. the accumulated delay in school, remains unchanged by the end of the
period compared to the year just following grade failure.
Data across grades again illustrate a weaker effect for those in eighth grade who also appear
more likely than those failing seventh or ninth grade to later catch up with non failers. Trends for those
in seventh or ninth grade are rather similar. Results based on a spline between 21-25 missed school
days and reported again in Table A2 in the appendix lead to very similar conclusions.
In sum, the data show an early disadvantage for grade failers in terms of grades attended whom
they hardly ever make up for. There appears to be some initial catching up between failers and non

37
failers but this is a rather transient phenomenon largely limited to the first period following grade
failure after which differentials widen up again. Intermittent attendance is unlikely to give reason of
this result. These results hold particularly true for those in seventh or ninth grade. As already noticed
above, at the end of the period of observation the proportion of non failers is much larger than the
proportion of failers, implying that observations on failers are at much higher risk of being right
censored. In turn this suggests that the results in Table 2 are likely to underestimate – and potentially
rather severely - the magnitude of the (negative) effect of grade failure on school outcomes.
One limitation of the data, as said, is information on grade failure in 1999 and 2001 is missing,
hence I am unable to say whether in any given year following time 0 failers face a different risk of
repetition than non failers. In this sense the data do not allow us to investigate what role later failure
and later drop out separately play in explaining these trends. In the next section I will try to shed some
light on these different channels for the year just following grade failure.
V.d Repeaters
In order to try to shed some light on the subsequent failure rate of early failers and passers in this
section I compare the outcomes of early failers who stay on (i.e. repeat a grade) to those who pass. By
looking at those who repeat one can check whether it is simply initial drop out among grade failers to
give reason of their differential outcomes or whether the effects of grade failure are long-lasting. While
the estimates in the previous sections can be interpreted as 'intention to treat' estimates of the effect of
grade repetition, estimates in this section refer to the 'effect of treatment on the treated'.
As already shown though, there is large non compliance among non failers since a large
proportion tends to drop out just following grade failure. Since, among failers, stayers are likely to be
selected in such a way to have higher chances of acquiring extra education, there are probably good
reasons to believe that (ignoring general equilibrium effects or externalities of some kind) the school

38
outcomes of repeaters only provide a lower bound estimate for the effect of grade repetition on the
population of failers at large, i.e. had all failers stayed on.21
Table 5 presents regression results for the sub-population of repeaters and compares it to the
population of non failers who stay on the following year. Again regression results based on a spline for
observations only in the range 21-25 are presented in the appendix, Table A3.
Column (1) presents the first stage estimates for this subpopulation. Compared to the estimates
in Table 2, estimates among the compliers show in general a larger effect of the rule on grade failure. If
repeaters are those with higher latent outcomes among the population of failers what this possibly
suggests is that enforcement of the rule is stricter among those with better latent outcomes. Possibly
this is due to the circumstance that schools tends to apply this rule with less vigor to those with prior
accumulated delay.
In column (2) I present the effect of grade repetition on the probability of dropping out of
school between time t=1 and time t=0 (i.e. one minus the hazard rate). It is remarkable that repeaters
tend to be at higher risk of drop out compared to non repeaters even the year following grade repetition,
suggesting long lasting (at least two periods) effects of grade failure. Column (3) investigates the effect
of grade failure on the probability of changing school. One might speculate that one way by which
students tend to undo the negative effect of grade failure is by changing institution. This might be due
to their selective choice of less demanding schools or to the fact that grade failure is symptomatic of the
bad quality of the match between the student and the school. In principle school changes within the
public system are not easy. Consistent with this one finds no effect of grade failure on school change,
although, as shown below, there is substantial heterogeneity across grades.
21 Indeed a regression of missed school days at time t0 on a dummy for drop out, a dummy for missed school days larger than 25 and the interaction of the two (plus controls as above) leads to a coefficient on the interaction term of 2.178 (s.e. 0.502) suggesting that failers with relatively more missed school days are more likely to drop out than passers with relatively more school days.

39
In columns (4) and (5) I present the effect of grade repetition on duration and maximum grade
achieved (censored to 2000 for non repeaters). It is interesting to notice that the negative effect of grade
failure remains negative and strong even among those who repeat a grade. Point estimates imply that
repeaters accumulate 0.62 less grades and stay in the sample on average 0.42 less years. These figures
are slightly lower than those found for the population of failers at large, consistent with a positive
selection of repeaters among the population of failers (plus the mechanic effect of repeaters staying on
one extra year). In any case, repetition does not appear to improve school outcomes. Column (6)
investigates the short term dynamics of grade failure. In particular it asks whether there is any state
dependence or unobserved heterogeneity that generate a correlation between grade failure across
subsequent years, so that repeaters tend systematically to fail more or less than non repeaters. Although
the data do not allow us to investigate grade failure in any subsequent year (due to missing data in 1999
and 2001) one can still look at failure rates one year after grade failure (in 1997 for those who failed in
1996 and in 1998 for those who failed in 1997).
In principle, the effect of grade repetition on students' failure later in life might go in a number
of directions. On the one hand, as already hinted at in the introduction, students might react to early
grade failure by exerting more effort or repetition might improve their attainment. However, the
opposite might be true due potentially to stigma or disenfranchisement. As said, schools on their part
might take into account early grade repetition in deciding whether a student has to fail an additional
grade or not. Schools might either reinforce this effect by making early repeaters repeat more (again if
stigma is a relevant factor in the school's decision for example) or they might be indulgent towards
early repeaters if they feel that early repetition would harm them or make them little good. Schools
might also discriminate in favor of early repeaters if they have an incentive not to retain failers too long
in the system, putting the school resources under strain. The data illustrate a very strong negative effect
of repetition on subsequent grade failure. Estimates in column (6) suggest that repeaters are around 36
percentage points less likely to fail again than non repeaters. A simple way of checking whether this is

40
due to differential treatment on the part of schools or instead changes in students' behavior consists in
running the same regression as in column (6) with the addition of current (i.e. time 1) number of missed
school days. I do so by including in the model a quadratic spline in number of missed days at time t=1,
a dummy for 26 or more missed school days and interactions of the two. Column (7) shows that
conditioning for missed school days at time t=1 the negative effect of repetition on failure rates later in
school tends to fall by about two thirds. Conditional on absenteeism at time t=1, repeaters are still less
likely to fail a grade than non repeaters but this effect is now estimated to be in the order of 14
percentage points. Column (8) clearly illustrates why this correlation tends to become weaker. Here I
regress number of missed school days at time t=1 on the discontinuity at time t=0. It is remarkable that
at time t=1 repeaters tend on average to miss 24 less days of school than non repeaters. What this
suggests is that a factor largely explaining why repeaters tend to be less at risk of failing the same grade
is that they exert more effort than non repeaters. This is consistent with the idea that (among the
selected sample of failers who stay on) grade repetition acts a discipline device.
Differences across grades show in general rather consistent patterns with those mentioned
above. One finds again a weaker effect of repetition in eighth grade. It is perhaps worth mentioning that
the negative effect of grade failure on the probability of being in the sample two years after grade
failure conditional on having repeated is particularly low for those repeating ninth grade. This would
suggest that those who repeat ninth grade tend to drop out of non vocational public schools after they
have completed Ciclo Básico. Rather interestingly the data also reveal some heterogeneity in the
probability of changing school following grade failure across grades. Although I find no effect in
seventh grade, the effect is positive in eighth grade and negative in ninth grade. This might be a
suggestion that failers in the second year of Ciclo Básico use selective choice of school as a way to
absorb part of the negative effect of grade failure. That might explain why the effect of grade failure is
less pronounced for these individuals although one might wonder why the same does not happen
among those failing seventh grade. As for those in ninth grade, the negative result is due most likely to
41
the circumstance that those ending Ciclo Básico change institution once they register in the first year of
upper Secondary education (tenth grade) while repeaters will have to wait a year before possibly doing
so.
Results with a spline for the observations in the range 21-25 in Table A3 lead to similar
conclusions. Rather interestingly, regressions in column (7) where grade failure at time t=1 is regressed
on grade repetition plus controls for missed school days at time t=1 show that grade failure at time t=1
is completely (rather than by about two thirds) explained by students' behavioral changes. According to
these estimates it appears that the lower risk of subsequent failure among early failers is exclusively
due to these students' increased effort.
To wrap up, the results in this section illustrate that the negative effects of grade failure extend
also to those (arguably positively selected) individuals who decide to stay on and repeat a grade. Grade
repetition does not lead to improvements in outcomes. Rather, the opposite is true. The results in Table
5 also shed some light on the catching up between grade failers and non failers in the year just after
grade failure occurs. Repeaters are less likely to fail again than non repeaters and this to a large extent
appears the result of repeaters exerting more effort in an attempt to pass. As said, though, this initial
partial reduction of the gap is undone in later years.
V.e Estimates Away from the Discontinuity Point
In this section I propose an alternative identification strategy based on differences in differences. As
already hinted at above, the rule governing grade promotion changed somewhat in 1998. Although the
basic principles of the system were left unchanged, at the beginning of the school year a new directive
was issued by the central school authorities that allowed discretion on the part of schools in passing
students with more than 20 missed school days independent of the number of missed school days over

42
that limit (and provided again they had no more than three pending subjects)22. Differently from the
rule in force in 1996 and 1997, hence, failure was not automatic for those above 25 missed school days.
This change in the discipline happened in a period of repeated attempts on the part of the central
authorities to reform grade promotion rules. In particular, an early project circulated to schools in 1997
was later abrogated by the directive in question.23 This created a climate of insecurity among teachers
and students regarding the rules that would have eventually governed grade promotion at the end of the
school year 1998, since the possibility of other directives was not to be ruled out. A simple inspection
of the data illustrates what effect this reform had on promotion. In Figure A5 in the appendix I plot the
average failure rate by number of missed school days (1-35) in 1998. Two observations are in order.
First, as in the previous years, failure increases with the number of missed school days and shows a
discontinuous jump between 25 and 26 missed school days (from 46% to 71%). However, consistent
with the new discipline, failure rates at 26 missed school days are sensibly below 100% and tend to
increase afterwards, suggesting that some (but not all) schools abandoned the practice of failing
children above 25 missed school days in 1998 or that schools were on average less strict in the
application of the (old) rule. Anecdotic evidence from that period suggests a great amount of inertia on
the part of schools in adopting the new discipline. Perhaps more interesting is the observation that the
distributions of missed school days appears similar in 1996-1997 and in 1998. This can be seen in
Figure A6 in the appendix where I plot the frequency distribution of missed school days in 1998 vis à
vis the distribution in 1996/1997 (conditonal on the number of missed school days being between 1 and
35). A visual inspection of the Figure shows that the shape of the two distributions is very similar.24
Taking together the evidence in Figures A5 and A6, it appears that while the incentives linked to the
22 This is directive ANEP, 2320/98, April 21 1998. 23 This is ANEP, Acta 70 Res. 96, 1997. 24 As a more formal check, I have run a multinomial logit regression of number of missed school days (between 1 and 35) between 1996 and 1998 on a dummy for 1998. A Chi-2 test that the year 1998 dummies are jointly different from zero leads to a rejection of the null (chi2 (34)=138.44). This should be no surprise since given the very large sample size (176,453 observations).
43
rule in force in 1996/1997 remained largely in place in 1998, the rules governing grade promotion did
not. Most likely the climate of insecurity around the discipline in force pushed students to act
conservatively, for fear that the old discipline might eventually be reinstated. If the students' incentives
associated to the rule operated similarly in 1998 and before that but the effect of missed school days on
repetition changed over time, then one can use the differential time-variation in failure rates across
individuals with different missed school days to infer the effect of grade failure on school outcomes net
of sorting. This is a simple differences (across time) in differences (across number of missed school
days) estimator of the effect of grade failure on school outcomes. The advantage of this estimator with
respect to the one based on the discontinuity at 25 missed school days is that, to the extent that sorting
around the discontinuity point is a source of concern and provided that sorting is similar across years,
by differentiating across individuals with the same number of missed school days in different years one
should be able to control for this source of unobserved heterogeneity. If the two estimation strategies
lead to similar results, this is suggestive of sorting being unlikely to be a major problem in the
estimates above.
Before presenting the regression results, it is useful to show graphically the effect of this regime
change on students' outcomes. In Figure 7 I plot the time difference between 1998 and 1996/97 in the
failure rate at any level of missed school days (between 1 and 35). I standardize this series to its value
at 20 missed school days. This is essentially the (standardized) difference between the series plotted in
Figure A5 and in Figure 3. One can see a modest fall in the difference up to 25 missed school days, a
negative jump between 25 and 26 missed school days and then some convergence. This is consistent
with much less stringency in the application of the 25 missed school days rule in 1998. I have
superimposed to this series the difference between the subsequent school outcomes of those observed
in 1998 and those observed in 1996/97. To make these outcomes comparable across years, I have
computed the number of additional grades attended after three years since the time the individual is
observed failing a grade (the maximum time lag for those observed in 1998). As above, I have
44
artificially censored this variable for non-failers by computing the number of additional grades attended
after 2 years for these individuals. Again, in the Figure, I have standardized this series to its value at 20
missed school days. It is remarkable that these two series appear almost like the mirror image of one
another. It is noticeable in particular that the reduction in failure rates at 26 missed school days that
happened in 1998 relative to the previous years translates into a significantly higher number of grades
attended for these students, suggesting again a negative effect of failure rate on later outcomes. Notice
that this negative correlation appears to hold elsewhere along the distribution of missed school days.
To formalize the evidence in Figure 7, in Table 6 I report the results of an IV regression of the
number of additional grades attended after 3 years (2 years for non failers) on the probability of failing
a grade instrumented by the interaction of number of missed school days with a dummy for 1998.
Regressions control for dummies for missed school days and for year dummies. As before, I report
regressions without and with additional controls. Standard errors are again clustered by number of
missed school days. The top part of the table refers to regressions on all observations with 1-35 missed
school days while the bottom part refers to observations with missed school days in the range 21-35. It
is remarkable that the estimated coefficients are very similar to the ones in Table 2. Point estimates
imply that grade failure is associated to between 0.58 and 0.96 less years of education. Results are
robust to the sample used. The inclusion of additional controls makes some difference to the results
when the entire sample is used, leading to smaller estimates of the negative effect of grade failure on
subsequent school outcomes.25 Although one might be concerned about this, differences in the
estimated coefficient on the restricted sample (those with 21-35 missed school days) are virtually
unchanged, suggesting little correlation between observed pupils' and schools' characteristics and the
instrument.
25 Since, as said, age is missing in 1998 and hence for individuals first observed in this school year, in this regression I add a dummy for missing age and missing grade-age distortion.
45
In sum, results based on differences in differences that exploit the regime change in the
discipline governing grade failure between 1996/97 and 1998 lead to very similar conclusions on the
effect of grade failure on subsequent school outcomes. This can be taken as corroborating evidence of
the results in the previous sections, suggesting that students' non-random sorting around the
discontinuity point is unlikely to be a major source of bias.
V.f Falsification Exercise
As an additional and final check for my estimates above, in this section I exploit the incentives created
by the promotion rules in force in 1996/1997 for individuals to cluster at 20 missed school days (i.e.
away from the discontinuity point). Recall from the previous discussion that promotion is automatic for
students with no more than three pending subjects provided they have no more than 20 missed school
days. Students hence will have an incentive not to cross this threshold. This is confirmed by the data
(Figure 3).The circumstance that the distribution of the running variable number of missed school days
appears discontinuous not only at 26 missed school days (where repetition is also discontinuous) but
also at 21 missed school days (where there is no apparent discontinuity in promotion) is rather helpful
for the purposes of my estimation.
As already discussed, the discontinuity in the distribution of the variables missed school days at
26 is potentially invalidating the consistency of the regression discontinuity estimates. In particular, if
non-random sorting is such that individuals with better (worse) latent outcomes locate systematically
below (above) the 26 missed school days threshold, this implies that the figures in Tables 2 to 5 tend to
overestimate its impact of failure on later students' outcomes. However, if students tend to non-
randomly sort around the 26 missed school days threshold – either because of their differential ability
or because of differential treatment on the part of schools of teachers - one would expect a similar
behavior around the 21 missed school days. Because there is apparently no discontinuity in promotion
at the 21 days threshold, one can check whether actual outcomes vary discontinuously around that
46
threshold. In particular if later outcomes worsen as a student crosses this threshold, this would suggest
that students to the right and to the left of this threshold are systematically different for reasons other
than failure rate and one should hence be very cautious in interpreting the results above as the
(negative) effect of failure on later outcomes. In practice, this is a test for the exclusion restriction
underlying the consistency of the instrumental variable estimates above. Already, a visual inspection of
Figures 4 and 5 illustrates that this is unlikely to be a major problem, since there is no apparent fall in
the outcome variables at the 21 days threshold.
This is confirmed in Table 7 where I present the estimated coefficient of regressions of grade
failure (first stage estimates) and additional grades attended (reduced form estimates) on a dummy for
21 or more missed school days. All regressions refer to observations in the range 1-35 missed school
days and again refer to the school years 1996 and 1997. These coefficients come from the regression
reported in the bottom part of Table 2 where I allow both the shape and the intercept of the outcome
variable to vary both between 20 and 21 missed school days and between 25 and 26 missed school
days. Again standard errors are clustered by number of missed school days. I report regressions without
and with controls. When no controls are included, there is evidence of a slight discontinuity in failure
rates at 21 missed school days. The point estimate is 0.03 but the estimates are insignificant at
conventional levels. When controls are included the estimate falls to about 0.002. Essentially the
regression results show no evidence of a discontinuity in failure rates between 20 and 21 missed school
days. The reduced form estimates show instead some discontinuity in the variable additional grades
attended. When no controls are included the point estimates imply that those to the right of 21 missed
school days gain on average a third of a school year relative to those to the left of this point (estimate is
0.32, and statistically significant at conventional levels). The point estimate falls to 0.19 and is again
significant when all the controls are included. In sum, the data show some discontinuity in the outcome
variable. This is such though to suggest that those at or to the right of 21 missed school days - if
anything- perform better than those to its left. Potentially this might be the result of schools or teachers

47
manipulating the records of missed school days in such a way to compensate underperformers or failers
who stay on exerting more effort or being temporarily strengthened by grade repetition. If one is
willing to extrapolate these results to those around the 26 missed school days threshold, this suggests
that the point estimates above – if anything – tend to underestimate the negative effect of grade failure
on later outcomes. So the estimates above have to be taken as conservative estimates.
VI. CONCLUSIONS
School systems in many developing countries are characterized by remarkably high failure and drop
out rates and overall low school attainment. Uruguay is no exception to this: repetition rates in public
schools in the compulsory school cycle (grades 1-9) are in the order of 20-25% and about a fourth of
individuals aged 25-29 fail to have completed compulsory education.
This paper uses administrative micro data on around 100,000 students in Junior High school
(grades 7 to 9) in Uruguay between 1996 and 1997 to assess the causal impact of grade failure on drop
out and later school outcomes. Exploiting the discontinuity in promotion induced by a rule that
establishes that a pupil missing more than 25 days during the school year will automatically fail that
grade I show that grade failure leads to between two thirds and one year less additional school grades
attended by the year 2001. Results are robust to different specifications for the counterfactual school
outcomes in the absence of grade failure.
A large part of the disadvantage for grade failers manifests through immediate drop out:
compared to non failers, failers are at disproportionate risk of abandoning school the year when failure
occurs. However, even among those who stay on (and hence repeat the grade they failed) the effects of
grade failure appear long lasting. In the short term repeaters tend to partially make up for the missed
grade. This is in great part due to repeaters exerting more effort (in terms of lower absenteeism)
compared to non failers. This initial advantage however is lost after two years: ultimately, even among
the presumably positive selected sample of grade failers who stay on, outcomes appear worse than

48
otherwise identical individuals who did not fail in Junior high school. Intermittent attendance is
unlikely to give reason of this result. If anything, non failers are more likely than failers to leave
temporarily the system and then re-enter.
A major concern regarding my conclusion is that the variable whose discontinuous relationship
with failure rates I use in order to identify the causal effect of grade failure on subsequent school
outcomes, namely missed school days, is largely under the students' control (as well as possibly under
the schools' control if school records can be manipulated). To the extent that students sort around the
discontinuity point in a fashion that is correlated with their latent outcomes (i.e. the ones that would be
observed in the absence of grade failure), and in particular if otherwise better (worse) performing
students end up locating below (above) the 26 missed school days threshold, one might be concerned
that my estimates pick up unobservable differences in students' characteristics on either side of the
threshold rather than the genuine effect of this policy. Evidence from the distribution of missed school
days shows a clear clustering of individuals at 25 missed school days. Although this is consistent with
the incentives of the promotion rule and not necessarily a sign of the continuity assumption in the
distribution of unobservable characteristics required for consistency of the regression discontinuity
estimator being violated, there are good reasons to be concerned about this feature of the data
(McCrary (2005)). In order to try to deal with this potential source of inconsistency of the regression
estimates, I propose a number of empirical strategies. First, I include in the regressions a number of
observable controls. To the extent that individuals with different latent outcomes are able to
systematically sort on either side of the discontinuity point, one would expect a discontinuity in
students' observable characteristics at 26 missed school days (Lee (2004)). Second, I use observations
not in the immediate neighborhood of the discontinuity point. In this way I hope to net out the bias in
the estimates due to otherwise better performing students exactly locating at 25 missed school days.
Third, I use a similar discontinuity in students' incentives to cluster at 20 (in addition to 25) missed
school days implicit in the rules governing grade promotion. Because the failure rate shows no
49
discontinuity between 20 and 21 missed school days, one can use this feature of the data to test for the
exclusion restriction underlying the consistency of the IV estimates. Last, I use a regime change that
took place during the school year 1998 to derive estimates away from the discontinuity point. During
this school year, students with more than 25 missed days could pass at the discretion of the school. I
use this regime change to derive a difference (across years, 1998 and 1996/1997) in difference (across
individuals with different numbers of missed school days) estimate of the effect of grade failure on
subsequent school outcomes.
Although my empirical estimates are somewhat sensitive to these different identification
strategies, a single response emerges, namely that the effect of grade failure on school outcomes
remains consistently negative and of reasonably similar magnitude. Generally speaking – and with the
exception of results based on observations not in the immediate neighborhood of the discontinuity point
– these checks suggest, if anything, negative sorting around the discontinuity point, with otherwise
worse performing students being more likely to locate below the threshold, and hence being less likely
to fail a grade. This would in turn suggest that the effect of failure on subsequent school outcomes is
conservatively estimated. One possible explanation for this finding is that schools or teachers tend to be
more lenient towards otherwise weaker students, due either to the recognition that these students might
benefit less from grade failure, to teachers' self interest or compassion. Another explanation is that in
the short run repeaters tend to exert more effort or they benefit from repetition in terms of increased
attainment so that repetition is unlikely to occur more than once.
One major limitation of the data at hand is that these refer only to individuals within the public
non vocational system. To the extent that grade failers are disproportionately at risk of migrating to
private or vocational schools, I might be exaggerating the negative effect of this policy on later school
outcomes. Although there is no direct way of checking this with my data, complementary evidence
from a phone survey quoted in ANEP (2000) suggests that the majority of school drop outs leaves the
system permanently, implying that movements to schools outside the system are unlikely to be of great

50
importance. A second limitation of the data is that these only provide information on maximum grade
attended (as opposed to maximum grade completed). Although there is no way to check this directly in
the data, it is hard to believe that results would be reverted if information on actual grade completion
were available. This would imply previous grade failers being disproportionately more likely to
complete the final grade they attended compared to non failers.
Note additionally that because non failers are at much higher risk of being in the sample by the
end of the period, this tends to underestimate the negative gap in subsequent educational attainment
between failers and non failers. This again suggests that the effects of grade failure on school outcomes
in the medium term estimated in this paper are possibly rather conservative estimates.
In sum, the data show strong negative causal effects of grade failure on a students' subsequent
school outcomes. Back of the envelope calculations show that at least about a third of early drop out
can be imputed to grade failure.26 It must be emphasized though that the paper remains agnostic on
whether overall this is a good policy from the perspective of the social planner. This would require
quantifying the private and social costs and benefits of grade failure, including possibly the deterrence
effect of such policy on students' underperformance. The evidence presented in the paper suggests that
these deterrence effects might not be negligible.
A second important qualification of my conclusions regards the external validity of the
estimates. As said, recent evidence for the US on the effect of repetition appears to suggest positive or
at least non negative effects of this policy on school attainment of primary school children, at least in
the short term (Jacob and Lefgren (2004)). There are a number of potential reasons why my results
differ from the empirical estimates for the USA, in addition to the obvious differences in the two school
systems in question. First, my analysis concentrates on students in Junior high school: the effect of
repetition might be very different for students of different ages and in different school grades. Second, 26 These are conservative estimates obtained by multiplying the average failure rate (30%) times the estimated effect of failure on the survival probability one year after (-0.25, row 1, column 1 in Table 4) and dividing it by the average hazard rate (0.26).

51
my data do not allow us to estimate the effect of repetition on attainment, since information on final
year marks or test scores is not reported. In principle I cannot rule out that attainment improves
following repetition, although the evidence that repeaters end up staying shorter in school and attending
on average less grades appears hard to reconcile with improved attainment. Indeed, not differently from
Jacob and Lefgren (2004), my estimates show improvements in performance (measured by lower
probability of repeating again) among first time repeaters. As said, though, this is largely attributable to
greater effort exerted by these students when they repeat a grade rather than presumably increased
attainment. Because my data set allows me to follow individuals over 4 to 5 years after failure
occurred, I am also able to assess the medium term effects of this policy. I show that the incentives to
exert more effort among repeaters are rapidly dissipated and the medium term effect of grade failure is
negative even among those who stay on. A final major difference between previous work and my
analysis is that by concentrating on teenagers in a developing country I am able to study directly the
effect of grade failure on immediate drop out, a phenomenon that is unlikely to happen among primary
school children in more developed countries. As shown, this margin of adjustment is of great
importance among Uruguayan teenagers and presumably similar effects are to be expected in other
developing countries.
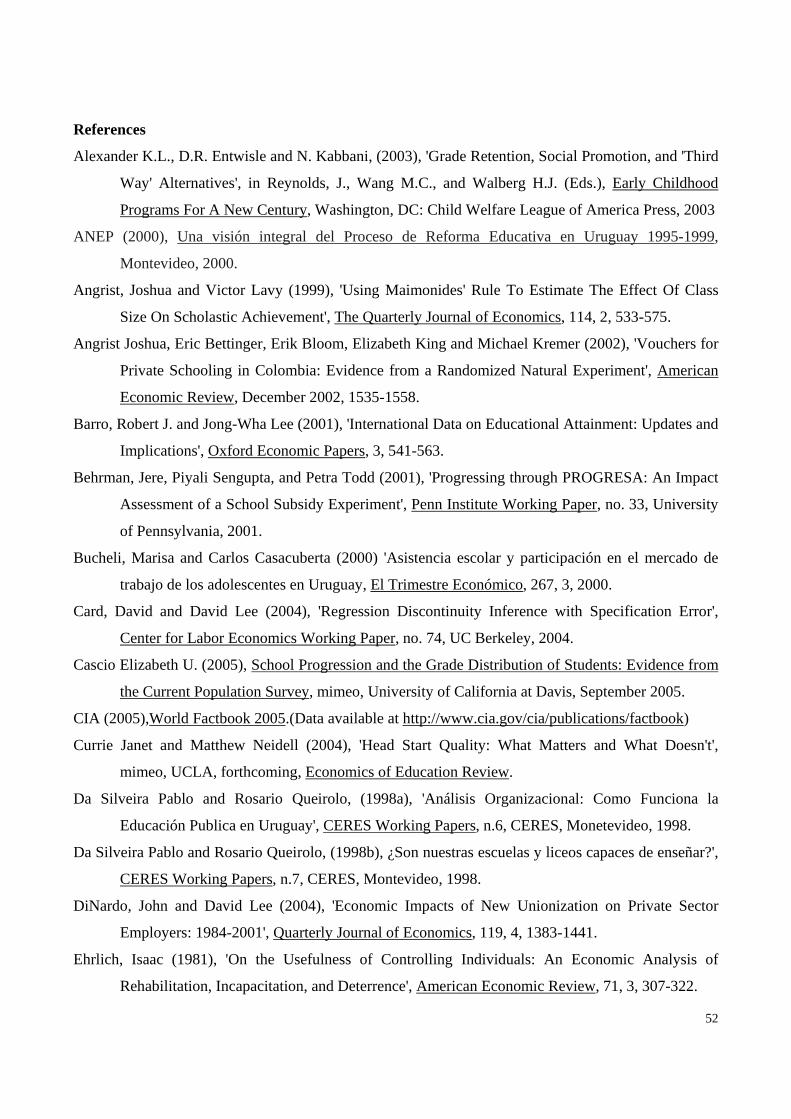
52
References
Alexander K.L., D.R. Entwisle and N. Kabbani, (2003), 'Grade Retention, Social Promotion, and 'Third
Way' Alternatives', in Reynolds, J., Wang M.C., and Walberg H.J. (Eds.), Early Childhood
Programs For A New Century, Washington, DC: Child Welfare League of America Press, 2003
ANEP (2000), Una visión integral del Proceso de Reforma Educativa en Uruguay 1995-1999,
Montevideo, 2000.
Angrist, Joshua and Victor Lavy (1999), 'Using Maimonides' Rule To Estimate The Effect Of Class
Size On Scholastic Achievement', The Quarterly Journal of Economics, 114, 2, 533-575.
Angrist Joshua, Eric Bettinger, Erik Bloom, Elizabeth King and Michael Kremer (2002), 'Vouchers for
Private Schooling in Colombia: Evidence from a Randomized Natural Experiment', American
Economic Review, December 2002, 1535-1558.
Barro, Robert J. and Jong-Wha Lee (2001), 'International Data on Educational Attainment: Updates and
Implications', Oxford Economic Papers, 3, 541-563.
Behrman, Jere, Piyali Sengupta, and Petra Todd (2001), 'Progressing through PROGRESA: An Impact
Assessment of a School Subsidy Experiment', Penn Institute Working Paper, no. 33, University
of Pennsylvania, 2001.
Bucheli, Marisa and Carlos Casacuberta (2000) 'Asistencia escolar y participación en el mercado de
trabajo de los adolescentes en Uruguay, El Trimestre Económico, 267, 3, 2000.
Card, David and David Lee (2004), 'Regression Discontinuity Inference with Specification Error',
Center for Labor Economics Working Paper, no. 74, UC Berkeley, 2004.
Cascio Elizabeth U. (2005), School Progression and the Grade Distribution of Students: Evidence from
the Current Population Survey, mimeo, University of California at Davis, September 2005.
CIA (2005),World Factbook 2005.(Data available at http://www.cia.gov/cia/publications/factbook)
Currie Janet and Matthew Neidell (2004), 'Head Start Quality: What Matters and What Doesn't',
mimeo, UCLA, forthcoming, Economics of Education Review.
Da Silveira Pablo and Rosario Queirolo, (1998a), 'Análisis Organizacional: Como Funciona la
Educación Publica en Uruguay', CERES Working Papers, n.6, CERES, Monetevideo, 1998.
Da Silveira Pablo and Rosario Queirolo, (1998b), ¿Son nuestras escuelas y liceos capaces de enseñar?',
CERES Working Papers, n.7, CERES, Montevideo, 1998.
DiNardo, John and David Lee (2004), 'Economic Impacts of New Unionization on Private Sector
Employers: 1984-2001', Quarterly Journal of Economics, 119, 4, 1383-1441.
Ehrlich, Isaac (1981), 'On the Usefulness of Controlling Individuals: An Economic Analysis of
Rehabilitation, Incapacitation, and Deterrence', American Economic Review, 71, 3, 307-322.
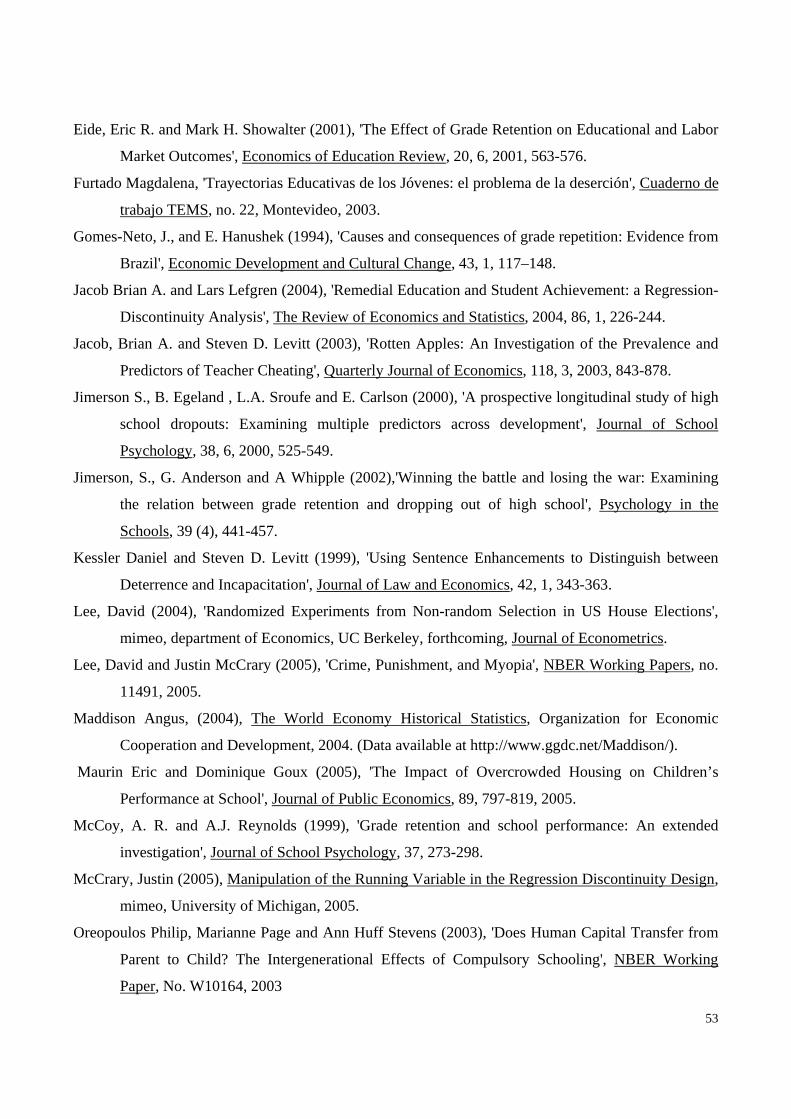
53
Eide, Eric R. and Mark H. Showalter (2001), 'The Effect of Grade Retention on Educational and Labor
Market Outcomes', Economics of Education Review, 20, 6, 2001, 563-576.
Furtado Magdalena, 'Trayectorias Educativas de los Jóvenes: el problema de la deserción', Cuaderno de
trabajo TEMS, no. 22, Montevideo, 2003.
Gomes-Neto, J., and E. Hanushek (1994), 'Causes and consequences of grade repetition: Evidence from
Brazil', Economic Development and Cultural Change, 43, 1, 117–148.
Jacob Brian A. and Lars Lefgren (2004), 'Remedial Education and Student Achievement: a Regression-
Discontinuity Analysis', The Review of Economics and Statistics, 2004, 86, 1, 226-244.
Jacob, Brian A. and Steven D. Levitt (2003), 'Rotten Apples: An Investigation of the Prevalence and
Predictors of Teacher Cheating', Quarterly Journal of Economics, 118, 3, 2003, 843-878.
Jimerson S., B. Egeland , L.A. Sroufe and E. Carlson (2000), 'A prospective longitudinal study of high
school dropouts: Examining multiple predictors across development', Journal of School
Psychology, 38, 6, 2000, 525-549.
Jimerson, S., G. Anderson and A Whipple (2002),'Winning the battle and losing the war: Examining
the relation between grade retention and dropping out of high school', Psychology in the
Schools, 39 (4), 441-457.
Kessler Daniel and Steven D. Levitt (1999), 'Using Sentence Enhancements to Distinguish between
Deterrence and Incapacitation', Journal of Law and Economics, 42, 1, 343-363.
Lee, David (2004), 'Randomized Experiments from Non-random Selection in US House Elections',
mimeo, department of Economics, UC Berkeley, forthcoming, Journal of Econometrics.
Lee, David and Justin McCrary (2005), 'Crime, Punishment, and Myopia', NBER Working Papers, no.
11491, 2005.
Maddison Angus, (2004), The World Economy Historical Statistics, Organization for Economic
Cooperation and Development, 2004. (Data available at http://www.ggdc.net/Maddison/).
Maurin Eric and Dominique Goux (2005), 'The Impact of Overcrowded Housing on Children’s
Performance at School', Journal of Public Economics, 89, 797-819, 2005.
McCoy, A. R. and A.J. Reynolds (1999), 'Grade retention and school performance: An extended
investigation', Journal of School Psychology, 37, 273-298.
McCrary, Justin (2005), Manipulation of the Running Variable in the Regression Discontinuity Design,
mimeo, University of Michigan, 2005.
Oreopoulos Philip, Marianne Page and Ann Huff Stevens (2003), 'Does Human Capital Transfer from
Parent to Child? The Intergenerational Effects of Compulsory Schooling', NBER Working
Paper, No. W10164, 2003
54
Pischke, Jorn-Steffen, (2003), 'The Impact of Length of the School Year on Student Performance and
Earnings: Evidence from the German Short School Years', NBER Working Paper, No. W9964,
2003.
Polinsky Mitchell A. and Steven M. Shavell (2000), 'The Economic Theory of Public Enforcement of
Law', Journal of Economic Literature, 45, 1, 2000, 45-76.
Schady Norbert and Maria Caridad Araujo (2005), Cash transfers, conditions, school enrollment, and
child work: Evidence from a randomized experiment in Ecuador, mimeo, The World Bank,
December 2005.
UNESCO (2002), EFA Global Monitoring Report. (Data available at: http://portal.unesco.org)
Urquiola, Miguel and Valentina Calderon (2004), Apples and oranges: Educational enrolment and
attainment across countries in Latin America and the Caribbean, mimeo, Department of
Economics, Columbia University, 2004.
Figure 1 Repetition Rates in Primary School and Gross Enrollment Rate in Secondary School
Algeria
Bahrain
Jordanw
Kuwait
Lebanon
Morocco
Saudi Arabia
Sudan
TunisiawAlbania
BelarusBulgariaCzech Republico
EstoniaHungary oPolando
Azerbaijan
Cambodia
ChinawIndonesiaw
SamoaThailandw
Argentinaw
BelizeBoliv iaChilew
Colombia
Costa Rica
Dominican Republic
Guatemala
Jamaicaw
Mexicoo
NicaraguaPanama
Paraguay w
PeruwTrinidad and Tobago
Uruguay wAustriao
Finlando
Franceo
Germany o
Irelando
Italy o
IndiawMaldiv es
Angola
Botswana
Burkina Faso
CameroonChad
Comoros
Equatorial Guinea
EthiopiaGuineaGuinea-Bissau
Lesotho
Madagascar
Malawi
0.4
.81.
21.
6E
nrol
lmen
t
0 .1 .2 .3 .4Repetition
The graph plots repetition rates in primary school on the horizontal axis and gross enrollment in Secondary school on the vertical axis. The sample refers to country with positive and non missing information on repetition rates and with an income per capita not greater than US$ 28,000. Source: UNESCO (2002).
Figure 2 Repetition Rates in Primary School and PPP GDP per Capita (US$ 1,000)
Algeria
Bahrain
Jordanw
Kuwait
Lebanon
Morocco
Saudi Arabia
Sudan
Tunisiaw
Albania
Belarus
Bulgaria
Croatia Czech RepublicoEstonia Hungary oPolandoAzerbaijan
Cambodia
Chinaw
Indonesiaw
Samoa
ThailandwArgentinaw
Belize
Boliv ia ChilewColombia
Costa Rica
Dominican Republic
Guatemala
JamaicawMexicoo
NicaraguaPanama
Paraguay w
Peruw
Trinidad and Tobago
Uruguay w
AustriaoFinlando
Franceo
Germany oIrelandoItaly o
Bhutan
IndiawMaldiv es
Angola
Botswana
Burkina Faso
Cameroon
ChadComoros
Equatorial Guinea
Ethiopia
GuineaGuinea-Bissau
Lesotho
Madagascar
Malawi
0.1
.2.3
.4R
epet
ition
0 5 10 15 20 25 30GDP
The graph plots (1999) PPP GDP per capita on the horizontal axis and repetition rates in primary school on the vertical axis. See also notes to Figure 1.
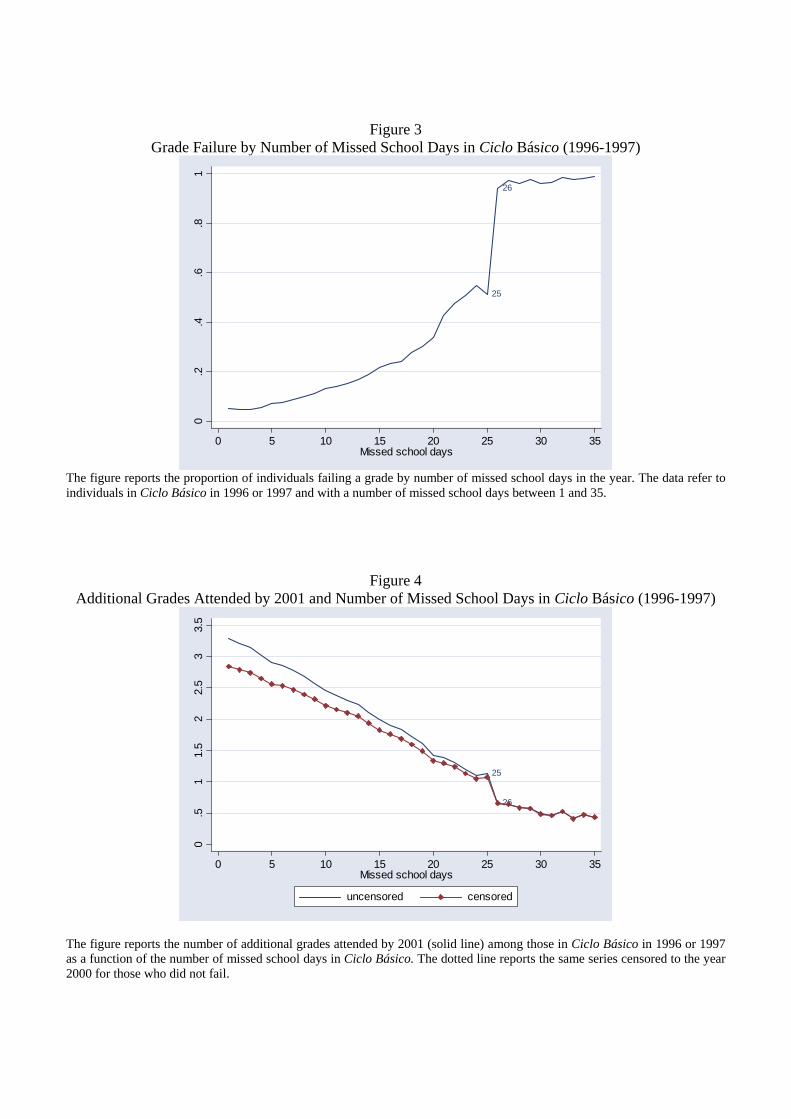
Figure 3 Grade Failure by Number of Missed School Days in Ciclo Básico (1996-1997)
25
260
.2.4
.6.8
1
0 5 10 15 20 25 30 35Missed school days
The figure reports the proportion of individuals failing a grade by number of missed school days in the year. The data refer to individuals in Ciclo Básico in 1996 or 1997 and with a number of missed school days between 1 and 35.
Figure 4 Additional Grades Attended by 2001 and Number of Missed School Days in Ciclo Básico (1996-1997)
25
26
0.5
11.
52
2.5
33.
5
0 5 10 15 20 25 30 35Missed school days
uncensored censored
The figure reports the number of additional grades attended by 2001 (solid line) among those in Ciclo Básico in 1996 or 1997 as a function of the number of missed school days in Ciclo Básico. The dotted line reports the same series censored to the year 2000 for those who did not fail.
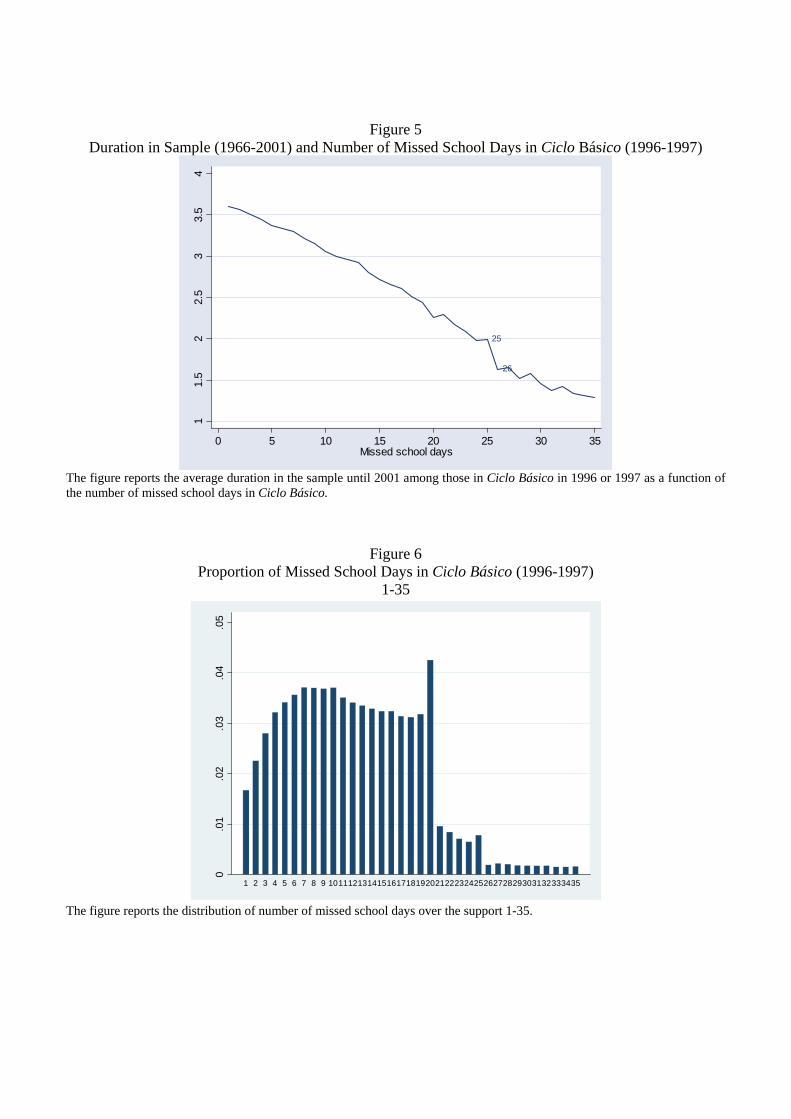
Figure 5 Duration in Sample (1966-2001) and Number of Missed School Days in Ciclo Básico (1996-1997)
25
26
11.
52
2.5
33.
54
0 5 10 15 20 25 30 35Missed school days
The figure reports the average duration in the sample until 2001 among those in Ciclo Básico in 1996 or 1997 as a function of the number of missed school days in Ciclo Básico.
Figure 6 Proportion of Missed School Days in Ciclo Básico (1996-1997)
1-35
0.0
1.0
2.0
3.0
4.0
5
1 2 3 4 5 6 7 8 9 1011121314151617181920212223242526272829303132333435
The figure reports the distribution of number of missed school days over the support 1-35.
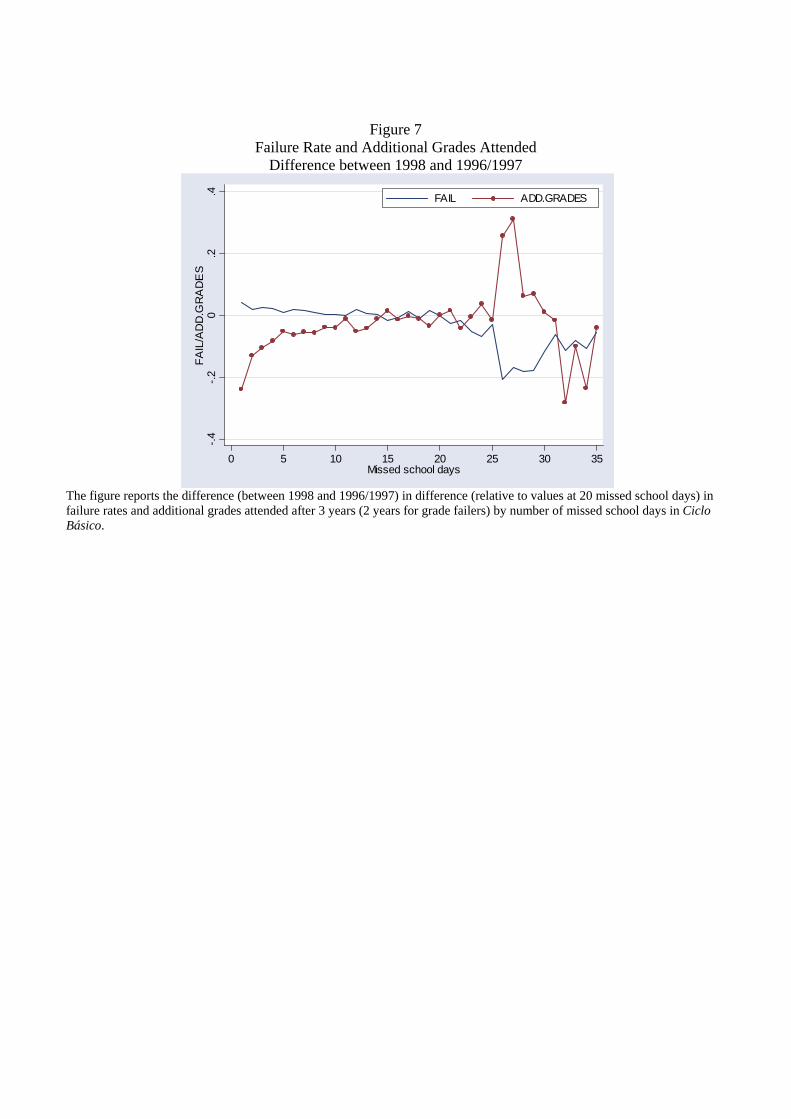
Figure 7 Failure Rate and Additional Grades Attended
Difference between 1998 and 1996/1997
-.4-.2
0.2
.4FA
IL/A
DD
.GR
AD
ES
0 5 10 15 20 25 30 35Missed school days
FAIL ADD.GRADES
The figure reports the difference (between 1998 and 1996/1997) in difference (relative to values at 20 missed school days) in failure rates and additional grades attended after 3 years (2 years for grade failers) by number of missed school days in Ciclo Básico.
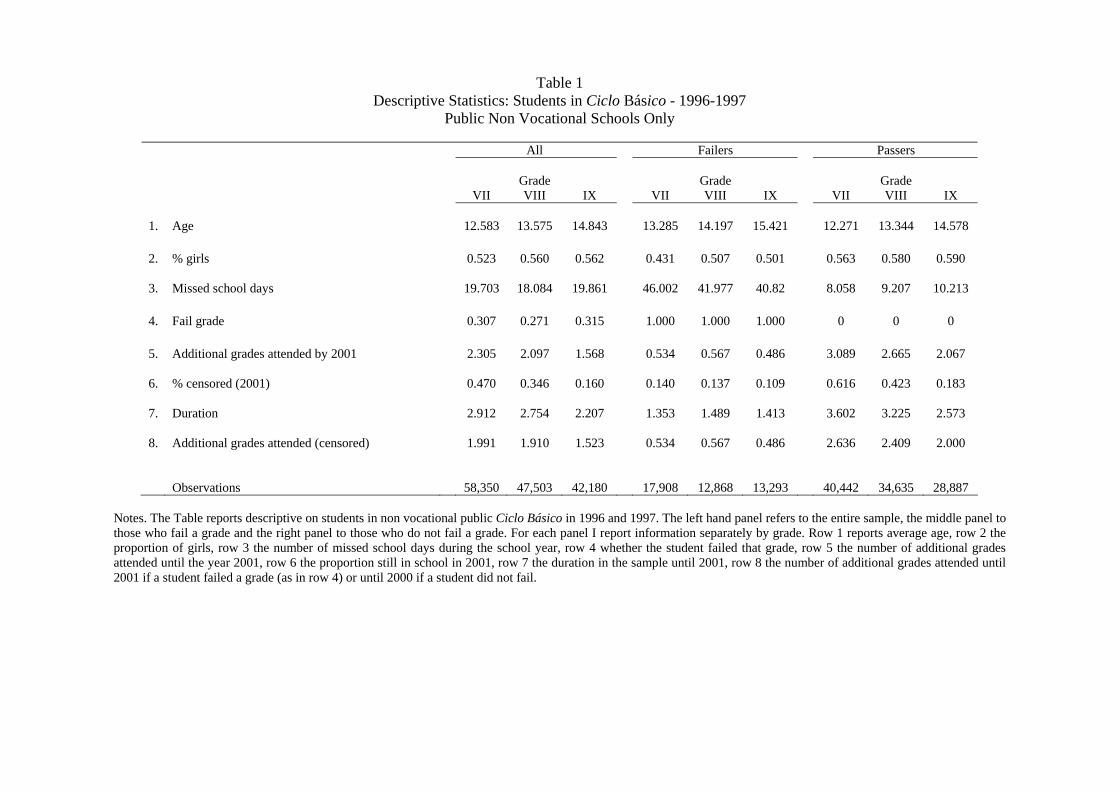
Table 1 Descriptive Statistics: Students in Ciclo Básico - 1996-1997
Public Non Vocational Schools Only
All Failers Passers Grade Grade Grade VII VIII IX VII VIII IX VII VIII IX 1. Age 12.583 13.575 14.843 13.285 14.197 15.421 12.271 13.344 14.578 2. % girls 0.523 0.560 0.562 0.431 0.507 0.501 0.563 0.580 0.590 3. Missed school days 19.703 18.084 19.861 46.002 41.977 40.82 8.058 9.207 10.213 4. Fail grade 0.307 0.271 0.315 1.000 1.000 1.000 0 0 0 5. Additional grades attended by 2001 2.305 2.097 1.568 0.534 0.567 0.486 3.089 2.665 2.067 6. % censored (2001) 0.470 0.346 0.160 0.140 0.137 0.109 0.616 0.423 0.183 7. Duration 2.912 2.754 2.207 1.353 1.489 1.413 3.602 3.225 2.573 8. Additional grades attended (censored) 1.991 1.910 1.523 0.534 0.567 0.486 2.636 2.409 2.000 Observations 58,350 47,503 42,180 17,908 12,868 13,293 40,442 34,635 28,887
Notes. The Table reports descriptive on students in non vocational public Ciclo Básico in 1996 and 1997. The left hand panel refers to the entire sample, the middle panel to those who fail a grade and the right panel to those who do not fail a grade. For each panel I report information separately by grade. Row 1 reports average age, row 2 the proportion of girls, row 3 the number of missed school days during the school year, row 4 whether the student failed that grade, row 5 the number of additional grades attended until the year 2001, row 6 the proportion still in school in 2001, row 7 the duration in the sample until 2001, row 8 the number of additional grades attended until 2001 if a student failed a grade (as in row 4) or until 2000 if a student did not fail.
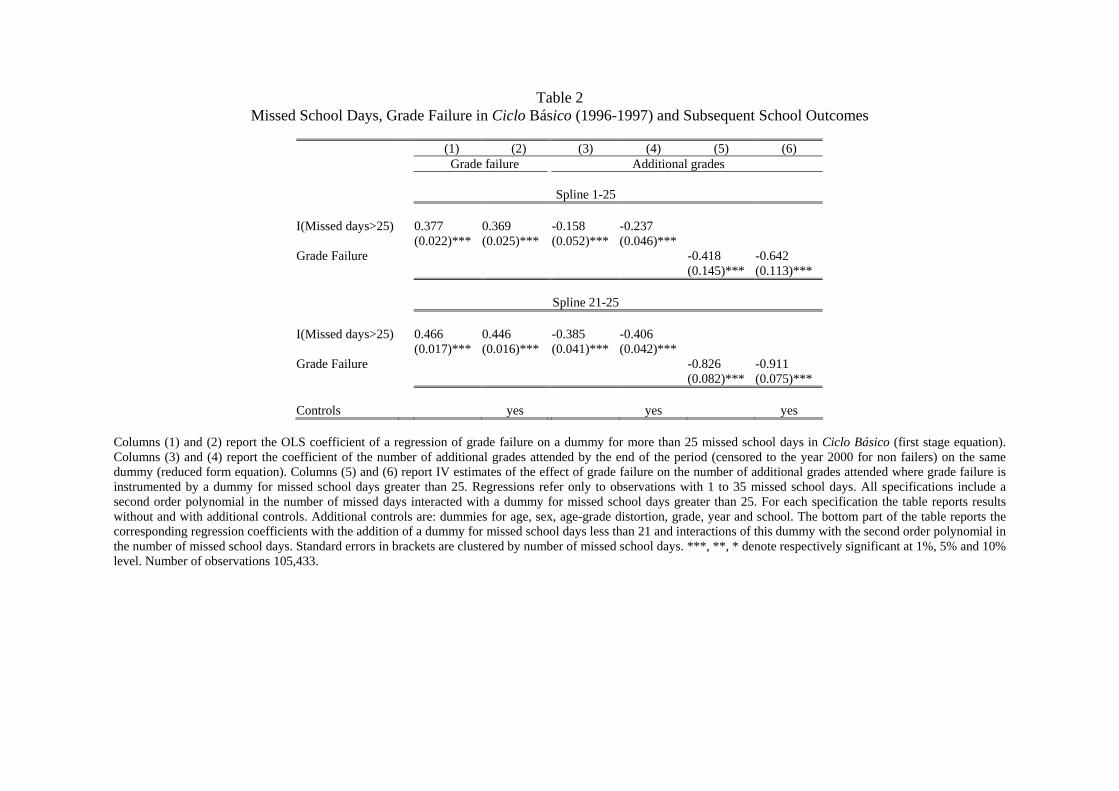
Table 2
Missed School Days, Grade Failure in Ciclo Básico (1996-1997) and Subsequent School Outcomes
(1) (2) (3) (4) (5) (6) Grade failure Additional grades Spline 1-25 I(Missed days>25) 0.377 0.369 -0.158 -0.237 (0.022)*** (0.025)*** (0.052)*** (0.046)*** Grade Failure -0.418 -0.642 (0.145)*** (0.113)*** Spline 21-25 I(Missed days>25) 0.466 0.446 -0.385 -0.406 (0.017)*** (0.016)*** (0.041)*** (0.042)*** Grade Failure -0.826 -0.911 (0.082)*** (0.075)*** Controls yes yes yes
Columns (1) and (2) report the OLS coefficient of a regression of grade failure on a dummy for more than 25 missed school days in Ciclo Básico (first stage equation). Columns (3) and (4) report the coefficient of the number of additional grades attended by the end of the period (censored to the year 2000 for non failers) on the same dummy (reduced form equation). Columns (5) and (6) report IV estimates of the effect of grade failure on the number of additional grades attended where grade failure is instrumented by a dummy for missed school days greater than 25. Regressions refer only to observations with 1 to 35 missed school days. All specifications include a second order polynomial in the number of missed days interacted with a dummy for missed school days greater than 25. For each specification the table reports results without and with additional controls. Additional controls are: dummies for age, sex, age-grade distortion, grade, year and school. The bottom part of the table reports the corresponding regression coefficients with the addition of a dummy for missed school days less than 21 and interactions of this dummy with the second order polynomial in the number of missed school days. Standard errors in brackets are clustered by number of missed school days. ***, **, * denote respectively significant at 1%, 5% and 10% level. Number of observations 105,433.
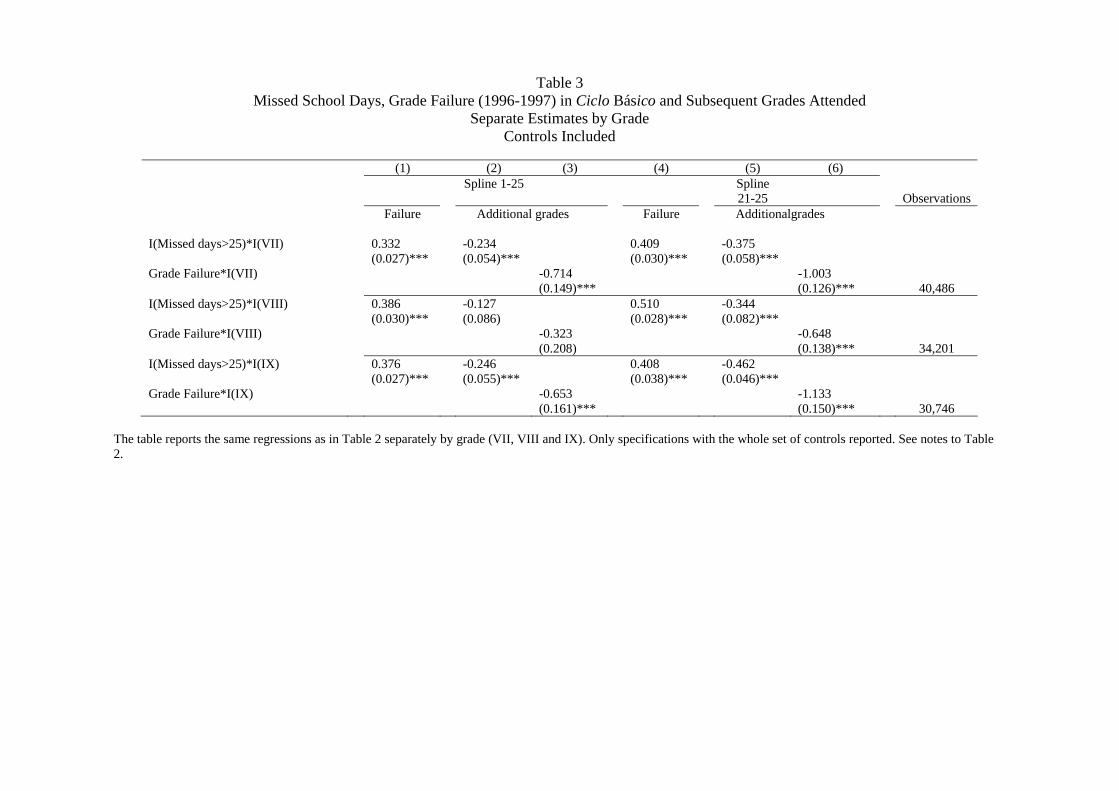
Table 3 Missed School Days, Grade Failure (1996-1997) in Ciclo Básico and Subsequent Grades Attended
Separate Estimates by Grade Controls Included
(1) (2) (3) (4) (5) (6) Spline 1-25 Spline
21-25
Observations Failure Additional grades Failure Additionalgrades I(Missed days>25)*I(VII) 0.332 -0.234 0.409 -0.375 (0.027)*** (0.054)*** (0.030)*** (0.058)*** Grade Failure*I(VII) -0.714 -1.003 (0.149)*** (0.126)*** 40,486 I(Missed days>25)*I(VIII) 0.386 -0.127 0.510 -0.344 (0.030)*** (0.086) (0.028)*** (0.082)*** Grade Failure*I(VIII) -0.323 -0.648 (0.208) (0.138)*** 34,201 I(Missed days>25)*I(IX) 0.376 -0.246 0.408 -0.462 (0.027)*** (0.055)*** (0.038)*** (0.046)*** Grade Failure*I(IX) -0.653 -1.133 (0.161)*** (0.150)*** 30,746
The table reports the same regressions as in Table 2 separately by grade (VII, VIII and IX). Only specifications with the whole set of controls reported. See notes to Table 2.
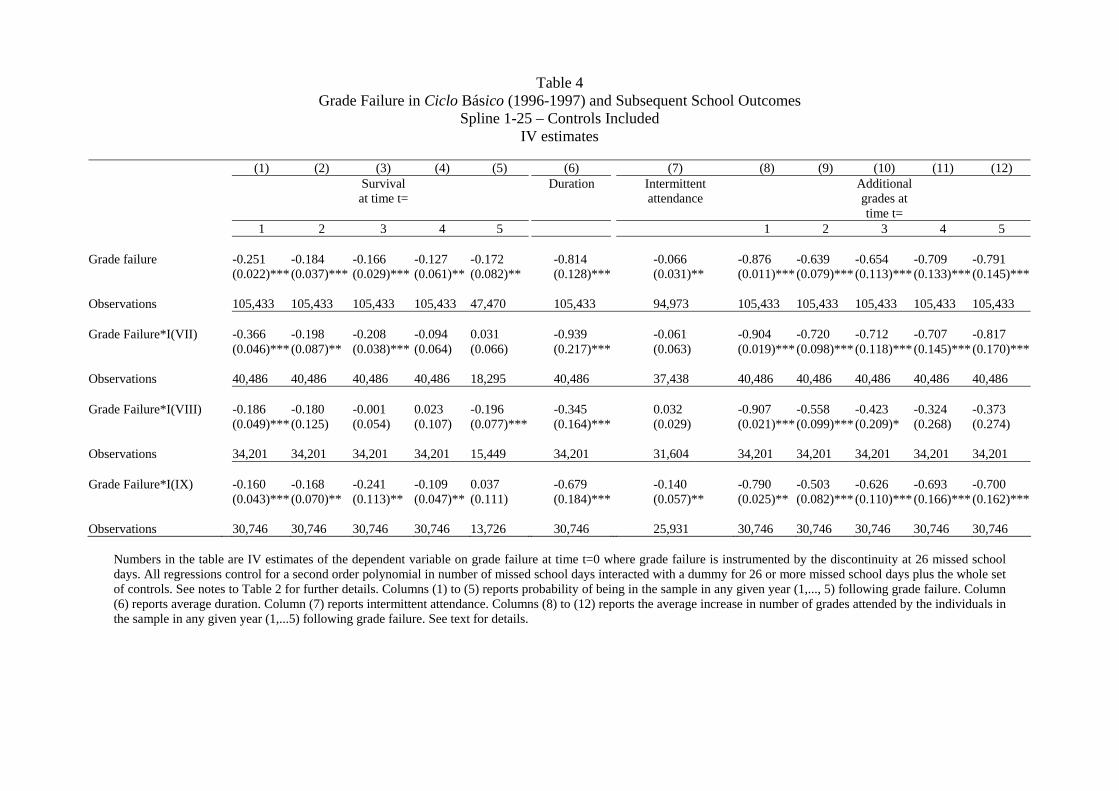
Table 4 Grade Failure in Ciclo Básico (1996-1997) and Subsequent School Outcomes
Spline 1-25 – Controls Included IV estimates
(1) (2) (3) (4) (5) (6) (7) (8) (9) (10) (11) (12) Survival
at time t= Duration Intermittent
attendance Additional
grades at time t=
1 2 3 4 5 1 2 3 4 5 Grade failure -0.251 -0.184 -0.166 -0.127 -0.172 -0.814 -0.066 -0.876 -0.639 -0.654 -0.709 -0.791 (0.022)*** (0.037)*** (0.029)*** (0.061)** (0.082)** (0.128)*** (0.031)** (0.011)***(0.079)***(0.113)***(0.133)***(0.145)*** Observations 105,433 105,433 105,433 105,433 47,470 105,433 94,973 105,433 105,433 105,433 105,433 105,433 Grade Failure*I(VII) -0.366 -0.198 -0.208 -0.094 0.031 -0.939 -0.061 -0.904 -0.720 -0.712 -0.707 -0.817 (0.046)*** (0.087)** (0.038)*** (0.064) (0.066) (0.217)*** (0.063) (0.019)***(0.098)***(0.118)***(0.145)***(0.170)*** Observations 40,486 40,486 40,486 40,486 18,295 40,486 37,438 40,486 40,486 40,486 40,486 40,486 Grade Failure*I(VIII) -0.186 -0.180 -0.001 0.023 -0.196 -0.345 0.032 -0.907 -0.558 -0.423 -0.324 -0.373 (0.049)*** (0.125) (0.054) (0.107) (0.077)*** (0.164)*** (0.029) (0.021)***(0.099)***(0.209)* (0.268) (0.274) Observations 34,201 34,201 34,201 34,201 15,449 34,201 31,604 34,201 34,201 34,201 34,201 34,201 Grade Failure*I(IX) -0.160 -0.168 -0.241 -0.109 0.037 -0.679 -0.140 -0.790 -0.503 -0.626 -0.693 -0.700 (0.043)*** (0.070)** (0.113)** (0.047)** (0.111) (0.184)*** (0.057)** (0.025)** (0.082)***(0.110)***(0.166)***(0.162)*** Observations 30,746 30,746 30,746 30,746 13,726 30,746 25,931 30,746 30,746 30,746 30,746 30,746
Numbers in the table are IV estimates of the dependent variable on grade failure at time t=0 where grade failure is instrumented by the discontinuity at 26 missed school days. All regressions control for a second order polynomial in number of missed school days interacted with a dummy for 26 or more missed school days plus the whole set of controls. See notes to Table 2 for further details. Columns (1) to (5) reports probability of being in the sample in any given year (1,..., 5) following grade failure. Column (6) reports average duration. Column (7) reports intermittent attendance. Columns (8) to (12) reports the average increase in number of grades attended by the individuals in the sample in any given year (1,...5) following grade failure. See text for details.
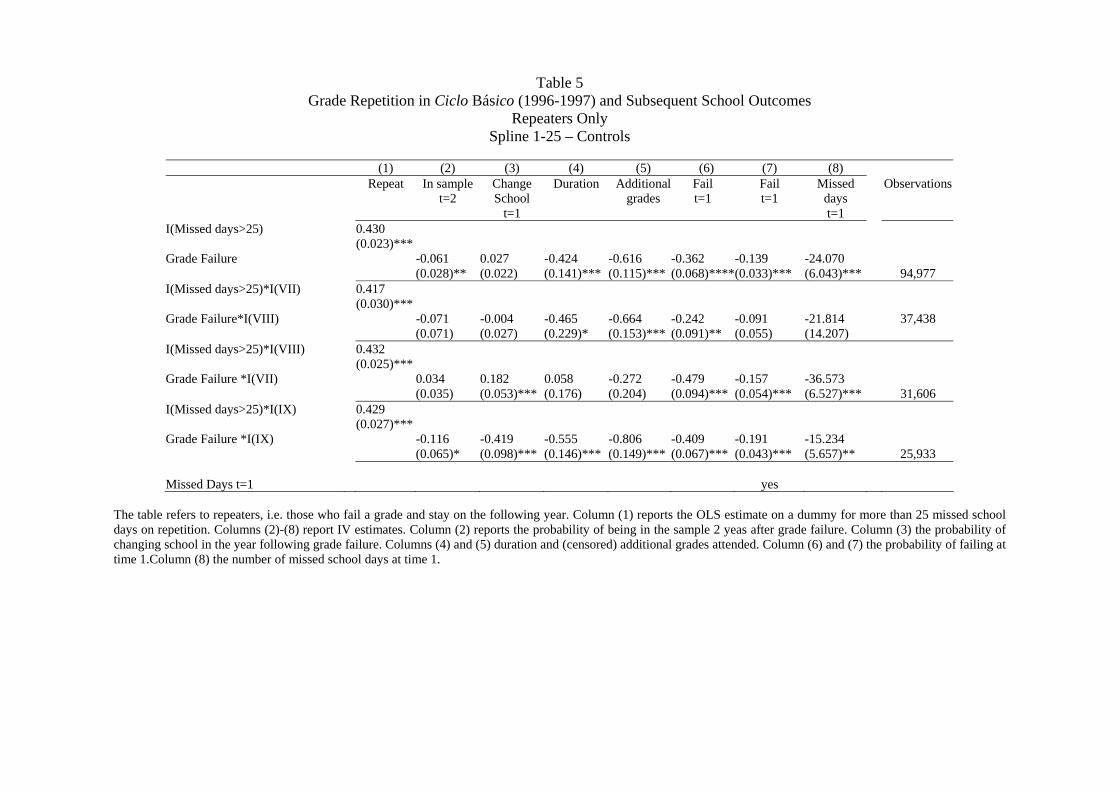
Table 5 Grade Repetition in Ciclo Básico (1996-1997) and Subsequent School Outcomes
Repeaters Only Spline 1-25 – Controls
(1) (2) (3) (4) (5) (6) (7) (8) Repeat In sample
t=2 Change School
t=1
Duration Additional grades
Fail t=1
Fail t=1
Missed days t=1
Observations
I(Missed days>25) 0.430 (0.023)*** Grade Failure -0.061 0.027 -0.424 -0.616 -0.362 -0.139 -24.070 (0.028)** (0.022) (0.141)*** (0.115)*** (0.068)****(0.033)*** (6.043)*** 94,977 I(Missed days>25)*I(VII) 0.417 (0.030)*** Grade Failure*I(VIII) -0.071 -0.004 -0.465 -0.664 -0.242 -0.091 -21.814 37,438 (0.071) (0.027) (0.229)* (0.153)*** (0.091)** (0.055) (14.207) I(Missed days>25)*I(VIII) 0.432 (0.025)*** Grade Failure *I(VII) 0.034 0.182 0.058 -0.272 -0.479 -0.157 -36.573 (0.035) (0.053)*** (0.176) (0.204) (0.094)*** (0.054)*** (6.527)*** 31,606 I(Missed days>25)*I(IX) 0.429 (0.027)*** Grade Failure *I(IX) -0.116 -0.419 -0.555 -0.806 -0.409 -0.191 -15.234 (0.065)* (0.098)*** (0.146)*** (0.149)*** (0.067)*** (0.043)*** (5.657)** 25,933 Missed Days t=1 yes
The table refers to repeaters, i.e. those who fail a grade and stay on the following year. Column (1) reports the OLS estimate on a dummy for more than 25 missed school days on repetition. Columns (2)-(8) report IV estimates. Column (2) reports the probability of being in the sample 2 yeas after grade failure. Column (3) the probability of changing school in the year following grade failure. Columns (4) and (5) duration and (censored) additional grades attended. Column (6) and (7) the probability of failing at time 1.Column (8) the number of missed school days at time 1.
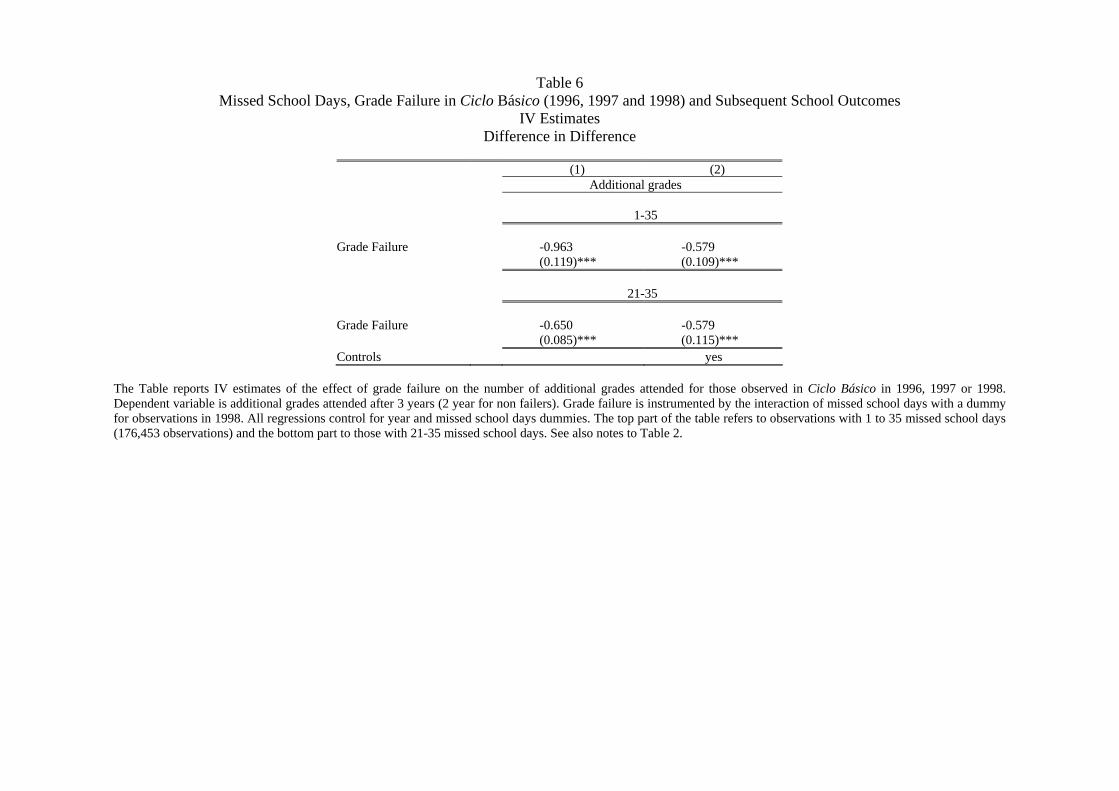
Table 6 Missed School Days, Grade Failure in Ciclo Básico (1996, 1997 and 1998) and Subsequent School Outcomes
IV Estimates Difference in Difference
(1) (2)
Additional grades 1-35 Grade Failure -0.963 -0.579 (0.119)*** (0.109)*** 21-35 Grade Failure -0.650 -0.579 (0.085)*** (0.115)*** Controls yes
The Table reports IV estimates of the effect of grade failure on the number of additional grades attended for those observed in Ciclo Básico in 1996, 1997 or 1998. Dependent variable is additional grades attended after 3 years (2 year for non failers). Grade failure is instrumented by the interaction of missed school days with a dummy for observations in 1998. All regressions control for year and missed school days dummies. The top part of the table refers to observations with 1 to 35 missed school days (176,453 observations) and the bottom part to those with 21-35 missed school days. See also notes to Table 2.
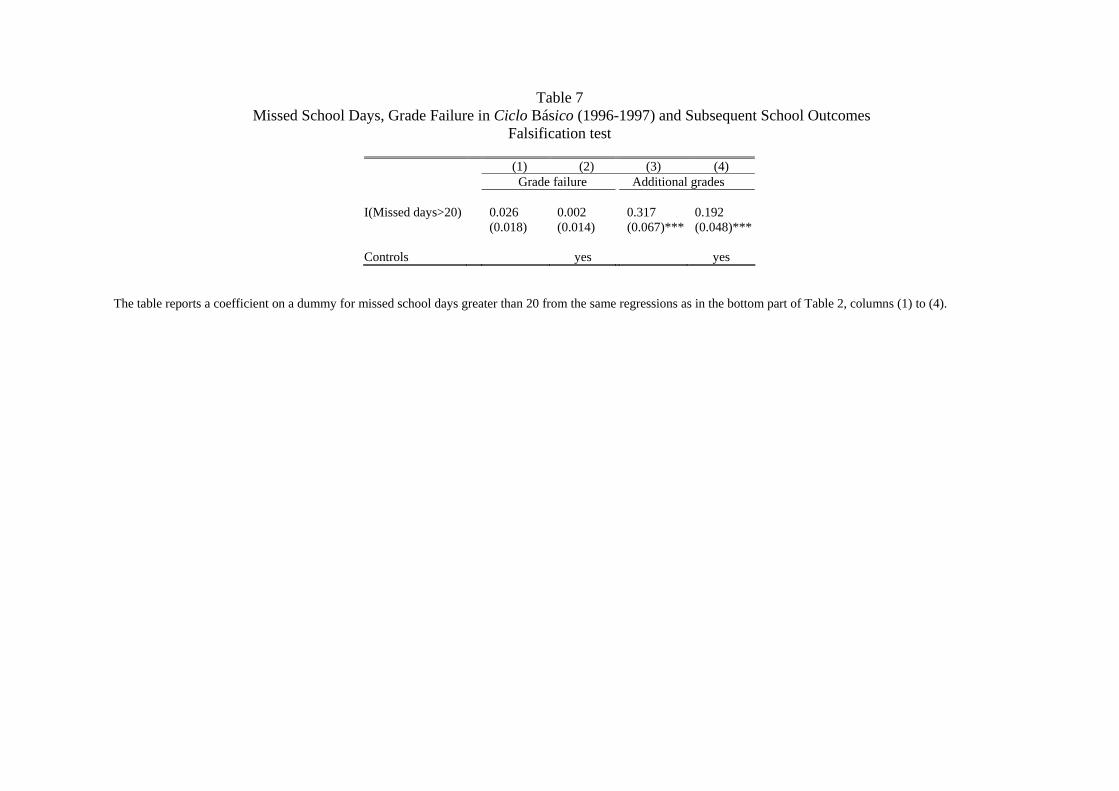
Table 7
Missed School Days, Grade Failure in Ciclo Básico (1996-1997) and Subsequent School Outcomes Falsification test
(1) (2) (3) (4)
Grade failure Additional grades I(Missed days>20) 0.026 0.002 0.317 0.192 (0.018) (0.014) (0.067)*** (0.048)*** Controls yes yes
The table reports a coefficient on a dummy for missed school days greater than 20 from the same regressions as in the bottom part of Table 2, columns (1) to (4).
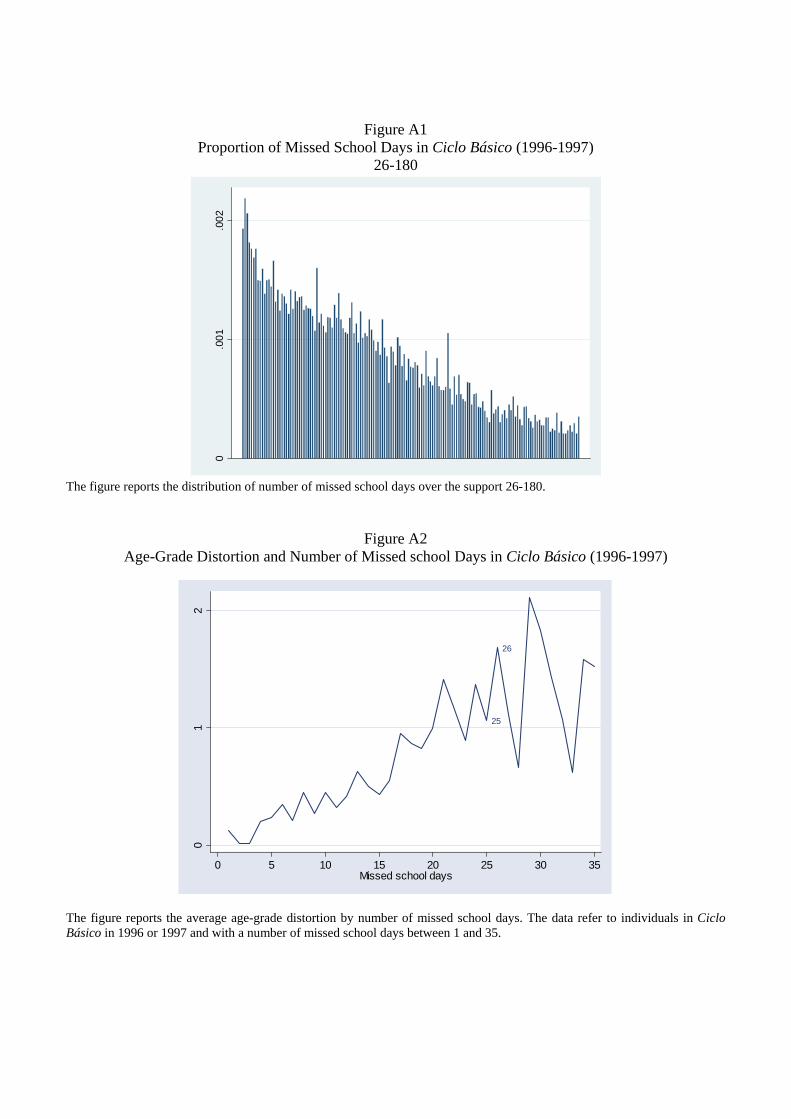
Figure A1 Proportion of Missed School Days in Ciclo Básico (1996-1997)
26-180
0.0
01.0
02
The figure reports the distribution of number of missed school days over the support 26-180.
Figure A2 Age-Grade Distortion and Number of Missed school Days in Ciclo Básico (1996-1997)
25
26
01
2
0 5 10 15 20 25 30 35Missed school days
The figure reports the average age-grade distortion by number of missed school days. The data refer to individuals in Ciclo Básico in 1996 or 1997 and with a number of missed school days between 1 and 35.
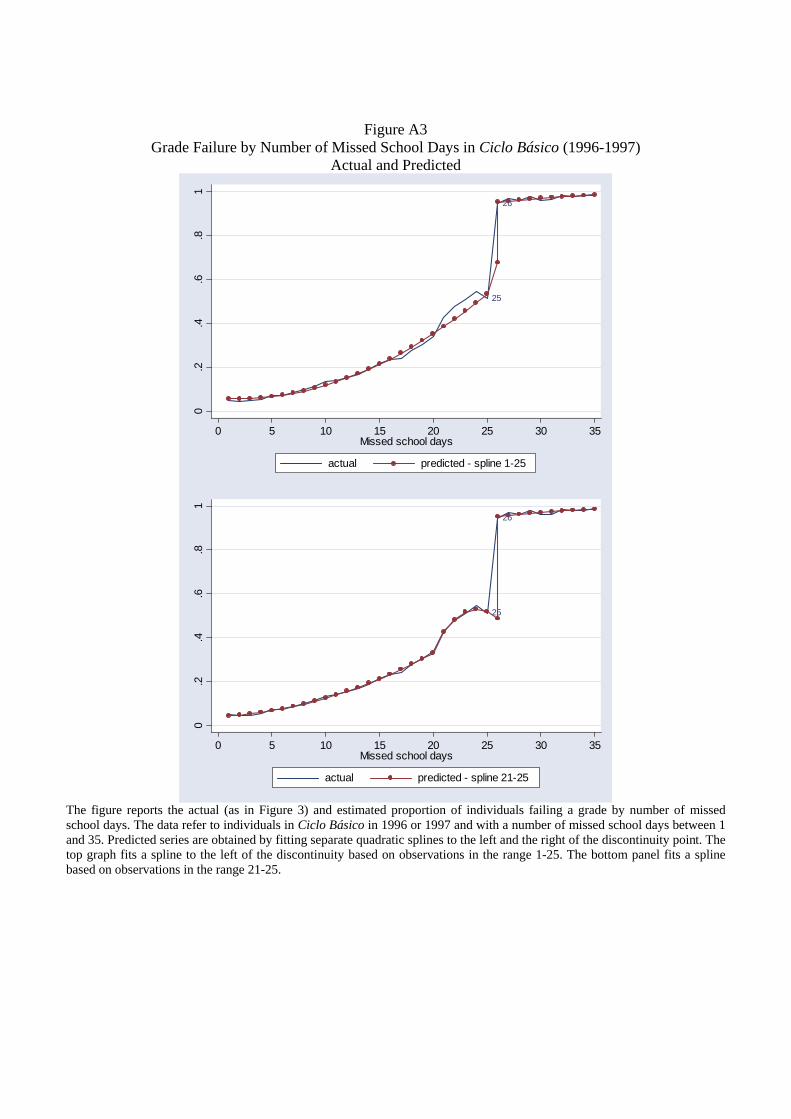
Figure A3 Grade Failure by Number of Missed School Days in Ciclo Básico (1996-1997)
Actual and Predicted
25
260
.2.4
.6.8
1
0 5 10 15 20 25 30 35Missed school days
actual predicted - spline 1-25
25
26
0.2
.4.6
.81
0 5 10 15 20 25 30 35Missed school days
actual predicted - spline 21-25
The figure reports the actual (as in Figure 3) and estimated proportion of individuals failing a grade by number of missed school days. The data refer to individuals in Ciclo Básico in 1996 or 1997 and with a number of missed school days between 1 and 35. Predicted series are obtained by fitting separate quadratic splines to the left and the right of the discontinuity point. The top graph fits a spline to the left of the discontinuity based on observations in the range 1-25. The bottom panel fits a spline based on observations in the range 21-25.
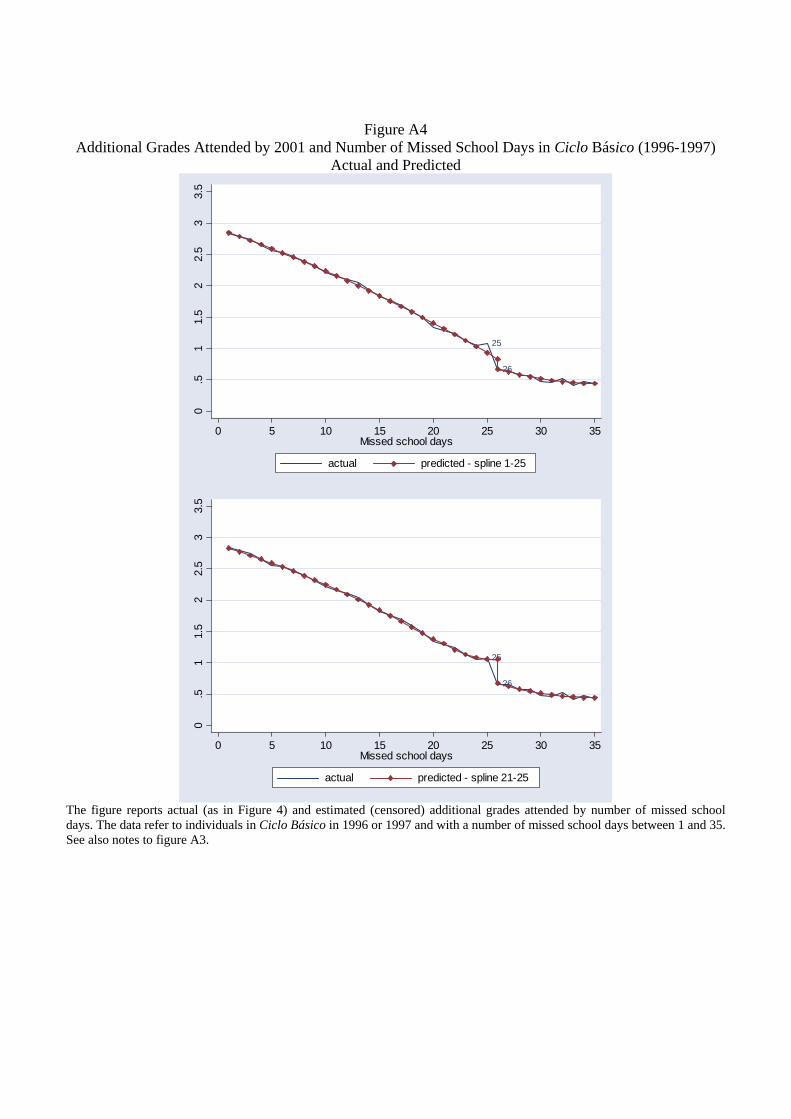
Figure A4 Additional Grades Attended by 2001 and Number of Missed School Days in Ciclo Básico (1996-1997)
Actual and Predicted
25
26
0.5
11.
52
2.5
33.
5
0 5 10 15 20 25 30 35Missed school days
actual predicted - spline 1-25
25
26
0.5
11.
52
2.5
33.
5
0 5 10 15 20 25 30 35Missed school days
actual predicted - spline 21-25
The figure reports actual (as in Figure 4) and estimated (censored) additional grades attended by number of missed school days. The data refer to individuals in Ciclo Básico in 1996 or 1997 and with a number of missed school days between 1 and 35. See also notes to figure A3.
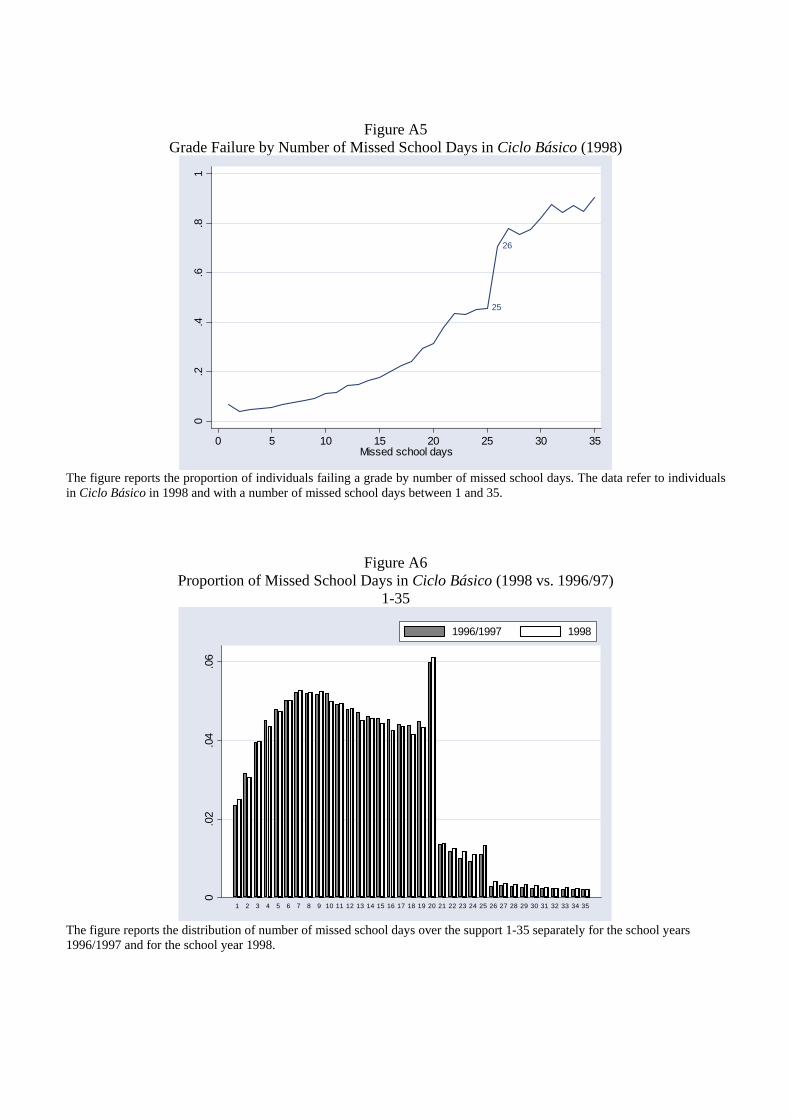
Figure A5 Grade Failure by Number of Missed School Days in Ciclo Básico (1998)
25
26
0.2
.4.6
.81
0 5 10 15 20 25 30 35Missed school days
The figure reports the proportion of individuals failing a grade by number of missed school days. The data refer to individuals in Ciclo Básico in 1998 and with a number of missed school days between 1 and 35.
Figure A6 Proportion of Missed School Days in Ciclo Básico (1998 vs. 1996/97)
1-35
0.0
2.0
4.0
6
1 2 3 4 5 6 7 8 9 10 11 12 13 14 15 16 17 18 19 20 21 22 23 24 25 26 27 28 29 30 31 32 33 34 35
1996/1997 1998
The figure reports the distribution of number of missed school days over the support 1-35 separately for the school years 1996/1997 and for the school year 1998.
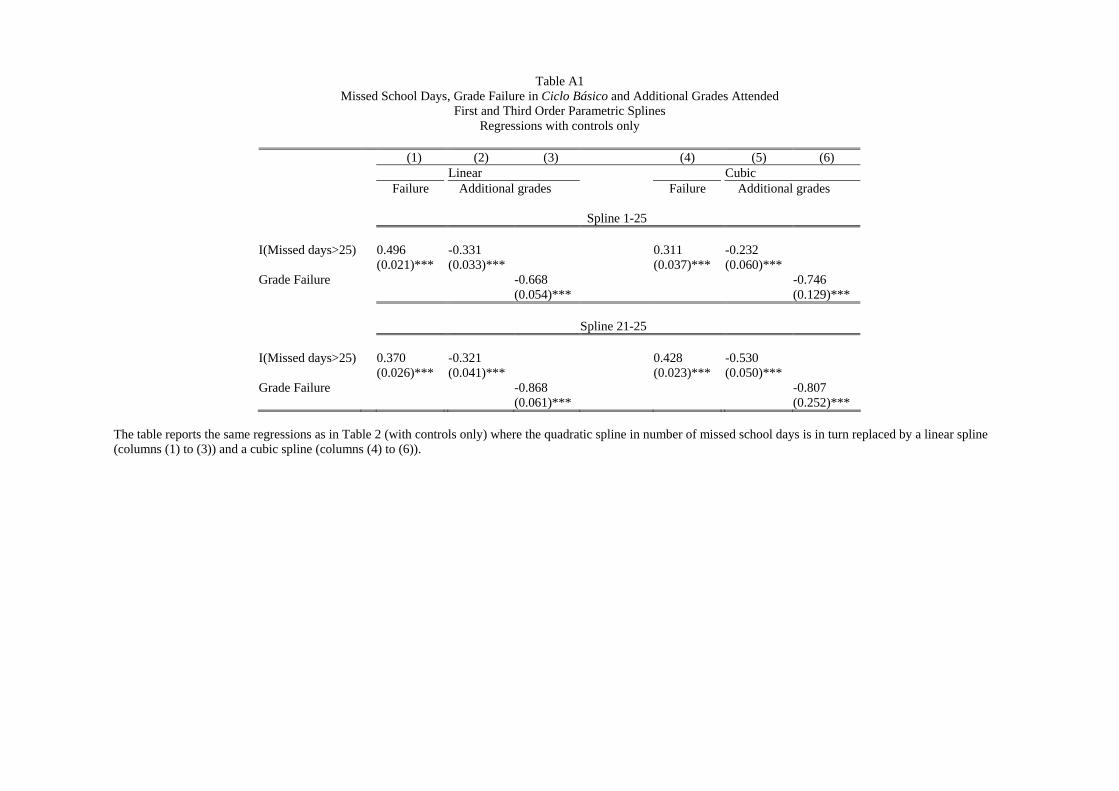
Table A1 Missed School Days, Grade Failure in Ciclo Básico and Additional Grades Attended
First and Third Order Parametric Splines Regressions with controls only
(1) (2) (3) (4) (5) (6)
Linear Cubic Failure Additional grades Failure Additional grades Spline 1-25 I(Missed days>25) 0.496 -0.331 0.311 -0.232 (0.021)*** (0.033)*** (0.037)*** (0.060)*** Grade Failure -0.668 -0.746 (0.054)*** (0.129)*** Spline 21-25 I(Missed days>25) 0.370 -0.321 0.428 -0.530 (0.026)*** (0.041)*** (0.023)*** (0.050)*** Grade Failure -0.868 -0.807 (0.061)*** (0.252)***
The table reports the same regressions as in Table 2 (with controls only) where the quadratic spline in number of missed school days is in turn replaced by a linear spline (columns (1) to (3)) and a cubic spline (columns (4) to (6)).
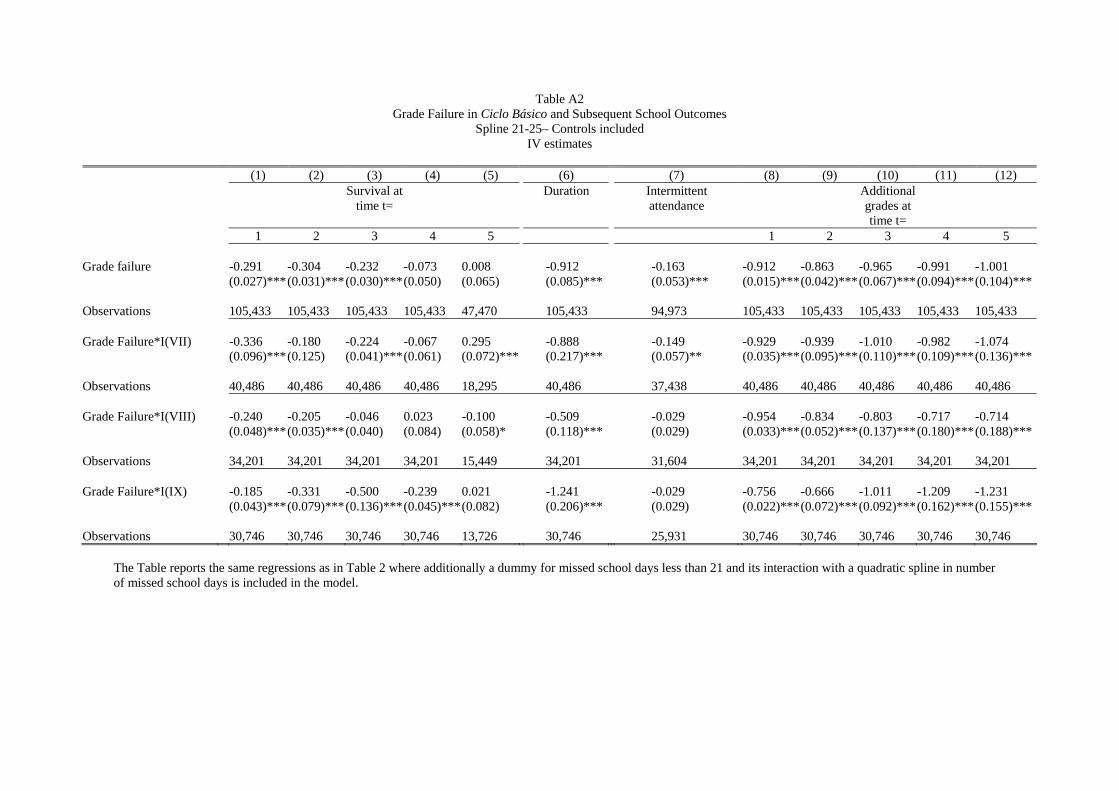
Table A2
Grade Failure in Ciclo Básico and Subsequent School Outcomes Spline 21-25– Controls included
IV estimates
(1) (2) (3) (4) (5) (6) (7) (8) (9) (10) (11) (12) Survival at
time t= Duration Intermittent
attendance Additional
grades at time t=
1 2 3 4 5 1 2 3 4 5 Grade failure -0.291 -0.304 -0.232 -0.073 0.008 -0.912 -0.163 -0.912 -0.863 -0.965 -0.991 -1.001 (0.027)*** (0.031)***(0.030)***(0.050) (0.065) (0.085)*** (0.053)*** (0.015)***(0.042)***(0.067)***(0.094)***(0.104)*** Observations 105,433 105,433 105,433 105,433 47,470 105,433 94,973 105,433 105,433 105,433 105,433 105,433 Grade Failure*I(VII) -0.336 -0.180 -0.224 -0.067 0.295 -0.888 -0.149 -0.929 -0.939 -1.010 -0.982 -1.074 (0.096)*** (0.125) (0.041)***(0.061) (0.072)*** (0.217)*** (0.057)** (0.035)***(0.095)***(0.110)***(0.109)***(0.136)*** Observations 40,486 40,486 40,486 40,486 18,295 40,486 37,438 40,486 40,486 40,486 40,486 40,486 Grade Failure*I(VIII) -0.240 -0.205 -0.046 0.023 -0.100 -0.509 -0.029 -0.954 -0.834 -0.803 -0.717 -0.714 (0.048)*** (0.035)***(0.040) (0.084) (0.058)* (0.118)*** (0.029) (0.033)***(0.052)***(0.137)***(0.180)***(0.188)*** Observations 34,201 34,201 34,201 34,201 15,449 34,201 31,604 34,201 34,201 34,201 34,201 34,201 Grade Failure*I(IX) -0.185 -0.331 -0.500 -0.239 0.021 -1.241 -0.029 -0.756 -0.666 -1.011 -1.209 -1.231 (0.043)*** (0.079)***(0.136)***(0.045)***(0.082) (0.206)*** (0.029) (0.022)***(0.072)***(0.092)***(0.162)***(0.155)*** Observations 30,746 30,746 30,746 30,746 13,726 30,746 25,931 30,746 30,746 30,746 30,746 30,746
The Table reports the same regressions as in Table 2 where additionally a dummy for missed school days less than 21 and its interaction with a quadratic spline in number of missed school days is included in the model.
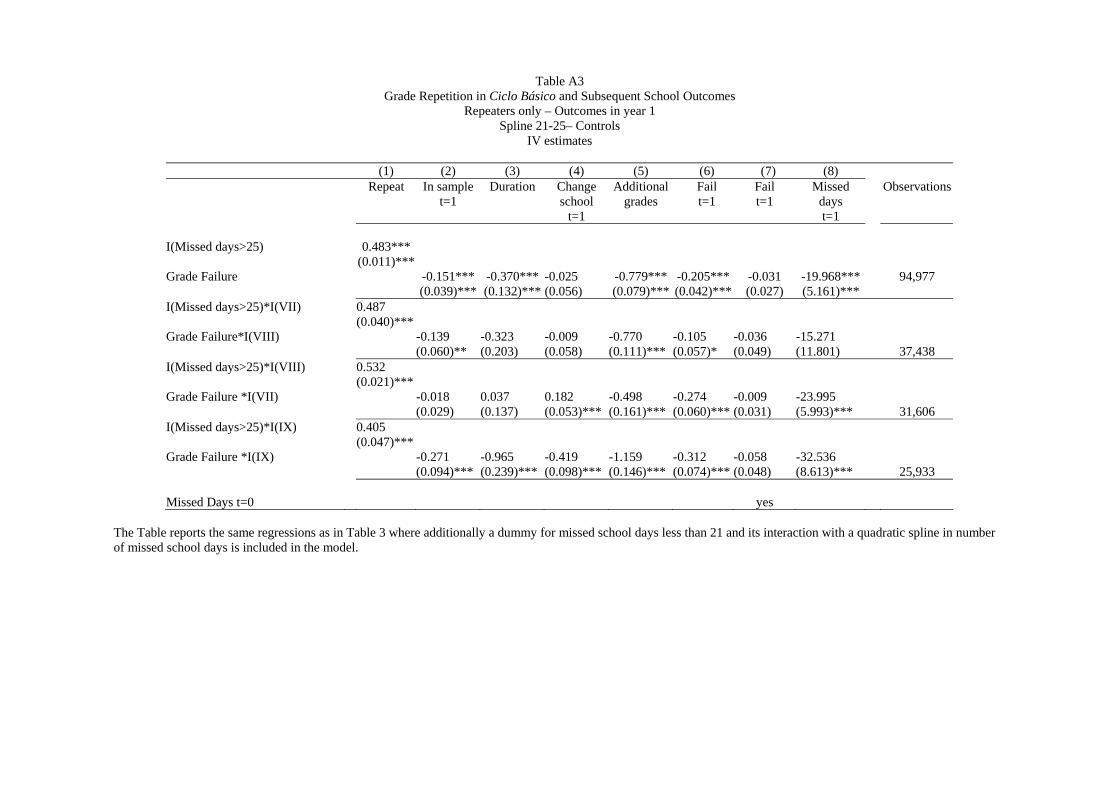
Table A3 Grade Repetition in Ciclo Básico and Subsequent School Outcomes
Repeaters only – Outcomes in year 1 Spline 21-25– Controls
IV estimates
(1) (2) (3) (4) (5) (6) (7) (8) Repeat In sample
t=1 Duration Change
school t=1
Additional grades
Fail t=1
Fail t=1
Missed days t=1
Observations
I(Missed days>25) 0.483*** (0.011)*** Grade Failure -0.151*** -0.370*** -0.025 -0.779*** -0.205*** -0.031 -19.968*** 94,977 (0.039)*** (0.132)*** (0.056) (0.079)*** (0.042)*** (0.027) (5.161)*** I(Missed days>25)*I(VII) 0.487 (0.040)*** Grade Failure*I(VIII) -0.139 -0.323 -0.009 -0.770 -0.105 -0.036 -15.271 (0.060)** (0.203) (0.058) (0.111)*** (0.057)* (0.049) (11.801) 37,438 I(Missed days>25)*I(VIII) 0.532 (0.021)*** Grade Failure *I(VII) -0.018 0.037 0.182 -0.498 -0.274 -0.009 -23.995 (0.029) (0.137) (0.053)*** (0.161)*** (0.060)*** (0.031) (5.993)*** 31,606 I(Missed days>25)*I(IX) 0.405 (0.047)*** Grade Failure *I(IX) -0.271 -0.965 -0.419 -1.159 -0.312 -0.058 -32.536 (0.094)*** (0.239)*** (0.098)*** (0.146)*** (0.074)*** (0.048) (8.613)*** 25,933 Missed Days t=0 yes
The Table reports the same regressions as in Table 3 where additionally a dummy for missed school days less than 21 and its interaction with a quadratic spline in number of missed school days is included in the model.