Embed Size (px)
Citation preview
UMEÅ UNIVERSITY MEDICAL DISSERTATIONS NEW SERIES NO. 982 - ISSN 0346-6612 – ISBN 91-7305-942-0
From the Department of Surgical and Perioperative Sciences Anesthesiology and Intensive Care Umeå University, Umeå, Sweden
DETECTION OF MYOCARDIAL ISCHEMIA
Clinical and experimental studies with focus on vectorcardiography, heart rate and perioperative conditions.
Sören Häggmark
Fakultetsopponent: Professor Mårten Rosenqvist
Karolinska institutet, Södersjukhuset 118 83 Stockholm
Umeå 2005

Copyright © 2005 Sören Häggmark ISBN 91-7305-942-0
Printed in Sweden by
Print Media, Umeå, 2005

I see trees of green, red roses too I see them bloom for me and you And I think to myself, what a wonderful world I see skies of blue and clouds of white The bright blessed day, the dark sacred night And I think to myself, what a wonderful world The colours of rainbow, so pretty in the sky Are also on the faces of people going by I see friends shakin’ hands, saying, “How do you do?” They’re really saying “I love you” I hear crying’, I watch them grow They’ll learn much more than I’ll ever know And I think to myself, what a wonderful world Yes, I think to myself, what a wonderful world Oh yeah
(George Weiss/Bob Thiele) To my family: Ing-Marie, Daniel & Annica, Nina & Mattias And my grandchilds: Tinde & Mira, Linnea & Linus
Abstract
4
ABSTRACT
Introduction. Multiple clinical methods for detecting myocardial ischemia are utilised in the hospital setting each day, but there is uncertainty about their diagnostic accuracy. In the operating room, multiple methods may be employed, while in the CCU advanced electro-physiological (ECG) techniques for myocardial ischemia detection, and in particular, ST segment analysis, are common. Vectorcardiography (VCG) is one form of ECG.
Several conditions other than ischemia may cause marked ST changes, which can impair the process of diagnosis of clinical ischemia. Elevated HR is one of these factors, which is studied here. The hypotheses were about concordance of different methods to detect ischemia, and relation of ECG ST levels to HR with and without myocardial ischemia.
Methods. Study I. Anesthetised vascular surgical patients with coronary artery disease were studied during the start of anesthesia and surgery: ECG, hemodynamic, mechanical, and metabolic parameters were measured and categorised as positive or negative with ref-erence to a specific definition of myocardial ischemia. Study II. Awake patients with no ischemic heart disease were paced in graded steps, and VCG ST analyses were performed.
Study III. Anesthetised pigs were studied for local metabolic and VCG ST changes related to controlled HR levels and transient coronary occlusion. Study IV. Thirty five anesthetised coronary artery disease (CAD) patients and ten non-CAD patients were paced at controlled levels, and great coronary artery vein (GCV) lactate measurement was used to determine presence or absence of myocardial ischemia. The CAD patients were paced up to HR lev-els where myocardial ischemia could be confirmed. The relation of HR-related VCG ST levels to presence or absence of ischemia was analysed. In Studies II,, III, and IV the ST vector magnitude (ST-VM), the change from baseline in ST-VM (STC-VM), and the vector angle change from baseline (STC-VA) were analysed for each step.
Results. Study I. Poor concordance was demonstrated for positive events (presumed myo-cardial ischemia) between the hemodynamic, ECG, mechanical, and metabolic detection methods. Study II. STC-VM but not ST-VM levels demonstrated HR-related increases in the presumed absence of myocardial ischemia in 18 awake subjects. J point time to ST measurement did not affect the response of VCG ST to HR. Study III. STC-VM levels showed HR-related increases in the absence of ischemia (tested by local metabolic obser-vations). VCG ST parameters responded positively to transient regional ischemia. Study IV. CAD patients, which demonstrated a clear pattern of onset and progress of ischemia during pacing, were further analysed for the relation of VCG ST level to ischemia. Sensi-tivity and specificity of STC-VM levels were described by ROC analysis for a range of STC-VM levels.
Conclusions. Concordance of different measures for detection of onset of myocardial ischemia is difficult to assess in the absence of a very reliable reference method. The con-tribution of HR and ischemia to VCG ST levels were estimated in study subjects. HR-re-lated increases in STC-VM occur in the absence of ischemia. HR levels need to be consid-ered when interpreting STC-VM as a diagnostic test for ischemia. Further study is needed to establish criteria that take into account multiple clinical factors in order to improve the predictive value of our tests for myocardial ischemia.

Original papers
5
ORIGINAL PAPERS
This thesis is based on the following papers, which will be referred to in the text by their Roman numerals: I Häggmark S, Hohner P, Östman M, Friedman A, Diamond G, Lowenstein E,
Reiz S. Comparison of hemodynamic, electrocardigraphic, mechanical, and metabolic indicators of intraoperative myocardial ischemia in vascular surgical patients with coronary artery disease. Anesthesiology 1989;70(1):19-25.
II Häggmark S, Haney MF, Jensen SM, Johansson G, Näslund U.
ST-segment deviations during pacing-induced increased heart rate in patients without coronary artery disease. Clinical Physiology and Functional Imaging 2005;25(4):246-52.
III Häggmark S, Haney MF, Johansson G, Biber B, Näslund U.
Vectorcardiographic ST deviations related to increased heart rate in the absence of ischemia in an experimental pig model. Journal of Electrocardiology, accepted for publication 2005.
IV Häggmark S, Haney MF, Johansson G, Reiz S, Näslund U.
Contributions of myocardial ischemia and heart rate to ST segment changes analysed by vectorcardiography in patients with or without coronary artery disease. Manuscript.
Reprints of original papers were made with approval from the publishers.

Contents
6
CONTENTS
ABSTRACT..............................................................................................................4 ORIGINAL PAPERS...............................................................................................5 CONTENTS..............................................................................................................6 ABBREVIATIONS ..................................................................................................8 PREFACE.................................................................................................................9 INTRODUCTION ..................................................................................................11
The importance of myocardial ischemia .......................................................11 Definitions......................................................................................................11 Myocardial infarction.....................................................................................12 Ischemia and metabolic adaptation ................................................................12 The ischemic cascade .....................................................................................12 Early identification.........................................................................................14 Existing detection methods ............................................................................15 Strength of electrocardiographic methods......................................................15 Cell events and ECG signal............................................................................16 Overview of VCG .........................................................................................17 Limitations of the current methods ................................................................18 What is our local tradition for methodological testing and evaluation ?........18 Heart rate adjustments ....................................................................................19
AIMS OF THE THESIS .........................................................................................20 Hypotheses: ........................................................................................................20 Specific Aims: .....................................................................................................21
REVIEW OF METHODS.....................................................................................22 Material ..............................................................................................................22
Patient based studies (I, II, and IV) ................................................................22 Study III, an animal study ..............................................................................22
Preparation.........................................................................................................22 Measurement methods ........................................................................................23
ECG (Studies I, II, III, IV) .............................................................................27 Cardiokymography (Study I) .........................................................................28 Hemodynamics (Studies I, II, III, IV) ............................................................29 Retrograde thermodilution, CS flow (Studies I, II, III, IV)............................29 Blood gases (Studies III, IV)..........................................................................30 Hemoximetry (Studies III, IV) .......................................................................30 Myocardial oxygen consumption (MVO2) (Studies III, IV) ..........................30 Blood lactate concentration (Studies I, II, III, IV) .........................................30 Microdialysis for lactate, pyruvate, glucose, and potassium (Study III) ........31 Tissue partial pressure oxygen (Study III) .....................................................32
Experimental protocols.......................................................................................32
Contents
7
Analysis...............................................................................................................33 Identification of ischemia) .............................................................................33 Statistics .........................................................................................................34
REVIEW OF THE RESULTS................................................................................35 Study I .................................................................................................................35 Relation of HR to VCG (and ECG) level (Studies II, III, IV) .............................36
ST-VM and HR ..............................................................................................36 STC-VM and HR ...........................................................................................36 STC-VA and HR ............................................................................................37 VCG ST measurement at different times after J point: relation to HR changes ...................................................................................37 ECG and HR ..................................................................................................39
Local metabolic measurements and ischemia ....................................................39 Regional metabolic measures and ischemia.......................................................40 VCG ST changes in relation to myocardial ischemia.........................................41
VCG results ....................................................................................................41 ECG and myocardial ischemia .......................................................................44
DISCUSSION.........................................................................................................45 Study I ............................................................................................................45 Corroborating Studies II, III, and IV..............................................................46 STC-VM ischemic thresholds or criteria........................................................50 J point results..................................................................................................51 Mechanisms of ST changes............................................................................52
Methodological Consideration ...........................................................................53 Future directions in electrocardiographic myocardial ischemia detection ? ....56
CONCLUSIONS.....................................................................................................57 ACKNOWLEDGEMENTS....................................................................................58 Populärvetenskaplig sammanfattning på svenska...................................................60 REFERENCES .......................................................................................................61

Abbreviations
8
ABBREVIATIONS
ANOVA Analysis of variance ATP Adenosine triphosphate CAD Coronary artery disease CaO2 Arterial oxygen content CCU Critical care unit CgcvO2 GCV oxygen content CKG Cardiokymography CS Coronary sinus vein ECG Electrocardiography GCV Great cardiac vein H+ Hydrogen ion HR Heart rate J-point Junction point [K+] Potassium ion concentration K+ Potassium ion LAD Left anterior descending artery LVMVO2 Left ventricular myocardial oxygen consumption LVMVO2 Left ventricular myocardial oxygen consumption Na+ Sodium ion PAOP Pulmonary artery occlusion pressure PCI Percutaneous coronary intervention PCWP Pulmonary capillary wedge pressure QGCV Great cardiac venous blood flow ROC Receiver operating characteristic SD Standard deviation SEM Standard error of the mean STC-VA ST change vector angle STC-VM ST change vector magnitude STsum ST summation of all 12-lead (ECG) ST-VA ST vector angle from Y ST-VM ST-vector magnitude VCG Vectorcardiography µV Micro volt

Preface
9
PREFACE
This work took place over a period of many years, and involved directly or indirectly too many people to count and thank by name. Clinical data collection took place in the hospital both in the Department of Thoracic Surgery, in the operating rooms together with personnel from the Departments of Anesthesia and Thoracic Anesthesia, and also in the electrophysiology laboratories of the Department of Clinical Physiology and the Department of Cardiology. This multi-departmental activity was dependent on the support and goodwill from colleagues and departmental leaders from several fields. I think that we demonstrated that together we could produce something that was larger than anything we might have tried in a single department. Also, on the university side, this work was supported by 2 different academic chairmen of anesthesia, Professor Sebastian Reiz and Professor Björn Biber, and this was my home institution as a Ph.D. candidate. The large animal experimental laboratory, with its friendly and professional personnel, has been something of a second home (at work) over the years, even if little of that activity appears in this thesis. Finally, since this work was largely cardiological, there are many cardiologists in our institution who have directly or indirectly contributed to the projects in general.
10
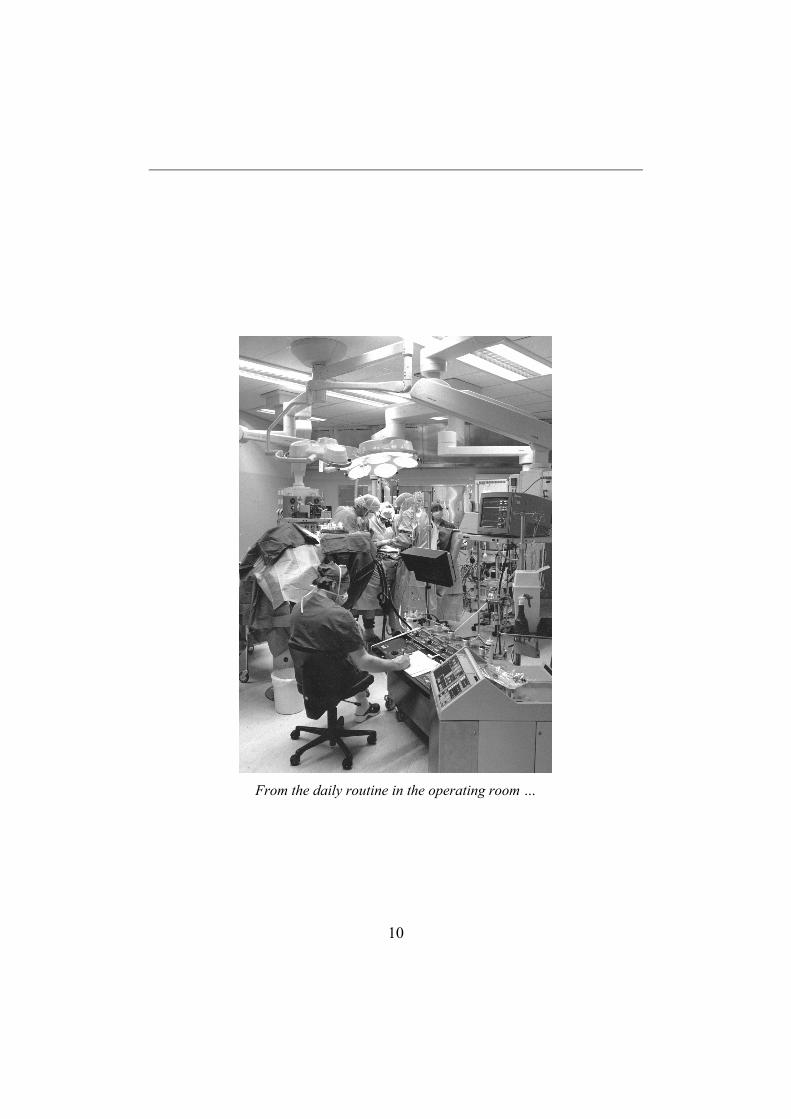
From the daily routine in the operating room …
Introduction
11
INTRODUCTION
“In our County (Västerbotten), approximately 70,000 resting and 6,000 exercise electrocardiograms (ECGs) are recorded each year, mostly in attempts to diagnose ischemic heart disease. There are probably 5,000 health care workers in our local system involved in collecting, processing, and interpreting these. And, this has been going on for decades, many decades. This test is absolutely accepted and integrated into our work routines, and colleagues do not generally question its implementation. Despite this massive daily effort and activity, the specific ECG criteria for diagnosis of myocardial ischemia in different clinical settings do not seem to be available based on published experience or expert consensus. Similar limitations are found for the vectorcardiographic diagnostics and monitoring activities that are widespread in CCUs in Sweden. ”
Anonymous Umeå, 2005
The importance of myocardial ischemia Myocardial ischemia is the process which, if uninterrupted, leads to irreversible
myocardial injury, life-threatining dysrythmia, heart failure and other subsequent complications related to ischemic heart disease - the number one killer of adults in the western world. Even with modern health care systems, still half of the patients with acute myocardial infarction die acutely. One strategy in attempting to de-crease the risk of myocardial infarction is to detect the disease before an infarction occurs. For patients who present with symptoms which might suggest active coro-nary artery disease, access to the best possible care can be life-saving. Early identification of coronary artery disease can provide an opportunity for medical and/or invasive interventions to prevent devastating progress of the disease. This thesis is focused on improving methods for identification of myocardial ischemia, since ischemia is always present in the course of acute coronary syndromes, and its presence directly implies that the patient moves from low risk to high risk for severe cardiac morbidity or death. Through improvement of detection methods, there will be a patient benefit leading to earlier appropriate interventions for patients with myocardial ischemia and acute coronary syndromes.
Definitions While this project studies detection and quantification of myocardial ischemia,
there is no aim here to question or redefine the concept of myocardial ischemia. There are several widely used slightly different definitions of myocardial ischemia, but a relatively general definition can be found in Braunwald’s textbook Heart Disease 7th Ed [1], “Myocardial ischemia is characterised by an imbalance be-tween myocardial oxygen supply and demand.” There are several different possi-ble etiologies for this. It can be brought about either by a limitation in coronary flow and substrate delivery, or by an increase in metabolic activity and substrate
Introduction
12
demand in the presence of limited substrate delivery, or by both at the same time. When ischemic conditions are present, the heart cells continue to work for a short time, though depleting their substrates and changing their metabolism to a very inefficient form which can only last a short time. Unless improved substrate deliv-ery occurs, or heart cell work decreases, injury will eventually occur, over a period of minutes.
Myocardial infarction Myocardial ischemia, if not interrupted with return of adequate coronary flow
(or decrease in myocardial metabolic activity) leads to injury, cell damage, and, if prolonged and severe, to cardiac cell death. The clinical syndrome of myocardial ischemia is usually not an isolated event, but can occur repeatedly without leading to cell death or infarction. Overt myocardial ischemia is generally considered a warning sign for threat of infarction or sudden cardiac death, and can also provide an indication of myocardium at risk for infarction [2, 3]. The infarction process per se, however, is usually based on a coronary thrombotic event, and is not the focus of the studies in this thesis.
Ischemia and metabolic adaptation Ischemia or repeated ischemic episodes can lead to a form of adaptation which
is characterised by metabolic and mechanical function in myocardial cells. This process has several forms, and has been described using terms like ‘stunning’ and ‘hibernation’, which are post-ischemic states that do not progress by themselves to infarction. Adaptive phenomena are typically present when experimental ischemia is induced, but they are not the focus of these studies, and are not analysed in our material. These studies confine their focus to immediate metabolic, mechanical, circulatory, and electrophysiological events associated with anesthesia and onset of surgery (I), manipulations of heart rate (II-IV) and with the onset and early course of myocardial ischemia (III, IV).
The ischemic cascade When myocardial ischemia begins, there is a cascade of events in each ischemic
cell which follow a well defined pattern. First, there is a reduction in availability of energy-carrying substrates (ATP) and oxygen, which leads to a shift from the overwhelmingly predominant aerobic (oxygen consumption-based) metabolism to anaerobic metabolism using other substrates which are available in very limited amounts. Anaerobic metabolism is relatively ineffective, and quickly consumes available resources [4].
This ischemic condition leads to consumption of the local energy sources, ulti-mately in the form of high energy phosphate bonds (phosphocreatinine) which are directly available to the myocyte contractile apparatus. There is also build-up of glycolytic metabolic by-products, including hydrogen ion (H+), lactate [5], and also breakdown of local proteins in order to be able to use their amino acid building
Introduction
13
blocks as energy sources. The intracellular accumulation of H+ leads to changes in the balance of other ions over the electrically charged heart muscle cell membrane, causing changes in the way that the cell membrane functions. The lack of ATP, which is the energy currency in the cell, leads to decreased activity of the ATP-dependent sodium/potassium membrane ion pumps. These ischemia-based proc-esses, with lack of ATP, deranged electrolyte homeostasis, and cell membrane polarisation, are presumed to be reflected by careful electrocardiographic re-cordings.
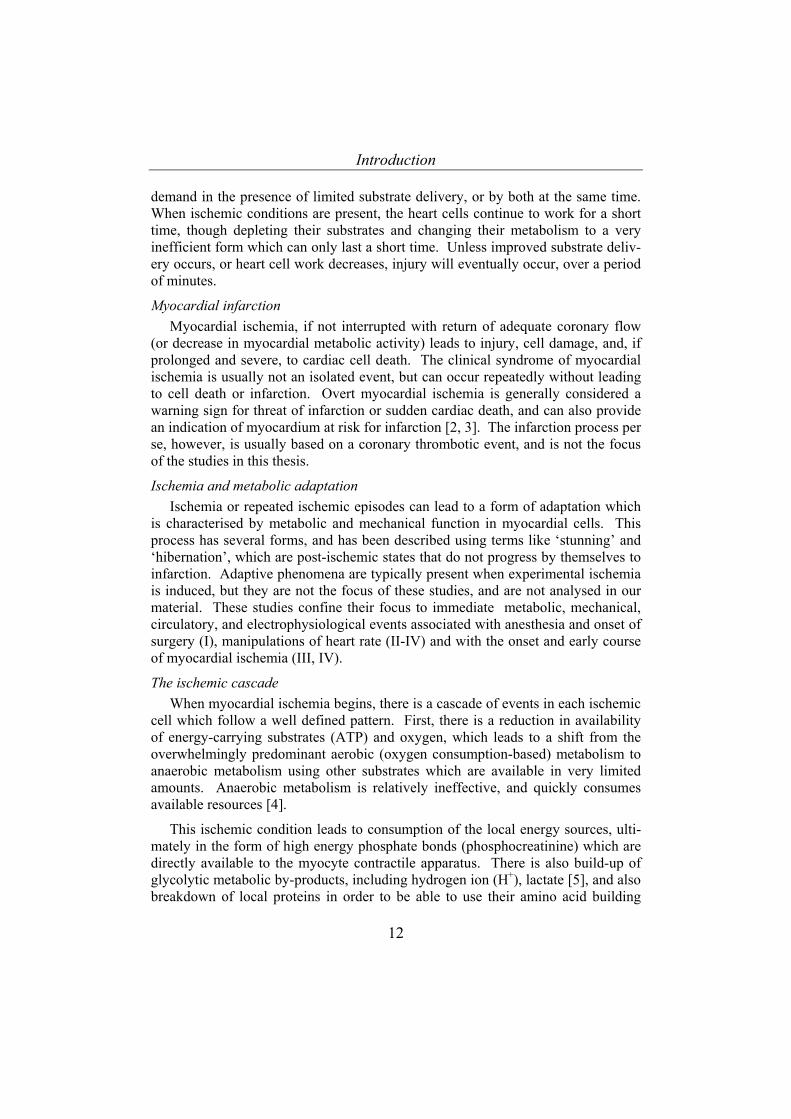
Time (sec)
mechanical wall motion
ECG changes
pain,CS lactate
occlusion
Figure 1. The ischemic ‘cascade.’ This stylised figure demonstrates the pattern of response to local ischemia, where early local mechanical dysfunction can be observed within a period of seconds, even before surface ECG changes can be noted (still well less than a minute after ischemia start). More time typically passes before by-products of ischemic metabolism from heart cells can be detected in venous blood.
There is a pattern of progressive deterioration in cardiomyocyte conditions and performance, which can be observed in predictable phases (Figure 1). Mechanical dysfunction can be observed before ECG changes occur, and ECG changes can be observed before angina symptoms eventually are noticed [6]. In fact, in patients with unstable angina, a majority of spontaneous ischemic episodes are ‘silent’, that is, without anginal chest pain [7]. This pattern is consistent, and occurs over a period of seconds (less than a minute) in response to complete arterial inflow occlusion to heart muscle. Therefore, during the onset of ischemia, there is always a progression of effects, but when significant amount of ischemia is established and a minute has passed with ischemic conditions, then there is always a combination of mechanical myocardial dysfunction, ECG changes, and even other signs or symptoms of ischemia.
Introduction
14
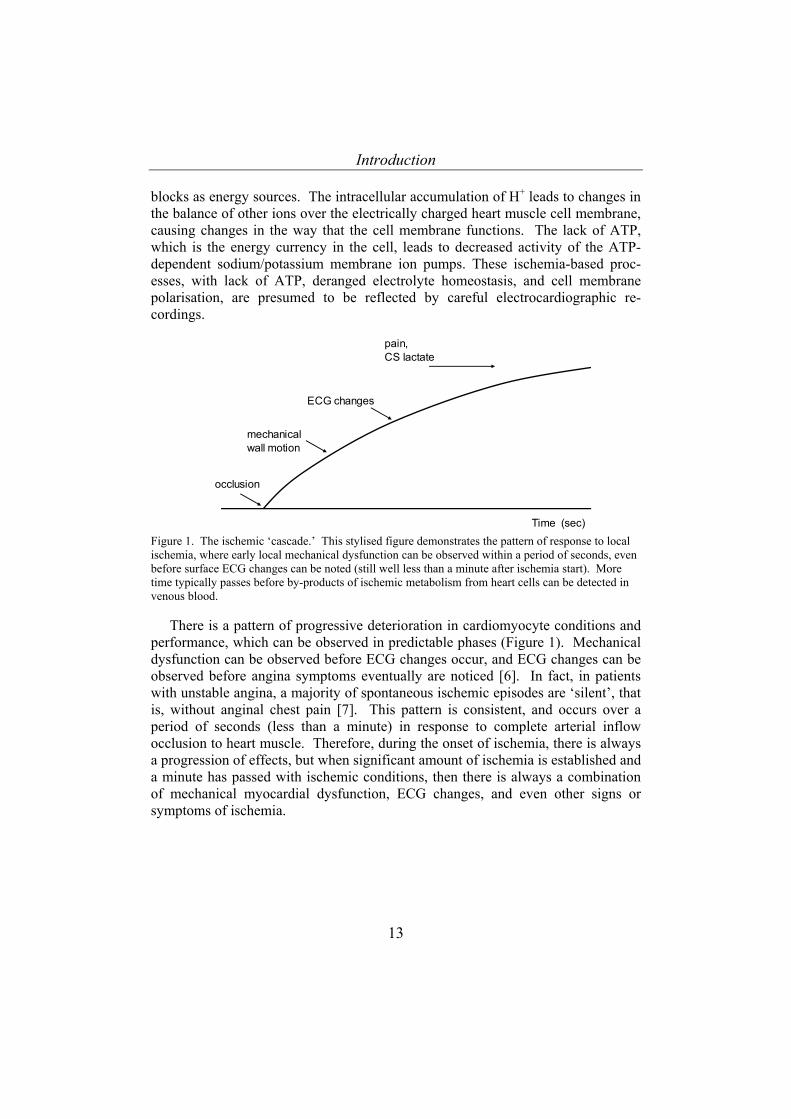
Study clinical useClinical Angina pectoris, pain 1880's xElectrocardiograpic ECG I-IV 1903 Eindhoven [8] x
VCG II-IV 1983 Sederholm [9] xStress ECG 1970's x
Mechanical CKG I 1980 Silverberg [10]Echocardiography 1970's xMRI 1990's
Hemodynamic PCWP (PAOP) I 1980'sLVEDP, dP/dt 1960's
Metabolic CS-Lactate I-IV 1960's Cohen [4]Microdialysis III 1990's Wikström [11]MRI, PETscan 1990's
Perfusion Radioimaging (i.e.SPECT) 1980's xFunctional Stress or exercise testing 1970's x
IntroductionCurrent
Method and technique
Table 1. Detection of myocardial ischemia: Different modalities with overview of their clinical introduction. CKG- cardiokymography, MRI- magnetic resonance imaging, LVEDP- left ventricu-lar end diastolic pressure, CS- coronary sinus, PET- positron emission tomography, SPECT- single photon emission computed tomography.
Early identification Early correct identification of myocardial ischemia is not always simple. In
patients with risk factors for coronary artery disease and symptomatology that sug-gests recurring acute ischemia, there are multiple diagnostic tests employed (Table 1). The test chosen by the responsible clinician is always a compromise between bedside availability, invasiveness (and risk), cost, and probability of diagnostic yield. The readily available bedside tests which are non-invasive and low cost and have a high predictive value are likely to produce the best diagnostic yield. In Table 1, electrophysiological diagnostic tests have been employed for many years, and have the clear advantage (over experimental perfusion and metabolic meas-urements) of ready availability at the bedside and low cost. The main limitation for ECG as a method, in this context, has been relatively low specificity, and in par-ticular for detection of regional posterior ischemia [12]. Other methods have clini-cal limitations in either their degree of invasiveness (and risk), bedside accessibil-ity, or their cost. Improving ECG specificity and sensitivity for detection of ischemia has been considered an important research goal in our group, which has been active in investigating both cardiological and perioperative/intensive care medicine related scientific questions concerning myocardial metabolism, function, and injury. Improved rapid bedside identification of myocardial ischemia will decrease risk for bad outcome in patients with ischemic heart disease [13], both in
Introduction
15
the coronary care unit (and the coronary interventional laboratory) and in the perioperative or intensive care setting, where cardiac mortality and morbidity is significant.
Existing detection methods All the methods mentioned in Table 1 have demonstrated promise as far as de-
tection of myocardial ischemia. To date, there is no absolutely perfect (100 % sensitivity and specificity) reference method for bedside identification of myocar-dial ischemia. Experimentally, regional ischemia can be produced prospectively, and then observed from electrophysiological, metabolic, or mechanical perspec-tives, providing an indication of how the test performs when the presence of ischemia is known. On the other hand, when a patient with angina symptoms is examined using these same electrophysiological, metabolic, or mechanical tests, there can be both difficulties in interpretation of the results (for presence or ab-sence of ischemia) as well as lack of agreement between the tests. This limitation in diagnostic certainty is a result of both problems in sampling, filtering of arte-facts, biological variation in signals, and unclear limits or thresholds for identifica-tion of ischemia.
One problem in studying myocardial ischemia detection is that there has not been a completely reliable (readily available and minimally invasive) reference method which is readily available to test these different clinical methods. There-fore, each method has its own performance in relation to experimental myocardial ischemia, but this performance for bedside measurements in patients is not well validated. There is also no well recognised pattern of concordance or disconcor-dance between different methods for detection of myocardial ischemia [14-19]. Choice and implementation of clinical methods is often a matter of local custom. Thus, despite 100 years of experience with ECG, still there is a need for more vali-dation and improvement of criteria for detection of myocardial ischemia. Myocar-dial ischemia detection has many different clinical applications in both anesthetised and awake patients, in the interventional heart catheterisation lab, in the CCU, op-erating rooms, exercise testing area, etc.
Strength of electrocardiographic methods The strength of ECG-based methods for detection of myocardial ischemia is
based on the combination of relatively high sensitivity for ischemia in patients with well identified risk factors for ischemia, as well as its low cost, non-invasiveness, bedside accessibility, and its relative ease for serial or continuous data collection and analysis [20] A weakness in ECG-based methods may be relatively less specificity for ischemia. For this reason, our research group has concentrated on testing electrocardiographic ischemia detection methods with the goal of identify-ing both factors which decrease specificity of positive finding as well as trying to define mechanisms of ECG ischemia events. We have also examined, at the same time, other clinically applicable methods for detection of ischemia, in the same
Introduction
16
experimental and clinical models [21]. For us, vectorcardiography has been a par-ticular focus, as one form of ECG method. Vectorcardiographic tools for analysis arrived in our laboratory somewhat serendipitously more than 15 years ago, and interest in developing and validating a clinical application for VCG in patients with ischemic heart disease has resided here since [22, 23].
Cell events and ECG signal The surface electrocardiogram (ECG) is the recording of variations in electrical
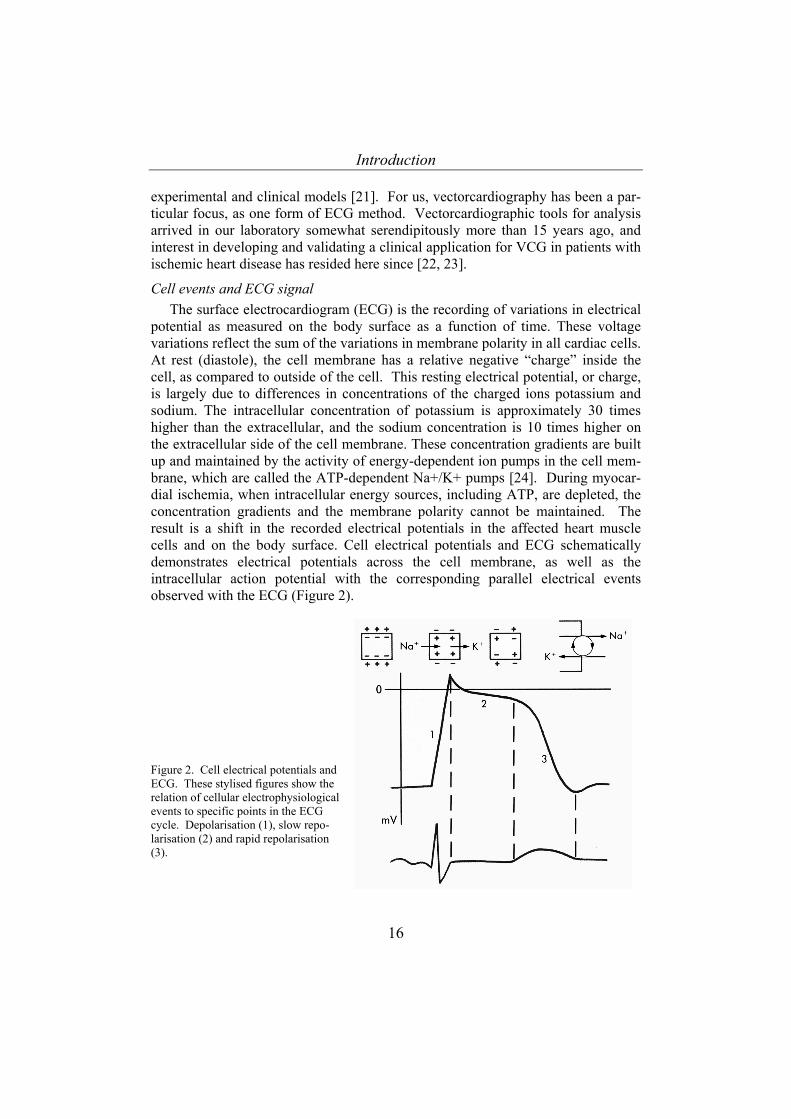
potential as measured on the body surface as a function of time. These voltage variations reflect the sum of the variations in membrane polarity in all cardiac cells. At rest (diastole), the cell membrane has a relative negative “charge” inside the cell, as compared to outside of the cell. This resting electrical potential, or charge, is largely due to differences in concentrations of the charged ions potassium and sodium. The intracellular concentration of potassium is approximately 30 times higher than the extracellular, and the sodium concentration is 10 times higher on the extracellular side of the cell membrane. These concentration gradients are built up and maintained by the activity of energy-dependent ion pumps in the cell mem-brane, which are called the ATP-dependent Na+/K+ pumps [24]. During myocar-dial ischemia, when intracellular energy sources, including ATP, are depleted, the concentration gradients and the membrane polarity cannot be maintained. The result is a shift in the recorded electrical potentials in the affected heart muscle cells and on the body surface. Cell electrical potentials and ECG schematically demonstrates electrical potentials across the cell membrane, as well as the intracellular action potential with the corresponding parallel electrical events observed with the ECG (Figure 2).
Figure 2. Cell electrical potentials and ECG. These stylised figures show the relation of cellular electrophysiological events to specific points in the ECG cycle. Depolarisation (1), slow repo-larisation (2) and rapid repolarisation (3).
Introduction
17
During severe and extensive myocardial ischemia, changes in the rapidity of depolarisation occur, which can be recorded as changes in the QRS-vector [25]. Similar types of changes can occur in the repolarisation wave and phase, and this has been the electrophysiological event which we have studied, the ST segment and the T wave. The maintenance of normal electrical potentials and intervals in both the QRS and ST-T waves are dependent on an adequate supply of energy and ATP, to build up and maintain the membrane polarity for each heart cycle.
For heart myocytes, there is propagation of a rapid depolarisation, which initi-ates systole, and slower repolarisation, recovery after systole, which propagates as a wave through the myocardium. This propagating wave front forms an electrical dipole, with a positive front side (still resting polarised myocytes) and a negative rear (newly activated myocytes). The cell-to-cell activation and deactivation, or propagation of depolarisation and repolarisation, is dependent on the gap junction channels or close chemical and electrical communications between adjacent cells. Briefly, ST segment changes recorded on the surface could theoretically be caused by multiple mechanisms: by changes in membrane polarity, energy supply and demand , or the integrity and function of gap junctions, or combinations of these. During myocardial ischemia, major and dynamic shifts in potassium develop [26]. It is not the purpose of this thesis to fully explore these mechanisms, since it is well established that potassium plays a major role in determination of membrane polar-ity and heart signal conduction, though we have included a smaller assessment of [K+] in one of the studies (III).
Overview of VCG There is not just one method to portray a spatial and vectorial analysis of car-
diac depolarisation and repolarisation. Several different techniques record and analyse the electric processes as a dipole with magnitude and direction. Different lead systems and different numbers of recording leads have been constructed over the years to obtain the most accurate representation of the dipole in all three planes [27, 28]. The most widespread VCG method is based on the lead system designed by Ernest Frank around 50 years ago [29]. The Frank lead system, using eight leads, was constructed after theoretical calculations and remarkably small experi-mental studies of electrical properties, along with skin and thoracic resistance and calculations based on the human.
The VCG technique employed in the three last studies (II-IV) in this thesis is built on the Frank lead system, and it is described in more detail in the Methods section.
Introduction
18
A general description of the VCG technique from a recently published Ph.D. thesis [30] is included below.
“A more accurate vectorial model approximates the heart with a dipolar source placed in a spherical conductor of homogeneous conductivity. The electrical fields generated by the myocytes are vectorially summed to a single resultant with the origin at the center of the dipole. The physical size of the dipole is negligible compared to the conducting sphere. The dipole rotates and the difference in electrical charge between the 2 poles changes. In each moment, three parameters are needed to describe the (electrical) magnitude and direction of the vector. Additional three parameters describe the (geometrical) position of the dipole.”
The amount of electrical potential that is due to heart cell activity and reaches the body surface is relatively small. It seems that only approximately 4 % of the electrical potential that occurs in and around the heart is observed directly in 12 lead ECG signals [28]
It is thought that VCG analysis of ischemia may offer some different types of assessment compared to conventional (precordial) 12 lead ECG, and this has been discussed in detail elsewhere [21, 31]. VCG data provides both a vector magnitude and a spatial direction. During the last two decades, ECG equipment has been available which employs a different tactic, that is, which records standard ECGs, and then based on recalculation indirectly reconstructs the standard ECG signals as vectorcardiograms [32, 33]. Some reasons for this roundabout method have been to expand upon the available standard ECG data and to avoid placing electrodes on the back.
Limitations of the current methods One limitation of both VCG and 12 lead ECG in detection of ischemia is that
there can be physiological factors which are not ischemia but still lead to changes (in the ST segment), which is the mode for ischemia identification. These physio-logical factors are not well characterised as far as systematic effects, but, through anecdotal reports, we know that they can sometimes lead to dramatic ST changes, even when myocardial ischemia is very unlikely or can be ruled out through non-ECG based methods. Factors other then ischemia which affect ECG ST analysis are present in most patients every day in every CCU, and these might include the following (more on this in the Discussion): changes in autonomic nervous system activity, changes in electrolyte concentration or balance across the cell membrane (i.e. potassium), body position or habitus, etc.
What is our local tradition for methodological testing and evaluation ? In the laboratory, and sometimes even in the clinical laboratory (or operating
room) we also try to measure through the best means possible whether ischemia is actually present or not. To this end an optimal reference method is mandatory for
Introduction
19
evaluation of clinically available non-invasive methods as VCG. A well-known fact from studies with exercise and an important observation in previous VCG studies [34] was the great ST vector changes occurring during marked increases in heart rate [35]. Furthermore, in the literature there is a lack of studies concerning HR relation to ST segment change in healthy subjects or in patients with verified ischemia. These topics became the scientific focus during the development of the individual studies which contributed to this thesis.
Heart rate adjustments Adjustments of ST-deviations for increases in heart rate during exercise ECG
were proposed already 25 years ago [36] in order to enhance the discrimination between myocardial ischemia and physiological ST changes during conditions of increased heart rate. Despite this, there is no consensus concerning the diagnostic and predictive value of adjustments of ST-segment changes for increases in heart rate. Several studies with exercise and 12-lead ECG have proposed an ST/HR index and ST slope for compensation of heart rate increases [35, 37-43]. Criteria for detection of ischemia with VCG have been empirically described without refer-ence to heart rate [2, 41, 44]. There are no previous studies using VCG which have been specifically designed to analyse the systematic impact of heart rate changes on VCG ST parameters. However, a relationship between VCG deviations and heart rate has been suggested based on observations from 2 exercise levels in pa-tients with ischemic heart disease and for pacing controlled heart rates at 2 levels [41], but the type of relation and its nature has not yet been well characterised. The present thesis focuses on evaluating myocardial ischemia detection with VCG and its relation to heart rate changes after initially examining ischemia detection with multiple clinical methods.

Aims of the thesis
20
AIMS OF THE THESIS
Hypotheses:
• The different (‘operating room’) clinical methods (hemodynamics, ECG,
mechanical wall motion, and metabolic measurements) have a strong concordance during ischemia assessment (I).
• There is a HR-dependent effect on ECG ST segments in the absence of
ischemia, and this can be demonstrated with VCG (II,III). • HR effects on VCG ST value do not vary in relation to different J point-ST
time intervals (II, and as regards unpublished results included in the thesis). • ST vector changes occur during HR elevation in a ST range generally accepted
to indicate myocardial ischemia. These ST changes occur simultaneously to increases in local metabolic activity during heart rate increase, but are not caused by ischemia (II, IV).
• During myocardial ischemia caused by increased myocardial work (coronary
artery stenosis), heart rate increase and ischemia both provide independent contributions to VCG ST changes (IV).
• ST vector angle changes in response to HR (II, III, IV) and in response to
ischemia (III, IV) • Empirically derived static ST vector criteria for the detection of myocardial
ischemia are not generally valid/reliable for different dynamic clinical conditions (II, IV).
Aims of the thesis
21
Specific Aims:
• To measure simultaneously hemodynamics, ECG, mechanical wall
motion, and metabolic parameters during anesthesia and surgery in patients with high risk for myocardial ischemia (I).
• To measure VCG ST parameters during experimentally-induced heart
rate changes in patients with no ischemic heart disease (II, IV)) • To measure VCG ST parameters at different HRs and with different
time intervals from J point to ST measurement (II, and as regards unpublished results included in the thesis).
• To measure local and regional metabolic conditions and potassium
simultaneously with VCG ST parameters during increasing HR intervals in non-ischemic conditions (III).
• To measure the relation of ST vector parameters to myocardial ischemia
during experimental increases in HR in anesthetised patients with or without ischemic heart disease (IV).
• To describe the performance of established ST vector criteria for
myocardial ischemia in anesthetised patients with or without coronary artery disease (IV).
• To investigate the sensitivity, specificity and diagnostic accuracy of ST
vector parameters in a subgroup of anesthetised patients with evidence of myocardial ischemia as assessed by lactate analyses of samples from the great cardiac vein and arterial blood (IV).
Review of methods
22
REVIEW OF METHODS
Material
All studies including human subjects were approved by the Umeå University Research Ethics Committee (now called The Regional Ethical Review Board in Umeå) and patients provide informed consent. The study involving animals (III) was approved by the Umeå University Research Ethics Committee (now called the Umeå djurförsöksetiska nämnd)
Patient based studies (I, II, and IV) No patient participated in more than one of these studies. In Study I, 53 adult
vascular surgical patients with CAD were prospectively enrolled, during the study period 1986-1988. One or more of the following was used to identify CAD patients: angina + positive stress ECG, previous MI, positive dipyridamole-thal-lium scintigraphy, or angina + positive coronary artery angiogram.
In Study II, 18 consecutive adult patients scheduled for ablation therapy for atrioventricular (AV) nodal re-entrant tachycardia were enrolled. Entry criteria being under 55 years of age with no history of angina, or over 55 years with a normal coronary angiogram. Exclusion criteria included abnormal ECG (including a delta wave), and left ventricular (LV) hypertrophy by ultrasound.
In Study IV, 45 consecutive patients from our hospital’s scheduled thoracic and vascular surgery operation list were enrolled. Inclusion criteria for CAD group (n=35) were angiographically confirmed 2 or 3 vessel coronary artery disease, including a proximal left anterior descending (LAD) artery stenosis. Also, non-CAD patients (n=10), who were scheduled for elective heart valve or aortic surgery were enrolled.
Study III, an animal study Thirteen locally raised Hampshire-Yorkshire juvenile pigs (around 40 kg) were
used.
Preparation
Studies I and IV. Subjects were premedicated, anesthetised in a standardised fashion preoperatively (in the operating room), and were studied before the start of surgery. Vascular catheterisation was performed, including a CS catheter which was placed in a position with the tip in the great cardiac vein (GCV), in order to sample blood from an area of the heart supplied by the LAD artery. The CS catheter contained both a blood sampling port and bipolar pacing electrodes. In Study IV, thermistors for thermodilution flow measurement were also present on the catheter tip.
Study II. The patients were awake and were resting at the conclusion of their radiofrequency ablation procedure in the catheterisation laboratory. A CS catheter
Review of methods
23
with a pacing electrode and blood sampling port was placed with the tip in the CS (in five patients). In the rest of the patients, right atrial pacing was used, with a transvenous pacing wire.
Study III. Animals were premedicated and anesthetised for acute experiments. Central vascular catheterisation was performed (see Study III for details). After a median sternotomy, microdialysis catheters were placed in the left ventricular ante-rior wall. A miniaturised Clark oxygen sensing electrode was also placed in the LV wall. A CS thermodilution catheter was placed with the tip in the GCV. Epicardial pacing electrodes were sewn to the right atrial appendage. The ster-notomy was closed. A subgroup of animals was studied without sternotomy and microdialysis.
Measurement methods
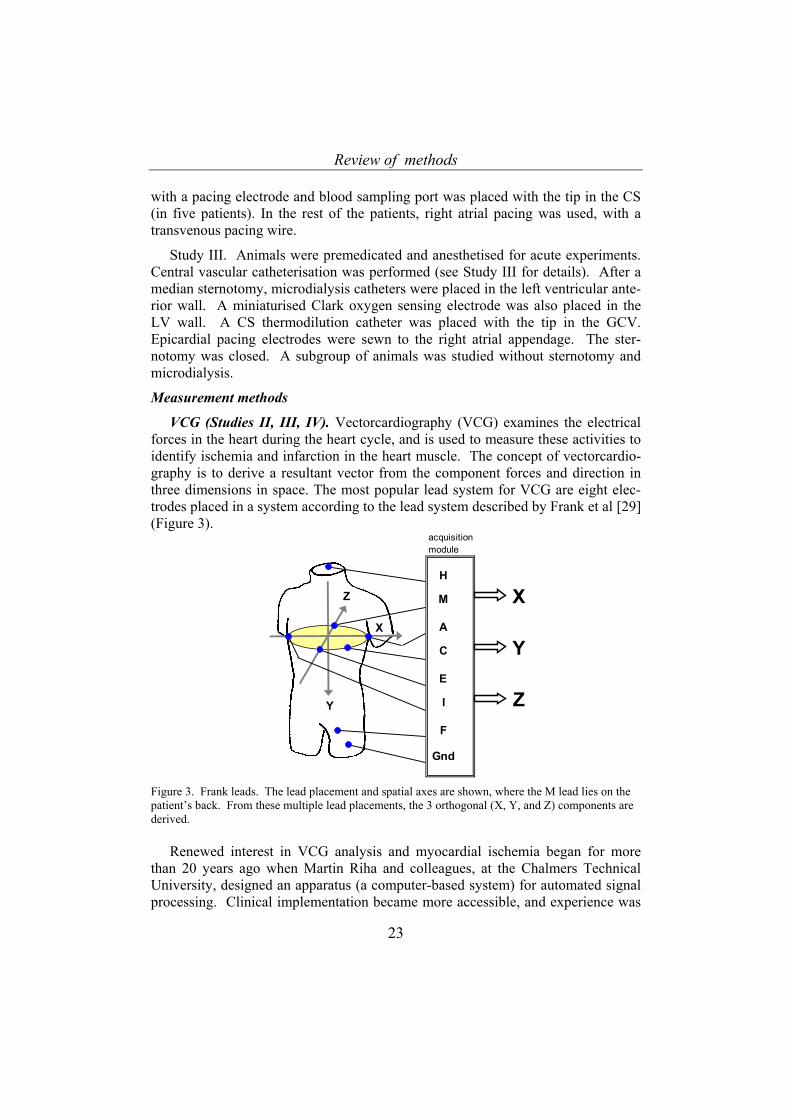
VCG (Studies II, III, IV). Vectorcardiography (VCG) examines the electrical forces in the heart during the heart cycle, and is used to measure these activities to identify ischemia and infarction in the heart muscle. The concept of vectorcardio-graphy is to derive a resultant vector from the component forces and direction in three dimensions in space. The most popular lead system for VCG are eight elec-trodes placed in a system according to the lead system described by Frank et al [29] (Figure 3).
acquisitionmodule
H
M XA
C YE
I ZF
Gnd
Z
Y
X
Figure 3. Frank leads. The lead placement and spatial axes are shown, where the M lead lies on the patient’s back. From these multiple lead placements, the 3 orthogonal (X, Y, and Z) components are derived.
Renewed interest in VCG analysis and myocardial ischemia began for more than 20 years ago when Martin Riha and colleagues, at the Chalmers Technical University, designed an apparatus (a computer-based system) for automated signal processing. Clinical implementation became more accessible, and experience was
Review of methods
24
acquired with this new type of system, which acquired many ‘pet’ VCG names such as ‘computerised’, ‘on-line’, ‘continuous’, ‘dynamic’, ‘quantitative’, ‘monitoring’, ‘computer-assisted’, and others terms. All these referred to this original system which collected signals using a computer system, and allowed some forms of signal processing (averaging and sorting), as well as storage for repeated analysis, and rapid access to processed signals at the bedside. There was much scientific activity to acquire experience with this [45-47], and the basis for our current clinical implementation of the VCG methods was established. During the last decade, there have been refinements in how VCG is interpreted to detect myocardial ischemia and infarction [22-23, 34, 48-57].
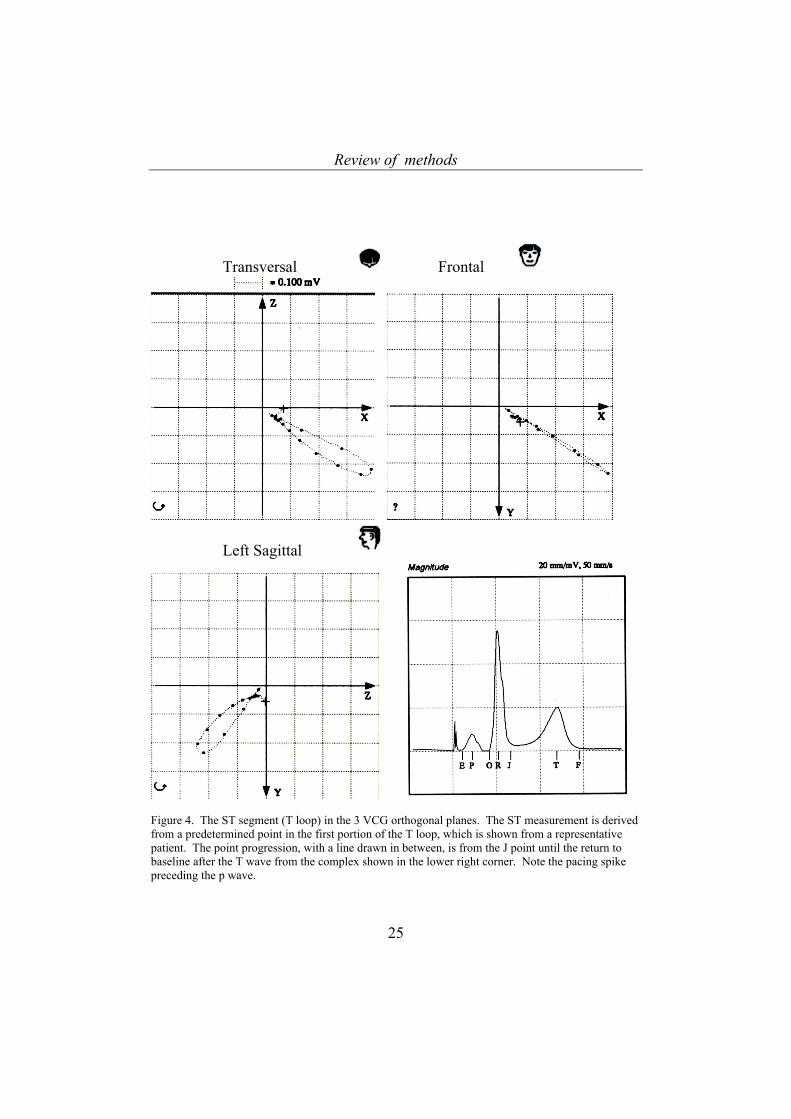
The MIDA 1000 vectorcardiography system, with MIDA 1000 2.74 software, was used for recording VCG. The signals were sampled at 500 Hz in three orthogonal components: X, Y and Z (Figure 4). During the baseline period, all complexes were recorded and averaged for a period of 2 minutes. The averaged complexes were sorted into reference classes, from which an active class with a large majority of recorded complexes was chosen. This chosen complex was then used as a template to automatically select beats for ST segment measurement [9, 58]. After the baseline template was established, periods of 15 seconds were used to generate an averaged heart cycle signal. For averaged complexes, the measure-ment sensitivity was 1.0 microvolts (µV). For each 4 minute pacing period, the second and third minutes in each period were analysed.
Review of methods
25
Transversal Frontal
Left Sagittal
Figure 4. The ST segment (T loop) in the 3 VCG orthogonal planes. The ST measurement is derived from a predetermined point in the first portion of the T loop, which is shown from a representative patient. The point progression, with a line drawn in between, is from the J point until the return to baseline after the T wave from the complex shown in the lower right corner. Note the pacing spike preceding the p wave.
Review of methods
26
The VCG ST vector trend variables were automatically derived from measured voltages in the X-, Y- and Z-leads for ST at J+20 msec and J+60 msec. From this summary complex, the ST vector at J+0 msec was derived by reading the X, Y and Z magnitudes at the J point, and then calculating the ST vector variables ST-VM and STC-VM. The absolute ST vector magnitude was calculated as follows.
ST-VM = 222 ZYX ++ in microvolts (µV) The relative spatial difference between reference and current ST vector was
calculated as follows.
STC-VM = 20
20
20 )()()( ZZYYXX iii −+−+− in microvolts (µV)
where the ‘0’ subscript represents the baseline reference measurement, and the ‘i’ subscript represents the current measurement.
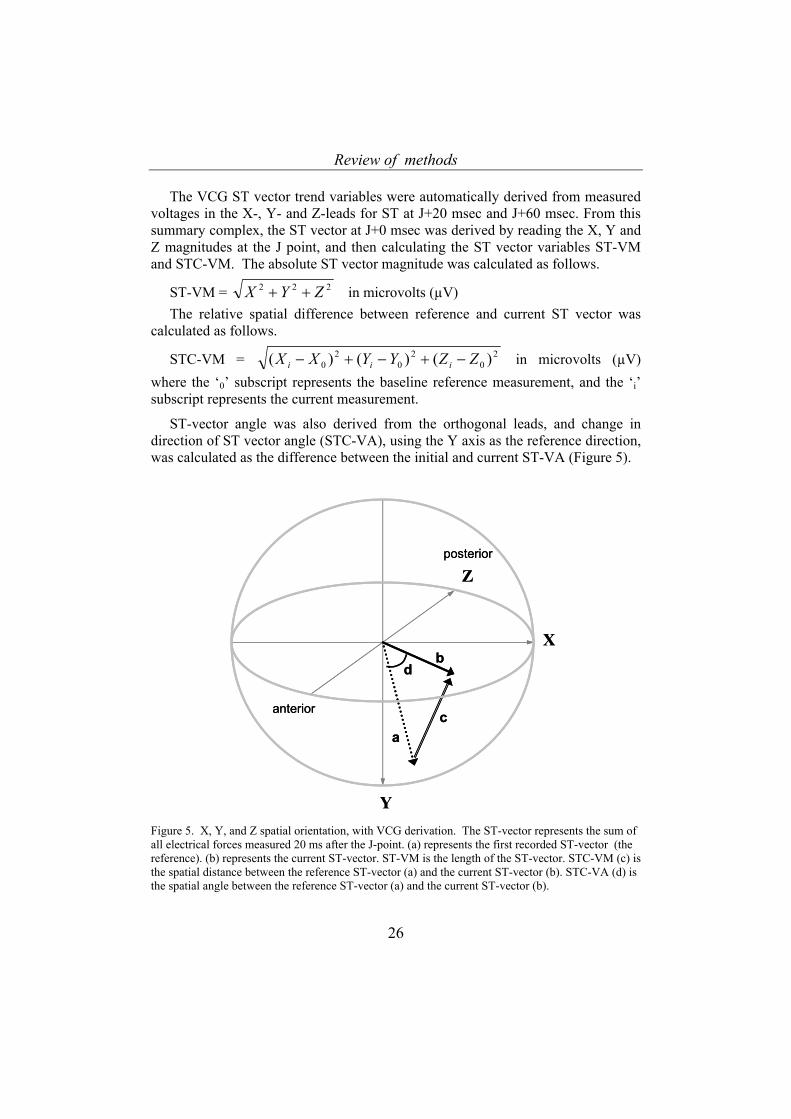
ST-vector angle was also derived from the orthogonal leads, and change in direction of ST vector angle (STC-VA), using the Y axis as the reference direction, was calculated as the difference between the initial and current ST-VA (Figure 5).
X
Y
Z
a
b
c
d
posterior
anterior
X
Y
Z
a
b
c
d
posterior
anterior
Figure 5. X, Y, and Z spatial orientation, with VCG derivation. The ST-vector represents the sum of all electrical forces measured 20 ms after the J-point. (a) represents the first recorded ST-vector (the reference). (b) represents the current ST-vector. ST-VM is the length of the ST-vector. STC-VM (c) is the spatial distance between the reference ST-vector (a) and the current ST-vector (b). STC-VA (d) is the spatial angle between the reference ST-vector (a) and the current ST-vector (b).
Review of methods
27
J+20
J+60
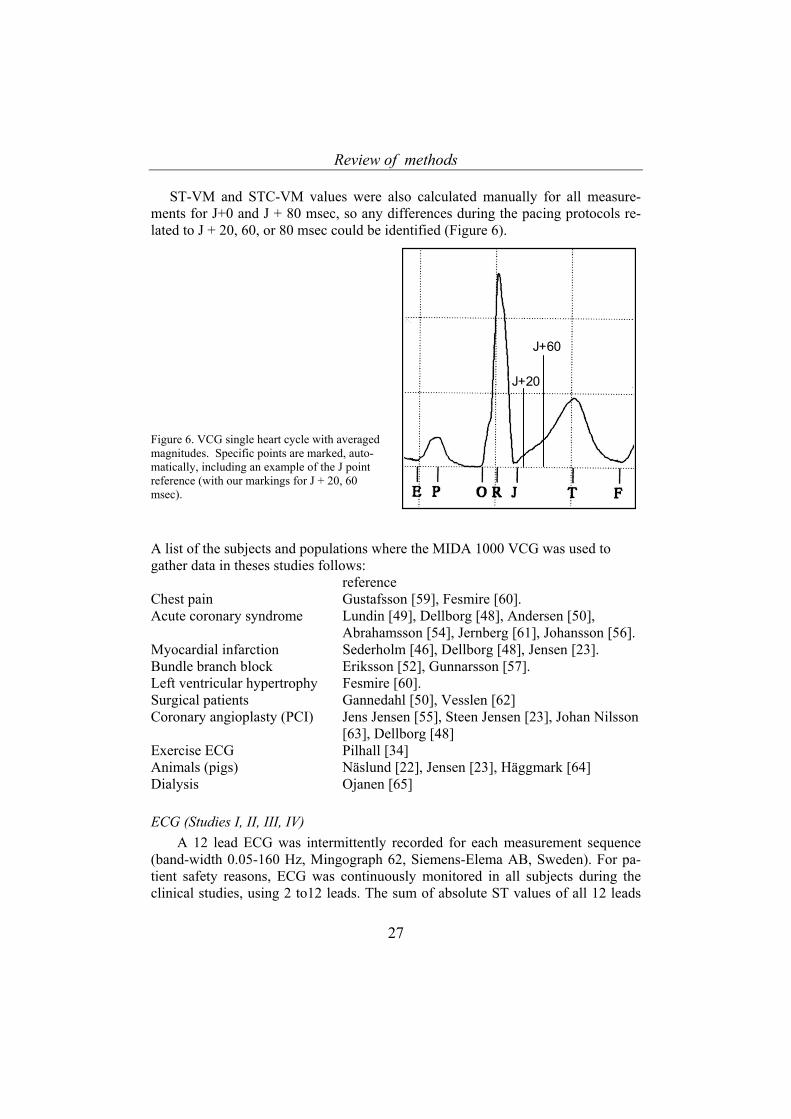
ST-VM and STC-VM values were also calculated manually for all measure-ments for J+0 and J + 80 msec, so any differences during the pacing protocols re-lated to J + 20, 60, or 80 msec could be identified (Figure 6).
Figure 6. VCG single heart cycle with averaged magnitudes. Specific points are marked, auto-matically, including an example of the J point reference (with our markings for J + 20, 60 msec).
A list of the subjects and populations where the MIDA 1000 VCG was used to gather data in theses studies follows: reference Chest pain Gustafsson [59], Fesmire [60]. Acute coronary syndrome Lundin [49], Dellborg [48], Andersen [50],
Abrahamsson [54], Jernberg [61], Johansson [56]. Myocardial infarction Sederholm [46], Dellborg [48], Jensen [23]. Bundle branch block Eriksson [52], Gunnarsson [57]. Left ventricular hypertrophy Fesmire [60]. Surgical patients Gannedahl [50], Vesslen [62] Coronary angioplasty (PCI) Jens Jensen [55], Steen Jensen [23], Johan Nilsson
[63], Dellborg [48] Exercise ECG Pilhall [34] Animals (pigs) Näslund [22], Jensen [23], Häggmark [64] Dialysis Ojanen [65] ECG (Studies I, II, III, IV)
A 12 lead ECG was intermittently recorded for each measurement sequence (band-width 0.05-160 Hz, Mingograph 62, Siemens-Elema AB, Sweden). For pa-tient safety reasons, ECG was continuously monitored in all subjects during the clinical studies, using 2 to12 leads. The sum of absolute ST values of all 12 leads
Review of methods
28
A B
(ECGsum STchange) was measured (Study IV) [21, 66]. Minimum absolute ST devia-tion was noted for changes of 0.5 mm (0.05 mV).
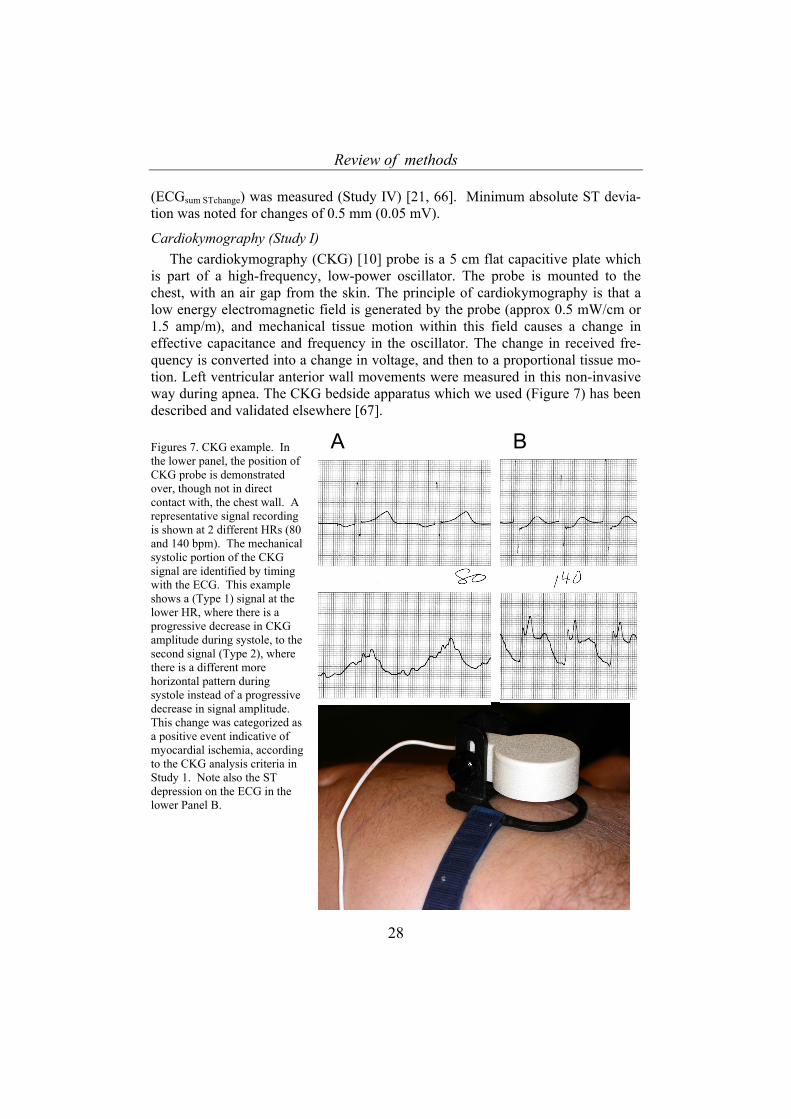
Cardiokymography (Study I) The cardiokymography (CKG) [10] probe is a 5 cm flat capacitive plate which
is part of a high-frequency, low-power oscillator. The probe is mounted to the chest, with an air gap from the skin. The principle of cardiokymography is that a low energy electromagnetic field is generated by the probe (approx 0.5 mW/cm or 1.5 amp/m), and mechanical tissue motion within this field causes a change in effective capacitance and frequency in the oscillator. The change in received fre-quency is converted into a change in voltage, and then to a proportional tissue mo-tion. Left ventricular anterior wall movements were measured in this non-invasive way during apnea. The CKG bedside apparatus which we used (Figure 7) has been described and validated elsewhere [67]. Figures 7. CKG example. In the lower panel, the position of CKG probe is demonstrated over, though not in direct contact with, the chest wall. A representative signal recording is shown at 2 different HRs (80 and 140 bpm). The mechanical systolic portion of the CKG signal are identified by timing with the ECG. This example shows a (Type 1) signal at the lower HR, where there is a progressive decrease in CKG amplitude during systole, to the second signal (Type 2), where there is a different more horizontal pattern during systole instead of a progressive decrease in signal amplitude. This change was categorized as a positive event indicative of myocardial ischemia, according to the CKG analysis criteria in Study 1. Note also the ST depression on the ECG in the lower Panel B.
Review of methods
29
Hemodynamics (Studies I, II, III, IV) Routine mechanical fluid filled catheter systems were employed (for details see
Studies). Arterial, central venous, pulmonary artery and pulmonary artery wedge pressures were recorded on either an analog (paper trace, different machine systems for each study) or digitally (see Studies for specific details) [16].
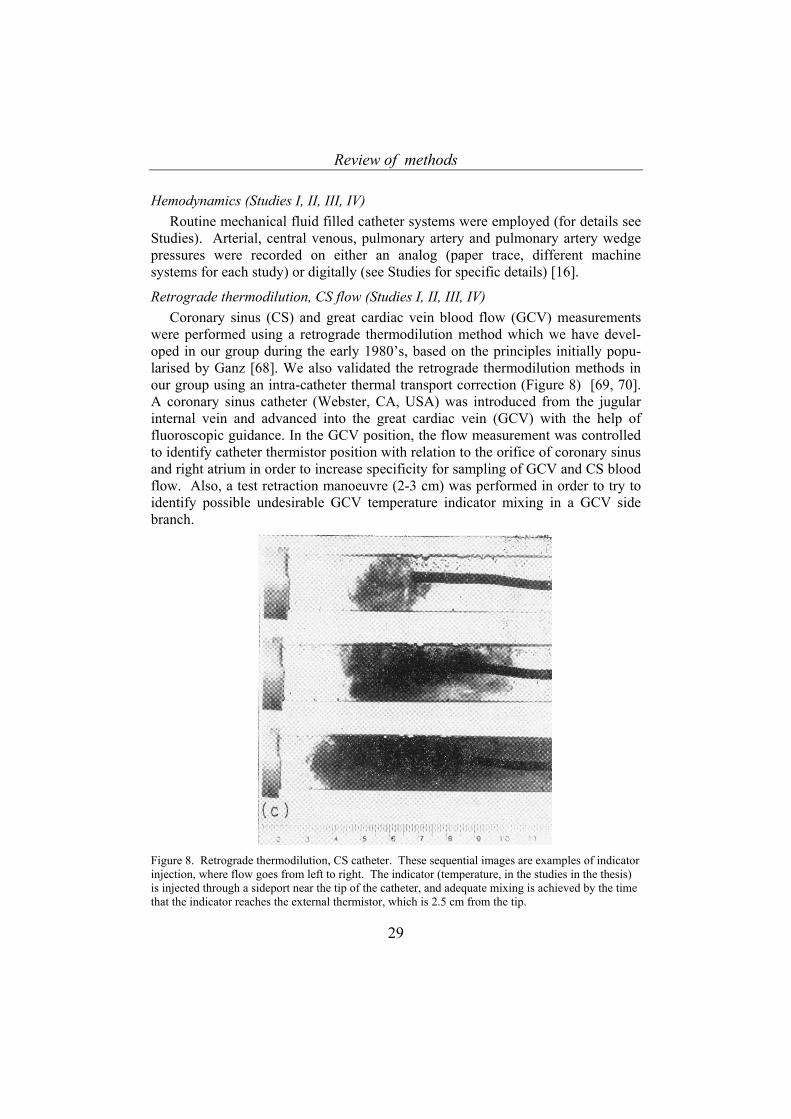
Retrograde thermodilution, CS flow (Studies I, II, III, IV) Coronary sinus (CS) and great cardiac vein blood flow (GCV) measurements
were performed using a retrograde thermodilution method which we have devel-oped in our group during the early 1980’s, based on the principles initially popu-larised by Ganz [68]. We also validated the retrograde thermodilution methods in our group using an intra-catheter thermal transport correction (Figure 8) [69, 70]. A coronary sinus catheter (Webster, CA, USA) was introduced from the jugular internal vein and advanced into the great cardiac vein (GCV) with the help of fluoroscopic guidance. In the GCV position, the flow measurement was controlled to identify catheter thermistor position with relation to the orifice of coronary sinus and right atrium in order to increase specificity for sampling of GCV and CS blood flow. Also, a test retraction manoeuvre (2-3 cm) was performed in order to try to identify possible undesirable GCV temperature indicator mixing in a GCV side branch.
Figure 8. Retrograde thermodilution, CS catheter. These sequential images are examples of indicator injection, where flow goes from left to right. The indicator (temperature, in the studies in the thesis) is injected through a sideport near the tip of the catheter, and adequate mixing is achieved by the time that the indicator reaches the external thermistor, which is 2.5 cm from the tip.
Review of methods
30
Blood gases (Studies III, IV) Blood was intermittently sampled from arterial and GCV simultaneously,
immediately before coronary blood flow measurements were performed in order to allow optimal calculations of MVO2 (see calculations below). The blood gases were analysed (ABL4 and ABL5, Radiometer, Copenhagen, Denmark) in Studies III and IV. To ensure stability of blood gases, if there was a delay until measure-ment, glass syringes were stored in an ice water bath until the analyses were per-formed. All blood gases were analysed within 1 hour after collection. This delay was due to limited access to a bedside blood gas analysis machine in our institu-tion. In Study III blood gases were analysed within 2 minutes of sampling.
Hemoximetry (Studies III, IV) Oxyhemoglobin percent was measured using a hemoximeter (OSM III, Radi-
ometer, Copenhagen, Denmark). In Study III, the hemoximeter was calibrated for animal (pig) blood. Hemoglobin concentration was also determined from the same sample, also in the OSM III.
Myocardial oxygen consumption (MVO2) (Studies III, IV) Left ventricular myocardial oxygen consumption (LV MVO2) was calculated as
GCV flow x myocardial arterio-venous oxygen content difference (ml O2 · min-1), measured through simultaneous blood sampling from the GCV and the radial artery as described above in section blood gases [14, 71-73].
Myocardial oxygen consumption was calculated in these studies as follows:
CaO2 = (aHbO2/100) · aHb · 1.39) + (PaO2 · 0.23); (ml/l)
CgcvO2 = (gcvHbO2/100) · gcvHb · 1.39) + (PgcvO2 · 0.23); (ml/l)
LVMVO2 = QGCV /1000 · (CaO2 - CgcvO2); (ml/min)
Blood lactate concentration (Studies I, II, III, IV) In these studies, the CS or GCV blood sampling was performed at the same
time as arterial blood sampling in order to determine a simultaneous difference in transcoronary lactate concentration. Myocardial lactate arterio-venous differences (a-vlactate diff) were calculated. Lactate extraction (%) was calculated as (a-vlactate diff)/arterial lactate concentration). GCV-flow myocardial net flux (GCVflux) was also calculated (a-vlactate diff x GCV flow) [72, 74-77]. Whole blood lactate analyses were immediately performed in the operating room or in the experimental lab (Yellow Springs Lactate Analyzer 1500, Ohio, USA, Study II, III, IV) and with a Roche lactate analyzer 640 (enzy-matic and electrochemical oxidation method) in Study I .
A separate analysis of variability in whole blood lactate analyses was per-formed from a total of 212 samples in our lab using repeated measures. Internal
Review of methods
31
validation of our total lactate sampling, processing, and measuring procedure (us-ing triple samples) demonstrated a variation of ± 0.01 mmol/l, with a coefficient of variance of 2.6% (95% confidence interval 2.26 - 2.94).
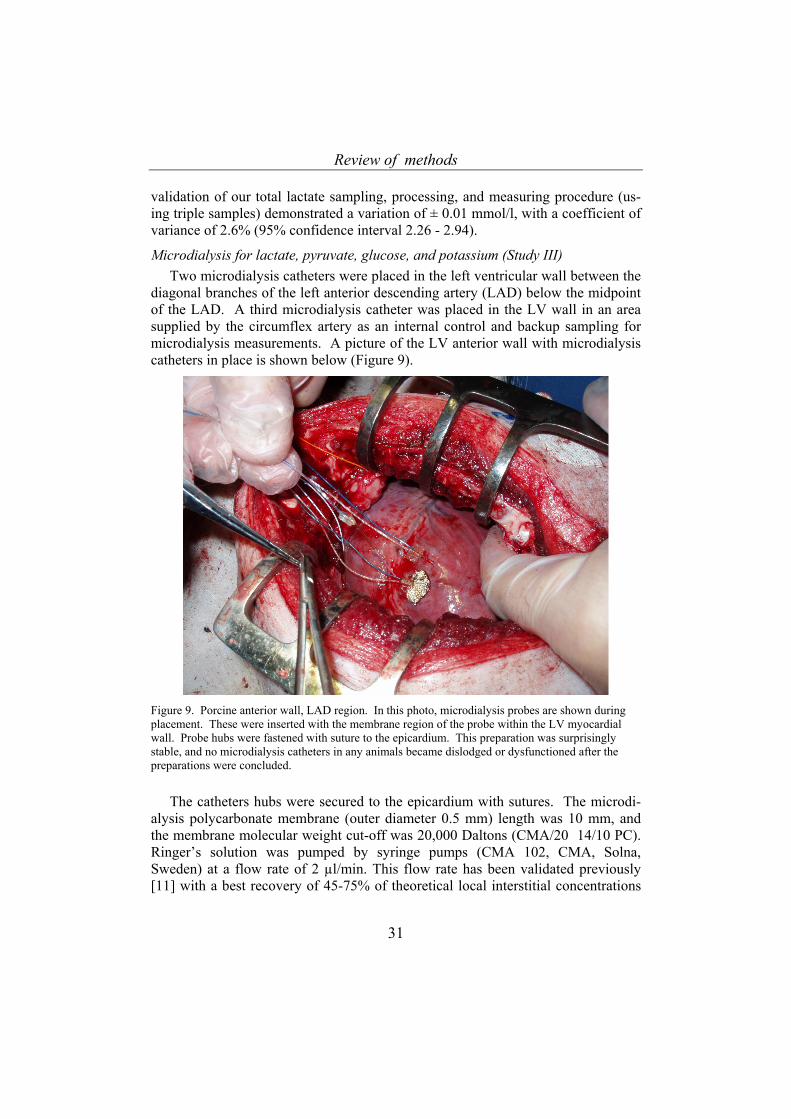
Microdialysis for lactate, pyruvate, glucose, and potassium (Study III) Two microdialysis catheters were placed in the left ventricular wall between the
diagonal branches of the left anterior descending artery (LAD) below the midpoint of the LAD. A third microdialysis catheter was placed in the LV wall in an area supplied by the circumflex artery as an internal control and backup sampling for microdialysis measurements. A picture of the LV anterior wall with microdialysis catheters in place is shown below (Figure 9).
Figure 9. Porcine anterior wall, LAD region. In this photo, microdialysis probes are shown during placement. These were inserted with the membrane region of the probe within the LV myocardial wall. Probe hubs were fastened with suture to the epicardium. This preparation was surprisingly stable, and no microdialysis catheters in any animals became dislodged or dysfunctioned after the preparations were concluded.
The catheters hubs were secured to the epicardium with sutures. The microdi-alysis polycarbonate membrane (outer diameter 0.5 mm) length was 10 mm, and the membrane molecular weight cut-off was 20,000 Daltons (CMA/20 14/10 PC). Ringer’s solution was pumped by syringe pumps (CMA 102, CMA, Solna, Sweden) at a flow rate of 2 µl/min. This flow rate has been validated previously [11] with a best recovery of 45-75% of theoretical local interstitial concentrations
Review of methods
32
of the analysed metabolites. Dialysate was collected in individual tubes at 10 min-ute intervals.
The CMA 600 Microdialysis Analyzer was used for assessment of glucose, lactate, and pyruvate for each measurement, with samples in plastic tubes. Potas-sium [K+] concentration was analysed in the microdialysate, where the samples were diluted with ion-filtered water from 20 µl to 5000 µl (250 times) and analysed by a certified commercial laboratory which employed a quantitative flame atomic absorption spectroscopy detection method (Perkin-Elmer Analyser 100, Boston, Massachusetts, USA). The laboratory’s estimated variation in measurement was reported as 5% at detected levels of 4 mmol/l.
Tissue partial pressure oxygen (Study III) Myocardial (LV anterior wall) tissue partial pressure of oxygen (O2) was
measured using a miniaturised Clark electrode placed inside of a semipermeable membrane inside a fine catheter designed for this purpose (REVOXODE probe, LICOX, GMS, Kiel-Mielkendorf, Germany ). This measurement reflected O2 par-tial pressure in the extracellular compartment, which was a type of balance result of local O2 delivery and consumption. The catheter was pulled through the anterior LV wall, using a second protective catheter, and the sensing surface was secured within the substance of the ventricular wall near the apex. The LICOX temperature probe was placed in the pericardium for temperature calibration of signal. A equilibration and stabilisation period of 20-30 min was observed before a stable baseline was established. The method has very rapid response time for changes (a brief second), and is widely recognised to be very sensitive to small changes in location and local O2 partial pressure differences [78].
Experimental protocols
All 4 studies included an incidental (Study I) or experimental provocation (Studies II, III, IV) of myocardial ischemia (or presumed ischemia) or a heart rate provocation in the confirmed or presumed absence of ischemia. In Study I, surgi-cal stimulation for a planned operation in an anesthetised subject (patient) was the provocation for an acute adrenergic response, and myocardial ischemia was pre-sumed (but not confirmed by an independent method). Data was collected at pre-determined steps during anesthesia and surgery: prior to anesthesia, after tracheal intubation, prior to surgical incision, and 10 and 30 minutes after incision. These points in the course of the operation were chosen based on prediction of increased sympathetic nervous system activity in connection with surgical (or other) physical stress, where this was presumed to in some patients provoke myocardial ischemia [79, 80].
In Studies II and III, heart rate provocation (increase) was performed without ischemia (presumed absence of ischemia) in awake subjects (II), and in anesthe-tised animals (III). In Study IV, heart rate (increase) was employed as a myocar-
Review of methods
33
dial load increase provocation with either ischemia (confirmed) or non-ischemia (confirmed) in anesthetised subjects.
Common to Studies II, III, IV was a step-wise increase in HR by atrial pacing with serial measures of hemodynamics and multiple myocardial ischemia detection parameters, with or without a second intervention with a certain myocardial ische-mia provocation.
In Studies II, III, and IV, the protocol design was largely similar. The protocols were designed to systematically increase HR. In Study IV, heart rate increases were also achieved to induce myocardial ischemia in CAD subjects. Data was collected at a baseline HR (or a baseline paced HR), and then at predetermined intervals during pacing-controlled HR integral steps (increases). The exact HR steps and time intervals at each HR level was unique to each protocol, though they were similar in that there were multiple HR steps, and 6-10 minutes at each step, which allowed a full hemodynamic and metabolic dataset collection.
Analysis
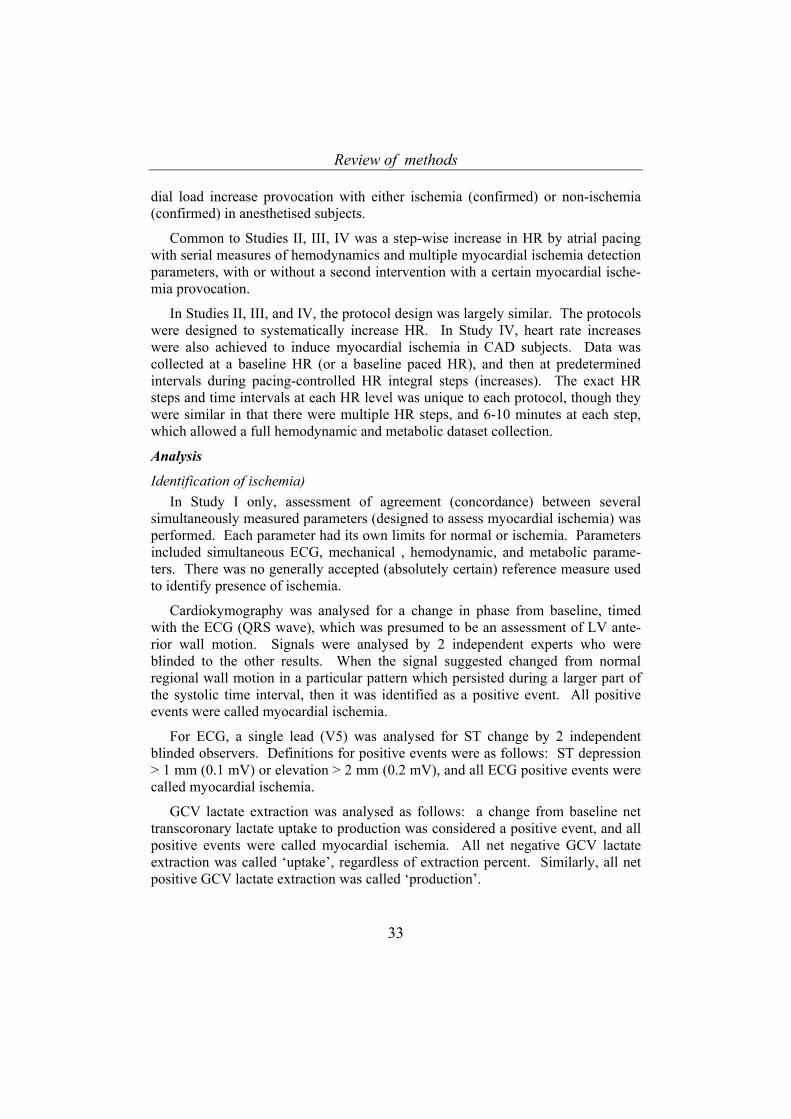
Identification of ischemia) In Study I only, assessment of agreement (concordance) between several
simultaneously measured parameters (designed to assess myocardial ischemia) was performed. Each parameter had its own limits for normal or ischemia. Parameters included simultaneous ECG, mechanical , hemodynamic, and metabolic parame-ters. There was no generally accepted (absolutely certain) reference measure used to identify presence of ischemia.
Cardiokymography was analysed for a change in phase from baseline, timed with the ECG (QRS wave), which was presumed to be an assessment of LV ante-rior wall motion. Signals were analysed by 2 independent experts who were blinded to the other results. When the signal suggested changed from normal regional wall motion in a particular pattern which persisted during a larger part of the systolic time interval, then it was identified as a positive event. All positive events were called myocardial ischemia.
For ECG, a single lead (V5) was analysed for ST change by 2 independent blinded observers. Definitions for positive events were as follows: ST depression > 1 mm (0.1 mV) or elevation > 2 mm (0.2 mV), and all ECG positive events were called myocardial ischemia.
GCV lactate extraction was analysed as follows: a change from baseline net transcoronary lactate uptake to production was considered a positive event, and all positive events were called myocardial ischemia. All net negative GCV lactate extraction was called ‘uptake’, regardless of extraction percent. Similarly, all net positive GCV lactate extraction was called ‘production’.
Review of methods
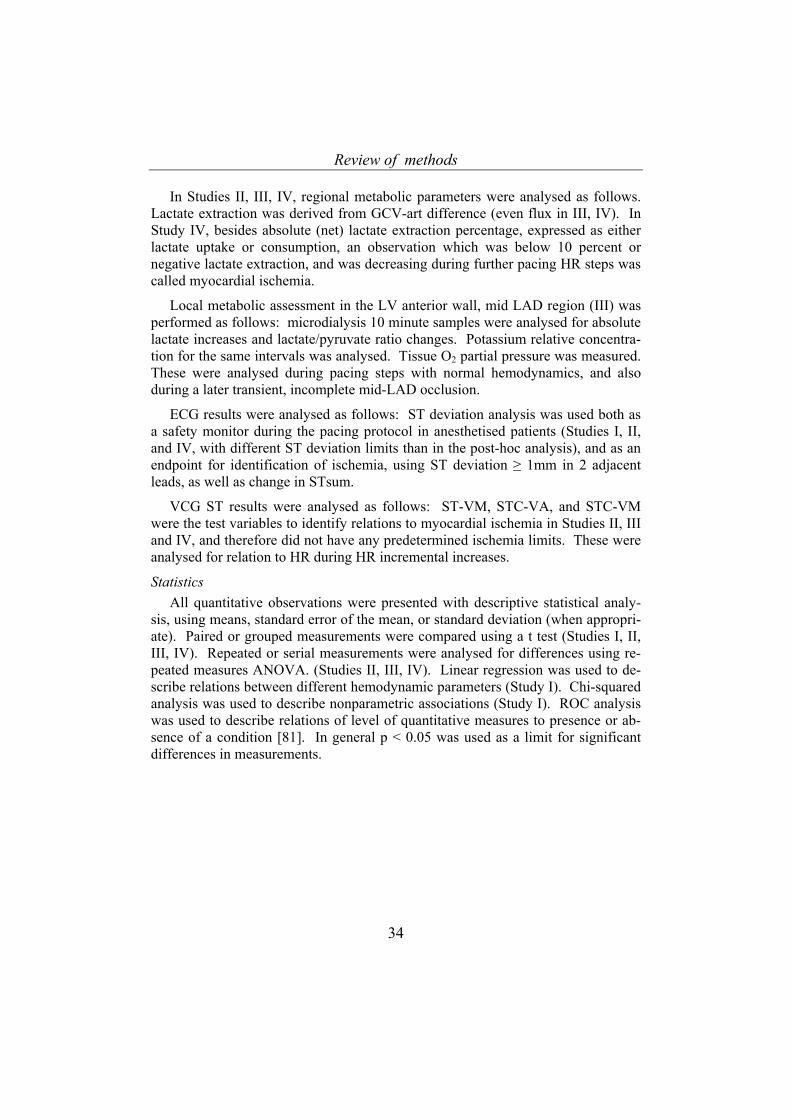
34
In Studies II, III, IV, regional metabolic parameters were analysed as follows. Lactate extraction was derived from GCV-art difference (even flux in III, IV). In Study IV, besides absolute (net) lactate extraction percentage, expressed as either lactate uptake or consumption, an observation which was below 10 percent or negative lactate extraction, and was decreasing during further pacing HR steps was called myocardial ischemia.
Local metabolic assessment in the LV anterior wall, mid LAD region (III) was performed as follows: microdialysis 10 minute samples were analysed for absolute lactate increases and lactate/pyruvate ratio changes. Potassium relative concentra-tion for the same intervals was analysed. Tissue O2 partial pressure was measured. These were analysed during pacing steps with normal hemodynamics, and also during a later transient, incomplete mid-LAD occlusion.
ECG results were analysed as follows: ST deviation analysis was used both as a safety monitor during the pacing protocol in anesthetised patients (Studies I, II, and IV, with different ST deviation limits than in the post-hoc analysis), and as an endpoint for identification of ischemia, using ST deviation ≥ 1mm in 2 adjacent leads, as well as change in STsum.
VCG ST results were analysed as follows: ST-VM, STC-VA, and STC-VM were the test variables to identify relations to myocardial ischemia in Studies II, III and IV, and therefore did not have any predetermined ischemia limits. These were analysed for relation to HR during HR incremental increases.
Statistics All quantitative observations were presented with descriptive statistical analy-
sis, using means, standard error of the mean, or standard deviation (when appropri-ate). Paired or grouped measurements were compared using a t test (Studies I, II, III, IV). Repeated or serial measurements were analysed for differences using re-peated measures ANOVA. (Studies II, III, IV). Linear regression was used to de-scribe relations between different hemodynamic parameters (Study I). Chi-squared analysis was used to describe nonparametric associations (Study I). ROC analysis was used to describe relations of level of quantitative measures to presence or ab-sence of a condition [81]. In general p < 0.05 was used as a limit for significant differences in measurements.
Review of the results
35
REVIEW OF THE RESULTS
Study I
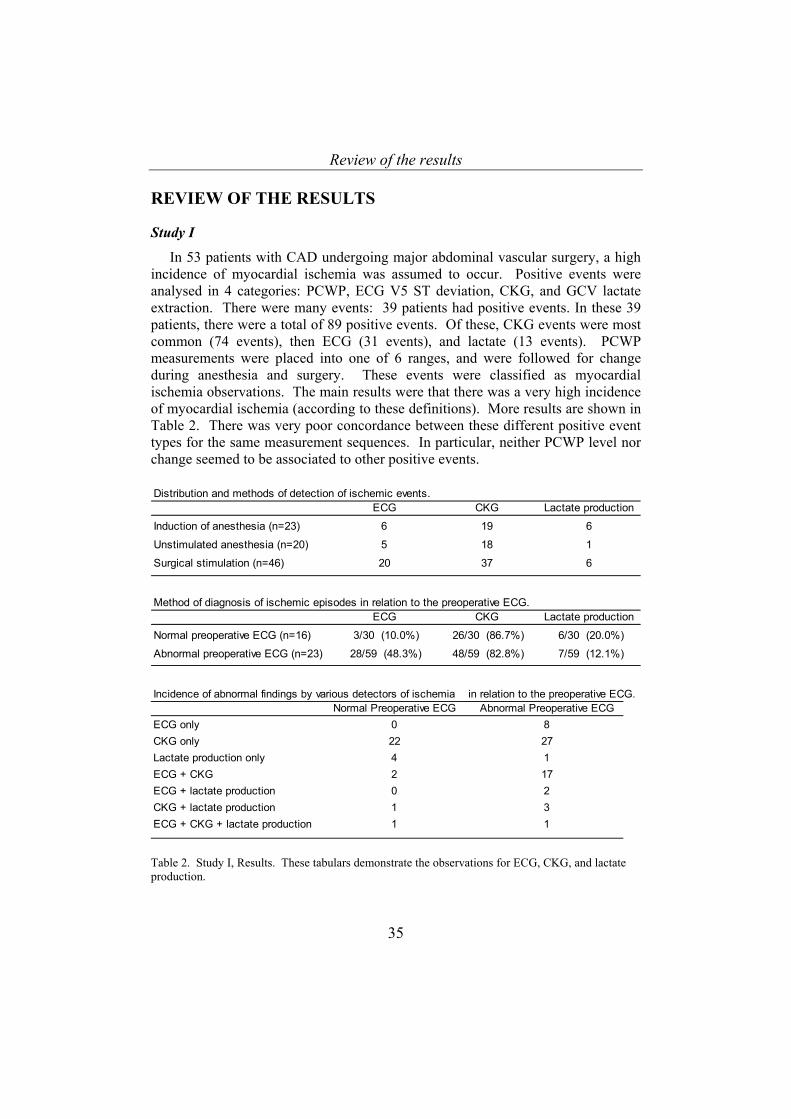
In 53 patients with CAD undergoing major abdominal vascular surgery, a high incidence of myocardial ischemia was assumed to occur. Positive events were analysed in 4 categories: PCWP, ECG V5 ST deviation, CKG, and GCV lactate extraction. There were many events: 39 patients had positive events. In these 39 patients, there were a total of 89 positive events. Of these, CKG events were most common (74 events), then ECG (31 events), and lactate (13 events). PCWP measurements were placed into one of 6 ranges, and were followed for change during anesthesia and surgery. These events were classified as myocardial ischemia observations. The main results were that there was a very high incidence of myocardial ischemia (according to these definitions). More results are shown in Table 2. There was very poor concordance between these different positive event types for the same measurement sequences. In particular, neither PCWP level nor change seemed to be associated to other positive events.
Distribution and methods of detection of ischemic events.
ECG CKG Lactate production
Induction of anesthesia (n=23) 6 19 6
Unstimulated anesthesia (n=20) 5 18 1
Surgical stimulation (n=46) 20 37 6
Method of diagnosis of ischemic episodes in relation to the preoperative ECG.ECG CKG Lactate production
Normal preoperative ECG (n=16) 3/30 (10.0%) 26/30 (86.7%) 6/30 (20.0%)
Abnormal preoperative ECG (n=23) 28/59 (48.3%) 48/59 (82.8%) 7/59 (12.1%)
Incidence of abnormal findings by various detectors of ischemia in relation to the preoperative ECG.Normal Preoperative ECG Abnormal Preoperative ECG
ECG only 0 8CKG only 22 27Lactate production only 4 1ECG + CKG 2 17ECG + lactate production 0 2CKG + lactate production 1 3ECG + CKG + lactate production 1 1
Table 2. Study I, Results. These tabulars demonstrate the observations for ECG, CKG, and lactate production.
Review of the results
36
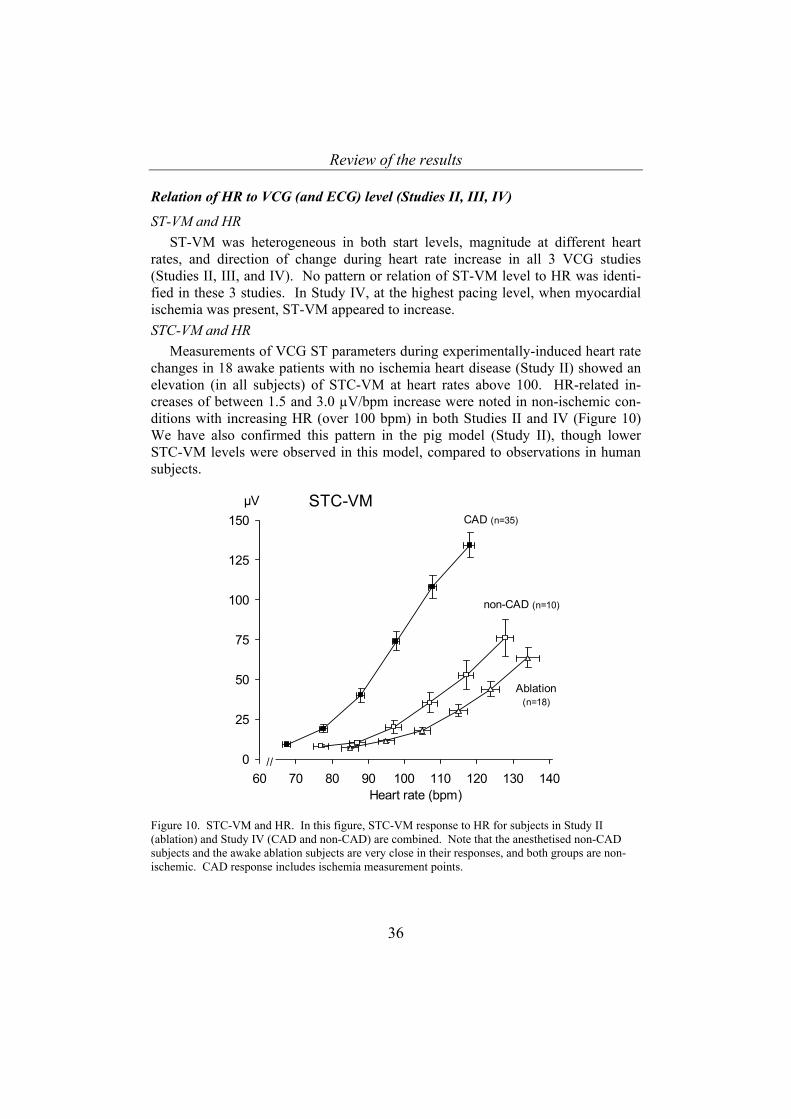
Relation of HR to VCG (and ECG) level (Studies II, III, IV)
ST-VM and HR ST-VM was heterogeneous in both start levels, magnitude at different heart
rates, and direction of change during heart rate increase in all 3 VCG studies (Studies II, III, and IV). No pattern or relation of ST-VM level to HR was identi-fied in these 3 studies. In Study IV, at the highest pacing level, when myocardial ischemia was present, ST-VM appeared to increase. STC-VM and HR
Measurements of VCG ST parameters during experimentally-induced heart rate changes in 18 awake patients with no ischemia heart disease (Study II) showed an elevation (in all subjects) of STC-VM at heart rates above 100. HR-related in-creases of between 1.5 and 3.0 µV/bpm increase were noted in non-ischemic con-ditions with increasing HR (over 100 bpm) in both Studies II and IV (Figure 10) We have also confirmed this pattern in the pig model (Study II), though lower STC-VM levels were observed in this model, compared to observations in human subjects.
0
25
50
75
100
125
150
60 70 80 90 100 110 120 130 140
STC-VMµV
Heart rate (bpm)
//
CAD (n=35)
non-CAD (n=10)
Ablation (n=18)
Figure 10. STC-VM and HR. In this figure, STC-VM response to HR for subjects in Study II (ablation) and Study IV (CAD and non-CAD) are combined. Note that the anesthetised non-CAD subjects and the awake ablation subjects are very close in their responses, and both groups are non-ischemic. CAD response includes ischemia measurement points.
Review of the results
37
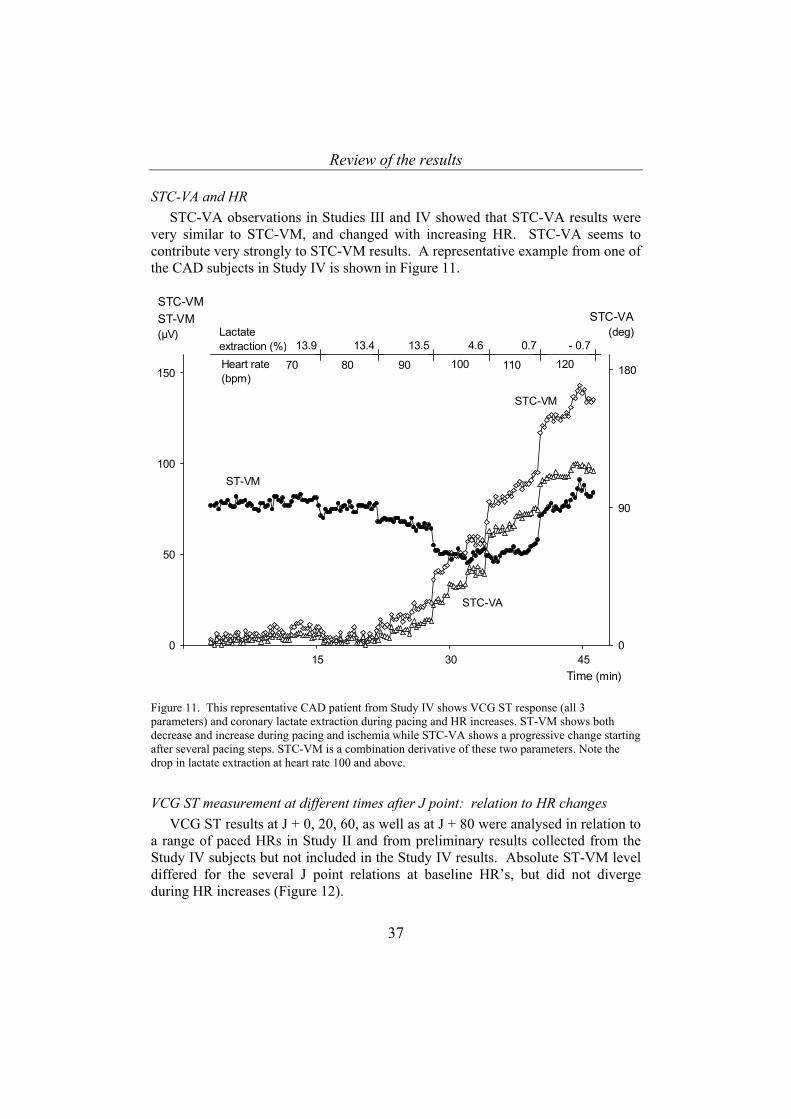
STC-VA and HR STC-VA observations in Studies III and IV showed that STC-VA results were
very similar to STC-VM, and changed with increasing HR. STC-VA seems to contribute very strongly to STC-VM results. A representative example from one of the CAD subjects in Study IV is shown in Figure 11.
0
50
100
150
0
90
180
Time (min)
ST-VM
STC-VM
STC-VA(deg)
STC-VMST-VM(µV)
70 120100
15 30 45
80 90 110
STC-VA
Heart rate (bpm)
Lactate extraction (%) 13.9 13.4 13.5 4.6 0.7 - 0.7
Figure 11. This representative CAD patient from Study IV shows VCG ST response (all 3 parameters) and coronary lactate extraction during pacing and HR increases. ST-VM shows both decrease and increase during pacing and ischemia while STC-VA shows a progressive change starting after several pacing steps. STC-VM is a combination derivative of these two parameters. Note the drop in lactate extraction at heart rate 100 and above.
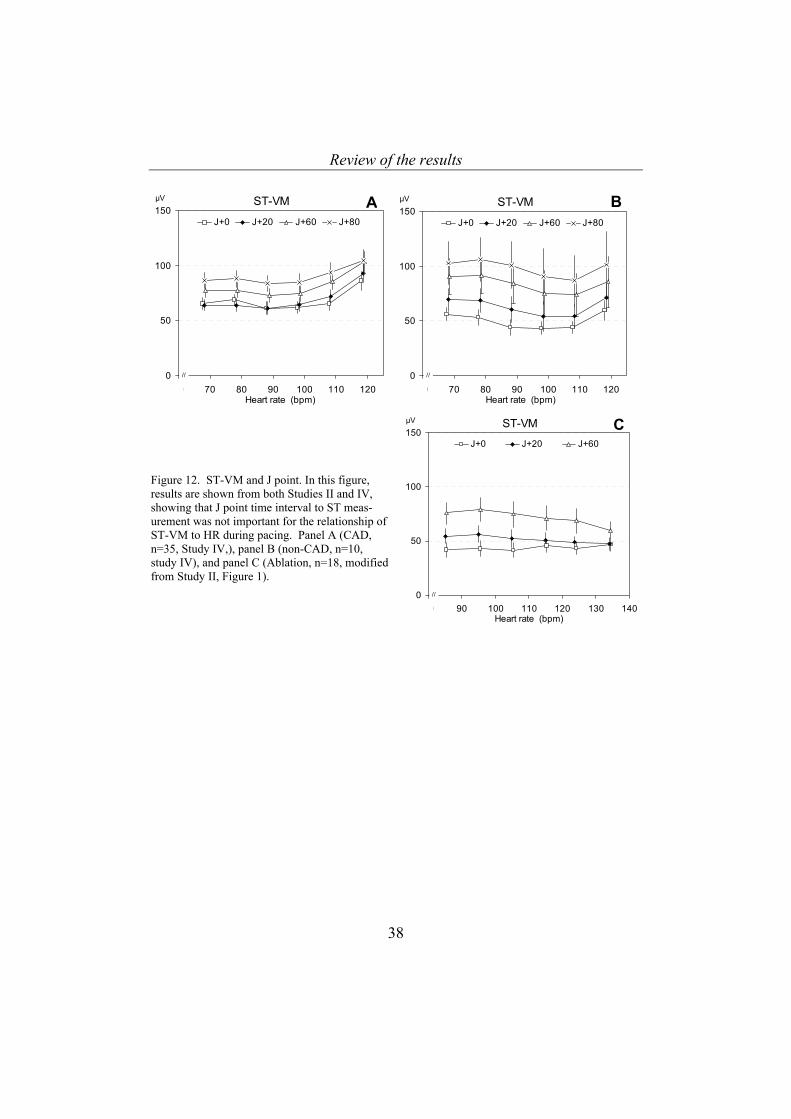
VCG ST measurement at different times after J point: relation to HR changes VCG ST results at J + 0, 20, 60, as well as at J + 80 were analysed in relation to
a range of paced HRs in Study II and from preliminary results collected from the Study IV subjects but not included in the Study IV results. Absolute ST-VM level differed for the several J point relations at baseline HR’s, but did not diverge during HR increases (Figure 12).
Review of the results
38
0
50
100
150
80 90 100 110 120 130 140
J+0 J+20 J+60
Heart rate (bpm)
ST-VMµV
//
C
0
50
100
150
60 70 80 90 100 110 120
J+0 J+20 J+60 J+80
Heart rate (bpm)
ST-VMµV
//
A
0
50
100
150
60 70 80 90 100 110 120
J+0 J+20 J+60 J+80
Heart rate (bpm)
ST-VMµV
//
B
Figure 12. ST-VM and J point. In this figure, results are shown from both Studies II and IV, showing that J point time interval to ST meas-urement was not important for the relationship of ST-VM to HR during pacing. Panel A (CAD, n=35, Study IV,), panel B (non-CAD, n=10, study IV), and panel C (Ablation, n=18, modified from Study II, Figure 1).
Review of the results
39
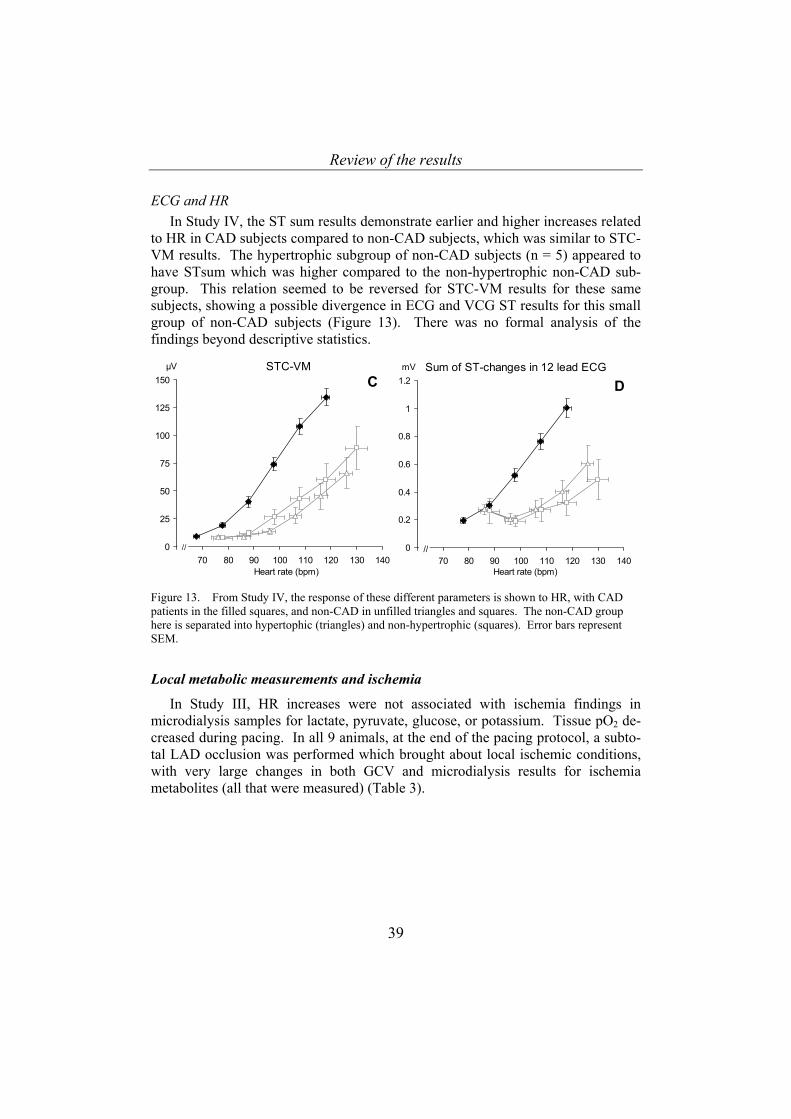
ECG and HR In Study IV, the ST sum results demonstrate earlier and higher increases related
to HR in CAD subjects compared to non-CAD subjects, which was similar to STC-VM results. The hypertrophic subgroup of non-CAD subjects (n = 5) appeared to have STsum which was higher compared to the non-hypertrophic non-CAD sub-group. This relation seemed to be reversed for STC-VM results for these same subjects, showing a possible divergence in ECG and VCG ST results for this small group of non-CAD subjects (Figure 13). There was no formal analysis of the findings beyond descriptive statistics.
0
25
50
75
100
125
150
60 70 80 90 100 110 120 130 140
STC-VMµV
Heart rate (bpm)
//
C
0
0.2
0.4
0.6
0.8
1
1.2
60 70 80 90 100 110 120 130 140
Sum of ST-changes in 12 lead ECGmV
Heart rate (bpm)
//
D
Figure 13. From Study IV, the response of these different parameters is shown to HR, with CAD patients in the filled squares, and non-CAD in unfilled triangles and squares. The non-CAD group here is separated into hypertophic (triangles) and non-hypertrophic (squares). Error bars represent SEM.
Local metabolic measurements and ischemia
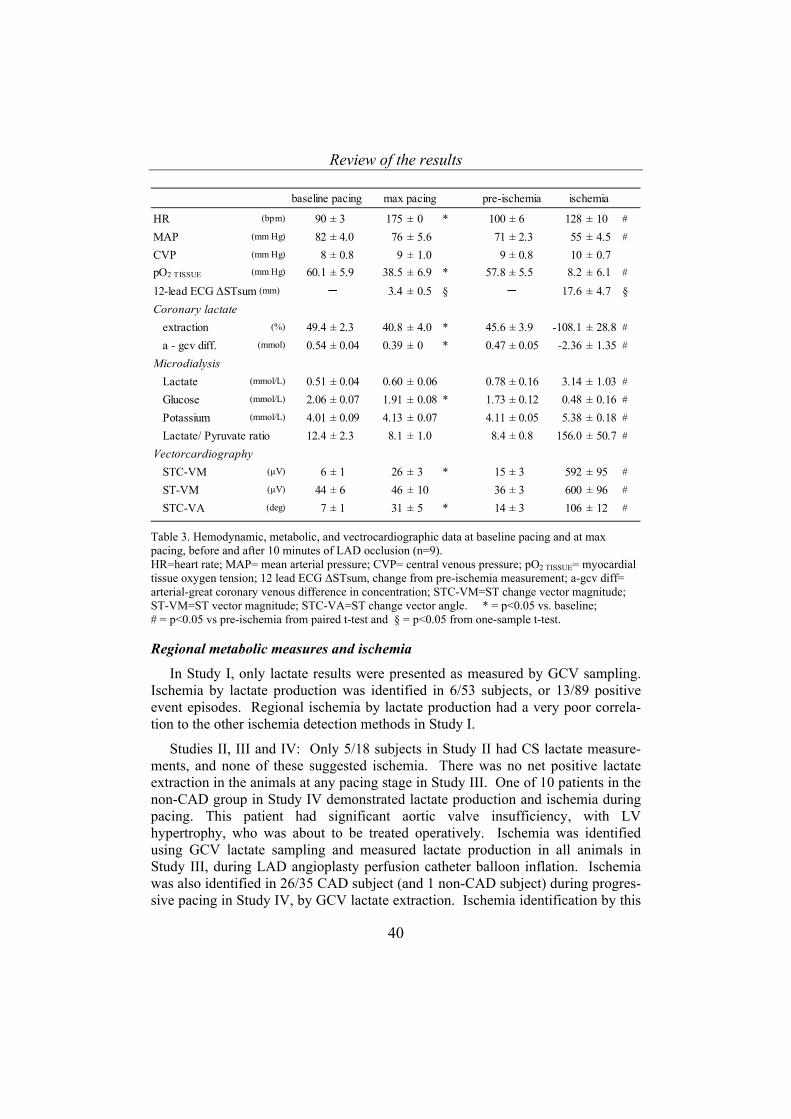
In Study III, HR increases were not associated with ischemia findings in microdialysis samples for lactate, pyruvate, glucose, or potassium. Tissue pO2 de-creased during pacing. In all 9 animals, at the end of the pacing protocol, a subto-tal LAD occlusion was performed which brought about local ischemic conditions, with very large changes in both GCV and microdialysis results for ischemia metabolites (all that were measured) (Table 3).
Review of the results
40
baseline pacing max pacing pre-ischemia ischemia
HR (bpm) 90 ± 3 175 ± 0 * 100 ± 6 128 ± 10 #
MAP (mm Hg) 82 ± 4.0 76 ± 5.6 71 ± 2.3 55 ± 4.5 #
CVP (mm Hg) 8 ± 0.8 9 ± 1.0 9 ± 0.8 10 ± 0.7pO2 TISSUE (mm Hg) 60.1 ± 5.9 38.5 ± 6.9 * 57.8 ± 5.5 8.2 ± 6.1 #
12-lead ECG ∆STsum (mm) ─ 3.4 ± 0.5 § ─ 17.6 ± 4.7 §Coronary lactate extraction (%) 49.4 ± 2.3 40.8 ± 4.0 * 45.6 ± 3.9 -108.1 ± 28.8 #
a - gcv diff. (mmol) 0.54 ± 0.04 0.39 ± 0 * 0.47 ± 0.05 -2.36 ± 1.35 #
Microdialysis Lactate (mmol/L) 0.51 ± 0.04 0.60 ± 0.06 0.78 ± 0.16 3.14 ± 1.03 #
Glucose (mmol/L) 2.06 ± 0.07 1.91 ± 0.08 * 1.73 ± 0.12 0.48 ± 0.16 #
Potassium (mmol/L) 4.01 ± 0.09 4.13 ± 0.07 4.11 ± 0.05 5.38 ± 0.18 #
Lactate/ Pyruvate ratio 12.4 ± 2.3 8.1 ± 1.0 8.4 ± 0.8 156.0 ± 50.7 #
Vectorcardiography STC-VM (µV) 6 ± 1 26 ± 3 * 15 ± 3 592 ± 95 #
ST-VM (µV) 44 ± 6 46 ± 10 36 ± 3 600 ± 96 #
STC-VA (deg) 7 ± 1 31 ± 5 * 14 ± 3 106 ± 12 #
Table 3. Hemodynamic, metabolic, and vectrocardiographic data at baseline pacing and at max pacing, before and after 10 minutes of LAD occlusion (n=9). HR=heart rate; MAP= mean arterial pressure; CVP= central venous pressure; pO2 TISSUE= myocardial tissue oxygen tension; 12 lead ECG ∆STsum, change from pre-ischemia measurement; a-gcv diff= arterial-great coronary venous difference in concentration; STC-VM=ST change vector magnitude; ST-VM=ST vector magnitude; STC-VA=ST change vector angle. * = p<0.05 vs. baseline; # = p<0.05 vs pre-ischemia from paired t-test and § = p<0.05 from one-sample t-test. Regional metabolic measures and ischemia
In Study I, only lactate results were presented as measured by GCV sampling. Ischemia by lactate production was identified in 6/53 subjects, or 13/89 positive event episodes. Regional ischemia by lactate production had a very poor correla-tion to the other ischemia detection methods in Study I.
Studies II, III and IV: Only 5/18 subjects in Study II had CS lactate measure-ments, and none of these suggested ischemia. There was no net positive lactate extraction in the animals at any pacing stage in Study III. One of 10 patients in the non-CAD group in Study IV demonstrated lactate production and ischemia during pacing. This patient had significant aortic valve insufficiency, with LV hypertrophy, who was about to be treated operatively. Ischemia was identified using GCV lactate sampling and measured lactate production in all animals in Study III, during LAD angioplasty perfusion catheter balloon inflation. Ischemia was also identified in 26/35 CAD subject (and 1 non-CAD subject) during progres-sive pacing in Study IV, by GCV lactate extraction. Ischemia identification by this
Review of the results
41
method was the reference method with which ischemia-related changes in STC-VM were identified (Study IV; Figure 14).
0
25
50
75
100
125
150
175
200
0 10 20 30 40 50 60-20
-15
-10
-5
0
5
10
15
20
(µV), (bpm)
Time (min)
HR (bpm)
STC-VM (µV) Lactateextraction (%)
(%)
Figure 14. Lactate extraction example. This representative example from a CAD subject in Study IV demonstrates the type of decrease in lactate extraction that was used to select patients as ischemic and chose them for further analysis.
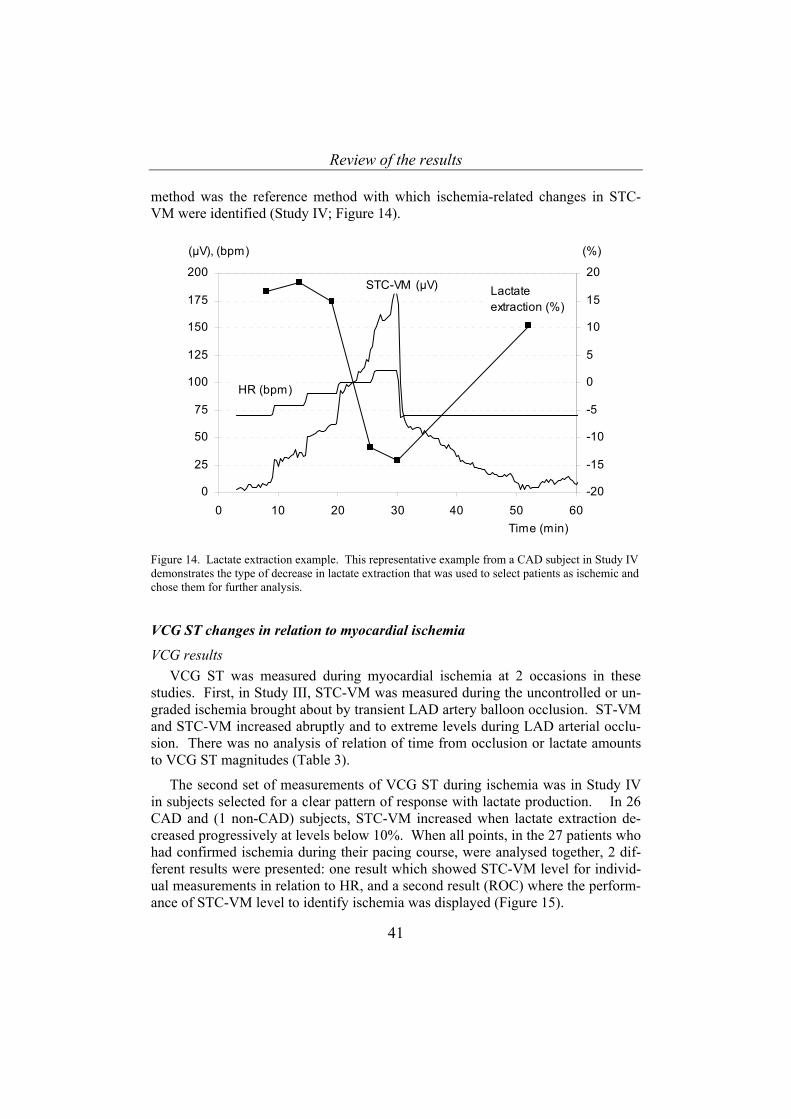
VCG ST changes in relation to myocardial ischemia
VCG results VCG ST was measured during myocardial ischemia at 2 occasions in these
studies. First, in Study III, STC-VM was measured during the uncontrolled or un-graded ischemia brought about by transient LAD artery balloon occlusion. ST-VM and STC-VM increased abruptly and to extreme levels during LAD arterial occlu-sion. There was no analysis of relation of time from occlusion or lactate amounts to VCG ST magnitudes (Table 3).
The second set of measurements of VCG ST during ischemia was in Study IV in subjects selected for a clear pattern of response with lactate production. In 26 CAD and (1 non-CAD) subjects, STC-VM increased when lactate extraction de-creased progressively at levels below 10%. When all points, in the 27 patients who had confirmed ischemia during their pacing course, were analysed together, 2 dif-ferent results were presented: one result which showed STC-VM level for individ-ual measurements in relation to HR, and a second result (ROC) where the perform-ance of STC-VM level to identify ischemia was displayed (Figure 15).

Review of the results
42
0
0.1
0.2
0.3
0.4
0.5
0.6
0.7
0.8
0.9
1
0 0.1 0.2 0.3 0.4 0.5 0.6 0.7 0.8 0.9 1
1 - Specificity (false positives)
Sens
itivi
ty (t
rue
posi
tives
)
No discrimination
STCVM
STVM
AB
C
D
Point STC-VM Sensitivity SpecificityA 44 µV 93% 68%B 54 µV 88% 75%C 76 µV 75% 84%D 89 µV 68% 87%
Figure 15. This ROC analysis presents the results in terms of relation of ischemia to STC-VM and ST-VM levels in the subgroup of 27 patients where lactate results were analysed further. The area under the curve is less for ST-VM (0.610), which suggests limited predictive value of absolute ST-VM levels for ischemia detection. Specific points A, B, C, and D in the STC-VM curve (area 0.862), demonstrate the declining sensitivity (and increasing specificity) for ischemia at higher STC-VM levels
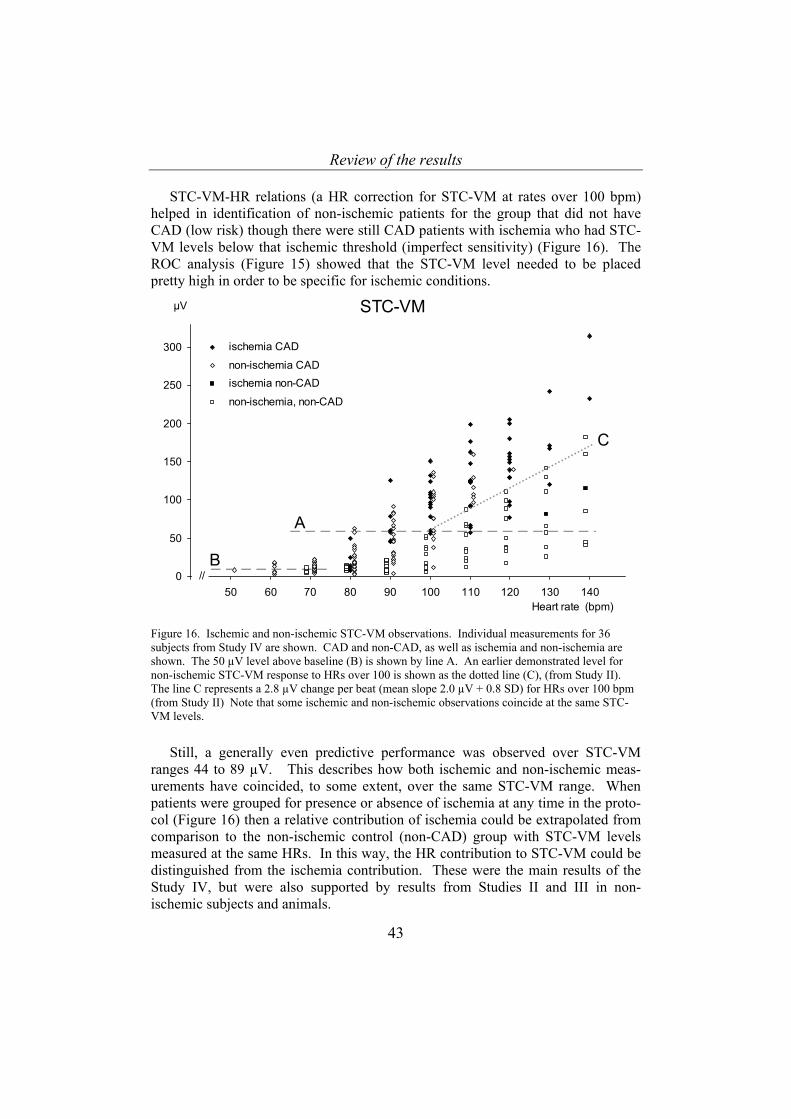
Review of the results
43
STC-VM-HR relations (a HR correction for STC-VM at rates over 100 bpm) helped in identification of non-ischemic patients for the group that did not have CAD (low risk) though there were still CAD patients with ischemia who had STC-VM levels below that ischemic threshold (imperfect sensitivity) (Figure 16). The ROC analysis (Figure 15) showed that the STC-VM level needed to be placed pretty high in order to be specific for ischemic conditions.
0
50
100
150
200
250
300
40 50 60 70 80 90 100 110 120 130 140
ischemia CAD
non-ischemia CADischemia non-CAD
non-ischemia, non-CAD
STC-VMµV
//
A
B
C
Heart rate (bpm) Figure 16. Ischemic and non-ischemic STC-VM observations. Individual measurements for 36 subjects from Study IV are shown. CAD and non-CAD, as well as ischemia and non-ischemia are shown. The 50 µV level above baseline (B) is shown by line A. An earlier demonstrated level for non-ischemic STC-VM response to HRs over 100 is shown as the dotted line (C), (from Study II). The line C represents a 2.8 µV change per beat (mean slope 2.0 µV + 0.8 SD) for HRs over 100 bpm (from Study II) Note that some ischemic and non-ischemic observations coincide at the same STC-VM levels.
Still, a generally even predictive performance was observed over STC-VM ranges 44 to 89 µV. This describes how both ischemic and non-ischemic meas-urements have coincided, to some extent, over the same STC-VM range. When patients were grouped for presence or absence of ischemia at any time in the proto-col (Figure 16) then a relative contribution of ischemia could be extrapolated from comparison to the non-ischemic control (non-CAD) group with STC-VM levels measured at the same HRs. In this way, the HR contribution to STC-VM could be distinguished from the ischemia contribution. These were the main results of the Study IV, but were also supported by results from Studies II and III in non-ischemic subjects and animals.

Review of the results
44
ECG and myocardial ischemia 12 lead ECG results were presented in Study IV, and demonstrated a clear re-
sponse to ischemic conditions in terms of both individual ST changes as well as change STsum (Figure 13), all of this derived from non-automated analysis of paper traces. None of the studies was designed to evaluate the 12 lead ECG response to HR or ischemia.
Discussion
45
DISCUSSION
These studies included both new combinations of methods, to study myocardial ischemia detection, as well as new findings, through in-depth analysis of results from already well established methods. Patient material was studied with VCG and other electrophysiological measurements with simultaneous regional metabolic assessment during heart rate manoeuvres. Experimental material (large animal model) was collected with electrophysiological measurement and simultaneous local metabolic assessment during HR manoeuvres and during controlled regional myocardial ischemia. HR and ischemia combined effects were studied in patients in a controlled setting with graded ischemia steps. These observations have pro-vided a novel opportunity to refine some of our tools for myocardial ischemia de-tection.
In order to interpret the general findings, it seems prudent to analyse some as-pects of Study I first, and separately. This was very rich as a hypothesis generating study. Studies II, III, and IV had similar hypotheses and experimental designs, and they will be considered together.
Study I Study I was performed many years before the other 3 studies, and it perhaps
may best be interpreted from a perspective that takes into account the knowledge and methods available at the time it was published. The scientific question con-cerned the best way to identify myocardial ischemia in the bedside setting. The methods employed in Study I were not exhaustive or the most highly intensive or detailed, but were rather the methods that clinicians had at hand, when patients might be suspected to be ischemic, and a diagnostic question was posed. Also, CKG was relatively newly introduced, and not well established. The design of identifying agreement between the different methods was a result of not having a readily available, highly certain reference method which could identify ischemia (or no ischemia) beyond all doubt. There was a breadth in the study design, since it was recognised that all the methods could detect ischemia, and that all could also miss ischemia. Also, there was an idea to incorporate several different types of ischemia detection into the protocol: metabolic, electrophysiological, mechanical, and hemodynamic. Therefore, positive events from all detection method types were included. The weakness of the analysis became apparent when some of the methods produced lots of positive events, and others produced few. It is uncertain how many positive ischemic events that the subject group had, but it is possible that there was more ischemia than was identified by lactate analysis and less than were identified by CKG positive events. Also, the protocol relied on myocardial ischemia being provoked by either anesthetic or surgical related interventions, but these were not controlled by the investigators. Some incidence of ischemia in that selected patient group was accepted and recognised, but there was uncertainty about exactly which patients and which measurement points involved myocardial
Discussion
46
ischemia. 12 lead ECG data was available for many of the patients, but not for all due to logistical problems, and these results were not included in the final analysis.
This study awakened several questions. Firstly, we demonstrated that study of myocardial ischemia with hemodynamic, mechanical, metabolic, and electro-physiological methods in anesthetised patients in our institution was feasible. It also demonstrated the need in future studies to strive for not just agreement be-tween the different methods but also agreement with an optimal reference method, to the extent possible.
At the same time that follow-up studies for Study I were being planned and started, VCG validation work was being performed in our institution. Much of my own research activity was involved in both refinement of VCG detection of myo-cardial ischemia and refinement of regional metabolic lactate sampling in both patients and in experimental animal models. It was logical that ensuing studies would involve these 2 methods, which we have believed are among the most reli-able, in optimal conditions, for rapid detection of myocardial ischemia.
One shortcoming of VCG as a detection method for ischemia, which was dis-cussed much in our group in relation to the Ph.D. theses of colleagues Ulf Näslund and Steen Jensen [22, 23] was the apparent dependent relation of STC-VM to heart rate changes. Well, not only heart rate changes, but several factors other than ischemia. This was the scientific question which gave the form to the study de-signs for II, III, and IV. We hoped to have optimal and controlled experimental conditions in which to prospectively vary HR in both ischemic and non-ischemic conditions, and to study the VCG ST responses in order to better refine the VCG ST definition of ischemia.
Initially the question arose in the PCI lab, where there was an acute occlusion with certain ischemia but no gradation of ischemia, and no controlled variation in HR [21, 63, 82]. Therefore we thought that the optimal setting to study HR effects on VCG ST would be one where both controlled HR changes and ischemic condi-tions could be induced. The patient group with easily induced myocardial ische-mia, but no other problems, was a difficult one to recruit and study in large num-bers. The same conditions could be produced in the lab, though achieving con-trolled graded ischemia in healthy pigs is not easy, and compromises were neces-sary (non-ischemia or nearly complete LAD occlusion). A fundamental clinical study with HR variation but no ischemia was also planned, and an appropriate pa-tient group was identified. With this perspective, it seems that we have tested our hypotheses.
Corroborating Studies II, III, and IV First, ST-VM results in response to HR changes were very difficult to analyse.
ST-VM showed no systematic response to HR changes in any of the studies, at
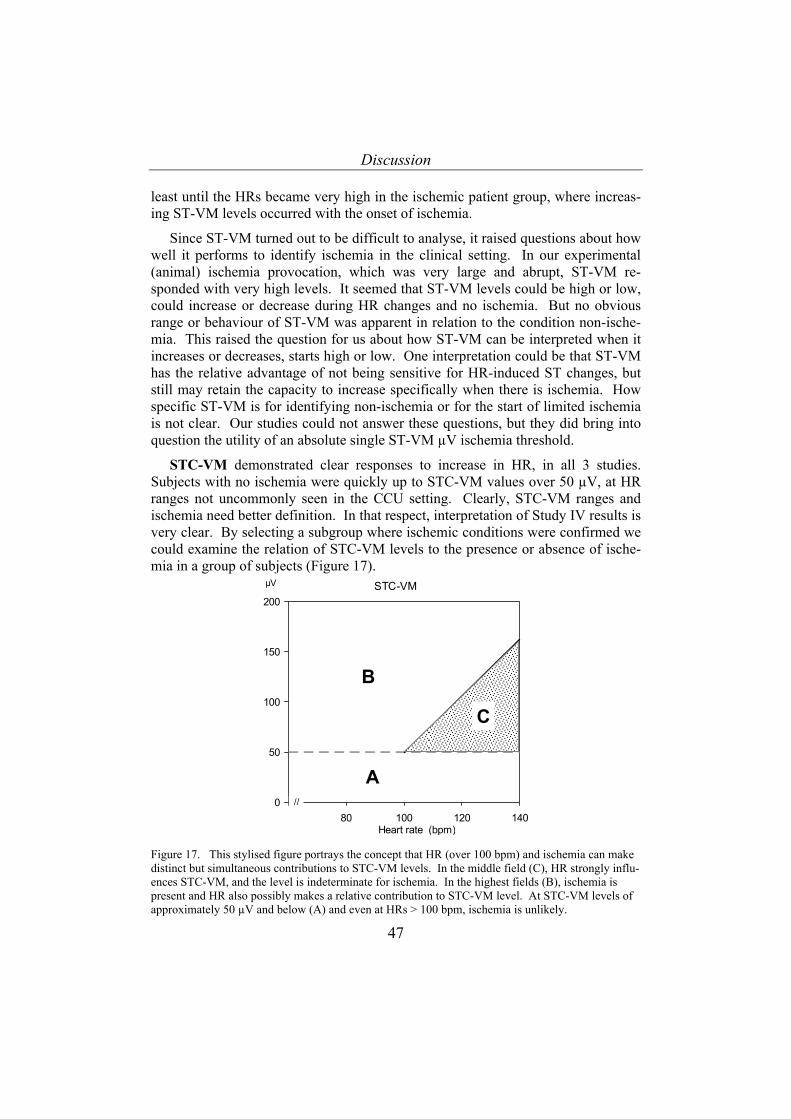
Discussion
47
least until the HRs became very high in the ischemic patient group, where increas-ing ST-VM levels occurred with the onset of ischemia.
Since ST-VM turned out to be difficult to analyse, it raised questions about how well it performs to identify ischemia in the clinical setting. In our experimental (animal) ischemia provocation, which was very large and abrupt, ST-VM re-sponded with very high levels. It seemed that ST-VM levels could be high or low, could increase or decrease during HR changes and no ischemia. But no obvious range or behaviour of ST-VM was apparent in relation to the condition non-ische-mia. This raised the question for us about how ST-VM can be interpreted when it increases or decreases, starts high or low. One interpretation could be that ST-VM has the relative advantage of not being sensitive for HR-induced ST changes, but still may retain the capacity to increase specifically when there is ischemia. How specific ST-VM is for identifying non-ischemia or for the start of limited ischemia is not clear. Our studies could not answer these questions, but they did bring into question the utility of an absolute single ST-VM µV ischemia threshold.
STC-VM demonstrated clear responses to increase in HR, in all 3 studies. Subjects with no ischemia were quickly up to STC-VM values over 50 µV, at HR ranges not uncommonly seen in the CCU setting. Clearly, STC-VM ranges and ischemia need better definition. In that respect, interpretation of Study IV results is very clear. By selecting a subgroup where ischemic conditions were confirmed we could examine the relation of STC-VM levels to the presence or absence of ische-mia in a group of subjects (Figure 17).
0
50
100
150
200
60 80 100 120 140
STC-VMµV
//
A
B
C
Heart rate (bpm) Figure 17. This stylised figure portrays the concept that HR (over 100 bpm) and ischemia can make distinct but simultaneous contributions to STC-VM levels. In the middle field (C), HR strongly influ-ences STC-VM, and the level is indeterminate for ischemia. In the highest fields (B), ischemia is present and HR also possibly makes a relative contribution to STC-VM level. At STC-VM levels of approximately 50 µV and below (A) and even at HRs > 100 bpm, ischemia is unlikely.
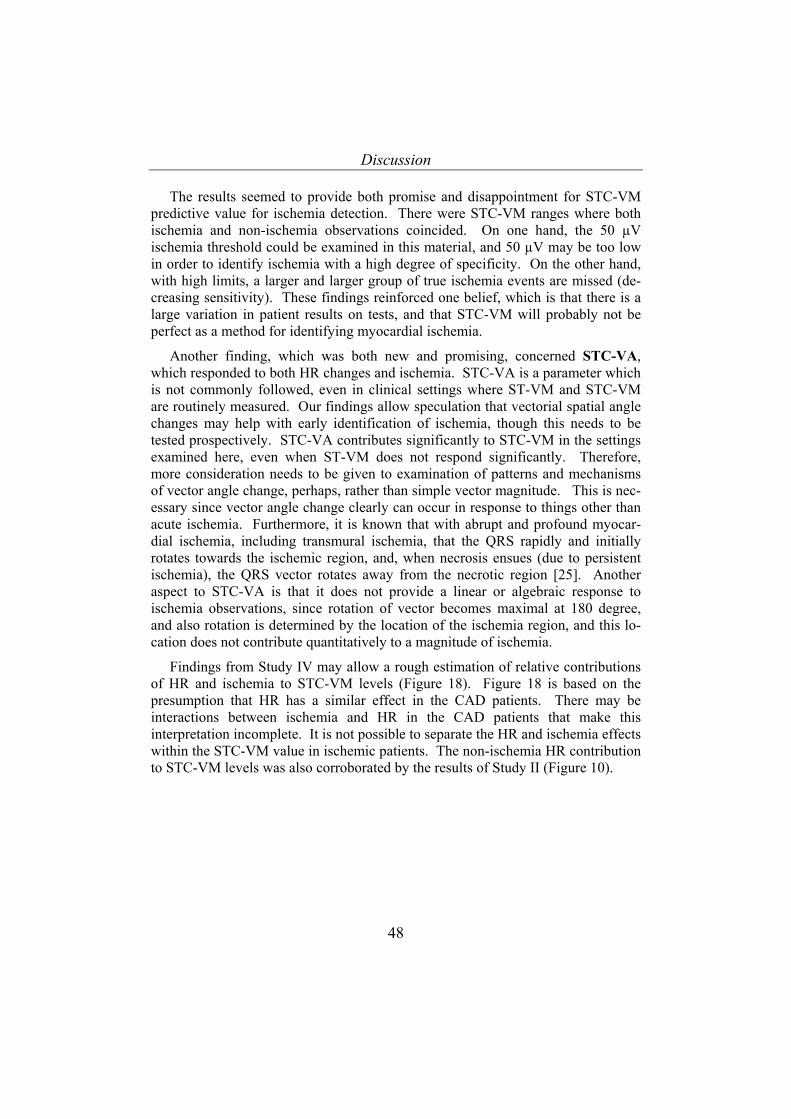
Discussion
48
The results seemed to provide both promise and disappointment for STC-VM predictive value for ischemia detection. There were STC-VM ranges where both ischemia and non-ischemia observations coincided. On one hand, the 50 µV ischemia threshold could be examined in this material, and 50 µV may be too low in order to identify ischemia with a high degree of specificity. On the other hand, with high limits, a larger and larger group of true ischemia events are missed (de-creasing sensitivity). These findings reinforced one belief, which is that there is a large variation in patient results on tests, and that STC-VM will probably not be perfect as a method for identifying myocardial ischemia.
Another finding, which was both new and promising, concerned STC-VA, which responded to both HR changes and ischemia. STC-VA is a parameter which is not commonly followed, even in clinical settings where ST-VM and STC-VM are routinely measured. Our findings allow speculation that vectorial spatial angle changes may help with early identification of ischemia, though this needs to be tested prospectively. STC-VA contributes significantly to STC-VM in the settings examined here, even when ST-VM does not respond significantly. Therefore, more consideration needs to be given to examination of patterns and mechanisms of vector angle change, perhaps, rather than simple vector magnitude. This is nec-essary since vector angle change clearly can occur in response to things other than acute ischemia. Furthermore, it is known that with abrupt and profound myocar-dial ischemia, including transmural ischemia, that the QRS rapidly and initially rotates towards the ischemic region, and, when necrosis ensues (due to persistent ischemia), the QRS vector rotates away from the necrotic region [25]. Another aspect to STC-VA is that it does not provide a linear or algebraic response to ischemia observations, since rotation of vector becomes maximal at 180 degree, and also rotation is determined by the location of the ischemia region, and this lo-cation does not contribute quantitatively to a magnitude of ischemia.
Findings from Study IV may allow a rough estimation of relative contributions of HR and ischemia to STC-VM levels (Figure 18). Figure 18 is based on the presumption that HR has a similar effect in the CAD patients. There may be interactions between ischemia and HR in the CAD patients that make this interpretation incomplete. It is not possible to separate the HR and ischemia effects within the STC-VM value in ischemic patients. The non-ischemia HR contribution to STC-VM levels was also corroborated by the results of Study II (Figure 10).
Discussion
49
0
25
50
75
100
125
150
60 70 80 90 100 110 120 130
STC-VMµV
Heart rate (bpm)
//
Heart rate contribution
Ischemia contribution
CAD
non-CAD
Figure 18. Possible relative contributions of HR and ischemia to STC-VM levels. In this figure, which is based on observations of mean STC-VM from the 2 patient groups in Study IV, an approxi-mation of the ischemia contribution to the CAD observations can be made by superimposing the non-CAD results, for which there was only a HR-related STC-VM increase.
The coincidence of ischemia and non-ischemia measurements at the same STC-VM levels also awakened scientific questions, including concerning the degree of certainty with which the lactate analysis method identified myocardial ischemia. In one respect, CS or GCV lactate analysis is similar to microdialysis, in that both are qualitative assessments. CS lactate is diluted by unknown quantities of venous blood from non-ischemic regions; microdialysis samples have an incomplete equilibration with local interstitial concentrations for measured substances. Still, both methods are very certain in identification of direction and general magnitude of significant changes in metabolic activity. GCV sampling was used to identify ischemic metabolites. Venous drainage of these metabolites and the amount of di-lution from the ischemic myocardium, depend on the degree of ischemia, and amount of ischemic myocardium, and the type of ischemia for ‘demand’ type ischemia. Alternate drainage is possible for ischemia in some myocardial regions. A progressive lactate production was documented confirming adequate coronary sinus/GCV sampling of ischemic myocardium. The uncertainty in those subjects was whether or not the absence of ‘lactate production’ could be equated with no ischemia. Perhaps, lactate was produced in a small myocardial region of ischemia (which had ECG/VCG events), but that this lactate was not appreciated due to di-lution or other sampling problems which were overcome when the ischemia amount increased. This problem will not be resolved by lactate sampling alone.
Discussion
50
Another bedside method of detecting ischemia is needed during that step in the pacing protocol. Other investigators have published varying performance of the lactate analysis method for detection of ischemia. We have chosen a definition of ischemia by lactate criteria (less than 10% lactate extraction) in order to not miss many ischemic events due to lactate production criteria that are too high [74, 76].
STC-VM ischemic thresholds or criteria Better validation of VCG ST thresholds for ischemia have been a goal for many
years. One problem in validation work to this end is that myocardial ischemia in the clinical setting does not occur in controlled, graded, progressive degrees. Studies on exercising or acutely ischemic patients may provide STC-VM results, but the degree of ischemia and exact time of onset would be uncertain. Also, many of the non-ischemic coincidental conditions are difficult to control, including HR. It must be difficult to be certain, in all cases, that a first or baseline measurement is collected in non-ischemic conditions, so that STC-VM values can be compared to a non-ischemic reference. Concerning exercising subjects during a diagnostic ‘stress’ test, both the HR and the ischemia response may or may not be graded, which is why the maximal effort measurements are the ones most frequently inter-preted. All these factors have made clinical testing of a general VCG ST threshold for ischemia quite difficult.
We have attempted to control as many of these factors as possible in order to provide a graded progressive provocation in patients who had an ischemic heart syndrome which was relatively easily activated, in Study IV. In Study II, we ex-amined non-ischemic clinical conditions, and these results confirmed that the ab-solute VCG ST thresholds need to be re-evaluated and redefined, though exactly at which level was not clear from analysis of non-ischemia observations only. In Study IV, in the subgroup of ischemic patients where a non-ischemia lower pacing level was also identified, a contrast between ischemia measurements and non-ischemia measurements could be made, for STC-VM levels. The analysis was based on the presumption that the determination of ischemia, by GCV lactate measurement, identified true ischemia. In Study IV we tested STC-VM response in a subject group with severe ischemic heart disease. We can speculate that if we had tested the same in a subject group that did not have as much ischemia, that we would not have been able to identify similarly clear results. These observations probably cannot be generalised to what would happen if the subjects were not uni-versally ischemic, such as, for example, in a group of newly admitted chest pain patients.
The observations showed that a higher ischemia threshold is needed at higher HR’s, though ischemia was observed over quite a range of STC-VM, and no abso-lute threshold STC-VM level for ischemia was obvious, at least in our material. From this, probabilities for correct prediction of ischemia, based on STC-VM val-ues, could be calculated (Figure 14). Some uncertainty (false negatives and false
Discussion
51
positives) was obvious, demonstrating limits in the concept of generalisation of an absolute STC-VM ischemia threshold. Disregarding HR, the best predictive performance for ischemia by STC-VM levels lay between 44 and 89 µV. Choice of an optimal sensitivity or specificity must be up to each user of the method.
We are not able to describe in detail the transition from non-ischemic status (normal aerobic metabolism with balance in supply/demand or supply/drainage) to ischemia using electrocardiographic methods. That transition was, however, ele-gantly described already in the 1960’s as a process of progressive derangement of enzyme activities, glycolysis, and shift in concentrations of intermediate metabolic substrates and by-products, and decrease in local amounts of compounds with high energy phosphate bonds, to lactate production, metabolic standstill, and cell death [5]. Concerning electrocardiographic methods, the metabolic physiologists were early on the scene.
While we have studied VCG ST signals and ischemia, and reported some lim-ited 12 lead ECG results, we do not mean to suggest, by any means, that VCG is better or has more utility than the traditional 12 lead ECG for detection of myocar-dial ischemia. There are reviews [31] which discuss possible limitations or advan-tages of one or the other. The 12 lead ECG does not have a perfect predictive value for detection of myocardial ischemia, but it has a well established diagnostic performance in patients at risk for ischemia, which has made the technique the most widely accepted general method for that purpose. The most practical differ-ence between VCG, as we have employed it, and 12 lead ECG, is that patients do not have to have an electrode and lead on their back with ECG. This has practical significance in clinical settings. 12 lead ECG is easier to measure than to interpret. Spatial analysis and interpretation of directional changes and loops is regarded by many clinicians to be impenetrable. A single dimensional assessment as a function of time is usually preferred.
We have studied VCG as one form of electrophysiological method to assess myocardial ischemia, but not with the intent of asserting VCG as a method which should at some point replace the 12 lead ECG. Each method has its practical as-pects, and the choice to employ one or the other in the CCU for monitoring of ischemic patients has much to do with the general availability of equipment. How-ever, for research purposes, due to the well designed software, the VCG technique employed in this thesis has been an excellent electrophysiological tool.
J point results Another gap in the current scientific evidence for clinical implementation of
ECG for ischemia diagnosis concerns the J point and the time to ST measurement. There has been no firm recommendation, at least based on scientific evidence, for J point plus some number of msec for measurement of ST values. There has been speculation that higher HRs can disturb the ST measurement, and therefore the interval from the J point perhaps should be shorter rather than longer [83]. On the
Discussion
52
other hand, J + 0 has been though to increase the likelihood that one reduces repro-ducibility in the ST measurement, since the J point can vary or be difficult to de-termine exactly. Particularly automated systems might be more vulnerable to arte-fact or ‘noisy’ signals if J + 0 msec was the standardised routine for ST measure-ment. Presumably because of this, the recommendations which have been given by consensus of an expert group( [13, 84] are not always implemented and are given without reference to direct evidence for choice of this interval. In all automated ST measurement machines, operators are allowed to choose this interval. Our results, both in Studies II and IV (preliminary) provide support for the interpretation that no particular ST effect, even in ischemic subjects, occurs when following HR or ischemia effects, as long as the same J point- ST interval is observed (Figure 12). In humans, at very high HRs, the start of the T wave may coincide with J + 60 or 80 msec. In Study II, pacing levels did not exceed 150 bpm. We have not found a difficulty with any of the intervals that were examined in Studies II and IV.
Mechanisms of ST changes Many factors can bring about ST changes, but do not involve ischemia. These
factors must be considered in study design when measuring ST response, and these include at least the following: electrolyte derangements [85], extremes of auto-nomic tone, some drugs [86], body position [41] or posture, heart chamber loading, conduction disturbances including pre-excitation, previous myocardial injury, fi-brosis, scars, hypertrophy, pericarditis, dysrythmias [26], radiographic contrast [41, 87] (for example during coronary angioplasty), and non-biological artefacts like electrical interference, or incorrect VCG application (such as wrong electrode placement or connecting), inappropriate signal filtering [88].
The exact mechanisms for ST changes, both during ischemia and during HR events, was not the main focus of these studies. There are a number of factors which are thought to affect ST levels, which are independent of ischemia. While in the experimental study, where local metabolic factors could be assessed both dur-ing non-ischemic HR changes and during ischemia, there were some observation of both local substrate concentrations as well as extracellular potassium concentra-tion. While changes in local substrate amounts could be observed in relation to changes in myocardial work, there were no observation which helped to determine the mechanism of ST change. Potassium changes in relation to myocardial ischemia have been discussed for many years. Potassium flux has been the subject of interest during myocardial infarction, and even venous [K+] [89]. Alterations in extracellular [K+] related to shorter intervals for potassium reuptake during repo-larisation have been a part of our textbook physiology learning [90], though the microdialysis sampling in our study did not identify any change in myocardial ex-tracellular [K+] during STC-VM increases and increased HRs. Extracellular [K+] changes during HR increases has been shown experimentally in atrial muscle [91], but not in ventricular muscle. Microdialysis sampling is too slow to assess extracellular [K+]. It is clear that [K+] fluxes related to HR are not ruled out by
Discussion
53
these observations. Without doubt, there are marked [K+] changes related to myo-cyte injury, even as observed in our Study III, and these findings are not novel (Table 3). More investigation is needed to determine better detail the mechanism of ST change related to HR.
Electrophysiological signalling occurs in myocytes also through gap junction channels. Heart myocytes are separated by an interstitial space, and impulse propagation is dependent on cellular coupling by gap junction. The myocyte is connected to approximately 10 adjacent myocytes, and approximately 100 gap junctions [92]. [26, 93]. The gap junction channels are made up of a couple of different connexins, which are proteins with different characteristic ionic permeabilities and conductance. The gap junctions provide low-resistance electrical coupling and can enhance transfer of ATP or high-energy phosphates, like ATP. The conduction is fastest longitudinally, and the rate of propagation of the action potential is partly determined by the gap junctional resistance, which may itself be altered by ischemia and changes in concentrations of ions like calcium, as well as by acidosis/alkalosis [94]. Theoretically, alterations in the gap junctional resistance may have influence on conduction velocity. Whether or not alterations in the function of gap junction can cause ST segment changes during pacing-induced heart rate increases is not known, and investigation of gap junction function was not possible with this study design, and was not one of the aims [26].
The atrial repolarisation wave (Ta) has been proposed as a possible contributor to ST level [95-99]. The Ta wave generates very low voltages by sur-face electrocardiography. If the Ta is delayed, and at its maximal height (which normally occurs shortly before or during the start of the QRS complex) it may coincide with the ST, then, in theory there can be some influence on ST magnitude, even up to 50 µV. The Ta wave voltage is thought to be not higher than 10-15 µV during the early part of the ST segment (if it reaches ST at all). With normal conduction and a normal P-Q interval, the likelihood that Ta coincides with the ST measurements is low, especially at higher heart rates.
Methodological Consideration
Pacing was implemented to control HR since it has less side effects and more certainty than pharmacological methods for the same purpose. In the last study, pacing was used as a means for graded heart work increase. This was a disadvan-tage in that study, at least as far as separating HR and ischemia effects on VCG ST, since they occurred simultaneously. It was not possible to observe higher HRs in CAD patients without inducing ischemia. There was a subgroup of CAD patients which did not demonstrate lactate production during pacing steps but was eventu-ally identified as obviously ischemic by the ECG. We presume that these patients had ischemia related to pacing, which affected the VCG ST, but it was not clear at which pacing step the ischemia began. Pacing has repeatedly been demonstrated as an effective means for inducing ischemia in CAD patients [73, 74, 100, 101].
Discussion
54
Atrial pacing was readily accomplished in these patient groups, even if there were different approaches and catheter/electrode types in the different studies. The pacing capture is demonstrated in Figure 4. Metabolic assessments confirmed graded increases in LV work and oxygen consumption in the CAD subjects. Still, it was a requirement, in this group, that ischemia would be easily inducible and that the anterior wall and LAD anatomical ischemia involvement (GCV drainage area, largely) would be present in order to maximise the results.
Concerning the study populations, we have judged that healthy animals and accessory pathway ablation patients were reasonable models for non-ischemia, when the effects of HR alone on VCG ST were to be studied. It is not clear if there are any significant effects of presence or absence of anesthesia on ST analysis. Our presumption was that low doses of anesthetics did not disturb the ability of VCG ST to respond to HR, though clearly high doses of potent inhaled anesthetics would have presented a methodological problem. In all the studies, we strove to have resting (or anesthetised) conditions as a standard part of the method. If individual animals or subjects had been acutely stressed during a protocol that presumed resting adrenergic or sympathetic nerve system tone, then that would introduce changes not related specifically to HR or ischemia. In the clinical studies, there were few women, and that was a result of the clinical material available for enrolment. This was unavoidable, and limits our ability to examine these scientific questions from a gender (gender-pathophysiological) perspective.
Concerning detection of myocardial ischemia using lactate measurement, CS lactate is similar to microdialysis in that both are qualitative assessments. CS lactate is diluted by unknown quantities of venous blood from non-ischemic areas, microdialysis samples have an incomplete equilibration with local interstitial con-centrations for measured substances. Still, both methods are very certain in identi-fication of direction and general magnitude of significant changes in metabolic activity. The performance of this test to identify ischemia is assumed to be high as far as incidence of true positives, though exactly when the ischemia began is less clear. The protocol in Study IV allowed approximately 5 minutes from the start of pacing until lactate was sampled. The incidence of false negatives in the Study IV material is not clear. The effect of these is only that more patients needed to be studied in order to find an ischemia positive group.
As regards specific technical aspects of lactate analysis for identification of ischemia, GCV sampling of venous drainage is performed. There is some amount of dilution of venous blood from ischemic myocardium, and the degree of dilution depends on multiple factors, including degree of ischemia, and size of the ischemic area, presence or absence or total occlusion of arterial inflow, alternate drainage flow from ischemic myocardium (for example thebesian vein drainage of subendo-cardial ischemia), and other factors. A progressive lactate production was docu-mented in a subgroup of Study IV subjects, confirming adequate coronary sinus sampling of ischemic myocardial areas. The absence of ‘lactate production’ in
Discussion
55
those subjects was equated with no ischemia during preceding steps in the pacing protocol. We reason that there was high reliability of identification of myocardial ischemia in these selected patients.
There is uncertainty about the value for detecting myocardial ischemia of sev-eral clinical methods which examine mechanical myocardial events and hemo-dynamics. CKG events were described in Study I, as a means of assessing LV anterior wall structure and motion. It has long been recognized that local mechani-cal events are always present early after the onset of regional myocardial ischemia. Yet, there has always been difficulty in finding clinical methods which detect with reasonable specificity these ischemic mechanical events. In Study I, PCWP was also examined, though this also demonstrated low specificity in relation to positive events identified by other means. In general, indirect assessments of heart filling pressures are no longer implemented as a method for reliable detection of new on-set myocardial ischemia. But, when Study I was conceived, and was underway, this clinical question was very much alive. The study results contributed to the general trend to leave heart filling pressures as a means of identifying ischemia. Another disadvantage of direct measurement of heart filling pressures is the degree of invasiveness.
Echocardiography was also the subject of very active debate, as far as detection of ischemia. CKG was at that time thought, by us, to be a form of equivalent type of assessment. We also have been involved in study of echocardiographic (re-gional wall motion) endpoints in the same context, though no results are included in these studies. Echocardiography, with rapidly evolving technical developments, may yet prove to be useful in the detection of acute myocardial ischemia.
Some clinical implications of our studies may be summarised as follows.
The studies demonstrated limitations in the currently widespread VCG ST crite-ria for ischemia, though our findings did not provide specific information about exactly how these should be changed.
Clinicians need to be aware of for which purpose VCG ST findings will be used. Clinical setting, in general, and multiple other heart-specific factors (includ-ing HR) need to be considered before basing any therapeutic intervention of a VCG ST finding.
The monitoring and trend function in VCG ST clinical data collection, together with bedside information such as symptoms, HR and blood pressure, should assist the clinician in differentiating demand ischemia VCG ST events from spontaneous ischemia brought about by vasomotor or thrombotic events. When a transient ST change is observed, the responsible provider should assess and record these abovementioned factors.
Healthy individuals, without coronary artery disease, can demonstrate remark-able ST changes, which reside in the ranges usually thought to be specific for myo-

Discussion
56
cardial ischemia. Corroborating diagnostic investigation is needed to eliminate the possibility that such ST changes are caused by ischemia.
Future directions in electrocardiograpic myocardial ischemia detection
Some ideas about future research in this area include continuing with both clini-cal and experimental testing of VCG ST parameters in different conditions, par-ticularly concerning ST vector angle change and T wave loops.
VCG ST parameters, both related to HR and ischemia need to be investigated particularly in women at different hemodynamic conditions and hypertrophy, and also in populations without coronary artery disease. Furthermore, it would be in-teresting to examine VCG ST parameters together with other currently applied methods assessing electrocardiography, pump function, perfusion and metabolism.
The recovery of ST changes during the decline of HR (after tachycardia) was not examined in this thesis. There are studies demonstrating the predictive value of hysteresis in the ST/HR recovery pattern after exercise as far as detection of coronary artery disease [102, 103]. The pattern of ST decline during recovery after pacing-induced HR increases is another area worth exploring in the future.
Conclusions
57
CONCLUSIONS
• Generally available clinical methods (hemodynamics, ECG, mechanical wall motion, and metabolic measurements) have a poor concordance when myocar-dial ischemia is suspected, and there is uncertainty about their predictive value for ischemia.
• There is a HR-dependent effect on ECG ST segments that is independent of ischemia, at least when ischemia is absent.
• HR effects on VCG ST value do not vary in relation to different J point-ST time intervals, in the range J + 0 to J + 80 msec irrespective of heart rate up to 140 bpm.
• STC-VM increases during HR elevation in a ST range generally accepted to indicate myocardial ischemia (STC-VM 50 µV), even in the absence of ische-mia.
• HR-based STC-VM adjustments can improve STC-VM’s detection of ischemia at HRs above 100 bpm.
• STC-VM increases occur at lower HRs ranges and rise to higher levels during ischemia, compared to patients at same HR.
• STC-VM has limits in its predictive value for myocardial ischemia, and these are not completely understood, yet.
• STC-VM can be at high levels (over generally accepted thresholds for ische-mia) despite no measurable regional myocardial ischemia. STC-VM can be low (below generally accepted thresholds for ischemia) despite active regional myocardial ischemia measured by a reference method.
• During myocardial ischemia caused by increased myocardial work (coronary artery stenosis), heart rate increase and ischemia both provide independent contributions to VCG ST changes.
• ST vector angle changes in response to HR and in response to ischemia. • ST-VM shows a more heterogeneous and later response to HR or ischemia
compared to STC-VA. • Empirically derived static ST vector criteria for the detection of myocardial
ischemia can be improved as far as sensitivity and specificity for myocardial ischemia.
• Prospective clinical evaluation of ST vector parameters, using a second or reference method which is highly certain for detection of myocardial ischemia, is needed to further increase the clinical predictive value ST vector observa-tions for patients with suspected active ischemic heart disease.

Acknowledgements
58
ACKNOWLEDGEMENTS
I wish to express my sincere gratitude to all my friends, colleagues, and staff at the Heart Centre, including my daily colleagues over the years from the heart surgical operation suites, electrophysiology, and the Clinical Physiology Department.
Special thanks to the following:
Ulf Näslund, cardiology associate professor, my scientific tutor, main supervisor, chief, and friend for many years, starting during scientific work in the early 1990´s. Thanks for your enthusiastic support and patience throughout this project.
Michael Haney, anesthesia associate professor, scientific tutor, for your instruc-tion, patience and support. Thank you for giving me of your time and knowledge in the scientific discussions during data analysis and invaluable help in the writing procedure.
Sebastian Reiz, anesthesia professor, my first scientific tutor, for introducing me into the field of scientific work already in the late 1970´s.
Göran Johansson, anesthesia research engineer, for outstanding help in all pro-jects with technical and data handling. Thanks for the many happy times and friendship in project after project over the years, together with you.
Björn Biber, anesthesia professor, for constructive scientific discussions, guide-lines, encouragement and friendship in many years.
Ola Winsö, anesthesia associate professor, head of the academic section, anesthe-siology, for generous support and good working conditions.
Steen Jensen, from cardiology, for skillful scientific discussions and advising in the specific scientific field.
Per Hohner, thoracic anesthesia, posthumously. Per was very much involved in our daily work and our research projects. We all miss him.
Margareta Östman, thoracic anesthesia, co-worker from the clinical studies. Thanks for your enormous work and co-operation during the decades and great help with scientific questions.
Barbro Österlund, thoracic anesthesia, co-worker, for helpful professional han-dling of some of the study patients, and for demonstrating your own technique for introducing catheters into the coronary sinus with your special ‘talking’ method.

Acknowledgements
59
My colleagues at the department of Perfusion, Heart Centre at the University Hos-pital of Umeå: Erica Jansson, Lena Lindholm, Staffan Svenmarker, Ronny Lindholm and Micael Appelblad. You have been a fantastic group. You have been helpful and have given inspiration, happiness, and a good scientific atmos-phere in the daily work at the Heart Centre.
Pernilla Abrahamsson, Anna-Maja Åberg, and Ullagreta Gidlund anesthesia research, for handling and analyses of blood samples and other help.
Carola Sundholm and Margot Johansson cardiology research, for great help in the project.
Milos Kesek, Folke Rönn and Ulla-Britt Diamant, cardiology and electrophysi-ology, for support and helpful assistance in the project.
My son Daniel with his Annica and my daughter Nina with Mattias, for giving me strength and happiness, filling this life with meaning.
My grandchildren Linnea, Tinde, Linus and Mira, who are my ‘ögonstenar’.
My best friend and much loved and loving wife Ing-Marie Häggmark. Thank you for filling my life with love and joy and meaning. I am grateful for having the privilege to share my life with you.
Populärvetenskaplig sammanfattning på svenska
60
Populärvetenskaplig sammanfattning på svenska
Introduktion. Det finns osäkerhet med vilken precision olika metoder har för att detektera syrebrist, nedsatt cirkulation (ischemi) i hjärtat. På operationssalar används flera metoder, i hjärtintensivvård är elektrokardiografi (EKG) obligatorisk och s.k ST segment analys i EKG är vanligt för att upptäcka ischemi. Andra faktorer än ischemi kan försvåra ST analysens möjlighet att detektera ischemi. Ökande hjärtfrekvens (HR) är en sådan faktor. Vektorkardiografi (VKG) är en form av EKG, som särskilt studeras i denna avhandling.
Metoder. Studie I. Sövda kärlkirurgiska patienter med kranskärlsjukdom under-söktes under operation och intensivvård. EKG, parametrar för cirkulation, hjärtmekanik och ämnesomsättning (laktat) analyserades avseende detektion av ischemi. Studie II. Vakna individer utan kranskärlsjukdom pacades till ökande hjärtfrekvens under VKG ST analys. Studie III. Sövda grisar undersöktes med ischemimarkörer i mikrodialys från hjärtat och VKG ST analys under ökande hjärtfrekvens samt under övergående stopp i kranskärlsblodflöde (ischemi). Studie IV. 35 sövda kranskärlssjuka och 10 individer utan kranskärlssjuka undersöktes i samband med hjärt- eller kärloperation med ischemimarkörer från blod direkt från hjärtat (laktat) och VKG ST analys. I Studierna II, III och IV analyserades ST vector magnitude (ST-VM), relativ spatiell förändring - ST change vector magnitude (STC-VM) och ST vektorns vinkelförändring (STC-VA) under ökande hjärtfrekvens.
Resultat. Studie I. Endast svag inbördes överensstämmelse mellan de olika metoderna konstaterades avseende detektion av ischemi. Studie II. ST-VM visade ett heterogent mönster under ökande hjärtfrekvens medan STC-VM ökade systematiskt från hjärtfrekvens 100 och uppåt trots frånvaro av ischemi. Studie III. I likhet med Studie II, sågs heterogent mönster för ST-VM och ökande STC-VM under stigande hjärtfrekvens utan samtidig ischemi hos försöksdjuren. Under framkallad ischemi utan hjärtfrekvensstegring sågs stora ökningar i båda ST-VM och STC-VM. Studie IV. Hos kranskärlssjuka individer sågs betydande ST vektor förändringar såväl av hjärtfrekvens som av ischemi. Sensitivitet och specificitet för olika VKG ST ischemikriterier beräknades och en metod att korrigera STC-VM för hjärtfrekvensstegring indikerade att ischemikriterier kan framledes finslipas.
Slutsatser. Överensstämmelse mellan olika metoder var liten för detektion av ischemi i en tidigt genomförd studie. Vid ökande hjärtfrekvens visar den i kliniken etablerade VKG parametern ST-VM ett svårtolkat mönster medan STC-VM ökar systematiskt, vilket accentueras vid samtidig ischemi. Hjärtfrekvensen bör beaktas när man övervakar patienter med EKG metoder. Med en korrektionsfaktor för hjärtfrekvensstegring inlagd i ST analysen kan den diagnostiska säkerheten öka. Ytterligare studier i olika patientpopulationer är angelägna.

References
61
REFERENCES
1. Kern MJ. Coronary blood flow and myocardial ischemia. In Braunwald´s heart disease: a textbook of cardiovascular medicine. Philadelphia: Elsevier Saunders 20052, pp1103-27.
2. Näslund U, Häggmark S, Johansson G, Reiz S. Quantification of myocardium at risk and detection of reperfusion by dynamic vectorcardiographic ST segment monitoring in a pig occlusion-reperfusion model. Cardiovasc Res 1993;27(12):2170-8.
3. Jensen SM, Karp K, Rask P, Näslund U. Assessment of myocardium at risk with computerized vectorcardiography and technetium-99m-sestamibi-single photon emission computed tomography during coronary angioplasty. Scand Cardiovasc J 2002;36(1):11-8.
4. Cohen RD, Simpson R. Lactate metabolism. Anesthesiology 1975;43(6):661-73.
5. Williamson JR. Glycolytic control mechanisms. II. Kinetics of intermediate changes during the aerobic-anoxic transition in perfused rat heart. J Biol Chem 1966;241(21):5026-36.
6. Serruys PW, Wijns W, van den Brand M, Meij S, Slager C, Schuurbiers JC et al. Left ventricular performance, regional blood flow, wall motion, and lactate metabolism during transluminal angioplasty. Circulation 1984;70(1):25-36.
7. Cohn PF, Fox KM, Daly C. Silent myocardial ischemia. Circulation 2003;108(10):1263-77.
8. Einthoven W. Die galvanometerische registrierung des menschlichen Ekg, zugleich eine berurteeilung der Anwendung des capillar-electrometers in der physiologie. Pflugers Arch Gesamte Physiol Menschen Tiere 1903;99:472.
9. Sederholm M, Erhardt L, Sjögren A. Continuous vectorcardiography in acute myocardial infarction. Natural course of ST and QRS-vectors. Int J Cardiol 1983;4:53-63.
10. Silverberg RA, Diamond GA, Vas R, Tzivoni D, Swan HJ, Forrester JS. Noninvasive diagnosis of coronary artery disease: the cardiokymographic stress test. Circulation 1980;61(3):579-89.
11. Wikström G, Ronquist G, Nilsson S, Maripu E, Waldenström A. Continuous monitoring of energy metabolites using microdialysis during myocardial ischaemia in the pig. Eur Heart J 1995;16(3):339-47.

References
62
12. Schmitt C, Lehmann G, Schmieder S, Karch M, Neumann FJ, Schömig A. Diagnosis of acute myocardial infarction in angiographically documented occluded infarct vessel : limitations of ST-segment elevation in standard and extended ECG leads. Chest 2001;120(5):1540-6.
13. Gibbons RJ, Balady GJ, Bricker JT, Chaitman BR, Fletcher GF, Froelicher VF et al. ACC/AHA 2002 guideline update for exercise testing: summary article: a report of the American College of Cardiology/American Heart Association Task Force on Practice Guidelines (Committee to Update the 1997 Exercise Testing Guidelines). Circulation 2002;106(14):1883-92.
14. Hall R, O'Regan N, Gardner M. Detection of intraoperative myocardial ischaemia- a comparison among elecrtocardiographic, myocardial metabolic measurements in patients with reduced ventricular function. Can J Anaesth 1995;42:6:487-94.
15. Mangano DT, Browner WS, Hollenberg M, London MJ, Tubau JF, Tateo IM. Association of perioperative myocardial ischemia with cardiac morbidity and mortality in men undergoing noncardiac surgery. The Study of Perioperative Ischemia Research Group. N Engl J Med 1990;323(26):1781-8.
16. van Daele ME, Sutherland GR, Mitchell MM, Fraser AG, Prakash O, Rulf EN et al. Do changes in pulmonary capillary wedge pressure adequately reflect myocardial ischemia during anesthesia? A correlative preoperative hemodynamic, electrocardiographic, and transesophageal echocardiographic study. Circulation 1990;81(3):865-71.
17. Fleisher LA. Real-time intraoperative monitoring of myocardial ischemia in noncardiac surgery. Anesthesiology 2000;92(4):1183-8.
18. Landesberg G, Mosseri M, Zahger D, Wolf Y, Perouansky M, Anner H et al. Myocardial infarction after vascular surgery: the role of prolonged stress-induced, ST depression-type ischemia. J Am Coll Cardiol 2001;37(7):1839-45.
19. Landesberg G. Monitoring for myocardial ischemia. Best Pract Res Clin Anaesthesiol 2005;19(1):77-95.
20. Drew BJ, Wung SF, Adams MG, Pelter MM. Bedside diagnosis of myocardial ischemia with ST-segment monitoring technology: measurement issues for real-time clinical decision making and trial designs. J Electrocardiol 1998;30 Suppl:157-65.
21. Jensen SM, Johansson G, Osterman G, Reiz S, Näslund U. On-line computerized vectorcardiography monitoring of myocardial ischemia during coronary angioplasty: comparison with 12-lead electrocardiography. Coron Artery Dis 1994;5(6):507-14.

References
63
22. Näslund U. Myocardial ischemia and infarction in the closed-chest pig. Thesis, University of Umeå, 1992.
23. Jensen SM. Continuous vectorcardiography and myocardial ischemia. Thesis, University of Umeå, 2001.
24. Opie LH. Mechanism of cardiac contraction and relaxation. In Braunwald´s Heart Disease. Elsevier Sauders 2005 Chapter 19, pp457-89.
25. Näslund U, Häggmark S, Johansson G, Reiz S. Ischaemia and reperfusion induced transient QRS vector changes: relationship to size of the ischaemic territory. Cardiovasc Res 1993;27(2):327-33.
26. Zipes DP, Rubart M. Genesis of cardiac arrythmias: electrocardiological considerations, Chapter 27. In Braunwald´s Heart Disease, Textbook. Elsevier Saunders 2005,7th Edition, pp 659-71.
27. Frank E. Planar dipole loops. Circ Res 1956;4(3):257-62.
28. Schaeffer H, Haas HG. Circulation. In Handbook of physiology. Hamilton WF, Dow P. Washington DC: American Physiological Society 1962, pp334-41.
29. Frank E. Accurate, clinically practical system for spatial vectorcardiography. Circulation 1956;13:737-44.
30. Kesek M. Traces of repolarization inhomogeneity in the ECG. Thesis, Uppsala University, 2005
31. Chou TC. When is the vectorcardiogram superior to the scalar electrocardiogram? J Am Coll Cardiol 1986;8(4):791-9.
32. Edenbrandt L, Pahlm O. Vectorcardiogram synthesized from a 12-lead ECG: superiority of the inverse Dower matrix. J Electrocardiol 1988;21(4):361-7.
33. Kors JA, van Herpen G, Sittig AC, van Bemmel JH. Reconstruction of the Frank vectorcardiogram from standard electrocardiographic leads: diagnostic comparison of different methods. Eur Heart J 1990;11(12):1083-92.
34. Pilhall M. Vectorcardiographic QRS changes during exercise. Thesis, University of Göteborg, 1992
35. Okin PM, Anderson KM, Levy D, Kligfield P. Heart rate adjustment of exercise-induced ST segment depression. Improved risk stratification in the Framingham Offspring Study. Circulation 1991;83(3):866-74.
36. Elamin MS, Boyle R, Kardash MM, Smith DR, Stoker JB, Whitaker W et al. Accurate detection of coronary heart disease by new exercise test. Br Heart J 1982;48(4):311-20.
References
64
37. Lachterman B, Lehmann KG, Detrano R, Neutel J, Froelicher VF. Comparison of ST segment/heart rate index to standard ST criteria for analysis of exercise electrocardiogram. Circulation 1990;82(1):44-50.
38. Pilhall M, Riha M, Jern S. Ischaemic heart disease and the changes in the QRS and ST segments during exercise: a pilot study with a novel vectorcardiographic system. Clin Physiol 1992;12(2):209-23.
39. Okin PM, Kligfield P. Heart rate adjustment of ST segment depression and performance of the exercise electrocardiogram: a critical evaluation. J Am Coll Cardiol 1995;25(7):1726-35.
40. Morise AP. Accuracy of heart rate-adjusted ST segments in populations with and without posttest referral bias. Am Heart J 1997;134(4):647-55.
41. Jensen SM, Häggmark S, Johansson G, Näslund U. On-line computerized vectorcardiography: Influence of body position, heart rate, radiographic contrast fluid and myocardial ischemia. Cardiology 1997;88:576-84.
42. Kligfield P, Okin PM. Heart rate adjustment of ST depression in patients with coronary disease and negative standard exercise tests. J Electrocardiol 1999;32 Suppl:193-7.
43. MacLeod RS, Punske B, Yilmaz B, Shome S, Taccardi B. The role of heart rate in myocardial ischemia from restricted coronary perfusion. J Electrocardiol 2001;34 Suppl:43-51.
44. Dellborg M, Emanuelsson H, Riha M, Swedberg K. Dynamic QRS complex and ST segment monitoring by continuos vectorcardiography during coronary angioplasty. Coron Artery Dis 1991;2:43-52.
45. Sederholm M, Grøttum P, Erhardt L, Kjekshus J. Quantitative assessment of myocardial ischemia and necrosis by continuous vectorcardiography and measurement of creatine kinase release in patients. Circulation 1983;68(5):1006-12.
46. Sederholm M. Evolution of ischemia and necrosis in acute myocardial infarction as assessed by continuous vectorcardiography. Thesis, Karolinska institutet, Stockholm, 1984.
47. Grottum P. Quantification and monitoring of acute myocardial ischemia and infarction. Thesis, University of Oslo, 1990
48. Dellborg M. Dynamic vectorcardiographic monitoring of patients during myocardial ischemia and infarction. Thesis, University of Göteborg, 1991
49. Lundin P. On-line vectorcardiography in ischemic heart disease. Thesis, Karolinska institutet, Stockholm, 1995
References
65
50. Gannedahl P. Computerized vectorcardiography for On-line cardiac monitoring in non-cardiac surgery. Thesis, Karolinska institutet, Stockholm, 1997
51. Andersen K. Vectorcardiographic ST-segment monitoring in the unstable coronary syndrome. Thesis, University of Göteborg, 1997
52. Eriksson P. Ischemic heart disease in patients with bundle-branch block. Thesis, University of Göteborg, 1998
53. Klootwijk P. Dynamic computer-assisted ST segment monitoring in patients with acute coronary syndromes. Thesis, University Hospital Dijkzigt, Rotterdam 1998
54. Abrahamsson P. On the prognosis and risk assessment in unstable coronary syndrome, Thesis, University of Göteborg, 1999
55. Jensen J. On-line vectorcardiography during coronary angioplasty and unstable coronary artery disease. Thesis, Karolinska institutet Stockholm, 2000
56. Johansson P. On the dynamic ST-segment during acute myocardial infarction. Thesis, University of Umeå, 2001
57. Gunnarsson TG. On bunle branch block and acute myocardial infarction. Thesis, University of Göteborg, 2001
58. Dellborg M, Topol EJ, Swedberg K. Dynamic QRS complex and ST segment vectorcardiographic monitoring can identify vessel patency in patients with acute myocardial infarction treated with reperfusion therapy. Am Heart J 1991;122(4 PT 1):943-8.
59. Gustafsson G, Dellborg M, Lindahl B, Wallentin L. Early diagnosis and exclusion of acute myocardial infarction by two hours' vector-ECG and determination of either myoglobin or CK-mb. BIOMACS-study. BIOchemical Markers in Acute Coronary Syndromes. Scand Cardiovasc J 2000;34(2):172-7.
60. Fesmire FM, Eriksson SV. Vectorcardiography risk stratifies emergency department chest pain patients with left ventricular hypertrophy on the initial 12-lead ECG. Ann Noninvasive Electrocardiol 2004;9(2):149-55.
61. Jernberg T, Abrahamsson P, Lindahl B, Wallentin L, Dellborg M. Comparison of continuous vectorcardiography and continuous 12-lead electrocardiography of patients with unstable coronary artery disease: do they identify the same population? Coron Artery Dis 2001;12(3):187-95.

References
66
62. Wesslén O, Ekroth R, Joachimsson PO, Nordgren L, Nyström SO, Tydén H. Continuous vectorcardiography in cardiac surgery: natural course of vector changes and relationship to myocardial oxygen uptake. Scand J Thorac Cardiovasc Surg 1991;25(1):45-50.
63. Nilsson J, Eriksson A, Naslund U. Transient Increase in ST-segment Changes at Time of Reperfusion in Acute Myocardial Infarction Treated by Coronary Angioplasty. J Invasive Cardiol 1998;10(5):246-50.
64. Häggmark S, Haney MF, Jensen SM, Johansson G, Näslund U. ST-segment deviations during pacing-induced increased heart rate in patients without coronary artery disease. Clin Physiol Funct Imaging 2005;25(4):246-52.
65. Ojanen S, Koivisto AM, Kööbi T, Korhonen P, Mustonen J, Laippala P et al. Isolated ultrafiltration affects dynamic vectorcardiographic ischemia monitoring parameters. Clin Nephrol 2002;57(5):359-64.
66. Gwechenberger M, Schreiber W, Kittler H, Binder M, Hohenberger B, Laggner AN et al. Prediction of early complications in patients with acute myocardial infarction by calculation of the ST score. Ann Emerg Med 1997;30(5):563-70.
67. Bellows WH, Bode RH, Levy JH, Foëx P, Lowenstein E. Noninvasive detection of periinduction ischemic ventricular dysfunction by cardiokymography in humans: preliminary experience. Anesthesiology 1984;60(2):155-8.
68. Ganz W, Tamura K, Marcus HS, Donoso R, Yoshida S, Swan HJ. Measurement of coronary sinus blood flow by continuous thermodilution in man. Circulation 1971;44(2):181-95.
69. Häggmark S, Biber B, Sjödin JG, Winsö O, Gustavsson B, Reiz S. The continuous thermodilution method for measuring high blood flows. Scand J Clin Lab Invest 1982;42(4):315-21.
70. Bålfors E, Häggmark S, Ariola Jr S, Biber B, Ponten J, Reiz S. In vitro analysis of thermal transport in coronary sinus thermodilution catheters. Clin Physiol 1983;3(5):469-76.
71. Klocke FJ, Ellis AK. Control of coronary blood flow. Annu Rev Med 1980;31:489-508.
72. Opie LH, Owen P, Thomas M, Samson R. Coronary sinus lactate measurements in assessment of myocardial ischemia. Am J Cardiol 1973;32:295-305.
References
67
73. Cribier A, Berland J, Cazor J, Letac B. Coronary hemodynamic data in ischemic heart disease according to ischemic behavor during pacing. Clin Cardiol 1983;6:17-28.
74. Parker JO, Chiong MA, West RO, Case RB. Sequential alterations in myocardial lactate metaboli, S-T segments, and left ventricular function during angina induced by atrial pacing. Circulation 1969;40(1):113-31.
75. Sidi A, Davis RF. Lactate extraction fails to accurately reflect regional lactate production in ischemic myocardium. J Cardiothorac Anesth 1989;3(3):321-8.
76. Gertz EW, Wisneski JA, Neese R, Bristow JD, Searle GL, Hanlon JT. Myocardial lactate metabolism: evidence of lactate release during net chemical extraction in man. Circulation 1981;63(6):1273-9.
77. Guth BD, Wisneski JA, Neese RA, White FC, Heusch G, Mazer CD et al. Myocardial lactate release during ischemia in swine. Relation to regional blood flow. Circulation 1990;81(6):1948-58.
78. Magovern GJ, Flaherty JT, Kanter KR, Schaff HV, Gott VL, Gardner TJ. Assessment of myocardial protection during global ischemia with myocardial gas tension monitoring. Surgery 1982;92(2):373-9.
79. Reiz S, Häggmark S, Ostman M. Invasive analysis of non-invasive indicators of myocardial work and ischaemia during anaesthesia soon after myocardial infarction. Acta Anaesthesiol Scand 1981;25(4):303-11.
80. Hohner P, Backman C, Diamond G, Friedman A, Häggmark S, Johansson G et al. Anaesthesia for abdominal aortic surgery in patients with coronary artery disease, Part II: Effects of nitrous oxide on systemic and coronary haemodynamics, regional ventricular function and incidence of myocardial ischaemia. Acta Anaesthesiol Scand 1994;38(8):793-804.
81. van Erkel AR, Pattynama PM. Receiver operating characteristic (ROC) analysis: basic principles and applications in radiology. Eur J Radiol 1998;27(2):88-94.
82. Jensen J, Eriksson SV, Lindvall B, Lundin P, Sylvén C. Prognostic role of on-line vectorcardiography as regards repeat revascularization after successful coronary angioplasty. Cardiology 2000;93(1-2):78-86.
83. Okin PM, Bergman G, Kligfield P. Effect of ST segment measurement point on performance of standard and heart rate-adjusted ST segment criteria for the identification of coronary artery disease. Circulation 1991;84(1):57-66.
References
68
84. Alpert JS, Thygesen K, Antman E, Bassand JP. Myocardial infarction redefined--a consensus document of The Joint European Society of Cardiology/American College of Cardiology Committee for the redefinition of myocardial infarction. J Am Coll Cardiol 2000;36(3):959-69.
85. Diercks DB, Shumaik GM, Harrigan RA, Brady WJ, Chan TC. Electrocardiographic manifestations: electrolyte abnormalities. J Emerg Med 2004;27(2):153-60.
86. Platia EV, Weisfeldt ML, Franz MR. Immediate quantitation of antiarrhythmic drug effect by monophasic action potential recording in coronary artery disease. Am J Cardiol 1988;61(15):1284-7.
87. Flinck A, Selin K. Vectorcardiographic changes during cardioangiography with iodixanol and ioxaglate. Int J Cardiol 2000;76(2-3):173-80.
88. Mintchev MP, Rashev PZ, Bowes KL. Misinterpretation of human electrogastrograms related to inappropriate data conditioning and acquisition using digital computers. Dig Dis Sci 2000;45(11):2137-44.
89. Sylvén C, Sederholm M. Potassium and myoglobin release and ST and QRS vector changes during acute myocardial infarction. Clin Physiol 1988;8(2):129-35.
90. Katz A. Physiology of the heart. In Physiology of the heart, Textbook third edition. Braunwald E. Philadelphia: Lippincott 2000
91. Miyata A, Dowell JD, Zipes DP, Rubart M. Rate-dependent [K+](o) accumulation in canine right atria in vivo: electrophysiological consequences. Am J Physiol Heart Circ Physiol 2002;283(2):H506-17.
92. Kanno S, Saffitz JE. The role of myocardial gap junctions in electrical conduction and arrhythmogenesis. Cardiovasc Pathol 2001;10(4):169-77.
93. Poelzing S, Akar FG, Baron E, Rosenbaum DS. Heterogeneous connexin43 expression produces electrophysiological heterogeneities across ventricular wall. Am J Physiol Heart Circ Physiol 2004;286(5):H2001-9.
94. Spach MS, Heidlage JF, Dolber PC, Barr RC. Electrophysiological effects of remodeling cardiac gap junctions and cell size: experimental and model studies of normal cardiac growth. Circ Res 2000;86(3):302-11.
95. Hayashi H, Okajima M, Yamada K. Atrial T (Ta) loop in patients with A-V block: a trial to differentiate normal and abnoral groups. Am Heart J 1976;91(4):492-500.
96. Hayashi H, Okajima M, Yamada K. Atrial T (Ta) loop in dogs with or without atrial injury. Am Heart J 1976;91(5):607-17.

References
69
97. Hayashi H, Okajima M, Yamada K. Atrial T(Ta) wave and atrial gradient in patients with A-V block. Am Heart J 1976;91(6):689-98.
98. Mirvis DM, Wilson JL. Determination of the spatial and intensity properties of atrial repolarization potentials in the dog. J Electrocardiol 1986;19(2):99-107.
99. Debbas NM, Jackson SH, de Jonghe D, Robert A, Camm AJ. Human atrial repolarization: effects of sinus rate, pacing and drugs on the surface electrocardiogram. J Am Coll Cardiol 1999;33(2):358-65.
100. Heller GV, Aroesty JM, McKay RG, Parker JA, Silverman KJ, Come PC et al. The pacing stress test: a reexamination of the relation between coronary artery disease and pacing-induced electrocardiographic changes. Am J Cardiol 1984;54(1):50-5.
101. Valsson F, Lundin S, Kirnö K, Hedner T, Houltz E, Saito Y et al. Atrial natriuretic peptide attenuates pacing-induced myocardial ischemia during general anesthesia in patients with coronary artery disease. Anesth Analg 1999;88(2):279-85.
102. Viik J, Lehtinen R, Malmivuo J. Detection of coronary artery disease using maximum value of ST/HR hysteresis over different number of leads. J Electrocardiol 1999;32 Suppl:70-5.
103. Bjurö T, Gullestad L, Endresen K, Nordlander M, Malm A, Höglund L et al. Evaluation of ST-segment changes during and after maximal exercise tests in one-, two- and three-vessel coronary artery disease. Scand Cardiovasc J 2004;38(5):270-7.