Embed Size (px)
Citation preview
Grade 11Central Catholic High School
Effects of Whey Protein on Microbial Survivorship
William McCarthy

Background Information
• Annual sales of muscle mass products in the US is over $2.7 billion
• 50,000 health problems a year due to muscle mass products
• How these products affect microbial flora and the mechanism of the health problems has not been well researched
• The supplement industry is largely unregulated

Saccharomyces cerevisiae (Yeast)• Saccharomyces cerevisiae • Easy to manipulate in the
laboratory.• Most commonly studied
cell.• Very similar in structure
and biochemistry to more complex eukaryotes, including human cells.
• Buds in single colonies, can be easily counted.

Escherichia coli
• Large and diverse group of gram (-) bacteria Surrounded by an extra
cell wall composed of lipopolysaccharides
• Free living symbiont, or pathogen
• Common prokaryotic cell model

Purpose:
• To determine the effects of whey protein muscle supplements on yeast and E. coli survivorship.

Hypothesis:
• Null hypothesis: The Whey protein powder will not have a significant effect on the survivorship of E.coli or Saccharomyces cerevisiae.

Materialso Labeling tapeo Ethanolo Latex gloveso E. coli DH5 Alphao Saccharomyces cerevisiae
(Common Yeast)o Micropipetteso Micro racko Micro tubeso LB media (0.5% yeast
extract, 1% tryptone, 1% sodium chloride).
o CVS brand whey protein powder
o SDF (sterile dilution fluid) (10 mM KH2PO4, 10 mM K2HPO4, 1 mM MgSO4, 0.1 mM CaCl2, 100 mM NaCl)
o Turntableo Luria Broth agar plateso Bunsen burnero Vortexo Sidearm flasko Spreader barso Klett spectrophotometero Incubator

Liquid Pulse Procedure
1. E. Coli and Saccharomyces cerevisiae were grown overnight in sterile LB media.
2. Samples of the overnight cultures were added to fresh media in a sterile sidearm flask
3. The cultures were placed in incubators (30°C and 37°C) until a density of 50 Klett spectrophotometer units were reached. This represents cell densities of approximately 107 cells/mL for yeast and 108 cells/mL for E. coli.
4. The culture was diluted in a sterile dilution fluid to a concentration of approximately 105 cells/mL
5. 10 grams of whey powder was mixed with 16 ounces of water to create the recommended concentration
6. The resulting whey/water solution was mixed with SDF to create the following experimental concentrations:

Liquid Pulse Concentration Chart
Yeast/ E.coli
Whey/Water Solution
SDF Total Volume
0% 1 ml 0ml 1ml 2ml
1% 1 ml 0.02 ml 0.98 ml 2ml
10% 1 ml 0.2 ml 0.8 ml 2ml
20% 1ml 0.4 ml 0.6 ml 2ml

Liquid Procedure cont.
6. The solutions were then mixed by vortexing and allowed to sit at room temperature for 15 minutes
7. After vortexing to evenly suspend cells, 100 µL aliquots were removed from the tubes and spread on LB agar plates
8. The plates were incubated at 37°C for 24 hours9. The resulting colonies were counted visually. Each
colony is assumed to have risen from one cell

Effects of Whey Protein on E.coli Survivorship
control 1% 10% 20%0
20406080
100120140160180
Whey Protein Concentration
Aver
gae
Surv
ivin
g Co
loni
es 164.6170
144.3125.5

Statistical Analyses
• ANOVA: Single Factor– Analysis of Variation– Statistical test that
compares the means of multiple groups
– P-value from ANOVA testing identifies significance if P-value is < 0.05
• Dunnett’s Test– Statistical test that
compares an experimental group directly to the control group
– Identifies that the experimental group is significantly different than the control if t-value > t-crit

E.coli -ANOVA
• The P-Value suggests that there is a significant effect
Alpha: 0.05
Anova: Single Factor
SUMMARYGroups Count Sum Average Variance
control 6 1020 170 302.41% 6 988 164.6667 129.8667
10% 6 866 144.3333 187.466720% 6 753 125.5 70.7
ANOVASource of Variation SS df MS F P-value F crit
Between Groups 7454.458 3 2484.819 14.39571 3.15E-05 3.098391Within Groups 3452.167 20 172.6083
Total 10906.63 23

Dunnett’s Test: E.coli
Variable Concentrations
T-Value Interpretation
T-Crit=2.447 Whey Protein
1% 0.634 not significant
10% 3.170 SIGNIFICANT
20% 5.289 SIGNIFICANT
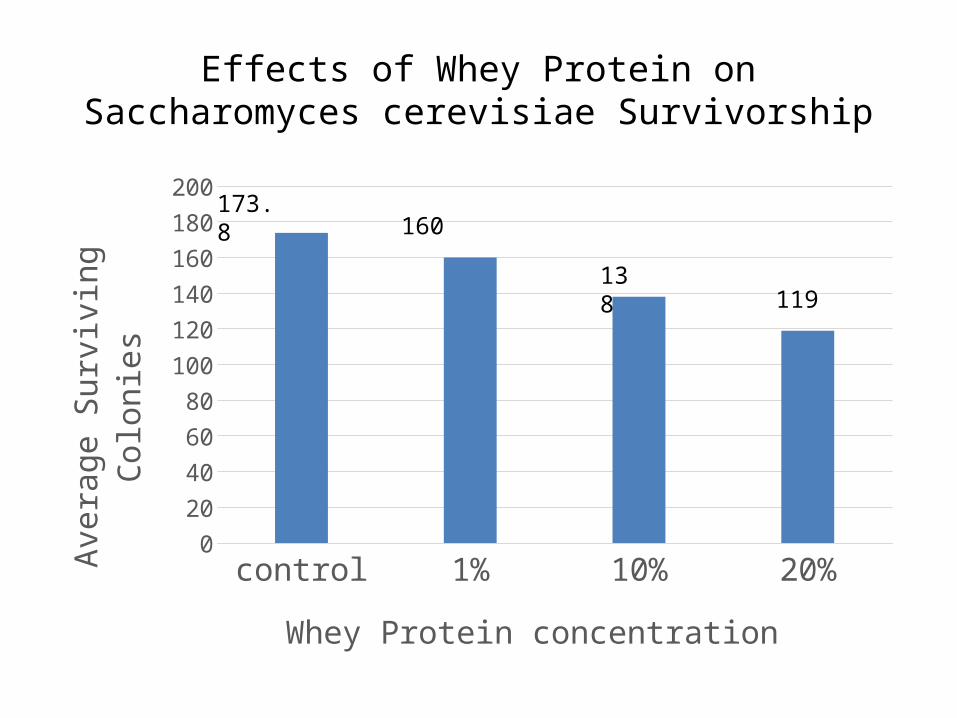
Effects of Whey Protein on Saccharomyces cerevisiae Survivorship
control 1% 10% 20%0
20
40
60
80
100
120
140
160
180
200
Whey Protein concentration
Aver
age
Surv
ivin
g Co
loni
es
173.8160
138 119
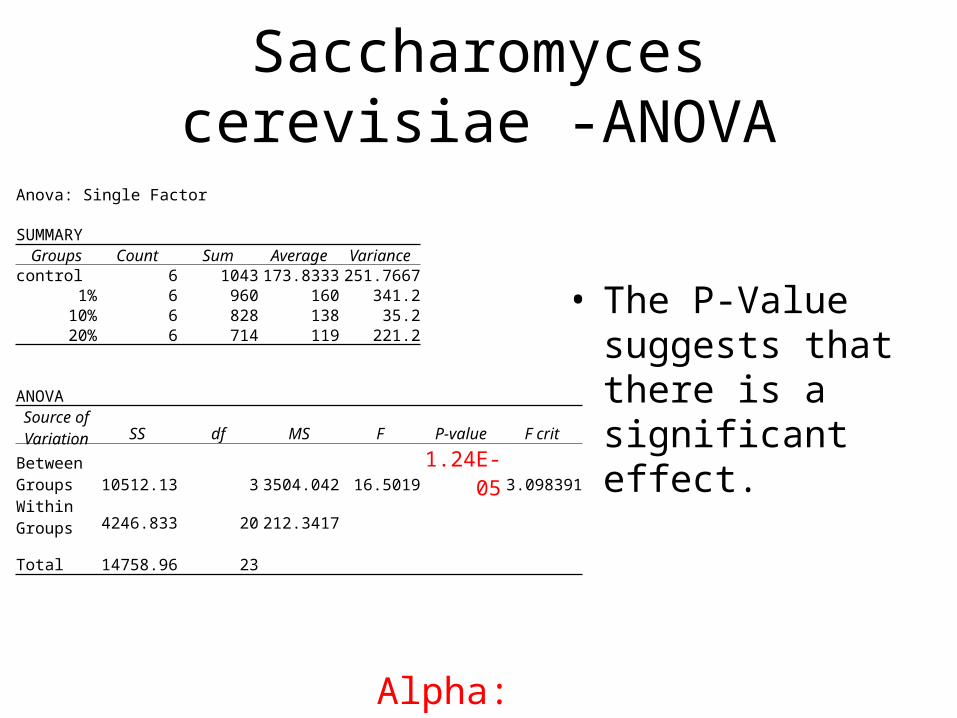
Saccharomyces cerevisiae -ANOVA
• The P-Value suggests that there is a significant effect.
Alpha: 0.05
Anova: Single Factor
SUMMARYGroups Count Sum Average Variance
control 6 1043 173.8333 251.76671% 6 960 160 341.2
10% 6 828 138 35.220% 6 714 119 221.2
ANOVASource of Variation SS df MS F P-value F crit
Between Groups 10512.13 3 3504.042 16.5019 1.24E-05 3.098391Within Groups 4246.833 20 212.3417
Total 14758.96 23

Dunnett’s Test: Saccharomyces cerevisiae
Variable Concentrations
T-Value Interpretation
T-Crit=2.447 Whey Powder
1% 1.664 not significant
10% 4.259 SIGNIFICANT
20% 6.518 SIGNIFICANT
Conclusions
• The null hypothesis may be rejected, for both E.coli and Saccharomyces cerevisiae , the Dunnett’s Tests show a significant effect in the 10% and 20% of the Whey protein• It may be accepted for 1%

Limitations
• Slight lag in synchronization of plating• Inability to count the exact amount of cells on
each plate• Limited number of low concentrations• Only one exposure time• Only survivorship assessed

Extensions
• More trials • Different microbes• Varying exposures and exposure
times• Synergistic effects• Wider variety of variables

References
• www.medicalnewstoday.com/articles/68511• http://www.cdc.gov/ecoli/• http://onlinelibrary.wiley.com/journal/10.111
1/%28ISSN%291567-1364
• http://www.forbes.com/sites/davidlariviere/2013/04/18/nutritional-supplements-flexing-their-muscles-as-growth-industry/
• http://www.bbc.co.uk/news/business-12277808