Embed Size (px)
DESCRIPTION
Gra6036- Multivartate Statistics with Econometrics (Psychometrics) Distributions Estimators. Ulf H. Olsson Professor of Statistics. Two Courses in Multivariate Statistics. Gra 6020 Multivariate Statistics Applied with focus on data analysis Non-technical - PowerPoint PPT Presentation
Citation preview

Gra6036- Multivartate Statistics withEconometrics (Psychometrics)
DistributionsEstimators
Ulf H. Olsson
Professor of Statistics

Ulf H. Olsson
Two Courses in Multivariate Statistics
• Gra 6020 Multivariate Statistics• Applied with focus on data analysis• Non-technical
• Gra 6036 Multivariate Statistics with Econometrics• Technical – focus on both application and understanding “basics”• Mathematical notation and Matrix Algebra

Ulf H. Olsson
Course outline Gra 6036• Basic Theoretical (Multivariate) Statistics mixed with econometric
(psychometric) theory• Matrix Algebra• Distribution theory (Asymptotical)
• Application with focus on regression type models• Logit Regression • Analyzing panel data• Factor Models• Simultaneous Equation Systems and SEM
• Using statistics as a good researcher should• Research oriented
Ulf H. Olsson
Evaluation
• Term paper (up to three students) 75%• 1 – 2 weeks
• Multipple choice exam (individual) 25%• 2 – 3 hours

Ulf H. Olsson
Teaching and communication
• Lecturer 2 – 3 weeks: 3 hours per week (UHO)• Theory and demonstrations
• Exercises 1 week: 2 hours (DK)• Assignments and Software applications (SPSS/EVIEWS/LISREL)
• Blackboard and Homepage• Assistance: David Kreiberg (Dep.of economics)

Ulf H. Olsson
Week hours Read
2 Basic Multivariate Statistical Analysis. Asymptotic Theory
3 Lecture notes
3 Logit and Probit Regression 3 Compendium: Logistic Regression
4 Logit and Probit Regression 3 Compendium: Logistic Regression
5 Exercises 2
6 Panel Models 3 Book chapter (14): Analyzing Panel Data: Fixed – and Random-Effects Models
7 Panel Models 3 Book chapter (14): Analyzing Panel Data: Fixed – and Random-Effects Models
8 Exercises 2

Ulf H. Olsson
9 Factor Analysis/ Exploratory Factor Analysis
3 Structural Equation Modeling. David Kaplan, 2000
10 Confirmatory Factor Analysis 3 Structural Equation Modeling. David Kaplan, 2000
11 Confirmatory Factor Analysis 3 Structural Equation Modeling. David Kaplan, 2000
12 Exercises 2
13 Simultaneous Equations 3 Structural Equation Modeling. David Kaplan, 2000
15 Structural Equations Models 3 Structural Equation Modeling. David Kaplan, 2000
16 Structural Equations Models 3 Structural Equation Modeling. David Kaplan, 2000
17 Exercises 2

Ulf H. Olsson
Any Questions ?

Ulf H. Olsson
Univariate Normal Distribution•
•

Ulf H. Olsson
Cumulative Normal Distribution

Ulf H. Olsson
Normal density functions
2 21/ 2 ( ) /2 1( | , )
2
xx e
2
21( ) ,
2(0,1)
u xu e u
u N

Ulf H. Olsson
The Chi-squared distributions
2 2(0,1) (1)If u N then z u
21 2
2
1
, ,.... (1) var
( )
n
n
ii
If z z z are n independent iables
then z n
2
2
( ( ))
( ( )) 2
E n n
Var n n

Ulf H. Olsson
The Chi-squared distributions2
1 2
2 2
1
, ,.... (0, ) var
( / ) ( )
n
n
i ii
If u u u are n independent N iables
then u n
21 2
2 2
1
, ,.... ( , ) var
( / ) ( , )
n
n
i ii
If u u u are n independent N iables
then u n
2
2
( ( , ))
( ( , )) 2 4
E n n
Var n n

Ulf H. Olsson
Bivariate normal distribution

Ulf H. Olsson
Standard Normal density functions
2
2
2
1)(
u
eu
)2()1(2
1
2
222
)1(2
1),(
vuvu
evu
),....,('
;)2(
1),...,.(
21
)'2
1(
2/12/21
1
n
nn
uuu
euuu
u
uu

Ulf H. Olsson
Estimator
• An estimator is a rule or strategy for using the data to estimate the parameter. It is defined before the data are drawn.
• The search for good estimators constitutes much of econometrics (psychometrics)
• Finite/Small sample properties• Large sample or asymptotic properties
• An estimator is a function of the observations, an estimator is thus a sample statistic- since the x’s are random so is the estimator

Ulf H. Olsson
Small sample properties
( )
( )
Unbiased E
Biased E
1 1 2: ( ) ( )is more efficient Var Var

Ulf H. Olsson
Large-sample properties
: lim ( ) 1
.
nnConsistency P
for all
: lim ( )nnAsymptotic unbiased E
11
2
( ): lim 1
( )n
Varis Asymptotic Efficent
Var
for all

Ulf H. Olsson
Introduction to the ML-estimator
1 2( , ,......, );k i
Let be the data matrix
x x x where x are vectors
1 21
:
( , ,......, , ) ( , ) ( | )k
k ii
The Likelihood function is as a function of the unknown
parameter vector
f x x x f x L X

Ulf H. Olsson
Introduction to the ML-estimator• The value of the parameters that maximizes this function are the maximum likelihood
estimates • Since the logarithm is a monotonic function, the values that maximizes L are the same
as those that minimizes ln L
max in ( )
ln ( )0
ML
The necessary conditions for imiz g L is
L
We denote the ML estimator
( )L L is the Likelihood function evaluated at

Ulf H. Olsson
Introduction to the ML-estimator
• In sampling from a normal (univariate) distribution with mean and variance 2 it is easy to verify that:
22
1
1( )
n
ML iMLi
n
ML ii
x andn
x xn
•MLs are consistent but not necessarily unbiased

Two asymptotically Equivalent TestsLikelihood ration test
Wald test

Ulf H. Olsson
The Likelihood Ratio Test
.Let be a vector of parameters to be estimated
U RTwo ML estimates and
2
arg 2ln
( )
The l e sample distribution of
is d
R
U
LThe likelihood ratio is
L

Ulf H. Olsson
The Wald Test
1 2, , ( ) ' ( ) ( )If x N then x x is d
0
0
1
2
: ( ) ,
( ( ) ) ' ( ( ) )
( )
H c q
then under H
W c q U c q
is d
Ulf H. Olsson
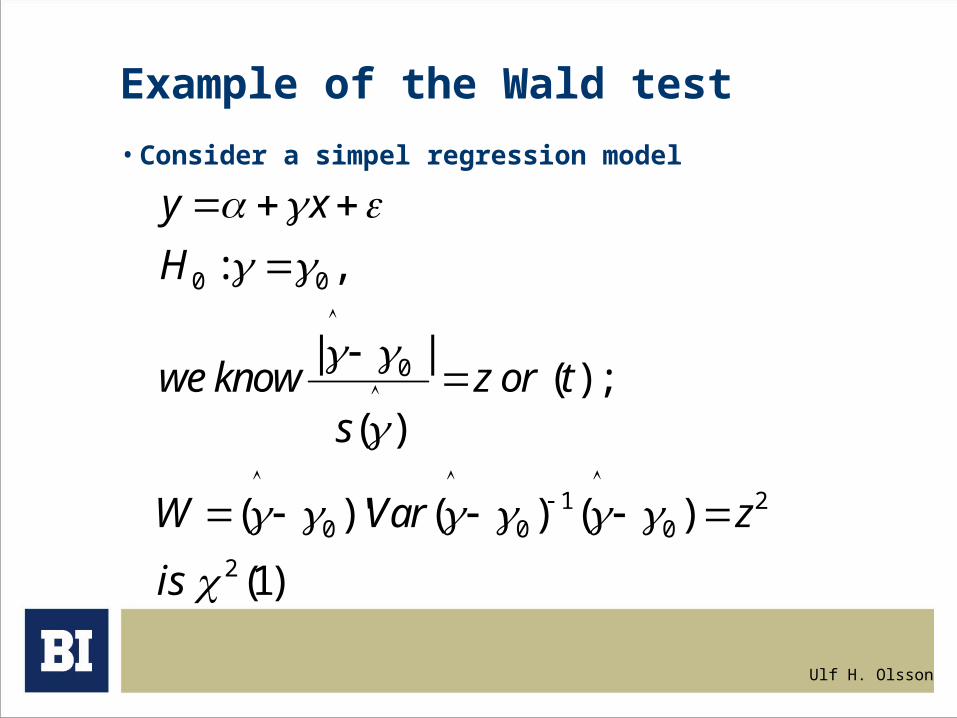
Example of the Wald test
• Consider a simpel regression model
0 0
0
1 20 0 0
2
: ,
| |( ) ;
( )
( ) ' ( ) ( )
(1)
y x
H
we know z or ts
W Var z
is

Ulf H. Olsson
Likelihood- and Wald. Example from Simultaneous Equations Systems
• N=218; # Vars.=9; # free parameters = 21;• Df = 24;• Likelihood based chi-square = 164.48• Wald Based chi-square = 157.96

Assessing Normality and Multivariate Normality (Continuous variables)Skewness
Kurtosis
Mardias test

Ulf H. Olsson
Bivariate normal distribution

Ulf H. Olsson
Positive vs. Negative SkewnessExhibit 1
These graphs illustrate the notion of skewness. Both PDFs have the same expectation and variance. The one on the left is positively skewed. The one on the right is negatively skewed.

Ulf H. Olsson
Low vs. High KurtosisExhibit 1
These graphs illustrate the notion of kurtosis. The PDF on the right has higher kurtosis than the PDF on the left. It is more peaked at the center, and it has fatter tails.

Ulf H. Olsson
J-te order Moments• Skewness• Kurtosis
( ) , 1; ( );jj
Population central moments
E X j E X
X is continuous and random
42 2
2
: 3Kurtosis
31 3/ 2
2
:( )
Skewness

Ulf H. Olsson
Skewness and Kurtosis
1 2
0 0
2
.
: 0 : 0
and can be estimated from a sample
We can test H Skewnes and H Kurtosis
by z and tests
1 22,
var .
var : (( ) ' ( ))p
We can even estimate and test for multi iate kurtosis
Multi iate kurtosis E X X

Ulf H. Olsson
To Next week
• Down load LISREL 8.8. Adr.: http://www.ssicentral.com/• Read: David Kaplan: Ch.3 (Factor Analysis)• Read: Lecture Notes