Embed Size (px)
Citation preview

GOVERNMENT OF GHANA
PUBLIC EXPENDITURE AND FINANCIAL ACCOUNTABILITY (PEFA) PERFORMANCE
ASSESSMENT REPORT
Based on the PEFA 2016 FRAMEWORK
September 25, 2018
Final Report
Funded by

GOVERNMENT OF GHANA
Public Expenditure and Financial Accountability (PEFA) Assessment
Report -September 2018
The quality assurance process followed in the production of this report satisfies all
the requirements of the PEFA Secretariat and hence receives the ‘PEFA CHECK’.
PEFA Secretariat
September 25, 2018

Currency: Ghanaian cedi (GH₵) Exchange rate, GH₵4.9 = US$1 (September 2018)
Fiscal Year = January - December

Table of Contents ABBREVIATIONS AND ACRONYMS .............................................................................................................. 1
EXECUTIVE SUMMARY ................................................................................................................................. 5
1. INTRODUCTION .................................................................................................................................. 17
2. COUNTRY BACKGROUND INFORMATION ......................................................................................... 21
3. ASSESSMENT OF PFM PERFORMANCE ............................................................................................. 35
PILLAR ONE: Budget reliability .............................................................................................................. 35
PI-1. Aggregate expenditure outturn ................................................................................................ 35
PI-2. Expenditure composition outturn ............................................................................................ 36
PI-3. Revenue outturn ....................................................................................................................... 39
PILLAR TWO: Transparency of public finances ..................................................................................... 41
PI-4. Budget classification ................................................................................................................. 41
PI-5. Budget documentation ............................................................................................................. 44
PI-6. Central government operations outside of financial reports .................................................. 46
PI-7. Transfers to subnational governments .................................................................................... 58
PI-8. Performance information for service delivery ......................................................................... 66
PI-9. Public access to fiscal information ........................................................................................... 71
PILLAR THREE: Management of assets and liabilities ........................................................................... 74
PI-10. Fiscal risk reporting ................................................................................................................. 74
PI-11. Public investment management ............................................................................................. 79
PI-11. Public investment management ............................................................................................. 79
PI-12. Public asset management ....................................................................................................... 82
PI-13. Debt management .................................................................................................................. 87
PILLAR FOUR: Policy-based fiscal strategy and budgeting ................................................................... 94
PI-14. Macroeconomic and fiscal forecasting ................................................................................... 94
PI-15. Fiscal strategy .......................................................................................................................... 98
PI-16. Medium-term perspective in expenditure budgeting ......................................................... 101
PI-17. Budget preparation process ................................................................................................. 104
PI-18. Legislative scrutiny of budgets ............................................................................................. 107
PILLAR FIVE: Predictability and control in budget execution ............................................................. 112
PI-19. Revenue administration ........................................................................................................ 112
PI-20. Accounting for revenues ....................................................................................................... 116
PI-21. Predictability of in-year resource allocation ........................................................................ 118
PI-22 Expenditure arrears ................................................................................................................ 122
PI-23. Payroll controls ..................................................................................................................... 125
PI-24. Procurement .......................................................................................................................... 129
PI-25. Internal controls on non-salary expenditures ...................................................................... 135
PI-26. Internal audit ......................................................................................................................... 137
PILLAR SIX: Accounting and reporting ................................................................................................. 144
PI-27 Financial Data Integrity .......................................................................................................... 144
PI-28. In-year budget reports .......................................................................................................... 147
PI-29. Annual financial reports ........................................................................................................ 150
PILLAR SEVEN: External scrutiny and audit ......................................................................................... 155
PI-30. External audit ........................................................................................................................ 155
PI-31. Legislative scrutiny of audit reports ..................................................................................... 161
4. CONCLUSIONS OF THE ANALYSIS OF PFM SYSTEMS ...................................................................... 166
5. GOVERNMENT PFM REFORM PROCESS .......................................................................................... 181
ANNEX 1: PERFORMANCE INDICATOR SUMMARY ................................................................................. 186
ANNEX 2: SUMMARY OF OBSERVATIONS ON THE INTERNAL CONTROL FRAMEWORK ........................ 203
ANNEX 3: SOURCES OF INFORMATION BY INDICATOR .......................................................................... 206
ANNEX 5: TRACKING CHANGE IN PERFORMANCE BASED ON THE 2011 VERSION OF PEFA .................. 222
ANNEX 6: PIs 1-2 EXPENDITURE DATA (2016 Framework) ..................................................................... 234
ANNEX 7: ANALYSIS FOR PI-2.2 COMPOSITION VARIANCE BY ECONOMIC CLASSIFICATION ................ 238
ANNEX 8: LIST OF PEOPLE MET ................................................................................................................ 239
ANNEX 9: Related recent PFM analysis ................................................................................................... 245
ANNEX 10: PIs 1-2 EXPENDITURE DATA (2011 Framework) ................................................................... 246

1
ABBREVIATIONS AND ACRONYMS
ABFA
Annual Budget Funding Amount
ACB Appeals and Complaints Board
ADMR Annual Debt Management Report
AFROSAI-E African Organization of English-Speaking Supreme Audit Institutions
AFS Annual Financial Statement
AG Auditor- General
AGA Autonomous Government Agencies
AMIS Audit Management Information System
ARIC Audit Report Implementation Committee
BCG Budgetary Central Government
BoG Bank of Ghana
CAAT Computer Assisted Auditing Technique
CAG Controller and Accountant- General
CAGD Controller and Accountant- General Department
CCS Commitment Control System
CD Custom’s Division
CF Consolidated Fund
CG Central Government
CISA Certified Information Systems Auditor
CoA Chart of Accounts
COFOG Classification of the Functions of Government
CS-DRMS Commonwealth Secretariat Debt Recording and Management System
CSO Civil Society Organization
DA District Assembly
DACF District Assemblies Common Fund
DACU Data Analysis and Capturing Unit (
DDF District Development Facility
DMCE Debt Management, Compliance and Enforcement Unit
DMD Debt Management Department Division
DP Development Partners
DSA Debt Sustainability Analyses
DTRD Domestic Tax Revenue Division
ECF Extended Credit Facility
ECG Electricity Company of Ghana
EOCO Economic and Organized Crime Office
ERFD Economic Research and Forecasting Division
E-SPV Electronic Salary Payment Voucher
EU European Union
FAA Financial Administration Act
FAR Financial Administration Regulations

2
FOAT Functional and Organizational Assessment Tool
FSD Fiscal Strategy Document
FX Foreign Exchange
FY Fiscal Year
GAS Ghana Audit Service
GCB Ghana Commercial Bank
GDP Gross Domestic Product
GEMSP Ghana Economic Management Strengthening Project
GETFGETFund Ghana Educational Trust Fund
GES Ghana Education Service
GFS Government Financial Statistics
GH₵ Ghanaian Cedi (local currency)
GHS Ghana Health Service
GIA Ghana Irrigation Authority
GIFMIS Government Ghana Integrated Financial Management Information System
GIIF Ghana Infrastructure Investment Fund
GNPC Ghana National Petroleum Corporation
GoG Government of Ghana
GRA Ghana Revenue Authority
GSGDA Ghana Shared Growth and Development Agenda
HR Human Resources
HRMIS Human Resource Management Information System
HSMTDP Health Sector Medium-Term Development Plan
IAA Internal Audit Agency
IAU Internal Audit Unit
ICB International Competitive Bidding
IGF Internally-Generated Funds
IMF International Monetary Fund
INTOSAI International Organization of Supreme Audit Institution
IPSAS International Public Sector Accounting Standards
IPPD Integrated Personal Payroll Database
IPPF International Professional Practice Framework
IT Information Technology
LC Letter of Credit
LI Legislative Instrument
LTO Large Taxpayers Office
MDAs Ministries, Departments, Agencies
MMDAs Municipal Metropolitan and District Assemblies
MLGRD Ministry of Local Government and Rural Development
MoE Ministry of Education
MoF Ministry of Finance
MoFA Ministry of Food and Agriculture
MoFEPMoF Ministry of Finance and Economic PlanningMinistry of Finance
MoH Ministry of Health

3
MTDMS Medium-Term Debt Management Strategy
MTEF Medium-Term Expenditure Framework
MTO Medium Taxpayers Offices
MU Management Unit
NACAP National Anti-Corruption Action Plan
NCB National Competitive Bidding
NDPC National Development Planning Commission
NGO Non-Governmental Organization
NHFIA National Health Fund Insurance Authority
NHIA National Health Insurance Authority
NHIF National Health Insurance Fund
NHIL National Health Insurance Levy
NTRU Non-Tax Revenue Unit
NR Not Rated
OT Oversight Team
PAC Public Accounts Committee
PAD Project Appraisal Document
PAF Performance Assessment Framework
PBB Program-Based Budgeting
PCP Project Concept Paper
PDID Public Debt and Investment Division
PDMO Public Debt Management Office
PDMR Public Debt Management Report
PEFA Public Expenditure and Financial Accountability
PEMU Public Expenditure Monitoring Unit
PETS Public Expenditure Tracking Studies
PFM Public Financeial Management
PFMA Public Financeial Management Assessment
PFMRP Public Financeial Management Reform Project
PMRS Public Financeial Management Reform Strategy
PI Performance Indicator
PID Public Investment Division
PIM Public Investment Management
PIMS Public Investment Management System
PIP Project Investment Program
PIU Project Implementation Unit
PPA Public Procurement Authority
PPD Payroll Processing Department
PPP Public-Private Partnership
PPS Payroll Processing Section
PSC Public Service Commission
PUFMARP Public Finance Management Reform Program
RAM Regulatory Audit Manual
RCC Regional Coordinating Council
SAI Supreme Audit Institution
SDR Special Drawing Rights

4
SDU Service Delivery Unit
SEC State Enterprise Commission
SECO Swiss State Secretariat for Economic Affairs
SF Statutory Fund
SN Sub-National
SNG Sub-national Government
SO Standing Order
SOE State-Owned Enterprise
SSNIT Social Security and National Insurance Trust
STO Small Taxpayers Office
TIN Tax Identification Number
TRIPS TM Total Revenue Information and Processing System
TSA Treasury Single Account
VAT Value-Added Tax
VRA Volta River Authority
WB World Bank
ZBA Zero-Balance Accounts

5
EXECUTIVE SUMMARY
Assessment purpose and management
The purpose of this Public Expenditure and Financial Accountability (PEFA) assessment is twofold:
Establish a baseline for public financial management (PFM) performance, using the revised PEFA Framework that came into effect in early 2016. This contains many changes from the 2011 Framework, thus requiring a new baseline.
Assess the change in PFM performance since the 2012 PEFA assessment according to 2016 PEFA framework guidelines on tracking performance change.
This PEFA assessment covers the budget function of the Central Government, which comprises the 50 Ministries, Departments, and Agencies (MDAs) of the Government of Ghana (GoG).
The time period covered for each of the 31 performance indicators (PIs) depends on the specification of the PI. For some PIs, the relevant time period is the situation at the time of the assessment, in this case, February–March 2018 (when the PEFA team was in the field). For other PIs, the relevant time period is the last completed fiscal year (FY) or the last three completed FYs. For some other PIs, the PEFA assessment took place shortly after the end of 2017, that is, before the data for actual revenues and expenditures during 2017 were available. Thus, for PIs 1–3 and 28–30, the relevant time period is 2016 or 2014–2016.
The assessment has been carried out by a team of consultants hired by the World Bank-financed Public Financial Management Reform Project (PFMRP). The team reported to the Director of the PFMRP Project, who himself reported to the Oversight Team established to oversee the project. As shown in Table 1.2, in Section 1, the Oversight Team was mainly comprised of senior management from the Ministry of Finance (MoF) and the Controller and Accountant General’s Department (CAGD), Ghana Audit Service (GAS), Ghana Revenue Authority (GRA), Bank of Ghana (BoG) as well as three donor partners who are members of the PFM Working Group.
The impact of PFM performance on aggregate fiscal discipline, the strategic
allocation of resources and the efficiency of service delivery
First, it is appropriate to highlight the legal and institutional strengths of Ghana’s PFM system.
PFM strengths
The 1992 Constitution outlines the fundamental legal framework for PFM. It guarantees
independence of Parliament, the Judiciary, the Auditor General and his/her office, as well as
independent government institutions such as Electoral Commission and the National
Commission for Civic Education. The main strength of Ghana’s PFM system derives from its
solid legal and institutional setting for PFM, accompanied by a skilled, dedicated, and well-led

6
civil service. Ghana has been independent since 1957, and has been able to develop these
strengths over the course of six decades. The structure is robust, the key PFM institutions
mentioned above are the main institutional pillars that provide solid guidance and leadership
to the MDAs that deliver the public goods and services that Ghana needs as a pre-requisite
for socio-economic development. Ghana is a lower middle-income country, with strong PFM
playing a major role in achieving this status. Many other African countries tend to look to
Ghana as an example of how to effectively use PFM systems to support such successful
development. In spite of these, the PFM system could be better than it is right now; this
notwithstanding, its institutional strengths indicate that the wherewithal to strengthen PFM
is definitely in place. However, the system has some inherent fiscal and fiduciary risk.
PFM Weaknesses
Nonetheless, Ghana’s PFM could be improved as some aspects of it pose a degree of fiscal and fiduciary risk, with adverse implications for aggregate fiscal discipline, the strategic allocation of resources and the efficiency of service delivery (the three budgetary outcomes). The Government of Ghana’s institutional strengths indicate that it has the wherewithal to implement the measures needed to reduce risk.
Aggregate fiscal discipline is essential to macro-economic stability, itself essential to the predictable provision of public goods and services to society. Aggregate fiscal discipline can be endangered by exogenous forces, such as falling global prices of commodities that Ghana exports, as happened during 2013-2017, and disruptions to the supply of crude oil to the main oil refinery. Such events may lead to falls in domestic revenues and increasing fiscal deficits. Borrowing to fund such deficits may further endanger macro-economic stability (increasing current account deficits, falling foreign exchange reserves, rising inflation).
Strong public financial management (PFM) can support the preserving of aggregate fiscal discipline, itself in support of macro-economic stability. Strong budget preparation, budget execution, revenue administration and accounting and reporting systems all support credible policy-oriented budgets that provide the public services that people want at a reasonable price. Public services are provided cost-effectively, indicating that the composition of public services is about right (strategic allocation of resources) and that the provision of services is cost-efficient (efficiency of service delivery).
Weaknesses in PFM tend to make it harder to adjust to adverse external situations, and, in themselves, may run the risk of undermining aggregate fiscal discipline, (fiscal risk), the strategic allocation of resources and efficient service delivery (fiduciary risk).
The Government of Ghana has been implementing PFM reform strategies since the early 2000s, but, nevertheless, weaknesses remain, as identified by this PEFA assessment, and all with adverse implications for the three budgetary outcomes. These are itemized as follows:

7
1) The financial situation of state-owned enterprises (SoEs)
PI-10 in Section 3 indicates considerable weaknesses in the financial situation of such enterprises. These pose a threat to the GoG budget because of their need for funding that ultimately becomes the obligation of GoG to cover (through explicit and implicit contingent liabilities). The GoG forgoes the revenues that they could earn if SoEs were not making losses, and which could be used to fund public service delivery. The large size of SoEs in relation to the economy mean that they do business with each other, the result being a chain of debts if one gets into financial trouble, the situation thereby becoming exacerbated.
The information available to GoG on the extent of these financial weaknesses seems that it is not as robust and timely that it should be, as noted under PI-10. MoF through its Debt Management Division monitors information on the loan guarantees extended to SoEs, but the accuracy of such information is open to question (PI-13). There is no single body that monitors the financial sitation of SoEs, though this situation may change through the State Enterprise Commission (SEC) having its watchdog role strengthened.
2) Revenue administration
Notwithstanding several years of reform, indications are that domestic revenue mobilization is not as strong as it could be. Robust compliance with tax obligations is still a challenge, the tax audit function is not as strong as it could be, and tax arrears are significant in size (low score for PI 19 on revenue administration). This is not just Ghana Revenue Authority’s fault: the inter-enterprize arrears situation of SoEs impacts on the size of revenues collected by GRA, which in turn impacts negatively on its ability to administer the taxation regime (as GRA’s funding is a specified percentage of tax revenue).
Strengthened revenue administration would bring in more revenues for GoG, which are then available for funding public services and reducing the need to borrow in order to fund such services. This supports all three of the key budgetary outcomes.
3) Expenditure commitment control
Expenditure commitments made outside the approved budget and not supported by cash will likely result in payments arrears. Although the Ghana Integrated Financial Management Information System (GIFMIS) is now more or less fully in place (its establishment started in 2012) and is supposed to guard against commitments being made, it still seems to be the case that commitments are made outside the system (low scores for PI-22 on arrears and for commitment control under PI-25.2).
4) Cash management
In-year execution of the budget still seems to be based on the amount of cash actually available to pay bills (‘cash rationing’). This leads to considerable unpredictability in budget execution. The main complaint of the four large MDAs met by the team was delays in receiving budget releases,
8
and thus delays in receiving the funds needed to execute their approved budgets. Such practices have considerable negative impact on both the strategic allocation of resources (which may be far less optimum than planned) and on the efficiency of service delivery (low scores for PI-21).
This situation is partly a symptom of the unexpected demands on budgetary resources caused by the financial situation of SOEs and violations of the expenditure commitment control system. It also reflects the incomplete consolidation of cash balances that would enable all cash balances available to be used to help finance budget execution. Currently a sizeable amount is not consolidated as: (i) they represent the internally generated funds (IGF) retained by MDAs to finance specific expenditures and are kept in commercial bank accounts); (ii) funds kept by Statutory Funds (e.g. GETFund) and financed largely by transfers from GoG; and (iii) funds kept in donor project accounts held in commercial banks.
Establishment of a Treasury Single Account (TSA) would help alleviate this problem; establishment has begun. Of course, eliminating the retention of IGFs and tightening up on the flow of budgetary funds to Statutory Funds would help alleviate the issue, but this might raise political issues.
5) Extra-budgetary operations
As described under PI-6, there is a significant amount of non-transparency in the budgetary system in Ghana that can negatively impact on budgetary outcomes, particularly the strategic allocation of resources and efficient service delivery. Although the approved annual GoG budget is funded from all sources of funding and not just the Consolidated Fund (CF), information on budget implementation does not include expenditures financed by IGFs, donor project funds and Statutory Funds. About 20 percent of budgetary funds are spent in this non-transparent manner. PI-6 scores D.
Under the 2016 Public Financial Management Act (2016), this situation will improve, as the reporting on budget execution will cover all sources of funding.
6) Budget preparation
The procedures for preparing annual budgets are well-established (PI-17), but they don’t guarantee that the approved budgets will truly meet the needs of society. There seems to be no mechanism for ensuring the cost effectiveness of proposed spending. Ineffective and inefficient spending may be carried forward for year after year, as there appears not be a mechanism for weeding this out, for example, through spending reviews outside the budget preparation cycle. One issue is that annual Budget Guidelines are issued by MoF to MDAs without the prior scrutiny of the Cabinet, a political body that might want more say in what goes into the Guidelines.
The lack of predictability in the annual budget complicates the development of a medium term perspective on budgeting. Obtainng an annual perspective is even difficult.

9
As a basis for estahlishing a medium term perspective, the preparation of forward spending estimates (FSEs) would be useful for these project expenditures over the medium term on the basis of current policies and the current levels of service currently being delivered. They would include the future recurrent costs implied by capital expenditures that have already been committed to. They would also provide a mechanism for eliminating spending that would not be needed over the medium term. They would also form the basis on which ‘new’ spending could be identified.
7) Public investment management
Studies conducted by World Bank and IMF indicate the potential waste of resources posed by large investment projects being approved and executed in a non-rigorous manner (D score for PI-11). A project has been established in MoF to address this situation, but progress in implementing the project has been slow.
8) Payroll, procurement and payments systems
Weaknesses in these systems can pose major fiscal and fiduciary risk, but significant progress has been made in recent years in strengthening these systems. PIs 23, 24 and PI-25.3 all demonstrate strengthened robustness, the result in part of strengthened IT systems.
In response to the adverse macro-economic situation confronting Ghana during 2013-2016 due to the globall falls in commodity prices, the GoG entered into a financial support arrangement with the International Monetary Fund (IMF) through the Extended Credit Facility (ECF). To receive this support, the GoG implemented a number of fiscal tightening measures (for both revenues and expenditures), as well as some structural reforms that would strengthen PFM systems. Such reforms relate to the weaknesses mentioned above. Progress in implementing the reforms has been moderate, though there was some slippage during 2016.
The new Government that came to power in early 2017 appeared determined to take the measures needed to ensure fiscal sustainability and to fully implement the structural reforms agreed to through the ECF. The latest ECF review (fifth and sixth) posted on IMF’s website (in early May 2018) was positive in its assessment of the GoG’s ability to meet the fiscal targets agreed to with the IMF. However, it pointed to the strong need to ensure that the requisite structural reforms are actually implemented.
Changes in PFM performance since the 2012 PEFA Assessment
Table 2 summarises changes in PFM performance since the 2012 assessment. The changes are
assessed by applying the 2011 PEFA Framework to the situation at the time of the 2018 PEFA
Framework. Due to the many differences between the 2011 and 2016 Frameworks, comparability
issues arise if the 2016 Framework is used to assess performance changes. The PEFA Guidance
Note on conducting repeat PEFA assessments thus stipulates that the same Framework should
be used when assessing performance change.

10
Section 4.4 goes into more detail on changes in PFM performance and the implications of their
impact on aggregate fiscal discipline, strategic allocation of resources and efficient service
delivery
The table indicates that some strengthening of PFM performance has taken place since the 2012
assessment, helped by the establishment of GIFMIS soon after the 2012 assessment. The main
areas of strengthening are:
PI-4 on payments arrears. The monitoring of arrears has improved, which should help
GoG to take more effective action to guard against the arrears being incurred in the first
place. Significantly sized arrears risks damageing the credibility of the budget and impact
negatively on all the three budget outcomes.
PI-9: Monitoring of the financial situation of MMDAs. MMDAs potentially pose significant
fiscal risk for GoG and thereby impact negatively on budget outcomes. Strengthened
knowledge of the financial situation of MMDAs would help GoG to identify financial
problems of MMDAs ahead of time and to help MMDAs to plan and implement mitigative
actions. Strengthening of the monitoring of fiscal risk posed by SoEs remains, however, a
major challenge.
Payroll control (PI-23). Strengthening is underway, though not yet reflected in the
scoring, through: (i) the introduction of the HRMIS, which makes possible the linking of
the establishment list, kept by the Office of the Civil Service, with IPPD (PI-23 (i); (ii) more
timely updating of payroll records; and (iii) the E-SLV, which helps strengthen internal
control (PI-23 (ii). Weak payroll controls pose both fiscal risk (threat to aggregate fiscal
discipline) and fiduciary risk (wasteful spending on wages and salaries detracting from
efficient and effective service delivery.
Procurement systems (PI-19). More procurement taking place on a competitive basis and
more procurement information available to the public, thus strengthening transparency.
This impacts positively on the efficiency of service delivery and reduces the fiduciary risk
of wasteful spending to the efficiency of service delivery. Expenditure commitment
controls and compliance with controls (PI-20 (i) and (iii)) have strengthened, helped by
the establishment of GIFMIS. Fiduciary risk to the efficiency of service delivery is
diminishing as a result.
Resources received by primary service delivery units (PI-23): The advent of GIFMIS
appears to have considerably strengthened the transparency of the receipts by service
delivery units –those in the health sector in particular. This has lowered the fiduciary risk
of wastefulness in the use of resources, thereby increasing the efficiency of service
delivery.
The main ‘problem’ areas still outstanding are: (i) the extent of unreported extra-budgetary
operations (ii) inadequate monitoring of the financial operations of State-Owned Enterprises
(SoE), linked to the apparent non-transparency of loan guarantees provided to them by GoG; and
(iii) revenue administration. The relevant indicators are PIs 7, 9, 13-15, 17, and 28 (directly) and

11
1, 2, 24, 25, and 29 (indirectly); the un-reported extrabudgetary operations impact on the
transparency of in-year budget execution reports and annual financial statements). Weaknesses
in these areas pose both fiscal and fiduciary risk, thus potentially impacting negatively on all three
budget outcomes.
Overview of GoG’s PFM Reform Strategy
The most recent PFM Reform Strategy (PFMRS) was established in 2015. Implementation would occur under a PFMRP in the form of a World Bank-financed project. Government ownership of the PFMRP would be is important for its success. Accordingly, the Ministry of Finance, under the leadership of the Minister, was responsible for the overarching strategic coordination and oversight of the project. Various institutional and implementation arrangements were made to to support the PFMRP. The PFMR Secretariat was established as a separate office as part of the World Bank project. Under the oversight of its Director, the PEFA team used the office’s conference room as a base for operations.
Implementation appears to have been a success so far. The successful establishment of PFM-related computer systems, such as GIFMIS, has been crucial for the implementing of reforms. The GIFMIS itself was located in the offices of the PFMR Secretariat. Although different from the common experience of such IT systems coming under the office of the Accountant General (e.g. Kenya), its location in the PFMR Secretariat facilitated the procurement operations associated with GIFMIS. GIFMIS has so far played a pivotal role in strengthening PFM reform.
The PFMRS recently came to the end of its life. This PEFA report is helping to inform the preparation of the next strategy.
The analysis in this PEFA report implies that GoG should basically continue with the strategy it is already implementing, with enhanced focus on the PFM weaknesses that have major negative impact on the three budget outomes and thus significant fiscal and fiduciary risk. The obvious areas are State Owned Enterprise reform, revenue administration, continuing the roll out of the Treasury Single Account, ensuring that GIFMIS and the IT-based payroll control systems function well. All these would help to improve the predictability and credibility of the annuall budget and thus enable an efficient and reliable budget execution process.
In planning any changes to its PFM Reform Strategy, the MoF, other key PFM-related institutions (e.g. GRA) and key line mnisters should undertake a prioritsation exercise in planning its reform activities. Such an exercise should take into account institutional capacity and human resource constraints and identify logical sequencing issues: what needs to be done first in order to enable something else. The more bindng the constraints, the greater the extent of prioritization needed.
What should not be done is to prepare a strategy that identifies what needs to be done to increase the score for a PEFA dimension. A number of PFM Reform Strategies attempt to do this, without taking into account capacity constraints and prioritisaton/sequencing issues. They come out with detailed PFM reform Action Plans that try to address all issues, the result being limited successs in achieving meaningful PFM reform.

12
Table 1: Overview of PEFA indicator scores using 2016 methodology
PFM Performance Indicator Scoring Method
Dimension Ratings Overall Rating i. ii. iii. iv.
Pillar I. Budget reliability
PI-1 Aggregate expenditure outturn M1 D* D*
PI-2 Expenditure composition outturn M1 D* D* A D+
PI-3 Revenue outturn M2 D C D+
Pillar II. Transparency of public finances
PI-4 Budget classification M1 C C
PI-5 Budget documentation M1 C C
PI-6 Central government operations outside financial reports
M2 D D D D
PI-7 Transfers to subnational governments M2 C D D+
PI-8 Performance information for service delivery
M2 A A C B B+
PI-9 Public access to fiscal information M1 A A
Pillar III. Management of assets and liabilities
PI-10 Fiscal risk reporting M2 D* B D D+
PI-11 Public investment management M2 D D D D D
PI-12 Public asset management M2 C D D D+
PI-13 Debt management M2 C D B C+B
Pillar IV. Policy-based fiscal strategy and budgeting
PI-14 Macroeconomic and fiscal forecasting M2 C C C C
PI-15 Fiscal strategy M2 D C NA D+
PI-16 Medium-term perspective in expenditure budgeting
M2 A C A D B
PI-17 Budget preparation process M2 C C C C
PI-18 Legislative scrutiny of budgets M2 B A A B B+
Pillar V. Predictability and control in budget execution
PI-19 Revenue administration M2 A D D D D+
PI-20 Accounting for revenue M1 A B C C+
PI-21 Predictability of in-year resource allocation **M2 C C B B C+
PI-22 Expenditure arrears M1 D B D+
PI-23 Payroll controls M1 C C B B C+
PI-24 Procurement M2 D B B B C+
PI-25 Internal controls on non-salary expenditures
M2 A C B B
PI-26 Internal audit M1 C C C B C+
Pillar VI. Accounting and reporting
PI-27 Financial data integrity M2 C A C A B
PI-28 In-year budget reports M1 D A C D+

13
PFM Performance Indicator Scoring Method
Dimension Ratings Overall Rating i. ii. iii. iv.
PI-29 Annual financial reports M1 D A C D+
Pillar VII. External scrutiny and auditD
PI-30 External audit M1 B B B A B+
PI-31 Legislative scrutiny of audit reports M1 D D D D D
Source: Scoring tables under each PI in Section 3.
Table 2: Summary of change in performance since 2012 PEFA assessment, based on 2011 PEFA Framework
Indicator/Dimension Score of
2012 assessment
Score of 2018
assessment Assessment of change
A. PFM OUTTURNS: Credibility of the budget.
PI- 1. Aggregate expenditure outturn compared to original approved budget (1 dimension)
C NR
Not possible to assess performance change. The score in the 2012 PEFA assessment should also have been NR. Total primary actual expenditure is not known, as actual expenditures financed by IGFs and Statutory Funds are not fully reported on.
PI-2. Composition of expenditure outturn to original approved budget (2 dimensions, M2 scoring method)
NR NR
Not possible to assess performance change. This is for the same reasons as under PI-1.
PI-3. Aggregate revenue outturn compared to original approved budget
C D
Domestic revenue performance appears to have fallen,
probably due to the adverse external situation confronting
Ghana: declines in gold and crude oil prices and production
volumes for gold and cocoa.
PI-4 Stock and monitoring of expenditure payment arrears (M1) (2 dimensions)
D D+
Strengthened performance under PI-4(ii) (i) Unchanged D rating for stock of arrears. (ii) Strengthened availability of information on arrears, partly helped by the advent of GIFMIS.
B. KEY CROSS-CUTTING ISSUES: Comprehensiveness and Transparency
PI-5. Classification of the budget (one dimension)
C C
Performance improved due to the introduction of program-based budgeting in 2014 and scrapping of the burdensome activities-based budget system. This was not enough to increase the score.
PI-6. Comprehensiveness of information included in budget documentation
C B
Performance improved. Five out of 9 information elements fulfilled, against 4 in 2012 PEFA assessment.

14
Indicator/Dimension Score of
2012 assessment
Score of 2018
assessment Assessment of change
PI-7 Extent of unreported government operations (M1) (2 dimensions)
C+ D
Performance unchanged. The scores were too high in the 2012 assessment for both domestic and donor-funded un-reported operations. - Limited comparability with PI-6 in 2016 Framework
PI-8: Transparency of Intergovernmental Operations (M2) (3 dimensions)
D+ D+
Performance unchanged. (i) The system of horizontal allocation of transfers and the transparency thereof has not changed (C). (ii) The timeliness and reliability of the information on transfers is unchanged (D) (iii) The extent of consolidation of fiscal data for general government on a sector basis is unchanged. The recently operationalized GIFMIS should now make this possible. (D)
PI-9 Oversight of aggregate fiscal risk from other public-sector entities. (M1) (2 dimensions)
C C+ Performance strengthened under (ii) on monitoring of MMDAs. - Performance unchanged under 9 (i) on monitoring of SoEs
PI-10 Public access to key fiscal information
B B Performance unchanged. Four out of the 6 elements as listed in the 2011 Framework have been met. (i.e. elements (i), (ii), (iii), & (iv))
C. BUDGET CYCLE
C (1): Policy-based budgeting
PI-11. Orderliness and participation in the annual budget process (M2) (3 dimensions)
B B No change in performance
PI-12 Multi-year perspective in fiscal planning, expenditure policy and budgeting (M2) (4 dimensions)
C+ B Strengthened performance under 12 (iii) on costed sector strategies (B from C).
C (2): Predictability and Control in Budget Execution
PI-13 Transparency of taxpayer obligations and liabilities (M2) (3 dimensions)
C+ B
Performance unchanged. The score for 13 (i) on clarity and comprehensiveness of tax liabilities was too low in the 2012 PEFA assessment. - Comparability with 19.1 in the 2016 Framework.
PI-14 Effectiveness of measures for taxpayer registration and tax assessment (M2) (3 dimensions)
C C
Performance unchanged. - (i) New integrated tax administration system still being rolled out. - (ii) Penalties for non-compliance still lack effectiveness. - (iii) Tax audits still only partly based on risk criteria.

15
Indicator/Dimension Score of
2012 assessment
Score of 2018
assessment Assessment of change
PI-15 Effectiveness in collection of tax payments (M1) (3 dimensions)
D+ NR
Performance unchanged for all dimensions. - (i) Arrears data unreliable. 2017 TADAT report also indicated that the data is unreliable to assess performance change. --(ii) Transfers of tax collections to Treasury. B score unchanged. -- (iii) Accounts reconciliation. D score unchanged. -- 15 (i) is similar to 19.4 in 2016 Framework.
PI-16 Predictability in the availability of funds for commitment of expenditures (M1) (3 dimensions)
D+ C+
Performance strengthened: -(ii) Longer time horizon for making commitments. Lacks meaningfulness if cash not available for payments. -(iii) Lower frequency of budget reallocations. - Cash flow (16(i)) forecasting still C.
PI-17 Recording and management of cash balances, debts and guarantees (M2) (3 dimensions)
C+
C Performance dropped due to slippage in dimension (i)
PI-18: Effectiveness of payroll controls (M1) (4 dimensions)
C+ C+
Performance unchanged, but strengthening underway under (ii) and (iii) - (i) Reconciliation between payroll and personnel records scored too high in 2012 assessment. -- Dimensions comparable withPI 23 in 2016 Framework, except (i), which is now more strictly defined. -(ii) Timeliness of changes to payroll strengthened, but retro-active adjustments still common --(iii) E-SPV strengthened controls, but not by enough to increase score.
PI-19 Competition, value for money and controls in procurement (M2) (four dimensions)
C B
Overall performance improved. - Dimensions (ii) and (iii) on extent of use of competitive procurement methods and procurement-related information available to the public
PI-20 Effectiveness of internal controls for non-salary expenditures (M1) (three dimensions)
D+ C+
Overall performance strengthened through dimensions (i) and (iii). - (i) Commitment control improved due to GIFMIS, but commitments still being made outside GIFMIS. - (iii) Compliance with rules strengthed due to GIFMIS.
PI-21 Effectiveness of internal audit (M1) (three dimensions)
C+ C+ Overall performance unchanged, but strengthening under (iii) on management response to audit findings.
C(iii) Accounting, Recording and Reporting
PI-22 Timeliness and regularity of accounts reconciliation (M2) (two dimensions)
D+ C+ Overall performance strengthened due to greater frequency of bank reconciliations (i)

16
Indicator/Dimension Score of
2012 assessment
Score of 2018
assessment Assessment of change
PI-23 Availability of information on resources received by service delivery units (one dimension)
D C Performance strengthened due to establishment of GIFMIS. - Annual service delivery reports not yet prepared.
PI-24 Quality and timeliness of in-year budget reports (M1) (three dimensions)
C D+
Overall performance unchanged due to D score for 24 (i). Actual expenditures financed by IGFs, Statutory Funds and grant-funded donor projects are not reported on even though they are budgeted for. - The score for this should also have been D in the 2012 assessment. - Timeliness of reports improved due to GIFMIS (ii).
PI-25 Quality and timeliness of annual financial statements (M1) (three dimensions)
C+ D+ Overall performance unchanged. – (i) Completeness of annual financial statements rated D for same reasons as under PI-24 (i). Should have been D in 2012 report.
C (iv) External Scrutiny and Audit
PI-26 Scope, nature and follow-up of external audit (M1) (three dimensions)
C+ B
Performance improved due to more effective follow-up under (iii); score increased to B from C. - Dimension comparable with PI 30 in 2016 PEFA Framework through some re-arranging.
PI-27 Legislative scrutiny of the annual budget law (M1) (four dimensions)
D+ C+ Performance strengthened for dimensions (i), (ii) and (iv)
PI-28 Legislative scrutiny of external audit reports (M1) (three dimensions)
D+ D Overall performance dropped. The D scores for 28.1 also imply D scores for 28.2 and 28.3 in both the 2012 and 2018 PEFA assessments.
A detailed table on performance change is shown in Annex 5

17
1. INTRODUCTION
1.1 Rationale and purpose
The rationale for this PEFA assessment is to review how well the PFM systems of the Government of Ghana (GoG) are working and whether its current PFM reform strategy (PFMRS) needs adjusting. The current PFMRS covers 2015-2018. The last PEFA assessment was conducted during 2012-13, nearly 6 years ago. The PEFA Secretariat recommends that assessments be conducted every three years. The actual frequency will vary from country to country, depending on circumstances. However, a new assessment seems to be warranted. A number of key PFM reforms have been implemented in recent years or are being implemented. Therefore, it is useful to determine the extent to which such reforms are positively influencing PFM performance.
The findings of the 2018 PEFA will also be used to directly inform the medium-term PFM plans of development partners (DPs). The GoG’s reformulated PFM Strategy (if it needs reformulating) will enable DPs to determine the kind of assistance it should provide in support of PFM reform. A comprehensive, well-informed PFMRS will also better assist in the coordination of the DP pipeline of PFM interventions, as well as the overall harmonization of efforts, as each DP will be working from the same, up-to-date, assessment. It is also hoped that the 2018 PEFA Assessment will help revive dialogue between the government and the DP PFM Working Group.
The purpose of this PEFA assessment is twofold:
Establish a baseline for PFM performance, using the revised PEFA Framework that came into effect in early 2016. This contains many changes from the 2011 Framework, thus requiring a new baseline.
Track change in PFM performance since the 2012 asessment by assessing current performance using the 2011 PEFA Framework, and then comparing this with the previous performance. This comparison can be found in Annex 4.
1.2 Assessment management and quality assurance
The assessment was conducted under the supervision of the Public Finance Management Reform Program (PFMRP) Office, established in 2015 under a project co-funded by the World Bank, the Swiss State Secretariat for Economic for Economic Affairs (SECO), and the Government of Ghana. The WB’s contribution is a US $45 million IDA credit and SECO’s is a US $3 million grant. The GoG’s counterpart funding pays for the office space and project personnel. The PFMRP was originally a four-year project, designed to run from May 2015 to June 2019, but it has been extended to December 2020. The activities of the PFMRP covers a large spectrum of PFM reforms, including budgeting, treasury management, oversight (internal and external audit, and parliamentary), and the current PEFA assessment. The PFMRP falls under the supervisory mandate of the Ministry of Finance. It is located in a separate office building. The team was

18
answerable to the Project Manager of the PFMRP, Dr. Mohammed Sani, who himself is answerable to the Oversight team, as noted below.
Table 1.1 details the assessment management and quality assurance arrangements for the PEFA assessment.
Table 1.1: Assessment management and quality assurance arrangements
PEFA Assessment Management Organization
Oversight Team (OT) — See Table 1.2 below.
Assessment Manager: Dr. Mohammed Sani Abdulai, Director of the PFMRP
Assessment Team Leader: Peter Fairman, PFM consultant contracted by the PFMRP
Assessment Team: Ranjan Ganguli, Getnet Haile, Charles Hegbor, Chinedum Nwoko, Dan Narainsamy
PEFA Secretariat
Peer Reviewers
Composition of the OT Members of the OT
Chairperson Minister of Finance
Ministry of Finance Chief Director
PFM Advisor to the Minister of Finance
Director of Budget
Controller and Accountant General Department Deputy Controller and Accountant-General
Ghana Revenue Authority Commissioner General
Bank of Ghana Deputy Governor
Internal Audit Agency Director General
Ghana Audit Service Deputy Auditor-General
Public Procurement Agency Director/Chief Executive Officer
Development Partners
World Bank
EU
SECO
Review of concept note and/or terms of reference
Date of reviewed draft concept note: October 2, 2017
Invited reviewers: Svetlana Klimenko, Lead Financial Management Specialist (World Bank); Antonio Leonardo Blasco, Senior Financial Sector Specialist (World Bank); Jonas Arp Fallov, Senior Economist Public Sector Specialist (World Bank) Patrick Kabuya, Senior Financial Management Specialist (World Bank); Guillaume Brule, Senior Public Sector Specialist, PEFA Secretariat (World Bank); Delphine Aupicon, Program Officer, Macro-economic and trade Section (EU); Matthias Feldmann, Chargé d’affaires (SECO); and Jonathan Nyamukapa (African Development Bank).
Date(s) of final concept note and/or terms of reference: November 27, 2017
Review of the assessment report
Date of reviewed draft report: June 6, 2018
Invited reviewers who provided comments: Oleksii Balabushko, Senior Public Finance Specialist (World Bank); Leah April, Senior Public Sector Specialist (World Bank); Saeeda Sabah Rashid, Senior Public Sector Specialist (World Bank). The PEFA Report Review was co-conducted by Stefan Bruni, University of Applied Sciences, and Andreas Bergmann, Zurich University of Applied Sciences.
PEFA Secretariat's review - (dates of reviews: 1st review July 30, 2018; 2nd review September 18, 2018

19
1.3 Assessment methodology
1. Coverage of the assessment: The assessment covered the central government of Ghana, denoted here as the Government of Ghana (GoG). For the purposes of this assessment, this covers 50 Ministries, Departments and Agencies (MDAs).1
2. When performance is assessed: As shown in the 2016 Framework for each performance indicator (PI) and at the beginning of each PI assessment in Section 3, the time period used for the assessment of each PI varies from PI to PI (for example, the time of assessment, last completed FY, last completed 3 FYs). In the case of this assessment, the last completed FY is 2017. However, for some PIs, it was necessary to use FY 2016 as the last completed FY, as the financial data for FY 2017 were not yet available. These indicators include, in particular, PIs 1-3, 28, 29 and 30.
3. Sources of information: Information was collected from websites, where possible, relevant GoG officials (including during the many meetings with team members), officials from the Bank of Ghana, the main business organization in Ghana, and a civil society organization (CSO) (a local branch of Transparency International). Annex 3 contains a list of information collected under each PI.
4. Most of the meetings with the GoG officials were with various departments and divisions of the MoF, the Controller and the Accountant General’s Department, and the Ghana Revenue Authority. Other GoG meetings were held with the Ghana Audit Service, the Internal Audit Agency, the Public Procurement Authority, the Public Service Commission, the Ministry of Local Government and Rural Development, the State Enterprise Commission, the National Development Planning Commission, the Ministries of Agriculture, Roads, Education and Health, and and Ministry of Energy. Other agencies are the Road Fund, Ghana National Petroleum Commission, Parliament (the Clerk to Public Accounts Committee), the Association of Ghana Industries, and the Ghana Integrity Initiative (a branch of Transparency International).
Process of conducting the assessment
The assessment team began its work on February 12, 2018. An initial meeting was held in the PFMRP’s Conference Room between the PEFA team of consultants and Nana Kwabena Adjei-Mensah (PFM Technical Advisor to the Honorable Minister), Dr. Mohammed Sani Abdulai (PFMRP Director) and Donald Mphande, Lead Public Finance Management Specialist of the World Bank office in Accra.
The launch meeting was held at the MoF on February 12, 2018 with the major development partners based in Accra in attendance, along with some senior government officials (including the Acting Director of Budget, the PFM Technical Adviser to the Minister of Finance, the Vice Chair of the Public Service Commission, the Deputy Auditor General, and the Deputy
1 As listed in Appendix 4A of the 2018 Budget Statement and Economic Policy, dated November 15, 2017.

20
Commissioner of the GRA). The meeting was chaired by the Honorable Deputy Minster Mrs. Abena Osei Asare. Donor representatives included Ms. Natalia Koliadne, IMF Resident Representative, Donald Mphande of the World Bank, Ms. Sophie Autie of the EU, Dr. Bukari Hamza of SECO, as well as Mr. John Grinyer and Mr. Naresh M. Jha, both of the IMF’s Africa Regional Technical Assistance Center (AFRITAC) West 2.
It was agreed that the team would first hold courtesy calls with the top management of the MoF, the CAGD, the GRA, and the Auditor General and his senior staff. These meetings were held during the rest of the first week and into the second week. The detailed meetings, including follow-up meetings, were held up to March 12, 2018. A meeting was then held with DPs to present initial findings. The team conducted a workshop on March 15, 2018, at which it presented its initial findings and scores. Prior to that, the team met three members of the Oversight Team at the PFMRP conference room to discuss initial findings and to fill in any information gap(s).
Following the end of the workshop, the team put together the first draft of Section 3. The team leader then prepared the other sections of the report (Sections 2, 4, 5, Annex tables). The full draft report was submitted to the Director of the PFMRP on May 20, 2018. Comments were provided by various World Bank staff in mid-June. These were incorporated into second draft report which was submitted to the PFM Secretariat and to World Bank (Accra) in mid July. This was submitted to the PEFA Secretariat in Washington DC. Comments were received from the Secretariat on July 30, 2018. This third draft addresses those comments.

21
2. COUNTRY BACKGROUND INFORMATION
2.1 Country economic situation
Ghana has become a low-middle income country over the last 25 years. It achieved this mainly on the basis of its mineral and agricultural resources (particularly gold and cocoa). Mineral resource findings have increased over the last decade, following the offshore discovery of oil in 2007, often referred to as the Jubilee Field. Oil production began in December 2010. As a result, the economy experienced a boom over the next three years. However, global crude oil prices crashed in 2014, creating a large negative impact on real gross domestic product (GDP) growth, the balance of payments and the fiscal balance. Real GDP growth was only 3.5 percent in 2016, the lowest growth rate since the 1990s. Foreign exchange reserves’ coverage of imports also fell. The economy began to recover during 2017 as global crude oil prices started to rise. Foreign exchange coverage started to increase again from 2.6 months as at December 2016 to 3 months of import coverage as at December 2017 at USD 5,783 billion2 from USD 4,862 billion in 2016.
Table 2.1 summarizes the fall in real GDP growth. The decrease is apparent after 2013, as is the start of the recovery in 2016. Foreign exchange reserves also fell. As noted in more detail in Section 2.2, the downturn in oil prices affected revenue collections. Rather than cut expenditures accordingly — with an associated detrimental impact on public service delivery — the GoG took a countercyclical stance by resorting to domestic financing to cover the loss in revenues. Budget support from donors also mitigated some of the impact. Domestic financing, if maintained for more than a temporary time, would, however, lead to adverse impacts on inflation, foreign exchange reserves, thereby leading to macroeconomic instability. Hence, starting in 2017, the GoG began to reign in this type of financing, which was becoming unnecessary as oil prices started to rise.
Table 2.1: Selected economic indicators
Selected Economic Indicators 2013 2014 2015 2016 2017*
Population
--Total population, millions 26.43 27.04 27.67 28.3` 29.96
-- Annual population growth (%) 2.24 2.3 2.33 2.32 2.23
National income and prices
Real GDP growth (%) 7.3 4.0 3.8 4.7 7.9
GDP current prices (billion GH₵) 93,416 113,343 136,957 167,353 205,914
Non-0il GDP (billions GH₵) 85,974 105,550 131,647 164,000 195,200
- % GDP 92.0 93.1 96..1 98.0 94.8
- Services as % GDP 48.1 49.6 51.2 53.6 52.1
- Industry (including oil production) as % GDP 26.9 25.4 23.6 22.7 23.7
GDP per capita (US$) 1,479 1,372 1,551 1,668
Consumer Price Index (CPI) annual average inflation (%) 15.5 17.2 17.5 11.5
External sector (US$ millions) 11.8
Current account balance, % GDP -9.5 -7.7 -6.7 -5.8
2 IMF Staff report on Extended Credit Facility May 2018

22
Selected Economic Indicators 2013 2014 2015 2016 2017*
Gross official foreign exchange reserves (FY-end), US$ millions
4,349 4,403 4,862 5,783
- Gross official reserves (in months of imports) 2.5 2.6 2.8 3.0
Monetary Sector
Broad money supply (M2) % annual growth 36.8 23.3 24.8 22.7
Credit to the private sector, % annual growth 41.8 31.7 9.1 11.0
Banks’ lending rate 29.0 27.5 31.7
Commercial banks’ capital asset adequacy ratio 18.5 17.9 17.7 17.8
Fiscal Sector
Primary balance (total less interest expenditure), % GDP 0.0 -0.4 -2.4 0.2
Net domestic financing, % GDP 31.0 28.5 32.1 32.5
Net external financing, % GDP 39.1 43.7 41.3 38.0
Source: Annual Budget Statements (MoF) and IMF ECF review/Article IV consultation reports May 2018.
2.2 Fiscal and budgetary trends
Table 2.2 presents the aggregate fiscal data for FYs 2014-16. The official data for 2017 have not yet been published by the Ministry of Finance. The data are not yet finalized.
Table 2.2: Ghana fiscal summary, 2014-16
GH₵ millions 2014 2015 2016
Cash basis Actual Actual Actual
Total revenues and grants 20,873 26,824 28,865
Taxes 18,073 21,744 26,209
Other revenues, including Internally-generated funds (IGFs) 1,986 2,391 1,515
Grants 814 2,689 1,141
Total Expenditures 32,329 36,410 44,473
Recurrent 26,233 29,276 36,795
Wages and salaries 11,034 12,917 14,623
Purchases of goods and services 1,777 1,388 3,221
Subsidies and social transfers 474 25 0
Grants to other Government units 1/ 2,354 4,267 5,442
Other non-interest expenses 2/ 3,513 1,604 1,980
Interest 7,081 9,075 11,529
Acquisition of non-financial assets 6,096 7,134 7,678
Balance -11,456 -9,586 -15,608
Primary balance (excluding interest) -4,375 -511 -4,079
Financing 11,456 9,586 15,608
Net acquisition of financial assets 3,299 -445 3,478
Borrowing (net) 14,702 8,302 17,351

23
GH₵ millions 2014 2015 2016
Cash basis Actual Actual Actual
Domestic financing (net) 8,828 2,424 14,391
External borrowing 7,205 8,612 7,564
External Amortization -1,331 -2,734 -4,604
Statistical discrepancy 53 839 1,735
1/ (i) Statutory Funds, Ghana National Petroleum Corporation (GNPC), the Energy Sector Levy Act; (ii) GH₵ 1.6 billion in 2017 of unpaid commitments from 2016.
2/ Payments of cash arrears and promissory notes to SFs & ; (ii) GH₵ 1.6 billion in 2017 of unpaid commitments from 2016.
GDP , GH₵ millions 113,343 136,957 167,353
Domestic revenues % GDP 18.4 19.6 17.2
Total expenditure % GDP 28.5 26.6 26.6
Balance % GDP -10.1 -7.0 -9.3
Primary balance, % GDP -3.9 -0.4 -2.4
Domestic financing, % GDP 7.8 1.8 8.6
External financing, % GDP 6.4 6.3 4.5
Public debt stock, GH₵ billions 79.6 100.2 122.3
% GDP 70.2 73.2 73.1
External debt stock, GH₵ billions 44.5 59.9 68.9
Domestic debt stock, GH₵ billions 35.0 40.3 54.4
Sources: Annual Budget Statements (Ministry of Finance - MoF), IMF Article IV Consultation Report, September 2017.
Tables 2.3 and 2.4 show the functional and economic classification of expenditures.
Table 2.3: Economic classification of GoG expenditures (%)
2014 2015 2016
Wages and salaries 34.1 35.5 32.9
Purchases of goods and services 16.4 8.2 11.7
Subsidies and transfers 8.7 11.8 12.2
Capital expenditures 18.9 19.6 17.3
Interest 21.9 24.9 25.9
Total expenditures 100.0% 100.0% 100.0%
Sources: Annual Budget Statements (Ministry of Finance - MoF), IMF Article IV Consultation Report, September 2017.
Regarding Table 2.3, it is important to note the increasing proportion of interest expenditures in line with the increasing debt stock. Indeed, it has become the second largest component of expenditures after wages and salaries.
Table 2.4: MDA Budget allocations by sector (%)
2015 2016 2017 2018

24
Administration 11.3 23.4 22.7
Economic 10.9 9.4 9.3
Infrastructure 11.1 6.8 6.1
Social 53.9 50.6 47.9
Public Safety 12.8 9.8 14.1
Total MDA expenditures 100% 100% 100%
Source: Appendix Tables in Budget Statements for 2015, 2016 and 2018 (4b for 2018). Not prepared for 2017. Note: Excludes allocations to pensions, social security, debt service, arrears clearance and various Funds.
Table 2.4 indicates that the social sector receives about 50 percent of total allocations, by far the largest share of governmental expenditures.
As noted under Section 2.1 above, fiscal and external imbalances started to mount in 2013, led by large falls in the prices of crude oil and cocoa, as well as delays by the GoG in taking mitigative measures. These imbalances were reflected in rising public debt, increasing inflation rates, increasing interest rates, falling foreign exchange reserves and a depreciating currency. Extensive power cuts due to adverse water conditions on the Volta River slowed economic growth, thereby reducing revenue growth and hurting the business and finance sector.
Eventually the GoG formally requested support (April 2015) from the IMF in the form of an Extended Credit Facility (ECF)3. This was formalized in August 2015 through a Letter of Intent (LOI) submitted by the GoG to IMF. In this letter, the GoG indicated the various measures it would take to reduce imbalances, including measures to strengthen public financial management, particularly in the areas of revenue administration, tax policy, budget execution/ reporting/accounting (including the roll-out of the Government Integrated Financial Management Information System [GIFMIS] and the Treasury Single Account [TSA] and the inclusion of IGFs, Statutory Funds and donor-funded projects/programs within their purview [see PI-6 in Section 3]), payroll control, and monitoring of state-owned enterprises [SOEs] (which were becoming an increasing fiscal risk for the GoG).
The second review conducted by the IMF in December 2015 indicated significant progress in implementing the ECF program. However, it was necessary to continue with fiscal consolidation efforts and structural fiscal reforms (as indicated in the Budget Statement for 2016) in support of restoring macroeconomic stability. The third review, conducted in September 2016, conveyed the same message, pointing out that the economic outlook remained grim, partly due to disruptions in oil production and the continuing deterioration in the financial performance of SOEs, particularly those in the energy sector. The spending pressures that would arise through the upcoming general election would add to the still high fiscal risks.
An IMF staff team visited Ghana in February 2017 and found that there had in fact been major fiscal slippages during 2016. The fiscal deficit had increased to about 9 percent of GDP (10 percent on a commitment basis, including unpaid new claims), instead of falling to about 5 percent. Likewise, instead of falling, the stock of debt had risen to 74 percent of GDP. Inflation
3 The amount is Special Drawing Right (SDR) 664.2 million), or 180 percent of Ghana’s quota.

25
had also risen instead of falling, as programmed. The reasons were both revenue performance being lower than programmed and expenditure performance being higher than programmed due to unbudgeted expenditure commitments that had bypassed commitment controls in the GIFMIS. The newly-elected government requested the Ghana Audit Service (GAS) to examine this, as discussed under PI-22 in Section 3. The team noted that the growing financial imbalances of SOEs, particularly those in the energy sector, needed to be addressed as a matter of urgency (see PI 10 in Section 3). The new Government indicated its desire to get public finances back on track.
The IMF staff team returned in April 2017 to prepare an Article IV Consultation Report and start the 4th Review under the ECF. The team noted that the new government’s initial steps were promising. For example, the 2017 budget prepared under the new Government represented a significant fiscal policy correction. However, more needed to be done in order to restore fiscal discipline and to continue to implement structural reforms — but with more of a focus on the whole public sector. Investor confidence in the economy was returning, as indicated in a recovery in the exchange rate following a sharp drop and high foreign investor participation in government bond auctions.
Key structural fiscal reforms agreed to under the ECF program and mentioned in the 2017 Budget Statement (in the Article IV Consultation report) included:
Reducing budget rigidities: New legislation restricts transfers to Statutory Funds (for
example, the Ghana Educational Trust [GET] Fund) to no more than 25 percent of the
budget. An almost unique feature of Ghana’s budget system is its segmentation, which
reduces the GoG’s flexibility in allocating budgetary resources, as so many of them are
earmarked (see PI-6 in Section 3 on reporting on extra budgetary operations).
However, it also detracts from fiscal transparency.
Rationalization of the use of internally generated funds: The 2017 budget channels a
larger portion of IGF to the central government budget and away from the retention of
such funds by the MDAs. This also reduces segmentation and increases transparency
(also see PI-6 in Section 3).
Since the 4th review of the ECF, progress in implementing the revised conditions of the ECF, that is, the revised package, has been reasonably good. According to the 5th and 6th reviews of the ECF program in May 2018, imbalances markedly diminished during 2017.
2.3 Legal and regulatory arrangements for PFM
The 1992 Constitution provides the legal basis for PFM in Ghana. Table 2.5 provides an overview of the main PFM laws and regulations.

26
Table 2.5: Overview of the main laws and regulations governing PFM in Ghana
Area Description
Budget preparation, execution, reporting and accounting
Until August 2016, the Financial Administration Act (2003) and the Financial Administration Regulations (2004) defined in detail the roles, functions and responsibilities in the management of government revenues and expenditures. They also defined the accounting, control and reporting systems.
The Public Finance Management Act (PFMA) replaced the Financial Admdinistration Act (FAA) (2003) in August 2016. The main features are elaborated below.
MDA Retentions Act, 2007 (Act 735) provides the legal backing to MDAs to retain IGFs.
Earmarked Funds Capping and Realignment Act, April 2017: The Act caps transfers to Statutory Funds (SFs) to no more than 25 percent of GoG revenues in any year, except if the GoG makes a policy decision otherwise (for example, the 2017 Budget topped up transfers to the National Health Fund to protect social spending). The purpose is to reduce rigidity in the overall budget framework, thereby freeing up funding for priority spending. The GoG will start publishing the budgets of SFs (which fall outside of the GoG budget, see PI-6 in Section 3) in the interests of greater transparency and accountability.
Tax administration General laws governing tax administration: Ghana Revenue Authority Act, 2009 (Act 791); Taxpayer Identification Numbering System Act, 2002 (Act 632).
General laws for direct and indirect taxes: Internal Revenue (Registration of Business) Act, 2005; Internal Revenue Act, 2000 (Act 592) and amendments; Internal Revenue Regulations (Legislative Instrument [LI] 1675); Value-Added Tax (VAT), 1998 (Act 546); Value-Added Tax Regulations, 1998 (LI 1646)
Revenue Administration Act, 2016: Consolidates information about the different tax acts.
Petroleum Revenue Management Act, 2011; This includes the establishment of a Petroleum Holding Fund from which resources are transferred to: (i) the Annual Budget Funding Amount (ABFA) held in the Consolidated Revenue Fund for the implementation of the annual budget; (ii) the Ghana Stabilization Fund, from which resources may be mobilized in response to revenue shortages emanating from price fluctuations; and (iii) the Ghana Heritage Fund to be used once the oil and gas deposits are exhausted.
Excise Stamp Act, 2013. Implementation of the underlying policy began in January 2018, starting in the ports, then at the point of sale, starting in

27
Area Description
March 2018. A significant increase in excise revenues is projected through the curtailment of under-invoicing and smuggling.
Electronic Point of Sales Device (EPOS) Act passed in March 2018: Specified taxable persons (for example, shops) required to acquire and use it for collecting payments from purchasing customers. Tax revenues from sales go straight to the GRA.
Automatic Exchange of Information Act, March 2018: Requires financial institutions to collect information from non-resident clients and pass this on to the GRA.
Public Procurement Public Procurement Act (663), 2003, as amended by Act 914 of 2016.
SOEs/Energy Sector Energy Sector Levy Act, 2016: Addresses the legacy debt of the oil refinery and supports the payment of power utility debts. The levies serve as collateral for debt restructuring and funding with banks.
Public Finance Management Act (2016): Key improvements over FAA (2003)
Expanded coverage to include IGF and donor-funded projects in the Consolidated Fund. Section 48 states that “Any revenue or other money raised or received for Government shall form part of the Consolidated Fund”. This means that in-year and end-year budget execution reports, as well as annual financial statements, will include funding from the retained portion of IGF and donor-funded projects and the spending thereof.
In the case of donor-funded projects, the disbursements and expenditures were not legally excluded from the Consolidated Fund (CF). The problems were two-fold: (i) expenditures of projects financed through disbursements from project accounts held in the Bank of Ghana (BoG) were not being reported in the annual financial statements prepared by the CAGD, as it was too difficult to track the information; as indicated in a note to these statements, the CAGD simply assumed that expenditures were equal to disbursements. Under the PFMA, the expenditures should be reported; and (ii) expenditures and disbursements from project accounts held by MDAs in commercial banks were not being captured in the CF. Under the PFMA, disbursements will have to flow through the CF (see PI-6 on extrabudgetary reporting).
The PFMA introduces fiscal responsibility principles, enhancing fiscal reporting and transparency requirements.
It also elaborates on the budget preparation process, which now includes the preparation of a Fiscal Strategy Document (FSD, section 15), which would inform the parameters of the annual budget. This would be prepared earlier in the FY than the Budget Statement (which contains elements of a fiscal strategy). The FSD is not a public document, and is

28
prepared for Cabinet review only. Section 31 of the third ECF review (October 2016) commented negatively on this as IMF considers this should be submitted to Parliament..
The PFMA elaborates on commitment controls (Section 25) and introduces cash and debt management provisions. (Sections 48-53 and 54-78 respectively). Debt management was not covered in the FAA (2003), as this came under the purview of the Loans Act (1970), see PI-13 in Section 3.
The Controller and Accountant General’s Department (CAGD) is primarily responsible for maintaining internal control in government. The department supervises and accounts for government revenues, expenditures, assets, and liabilities. It is the duty of the department to ensure that all government agencies comply with relevant financial rules and regulations. CAGD also developes financial manuals and templates for use by MDAs and MMDAs in financial reporting to ensure compliance with PFM laws. In addition, the Internal Audit Agency (IIA), established under the Internal Audit Act, 2003 plays a significant role in enforcing internal control across government. The agency is independent of the Controller and Accountant General. The Ghana Audit Service (GAS) reviews compliance with internal control rules and procedures and provides external oversight. Finally, the Parliament through its public accounts committee (PAC) complements the work of the GAS by reviewing and enforcing its findings.
2.4 PFM institutional arrangements
Structure of the public sector
Table 2.6 summarizes the broad financial structure of the public sector. Information is only readily available for the expenditures of the central government itself, and then only available in terms of actual expenditures reported on and accounted for through the Consolidated Fund. It omits information on actual expenditures funded by IGFs, donor-funded projects/programs, and Statutory Funds (see PI-6).
By contrast, the annual Appropriations Act shows (section 1.3) budgeted expenditures financed not only by the Consolidated Fund (into which revenues flow), but also by IGFs, donor-funded projects/programs, and Statutory Funds (Ghana Education Trust Fund [GETFund], the District Assemblies Common Fund [DACF], and the National Health Fund [NHF]) and the Annual Budget Funding Amount (ABFA), which is based on the earnings of the petroleum industry, as legislated for through the Petroleum Revenue Management Act of 2011 [Table 2.5 above]). The Ministries receiving this funding include: Special Development, Agriculture, Roads and Highways, Railway Development, and, to a lesser extent, the Ministry of Education and the Ministry of Health. Annual budgeted expenditures funded through the Consolidated Fund comprise 70-80 percent of total expenditures.

29
Table 2.6: Structure of the public sector (number of entities and financial turn-over)
Public sector
Year 2018 budget
Government subsector Social security funds 1/
Public corporation subsector
Budgetary unit
Extrabudgetary units
Non-financial public
corporations
Financial public corporations
Central L
- 50 MDAs - GH₵ 49.1 billion in expenditures 2018 budget 1/
NA 2/ - 1 Fund - GH₵ 1.9 bln budget 3/
- 84 total non-financial and financial - no estimate of total expenditures 4/.
No data
Municipal Metropolitan and District Assembly (MMDAs)
216 MMDAs - No estimate of total expenditure.
1/ From Table 3A, 2018 Budget Statement Appendix. Amount shown is the total GoG budget (GH₵ 61.1 billion) less transfers to other government units (GH₵ 12.1 billion), such as Statutory Funds. 2/ Information is not available in consolidated form. units comprise Statutory Funds (GET Fund, Roads Fund, DACF, the National Health Fund, and the Infrastructure Investment Fund), which receive funding from the budget in the form of transfers, and autonomous bodies, such as universities and hospitals, which receive funding through IGF. 3/ From Table 4A, 2018 Budget Statement Appendix. 4/ Forty-four are 100 percent GoG-owned, of which 34 are commercial. The other 40 have less than 100 percent of GoG ownership. Note: NA= information not available.
Table 2.7: Financial structure of central government—budget estimates
Year 2016, GH₵ bln
Central government
Budgetary unit
Extrabudgetary units
Social security funds
Total aggregated
Revenues Expenditures Transfers to (-) and from (+) other units of general government,
49.0 50.1 -4.5 +1.5
NA
NA
NA
Change in stock of liabilities Change in stock of financial assets Change in stock of non-financial assets
In Table 2.7 NA NA NA
Source: Annual Financial Statements for 2016, prepared by the CAGD. Note: NA=Information not available.

30
Table 2.8: Financial structure of central government – actual expenditures
Year Central government
2016, GH₵ bln Budgetary unit
Extrabudgetary units
Social security funds
Total aggregated 1/
Revenues Expenditures Transfers to (-) and from (+) other units of general government’
54.33 45.49 +1.47 -5.86
NA NA 1/ NA
Change in stock of liabilities Change in stock of financial assets Change in stock of non-financial assets
26.8 10.1 0.9
NA NA NA
1/ Source: Statement of Revenues and Expenditures in Annual Financial Statements (AFS) for 2016. Transfers in and Transfers out are explicitly included in the Statement. Transfers in are from the National Health Insurance Levy/the Social Security Fund (SNNIT) (note 7 in AFS). Transfers out are to the GETT, the DACF, Petroleum/Roads/Energy Fund, the Ghana Infrastructure Investment Fund (GIIF), The Energy Sector Levy, and the National Health Insurance Levy (NHIL) (note 20 in AFS). There is a Social Security Fund. Its receipts and expenditures are not explicitly shown in the annual financial statements of the CAGD. Note: NA=Information not available.
Institutional responsibilities for PFM
The six key institutions with responsibility for PFM are the Ministry of Finance (MoF), the Controller and Accountant General Department (CAGD), the Ghana Revenue Authority (GRA), Ghana Audit Service (GAS), Cabinet and Parliament. In Ghana, both the CAGD and the GRA fall under the jurisdiction of the MoF. The responsibilities of the MoF and CAGD are summarized below. The responsibilities of the GRA are summarized under PI-19 in Section 3.
The MoF
The MoF has overall responsibility for preparing the annual budget and arranging for the execution of it during the year. As shown on its website, it comprises a number of divisions: budget, debt management, economic research and forecasting, revenue policy, public investment, the real sector, monitoring and evaluation, the financial sector, and external resource mobilization . Its management comprises the Minister, three Deputy Ministers, Chief Director, and other Directors . Section 6 of the PFMA (2016) outlines the responsibilities of the Chief Director, who is the highest ranked civil servant in the MoF. Section 10 and 54 of the PFMA (2016) provides for the establishment of the Budget Office and Debt Management Office respectively. The line ministries are responsible for preparing their annual budgets under the direction of the MoF’s Budget Division which prepares Budget Guidelines each year. This guides the MDAs in the process of preparing their budgets. The process of preparing the annual budget is described and assessed under PI-17 in Section 3. MDAs are responsible for executing their budgets, according to procedures indicated by the MoF (for example, quarterly budget allocation

31
ceilings). They are also to report on budget execution as well as prepare their financial statements for audit.
The CAGD
The CAGD is headed by the Controller and Accountant-General (CAG). He is the Chief Accounting Officer for the Government and is assisted by 6 Deputy Controllers and Accountant-Generals, each of which is in charge of one of the six divisions of CAGD: Finance and Administration; Treasury; Financial Management Services; Information, Communications and Technology Management; Payroll Management; and Audit and Investigation. Each Division also has a number of units under it.
GRA
The GRA is headed by the Commissioner-General (CG) who is assisted by 3 Commissioners, each of which is in charge of one of the three divisions of GRA: Domestic Tax Revenue; Customs; and Support Services. Each Division has a number of departments under it.
GAS
The GAS is headed by the Auditor-General (AG). He is the constitutionally mandated Supreme Auditor of the Republic of Ghana and is assisted by 5 Deputy Auditors-General, each of which is in charge of one of the 5 departments of GAS: Finance and Administration; Central Government Audit; Educational Institutions and District Assemblies; Commercial Audit; and Performance and Special Audits.
Cabinet and the Parliament
The Cabinet is comprised of ministers from different Ministries, appointed by the President is responsible for reviewing the draft budget that emerges from the budget preparation process. The Minister of Finance is a member of the Cabinet and is responsible for submitting the draft budget to the Cabinet for its review. After its approval, which may require changes to the first draft, the budget is then submitted to the Parliament for discussion and eventual approval. Legally, approval has to be given by the end of the financial year. Legal approval is done through the annual Appropriations Act, which shows the approved appropriations for each Ministry according to program and broad economic classification. The Act also shows the appropriation of spending of IGF and other donor funds by cost centers under each Ministry.
Other key institutions with PFM responsibilities include the Public Procurement Authority (PPA); discussed under PI-24 in Section 3; the Internal Audit Agency (PI-26 in Section 3); the Public Service Commission (PI-23), the National Development Planning Commission (PIs 8, 16 and 17); the Ministry of Local Government and Rural Development (PI-7); and the Bank of Ghana (PIs 21 and 27).

32
2.5 Additional key PFM features and operating environment
A key feature of the budget in Ghana is the high degree of segmentation and earmarking, thereby instilling rigidity into the budgeting process. The main examples include:
(i) MDAs are allowed to retain a proportion of the internally-generated funds when providing public services. The processes followed for budgeting for these are transparent, as guided by legislation, and effectively monitored by the Non-tax Revenue Unit of the MoF. However, they are contrary to the practices in many countries whereby all revenues earned by MDAs through the provision of services are required be surrendered to the fund into which all tax revenues flow (the Consolidated Fund in Ghana). In this way, there is no earmarking. The funds surrendered are available for MDAs to compete for as part of the budget preparation process, resulting, in principle, in an optimum allocation of resources for the good of society. The IGF retention process also increases the administrative costs of budgets (ring-fencing funding for around 150 cost centers, as shown in 15 out of the 29 pages of the 2018 Appropriations Act). The retention process, though controlled, also raises the risk of MDAs keeping IGFs that they have earned in excess of the amounts they are allowed to retain, and then spending the surplus on items not included in the approved budget.4
(ii) The establishment of Statutory Funds results, in effect, in earmarking. The GETFund was established as a mechanism for earmarking public money for the provision of education services. Its funding comes in the form of a transfer from the MoF, as stipulated under the GETFund Act as a percentage of GoG revenues. The transfer is provided for in the annual Appropriations Act as a lump sum item. The budgeting of the use of the funds is outside the GoG budgeting process, and the expenditures of these funds are not captured in GoG budget execution reports or in the annual financial statements. Moreover, the administrative costs associated with running the GETFund are higher than they would be if the funding was simply provided through the Ministry of Education as part of the annual budgeting process.
The Earmarked Funds Capping and Realignment Act, April 2017, referred to in Table 2.5, partly addresses this issue by capping the percentage of revenues that can be transferred to Statutory Funds.
The annual Appropriations Acts shows other areas of earmarking (for example, at the Youth Employment Agency, and the Ghana Airport Authority).
As part of its periodic reviews of the progress being made by the GoG in implementing the ECF program, the IMF has been critical of the rigidity built into the budgeting system in Ghana, noting
4 In Uganda, ministries were allowed to retain earned revenues through ‘Appropriations in Aid” (AiA) provisions, with the use of such revenues budgeted for in the annual budget. However, there was scope for abuse. The Ministry of Finance eliminated the AiA in 2002. The Passport Agency, for one, was apparently not happy with this arrangement.

33
that reducing such rigidities would help to strengthen the efficiency and effectiveness of public expenditures.
Establishment of the GIFMIS and Treasury Single Account
The GIFMIS
Attempts to establish an information technology (IT)-based integrated financial information system in the mid-2000s ended in failure due to design deficiencies. As noted in the 2012 PEFA assessment, work had started on building a new system, called the GIFMIS.
GIFMIS development has been managed through the offices of the PFM Reform Project, funded by the World Bank. The PEFA assessment was based at the GFMIS offices during its field visit, facilitating an early meeting with the GIFMIS team. The GIFMIS now covers a multitude of cost centers, including those earning from IGF Donor Funds, and Statutory Funds. GIFMIS covers much of the country through the establishment of Transactions Processing Centers through a Wide Area Network (WAN). It also covers all Regional capitals and 166 out of 216 existing MMDAs. It is important to note that 38 new MMDAs were created in March 2018; these are yet to be provisioned for GIFMIS connectivity.
Progress in establishing the GIMIS was mentioned in the Annual Budget Statements and Economic Policy submitted to Parliament by the Minister of Finance. Paragraph 341 of the 2018 Budget Statement submitted to the Parliament on November 15, 2017 indicated that the GIFMIS had been launched in all MDAs (54), 60 Municipal Metropolitan and District Assemblies (MMDAs), and some institutions receiving IGF, including: four teaching hospitals, the Energy Fund, the Road Fund, the GETFund, and four donor-funded projects. Progress is also mentioned in the 5th and 6th review of ECF, published by the IMF on May 1, 2018, stating that GFMIS was now 87 percent complete.
The GIFMIS appears to be yielding significant benefits in terms of accounting and reporting (for example, the annual Budget Statement and Economic Policy and the annual Budget Performance Report). It has also had benefits in terms of budget preparation because of the acquisition of Hyperion, one part of the same Oracle suite of products that are part of the GIFMIS. Budgets prepared on Hyperion are electronically uploaded into the GIFMIS once approved, thereby facilitating timely budget execution and budget execution reports.
The Treasury Single Account (TSA)
The establishment of a TSA would facilitate more effective cash management in support of efficient budget execution. All available cash would be used to meet budget execution liquidity needs before borrowing would become necessary. There would be no surplus cash sitting in GoG bank accounts that could not be accessed to meet cash needs or that could be invested to earn interest.

34
Significant improvement has been recorded in cash and treasury management since 2016. Predictability and control in budget execution has been a major concern over the years, mainly due to poor cash management and budget overruns. The launching of the Treasury Single Account (TSA) in August 2017 and the continuous streamlining of Government bank accounts onto the TSA framework has significantly improved cash management, providing a more reliable expenditure commitment and payment framework, thereby reducing expenditure arrears and improving service delivery even though not at satisfactory levels.
The automatic bank reconciliation module within GIFMIS has been fully rolled out to all 37 MDAs. The TSA framework has resulted in an efficient daily consolidation of government bank accounts for 85% of central government cash flow, leading to effective cash management thereby reducing borrowing cost. That notwithstanding, more than 2500 other government bank accounts held by MDAs remain outside the TSA framework, some of these are donor-funded projects and others are government foreign accounts.
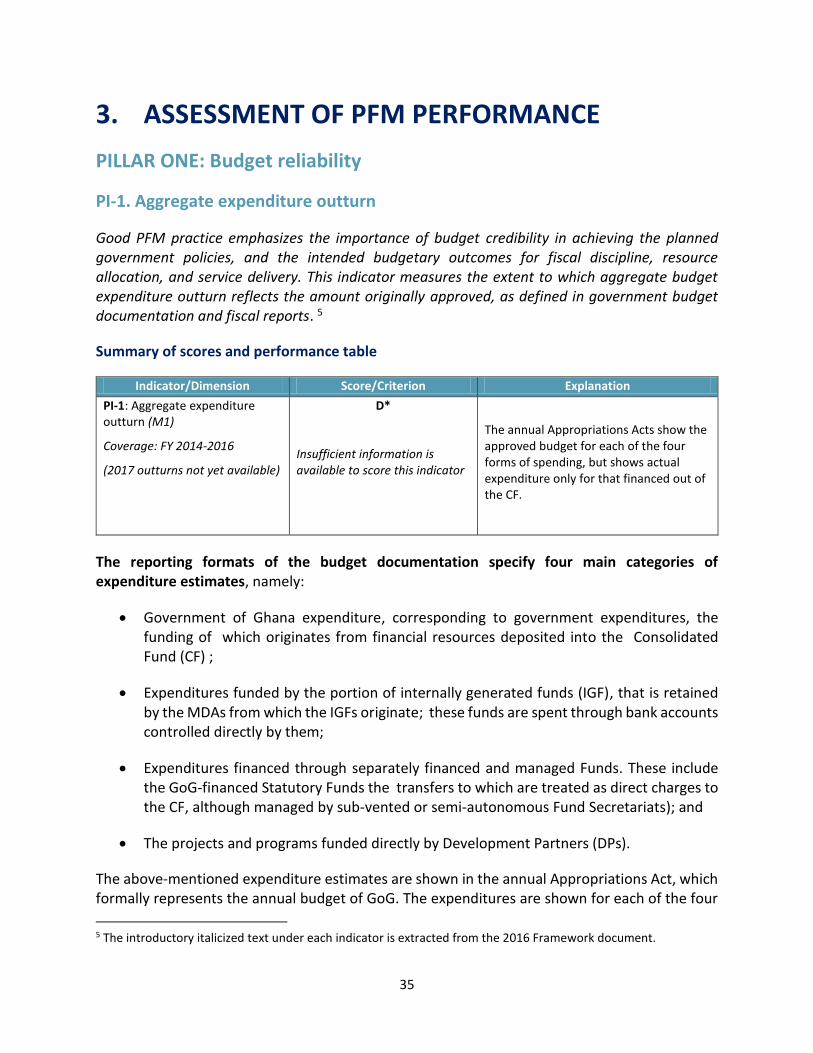
35
3. ASSESSMENT OF PFM PERFORMANCE
PILLAR ONE: Budget reliability
PI-1. Aggregate expenditure outturn
Good PFM practice emphasizes the importance of budget credibility in achieving the planned government policies, and the intended budgetary outcomes for fiscal discipline, resource allocation, and service delivery. This indicator measures the extent to which aggregate budget expenditure outturn reflects the amount originally approved, as defined in government budget documentation and fiscal reports. 5
Summary of scores and performance table
Indicator/Dimension Score/Criterion Explanation
PI-1: Aggregate expenditure outturn (M1)
Coverage: FY 2014-2016
(2017 outturns not yet available)
D*
Insufficient information is available to score this indicator
The annual Appropriations Acts show the approved budget for each of the four forms of spending, but shows actual expenditure only for that financed out of the CF.
The reporting formats of the budget documentation specify four main categories of expenditure estimates, namely:
Government of Ghana expenditure, corresponding to government expenditures, the funding of which originates from financial resources deposited into the Consolidated Fund (CF) ;
Expenditures funded by the portion of internally generated funds (IGF), that is retained by the MDAs from which the IGFs originate; these funds are spent through bank accounts controlled directly by them;
Expenditures financed through separately financed and managed Funds. These include the GoG-financed Statutory Funds the transfers to which are treated as direct charges to the CF, although managed by sub-vented or semi-autonomous Fund Secretariats); and
The projects and programs funded directly by Development Partners (DPs).
The above-mentioned expenditure estimates are shown in the annual Appropriations Act, which formally represents the annual budget of GoG. The expenditures are shown for each of the four
5 The introductory italicized text under each indicator is extracted from the 2016 Framework document.

36
funding sources mentioned above. The budgeted expenditures to be financed through the CF comprise about 80% of the total budget, the proportion varying slightly each year.
Although approved budgets show all sources of funding, the annual Financial Statements prepared by the CAGD and the annual Performance Reports on the Budget Statement and Economic Policy only show expenditures directly financed through the CF. Information on expenditures financed by the other sources of funding is not routinely available on a timely basis. This issue was noted in previous PEFA assessments and remains an issue in this assessment, as emphasized under PI-6,
It is therefore not possible to score this indicator, as the information is not fully available to score it.
For information purposes, Table 3.1 summarizes aggregate expenditure performance for FYs 2014-16 for expenditure financed through the CF. Actual expenditures exceeded budgeted amounts by large margins (at least 16 percent). The main reasons were: (i) non-wage expenditure commitments being larger than implied by approved budgets, leading to payments arrears that eventually had to be paid off; and (ii) large wage increases, also leading to payment arrears that had to be paid off.
Table 3.1: Aggregate CF-financed GoG expenditure performance (GH₵ billion)
2014 2015 2016
Budget 16.5 20.2 22.8
Actual 19.6 23.6 29.4
Percent Deviation 18.8% 16.8% 28.9%
Sources: Annual Appropriations Acts, Annual Financial Statements (CAGD), Annual Performance Reports on the Budget Statement and Economic Policy.
On-going reforms
The new Public Finance Management Act (2016) requires the reporting of expenditures to cover all sources. The issue will thus be resolved once the accompanying Financial Regulations currently being prepared are finalized and approved by the Parliament.
PI-2. Expenditure composition outturn
When the composition of expenditure varies considerably from the original budget, the intended budget outcomes may be severely underachieved. Thus, this indicator measures the extent to which reallocations between the main budget categories during budget execution have contributed toward the variance in expenditure composition. The results for this indicator measure variations for the administrative classification (MDA); and the broad economic classification.. FYs 2014, 2015, and 2016 are used for assessing performance.

37
Summary of scores and performance table
Indicator/Dimension Score/Criterion Explanation
PI-2 Expenditure composition outturn (M1-WL)
(Coverage: FYs 2014-16)
D+
Insufficient information is available under 2.1. and 2.2 to score.
2-1 Expenditure composition outturn by function
D*
Insufficient information is available to score this indicator
.
For the same reasons shown under PI-1, information is insufiicent to score this dimension. The annual Appropriations Act shows the budget of each MDA according to the different types of funding source, but only shows actual expenditures financed through the CF.
2-2 Expenditure composition outturn by economic type
D*
Insufficient information is available to score this indicator
The reasoning is the same as under 2.1.
2-3 Expenditure from contingency reserves
A
Actual expenditure charged to a contingency vote was on average less than 3 percent of the original budget.
Expenditure from contingency reserves was 0 percent of the original approved budget in 2014, 2015, and 2016, indicating that the expenditure contingency was allocated to the MDAs.
The way in which budget and outturn data are presented in Ghana makes the scoring of this indicator challenging. As noted under PI-1, the audited annual financial accounts prepared by CAGD do not provide outturns for all categories of expenditure. The CAGD does not report on actual expenditures funded by internally--generated funds (IGF)s, Statutory Funds (only reported in the accounting notes) and donor-financed projects/programs. The accounts only report on expenditures of each MDA financed through the Consolidated Fund (discussed further under PI-6) and not expenditures funded by the other sources noted under PI-1. The proportion of total actual expenditure per MDA funded from these other sources probably varies considerably between MDAs, further complicating the interpretation of the data.
2-1 Expenditure composition outturn by function
This dimension measures the variance between the original approved budget and end-of-year outturn in expenditure composition by program, administrative, or functional classification during the last 3 completed fiscal years. Contingency items and interest on debt are excluded. The dimension reflects the government’s ability to pursue its policy objectives as intended and stated in the budget.

38
It is not possible to score this dimension as information on actual expenditures per MDA presented on the same basis as for the approved budget (as shown in the Apprpriations Act) is not available.
Although it is not possible to score, for information purposes, the detailed tables in Annex 7 show the percentage variations between the original budget and actual expenditures funded out of the CF by administrative head for the 3 years. The CF comprises about 80% of total budgeted funding, according to the Appropriations Act for 2018 and thus provides an approximate guide as to the predictability of the budget by MDA (though this proportion is different for each MDA). The expenditure composition variance is derived from this information, as shown in Table 3.2.
Variations fluctuate very substantially both between MDAs and between years — indicating that the original approved budget may not be a good predictor of actual expenditures by the MDAs (even if the data captured all funding sources). This may reflect problems in preparing accurate budgets, perhaps because of inherent uncertainties in estimating the quantity and price factors used to prepare budgets. As noted under PI-1, large unbudgeted non-wage expenditure commitments and wage/salary increases led to payments arrears which had to be paid off during 2014-16. The variations were particularly high for three large MDAs:
Ministry of Local Government and Rural Development (2014: 322 percent; 2015: 643 percent; and 2016: 463 percent);
Ministry of Roads and Highways (2014: 146 percent; 2015: 976 percent; 2016: 2167 percent); and
Ministry of Works and Housing (2014: 137.6 percent; 2015: 632 percent).
The reasons for the deviations were broadly the same in all three years., as noted in the scoring box.
Table 3.2: Expenditure composition variance by Administrative Head 1/
for PI-2.1 for PI-2.3
Year Composition Variance (%)2/ Contingency Share (%)
2014 14.7 0.0
2015 27.5
2016 24.9
1/ The variance composition is defined as the sum of the absolute deviations for each MDA from the ‘adjusted budget’, defined as the original budget for the MDA plus/minus the aggregate deviation.
2/ The figures are derived from Annex Table 6, which show expenditure financed through the CF only..
Dimension 2.2 Expenditure composition outturn by economic type
This indicator measures the difference between the original approved budget and end-of-year outturn in expenditure composition by economic classification during the last 3 years, including

39
interest on debt and contingency items. The composition of the budget by economic classification is important for showing the balance between different categories of inputs.
The detailed tables in Annex 6 show the budgeted and actual expenditures (the latter funded through the CF only) for each main economic classification category, for which the composition variance by economic type is derived. The largest component is compensation of employees (28 percent of total expenditures), followed by interest payments, grants and capital expenditures. The size of the deviations for each component tends to vary between years. Table 3.3 shows the composition variance by economic type. The variance is significant, mainly reflecting the large expenditure variance by administrative function, as shown under PI-2.1. The variance might be different, however, if actual expenditures represented all funding sources; the detailed budget estimates include estimates for each funding source according to economic classification.
Table 3.3: Composition variance by economic type
Year PI 2.2. Composition
Variance (%)
2014 10.4
2015 12.6
2016 21.0
PI 2.3 Expenditure from contingency reserves
This indicator recognizes that while it is prudent to include an amount to allow for unforeseen events in the form of a contingency, this amount should not be so large as to undermine the overall credibility of the budget. Moreover, for the sake of transparency, if the contingency reserves are used, they should be allocated to the budgets of MDAs..
The contingency share of the total budget was calculated relative to the total budget appropriation, including contingency and interest. As indicated in the detailed tables in Annex 6, the share was no higher than 0.5 percent of the total budgeted expenditures in 2014, 2015, and 2016. Moreover, the contingency was allocated in its entirety to the MDAs (in the detailed tables in Annex 6, the actual expenditure under the contingency item is shown as zero).
.
PI-3. Revenue outturn
Summary of scores and performance table
Indicator/Dimension Score/Criterion Explanation
PI-3 Revenue outturn (M2-AV)
(Scope of coverage: 2014-16)
D+

40
Indicator/Dimension Score/Criterion Explanation
3-1 Aggregate revenue outturn D
Performance is less than required for a C score.
The C score requires that actual
revenue be between 92 and 116
percent of budgeted revenue in
at least two of the last three
years.
Actual revenues and external grants were less than 92 percent of budgeted revenues and grants in 2 of the 3 years: 90.5, 92.5 and 88.5 percent in 2014-16, respectively.. The key reasons for variation was largely due to dips on tax on income and property as well as tax on international trade
3-2 Revenue composition outturn
C
Variance in revenue composition was less than 15% in two of the last three years.
The variance in revenue composition was less than 15 percent in all three years, 2014-10.4 percent; 2015-8.1 percent; and 2016-12.9 percent, respectively 1/.
1/ Defined as the sum of absolute deviations between the actual and budgeted revenues for each revenue type. This is divided by the total budgeted amount of revenues and expressed as a percentage.
PI-3.1 Aggregate revenue outturn
Table 3.4 summarizes revenue performance. Aggregate revenue outturn compared with originally approved budget was more than 16%. Actual aggregate revenues and external grants were less than 92 percent of budgeted revenues and grants in 2 of the 3 years: 90.5, 92.5 and 88.5 percent in 2014-2016, respectively.
Table 3.4: Domestic revenue and external grants performance
Year PI 3.1 Total Revenue Deviation (%) PI 3.2 Composition Variance (%)
2014 -9.5 -10.4
2015 -7.5 -8.1
2016 -11.5 -12.9
Table 3.5 shows revenue performance for 2014-2016 for each type of revenue.
Table 3.5: Revenue and external grants performance by tax-type (millions cedis)
2014 2015 2016
Budget Actual % dev. Budget Actual % dev. Budget Actual %
dev.
Total revenues and external grants
25,986 23,527.8 -9.5 32,406.2 29,981.8 -7.5 38,038.0 33,678.2 -11.5
Taxes on income and property
9,238.3 8,486.5 -8.9 11,228.6 8,706.5 -29 12,072.0 9,106.9 -32.6
Taxes on domestic goods and services
7,061.3 6,434.2 -9.8 9,471.7 9,926.8 4.8 11,323.9 12,231.3 8.0

41
2014 2015 2016
Budget Actual % dev. Budget Actual % dev. Budget Actual %
dev.
Taxes on international trade
4,051.1 3,091.2 -31.1 4,705.7 3,448.9 -36.4 5,472.6 4,390.4 -24.6
Non-tax revenues 1/ 4,342.8 4,483.3 5.5 5,266.8 4,921.4 -6.6 7,209.7 4,882.4 -32.3
Social contributions 161. 4 218.2 35.2 182.6 289.3 58.4 352.0 280.4 -20.3
External grants 1,130.7 814.1 -38.9 1,550.8 2,688.8 75.4 1,607.9 1,140.7 -41
% Deviation -9.5% -7.5% -11.5%
Sources: Annual Budget Statements, Budget Performance Reports, and Fiscal Data reports (all prepared by MoF).
1/ Comprise budgeted and actual IGFs collected by MDAs, disaggregated according to retained and lodged IGFs (shown in the annual Fiscal Data reports prepared by MoF). The Non-Tax Revenue Unit in MoF collects the information from MDAs. The annual financial statements prepared by CAGD do not include actual retained IGFs as these are not deposited into the CF. They do include data on actual external grants received, also included in the Fiscal Data reports.
PI-3.2 Revenue composition outturn
Total actual revenue and grants have fallen short of approved budgets in recent years,mainly due to the unforeseen sharp decline in global oil and cocoa prices. Tax revenues from the sale of domestic goods and services were higher than budgeted for in 2015 and 2016, but not by enough to offset the impact of the fall in commodity prices on revenue from international trade.The annual Performance Reports on the Budget Statement and Economic Policy include an analysis of revenue performance. The variance in revenue composition was less than 15 percent in all three years, 2014-10.4 percent; 2015-8.1 percent; and 2016-12.9 percent, respectively
PILLAR TWO: Transparency of public finances
PI-4. Budget classification
A comprehensive classification system facilitates the effective linkage of budget allocations to underlying policies, expenditure recording, and monitoring of transactions — especially the management of key line items for the efficient and economical management of resources. This indicator assesses the extent to which the government budget and accounts classification is consistent with international standards. Government accounts, budget execution reports, and other budget execution data should be produced with a breakdown that corresponds to the documentation for the approved budget.
Summary of scores and performance table
Indicator/Dimension Score/Criterion Explanation
PI-4 Budget classification
Time period. Last draft budget submitted to Parliament (the
C
Budget formulation,
execution, and reporting are
based on administrative and
The Budget Guidelines include the chart of accounts (CoA) to be used by the MDAs for the preparation of their budgets. Budgets are prepared on a program/sub-program basis, and they are

42
Indicator/Dimension Score/Criterion Explanation
2018 Budget was prepared in 2017)
economic classification
using GFS standards (at least
level 2 of the GFS standard—
2 digits) or a classification
that can produce consistent
documentation comparable
with those standards.
increasingly being executed and reported as such through the GIFMIS. The reports are at a 2-digit GFS 2001 economic classification level, but in principle can be reported at a lower GFS 2001 level. This would, however, make budget documentation very bulky.
Not all MDAs are yet reporting on their budget execution through GIFMIS.
The Chart of Accounts (CoA) provides a framework for recording, classifying, and organizing accounting transactions into reports and statements, which provide various perspectives of these transactions. The framework is based on the 2001 edition of the Government Finance Statistics (GFS). It is structured in segments. Each segment contains a logical coding structure which facilitates reporting at both the summary and detailed levels of budgeting and accounting for transactions. These segments include Administrative, Economic, Function/Sub-function and Sub-items of expenditures and revenues of up to 7 digits. The CoA facilitates the preparation of reports required by the Public Financial Management Act (PFMA), 2016 (Act 921) and its accompanying regulations as well other management reporting.
The draft annual budget submitted to Parliament in the form of the Appropriations Bill has been presented on a program/sub-program basis since 2014. It is shown at the GFS 2-digit economic classification basis (for example, Goods and Services). . The program segment in the Chart of Accounts defines a set of services that deliver one or more of the core functions contained in the MDAs legislated and assigned mandates. It allows for classification of expenditure transactions based on programs and related sub-programs. Programs / sub-programs are assigned unique codes and descriptions.
In-year budget implementation reports can be prepared on a program/sub-program basis, as indicated by a report prepared by the Ghana Highway Authority for the period January-September 2017. Two programs are shown: (i) Management and Administration; Compensation of Employees; and (ii) Road Construction. The reports show economic classification of expenditure under each sub-program at 2-digit GFS 2001 level only. In principle, though, the reports could show budget execution through GIFMIS at a lower level GFS (sub-sub item code level for 3 digit GFS). The lower the level, however, that is, the more GFS digits – the more bulky are the reports.
The example shown below is an extract from GIFMIS from the Office of Government Machinery. It shows the purchase of copier paper (‘Printing and Stationary’ under the use of Goods and Services), as indicated in the code 2210101. The code comes under the Capacity Building Sub-program.

43
Figure 3.1: Example of use of CoA in GIFMIS for budget execution
Source: Note: CAGD= Controller and Accountant General’s Department; FMS =Financial Management System (GIFMIS). MoF= Ministry of Finance.
Full reporting on budget execution on a program basis, consistent with the program budget approved by Parliament, does not appear to have been fully achieved by all MDAs. As indicated at the team’s meeting with the Ministry of Food and Agriculture, budget execution reports could not yet be generated by the GIFMIS according to programs and sub-programs. This is because GIFMIS has not yet been fully adopted by all MDAs. Reports produced by MDAs that are outside the GIFMIS are consistent with economic and administrative classification only.

44
On-going reforms
MDAs are increasingly using GIFMIS to report on program and sub-program budget execution.
The Budget Department in MoF in conjunction with CAGD is in the process of adopting the Government Finance Statistics (GFS) 2014 Manual. This is accrual accounting based and provides complete coverage of government economic and financial activities.
PI-5. Budget documentation
This indicator assesses whether budget documentation, as presented to Parliament, contains all the information necessary for proper review, scrutiny, and approval. The set of documents provided by the executive should allow a complete picture of the central government’s fiscal forecasts, budget proposals, and outturn of the current and previous fiscal years. The assessment is made on the basis of the draft budget for FY 2018 (prepared and submitted during 2017).
Section 21 (5) of the PFMA sets out all the information requirements on which the annual budget should be based. This presentation is the responsibility of the Ministry of Finance. The Budget Statement and Economic Policy of the Government of Ghana for the 2018 Budget and the Program Based Budgets of all MDAs were submitted to the Parliament for FY 2018. The Statement comprised the following information:
Global economic developments and outlook
Macroeconomic performance for the current year – January to September 2017
Macroeconomic targets for 2018 and the medium term
Sectoral performance and outlook
Status of the 2017 budget policy initiatives and policy initiatives for the next fiscal year (2018)
Summary of Central Government Operations for 2017 to date (January-September), in the form of the Economic Classification of Central Government Revenues and Expenditures
MDA expenditure allocation for the medium term, 2018-2021
MDA staff establishment and costs
Non-tax revenue actuals and projections for 2018-2021
Internally-generated funds retention by MDA for 2018

45
Responses to the recommendations of the Parliament in respect of the report of the Auditor-General.
Summary of scores and performance table
Indicator/Dimension Score/Criterion Explanation
PI-5 Budget documentation
(Coverage: Last budget submitted to Parliament: 2018 budget submitted in 2017)
C
Budget documentation fulfils at least 3 basic elements (1–4).
A 'B' score requires 7 elements to be included in the budget documentation, including at least 3 basic elements. The fourth basic element is not included. Three non-basic elements are included in the budget documentation, one less than necessary to score a B.
Table 3.6: Budget documentation elements
Basic Elements Yes/No
1. Forecast of the fiscal deficit or surplus or accrual operating result.
Yes
2. Previous year’s budget outturn, presented in the same format as the budget proposal.
Yes
3. Current fiscal year’s budget presented in the same format as the budget proposal. This can be either the revised budget or the estimated outturn.
Yes
4. Aggregated budget data for both revenues and expenditures according to the main heads of the classifications used, including data for the current and previous year with a detailed breakdown of revenue and expenditure estimates.
No
Additional Elements
5. Deficit financing, describing its anticipated composition.
Yes
6. Macroeconomic assumptions, including at least the estimates for GDP growth, inflation, interest rates, and the exchange rate.
Yes
7. Debt stock, including details at least for the beginning of the current fiscal, year presented in accordance with the GFS or other comparable standard.
No
8. Financial assets, including details at least for the beginning of the current fiscal year, presented in accordance with the GFS or other comparable standard.
No
9. Summary information of fiscal risks, including contingent liabilities such as guarantees, and contingent obligations embedded in structured financing instruments such as public-private partnership (PPP) contracts.
No
10. Explanation of budget implications of new policy initiatives and major new public investments, with estimates of the budgetary impact of all major revenue
No

46
policy changes and/or major changes to expenditure programs.
11. Documentation of the medium-term fiscal forecasts
Yes
12. Quantification of tax expenditures No
Source: (i) 2018 Budget Statement and Economic Policy; (ii) 2018 Program-Based Budget.
Some of the information elements that are not included in the budget documentation are included in other documentation that Parliament has access to at a later date, including: the Annual Debt Management Report (ADMR) prepared by MoF, and the annual financial statements prepared by CAGD (including financial assets). The Annual Debt Management Report was prepared for the first time only in 2017 for 2016 (see PI 13).
PI-6. Central government operations outside of financial reports
This indicator measures the size of government revenues and expenditures not reported in the central government’s ex-post consolidated financial reports. Consolidating all general government revenues and expenditures into fiscal reports will provide a complete picture across all categories and will help aggregate fiscal discipline. It will also encourage the management of all resources in a manner consistent with government policies and procedures, and promote the quality and quantity of services provided on behalf of government.
Summary of scores and performance table
Indicator/Dimension Score/Criteria Explanation
PI-6. Central government operations outside of financial reports (M2-AV)
(Coverage: Last completed FY)
D
6.1 Expenditures outside of financial reports
D
Performance is less than required for a C score.
The C score requires that expenditures outside of government financial reports be less than 10 percent of total Budgetary Central Government (BCG) expenditures.
Expenditure of MDAs outside of the Consolidated Fund Financial Statements was at least 8.8 percent of BCG expenditures in 2016. This represents the estimated spending of retained IGF and donor project grants. Spending financed by these Funds (retained IGF and donor funds) is not known, but budgeted amounts were 14 percent of budgeted BCG expenditures. It is highly likely that actual spending increases the percentage to over 10 percent.

47
Indicator/Dimension Score/Criteria Explanation
6.2 Revenues outside of financial reports
D
Performance is less than required for a C score.
A score of C requires that revenues outside of government financial reports be less than 10 percent of total BCG revenues.
Revenues outside of the Consolidated Fund Financial Statements were at least 27 percent percent of BCG revenues in 2016.
6.3 Financial reports of extra-budgetary units
D
Performance is less than required for a C score.
The C score requires that detailed financial reports of the majority of extra-budgetary units are submitted to the government annually within nine months of the end of the fiscal year.
Less than 50 percent of extrabudgetary units by value submit audited financial reports within nine months of the end of the financial year.
Extrabudgetary revenues and expenditures are not contained in the central government’s annual budget, budget execution reports, and annual financial statements.
Extra-budgetary operations may arise in two ways:
1. Extra-budgetary units independent of the Budgetary Central Government (BCG), which comprises MDAs that are included in the annual budget presented to the Parliament. Entities independent of the BCG are governed by their own legislation, and thus fully autonomous . Some of these entities are included under this indicator as their focus is on the provision of public services, and they do not operate in a commercial manner (for example, universities and hospitals). Their revenue mobilization and spending operations are outside the BCG, but they should disclose their budgets, budget execution reports and annual audited financial statements. These units may receive funding through the BCG (for example, through internally generated funds (IGF) that they are allowed to retain and spend), but the amount of funding and the spending thereof should be fully reported and accounted for. The law requires all extrabudgetary agencies to prepare separate annual financial statements for the Auditor General or his/her appointee.
2. Operations of budgetary units outside of BCG financial reports: MDAs (budgetary units) may include entities that are part of the BCG, but which have a degree of autonomy. In the Ghana context, such entities tend to be known as sub-vented agencies (often known as semi-autonomous agencies in other countries). Their revenues, expenditures and accounts may or may not be consolidated with those of the parent MDA.
Currently, Ghana has scores of government departments and extrabudgetary units, with at least some aspects of their activities (that is, revenues, expenditures, or both) lying outside the

48
budget, complicating the reporting of the fiscal environment. Some extrabudgetary units finance all their operations from revenues collected directly from taxes and levies stipulated in their enabling Acts. As such, they do not receive additional support from the government budget, except for employee compensation paid centrally for all GoG employees. Examples include the National Health Insurance Authority (NHIA) and the Road Fund. Some other agencies retain and use their IGFs to augment budgetary allocations from the BCG, usually for employee compensation, some goods and services, and, sometimes, some investments. Examples include hospitals and senior high schools.
The Government of Ghana has only one official annual financial report, which is the Annual Financial Statements on the Consolidated Fund, for reasons elaborated below. It does not cover all the actual revenues and expenditures of GoG institutions that are funded through the Annual Appropriations Act. It excludes the following:
funds internally generated by MDAs and retained and spent by them, as allowed by law;
the expenditures by MDAs of most grants provided to them by development partners;
the receipts and expenditures of Funds, namely the District Assemblies Common Fund (DACF); the Ghana Education Trust Fund (GETFund); the Petroleum, Roads and Energy Funds, and the National Health Insurance Authority (NHIA). All these are Statutory Funds, established by legislation. As indicated in the 2016 Annual Accounts prepared by the CAGD, they receive funding from the GoG through shares of revenues and direct transfers.
Table 3.7 summarizes the Third Schedule of the 2015 Appropriations Act, which is the legal document approving the Budget for 2016. The budgeted proportion of expenditures through the CF was about 70 percent of total appropriations. The 2017 Appropriations Act (for FY 2018) shows that CF funding will comprise 80 percent of total appropriations.
Table 3.7: Summary of Third Schedule of the 2015 Appropriations Act for the
FY 2016 (GH₵ millions)
Funding from Consolidated Fund
Funding from Retained IGF
Funding from Funds
Funding from Donors
Total MDA Appropriations
34,837.2 3,532.4 6,846.6 4,893.7 50,109.9
69.5 % total 7.0% total 13.7% total 9.8% total 100.0, total
Details of sources of revenue and expenditure patterns are outlined under PIs-6.1 and 6.2 below
These figures exclude the revenues and expenditures of legally autonomous GoG institutions, which by definition have their own budgets. Thus, they are completely extrabudgetary. Nevertheless, they are receiving and spending public money, so their operations should be transparent, as assessed under PI 6.3, particularly for those institutions providing public services.
In Summary:

49
a. The final accounts (the Consolidated Fund Statement of Revenues and Expenditures) do not report on the actual retained revenues realized and the expenditures incurred on them.
b. Individual MDA final accounts should report on the actual retained revenues realized and the expenditures incurred; however, it is not clear how many MDAs submit their final accounts, as required by law.
c. The final accounts (the Consolidated Fund Statement of Revenues and Expenditures) do not report on the actual collections of IGFs (the bulk of which are in the health and education sectors) and the expenditures incurred on them.
d. The final accounts of MDAs and those of autonomous agencies (for example, universities and hospitals) include the actual collections of IGFs and the expenditures incurred on them.
Table 3.8 below summarizes the extent to which extrabudgetary revenues and expenditures and accounts are reported.
6.1. Expenditures outside of financial reports
This dimension assesses the magnitude of expenditures incurred by budgetary and extrabudgetary units (including social security-type funds) that are not reported in the government’s financial reports. Such expenditures may include expenditures from fees and charges collected and retained by budgetary and extrabudgetary units outside of the approved budget, as well as expenditures on externally-funded projects and activities not reported in central government financial reports.
Extrabudgetary expenditures arise through Article 175 and 176 of the 1992 Constitution and Sections 40 and 41 of the now-repealed Financial Administration Act (FAA) 2003. Article 175 of the Constitution creates three types of public accounts: The Consolidated Fund (CF), the Contingency Fund, and other funds established by the Parliament. The CF does not receive all revenues. Article 176 provides that all funds should accrue to the CF, except those funds that should accrue to ‘other funds’ created by the Parliament or those that Parliament authorizes the collecting MDA to retain. The FAA did not mandate preparation of final accounts on all public accounts, only the CF. This was prior to the enactment of the 2016 Public Financial Management Act (PFMA). The PFMA provides for the preparation of all final accounts of government revenues and expenditures. It is not yet effective because the accompanying Financial Regulations are still being prepared.
Section 40 of the FAA 2003 required the Controller and Accountant General (CAG) to prepare and submit for audit, monthly financial statements on the CF. Section 41 (a) of the FAA 2003 required heads of MDAs to prepare annual financial statements for submission to the Auditor General, the Minister of Finance and the CAG. Section 41 (b) required the CAGD to prepare an annual financial statement on the CF. Thus, operations outside the scope of the CF emerged in the form of ‘other’

50
funds created by Parliament and by central government MDAs authorized to collect and retain a portion of their IGF collections.
IGFs: Most revenue-generating MDAs retain a portion of their revenues, as approved by the Parliament, to fund some of their operations. The Consolidated Fund statement of actual revenues and expenditures does not present a consolidated report inclusive of these particular revenues. Reports of IGF collections and expenditures are contained only in individual MDA financial statements; there is no consolidated overview. There are scores of these reporting agencies and therefore, potential reports. As such, it is not possible to estimate the extent of compliance with reporting requirements.
MDAs use retained IGFs to augment budgetary allocations from the Central Government (CG), usually for employee compensation and for some goods and services. As listed in detail in Appendix Table 11 of the Annual Budget Statement, examples include hospitals, universities, senior high schools, and sub-vented agencies.6 Evidence obtained from the Revenue Directorate (RD) of the CAGD shows that the retention rate varies from 20 to 100 percent. A given MDA agrees on the retention percentage with the Minister of Finance, ex-ante. The RD prepares an estimate of collectible IGFs for the coming year and includes a budget of how revenue-generating agencies will spend their retained earnings, if approved. Once approved, the Minister of Finance includes the proposed spending in the IGF Retention Policy (based on the Retention Act (735)), which the Parliament subsequently approves as part of the Appropriations Bill.
MDAs first ‘lodge’ all IGFs earned by them with the MoF. The agreed retained amounts are then sent back to the MDAs, which may then spend the revenue on the items authorized by the Parliament. Revenue generated by the MDAs may not exceed the spending ceilings capped in the retention policy without due authorization by the Parliament, even if the actual revenue collected exceeds projections. Some MDAs, however, appear to violate these rules, as noted in some cases in the summary of the audited accounts of MDAs prepared by the GAS.
The spending by MDAs of IGFs retained by them is not reported in the annual financial statements on the CF or in any other report. Actual retained IGF collections are included in the in-year budget execution reports prepared by the MoF and the annual Budget Statement and Economic Policy prepared by the MoF. The actual spending of the retained IGFs is not shown in the budget execution reports, as the funds are recorded as a transfer from the CF to the recipient
6 Appendix 11c of the 2017 Budget Statement shows actual retained IGFs for the first 9 months of the previous year, and the projections for 2017 for each of a large multitude of agencies. For Ministry of Education (MoE) alone, there are 30 agencies receiving retained IGF, including 7 sub-vented agencies, 7 universities, 10 polytechnics, some Colleges of Education and some other teaching institutions. Nearly 50 percent of all retained IGFs come under the MoE umbrella of MoE. The Ministry of Health (MoH) has the Ghana Health Services (the largest recipient of IGFs), which includes 4 Teaching Hospitals, 8 Regulatory Agencies, 7 Subvented Agencies, 3 Psychiatric Hospitals, some Health Training Institutions, and the Christian Health Associations of Ghana. About 40 percent of all retained IGFs fall under the umbrella of the MoH. Thus, about 90 percent of all retained IGFs are generated by agencies falling under the MoE and the MoH.

51
MDA.7 The actual expenditures financed by these transfers are not reported in any consolidated financial report covering all MDAs. The MDAs indicate the actual expenditures financed by retained IGFs in the financial reports they prepare and submit to the GAS separately. However, these reports are not consolidated into one annual financial report, covering all revenues and expenditures. Given the large number of MDAs, such a consolidation is necessary for Parliament to understand exactly how the retained IGFs are being spent. The annual report prepared by the GAS on the public accounts of MDAs does not provide a consolidation. In this context, its main purpose is to indicate various violations of Financial Regulations by MDAs. It is not even clear whether the individual accounts prepared by the MDAs and submitted to the GAS for audit include all retained IGFs and the spending thereof.
Donor-funded projects/programs: Accurate reporting on donor grant-funded project/program expenditures appears to be problematic. Several government departments benefit from donor-funded projects, for example, the ministries of health, education, and agriculture. Donor funds are not co-mingled with GoG funds, but flow directly to a commercial bank or the Bank of Ghana accounts maintained for the project/program purpose. Financial statements prepared for the Consolidated Fund do not account for the expenditure of these resources. Individual MDA financial statements do account for such expenditures. However, as is the case for the retained IGFs, these are not consolidated into one report.
The Project Grants schedule listed in the report on the Accounts for 2016 (Table 4) prepared by the CAGD indicates grants from several donors, but actual expenditures are not reported. Financial inflows of funding from donors are recorded and reported, at least for those inflows deposited into GoG-held bank accounts. Note 1.12 under the Summary of Accounting Policies in the CAGD indicates that expenditures are simply assumed to equal disbursements (as also noted in the 2012 PEFA assessment). The Resource Mobilization Division in MoF maintains a manual system for reporting of expenditures, but this relies on accurate reporting by donors and Project Implementation Units (PIUs). The PIUs tend to maintain accounts in commercial banks. These are opened by the parent Ministry, but the monitoring of project/program expenditures through these accounts does not tend to be systematic. In any case, such expenditures are not reported in a transparent manner.
To date, there is no system that automatically provides for such reporting, although a linkage through the GIFMIS is being planned. The situation is better for loan-funded donor projects/programs, as the accounts for these tend to be held in the BoG, because: (i) the amounts of funding per project/program tend to be much larger than those of grants; and (ii) donors want to be assured that their loan disbursements into the project/program bank account —and expenditures funded by withdrawals from the account —match their records and reconcile with
7 All IGFs collected are at first ‘lodged with the MoF, and the agreed retained part is then transferred to the MDAs. The retained IGFs are reported on as a transfer to the MDAs (noted under “Other grants and loans to” as “Retention of IGFs” in the Fiscal Data tables prepared by the MoF and in the detailed tables contained in the appendices of the annual Budget Statements.

52
the figures maintained in the Commonwealth Secretariat Debt Recording and Management System (CS-DRMS).
Some donor-funded projects may fall outside of the GoG budget completely, even if they have been agreed at a high level between the GoG and the donor. This may be the case with the United States Agency for International Development (USAID)-funded projects, as in the case in Kenya. USAID-funded project disbursements amounted to GH₵ 654.1 million in 2016 (according to Table 5 in the CAGD’s report on the Accounts for 2016). However, they are not included in any MDA budget. However, this spending takes place mainly at the MMDA level, that is, outside the scope of this assessment.
The magnitude of actual retained IGFs and donor funds received in 2016 can be found in budget performance reports, as shown in Table 3.8 below. This amounted to 8.8 percent of the total budget for that year.
Table 3.8: Budgets and spending of IGFs and donor projects (GH₵ millions)
2015 AA
Retained IGF & DP-
funded projects
2015 Actual
Retained IGF & DP-
funded projects
(Jan-Sept)
2016 AA Retained
IGF & DP-funded projects
2016 Actual
Retained IGF & DP-
funded projects
(Jan-Dec)
2017 AA , retained
IGF & DP-funded projects
2017 Actual
retained IGF & DP-
funded projects
(Jan-Sept)
Retained IGFs 2,833 1,820.7 3,532.4 3,367.8 3,361.6 2,204.7
o/w Ministry of Education
- o/w Ministry of Health
1,306.8
1,003.8
914.9
624.4
1,525.4
1,293.6
1,512.5
1,089
1,627.3
1,345.4
1,047.4
600.6
DP-funded projects 4,399.4 1,508 4,893.7 1,140.7 3,557.2 948.1
Total MDA Budget 44,021.2 27,491 50,109.9 51,125.1 54,394.8 36,423
IGF & DP funding as % total MDA budget
16.4% 12.1% 15.8% 8.8% 9.0% 8.6%
Sources: Appropriations Act (AA), Budget Statements, Budget Outturn and Fiscal Data reports prepared by the MoF. Note: DP= development partner; IGF=internally-generated funds; MDA= Ministries, Departments and Agencies; o/w= of which. Funds other than IGFs and donors:
The Appropriations Acts show that MDA spending is also funded by Statutory Funds/Funds, the operations of which are outside the CF. The 2016 Appropriations Act indicates that about 14 percent of MDA expenditures were to be financed in this way. The Funds are the Ghana Education Trust Fund (GETFund); the Petroleum/Roads/Energy Fund (through the Annual Budget Funding Allocation (ABFA); the National Health Insurance Authority (NHIA); and the Ghana Infrastructure Investment Fund (GIIF, newly established in 2016). As shown in the 2016 CAGD report, some of these Funds (GETFund) receive funding from the budget in the form of percentages of revenues

53
(for example, the VAT, as indicated under Note 3 in the CAGD 2016 report) and direct payments (Note 10 in the CAGD report). The actual spending from these Funds is not consolidated into a financial report. To determine the amount of spending of each fund, it is necessary to go to the annual reports and accounts of these bodies. These are not readily available on their websites. Those for the NHIA are available, but they are out of date.
The District Assembly Common Fund (DACF) receives funding from the GoG (note 10 in the CAGD report). Much of its funding goes straight to the MMDAs (PI-7). Thus, it is not spent at the central governmental level. As such, it remains outside the scope of this PEFA report (also referred to in earlier PEFA assessments).
Some extrabudgetary agencies finance all their operations from revenues collected directly from taxes and levies stipulated in their enabling Acts. They do not receive additional support from the government budget, except for employee compensation paid centrally for all GoG employees. These units prepare separate annual financial statements, which the Auditor General or his/her appointee audits.
Table 3.9 presents an incomplete comprehensive estimate of revenues and expenditures not reported on the CF final accounts. The audited accounts for 2016 prepared by the GAS are a convenient source of information. They show that expenditures outside the CF amounted to at least 14 percent of total central government expenditures in 2016, as measured by expenditures financed through the Consolidated Fund. Of this, at least 7.5 percent represents the extrabudgetary expenditures of the MDAs through the spending of retained IGFs and donor project/program funds. This figure may be incomplete if the MDAs are spending IGF collections that had reached the levels allowed to be retained. Any excess would be required to be deposited into the CF. Alternatively, they would need to seek the approval of the MoF to spend the excess through a budget adjustment. The annual reports prepared by GAS on the MDA accounts refer to instances of this occurrence. It is difficult to know the extent to which this is happening. It may also be incomplete if MDAs are receiving funding from donors outside of budgetary channels. However, again, it is difficult to know this.
The figure also does not take into account the spending by MDAs out of transfers from Statutory Funds/Funds. Table 3.7 indicates that 13.7 percent of 2016 total appropriations would come from these (GH₵ 6846 million). Even if only half of these were actually spent, the percentage of actual extrabudgetary spending by MDAs would climb to about 14 percent.8
Once the drafting of the Financial Regulations in support of the PFMA (2016) is completed, the issues raised above concerning the spending of IGFs and donor project funds will disappear, as the Consolidated Fund will absorb them.
8 Half of the budgeted funding by Funds is GH₵ 3420 million. Add this to the GH₵ 3674 million (under 2 above), and the total of extrabudgetary funding of budgetary units increases to GH₵ 7094 million. The total of this plus actual appropriated expenditures (GH₵ 44791 million) comes to GH₵ 51,885 million. The proportion of extrabudgetary funding amounting to GH₵ 51,885 million increases to 13.7 percent.

54
Table 3.9: Revenues and expenditures outside of the Consolidated Fund
Entity
Type of Revenue outside Central
Government (CG)
Financial Reports
Estimated Revenues outside of
CG Financial Reports (millions
GH₵)
Type of expenditure outside CG Financial
Reports
Estimated amount of
expenditures outside of CG
Financial Reports
(million GH₵)
Evidence and reporting
1) Extrabudgetary Units 1/ 3,577.5 3,756.2
Universities Student fees, grants, bursaries, financial aid, interest income, and so on.
757.0 Operating expenditures, research costs, bursaries, asset write-offs, finance costs, and so on. (funded partly by IGFs)
8,34.2 Annual reports of universities
National Health Insurance Fund (NHIA)
Receipts (not part of CF Revenues)
1,101.8 All expenditures 904.3 Annual report of the NHIA (latest, for 2013, unaudited)
Ghana Education Trust Fund (GETFund)*
Receipts 7.7 General and administrative expenses
6.59 Annual report of the GETFund
Road Fund Fees, tolls, fuel levies
1,371.7 Highways, urban roads, and feeder roads
1,877.9 Annual reports
Other income
339.3 Interest charges 133.2
2) Operations of Budgetary Units outside of CG financial reports
3,751.5 3,674.3

55
Entity
Type of Revenue outside Central
Government (CG)
Financial Reports
Estimated Revenues outside of
CG Financial Reports (millions
GH₵)
Type of expenditure outside CG Financial
Reports
Estimated amount of
expenditures outside of CG
Financial Reports
(million GH₵)
Evidence and reporting
MDAs Retained IGF
(excluding for universities, noted above, and for the MoH, also noted below)
435.6 Various items 2,066.7 Annual Budget Statements (details in Appendix Tables), show retained IGFs for each MDA recipient). See Table 6.6.
Assumes all retained IGFs are spent by MDAs. Individual MDA audited annual accounts are not available on MDA websites or GAS’ websites. The only specific information was obtained from draft financial statements of the MoH and from information contained in annual reports of universities.1/
MDAs Donor-grant funds
1,140.7 Various items 1,140.7 GAS report on CF accounts for 2016. This assumes that expenditures are equal to receipts, due to MDAs’ difficulties in reporting on expenditures.
MDAs Statutory Funds
Information is not available. Only the budgeted amounts are known (as per the 2016 Appropriations Act, which shows the Funds financing 14 percent of budgeted expenditures of the BCG).
Ministry of Health
Drugs, services, NHIS, financial credits, and so on
2,175.2 Expenditures, including through retained IGFs.
466.93 MoH Draft 2016 Financial Statements, Notes 10a, 11a, 12, and 13.
Total Outside of BCG Financial Reports
7,329 7,439.5

56
Entity
Type of Revenue outside Central
Government (CG)
Financial Reports
Estimated Revenues outside of
CG Financial Reports (millions
GH₵)
Type of expenditure outside CG Financial
Reports
Estimated amount of
expenditures outside of CG
Financial Reports
(million GH₵)
Evidence and reporting
Total CF revenues/expenditures
26,940.1 44,791.4
Total CF+ extra budgetary revenues/expenditures (1+2)
34,269 52,230
Percent outside of the CF
21.4% 14.2%
Percent outside of CF for 2.
7.6%
*Actual budgetary allocations to the GETFund in the 2016 final accounts of 922.3 million is not in the GETFund financial statements, which means that it is in some other statement not yet available
1/ These are autonomous agencies established under their own legislation. They have reporting responsibilities to the central government, and they are required to submit audited annual accounts.
6.2. Revenues outside of financial reports
This dimension assesses the magnitude of revenues received by budgetary and extrabudgetary units (including social security funds) that are not reported in the government’s financial reports. Such revenues may include those received by extrabudgetary units from budgetary transfers or other revenues, revenues from donor-funded projects, and fees and charges outside the types or amounts approved by the budget, where any of these are not reported in central government financial reports.
The evidence presented in Table 3.9 above applies in this case as well. The incomplete estimate is that, at least, 21.4 percent of central government revenues are outside of CF reports. Including funding received from Statutory Funds/Funds, the percentage would be significantly higher than this.
The Non-tax Revenue (NTR) Unit of the Ministry of Finance and the Revenue Directorate of the CAGD monitor IGF collection by agencies. The CAGD’s monitoring is through the requirement that MDAs submit monthly financial statements to the CAGD, as well as by confirmatory visits to the MDAs. The NTR Unit monitoring is more rigorous. It involves coordinating IGF forecasting, field monitoring visits, and reviews. The Unit is also deploying an e-monitoring platform to enhance efficiency. Currently, it has covered only Immigration Services, which uses it to monitor

57
passport revenues. The MoF and the CAGD also expect that the launch of GIFMIS and reporting of collections will help to close any loopholes and improve reporting.
6.3. Financial reports of extrabudgetary units
This dimension assesses the extent to which ex-post financial reports of extrabudgetary units are provided to the central government. Annual financial reports should be comprehensive and provided in a timely manner consistent with budgetary central government reporting requirements. Information should include details of actual revenues and expenditures, assets and liabilities, as well as guarantees and long-term obligations. A separate indicator (PI-29) assesses the extent to which thebudgetary central government units submit financial reports for audit.
Extra-budgetary units submit audited annual financial statements to the Auditor General and the CAGD, as required by law. Two of the seven audit reports sighted shows that these extra-budgetary units submit their audited annual financial statements to the Auditor General within nine months of the end of the year. However, most reports were submitted well after the deadline.
The Ghana Audit Service nominated independent external auditors to audit the statements of these units on its behalf. A 2016 sample (Table 3.10) of six annual accounts obtained include statements of incomes and expenditures, assets and liabilities, and cashflows. They also include a notes section. Some entities (e.g. University of Ghana) also include information about extended financial obligations (e.g. vehicle loan facility and Ghana Commercial Bank (GCB) term loan) The information also contained the balance at the beginning of the year, draw downs, repayments, and so on.
Table 3.10: Financial reports of extrabudgetary units for FY2016
Name of extrabudgetary unit
Financial Year
Date of annual
financial report
completed
Date of annual
financial report
received
Content of Annual Financial Report (Y/N):
Expenditures as a
percentage of total
extrabudgetary unit
expenditures (estimated)
Expenditures and
revenues by economic
classification
Financial and non-financial
assets and liabilities
Guarantees and long-
term obligations
University of Ghana
January 1 - December
31 NA
Sept. 7, 2017 Yes Yes Yes 12.9%
Koforidua Technical University – IGF
Sept. 14, 2017
Yes Yes Yes 0.0%
Kwame Nkrumah University of Science and Technology (KNUST)
Nov. 29, 2017
Yes Yes Yes 7.1%
University of Cape Coast Jan. 25, 2018 Yes Yes Yes 7.4%

58
Ghana Education Trust Fund (GETFUND)*
Dec. 21, 2017
Yes Yes Yes 0.1%
Road Fund Not yet submitted**
Yes Yes 43.6%
District Assemblies Common Fund NA Yes Yes 28.9%
Total 100.0%
*The actual budgetary allocations to the GETFund in the 2016 final accounts in the amount of 922,286,345 cedis are not in the GETFund financial statements. This means that they are in some other statement not yet available.
**The last audit submitted was for FY2015. The 2016 audit is complete. It was conducted by an external audit firm appointed by the Ghana Audit Service. Recent Board changes are delaying the signing and submission.
PI-7. Transfers to subnational governments
This indicator assesses the transparency and timeliness of transfers from the national government to the first-tier Sub-national Governments (SNGs) along with fiscal relations with the national government. It reviews the basis for the transfers, including whether the MMDAs receive timely information about their allocations to facilitate fiscal planning.
Summary of scores and performance table
Indicator/Dimension Score/Scoring criterion Explanation
PI-7. Transfers to subnational governments
(Scoring method: M2-AV)
D+ Only about 34 percent of transfers to the MMDAs follows transparent rules.
7.1 System for allocating transfers
(Time period: Last completed FY)
C
The horizontal allocation of some transfers to subnational governments from the central government is determined by transparent, rule-based systems.
The transfer of about 34 percent of the amounts due to the MMDAs in 2016 was done through transparent, rule-based processes. Of this, 24.6 percent was done through the procedures for block grant transfers through the District Administration Common Fund (DACF), and 9.6 percent was through the procedures for block grant transfers through the District Development Facility (DDF).
Sixty-six percent of the transfers to the MMDAs represent the institutional and indirect transfers from the DACF, as shown in Table 3.11. These were not done through transparent, rules-based procedures.

59
Indicator/Dimension Score/Scoring criterion Explanation
7.2. Timeliness of information about the transfers
(Time period: Last completed FY)
D
Performance is less than required for a C score.
The C score requires that: “The central government issues reliable information on annual transfers to subnational governments before the start of the subnational governments’ fiscal year”.
The two main issues are:
(i) MMDAs have the same budget calendar as the GoG. They have to wait until the GoG budget is passed before they know how much they will receive in transfers.
(ii) The Parliament is required to approve the horizontal allocation formula for the DACF on an annual basis. This approval may not be given until late in the first quarter of the next fiscal year.
Explanation of the Ghana Local Administration System
Ghana operates a four-level local government administration system including regions; district assemblies; sub-metropolitan district, urban, and town councils; and unit committees. Regions are at the apex of the local governmental system, but they are not the most important local governance organ. District assemblies are key. The function of the regions is to coordinate and monitor the activities of the districts within its jurisdiction. There are currently 10 regions. Each region has a Regional Coordinating Council (RCC) that comprises the regional minister and deputy/deputies, regional coordinating director, presiding officers of district assemblies, district chief executives in the region, two chiefs from the regional council of chiefs, and regional heads of decentralized ministries and agencies, who are non-voting members.
The legal basis for this arrangement can be found in the Constitution; the PFMA (2016), which replaced the FAA (2003); the Local Government Act (1993); the Local Government Service Act (2003); and the Local Government Service Regulations (2008).
Each region consists of several district assemblies, of which there are currently 216. District assemblies (DAs) are of three types: metropolitan, municipal, and district. Metropolitan DAs have populations of above 250,000, and municipal DAs have populations below 250,000, but above 95,000. District DAs have populations of less than 95,000, but more than 75,000. (This discussion uses the general term "District" to represent all administrative units below the level of the regions, except where the context indicates otherwise.)
District assemblies are the principal authorities for local service delivery, and they have planning, development, budgeting, and rating powers. They also receive budgetary allocations from the GoG, and grants from both the GoG and development partners. Their functions include integrating the national development agenda into district development plans to ensure effective coordination. District assemblies comprise both elected and unelected members. The President appoints up to 30 percent of members to represent various interest groups. The President also appoints the district chief executive, subject to two-thirds majority approval by the district assembly.

60
Unelected sub-metropolitan district, urban, and town councils are immediately below district assemblies. They consist of representatives of district assemblies, unit committees, and appointed persons. Unit committees occupy the base of the local governmental system. Unit committees perform duties assigned to them by district assemblies, but they have no independent budgets, and the members work without remuneration. Neither sub-metropolitan district, urban, and town councils nor unit committees receive direct budgetary allocations or grants from the central government or grants from development partners. Also, neither has taxing powers.
7.1. System for allocating transfers
The indicator examines the mechanism for fund transfers from the MoF to the MMDAs. The GoG transfers both specific and block grants to the districts. Each transfer follows a different process.
Specific grants
These are “categoric” (that is, specific) grants made by the GoG to the MMDAs to meet stated expenditures; the GoG centrally disburses these grants on behalf of the MMDAs. The grants are unconditional because the MMDAs do not need to fulfill any condition to qualify for them. However, the grants are specific to predefined purposes that MMDAs cannot alter, especially since the GoG directly expenses the grants on the MMDAs’ behalf. Examples of specific grants include compensation of employees, goods and services, road construction, capacity building, mineral development, and so on. The GoG transfers funds for MMDA staff compensation directly to the individual bank accounts of the employees. Other responsible organs of the GoG similarly make direct payments to the respective third parties, in the case of other specific funds. This is different from the systems in some other countries, where grants for wages and goods and services are done in the form of block grants, which are transferred directly to local governments to disburse in line with their budgets.
Sector specific grants are also used for operations and maintenance (O&M) costs in agriculture, community development and social welfare, and feeder and urban roads. The GoG uses the unit cost of service delivery, measured as the number of extension workers in the district, to distribute these funds among the MMDAs. The Ministry of Food and Agriculture (MoFA) originally developed this principle for its use, but other sectors have since started using it for their own disbursements to the MMDAs. The Ministries of Education and Health also provide sector-specific grants, but they disburse them through their deconcentrated field offices rather than through the MMDAs.
Other specific grants available to the MMDAs include the Road Fund (RF) and the Minerals Development Fund (MDF). The RF is a deconcentrated arm of the Ministry of Roads and Highways. The Districts recommend projects, but the Ministry decides which projects to execute. The Ministry also awards the contract. Districts monitor implementation of contracts and sign payment certificates submitted to them by the contractors. The RF pays the contractors directly. The decision criteria used by the Ministry to select projects to fund the MMDAs are unclear, and the Ministry does not publish them.

61
The amounts of these specific grants disbursed each year are not included in the assessment of this dimension. They do not appear to be explicitly included in the budgets of the MMDAs. In fact, they are part of the budgets of the central government ministries, with the funds being disbursed through the MMDAs.
Block grants
Block grants are comprised of: (i) unconditional grants from the GoG that MMDAs may use to support their budget as they wish; and (ii) conditional grants, which are dependent on the MMDAs meeting certain basic and performance conditions detailed in the Functional Organization Assessment Framework (FOAT) tool. The District Assembly Common Fund (DACF) is an example of the unconditional aspect of a block grant, and the District Development Facility (DDF) and the Urban Development Grant (UDG) are examples of the conditional aspects of block grants.
DACF
The DACF is a statutory, mandatory, and budgetary mechanism for disbursing funds to the MMDAs. Ghana differs from many other countries in this respect in that the central government channels these funds to sub-national governments through the regular annual budget preparation process. By law, the GoG contributes at least 5 percent9 of government tax revenues to the Fund for distribution among the MMDAs. The proceeds are a significant source of finance for MMDA development programs.
The mechanism for the horizontal distribution of the DACF to the MMDAs is complex. The distribution uses a formula proposed annually by the DACF Administrator and approved by the Cabinet and Parliament. The formula comprises “direct” and “indirect transfers” to the MMDAs. The indirect transfers consist of several upfront allocations for various national causes that may benefit the MMDAs, but significantly reduce amounts sharable among the DAs (see below). The residual after making these indirect transfers is the direct transfer distributed among the MMDAs according to a transparent, though complicated, formula.
Posts on the DACF website specify these upfront deductions, that is, indirect transfers, to include the following:
Institutional transfers, for example, for disaster management, youth employment, and so on.
Indirect transfers for supporting national social intervention projects implemented in districts, for example, the national school feeding program, borehole, the Ghana Youth Employment Entrepreneurship Development Agency, and so on. It is not clear that all MMDAs would have prioritized those procurements, if given the funds directly.
9 The Constitution specifies a minimum of 5 percent. An Act of Parliament provided for 7.5 percent in 2007, which operated until 2017 when the Parliament reduced it to the minimum of 5 percent.

62
Member of Parliament (MP) constituency projects nominated by the MDAs; this portion was 7 percent in 2016 – 4.5 percent for project implementation and 2.5 percent to the MPs for monitoring.10
DACF reserve for contingency expenditures.
DACF secretariat for operational expenses.11
In addition, the GoG takes its contribution to the DDF (see below) from the DACF.
The ‘indirect transfers’ deducted from the DACF significantly reduce the sum that the GoG can directly distribute among the DAs. The 2017 DACF Allocations Statement shows that the residual balances (direct transfer) available for distribution among the MMDAs after upfront deductions (indirect transfers) were 46.52 and 35.10 percent, respectively, in 2017 and 2016, as shown in Table 3.11 below.
Table 3.11: DACF Allocation Statement for 2017 and 2016
ALLOCATION 2017 % GH₵ % GH₵
2017 2016
INSTITUTIONAL TRANSFERS 16.35 257,602,391 6.65 133,800,000
NATIONAL YOUTH AUTHORITY (ACT. 939) 5.00 78,796,767
YOUTH EMPLOYMENT AGENCY (ACT. 887) 10.00 157,593,534 6.65 133,800,000
NATIONAL DISASTER MGT. ORGANIZATION (ACT. 927) 1.35 21,212,090
NATIONAL PROJECTS 16.03 252,622,435 38.60 776,200,000
NATIONAL EDUCATION POLICIES 4.45 70,129,123
WASTE MGT (LIQUID/SOLID) 7.00 110,315,474 14.90 300,000,000
ACCRA SEWERAGE TREATMENT PLANT (LAVENDER HILL) 2.53 39,871,164 4.70 95,000,000
SEED CAPITAL FOR NEW MMDAS BUILDING 2.05 32,306,674
OTHERS - 19.00 381,200,000
RESERVE 13.40 211,175,335 10.20 205,419,128
CONSTITUENCY LABOUR PROJECTS (MPS) 5.00 78,796,767 4.50 90,626,086
CONSTITUENCY LABOUR MONITORING & EVALUATION (MPS) 3.00 47,278,060 2.50 50,347,825
RESERVE FUND 2.00 31,518,707 1.35 27,187,826
RCC 2.00 31,518,707 1.35 27,187,826
DACF OPERATIONS 0.50 7,879,677 0.50 10,069,565
DACF OFFICE BUILDING 0.90 14,183,418
MMDAS – INDIRECT 7.70 121,347,021 9.45 190,087,130
YEA -SANITATION MODULE (ARREARS) 7.10 111,891,409 8.90 179,111,304
TRAINING 0.50 7,879,677 0.40 8,055,652
CURED LEPERS 0.10 1,575,935 0.15 2,920,174
MMDAS – DIRECT 46.52 733,188,157 35.10 708,406,758
PERSONS WITH DISABILITIES (PWD) 3.00 47,278,060 1.80 37,000,000
NET MMDAS 43.52 685,910,097 33.30 671,406,758
100 1,575,935,339 100 2,013,913,015
10 See “2016 Formula for Sharing the District Assemblies Common Fund” available on the DACF website, www.commonfund.gov.gh 11 http://www.commonfund.gov.gh/index.php?option=com_content&view=article&id=337&Itemid=442

63
Source: DACU reports
MMDAs share the residual balance according to a formula based on the four principles shown in Table 3.12. The principles are: basic needs, responsiveness, service pressure, and equality. The ‘basic needs’ principle seeks to channel resources to areas of greatest need. These are health and education services, and water and tarred road coverage. The formula explains the logic of this principle as follows, “Under this Factor, those who have more facilities/services receive less to bridge the development gap”.12
The ‘responsiveness’ factor seeks to encourage internal revenue generation
efforts within the MMDA by factoring in how responsive they have been in terms of revenue collection.
The ‘service pressure’ factor seeks to compensate urban assemblies for the ‘pressure’ put on their facilities by visitors. In this context, the rural-urban migration exacerbates this pressure. The formula uses population density to measure service pressure. However, the formula is increasingly de-emphasizing this principle and adopting the view that citizens should pay for services, as stated on the Common Fund website.
The equality factor devotes a proportion to the equality of districts. How this is defined is not clear. Table 3.12 shows that the equality and needs principles equally account for 90 percent of the formula. The responsiveness (revenue improvement) principle accounts for 6 percent, and the service pressure principle is four percent.
The DDF and the UDG
The District Development Facility (DDF) and the Urban Development Grant (UDG) are performance-based grants contributed to by the GoG and development partners (DPs). It is not clear why DPs are providing direct financial support to the DAs, when the DACF already provides a mechanism for channeling funds to them. If the DACF funding is not sufficient, then the GoG could simply increase its contribution rate13. The DPs’ contribution to the DDF is comprised of part grants and part credits. The DDF is available to all 216 MMDAs, whereas the UDG is available to only the 46 metropolitan and municipal assemblies existing in 2010, when the UDG came into effect. The extent to which performance is sufficient to meet the conditions of accessing the
12 http://www.commonfund.gov.gh/index.php?option=com_content&view=article&id=337&Itemid=442 13 Moreover, the DDF funding appears to be fungible, as indicated by the fall in the GoG’s contribution rate to 5 percent in 2018from 7 percent in 2017.
Table 3.12: Horizontal Distribution Formula of the DACF among MMDAs
Source: DACF website:
http://www.commonfund.gov.gh/index.php?option=c
om_content&view=article&id=337&Itemid=442

64
grants is assessed through the Functional and Organization Tool (FOAT) developed by the Ministry of Local Government and Rural Development (MLGRD).
The DDF comprises capacity building and investment grant components, both of which the MMDAs must meet the conditions for; the UDG comprises only a capital component. Both grants use the same basis for distribution, that is, the outcome of independent annual assessments of the MMDAs using FOAT developed by the Ministry of Local Government and Rural Development. The principle is to ‘assess the previous year in the current year, and use that to release the funds in the following year’, although in practice, the annual disbursement seems to be based on the FOAT from four years ago. The FOAT framework is comprised of two sets of conditions: minimum and performance conditions. Meeting the minimum conditions qualifies a DA to share in the capacity-building aspect of the grant, but the DA must also meet the performance criteria to share in the investment grant. For the UDG, the DA must meet both minimum and performance conditions, and also attain the national average score on the performance standards.
Regarding the DDF, disbursements in 2016 were based on the 2012 FOAT assessment. There was no assessment in 2013. The 2014 FOAT assessment will serve as the basis for the 2018 disbursement.
Table 3.13 shows that 34 percent of the distributions from the DACF and DDF funds in 2016 was through a transparent rules-based formula; the 2017 figures were not available at the time of the fieldwork. The Table shows that of the nearly GH₵ 1.3 billion budgetary allocations to the DACF, the ‘direct transfers’ to the MMDAs (according to the horizonal allocation formula noted in Table 3.12) was only GH₵ 352.3 million. There was no UDG distribution in 2016. In total, GH₵ 1,430.8 million accrued to the MMDAs in 2016, out of which the MMDAs received only GH₵ 486.4 million or 34 percent by transparent, rules-based formulae. Of this 34 percent, 24.6 percent was through DACF procedures, and 9.4 percent was through DDF procedures.
Although these disbursements to the MMDAs are definitely rules-based, the transparency of the DACF horizonal allocation fomula may be open to question. It is complex and requires the gathering of various types of data, the transparency and accuracy of which may also be open to question.
Table 3.13: Ghana Central Government PEFA 2016: Transfers to the MMDAs (in Ghanaian Cedis)
Type of Transfer (a) Budgetary Allocation
Actual Rule-based Allocation
% of Total Allocation
District Assemblies Common Fund (DACF) 1,296,684,351 352,286,432 24.6%
District Development Facility (DDF) 134,108,160 134,108,160 9.4%
Urban Development Grant (UDG) 0 0
Total Allocation 1,430,792,511 486,394,592 34.0%

65
Type of Transfer (a) Budgetary Allocation
Actual Rule-based Allocation
% of Total Allocation
Note 1: The budgetary allocation figure to the DACF is from Note 20 of the Audited 2016 Final Accounts of the CF. The release figure is from Appendix A of the 2016 Auditor General's Report on the DACF.
Note 2: The difference between the budgetary transfer stated in the CF and that of the 2016 DACF is the 24,483,185 cedis contribution to projects transferred directly by the MoF (see Note 1 of the Draft 2016 DACF financial statement).
Note 3: Review of information in the audit report cited above shows that the distribution of this figure followed the prescribed formula.
7.2. Timeliness of information on transfers
Budget guidelines published by the Ministry of Finance include projected allocations to the DACF and DDF. However, they do not include information about the horizontal distribution formulae used to enable the MMDAs to see how much funding they will receive (thus detracting from the transparency of the formulae).
The Budget guidelines issued by the MoF cover both central and local government entities. Thus, the MMDAs observe the same budget calendar and must use the same national budget guidelines issued by the Minister of Finance around June of each year. Likewise, they must approve their budgets by the end of the year just as the GoG does. The guidelines include indicative ceilings for all revenues accruing to the MMDAs from the center. The Minister of Finance issues firm budget ceilings to all entities (central and local) around October or November of each year.
It should be noted that neither the indicative nor the firm guidelines include the DACF horizontal allocation formula for sharing accrued revenues among the MMDAs. This is because the Parliament has to first appprove the formula each year, thus requiring the DACF management to propose and submit a formula to the Parliament. In practice, the DACF Administrator submits the proposed formula to the Cabinet through the MLGRD. The Cabinet reviews and submits the proposal to the Parliament for approval. Over the years, this process delays the final approval of the formula until well into the first quarter of the next fiscal year, that is, the budget year. For instance, the process of approving the 2018 DACF allocation formula was still ongoing at the time of completion of the fieldwork for this assessment in the third week of March 2018. However, all MMDA councils had approved their respective fiscal 2018 budgets by December 2017, as required by law — even though they did not have full information about the amount of transfers they would receive through DACF.
Technically, the Parliament does not approve the MMDA budgets. However, the Parliament appropriates all transfers from the center, including GoG and donor grants. These grants constitute 80-90 percent of individual MMDA funding, depending on the type. Local taxes collected by the assemblies constitute the balance of MMDA budgetary revenues. Respective assemblies set those taxes within guidelines provided by the central govermment.

66
One implication of this arrangement is that the MMDAs do not base their budget preparations on reliable information about expected revenues because they do not know the horizontal distribution formula. The MMDAs only estimate their probable receipts for the coming year based on their interpretation of the previous years’ allocation formulae. The priorities of the GoG for those previous years, as reflected in the respective formulae, may not reflect the priorities of the GoG for the coming year.
Another implication of the late approval of the DACF allocation formula is the inevitable delay in the MMDAs receiving their actual allocations. For example, the MMDAs are unlikely to receive any allocations within the first quarter of 2018, since the Parliament did not approve the new formula until near the end of the first quarter. This delay is perennial, and it slows budget commitments by the MMDAs, which rely on GoG budgetary allocations for the bulk of their budgetary resources. As a result, the public services that would be provided under the new budget might be delivered later in the year than planned, leading to adverse societal welfare effects.
PI-8. Performance information for service delivery
This indicator examines the service delivery performance information in the executive’s budget proposal or its supporting documentation in year-end reports. It determines whether performance audits or evaluations are carried out. It also assesses the extent to which information about resources received by service delivery units is collected and recorded.
Summary of scores and performance table
Indicator/Dimension Score/Criterion Explanation
PI-8 Performance information for service delivery
(Scoring method: M2-AV)
B+
8.1 Performance plans for service delivery
(Time period: next FY)
A.
Information is published annually on policy or program objectives, key performance indicators, outputs to be produced, and the outcomes planned for most ministries. The information is disaggregated by program or function.
Performance plans are contained in the program-based budgets that have been prepared by all MDAs beginning in 2014, and submitted to the Parliament for approval. These are published
8.2 Performance achieved for service delivery
(Time period: Last completed FY)
A.
Information is published annually on the quantity of outputs produced and the outcomes achieved for most ministries. The information is
Service delivery information is published annually in the Program-Based Budget estimates and in the Budget Performance Report.

67
Indicator/Dimension Score/Criterion Explanation
disaggregated by program or function.
8.3 Resources received by service delivery units
(Time period: Last 3 completed FYs)
C.
A survey carried out in one of the last three years provides estimates of the resources received by service delivery units for at least one large
ministry .
The GHS prepares an annual report on its operations. The 2016 Annual Report covers the third year of the implementation of activities under the Health Sector Medium-term Development Plan 2014-2017 and the 2016 Health Sector Program of Work. This report covers the general status of health, the prevalence of various diseases and the achievements of the activities planned to counter these (e.g. progress in implementing health infrastructure projects).
8.4 Performance evaluation for service delivery
(Time period: Last 3 completed FYs)
B
Evaluations of the efficiency and effectiveness of service delivery have been carried out and published for the majority of ministries at least once within the last three years.
Evaluations of service delivery have been conducted and published annually for the majority of MDAs. This has been done for all of the 3 years under review (2014-2016), as indicated in the annual PBB estimates, Budget Performance reports, Budget Statements and annual NDPC progress reports. However, independent evaluations are limited.
8.1 Performance plans for service delivery
The Government of Ghana introduced Program-Based Budgeting (PBB) in 2014. Since then, all MDAs have been preparing their budget estimates on a program basis as part of the budget preparation cycle. The PBB estimates include the following service delivery information: the policy objectives for the medium-term budget; policy outcome indicators and targets; and, at a program level, the main outputs, output indicators, and projected targets over the medium term. The PBB estimates for each major MDA are published on-line, as shown on the MoF website (the latest PBB is for 2018-2020). The estimates contain considerable narrative in support of the tables.
8.2 Performance achieved for service delivery
The PBB estimates of each year capture the key service delivery achievements for the previous year. Also, the targets achieved for each output by program and for each outcome indicator are recorded in the PBB estimates. As noted in PI-8.1, these reports are published on MoF website.
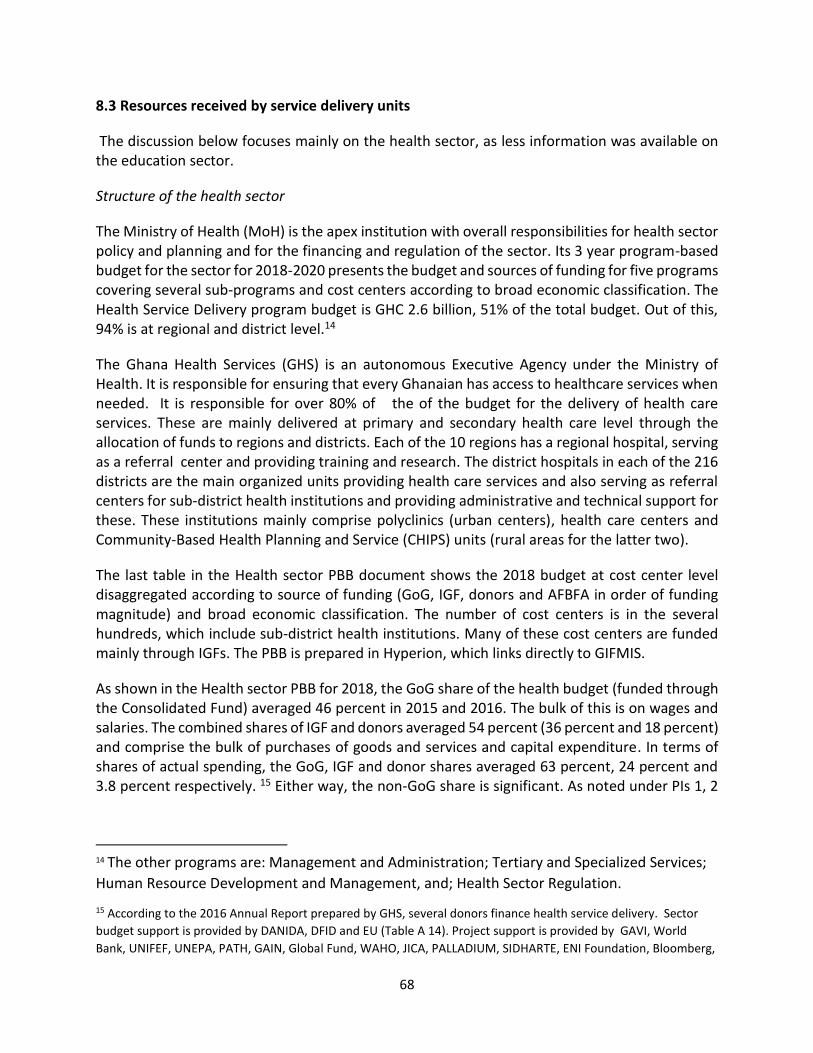
68
8.3 Resources received by service delivery units
The discussion below focuses mainly on the health sector, as less information was available on the education sector.
Structure of the health sector
The Ministry of Health (MoH) is the apex institution with overall responsibilities for health sector policy and planning and for the financing and regulation of the sector. Its 3 year program-based budget for the sector for 2018-2020 presents the budget and sources of funding for five programs covering several sub-programs and cost centers according to broad economic classification. The Health Service Delivery program budget is GHC 2.6 billion, 51% of the total budget. Out of this, 94% is at regional and district level.14
The Ghana Health Services (GHS) is an autonomous Executive Agency under the Ministry of Health. It is responsible for ensuring that every Ghanaian has access to healthcare services when needed. It is responsible for over 80% of the of the budget for the delivery of health care services. These are mainly delivered at primary and secondary health care level through the allocation of funds to regions and districts. Each of the 10 regions has a regional hospital, serving as a referral center and providing training and research. The district hospitals in each of the 216 districts are the main organized units providing health care services and also serving as referral centers for sub-district health institutions and providing administrative and technical support for these. These institutions mainly comprise polyclinics (urban centers), health care centers and Community-Based Health Planning and Service (CHIPS) units (rural areas for the latter two).
The last table in the Health sector PBB document shows the 2018 budget at cost center level disaggregated according to source of funding (GoG, IGF, donors and AFBFA in order of funding magnitude) and broad economic classification. The number of cost centers is in the several hundreds, which include sub-district health institutions. Many of these cost centers are funded mainly through IGFs. The PBB is prepared in Hyperion, which links directly to GIFMIS.
As shown in the Health sector PBB for 2018, the GoG share of the health budget (funded through the Consolidated Fund) averaged 46 percent in 2015 and 2016. The bulk of this is on wages and salaries. The combined shares of IGF and donors averaged 54 percent (36 percent and 18 percent) and comprise the bulk of purchases of goods and services and capital expenditure. In terms of shares of actual spending, the GoG, IGF and donor shares averaged 63 percent, 24 percent and 3.8 percent respectively. 15 Either way, the non-GoG share is significant. As noted under PIs 1, 2
14 The other programs are: Management and Administration; Tertiary and Specialized Services;
Human Resource Development and Management, and; Health Sector Regulation.
15 According to the 2016 Annual Report prepared by GHS, several donors finance health service delivery. Sector
budget support is provided by DANIDA, DFID and EU (Table A 14). Project support is provided by GAVI, World
Bank, UNIFEF, UNEPA, PATH, GAIN, Global Fund, WAHO, JICA, PALLADIUM, SIDHARTE, ENI Foundation, Bloomberg,
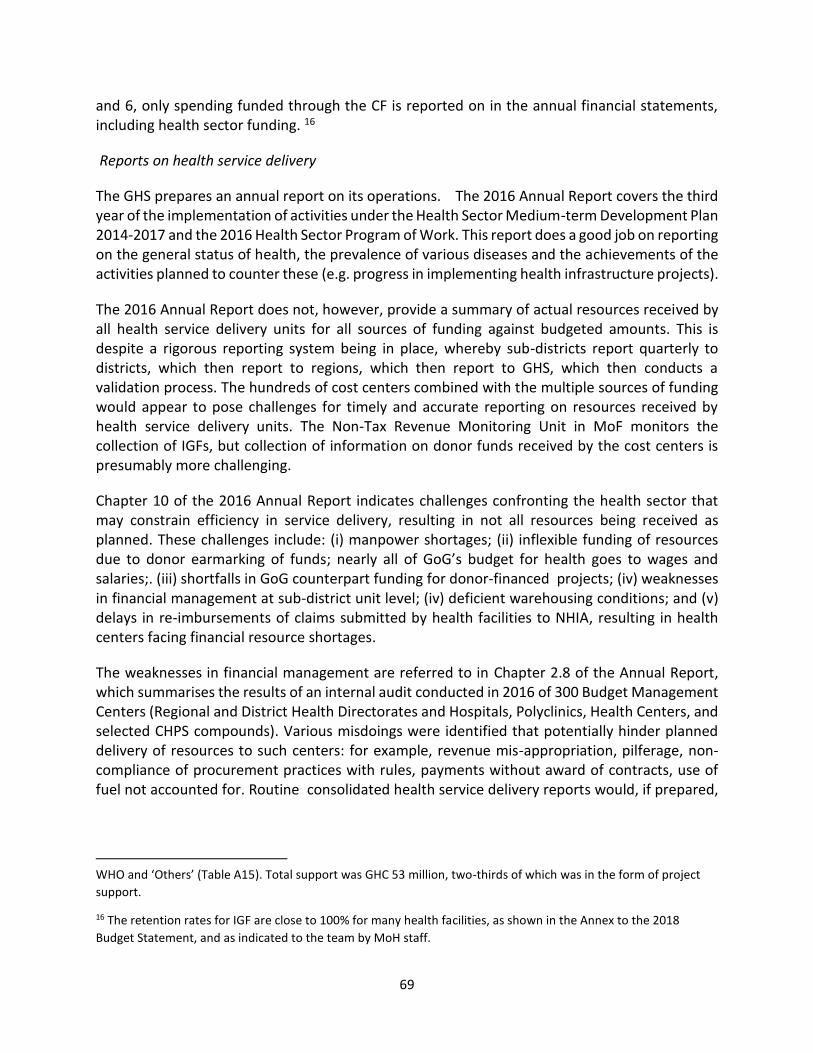
69
and 6, only spending funded through the CF is reported on in the annual financial statements, including health sector funding. 16
Reports on health service delivery
The GHS prepares an annual report on its operations. The 2016 Annual Report covers the third year of the implementation of activities under the Health Sector Medium-term Development Plan 2014-2017 and the 2016 Health Sector Program of Work. This report does a good job on reporting on the general status of health, the prevalence of various diseases and the achievements of the activities planned to counter these (e.g. progress in implementing health infrastructure projects).
The 2016 Annual Report does not, however, provide a summary of actual resources received by all health service delivery units for all sources of funding against budgeted amounts. This is despite a rigorous reporting system being in place, whereby sub-districts report quarterly to districts, which then report to regions, which then report to GHS, which then conducts a validation process. The hundreds of cost centers combined with the multiple sources of funding would appear to pose challenges for timely and accurate reporting on resources received by health service delivery units. The Non-Tax Revenue Monitoring Unit in MoF monitors the collection of IGFs, but collection of information on donor funds received by the cost centers is presumably more challenging.
Chapter 10 of the 2016 Annual Report indicates challenges confronting the health sector that may constrain efficiency in service delivery, resulting in not all resources being received as planned. These challenges include: (i) manpower shortages; (ii) inflexible funding of resources due to donor earmarking of funds; nearly all of GoG’s budget for health goes to wages and salaries;. (iii) shortfalls in GoG counterpart funding for donor-financed projects; (iv) weaknesses in financial management at sub-district unit level; (iv) deficient warehousing conditions; and (v) delays in re-imbursements of claims submitted by health facilities to NHIA, resulting in health centers facing financial resource shortages.
The weaknesses in financial management are referred to in Chapter 2.8 of the Annual Report, which summarises the results of an internal audit conducted in 2016 of 300 Budget Management Centers (Regional and District Health Directorates and Hospitals, Polyclinics, Health Centers, and selected CHPS compounds). Various misdoings were identified that potentially hinder planned delivery of resources to such centers: for example, revenue mis-appropriation, pilferage, non-compliance of procurement practices with rules, payments without award of contracts, use of fuel not accounted for. Routine consolidated health service delivery reports would, if prepared,
WHO and ‘Others’ (Table A15). Total support was GHC 53 million, two-thirds of which was in the form of project
support.
16 The retention rates for IGF are close to 100% for many health facilities, as shown in the Annex to the 2018
Budget Statement, and as indicated to the team by MoH staff.

70
make it easier to understand the reasons for differences between planned and actual delivery of resources to health sector entities.
Although the several hundred cost centers that comprise the health sector are coded in GIFMIS, in practice they are not yet all hooked up to GIFMIS, thus constraining the timely production and the possible accuracy of service delivery reports.
Some of the larger health units do in fact prepare annual reports. The team reviewed the last annual report (covering 2015) prepared by the Korle-Bu Teaching Hospital, which is the largest hospital in Ghana. The report shows all resources received, including information about the use of these resources. 17 The team also reviewed the annual report of the high profile National Malaria Control Program.. This also reported on its service delivery performance and targets achieved, including the resources that were used to achieve those targets.
Education SectorThe Ministry of Education (MoE) does not prepare an annual report, unlike the Ministry of Health. The team obtained information from the 2018 PBB for MoE and from its meeting with MoE officials. The structure of the PBB is similar to that of MoH. The Basic Education Program (02302) -the relevant one for this indicator- covers kindergarten, primary education and junior secondary education. The funding is entirely through the Consolidated Fund. 18
The MoE determines policy and monitors its implementation and effectiveness. The Ghana Education Services (GES) is responsible for organizing the delivery of basic services country-wide through its District Education Offices. Funding is through the CF and the GETFund. Provision of basic education is free, so there are no IGFs. Donors do not provide any funding directly to basic education. Text books and other teaching materials appear to be delivered in-kind. There is no reporting the planned and actual amounts delivered. The program budget for basic education indicates that schools receive capitation grants, which can be used to purchase goods and services. The detailed tables in the PBB document indicate, however, that Compensation of Employees is the only expenditure. Each and every basic school is shown in the detailed tables under its own code.
8.4. Performance evaluation for service delivery
The Ministry of Finance submits a Budget Performance Report to the Parliament which captures the service delivery achievements for all MDAs across all programs. This was done for 2014 and 2015.The Budget Statement for 2017 reported on the performance of 2016 for all MDAs by program. These evaluation reports on service delivery efforts are prepared by the MDAs and
17 The Korle Bu Teaching Hospital was established as a General Hospital in 1923. Starting with 200 beds, it now has over 2000 beds with several specialties and Centers of Excellence. It is currently the largest referral facility in the West African Sub-Region. It became a teaching hospital in 1962. A Board of Directors established in accordance with the Ghana Health Service and Teaching Hospitals Act (ACT 525) of 1996, governs the Hospital. 18 The other programs are: Management and Administration, Second Cycle Education (Senior High School and
TVET), Non Formal Education, Inclusive and Special Education, and Tertiary Education.

71
subsequently published on MoF website. Further to this the PBB estimates of each MDA report on the previous year’s performance in terms of efficiency and effectiveness. These are presented to Parliament for their evaluation during the budget debates.
The National Development Planning Commission (NDPC) prepared Annual Progress Reports for 2014 and 2015.19 These reports inform the implementing MDAs and MMDAs about the progress they have made in achieving the Ghana Shared Growth and Development Agenda (GSGDA) II targets, and in taking remedial actions where necessary. These reports have been distributed to all stakeholders and are published on the NDPC’s website.
A specific example of a performance evaluation is in regard to the Korle-Bu Teaching Hospital. Regarding Ministry of Health, the year 2016 marked the second year of the implementation of its Strategic Outcome Framework. The Organizational Performance Assessment Tool (OPAT) was used to conducat a second major assessment of its impact. Initial assessments were conducted regarding the extent to which planned milestones were being met.
The Ghana Audit Service (GAS) has carried out performance audits during the years under review (for example, for the 2016 Performance Audit Report of the Auditor General on Ensuring Safety and Quality of Medicines in Ghana, and the Performance Audit Report of the Auditor General on the Management of the Expanded Plantation Program of the National Forest Plantation Development Program, Ghana). The GAS website also contains performance audits for 2014 and 2015. These independent evaluations do not cover the majority of MDAs, and are also limited in terms of scope.
PI-9. Public access to fiscal information
Transparency in the government depends on the comprehensiveness of fiscal information available to the public. The quality of information and the means by which it is made available to the public is as important as the extent of information coverage.
Summary of scores and performance table
Indicator/Dimension Score/Criterion Explanation
PI-9 Public access to fiscal in-formation
(Time period: Last completed FY)
A.
The government makes available to the public eight elements, including all five basic elements, in accordance with the specified time frames.
All five basic elements plus three additional elements as required by the PEFA framework are met (basic elements 1 to 4 plus additional elements 7 to 9)
19 The NCDP falls under the auspices of the Office of the President and has the main responsibility for preparing
the main planning documents of GoG.
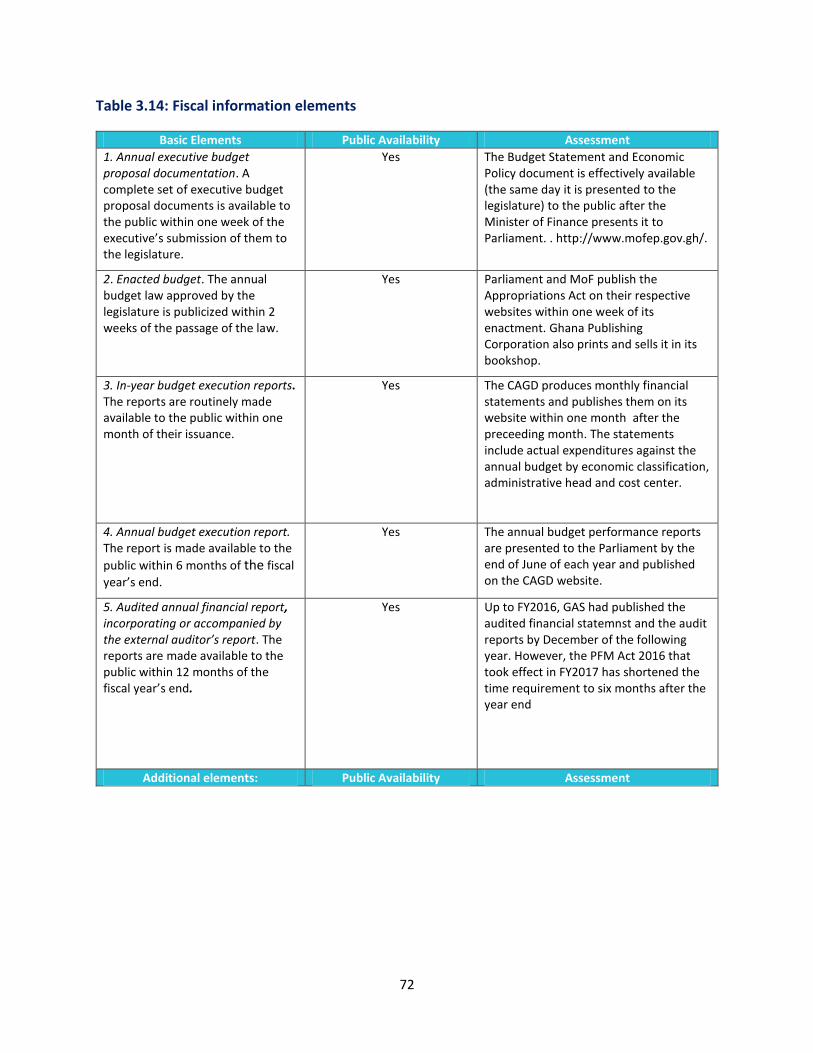
72
Table 3.14: Fiscal information elements
Basic Elements Public Availability Assessment
1. Annual executive budget proposal documentation. A complete set of executive budget proposal documents is available to the public within one week of the executive’s submission of them to the legislature.
Yes The Budget Statement and Economic Policy document is effectively available (the same day it is presented to the legislature) to the public after the Minister of Finance presents it to Parliament. . http://www.mofep.gov.gh/.
2. Enacted budget. The annual budget law approved by the legislature is publicized within 2 weeks of the passage of the law.
Yes Parliament and MoF publish the Appropriations Act on their respective websites within one week of its enactment. Ghana Publishing Corporation also prints and sells it in its bookshop.
3. In-year budget execution reports. The reports are routinely made available to the public within one month of their issuance.
Yes The CAGD produces monthly financial statements and publishes them on its website within one month after the preceeding month. The statements include actual expenditures against the annual budget by economic classification, administrative head and cost center.
4. Annual budget execution report. The report is made available to the
public within 6 months of the fiscal
year’s end.
Yes The annual budget performance reports are presented to the Parliament by the end of June of each year and published on the CAGD website.
5. Audited annual financial report, incorporating or accompanied by the external auditor’s report. The reports are made available to the public within 12 months of the fiscal year’s end.
Yes Up to FY2016, GAS had published the audited financial statemnst and the audit reports by December of the following year. However, the PFM Act 2016 that took effect in FY2017 has shortened the time requirement to six months after the year end
Additional elements: Public Availability Assessment

73
6. Pre-budget statement. The broad parameters for the executive budget proposal regarding expenditures, planned revenues, and debts are made available to the public at least 4 months before the start of the fiscal year.
No During 2017 the Minister of Finance submitted to the Cabinet for approval the Fiscal Strategy Document for 2018, the first such document ever prepared.
However, this document is not made available to the public, as it focuses on a range of options and scenarios for Cabinet deliberation. The Cabinet then makes a decision about the fiscal strategy, which is reflected in the Budget Statement presented to the Parliament near to the end of the fiscal year.
7. Other external audit reports. All non-confidential reports on central government-consolidated operations are made available to the public within 6 months of submission.
Yes The main annual audit report on consolidated government operations other than the audit report on the AFS (which covers only the CF) is the report on the Public Accounts of MDA. The report for FY 2016 was published on the GAS website on August 7, 2017. MDAs have up to 3 months after the end of the FY to prepare their accounts and submit to GAS. Thus, publishing of the audit report on these accounts is within 6 months of submission.
8. Summary of the budget proposal. A clear, simple summary of the executive budget proposal or the enacted budget is made accessible to the non-budget experts, often referred to as a ‘citizens’ budget.” Where appropriate, it is translated into the most commonly spoken local language. It is publicly available within 2 weeks of the executive budget proposal’s submission to the legislature, and within one month of the budget’s approval.
Yes The Citizens Budget is made public and distributed within two weeks following the presentation of the Budget Statement and Economic Policy to the Parliament ( November 15 2017 for 2018 budget statement). The date of the Appropriatons Act for 2018 was December 27, 2017, within one month of the Appropriation Act.
In order to promote ownership of the national budget, the preparation process
is very participatory. Using the print media, citizens and civil society
organizations are asked to attend a stakeholder consultation meeting to share their thoughts and ideas for
consideration about the Budget
Statement and Economic Policy of the Government.
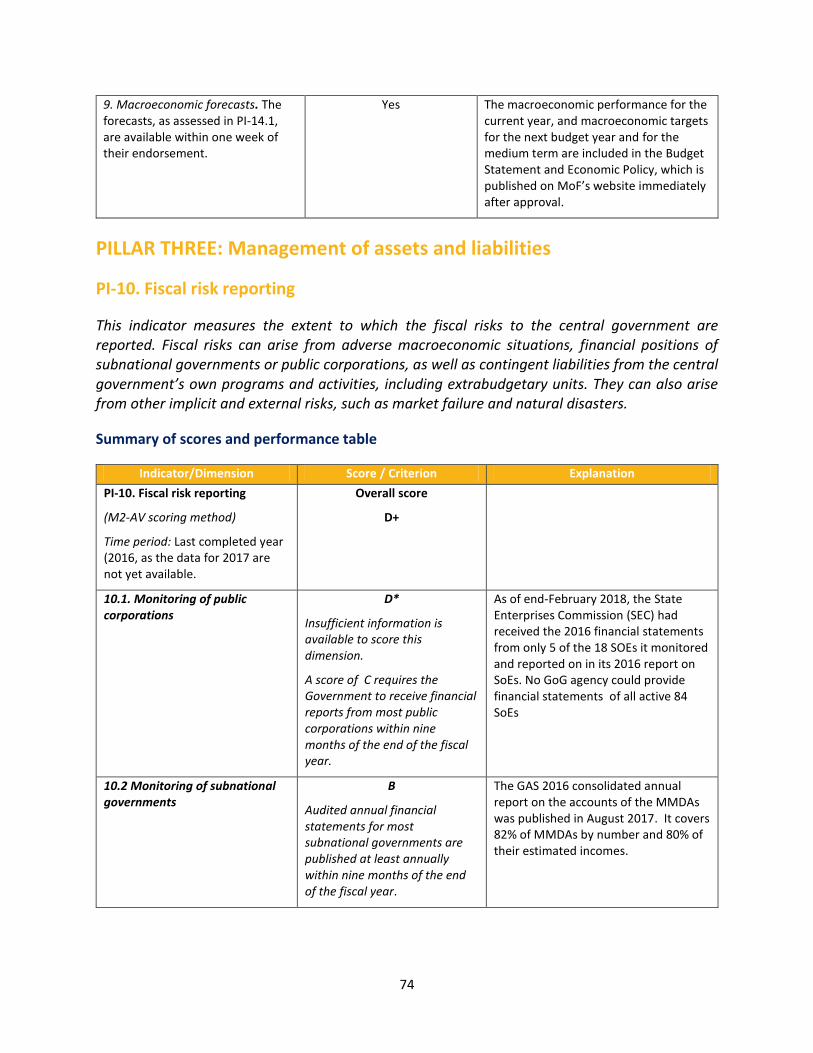
74
9. Macroeconomic forecasts. The forecasts, as assessed in PI-14.1, are available within one week of their endorsement.
Yes The macroeconomic performance for the current year, and macroeconomic targets for the next budget year and for the medium term are included in the Budget Statement and Economic Policy, which is published on MoF’s website immediately after approval.
PILLAR THREE: Management of assets and liabilities
PI-10. Fiscal risk reporting
This indicator measures the extent to which the fiscal risks to the central government are reported. Fiscal risks can arise from adverse macroeconomic situations, financial positions of subnational governments or public corporations, as well as contingent liabilities from the central government’s own programs and activities, including extrabudgetary units. They can also arise from other implicit and external risks, such as market failure and natural disasters.
Summary of scores and performance table
Indicator/Dimension Score / Criterion Explanation
PI-10. Fiscal risk reporting
(M2-AV scoring method)
Time period: Last completed year (2016, as the data for 2017 are not yet available.
Overall score
D+
10.1. Monitoring of public corporations
D*
Insufficient information is available to score this dimension.
A score of C requires the Government to receive financial reports from most public corporations within nine months of the end of the fiscal year.
As of end-February 2018, the State Enterprises Commission (SEC) had received the 2016 financial statements from only 5 of the 18 SOEs it monitored and reported on in its 2016 report on SoEs. No GoG agency could provide financial statements of all active 84 SoEs
10.2 Monitoring of subnational governments
B
Audited annual financial statements for most subnational governments are published at least annually within nine months of the end of the fiscal year.
The GAS 2016 consolidated annual report on the accounts of the MMDAs was published in August 2017. It covers 82% of MMDAs by number and 80% of their estimated incomes.

75
10.3 Contingent liabilities and other fiscal risks
D
Performance is less than required for a C score
A score of C requires that ‘Central government entities and agencies quantify some significant contingent liabilities in their financial reports’
GoG documents contain very little information on the types of contingent liabilities.
10.1. Monitoring of public corporations
The government does not have a clear overview of its ownership or equity holdings in public corporations. There are currently believed to be about 128 SOEs, of which 84 are considered active. This is down from a high of around 300 in the mid-1980s following privatizations and closures. The MoF published SOE Annual Aggregate Report for 2016, but this covered only 18 selected SOEs. This was the first ever such report. The MOF indicated that it is in the process of compiling a similar report for 2017 that will cover 50 or so SOEs. Extrapolating from various analyses including the 2016 report, the MOF believes that SOEs carry significant fiscal risks. These risks include contributing to a stock of government arrears and liabilities that are not separately accounted for in the budget. Such risks impact on macroeconomic performance in general, and fiscal performance in particular.
The responsibility for monitoring public corporations is distributed, fragmented and incomplete. The MOF owns the shares of all state-owned investments, including both minority- and majority-owned SOEs, financial SOEs, and wholly-owned nonfinancial companies. Primary responsibility in the MOF for the oversight of SOEs rests with its Public Investment Division. Under PFMA (2016) (and under the preceding FAA, 2003), SOEs are required to obtain MoF approval to borrow. The MoF is the only body that can guarantee loans incurred by SOEs. The MOF’s Debt Management Division (DMD) monitors SOE borrowings and guarantees. The PFMA also requires SOEs to submit quarterly and annual reports on their debt stock and borrowings to the DMD (although at the time of the PEFA field visit, the PFMA was not fully operative, as its Financial Regulations were still being prepared).. The MOF’s Legal Division monitors all SOE legal matters.
Regarding most SOEs, the MOF has delegated ownership responsibility to relevant sector line ministries — although these ministries tend to regard this responsibility as pertaining only to matters, such as nominating board members and formulating policy, rather than public financial management.
Formed in 1987, there is a separate State Enterprises Commission (SEC) with the current remit to provide strategic management and improve the performance of 39 wholly-owned SOEs.20 As
20 See Annex 1 of the 2016 SEC report. This shows: (i) 25 limited liabilities companies with 100% GoG shareholding,
e.g. Ghana Electricity Company, TEMA Oil Refinery, Ghana Airports Company; (ii) 9 Statutory Corporations, with
100% GoG shareholding;e.g. Volta River Authority, Ghana National Petroleum Corporation, Ghana Cocoa Board;
(iii) 25 Joint Venture Companies with proportions of GoG ownership varying from 2 percent (First Savings and

76
of end-February 2018, the SEC reported in its report on SoEs in 2016, only limited success in encouraging these SOEs to publish audited Annual Financial Statements (AFS). Of the 39 SOEs, 27, 9 and 5 published AFS for 2014-2016, respectively. The SEC report indicates that all the 5 SOEs that published their AFS in 2016 were in arrears in preparing them, as was also the case in preparing them in 2015. In the absence of information on the timeliness of the submission of AFS of all SoEs, it is not possible to know, in terms of the value of their net assets, the ratio of the 5 SoEs reported to be in arrears in submitting their AFS to all SoEs.
The Bank of Ghana is the shareholder of most state-owned banks. It appears that there is no one GOG department that currently collects financial statements from all the active 84 SOEs.
The SEC report for 2016, which focuses mainly on 18 SoEs only, indicates that the net assets of these totaled GHC 29, 565 million. Many of these are big companies, but, in the absence of information on the net assets in 2016 of all SOEs, it is not possible to know the proportion of the assets held by these to the net assets of all the SoEs.
As noted under PI-13, the Annual Debt Management Report for 2016 prepared by the Debt Management Department of MoF (the first one ever produced) includes information on GoG guarantees of loans incurred by SoEs to mainly finance (including through on-lending, promissory notes, letters of credit). As with the SEC Report, there is little analysis of the financial health of such SoEs.
In compiling the Annual Debt Management Report, the MOF, through the DMD, does not, as noted under PI-13, request routine submissions from the MDAs of relevant information about their contingent liabilities to corroborate and reconcile to the information held centrally by the MOF. In this context, there is a risk that the report might be incomplete and/or out of date. This is because the MDAs may have undertaken certain fiscal risks that the MOF was not aware of — or, in some cases, even the MDAs might not be aware that some of their activities are creating fiscal risks. As noted in previous PEFA assessments, government-guaranteed loans to SOEs may create an incentive for risky behavior relative to making financial commitments without a guarantee. For instance, a given SOE may obtain short-term financing from a private financial institution, with the guarantee serving as collateral. The SOE may then ‘call’ the guarantee if it is unable to repay the loan.
There is a considerable ongoing reform effort to improve the governance of SOEs, primarily through the World Bank-financed Ghana Economic Management Strengthening Project (GEMSP), that came into effect in 2016. Its aim is to consolidate the state’s ownership role, and to establish a so-called Single Entity to assume responsibility for governance and financial oversight of all SOEs. In addition, it supports pilot corporate governance improvements in five selected SOEs. At
Loans Limited) to 80 percent (SIC Life Company); (iv) 15 companies with Government carried interest, mainly 10
percent (e.g. Abosso Goldfields Ghana Ltd; Ashanti AngloGold (Ghana) Ltd; Golden Star (Wassa) Ltd.) and (v) 10
Subvented Agencies, 100 percent GoG ownership (e.g. Ghana Highways Authority, Ghana News Agency, Ghana
Irrigation Authority). Total of 84.

77
the time of the PEFA team’s field visit, procedures for the establishment of the Single Entity were in the process of being established.
SOEs owe considerable amounts in taxes, as discussed under PI-19.4 on Revenue Arrears Monitoring. The main reasons are the financial inter-relationships between the SOEs and the significant size of the arrears. Tthe weak financial performance of one SOE has had adverse impacts on other SOEs, leading to liquidity problems and resultant delays in paying bills, including tax liabilities.
10.2. Monitoring of subnational governments
Subnational governments are comprised of 216 MMDAs, including 6 Metropolitan, 46 Municipal and 164 District Assemblies. They are distinguished from each other by their minimum population sizes. However, they have common financial management obligations as set out in the Local Governance Act of 2016 (LGA) and the PFMA. The MMDAs’ finances are overseen variously by the following: each of the ten Regional Co-ordinating Councils (RCCs) established by the LGA specifically for the purpose of overseeing MMDAs; the Ministry of Local Government and Rural Development (MLGRD); and the MOF. The MMDAs prepare and submit monthly financial reports to their RCCs, the MLGRD and the MOF. In addition, the LGA obliges the MMDAs to prepare and publish annual financial statements, and to submit them for auditing by the Ghana Audit Service.
The Ghana Audit Service is the only body that produces a consolidated annual audit report on the financial position of all MMDAs, including revenues, expenditures, assets and liabilities. By contrast, the MLGRD collects MMDA annual financial reports. It records each MMDA’s annual revenues and expenditures on an Excel spreadsheet. This permits aggregation of revenues and expenditures across all MMDAs. However, it does not include information on MMDA assets and liabilities. Similarly, the Public Accounts Directorate of the CAGD collects the MMDA’s monthly financial reports. It then records each MMDA’s revenues and expenditures on a month-by-month basis using separate Excel spreadsheets (one for each MMDA). These are neither aggregated across all MMDAs, nor do they include information on MMDA assets and liabilities. Thus, the revenue and expenditure information produced by the MLGRD and the CAGD does not appear to reconcile with each other, either in aggregate, or at the level of the individual MMDA. Inconsistencies in the information available to the MLGRD and the MoF may also hinder their ability to act on possible fiscal risks posed by the MMDAs.
The Ghana Audit Service report includes considerable details regarding the compliance of MMDAs with annual financial statement filing obligations, including information about net income, net financial position, and irregularities. The GAS report on MMDAs for the fiscal year ending on December 31, 2016 ( dated August 14, 2017) noted that 39 out of 216 MMDAs representing 18.1 percent of MMDAs had not submitted their 2016 financial statements by the statutory deadline of February 28, 2017. MMDAs submitting after this date are defined as ‘defaulters’ and the auditing of the AFS of MMDAs only apply to those that submitted their AFS before the deadline. In terms of the proportion of the number of MMDAs that submitted their AFS on time, 82 percent did so. Assessing the proportion of those MMDAs that submitted their

78
AFS, in terms of value (i.e. income, expenditures, assets) is more difficult as the totals shown in the report (in the Appendix) exclude the incomes, expenditures and assets of the 18 percent of the MMDAs that did not submit their 2016 AFS on time. Most of these 39 MMDAs did, however, submit on time for FY 2015, their incomes (Appendix Table C) amounting to GHC 164 billion, comprising about 13 percent of total MMDA income in 2015 (excluding the three that didn’t, representing less that 1 percent of total MMDAs). _Total incomes of MMDAs grew by 25 percent in FY 2015 over FY 2014, representing inflation amongst other things. Applying this percentage growth to FY 2015 gives an approximate estimate of total MMDA income in 2016 of about GHC 1600 million. Actual income in FY 2016 was GHC 1276 million, representing about 80 percent of GHC 1600 million, the difference representing the total incomes of those MMDAs that did not complete their AFS.
The GAS 2016 report also contains a table of the assets and liabilities of each MDA (Appendix Table F) and a table of Operational Results (Appendix Table E, Incomes and Expenditures). The Tables show that a significant proportion of MMDAs ran a deficit in 2016, and a few MMDAs had total liabilities that exceeded total assets at fiscal year-end.
10.3. Contingent liabilities and other fiscal risks
As indicated in the 2016 PEFA Framework document, fiscal risk posed to GoG by its explicit guarantees of loans to SoEs is discussed under PI-10.1 and elaborated on under PI-13. It is raised as an issue in the 2018 Budget Statement and Economic Policy and the 2016 Annual Debt Management Report (ADMR), the first one ever produced. The fiscal risk posed to GoG by MMDAs is covered under PI-10.2. It is not raised as an issue in the 2018 Budget Statement. The audited accounts of MMDAs 2016 include tables showing operating balances (surpluses/deficits) and assets and liabilities, but there is no fiscal risk analysis.
The fiscal risks under this dimension include those posed by Public Private Partnership (PPP)
agreements, state guarantees for various types of loans (e.g. mortgage loans, student loans,
agriculture loans, and small business loans), state insurance schemes (e.g. bank deposit
insurance, private pension fund insurance, and crop insurance). They also include the fiscal
risks posed by public pension funds going into deficit and costs of ongoing litigation and court
cases. The 2018 Budget Statement and Economic Policy says little about such risks.21
As indicated in the ADMR, GoG is in the process of entering into 19 PPP agreements, but none
are operational yet. The fiscal risk posed to Government by these can be significant, as has
been the experience in many countries. The GoG appears to have not yet developed a
mechanism for managing such risk.
21 In contrast, the annual Budget Policy Statement of the Government of Kenya contains a whole chapter on fiscal
risk.

79
PI-11. Public investment management
PI-11 assesses the process of economic appraisal, selection, costing, and monitoring of major public investment projects. Public investment projects are critical drivers of socioeconomic growth. Rigorous analysis and prioritization will help to ensure that the government sustainably implements them as planned. This is a new indicator.
Summary of scores and performance table
Indicator/Dimension Score Explanation
PI-11. Public investment management D The government is still working to establish or functionalize the respective project and investments management systems.
11.1 Economic analysis of investment projects
D Performance is less than required for
a C score.
The government does not have projects that meet the Framework’s definition of major investment projects and it has not yet developed its own definition
11.2 Investment project selection D
Performance is less than required for a C score.
The Public Investment Division (PID) of MoF
does not yet have the necessary project
selection guidelines. It explained that it is in the
process of developing them
11.3 Investment project costing D
Performance is less than required for a C score.
The PID is also working to develop project
appraisal and costing guidelines. The GoG
appears to have projects that meet the
Framework, but it is yet to develop its own
definition of major investment projects project
11.4 Investment project monitoring D
Performance is less than required for a C score.
The PID has not developed the necessary
monitoring framework for major investment
projects. This exercise is in process.
Background
This is a new indicator.
The Public Investment Division (PID) was established in the MoF in 2010 to centralize the selection of major investment projects and ensure that they are in the best interests of the country. It has only been partially operational since then. The World Bank conducted a Public Investment Management (PIM) assessment at about the same time, using a standardized methodology that it had prepared. The PIM assessment identified shortfalls at all stages of the PIM process, from pre-investment to monitoring and evaluation. The shortfalls were leading to the selection through the budget/MTEF process of inadequately justified and poorly prepared projects. This, in turn, led to cost and time overruns and stalled and abandoned projects. A PIM assessment conducted by the IMF in February 2016 confirmed these observations. The Government then prepared a PIM Strategy that was approved by the Cabinet in June 2015. The PID then prepared and published the National Policy on Public Investment Management (“PIM Policy”).

80
Difficulties in identifying Major Investment Projects
The government has yet to develop its own definition of what constitutes major investment projects. The PEFA Field Guide (on PEFA website) defines (page 80) major investment projects as those whose “total investment cost amounts to 1 percent or more of total annual budget expenditure[s]” …these are “among the largest 10 projects (by total investment cost) for each of the 5 largest central government units, measured by the units’ investment project expenditure”. The definition also allows for the use of the government’s definition that “would at least meet these criteria and that would simplify collection of information”. The PID in the MoF is currently working on this issue.
The manner of presentation of the approved budget makes it difficult to identify ‘major investment projects’. Published estimates detail MDA allocations by programs and sub-programs, but not by individual projects, as shown in Table 3.15 below. For instance, the Ministry of Aviation has an allocation for infrastructure assets of 153.3 million cedis, but it does not provide a breakdown of the allocation to projects. It is therefore not possible to identify individual projects from the budget estimates.
Table 3.15: Illustration of the presentation of the 2018 Budget Estimates of the MDAs
Sub-program Source of Funding Estimate (cedis)
Ministry of Food and Agriculture
Agricultural Facilities and Infrastructure International Fund for Agricultural Development
79,319,362
Plants Fertilizer and Seed Management Central GoG and CF 139,895,250
Ministry of Roads and Highways (MoRH)
Bridge Construction works Central GoG and CF 75,000
Ministry of Aviation
Infrastructure Assets Germany’s Reconstruction Credit Institute (Kreditanstalt Fur Wiederaufbau - KfW)
153,312,000
Source: Extracted from the respective MDA budgets, available on the Ministry of Finance website: www.mofep.gov.gh
11.1. Economic analysis of investment projects
In line with the PIM policy and under the direction of PID, plans are forthcoming for the adoption of a centralized project appraisal process for major projects. This would replace the decentralized investment appraisal process, which informs the selection of investment projects for inclusion in the annual budget/MTEF preparation process (see PI-17). Currently, the MDAs use their own economic appraisal, prioritization, and selection approaches to prepare their project pipelines for funding consideration. These are broadly based on the Financial Administration Regulations that are issued every year at the start of the budget preparation process. Some MDAs may be more rigorous in doing this than others. For example, road construction/rehabilitation projects tend to use standard, international appraisal procedures (although these projects tend to be donor-financed).

81
The PIM policy makes ex-ante project appraisal a prerequisite, using standardized methods. The objective is “to assess and determine the economic viability of a project, establish value for money, and improve on the quality of public investments/projects”. Standardized methods include cost-benefit analysis (CBA); the economic net present value (ENPV); internal rate of return (IRR); payback period; loan-life cover ratio; debt service cover ratio; sustainable cashflow models; and earnings before and after taxes. Social projects would primarily utilize the cost effectiveness analysis (CEA) technique.
These project appraisal methods are already used to some extent, based on the Budget Guidelines. The Ghana Irrigation Authority explained that some of its projects undergo formal appraisals. The example cited is the 67 million cedis Tamne Irrigation Project in support of farming. The project is part of a package of projects funded by the Ghana Export-Import (EXIM) Bank as part of the export promotion initiative of the Ministry of Trade and Industry . The GIA explained to the team that the selection of the project was competitive, and that it was chosen from among a basket of potential projects. The project underwent formal prefeasibility analysis and ranking that qualified it along with some others for funding. According to the GIA, both the MoF and the MoFA reviewed the feasibility studies. The project document outlined the appraisal process and included the detailed project design and project costing. The Export Development and Agricultural Investment Fund (EDAIF), the predecessor of the Ghana EXIM Bank appointed the consultants for the studies.
Ongoing reforms
Project formulation stage under the PIM policy: The MDAs, MMDAs and SOEs would be required to prepare a project concept paper/note (PCP) that includes a needs assessment, cost and time estimates, and preparatory works. The agencies would then submit the PCP online to the PID through the newly-planned Project Investment Management System (PIMS). The PIMS will be a web-based database set up to facilitate effective and efficient delivery of PIM. The PID would then evaluate the PCP for eligibility to access the Project Development Fund (PDF), that is planned for under the policy.
Project preparation stage: The PIM Policy makes project preparation mandatory for all projects requiring budgetary funding. Project preparation includes pre- and full feasibility studies and formal appraisals. The PID plans to develop a Project Preparation and Appraisal Manual/Guidelines and templates to guide MDAs through the process. This manual is still under preparation.
Strengthening PIM is one of the three components of the World Bank-financed Ghana Economic Management Strengthening Project (GEMSP), that came into effect in August 2016. The other two components include state-owned enterprise reform to reduce fiscal risk (as discussed in PI-10), and revenue management strengthening (as discussed under PIs 19-20 below). The Project Appraisal Document (PAD) for the GEMSP took as its main reference the World Bank PIM assessment conducted in 2012 (noted under ‘Background’ above).
The PIM sub-components of the GEMSP are:

82
Improvement of the regulatory and institutional setting for PIM and the creation of the required PIM instruments; and
Development and implementation of a capacity building strategy for PIM.
The PID informed the PEFA team that little has happened over the last few years in strengthening PIM under the GEMSP, and that various activities are in the process of being planned, as noted above.
The eventual outcome of these PIM reforms would be a costed public investment program (PIP) linked to the Medium-Term Expenditure Framework (MTEF). The PIP would ensure the proper programing of MDA projects and discontinue the current practice of projects being selected by MDAs independently of each other — even though large projects tend to have significant intersectoral linkages.
11.2. Investment project selection
The narrative in dimension (i) above applies. The PID of the Ministry of Finance is yet to develop the necessary appraisal and selection guidelines. Currently, MDAs do not receive any guidelines on this.
11.3. Investment project costing
The narrative in dimension (i) above applies. The government is yet to define ‘major investment projects’ and the criteria for project costing. This is part of the project appraisal processes that the PID is working on.
11.4. Investment project monitoring
The narrative in dimension (i) above applies. There is currently no monitoring framework that requires regular reporting on the total cost and physical progress of ‘major investment projects’, and the level of compliance with standard procedures and rules for project implementation developed for the purpose. As explained above, the PID has not yet developed such a framework.
PI-12. Public asset management
This is a new indicator.
PI-12 assesses the management and monitoring of government assets and the transparency of asset disposal. The effective management of assets promotes aggregate fiscal discipline by ensuring efficient and effective control in the use of government resources in implementing policy objectives. Insufficient knowledge of the existence and use of assets can conceal potential misuse of resources or result in the under-utilization of assets, which can affect policy implementation and service delivery.

83
Summary of scores and performance table
Indicator/Dimension Score/Scoring Criterion Explanation
PI-12. Public asset management (Scoring method: M2-AV).
Time period: year of last completed annual financial statements (2016)
D+
The government maintains a basic record of equities and securities holdings, but not it does not keep a central register of fixed assets; some departments have fixed assets’ registers, but they do not include information on age and usage. Individual agencies observe rules on assets’ disposal, but budgets and financial reports do not include information on transfers and disposals
12.1 Financial asset monitoring
C
The government maintains a record of its holdings in major categories of financial assets.
The Non-tax Revenue Unit of the Ministry of Finance maintains a record of one component of financial assets -government holdings of stocks and equities. The Annual Financial Statements prepared by the CAGD include a table showing the end-year stock of all the financial assets of the GoG, disaggregated by type of asset.
12.2 Nonfinancial asset monitoring
D
Performance is less than required for a C score.
A score of C requires that the government maintain a register
of its holdings of fixed assets, and collect partial information
about their usage and age.
The Annual Financial Statements prepared by the CAGD contain a list of fixed assets held by MDAs. The list shows beginning and end-year values, reflecting disposal, acquisition, and depreciation. The MDAs do not collect information about the usage and age of their assets.
12.3 Transparency of asset disposal
D
Performance is less than required for a C score
The C score requires that the procedures and rules for the
transfer or disposal of nonfinancial assets be
established. Partial information on transfers and disposals is
included in budget documents, financial reports, or other
reports.
Rules for asset disposal exist, and individual MDAs observe them when disposing of their assets. However, budget documents, financial reports, or other information do not include information about such transfers and disposals.

84
12.1. Financial asset monitoring
The Non-tax Unit of the Ministry of Finance maintains a record of government holdings in stocks and equities. The Balance Sheet of the Annual Financial Statements (AFS) prepared by the CAGD includes a summary of the financial assets held by the GoG. The latest report covers 2016 (and includes 2015). Notes 25-29 show the end-year and beginning year (end of previous year) stocks of financial assets in disaggregated form by type: cash and cash equivalents, collateral securities, current receivables (mainly advances), pre-payments, non-current receivables (loans), and equity investments (for example, in state-owned enterprises). Notes 23 and 24 show, in aggregated form (loans, equity investments, advances), the financial assets acquired and disposed of during the year. Additional statements provided in the AFS contain highly disaggregated information about the financial assets. However, information about the annual performance of these assets is not shown in the AFS (apart from subtracting beginning-year values from end-year values). Annual performance reports about the portfolio of assets held (particularly relevant for SOEs) are not prepared (a B score requires this).
Information on Nonfinancial Assests included in the Financial Statements
Source: 2016 Finaal Accounts of Ghana, page 30; see www.cagd.gov.gh

85
12.2. Nonfinancial asset monitoring
The final accounts for the Consolidated Fund contain a list of nonfinancial assets, but there is no comprehensive asset register to assist in the systematic monitoring of the acquisition, use, age, depreciation, movement, and disposal of such assets. The Balance Sheet for the 2016 AFS shows in aggregated form (including for the 2015 Balance Sheet in an adjacent column), the value of the stock of fixed assets (denoted as property, plant and equipment). Note 1.9 of the Accounts indicates that, in compliance with International Public Sector Accounting Standards (IPSAS), starting in 2012, fixed assets are capitalized upon acquisition and then depreciated at a specified annual rate, with the rate varying between asset classes. The Additional Statement 7 in the accounts shows fixed assets by asset class on a very disaggregated basis, including beginning year value, additions, disposals, allowance for depreciation and end-year net book value. Table 3.10 below provides a summary. The information comes from the fixed asset registers maintained by the MDAs, which affix coded information to each asset (as observed by the assessment team). These registers are not necessarily comprehensive and do not include information about age and usage.
The lack of a fully comprehensive asset register that includes information about age and usage is a common legacy of many cash-based accounting systems, a legacy that the GoG shares. Many governments do not accrue assets , but expense them in the year of purchase. Therefore, they do not find the need to keep detailed records to track their use and disposal because the assets have no residual value in the books. The GoG is migrating to accrual basis accounting, under which it will be required to track assets and their values from acquisition to disposal, ensuring that the disposal is done at fair value. The launch of the GIFMIS and the deployment of its fixed asset module is helping in this reform effort.
The GIFMIS has a fixed assets (FA) module that can assist in monitoring nonfinancial assets, but the GoG has only partially activated it. The activated functionalities are for procurement and the asset list. Policies to deploy the other FA functionalities are not yet in place. Therefore, the GoG is not yet fully exploiting the GIFMIS in its monitoring of fixed assets.
Table 3.16: Non-Financial Assets of the GoG
Categories Subcategories Where captured
Dwellings Buildings, destitute homes, bungalows/flats, homes for the aged, palace, and barracks
Annual Financial Statements
Non-Residential Buildings
Hospitals, clinics, day care centers, office buildings, school buildings, slaughter houses, and health centers
Annual Financial Statements
Other Structures
Roads, cemeteries, toilets, markets, car/lorry parks, bridges, road signals, feeder roads, urban roads, highways, drainages, and workshops
Annual Financial Statements
Transport Equipment
Motor vehicles, airplanes, trains, ships and vessels, motor bikes, and bicycles
Annual Financial Statements

86
Categories Subcategories Where captured
Other Machinery and Equipment
Plants and equipment, agricultural machines, servers (computing), networking and ICT equipment, other capital expenditures, machinery, other assets, computers and accessories, uninterruptible power supply systems, printers, office equipment, air conditioners, electrical equipment, and communications equipment
Annual Financial Statements
Infrastructure Assets
Electrical networks, sewers, landscaping and gardening, runways, interior development, furniture and fittings, irrigation systems, water systems, harbor and landing sites, and sea walls
Annual Financial Statements
Computer Software
Annual Financial Statements
The government does not keep a register of sub-soil assets. The Ghana National Petroleum Corporation (GNPC) and the Petroleum Commission record and update oil reserves periodically. However, this information this does not feed into any formal sub-soil asset monitoring process. Ghana also has rich bauxite and other mineral deposits, but it is not clear that the government maintains a register of these resources. There is also no information on record of underground installations, including oil and water pipelines, communication cables, and so on.
12.3. Transparency of asset disposal
Rules for asset disposal exist, and individual MDAs observe them when disposing of their assets. However, budget documents, financial reports, or other information do not include information about such transfers and disposals. Part 8, Sections 83-85 of the Public Procurement Act (663), 2003 on the Disposal of Stores, Vehicles, Plant and Equipment, governs assest disposal. Under Section 83, the Head of a procurement entity convenes a Board of Survey comprising representatives of relevant departments. The Board organises the preparation of a report on what items it considers should be disposed of, and recommends the best method of disposal. provides the authority to dispose. It makes recommendations to the head of the procurement entity, who, if he/she approves, authorizes the recommended disposal to go ahead. Items may be disposed of through transfers to other MDAs, sale by public tender or auction, or by destruction. The Minister, in conjunction with the Head of the procurement entity, may make regulations, providing in more detail on the required disposal procedures.
As noted under PI-24, Parliament passed Act 914 in 2016 to amend certain sections of Act 663. The regulations for this are still being prepared.
The Auditor General’s annual report (latest 2016) on the annual financial statements on the Consolidated Fund says nothing on asset disposal proceeds. The Auditor General’s 2016 audit report on the Public Accounts of MDAs also says nothing about any irregulaties in disposal procedures which could pose a risk of waste of public funds.

87
PI-13. Debt management
This indicator assesses the management of domestic and foreign debts and guarantees. It seeks to identify whether satisfactory management practices, records, and controls are in place to ensure efficient and effective arrangements.
Summary of scores and performance table
Indicator/Dimension Score/Scoring Criterion Explanation
PI-13. Debt management
(M2-AV scoring method)
C
13.1. Recording and reporting of debt and guarantees
(Time period: at time of assessment)
C
Domestic and foreign debts and guaranteed debt records are updated annually. Reconciliations are performed annually. Areas where reconciliation requires additional information to be completed are acknowledged as part of the documentation of records.
Debt records are maintained and up-dated regularly. There are some reconciliation issues: (i) between the DMD in the MoF and the DPI in the CAGD; and (ii) between the DPI and the Bank of Ghana with regard to external debts.
The records of the GoG-guaranteed debts are harder to keep up-to-date. It ia also difficult to know how accurate they are, as they are based on SOE records.
13.2. Approval of debt and guarantees
(Time period: Last completed FY)
D
Performance is less than required for a C score
A score of C would require, inter alia, procedures to be fully followed for approving and issuing loan guarantees, and for the Ministry of Finance to fully monitor the servicing of the underlying debt.
The 1970 Loans Act sets out the legal basis for the GoG’s management of debt. Only the Minister for Finance may borrow money and issue loan guarantees. Cabinet approval is required. Legislative approval of the terms and conditions of any loan and/or loan guarantee is required.
The financial state of a number of SoEs, as noted under PI-10, indicate that the procedures for the approval of loan guarantees and the monitoring of the servicing of the underlying debt may not be fully effective.
The PFMA (2016) considerably strengthens the procedures for debt management, including those for approving and monitoring new loan guarantees. These strengthened procedures are not yet in effect, pending approval of the supporting Financial Regulations.

88
Indicator/Dimension Score/Scoring Criterion Explanation
13.3. Debt management strategy
(Time period: At time of assessment with reference to the last 3 completed FYs)
B
A current medium-term debt management strategy, covering existing and projected government debt with a horizon of at least three years, is publicly reported. The strategy includes target ranges for indicators such as interest rates, refinancing, and foreign currency risks.
The current Medium-Term Debt Management Strategy (MTDMS) has a horizon of 3 years, covering 2017-19, as prepared by MoF. It includes risk benchmarks. It is published on MoF’s website, as required under Section 59 of the PFMA (2016)..
The Budget Statement for 2018 includes an assessment of the effectiveness of the 2016-18 MTDMS.
The current MTDMS is more rigorous and detailed than previous strategies, as specified under Section 59 of the PFMA (2016)..
13.1. Recording and reporting of debts and guarantees
Debt reporting
Government debt statistics are contained in a number of documents, including: the very comprehensive Annual Debt Management Report (ADMR), prepared by the Debt Management Division (DMD) of the MoF; the annual Budget Statements prepared by the MoF; the monthly and quarterly reports of the BoG, which are posted on its website (monthly for domestic debt, quarterly for external debt); and the annual accounts of the Consolidated Fund prepared by the CAGD. These include detailed schedules (Table 8 of CAGD annual report of CF) of the opening balances, movements and closing balances of all domestic and external debts for each project/program. In 2016, the first Annual Debt Management Report (ADMR) was prepared in accordance with Section 72 of the PFMA (2016). The MoF prepares monthly debt reports for its own internal use. Table 3.17 summarizes end-of-year debt stocks for the last few years, as shown in the 2016 ADMR.
Table 3.17: Ghana Public Debt (US$ millions)
Public debt 2012 2013 2014 2015 2016
External debt 9153.5 11901.9 13871.8 15781.8 16460.9
--Multilateral 4336.6 4557.9 4900.7 5379.4 5547.9
--Bilateral 948.7 1114.9 1127.8 1196.3 1136.4
--Export credits 1036.3 1119.3 1158.4 1176.2 1315.2
--Commercial 958.4 1826.7 2270.8 2788 2782.2
--International capital markets
750 1530.5 2530.5 3530.5 3549
--Other concessional 1123.3 1750.4 1883.5 1811.3 1730.1
Domestic debt 9957.2 12559.4 10915.6 10621.4 12766.1
--Short-term 3055.8 4058.1 4263.3 4805.7 4806.1
--Medium-term 5077.4 5795.7 4016.5 3344 4865

89
Public debt 2012 2013 2014 2015 2016
--Long-term 1675.5 2434.3 2457.5 2361 2978
--Standard loans 192.4 271 178 110.6 116.1
TOTAL DEBT 19150.7 24461.4 24787.4 26403.3 29227.1
% external 47.8 48.7 56.0 60.0 66.6
% GDP 47.8 56.8 70.2 72.2 72.5
External 22.8 27.8 39.3 43.2 40.8
Domestic 25.0 29.2 30.9 29.1 31.6
GoG-Guaranteed loans (GH₵ millions outstanding) o/w IMF loans to the BoG (3038.9), and the remainder are for infrastructure projects.
4235.9
(3038.9)
On-lent loans outstanding (US$ millions) 1/
2342.5
Promissory notes outstanding end-of 2016 (US$ millions) 2/
52.9
Letters of credit issued (LCs) in 2015-16 (GH₵ millions) 3/
912.9
Source: ADMR 2016, prepared by the DMD in the MoF. 1/ GoG borrows and then on-lends funds to SOEs and small businesses, mainly for infrastructure projects. In effect, the GoG is guaranteeing to the lender that the money will be paid back. Relative to an official loan guarantee, the GoG can exercise more pressure on the SOE to ensure that the project being financed will successfully be implemented. 2/ Issued on behalf of the Volta River Authority for crude oil purchases. A promissory note is an unconditional promise to pay a certain sum of money on demand on a specified due date. In effect, this is the same as a GoG-guaranteed loan (as stated in the Glossary of the ADMR). 3/ This is a financial instrument that specifies a letter from a bank guaranteeing that a buyer’s payment to a seller will be received on time and for the correct amount. In the event that the buyer is unable to make payment on the purchase, the bank will be required to cover the full or remaining amount of the purchase (as stated in the Glossary of the ADMR). In effect, such Letters of Credit (LCs) are also GoG-guaranteed loans, as the bank issuing the LC will want to be covered. The purpose of the LCs was/is to support infrastructure projects being implemented through seven MDAs. The LCs are listed in Table 17 of the ADR.
The DMD continues to use the Commonwealth Secretariat Debt Recording and Management System (CSDRMS) for its debt management functions. This has been upgraded since the 2012 PEFA assessment to improve the tracking of and accounting for on-lending of external loans to the GoG.22 The BoG manages domestic government debt on behalf of the GoG, and transfers its database records to the DMD every month.
Reconciliation issues
According to the Auditor General’s Report on the Consolidated Fund for 2016 and a meeting with representatives from the Public Debt and Investment Directorate (PDI) in the CAGD, there
22 Section 7.3 of the CAGD Report on the Public Accounts of the Consolidated Fund for 2016 notes the implementation of the Auditor General’s recommendations contained in the audit report of 2015. The public debt statistics were likely understating the amount of on-lending. The 2012 PEFA assessment raised this as an issue.

90
were external debt reconciliation issues during 2015 and 2016 regarding the debt records held by the DMD and the PDI. This is partly because the PDID is not yet linked to the CSDRMS, indicating scope for error in the transmission of records from the DMD to the PDID. The PDID is responsible for conveying payment instructions to the Bank of Ghana. According to the PDID, the records of external debt held by the BoG may differ from those held by the PDID because of month-end factors (external debt service payment requests submitted to the BoG by the PDID during the course of the month, but payment being made after the month-end at a different exchange rate than that used by the PDI).
Page 35 of the Auditor General’s 2016 Report on the Consolidated Fund indicates that reconciliation issues had been resolved, but this may be an ongoing annual issue until the PDID is linked to the CSDRMS. The CAGD’s report on the implementation of the Ghana Audit Service’s recommendations on its audit covering FY 2016 (noted in the footnote below) indicated that the GAS had identified an underestimate of GH₵ 1.1 billion pertaining to the GoG’s external loan balances for FY 2016 (paragraph 7.6 of the report). This was due to delays in the communication of information from the DMD to the PDI. Paragraph 7.6 of the report indicates that reconciliation between the DMD and the PDI is now done on a quarterly basis.
Debt guaranteed by the GoG
The ADMR for 2016 seems to be the only source of information about the stocks of GoG- guaranteed debt. The accuracy of this information is also open to question. The updating of this is less timely than for the GoG’s own debt. It may also be less accurate as the information has to come, via their parent MDAs, from those SOEs and Public Corporations for which the GoG has guaranteed the debts. The MoF’s DMD does not request routine submissions from the MDAs of relevant information on the status of the debt that these bodies have incurred and which has been guaranteed by the GoG. This information is needed to corroborate and reconcile with the information held centrally by the MOF. Without it, there is a risk that the information might be incomplete and/or out of date.
Parent MDAs need to check that the SOEs/Public Corporations falling under their umbrella are routinely checking their debt records against creditor records — and that debt transactions reconcile with those shown in their bank accounts. For foreign exchange-denominated debts, fluctuations in exchange rates will impact the cedi equivalent, so this needs to be considered as well.
Section 3 of the ADMR covers contingent liabilities (mainly in the form of loans to SOEs guaranteed by by GoG) and on-lending. Appendix 4 of the report shows the GoG guaranteed loans to SOEs totaling GH₵ 1.2 billion (approximately US$ 270 million) at the end of FY 2016. As indicated in Table 3.17 above, this comprised a relatively small portion, 4.1 percent, of the total debt stock in 2016.
Table 14 in the 2016 ADMR identifies 14 new on-lending agreements totaling US$ 1.4 billion. These are not strictly contingent liabilities. Rather, the GoG is at risk if the SOEs borrowing from the government fall behind in their debt service payments, causing possible fiscal stress for

91
government, which would then be required to service its debt to the lenders. To date, contingent liabilities do not include those arising through PPPs. Several (19) are in the planning stage, but are not yet operational, as noted in the ADMR (listed in its Appendix 6).
13.2. Approval of debts and guarantees
The debt management provisions of the PFMA (2016) consolidate debt management and PFM under one law; to a large extent, they also formalize the debt management practices that have been in place for some years. To date, the Constitution (Article 181) of 1992 and the Loans Act of 1970 have governed the Central Government’s contracting of loans. The Loans Act is repealed. The PFMA provides the MoF with the sole authority to contract loans on behalf of the government or any other public-sector institution, subject to cabinet and parliamentary approval. Article 6 of the 1992 Constitution requires Statutory Corporations to obtain the prior approval of the Minister of Finance to obtain a loan. Articles 10 and 13 of the Constitution also empower the Minister to grant loan guarantees. Section 51 (3) of the Bank of Ghana Act requires the BoG to put a limit on the aggregate of guarantees issued by it each year. Prior to the PFMA (2016), there was no legislation that required a Medium-Term Debt Management Strategy (MTDMS), although, in practice, these were being prepared.
In practice, however, the procedures for approving proposed new debt and government guarantees appear not to have been fully followed. In the case of government guarantees, this is implied by the financial situation of a number of SoEs, as indicated under PI-10. Public debt management-related legislation and procedures are therefore in the process of being tightened up. The Loans Act of 1970 is in the process of being superseded by the PFMA (2016) under Sections 54-78 on Public Debt Management. The provisions of PFMA on debt management are not substantially different in principle than under the Loans Act, but they go into far more detail. For example, the conditions for obtaining loan guarantees are far more detailed. Section 66 notes the detailed conditions under which the GoG may guarantee loans made to public corporations, SOEs and MMDAs. Section 66 (2) requires the Public Debt Management Office (PDMO) to conduct a fiscal risk analysis of any institution that is planning to borrow and/or wanting to obtain a loan guarantee from the MoF.23 Section 71 specifies the requirement for the PDMO to prepare semi-annual statistical debt reports. These would include information on guaranteed loans and on-lent loans. Section 72 requires that the PDMO prepare an Annual Debt Management Report. This requirement has already been implemented, as reflected in the first-ever ADMR (this was not required by the Loans Act). The Financial Regulations for the PFMA (2016) currently being drafted will go into even more detail regarding procedures for debt management..
Domestic debt has been managed differently than external debt because domestic debt has mainly been short-term in nature (with debt instruments, typically Treasury Bills, being issued every week). Each domestic debt issue has not required prior Parliamentary approval, as long as
23 The PDMO has not been established yet, as the financial regulations supporting the PFMA are still being drafted. The Debt Management Division (DMD) in the MoF is still in place.

92
the terms and conditions of each issue do not change. The main limitation is the overall domestic borrowing figure announced in the annual Budget.
13.3. Debt management strategy
This is a new dimension.
The MoF has been preparing medium-term debt management strategies (MTDMS) since 2006, the most rigorous being the most recent one, covering 2017-2019. These were not explicitly required by the Constitution and the Loans Act (1970). The MTDMS prepared in 2006 (“Ghana New Financing and Debt Strategy”) focused on: extending the average maturity rate of the domestic debt portfolio; better integrating debt and cash management; and improving transparency, with the expectation of achieving subsequent gains for the government’s cost of money (referred to in the 2009 PEFA assessment).
The MTDMS reports have been based on Debt Sustainability Analysis (DSA) reports. Prior to 2007, these were prepared entirely by the IMF and the World Bank. Starting in 2007, the DSA was prepared in close coordination with the IMF and World Bank, using the IMF’s DSA model (as used in its Article IV Consultation reports). The DSA was coordinated through the Policy Analysis and Research Division of the MoF, where key macroeconomic variables were gathered and assumptions discussed.
The MTDMS has strengthened in rigor over the years. The Budget Statement for FY 2016 indicated that the MTDMS for FY 2016-18 would be more rigorously prepared than previous strategies — and that the financing of the budget deficit would more closely reflect the debt strategy. This was not a public document, but the assessment team was able to review it on a “read-only basis” and considered it to be of good quality. Its focus was to develop primary and secondary markets to achieve greater efficiency through the refinancing of external and domestic debt with longer tenors, thereby leading to reduced debt service costs.
In relation to measuring the degree of success in implementing the MTDMS for 2016-18, Table 18 in the 2016 ADMR notes the performance of four areas of risk and associated risk indicators for external and domestic debt for FYs 2015 and 2016, including the following information:
(i) Cost of debt: weighted average interest rate;
(ii) Refinancing risk: Average time to maturity (number of years); and percentage of debt maturing in one year.
(iii) Interest rate risk: Average time to re-fixing (number of years); debt refixing in one year (percentage of total debt); fixed rate debt (percentage of total debt).
(iv) Foreign currency risk (FX): Proportion of public debt denominated in FX; short term FX debt (percentage of FX reserves).

93
According to the ADMR (paragraphs 58 and 62), the implementation of the strategy had mixed results in 2015 and 2016. Most of the actual indicators went in the wrong direction (for example, the weighted average interest rate increased to 11.4 percent in 2016 from 10.5 percent in 2015). Nevertheless, paragraph 63 of the ADMR points to some positive developments (for example, the strengthening of the Ghana Fixed Income Market through the establishment of e-trading platforms, leading to significant growth in the volume of trade).
The Budget Statement for the 2018 budget also assesses performance under the MTDMS for 2016-18. It indicates that the GoG adhered to the MTDMS in terms of not issuing sovereign bonds and relying on market instruments only for domestic financing of the budget (with no borrowing from the BoG). Through debt re-profiling (that is, borrowing at less expensive rates at longer tenors to replace more expensive debt at shorter tenors), the debt-to-GDP ratio fell to 68.6 percent of GDP by the end of September 2017, from 73 percent at the end of 2016. The interest burden on the GoG’s revenues started to fall from 45 percent of tax revenues at the end of 2016, and it was projected to fall to 41 percent by the end of 2017. Paragraphs 110-118 in the Budget Statement elaborate on this issue (also paragraph 798). Paragraphs 119-120 in the Statement indicate some strengthening of the GoG’s credit ratings after years of deterioration. This is partly attributable to the implementation of the MTDMS. Paragraphs 200-206 and 347-351 focus on the debt management strategy for 2018, emphasizing its consistency with the MTDMS for 2017-19.
The latest MTDMS covers FY 2017-19, with the MoF preparing a DSA. It was posted on MoF’s website on May 31, 2017. It is the first MTDMS prepared under the PFMA (2016). Section 59 requires the Public Debt Management Office (PDMO) to prepare a rolling 3-year MTDMS every year for approval by the Cabinet.24 This gives legal effect to what has already been the case for several years. The MTDMS should be based on the debt management objectives set out in Section 58 of the PFMA (2016), basically financing the GoG’s borrowing requirements in a timely and sustainable manner with due regard to risk, as well as promoting the growth of the domestic public debt market. Section 59 (4) requires that the MTDMS be published; in practice, it is published on MoF’s website. Publication was not required under the Loans Act Section 60 requires the PDMO to prepare an Annual Borrowing and Recovery Plan, based on the MTDMS.
The latest MTDMS does not put an annual limit on the issue of loan guarantees, but the PFMA has made the conditions for SOEs to receive guarantees more stringent, as noted under 13.2. Previous MTDMSs did not place a ceiling on guarantees, presumably because the Loans Act did not stipulate such a ceiling (but Section 51 of the Banking Act does allow the BoG to set a ceiling on the value of loan guarantees that it can issue). The MTDMS for 2012-2014 indicated that the maximum guarantee or on-lending facility granted to a parastatal/SOE would be guided by its performance and should not exceed the sum of the previous three years’ revenues.
The MTDMS for 2017-19 is well-prepared and appears to be more rigorous than the MTDMS for 2016-18. What is shown on MoF’s website is the official document. The assessment team had
24 See previous footnote regarding the establishment of the PDMO.

94
“read-only” access to what is a background paper that underpins the formal strategy.25 It includes risk analysis with regard to the impacts of changes in interest and exchange rates on the debt portfolio, taking into account also revisions in revenue projections and refinancing options.
On-going reforms
The Financial Regulations for the PFMA (2016) are still being prepared. Procedures for debt management will be included.
Paragraph 24 of the MTDMS for 2017-19 notes the GoG’s plan to implement a Credit Risk Assessment for State-Owned Enterprises (relevant to PI 13.2 above). The reason is GoG’s concern that: “The current financial shape and governance structure of SOEs, particularly in the energy sector, is worrying and this continues to pose challenges for fiscal policy outcomes”. Paragraphs 121-122 of the Budget Statement also refer to this. Paragraphs 123-138 elaborate on the measures being taken to reduce the burden of the legacy debt hanging over the energy sector brought about by the large fall in international crude oil26 prices between 2013 and 2016. These measures include the Energy Sector Levies Act (ESLA) of December 2015, under which an Energy Debt Recovery Levy was imposed; a bond program established to replace legacy debt by medium-to-long term cedi-denominated debt; and the implementation of efficiency-enhancing measures, such as the Cash Waterfall Mechanism.
PILLAR FOUR: Policy-based fiscal strategy and budgeting
PI-14. Macroeconomic and fiscal forecasting
This is a new indicator. It measures the ability of a country to develop robust macroeconomic and fiscal forecasts, which are crucial to creating a sustainable fiscal strategy and ensuring greater predictability of budget allocations. It also assesses the government’s capacity to estimate the fiscal impact of potential changes in economic circumstances.
Summary of scores and performance table
Indicator/Dimension Score/Scoring Criterion Explanation
PI-14. Macroeconomic and fiscal forecasting-(M2-AV scoring method)
(Time period. Last 3 completed FYs):
C
25 The team leader was provided access to the background document on a ‘read-only’ basis, and thus was able to obtain a full understanding and overall appreciation of the quality of the document. The same holds true for the 2016-18 MTDMS, that he was also able to read. 26 Paragraphs 400-405 of the Budget Statement also refer to the impact that the large fall in international cocoa prices had on the cocoa sector. The fiscal impact on the GoG in 2016 was related to the foregoing of its share of export duty payments (but which are, relative to the energy sector, only a very small proportion of GoG revenues).

95
Indicator/Dimension Score/Scoring Criterion Explanation
14.1. Macroeconomic forecasts
C
The government prepares forecasts of key macroeconomic indicators for the budget year and the two following fiscal years.
The annual budget statements presented to the Parliament (the last for which is for FY 2018) includes Section 4 on Macroeconomic Targets for 2018 and the Medium Term.
Paragraphs 148 -149 and 159 list targets for key macro-economic variables. The targets are based on assumptions about the performance of exogenous variables and that GoG will continue to implement fiscal and monetary policies supportive of continued strengthening of macro-economic stability.
14.2. Fiscal forecasts C
The government prepares forecasts of revenue, expenditure and the budget balance for the budget year and the two following fiscal years
.
Medium term revenue and expenditure forecasts are contained in tabular form in Appendix 3 of the 2018 Budget Statement. The forecasts are dis-aggregated according to revenue type and broad economic classification for expenditure. The forecasts are stated terms of GDP.
The assumptions regarding the forecasts are not clear. Revenue mobilization and expenditure rationalizing measures are mentioned in the main text of the Statement, but the relationship between these and the projections in the tables are unclear. The statement casts and the underlying assumptions are included in the annual Budget Statements (disaggregated tables contained in Appendix 3 of the Statement) and presented to the Parliament, the most recent of which is for 2018.
Differences from the forecast made in the previous year are not explained.
14.3. Macro-fiscal sensitivity analysis
C
The macro-fiscal forecasts prepared by the government include a qualitative assessment of the impact of alternative macroeconomic assumptions.
Macro-fiscal forecasts are prepared internally by the GoG using different assumptions about the future path of relevant parameters ( for example, inflation, and interest rates). The draft forecasts are not shown in the Budget Statement, only the actual forecast which is eventually selected.

96
14.1. Macroeconomic forecasts
The Economic Forecasting and Research Division (EFRD) of the MoF is, in conjunction with Bank of Ghana and Ghana Statistical Services (GSS), responsible for preparing macroeconomic forecasts. These tend to be prepared using the financial programming approach of the IMF. Under this approach, forecasts of the real, monetary, financial, external (balance of payments) and fiscal sectors are prepared. These sectors are inter-linked in key ways. For example, revenues are linked to GDP; the GoG borrows from the banking system which is linked to the monetary sector; and the external sector is linked to the monetary sector through changes in net foreign exchange reserves. Debt sustainability analysis is used to help determine the government’s external and domestic borrowing limits. Real sector growth forecasts (real GDP growth) are prepared according to a sector-based ‘bottom-up- microeconomic approach. These tend to be discussed under the current IMF Extended Credit Facility (ECF). Forecasts of the other sectors are made jointly by the MoF and the BoG, so as to ensure inter-sectoral consistency.
The annual Budget Statement and Economic Policy presented to the Parliament includes a chapter on macroeconomic developments and the macro-economic outlook. The most recent one at the time of the PEFA field visit was for FY 2018. The EFRD prepares high-quality, annual macroeconomic performance reports, which help to inform the preparation of this chapter. Prior to submission to the Parliament, draft macroeconomic and fiscal forecasts prepared by the MoF and the BoG are scrutinized by the Economic Management Teams, members of which a number of Ministries chaired by the Vice-President. Section 3 of the Statement covers macroeconomic performance during the first three quarters of 2017. A summary section precedes an analysis of the performance of the four macroeconomic sectors (real, fiscal, monetary, and external), ending with an analysis of public sector debt developments and management (as indicated in PI-13.3).
Section 4 of the Statement covers macroeconomic targets for 2018 and the medium term (Paragraphs 148 -149 and 159 list targets for key macro-economic variables). The targets are based on assumptions concerning projections of exogenous variables (e.g real GDP growth, oil production and prices) and that the Government will be able to continue to implement the fiscal and monetary policies necessary for strengthening macro-economic stability. Macroeconomic objectives and strategies are outlined consistent with these assumptions. The analysis is then presented on a macroeconomic sector basis. Three year forecasts for real GDP and the fiscal sector are shown. Targets for real GDP growth, inflation, the overall fiscal balance and primary balance, and foreign exchange reserves import coverage are listed consistent with the macro-economic policy stance (paragraph 148). The target for the primary balance implies a projection of interest rates. A table showing the projected medium-term macroeconomic framework is not provided
The previous year’s budget statements were prepared along the same lines as the one for the 2018 Budget Statement, but they provided less detai
A consolidated macroeconomic framework for the next few years is not shown, though this would be useful ( IMF Article IV reports show this for all countries). . as it would show the linkages

97
between the four macro-economic sectors and make more explicit the underlying assumptions. l.
14.2. Fiscal forecasts
The Budget Statement and Economic Policy for 2018 (and for previous years) includes aggregate fiscal forecasts as a subset of the macroeconomic forecasts referred to in 14.1. These forecasts set targets for the aggregate and primary fiscal balances, and targets for spending based on revenue and grant forecasts, including the amount of borrowing implied by the fiscal balance target. The revenue forecasts also take into account new policy initiatives.
Appendix 3 of the 2018 (also for previous years) Budget Statement contains disaggregated, medium-term projections of revenues disaggregated by type and expenditures on an economic classification basis for 2018-21. These are partly based on new revenue and expenditure initiatives, as described in Section 6 of the 2018 Budget Statement. The revenue measures described in paras 332-337 and 848-855 in this section are mainly measures aimed at strengthening compliance (weaknesses in compliance are assessed under PI-19). Specific possible tax policy measures (e.g. reducing the extent of tax exemptions) are discussed in paras. 164-165. Petroleum revenues are projected over the medium term in detail in paras. 186-198 in the Budget Statement.
Nevertheless, revenue projections by revenue type are made on the basis of ratios to GDP, as shown in detailed tabular form in Appendix 3B of the 2018 Budget Statement. Tax revenue (disaggregated by type) is projected to increase to 18.5 percent of GDP by 2021 from 16.5 percent of GDP in 2018. The robustness of this projection and its linkage to the strengthening of tax compliance and envisaged tax policy measures is not clear. No explanation and justification of the projections is provided alongside the table.
Specific expenditure strengthening measures being considered over the medium term are outlined in paras. 334-346 (e.g continuing to strengthen payroll and procurement systems) and paras. 856-866 in the 2018 Budget Statement, for example, rationalizing travel expenditure.
Appendix Table 2.3 projects expenditure according to broad economic classification in terms of GDP. Total expenditure is projected to fall to 23.5 percent of GDP by 2021 from 25.3 percent in 2018. As for revenue, the robustness of these projections and the relationship to the envisaged expenditure policy measures is not clear.
The assumptions regarding the forecasts are not clear. Revenue mobilization and expenditure rationalizing measures are mentioned in the main text of the Statement, but the relationship between these and the projections in the tables are unclear. The statement casts and the underlying assumptions are included in the annual Budget Statements (disaggregated tables contained in Appendix 3 of the Statement) and presented to the Parliament, the most recent of which is for 2018. Differences from the forecast made in the previous year are not explained.

98
14.3. Macro-fiscal sensitivity analysis
The Budget Statement presented to Parliament does not explicitly contain any macro-fiscal sensitivity analysis as part of the process of preparing the macro-fiscal forecasts. However, such an analysis (qualitative and quantitative) takes place informally behind the scenes during the process of preparing the Budget Statement (also see PI 15-2). MoF prepares these macro-fiscal forecasts using different assumptions about the future path of relevant parameters (for example, inflation, and interest rates). The draft forecasts are not shown in the Budget Statement, only the actual forecast which is eventually selected.
PI-15. Fiscal strategy
This indicator provides an analysis of the capacity to develop and implement a clear fiscal
strategy. It also measures the ability to develop and assess the fiscal impact of revenue and
expenditure policy proposals that support the achievement of the government’s fiscal goals.
Summary of scores and performance table
Indicator/Dimension Score/Scoring Criterion Explanation
PI-15: Fiscal Strategy
(M2-AV scoring method)
D+
15.1: Fiscal impact of policy proposals
(Time period: Last 3 completed FYs)
D
Performance is less than required for a C score.
C score requires:’The government prepares estimates of the fiscal impact of all proposed changes in revenue and
expenditure policy for the budget year.’
The fiscal impacts of the proposed changes in revenue and expenditure policy are not explicitly shown in Section 6 of the Annual Budget Statement, except in some cases.
In principle, the impacts are calculated internally by MDAs, and are reflected in the estimates of revenues and expenditures shown in the Budget Statements for FYs 2014-18. But there is no way of knowing whether this is in fact the case.

99
Indicator/Dimension Score/Scoring Criterion Explanation
15.2. Fiscal strategy adoption
(Time period: Last completed FY)
C
The government has prepared for its internal use a current fiscal strategy that includes
qualitative objectives for fiscal policy.
In line with Section 15 of the PFMA (2016), MoF is required to prepare an annual Fiscal Strategy Document (FSD), which shows fiscal objectives and how to best meet these for the next 2 years. The 2017 FSD is the first of its kind. The FSD was submitted to Cabinet for its discussion and eventual approval.
The PFMA does not require that the FSD be submitted to the Parliament. The main points are reflected, however, in the annual Budget Statement and Economic Policy for 2018-21.
15.3. Reporting on fiscal outcomes
(Coverage: Last completed FY)
NA
As noted under 15.2, the GoG prepared its first explicit fiscal strategy only in 2017. This was not published, and appears not to have influenced preparation of the 2018 budget. It is therefore too early to assess progress made in implementing the strategy.
This is a new indicator.
15.1: Fiscal impact of policy proposals
Section 6 of the annual Budget Statements shows the proposed changes in revenue and expenditure policy that are planned to take place in the following year; the last one is for the 2018 Budget. In many cases, the impact of the proposed changes is shown only in physical terms, not monetary terms. Moreover, it is not presented in the form of a table. The impacts are shown only for the budget year and not the following 2 years. Even when shown in monetary terms, it is not clear how much of the budgeted allocation for the spending represents a continuation from the previous year, and how much is ‘new’ spending. The budgetary impacts of new policy measures on revenues and expenditures are in principle estimated internally (for example, the Revenue Policy Division in the MoF analyzes the fiscal impact of changing a tax rate). It is difficult for an outside reviewer to know, however, the extent to which this is done. The transparency of the Budget Statement would be stronger if the budgetary impact of the proposed changes was explicitly shown in the Budget Statement.
The Economic Management Teams, drawn from different ministries, and the Economic Policy Coordination Council, located in the Office of the Vice-President, provide comments on macro-fiscal and budget-related documents prepared by MoF for submission to Cabinet. There is no particular methodology for estimating impacts (beyond the templates contained in Budget Call Circulars)

100
15.2. Fiscal strategy adoption
For some time now, the Government of Ghana has prepared the Budget Statement and Economic Policy for submission to the Parliament in November, just ahead of the submission of the detailed budget estimates. In effect, the Budget Statement represents a fiscal strategy, explaining the Government’s expenditure policies. As such, it is consistent with broad economic development objectives. It describes how these policies will be implemented through the budget (including indicative estimates for the following 2 years), while explicitly refering to the fiscal strategy of the Government (paragraphs 18 and 19, under “Fiscal Policy and Medium-Term Outlook).
An issue with the Budget Statement has been its timing, as it comes very late in the fiscal year. In many other countries, it comes much earlier in the year, representing the strategic phase of budget preparation. During this phase, expenditure priorities for the coming MTEF period are discussed and agreed upon, and ‘soft’ expenditure ceilings are established for each program within each MDA for the next 3 years. These are consistent with the estimation of an overall resource envelope. The MDAs would then estimate expenditures that would fit within these ceilings. This process would result in the preparation of a Budget Strategy Paper/Budget Policy Statement, Fiscal Strategy, or equivalent wording. It would subsequently be approved by the Cabinet, and perhaps also by the Parliament. A Budget Call Circular would then be distributed to the MDAs so that they could start on the detailed budget estimation phase of their budget preparations.
Section 15 of the PFMA addresses this issue through the renaming of the Budget Statement as the Fiscal Strategy Document (FSD), and bringing this forward to earlier in the FY, as noted below.
The concept of an explicit FSD to be prepared by the Government earlier in the year was provided for through Section 15 of the PFMA (2016). The first one was prepared in May 2017. The FSD should be submitted to the Cabinet for approval, but it is not presented to the Parliament, and is confidential. The FSD should include the Medium-Term Fiscal Framework, a Medium-Term Expenditure Framework, a statement of policy measures consistent with fiscal policy objectives, a fiscal risk statement, and a Medium-Term Debt Management Strategy (MTDMS). The main element missing from the Budget Statement is a fiscal risk statement. No reference is made in Section 15 to the Budget Statement and Economic Policy, indicating that it will be replaced by the FSD.27
The FSD, prepared under the auspices of the MoF, is very comprehensive and analytical. The team leader had the opportunity to look at the FSD on a quick “read-only” basis. A key feature is the presentation of a number of fiscal scenarios under different macro-fiscal-type assumptions. The idea is that the Cabinet reads and discusses it, and then decides which fiscal policy/strategy is most suited for Ghana’s situation in terms of reducing the medium-term risks of
27 Such an analysis of fiscal risks is contained in the annual Budget Policy Statements prepared by the National
Treasury in Kenya, as shown on its website (the team leader led a PEFA assessment there in 2017).

101
macroeconomic instability, as well as reducing the risks of the medium-term strategic allocation of budgetary resources in not being as efficient and effective as it could be.
One problem with starting the budget preparation process earlier in the year is that projections of the overall resource envelope for the next year may change during the year. This may, for example, result in revenue performance being different than originally forecast. As a result, the original expenditure estimates made by the MDAs would need to be revised. This could be time-consuming for the big ministries with district offices located all over the country. This issue was raised by MDA representatives during the meetings that the team held with four of the large MDAs.
As noted under PI-16, the FSD appears not to have been used to inform the setting of MDA expenditure ceilings in the annual Treasury Guidelines. These are issued to MDAs in August to enable them to prepare their budget estimates for the following year. The Guidelines for preparing the 2018 budget do not make any reference to the FSD.
15.3. Reporting on fiscal outcomes
Under this dimension, progress in implementing the fiscal strategy referred to under 15.2 is assessed. As the strategy is still very new and was not used to inform the preparation of the 2018 Budget, it is not possible yet to assess progress in implementing the strategy.
PI-16. Medium-term perspective in expenditure budgeting
This is a new indicator.
Expenditure policy decisions have multi-year implications and need to be aligned with the availability of resources in the medium term. The resulting medium-term expenditure estimates should be reconciled with fiscal aggregates determined through the fiscal strategy in the budget. This indicator examines the extent to which expenditure budgets are developed for the medium term within explicit medium-term budget expenditure ceilings.
This is a new indicator.
Summary of scores and performance table
Indicator/Dimension Score/Scoring criterion Explanation
PI-16 Medium-term perspective in expenditure budgeting
(M2-AV scoring method)
B
16.1 Medium-term expenditure estimates
(Time period: last budget submitted to legislature: for 2018)
A.
The annual budget presents estimates of expenditures for the budget year and the following two fiscal years. These are allocated by administrative,
The GoG adopted program-based budgeting (PBB) in 2014. Each MDA prepares its PBB in the context of an MTEF, according to administrative, program, sub-program and broad economic classification. The first year of

102
Indicator/Dimension Score/Scoring criterion Explanation
economic, and program (or functional) classification.
the MTEF is represented in the annual Appropriations Act. This does not show the outer 2 years, but the program budgets for each MDA do.
16.2 Medium-term expenditure ceilings
(Time period: last budget submitted to the legislature was for 2018).
C
Aggregate expenditure ceilings for the budget year and the two following fiscal years are approved by the government before the first budget circular is issued
Expenditure ceilings for the new the updated Medium-Term Fiscal Framework are approved each year by the Cabinet, prior to the issue by MoF each year of the Budget Guidelines for preparing next year’s budget. As indicated under PI-17, the Guidelines themselves, which contain the allocative ceilings, are not approved first by Cabinet prior to their issue to MDAs.. .
16.3 Alignment of strategic plans and medium-term budgeting
(Time period: last budget submitted to legislature was for 2018).
A.
Medium-term strategic plans are prepared and costed for most ministries. Most expenditure policy proposals in the approved medium-term budget estimates align with the strategic plans..
The National Development Planning Commission is responsible for National Planning (GSGDA 2) in Ghana. It also assists the MDAs in the preparation of Medium Tterm Development Plans (MTDPs), consistent with GSGDA-2, , which are costed. The 3- year MTEF PBB estimates prepared by each MDA as part of the budget preparation process are based on MTDPs. They include strategic analysis of planned spending per program as well as cost estimates.
16.4 Consistency of budgets with previous estimates
(Time period: Approved budgets for last completed FY (2017) and current FY (2018)).
D.
Performance is less than required for a C score.
The C score requires that the budget documents provide an explanation of some of the changes to expenditure estimates between the second year of the last medium-term budget and the first year of the current medium-term budget at the aggregate level.
The budget documents do not fully quantify and explain the variation between the corresponding years in each medium-term budget.
16.1 Medium-term expenditure estimates
Good practices for this dimension establish that the annual budget present an estimate of expenditures for the fiscal year and the following two fiscal years, organized according to administrative, economic, and program (or functional) classification.
Program-based budgeting (PBB), introduced in 2014, takes place within a Medium-Term Expenditure Framework (MTEF). The annual Approprations Act (AA) represents the first year of

103
the MTEF. As shown on MoF’s website, the detailed budget for each MDA, shows estimates of sub-program expenditure under each program for 2018-2020, disaggregated by broad economic classification. Each MTEF contains substantial explanatory narrative in terms of policy, program description and targets. The structure appears to be similar to that of medium term program budgets prepared in South Africa. The overall resource envelope for the MTEF is based on the Medium-Term Fiscal Framework prepared by the MoF, as updated each year.
16.2 Medium-term expenditure ceilings
Good practice requires that aggregate expenditure ceilings —and those at the ministerial level for the budget year and the following two fiscal years — be approved by the government before the first budget circular is issued.
The budget circular ( Budget Guidelines) is supposed to be issued in July of each year (as discussed under PI-17), but in practice, this does not happen until August (Budget Guidelines 2018 – 2021 in the context of preparing the 2018-2021 budget and MTEF). The Guidelines contain the ceilings at the ministerial level for 2018, as well as the indicative ceilings for the following two fiscal years. The Guidelines were not submitted to Cabinet for its approval prior to being issued to MDAs.
16.3 Alignment of strategic plans and medium-term budgets
Referenced Good practice establishes the preparation and publication of medium-term strategic plans for most ministries, as well as an alignment between most expenditure policy proposals in the medium term with budgetary estimates of strategic plans.
In Ghana, the National Development Planning Commission (NDPC) is responsible for national development planning. The Ghana Shared Growth and Development Strategy Two (2014 – 2017) is currently in place. Assisted by the NDPC, all MDAs prepared costed medium-term strategic plans (2014-2017) for the implementation of GoG policies and program over the medium term. These plans are available on NDPC’s website. During the annual budget planning exercise, the NDPC gets involved in assisting the MDAs. Specifically, it ensures that the PBB medium-term estimates are aligned to the strategic plans in terms of policies and program. The NDPC staff also sit at the budget technical hearings of all MDAs, during which costs are discussed in detail.
In 2012 the GoG implemented Progam Based Budgeting (PBB) within a Medium Term Expenditure Framework across the whole of government. The aim of PBB is better information on the link between government’s policy priorities and plans, and the use of its resources. PBB allows governments to be clearer on the link between policies, outputs and the costs of preparing these (i.e. expenditure) and outcomes. The 3 year PBB estimates prepared each year by each MDA (formally titled as MTEF PBB Estimate) as part of the budget preparation process provide an analytical costed strategic perspective to the planned spending for the next 3 years. Individual MTEF PBBs are shown on MoF’s website for the larger MDA. The annual Appropriations

104
Act represents a summary of the MTEF PBBs for all MDAs (e.g. Education, Agriculture and Fisheries). 28
Costing sector strategic plans for more than a few years ahead is problematic due to uncertainties in projecting prices and volumes. The most important thing is to ensure that the plans are consistent with policy goals and objectives. Detailed costing becomes more meaningful through the preparation of costed Medium Term Development Plans (MTDP) on which the 3 year rolling MTEFs are based, costs being firmed up as the MTEF is rolled one year forward each year. In making projections, scenario and sensitivity analysis can be used, taking into account cost trends and the impacts on desired outcomes of hypothetical different cost projections. 29
16.4 Consistency of budgets with previous years estimates
The budget documents do not fully quantify and explain the variation between the corresponding years in each medium-term budget. Good practice requires that budget documents explanations of all changes to expenditure estimates between the last medium-term budgeting financial year and the current medium-term budget at the ministry level should be provided.
PI-17. Budget preparation process
This indicator measures the effectiveness of participation by relevant stakeholders in the budget preparation process.
Summary of scores and performance table
Indicator/Dimension Score/Scoring criterion Explanation
PI-17 Budget preparation process
(Scoring method: M2-AV)
C
17.1 Budget Calendar C.
An annual budget calendar exists, and some budgetary units comply with it by
MoF issued the annual budget calendar for preparing the 2018 budget in February 2017.
28 Each MTEF PBB for each MDA contains the following main sections: (i) Strategic Overview (policies consistent
with GSDDA11), Goal, core functions, policy outcome indicators, expenditure trends, summary of key
achievements by program; (ii) Budget Program Summary: objectives, descriptions of key operations, program
service delivery, and program budget, including estimates for the 2 outer years.
29 For example a review of the MoH’s Health Sector Medium-Term Development Plan (HSMTDP) 2014 – 2017,
included a chapter on the budget and costing of the plan. The main tools used in the costing of the HSMTDP were: (i) the Marginal Budgeting for Bottlenecks (MBB) tool (internationally developed) for MDA-related services and health systems strengthening; and (ii) the activity-based costing for additional services not captured by the MBB (for example, mental health). Data inputs and intermediate results were validated with the MoH and Ghana Health Services (GHS) stakeholders through two validation workshops. Three cost scenarios were prepared, low, medium and high, reflecting the realism of the desired targets in terms of the availability of both physical (e.g. manpower) and financial resources and institutional constraints.

105
Indicator/Dimension Score/Scoring criterion Explanation
(Time period; preparation in 2017 of budget/MTEF for 2018-20)
meeting the deadlines for completing estimates.
The Budget Circular was issued to MDAs on August 15, 2017. The MDAs were required to submit the budget documents by August 31. This allowed only 2 weeks for the MDAs to prepare their budget submissions, and many MDAs were late.
17.2 Guidance on budget preparation
(Time period; preparation in 2017 of budget/MTEF for 2018-20)
C.
A budget circular or circulars are issued to budgetary units, including ceilings for administrative or functional areas. Total budget expenditures are covered for the full fiscal year. The budget estimates are reviewed and approved by the Cabinet after they have been completed (in every detail) by the budgetary units.
The Budget Circular is clear and relatively comprehensive. It includes ceilings, and guidelines, including templates. The Circular for the 2018 budget preparation was approved for issue by the MoF, but not by the Cabinet.
This may not matter too much as the Cabinet had already approved the FSD.
17.3 Budget submission to the legislature
(Time period; preparation in 2017 of budget/MTEF for 2018-20)
C.
The executive has submitted the annual budget proposal to the legislature at least one month before the start of the fiscal year in two of the last three years.
The dates of submission of the annual Budget Statement and Economic Policy to Parliament for 2016 and 2018 were:
November 13, 2015, and November 15, 2017, respectively.
Because 2016 was an election year, the appropriation bill was submitted to Parliament on 15 November 2016 was to cover spending in the first quarter of 2017 only.
17.1 Budget calendar
Good practice for this dimension draws on the existence of a clear annual budget calendar, which is generally observed. It grants ministries and public entities at least six weeks from the date of receipt of the budget circular (which establishes provisional budgeting ceilings) to complete their detailed estimates.
The MDAs appear to have too short a period to prepare and submit their detailed budget proposals. This resulted in delays by the MDAs in preparing and submitting their detailed budget estimates. For the preparation of the 2018-2020 medium-term expenditure estimates, the calendar was issued in February 2017 and the Budget Treasury Guidelines were issued (as per the calendar) to the MDAs on August 15, 2017. The MDAs were required to submit their proposals by August 31, 2017, and the budget technical hearings were scheduled to start on September 12, 2017. This allowed only 2 weeks for the MDAs to prepare their budget submissions, and many MDAs were late in submissions
106
This has been a common feature in recent years (2014, 2015, 2016), as also noted in the 2012 PEFA assessment. Moreover, ceilings tend to be revised after the submission of budget proposals, even up to the last minute. This lessens the incentive for the MDAs to prepare budget proposals in line with the budget circular if they know that the probability of having to repeat the whole exercise again is high. The amount of work required in preparing a budget proposal is high , particularly for large ministries with district offices all over the country (for example, the Ministries of Health and Education). This point was made at the meetings held by the team with the line ministries.
17.2 Guidance on budget preparation
Good practice establishes that one or more complete and clear circulars should be forwarded to the ministries and public entities, covering all budgetary expenditures for the full year, and reflecting the maximum ceilings approved by the government
A new factor introduced to the budget preparation exercise was the preparation of a Fiscal Strategy Document (FSD), as required under Section 15 of the PFMA (2016). The Cabinet approves the FSD. MoF submitted this to the Cabinet on March 31, 2017. The FSD (which is not published) included various possible scenarios for the MTEF, including different aggregate expenditure ceilings. The macro-fiscal estimates of the FSD were an input into the preparation of the Treasury Guidelines for 2018 – 2021. These influenced the settings of the detailed expenditure ceilings for the MDAs, on the basis of which MDAs prepared their detailed budget estimates.
The contents of the Budget Guidelines include:
Macro-fiscal Framework
Indicative ceilings for the all MDAs for the medium-term, 2018-2021
Guidance on the preparation of the Program-Based Budget (which has been the official budget since FY 2014):
o Templates for the PBB
o Specific guidance and templates on budgeting for non-tax revenues
o Specific guidance and templates on compensation of employees
o Specific guidance on budgeting for goods and services and priority expenditures
o Guidance on capital expenditures and the preparation of the Public Investment Plan (PIP), 2018-2021
o A detailed list of the chart of accounts to be used for budgeting

107
o Templates for commitments and arrears
o Timetable for the 2018-2021 Budget Hearings
In addition to the detailed guidelines (budget circular) that were issued, the MoF provided technical support to the MDAs. The MDA Budget Committees and Program Budget Working Groups (PBWGs) were trained on the Budget Guidelines, the preparation of PBB and the use of Hyperion to facilitate the preparation of the 2018-2021 Budget. Since the 2012 PEFA assessment, Hyperion has replaced Activate as the budget preparation software package; it is Oracle-based and directly linked to the GIFMIS, so that the approved budget can be uploaded directly into the GIFMIS, thereby facilitating budget execution.
17.3 Budget submission to the Legislature
Good practice states that the Executive Branch must submit the annual budget proposal to the legislature at least two months before the start of the fiscal year in each of the past three years, so that the Legislative Branch has sufficient review time.
The dates of submission of the annual Budget Statement and Economic Policy for 2016 and 2018 were November 13, 2015, and November 15, 2017, respectively As noted under Pi-18 (iii), 2016 was an election year and the election was held in December 2016., . A draft appropriations bill was submitted to Parliament on 15 November 2016, covering the first quarter of 2017 only. This is the usual practice in election year in Ghana; this allows the new government to prepare a full budget for the whole year taking into account the approved first quarter appropriations.
PI-18. Legislative scrutiny of budgets
This indicator assesses the legislative scrutiny and debate of the annual budget law as described by the scope of the scrutiny, the internal procedures for scrutiny and debate, and the time allocated to that process. This is done in terms of the ability to approve the budget before the commencement of the new financial year. It also assesses the existence of rules for in-year amendments to the budget without ex-ante approval by the legislature. The indicator is broadly the same as PI-27 under the 2011 PEFA Framework.
Summary of scores and performance table
Indicator/dimension Score/Scoring criterion Explanation
PI-18: Legislative Scrutiny of Budgets
(M1-WL)
B+

108
Indicator/dimension Score/Scoring criterion Explanation
18.1 Scope of Budget Scrutiny
(Time period; Last completed FY)
B
The legislature’s review covers fiscal policies and aggregates for the coming year as well as details of expenditures and revenues.
The Parliament scrutinizes both the aggregate and detailed budget estimates for both revenues and expenditures at the national (consolidated) level and at sectoral level, including to some extent the fiscal policies and macroeconomic forecasts for the coming year. The review does not include outer year estimates.
18.2 Legislative Procedures for Budget Scrutiny
(Time period:Last completed FY)
A
The legislature’s procedures to review the budget proposals are approved by the legislature in advance of budget hearings and are respected. The procedures include arrangements for public consultation and internal organizational arrangements, such as specialized review committees, technical support and negotiation procedures.
Clear rules exist for legislative budget scrutiny. These rules are enshrined in the Standing Orders. They are well respected, and allow for public consultation and solicitation of technical support with regard to budget review. The rules also make provision for specialized budget review committees (such as a select committee, and finance committee).
18.3 Timeliness of Budget Proposal Approval
(Time period: Last 3 completed FYs)
A
The legislature has approved the annual budget before the start of the year in each of the last three fiscal years.
The Parliament passed the Appropriations Act before the beginning of the new financial year in all three of the last three completed fiscal years.
18.4 Rules for Budget Adjustment by the Executive
(Time period: Last 3 completed FYs)
B
Clear rules exist which may be adhered to in some instances, or
they may allow extensive administrative reallocation as well as expansion of total expenditures.
Articles 179(8) & (9) of the Constitution, and Section 32 of the PFM Act of 2016 outline the rules for in-year budget reallocations; they are clear and respected.
The law places no limitation on the number and value of virements.This provides potential for extensive administration reallocation, but in practice, this is highly restricted.
One Supplementary Appropriations Bill was passed ex-ante in 2016 to increase the aggregate budget by 2 percent of the originally approved budget.
PI-18.1 Scope of budget scrutiny
The Parliament is empowered to scrutinize central government budget estimates under Article 106 of the 1992 Constitution and Standing Order No. 141. These are contained in the annual Budget Statement and Economic Policy and the detailed program budget estimates presented before the Parliament, as contained in the annual Appropriations Bill. The Budget Statement includes fiscal policies and the macroeconomic forecast. Other documents submitted to the

109
Parliament as part of the budget review process are (i) the budget performance reports from the MDAs for the last fiscal year; an annual debt management report, the first of which was prepared in 2017 (see PI-13); (iii) a macroeconomic performance report, which includes fiscal sector developments (including public debt developments), (iv) the government’s Medium-Term Debt Management Strategy (see PI-13)); and (v) a table showing areas of fiscal risk (including those posed by SOEs) and risk mitigation measures to be taken.
The budget review is conducted by parliamentary select committees for each sector, as well as financial and fiscal reviews by the finance and business committee.
The Director of Budget and Research in Parliament confirmed that the legislative budget scrutiny does not cover medium-term fiscal forecasts — although the MoF submits medium-term estimates. The Parliament has indicated that these are meaningless since they are significantly different from subsequent annual estimates submitted thereafter.
PI-18.2 Legislative procedure for budget scrutiny
The procedure for budget scrutiny is well established. It is documented in the Standing Orders, and is well respected. Standing Orders (SO) 147 to 149 outline the procedures for debating and approving the budget estimates. The public has a voice during the budget review. For example, Civil Society Organizations (CSOs), especially those working on budget advocacy (such as SEND Ghana and the Center for Budget Advocacy) provide technical assistance to parliamentarians during the budget review. The budget and research office of Parliament has documented, in accordance with Article 179 of the 1992 Constitution and SO 147-149, all steps in the review of the annual budget. There are 14 steps, as follows:
The Speaker of Parliament calls the Minister of Finance to present the Government’s financial/fiscal policy; the public is invited.
The Speaker adjourns the debate in accordance with SO140(3) for not less than 3 days.
Sector budget estimates are submitted to sector (MDAs) select committees in accordance with SO140(4); the public is consulted. Input from CSOs and interested groups is solicited.
The Speaker submits revenue and expenditure estimates to the Finance Committee for review; the public is consulted. Input from CSOs and interested groups is solicited.
Select (MDA) committees submit their reports before the Business Committee.
The House (plenary) approves the MDA budgets; if not approved, MDA estimates are referred back to the relevant Select Committees.
Once all MDA estimates are approved, the Minister of Finance submits the Appropriations Bill for a first reading.

110
The Speaker refers the Bill to the Finance Committee for consideration. The public is consulted. Input from CSOs and interested groups is solicited.
The Finance Committee submits its report on the Appropriation Bill before the Parliament.
The Appropriations Bill goes through a second reading, leading to possible amendments, perhaps reflecting inputs from CSOs. Further amendments may be proposed.
Following incorporation of any further amendments, the Bill goes through a third reading.
The Bill is passed into an Act, once approved. If it is not approved, it goes through another review and perhaps further amendments.
PI-18.3 Timing of budget approval
In all the last three completed fiscal years, the legislature passed the Appropriations Act before the start of the new financial year. The year 2016 was an election year, the election to was held in December 2016, and by the dictates of the law, the Ministry of Finance submitted a request to the Parliament to spend from the Consolidated Fund. This was done through an appropriation for the first quarter of the new financial year (2017) in accordance with Section 23 of the PFM Act of 2016 and Article 180 of the Constitution; it was approved before the end of December 2016. Table 3.18 below shows the dates of budget submission to the Parliament and actual approval dates.
Table 3.18: Budget Submission to Parliament and Approval (2014-2018)
Budget Year Draft Budget Submitted to Parliament Budget Adopted by Parliament
2014 11/16/2013 12/31/2013
2015 11/19/2014 12/30/2014
2016 11/13/2015 12/22/2015
2017 11/15/2016 12/29/2016
2018 11/15/2017 12/27/2017
PI-18.4 Rules for budget adjustments by the executive
This dimension assesses the clarity of the rules governing in-year adjustments to the approved budget by the Executive and the extent to which these rules are adhered to.
The rules and procedures for in-year adjustments of the budget by the Executive are clearly outlined under Section 32 of the PFM Act of 2016 (roughly equivalent to the procedures specified in the 2003 FAA and 2004 Financial Administration Regulations [FAR]). Section 32(1)), covers the procedures for virements, which are adjustments within a Ministry that require approval by the Minister of Finance. The exception is for re-allocations within non-wage non-capital expenditure line items, which can be approved by the head of the ministry itself. Such virements cannot be made from wages and salaries to goods and services and/or capital

111
expenditures. Reallocations within the same payroll vote are allowed only where it relates to the same expenditure line item. Virements are allowed from recurrent expenditures to capital expenditures, but not from capital toto recurrent expenditures. The law does not place any limitation on the number and value of virements that can be made in each year.
The PFM Act of 2016 is silent on the number of in-year virements, as well as the limit in terms of value (threshold as a percentage of total original approved budgets) of these virements. This, by extension means that in-year reallocations can take place frequently — irrespective of size. In practice, however, virements are highly restricted. Indeed, the frequency of virements has decreased since the 2012 PEFA assessment.
The amount of the overall budget and the budget of each MDA cannot be increased or decreased except through a Supplementary Appropriations Act. Article 179 of the 1992 Constitution and Section 35 of the PFMA (2016), which is much the same as Section 172 of the FAA (2003), provides the legal basis for supplementary appropriations. In accordance with Section 35 of the PFMA (2016), supplementary estimates shall be submitted before the Parliament when the government realizes the need for additional appropriations and/or a revision of existing appropriations.
One supplementary appropriations bill was passed in February 2016 for an additional expenditure in the amount of GH₵ 865.79 million. Approval was ex-ante. This represented a 2 percent increase from the originally approved budget of GH₵ 44.02 billion.
In-year adjustments to the original budget are fairly transparent, and are communicated to the MDAs; however, they are not entirely predictable as actual implementation still remains a challenge. In comparison to previous PEFA assessments, commitment control has improved as a result of the GIFMIS rollout to all MDAs, thereby limiting to a large extent budget overruns (which lead to Supplementary Appropriations Bills). Nonetheless, some commitments still occur outside the system.
The legislative procedure for approving any supplementary appropriations bill is the same as that for the main budget, except that the estimates are submitted to the plenary and then referred to the Finance Committee for scrutiny before approval by the whole House. The legal framework on supplementary budgets is contained in Article 179(8) & (9) of the 1992 Constitution; a supplementary bill can only be passed by the Parliament when there is a need for an increase in the budget (with additional revenues) to pay for expenditures not originally approved, or for a reduction in the budget in the event of revenue shortfalls.
Ongoing reforms
The PFMRP under the MoF is currently supporting the Parliament in strengthening its technical capacity for budget scrutiny.

112
PILLAR FIVE: Predictability and control in budget execution
PI-19. Revenue administration
This indicator relates to the entities that administer central government revenues, which may include tax administration, customs administration, and the social security (contribution) administration. It also covers agencies administering revenues from other significant sources, such as natural resource extraction. These may include public enterprises that operate as regulators and holding companies for government interests. In such cases, the assessment will require information to be collected from entities outside of the government sector.
Summary of scores and performance table
Indicator/Dimension Score/Scoring criterion Explanation
PI-19. Revenue administration
(Scoring method, M2-AV)
Overall score
D+
19.1 Rights and obligations for revenue measures
Time period: At time of assessment
A
Entities collecting most revenues use multiple channels to provide payers with easy access to comprehensive and up-to-date information on the main revenue obligation areas, as well as on rights including, as a minimum, redress processes and procedures.
The Communications and Public Affairs Department of the Ghana Revenue Authority (GRA) provides tax payers with information about their rights and obligations, as well as redress processes and procedures through a variety of means and over a variety of media.
19.2 Revenue risk management
Time period: At time of assessment
D
Performance is less than required for a C score.
The C score requires entities collecting the majority of revenues to use approaches that are partly structured and systematic for assessing and prioritizing compliance risks for some revenue streams.
The GRA does not have explicit risk-based systems to assess taxpayer compliance.

113
Indicator/Dimension Score/Scoring criterion Explanation
19.3 Revenue audit and investigation
Time period: Last completed FY.
D
Performance is less than required for a C score.
The C score requires entities collecting the majority of revenues to undertake audits and fraud investigations using a compliance improvement plan. They must also complete the majority of planned audits and investigations.
The GRA undertakes audits and fraud investigations, but it does not have a compliance improvement plan.
19.4 Revenue arrears monitoring
Time period: Last completed FY.
D
Performance is less than required for a C score.
The GRA acknowledges significant concerns regarding the completeness and integrity of the reported arrears data. Based on provisional analyses: arrears represented less than 4 percent of annual GRA-administered tax revenues for both 2016 and 2017. Domestic Tax Revenue Division (DTRD) arrears older than 12 months represented 69 percent of total DTRD arrears as of end-2017. There was no aged analysis of DTRD arrears as occurred at end-2016. These data may not be correct, however. The Customs Division (CD) is unable to produce any aged analyses of its arrears.
See PI-3 Revenue Outturn for a table of central government revenues, including the values and proportions contributed by the following constituent revenue streams.
Background
The Ghana Revenue Authority (GRA) administers most central government revenues. It comprises two divisions: the Customs Division (CD), which is responsible for import duties, import VAT, export duties, petroleum taxes and import excise taxes; and the Domestic Tax Revenue Division (DTRD), which is responsible for personal income taxes, corporation taxes, stamp duties, gift taxes, capital gains taxes, rent taxes, mineral royalties, communications service taxes, as well as the domestic VAT and its counterpart, the National Health Insurance Levy (NHIL).
Ghana also has significant petroleum revenues from its interests in the oil and gas sector. These revenues are governed in very clear terms by the Petroleum Revenue Management Act of 2011, as amended in 2015, in terms of flows of money, the various funds to which the revenues must be allocated, the uses to which it must be put, as well as institutional accountability. Although clearly expressed, the governance framework is nevertheless complex with multiple flows, funds, eligible uses and accountabilities.

114
For lifting proceeds, the Ghana National Petroleum Corporation (GNPC) advises both the MoF and the BoG of the revenues to be collected, which are received directly by the BoG. The GRA advises the MoF and the BoG of the revenues regarding petroleum corporate taxes, royalties and surface rentals, which are also banked at the BoG. The BoG first reimburses the GNPC for its expenses and then remits 30 percent of the remainder to finance the GNPC’s carried and participating interest in the oil sector. The remaining 70 percent is regarded as the Petroleum Holding Fund (PHF), of which 70 percent flows to the national budget in the form of the Annual Budget Funding Amount (ABFA). The other 30 percent flows to the Ghana Petroleum Fund (GPF).
A minimum of 70 percent of the ABFA is to be used for public investment expenditures, and a maximum of 25 percent of the ABFA is to be allocated to the Ghana Infrastructure Investment Fund (GIIF). The GPF distributes a futher 70 percent to the Ghana Stabilization Fund (GSF) and 30 percent to the Ghana Heritage Fund (GHF). The GSF in turn distributes 50 percent to the Sinking Fund, 25 percent to the Contingency Fund, with the remaining 25 percent staying in the GSF. The Ghana Audit Service (GAS) publishes annual audit reports on these petroleum funds, including information on all flows and transfers.
Other significant budget revenues include project grants and internally generated funds (IGFs), both of which are managed by the responsible line ministry. Project grants and loans from multilateral and bilateral development institutions are overseen by the MoF’s External Resource Mobilization Division (ERMD). The ERMD receives regular reports on the draw-down and utilization of such resources from the relevant line ministry, development institutions, as well as the CAGD. It then reconciles such information through its Development Cooperation Management Information System (DCMIS). Line ministries manage their own IGFs, which mainly take the form of fees and charges.
PI-19 focuses on the GRA because it administers most of the central government’s revenues.
19.1. Rights and obligations for revenue measures
The Communications and Public Affairs Department (CPAD) of the Ghana Revenue Authority has primary responsibility for providing taxpayers with information about their rights and obligations, as well as redress processes and procedures. It fulfills its mandate through a variety of means, including press conferences, seminars, information leaflets, publications and advertisements over a variety of media including the GRA website, the Customs Division (CD) website, television, radio, newspapers and magazines. It also arranges meetings with various stakeholder institutions to help their members understand the extant, as well as the proposed new rules and regulations.
In 2013, the GRA adopted and published a Client Charter in which it set out its service delivery standards as well as the rights and responsibilities of taxpayers. Both the CD and DTRD have operational manuals that specifically include sections on how to deal with objections and appeals. Stakeholder institutions report that information on taxpayers’ rights and obligations are comprehensive and readily available although, unfortunately, at the time of the fieldwork for this PEFA assessment, the hyperlinks on the GRA website that were intended to facilitate reporting

115
of fraud did not work. Finally, all legislation relating to the various taxes administered by the GRA is readily available on the GRA website. It sets out, in very clear terms, taxpayers’ rights and obligations, as well as the manner in which dissatisfied taxpayers may lodge objections and appeals to the GRA, as well as to the Court of Appeals and the Supreme Court.
19.2. Revenue risk management
Although the GRA has a Risk Management Unit (RMU), there is no risk management program. There is a draft risk management policy which details how the GRA could address the issue of risk management. However, this draft policy has not been finalized and is not yet operational. The RMU produced a 2017 risk management report, but it was comprised more of analyses of trends, as well as an ex-post performance review and internal audit report. It contained recommendations on how to improve revenue administration in both the CD and the DTRD, as well as proposals to introduce robust risk management systems that integrate with both divisions’ information systems — and particularly with the DTRD’s Total Revenue Integrated Processing System (TRIPS™). The most meaningful attempt at a risk management approach is the DTRD’s differentiated treatment of taxpayers based on size. This is done through their Large Taxpayers Office (LTO) in Accra, as well as the Medium Taxpayers Offices (MTOs) and Small Taxpayers Offices (STOs) located throughout the country. Neither the DTRD nor the CD have explicit risk-based systems to assess taxpayer compliance.
19.3. Revenue audit and investigation
The GRA does not have a compliance strategy or a compliance improvement plan, which would be followed by structured audits and fraud investigations. However, the GRA has an ongoing project to develop a compliance management strategy.
The GRA performs audits across all taxes and types of taxpayers. The CD has a Post Clearance Audit Unit that performs ex-post audits of cargo that has cleared customs. This is done on the basis of self-assessments. These audits are selected on the basis of clear risk criteria. The DTRD has audit units in each LTO, MTO and STO, all of which have targets in terms of coverage, and numbers and types of audits to be performed. The MTOs use centrally-prepared risk criteria to identify taxpayers to audit, whereas the LTO aims to cover all taxpayers over a three-year cycle. Local STOs identify taxpayers by applying local knowledge rather than a systematic DTRD-wide approach. There are manuals and methodologies for performing DTRD audits, although it is understood that these are not fully followed.
The GRA includes an Investigation Unit (IU) that is under-staffed and in need of more expertise relating to DTRD-administered taxes. The IU reports directly to the GRA Commissioner General and acts on cases referred to it by the Commissioner General or any GRA Commissioner, Deputy or Assistant Commissioner.

116
19.4. Revenue arrears monitoring
The GRA’s Debt Management, Compliance and Enforcement Unit (DMCE) monitors arrears across the GRA and, consistent with the Internal Revenue Act of 2000 and its Operational Manual, considers any debt due and payable to the GRA as an arrear. The production of debt reports is a fairly new initiative. As of the end of fiscal year 2016, the DMCE had information on total debt stock. However, it had no aged analysis, whereas at the end of fiscal year 2017, the DMCE had information on total debt stock as well as an aged analysis of DTRD debt. Both the CD and each DTRD LTO, MTO and STO submit reports on debt stock to the DMCE. The CD information is extracted from the Ghana Customs Management System (GCMS), which is not aged. The DTRD information currently presented by each LTO, MTO and STO is aged, and is derived from TRIPS™ by those DTRD offices using the system, or from local office systems by those DTRD offices not yet connected to TRIPS™.
The DMCE acknowledges significant concerns regarding the completeness and integrity of its reported arrears and aged analyses. It anticipates that these issues will be addressed once the TRIPS™ is rolled out to all DTRD offices, and when both the GCMS and the TRIPS™ are linked to the GRA’s proposed data warehousing, Business Intelligence System. Acknowledging the issues regarding data quality, the stock of revenue arrears (that is, debt) reported by the DMCE as of end-2016 represented 4 percent of total 2016 GRA-administered tax revenues. As of end-2017, this being the first fiscal year-end for which the DMCE had aged analyses on DTRD arrears, the stock of revenue arrears represented 3.5 percent of total 2017 GRA-administered tax revenues. DTRD arrears older than 12 months represented 69 percent of total DTRD arrears. These percentages have little meaning, however, if the data on which they are based are questionable. Also, as of end-2017, institutional debt, that is, arrears from fully-owned SOEs, represented 66 percent of total GRA debt stock. These SOEs reportedly have difficulties discharging their tax obligations partly because they have difficulties in collecting revenues from other SOEs.
PI-20. Accounting for revenues
This indicator assesses procedures for recording and reporting revenue collections, consolidating the revenues collected, and reconciling tax revenue accounts. It covers both tax and non-tax revenues collected by the central government. The assessment focuses on the accounting of revenues administered by the Ghana Revenue Authority, including petroleum fund revenues because these revenues represent most of the central government’s revenues.
Summary of scores and performance table
Indicator/Dimension Score/scoring criterion Explanation
PI-20 Accounting for revenue
(M1-WL):
Overall score
C+

117
Indicator/Dimension Score/scoring criterion Explanation
20.1 Information on revenue collections
Time period: At the time of assessment
A
A central agency obtains revenue data at least monthly from entities collecting all central government revenues. This information is broken down by revenue type, and is consolidated into a report.
The GRA prepares monthly consolidated reports on all central government revenues, and shares such reports with agencies involved in the collection and administration of revenues, including the MoF, the CAGD and the BoG.
20.2 Transfer of revenue collections
Time period: At the time of assessment.
B
Entities collecting most central government revenue transfers to the Treasury and other designated agencies on, at least, a weekly basis.
Most GRA-administered revenues are collected from taxpayers by two commercial banks which remit collected funds within 48 hours to the Treasury Single Account administered by the CAGD. Evidence shows that 79.1% of total revenues are transferred within 48 hours to the Treasury
20.3 Revenue accounts reconciliation
Time period: At the time of assessment
C
Entities collecting most government revenues undertake complete reconciliation of collections and transfers to the Treasury and other designated agencies at least annually, within 2 months of the end of the year.
The GRA and the CAGD perform detailed reconciliations of transfers to the Treasury Single Account within one month of every month-end. However, this reconciliation does not include assessments and arrears, as would be required to achieve a higher PEFA score.
See PI-3 Revenue Outturn and PI-19 Revenue Administration for a table and narrative description of central government revenues.
20.1. Information on revenue collections
The GRA prepares monthly consolidated reports on all central government tax revenues. These reports include tables showing revenues collected against targets for each tax type, together with a narrative discussion of the reasons for the performance. The reports also include reconciliations between the amounts collected as reported by the GRA’s CD and DTRD, with the amounts banked by the BoG and recorded by the CAGD. Finally, these monthly reports include revised revenue projections for the remainder of the year. These GRA reports are also shared with all institutions involved in the collection and administration of revenues, and they are presented in the monthly meetings of the Revenue Sub-Committee of the Economic Policy Coordinating Committee (EPCC-RSC).
20.2. Transfer of revenue collection
Tax revenues administered by the GRA, other than those related to petroleum funds, are paid by taxpayers into the GRA Zero-Balance Accounts (ZBAs) held at two commercial banks, the Ecobank and the GCB Bank. These ZBAs, operated by the commercial banks , are not regarded as part of the Treasury Single Account (TSA). As such, they do not fall under the control of the

118
CAGD. After 48 hours, revenues deposited into these commercial bank accounts are transferred into the GRA Revenue Transit Accounts (GRTAs) that form part of the TSA. These funds are held at the BoG and administered by the CAGD. The reason for the 48-hour delay in transferring funds from the commercial banks to the GRTAs is to compensate the commercial banks for their services because they make no explicit charges for their services as revenue collection agents of the GRA. Petroleum revenues are collected and transferred, as described in the narrative description for PEFA performance indicator, PI-19 Revenue Administration. The Ghana Audit Service 2016 annual audit report on these petroleum funds found that some of these funds were transferred with some delays.
Tax and non-tax revenues other than petroleum-related revenues deposited into GRTAs amounted to 79.1 percent of total revenues in 2016 (according to the Fiscal Data report for 2016). The Fiscal Data report (on MoF website) indicates a provisional outturn for tax revenue collections in 2016 of GHC25,728.66 million. Of this, petroleum-related tax revenues not paid into the GRTAs were GHC 1026.74 million. Lodged non-tax revenues were GHC 1514.65 million, of which GHC490.50 million were petroleum-related and not paid into the GRTAs. Thus total revenues of GHC25,726.07 million were paid into the GRTAs ((25728.66-1026.74=24701.92) + (1514.65-490.5=1024.15)). Total overall revenue amounted to GHC 32,537.45 million. Thus, revenues paid into the GRTAs represented 79.1 percent of total revenues collected in 2016
20.3. Revenue account reconciliation
Every month, the CAGD and the GRA exchange detailed information and perform detailed reconciliations between the amounts collected by the GRA, banked by the BoG and recorded by the CAGD. As discussed above under PI-20.1, the GRA prepares monthly consolidated reports on all central government tax revenues. These reports include reconciliations between the amounts collected as reported by the GRA’s Customs Division and the DTRD with the amounts banked by the BoG and recorded by the CAGD. These GRA reports are then shared with all institutions involved in the collection and administration of revenues. They are also presented in the monthly meetings of the EPCC-RSC that include representatives of the GRA, the MoF, the CAGD, the BoG, as well as the two commercial banks involved in revenue collection. This forum provides the institutions with a further opportunity to raise issues regarding revenue account reconciliations.
These revenue account reconciliations do not include assessments and arrears, which reflects wider issues with the GRA’s management information systems as discussed earlier with respect to PEFA performance indicator PI-19.4.
PI-21. Predictability of in-year resource allocation
This indicator assesses the extent to which the central Ministry of Finance is able to forecast cash commitments and requirements, and to provide reliable information about the availability of funds to budgetary units for service delivery.

119
Summary of scores and performance table
Indicator/Dimension Score /scoring criterion Explanation
Predictability of in-year resource allocation
(M2-AV scoring method)
C+
21.1 Consolidation of cash balances
Time period: Time of assessment
C
Most cash balances are consolidated on a monthly basis.
At least 75 percent of central government bank balances are consolidated daily. There still remain over 2,500 other government accounts, a multitude of donor-financed project accounts, as well as statutory funds that are outside of the TSA framework.
21.2 Cash forecasting and monitoring
Time period: Last completed FY
C
A cash flow forecast is prepared for the fiscal year.
The MoF prepares consolidated cash flow plans annually based on inputs from the MDAs; these cash plans are not updated on the basis of actual cash flows.
21.3 Information on commitment ceilings
Time period: Last completed FY
B
Budgetary units are provided with reliable information about commitment ceilings in advance on at least a quarterly basis.
The MoF issues expenditure commitment warrants iin advance on a quarterly basis, providing the MDAs with sufficient and reliable information for expenditure commitments.
21.4 Significance of in-year budget adjustments
Time period: Last completed FY.
B
Significant in-year adjustments to budget allocations take place no more than twice in a year, and are done in a fairly transparent way.
The frequency of virements has fallen in recent years.
Only one Supplementary Appropriations bill was passed by the Parliament in February 2016. This increased the MDAs’ original expenditures by 2 percent in aggregate. This was fairly transparent, but not entirely predictable
PI-21.1 Consolidation of cash balances
The TSA provides an opportunity for the MoF, through the CAGD, to view and consolidate cash balances on a daily basis, and to deal with cash management challenges including high debt servicing costs and high Treasury bill rates. Over the years, these have contributed to reduced fiscal space, thereby leading to ineffective resource allocation and inefficient service delivery.

120
The MoF formally launched the TSA in August 2017, as noted in the September 2017 ‘Treasury News’ prepared by the CAGD30. Leading up to that, in a letter dated December 31, 2015, the Deputy CAG in charge of Treasury had instructed the Governor of the BoG not to honor requests from the MDAs and MMDAs to transfer funds from the sub-Consolidated Fund accounts held by them in commercial banks to other accounts in the commercial banks. A circular dated December 9, 2015 (reference number T1/2015) was sent to all MDAs to that effect. This saw the closure and transfer of 36 government accounts in commercial banks to new government accounts held in the BoG. Officials from the CAGD Treasury confirmed that the practice of the MDAs in transferring funds from sub-CF accounts in commercial banks to other accounts in commercial banks had been significantly reduced as a result of the rollout of the TSA — except for those accounts that had yet to be brought into the TSA framework. By December 2017, a total of GH₵ 143.9 million (US$ 13,752) had been transferred to the BoG under the TSA.
At the time of the PEFA team’s field visit (February-March 2018), 2,499 central government bank accounts — including the Treasury Main Account representing an estimated 75 percent of central government cash flows — had been linked to the TSA framework; these balances are consolidated daily. The CAGD does not have full information regarding the balances of Internally Generated Funds (IGF) held by the MDAs in commercial banks. There are over 2,500 other government accounts held by the MDAs in commercial banks, as well as a significant number of donor-financed project accounts that remain outside the TSA framework. As such, they do not form part of the daily consolidation process. Furthermore, the TSA does not cover all central government foreign exchange accounts, except for 22 that are directly under the Treasury. Statutory funds (13 in number) are also not covered, although it is unlikely they would initially be covered, as these are separate legal entities. The TSA does not include cash balances (imprest funds) held by the MDAs. Furthermore, the MDAs holding 238 accounts in commercial banks have not yet complied with the directive from the CAGD to close these accounts and transfer all balances to the Bank of Ghana. The amounts of the bank balances are not known.
Improvements in the consolidation of GoG-owned cash balances have recently occurred; e.g in the functioning of the TSA.. This has made it possible to transfer some government bank accounts to the BoG, providing the government with a better cash management framework.
PI-21.2 Cash forecasting and monitoring
The MDAs prepare and submit annual cash flow plans to the MoF, which prepares a consolidated cash flow forecast based on inputs from the MDAs’ annual cash flow plans. Neither the MDAs nor the MoF update these cash flow forecasts based on actual cash flows. The cash flow plans are rudimentary, prepared simply by equally dividing the annual cash needs by twelve, or equally by quarter. Interactions with officials from the MDAs suggest that there is no motivation for updating these cash plans because the MoF fails to adhere to these cash
30 An initial move toward establishing a TSA was made at the time of the 2012 PEFA assessment through the consolidation of some GoG-held bank accounts held at the BoG.

121
forecasts. Payments are made when cash is available (that is, cash rationing). The MoF/CAGD determines the prioritization of payments of invoices (refer to PI-21.3 below).
Cash flow forecasting in support of the preparation of cash management plans for the year has little meaning31. The practice of weekly cash management committee meetings still exists, but the purpose of the meetings is to review cash needs over the next week by considering inflows from the GRA and outstanding payables thereto. This is done in order to decide on borrowing requirements and to advise the Minister of Finance accordingly. In an environment of budgets being executed on a cash rationing basis, forecasts of cash flows for more than a short period of time have little meaning.
PI-21.3 Information about commitment ceilings
The Ministry of Finance issues two expenditure commitment warrants; one known as the specific warrant for capital (infrastructure) expenditure, and the second known as the general warrant for goods and services. Whereas the goods and services expenditure commitment warrant is released quarterly to the MDAs, the specific warrant has no particular frequency. Rather, it is done as and when necessary for capital expenditure commitments.
The goods and services expenditure commitment warrant is issued timely and reliably for each quarter. The advantage of this is eroded, however, by the possibility of non-timely availability of cash to pay for the invoices submitted. In 2012, the time horizon for expenditure commitment was one month, but it could be shortened or delayed.. The first quarter 2017 warrant was issued on January 17, 2017, thereby giving the MDAs sufficient time and reliable information for expenditure commitments. It would seem that the longer time horizon represents an improvement. However, as indicated under PI-21.2 above, the challenge has been the non-timely release of actual cash for payment of expenditures.
PI-21.4 Significance of in-year budget adjustments
In-year adjustments to the original budget are fairly transparent and are communicated to the MDAs. However, they are not entirely predictable as the actual implementation still remains a challenge. In comparison to previous assessments, commitment control has improved as a result of the GIFMIS rollout to all MDAs, thereby reducing the request for virements to a large extent. As noted under PI-18.4, the approval of virements by the MoF was highly restricted in 2016.
One supplementary appropriations bill was passed in February 2016 for an amount of GH₵ 865.79 million. In terms of significance, this represented a 2 percent upward adjustment of the originally approved budget of GH₵ 44.02 billion.
31 The team benefited from a meeting with the Cashier General (in the CAGD), who explained how the budget was executed each month. In the context of the amount of cash available often being less than the value of invoices submitted through the GIFMIS, decisions had to be made on what invoices had to be paid now, and what invoices could be paid later.

122
Ongoing reforms
With regard to the TSA, the CAGD is still in the process of closing the multiplicity of central government bank accounts and bringing them under the TSA framework. This includes the donor-financed projects bank accounts.
PI-22 Expenditure arrears
This indicator measures the extent to which there is a stock of arrears, and the extent to which a systemic problem is being addressed and brought under control.
Summary of scores and performance table
Indicator/Dimension Score/scoring criterion Explanation
PI 22: Expenditure arrears
(Scoring method: M1-WL)
D+
22.1 Stock of expenditure arrears
Time period: Last 3 completed FY for which data available. Data for FY 2017 only available up to September 2017
D
The stock of expenditure arrears is more than 10 percent of total expenditures in at least two of the last three completed fiscal year.s
The stock of expenditure arrears was 2.4 percent and 18.7 percent of total actual expenditures in FY2015 and FY2016, respectively, averaging 10.55 percent of total actual expenditures. The stock of arrears does not include arrears in VAT refunds; therefore, arrears could be substantially higher than reported.
22.2 Expenditure arrears monitoring
Time period. At the time of assessment.
B
Data on the stock and composition of expenditure arrears is generated quarterly within eight weeks of the end of each quarter.
The Public Expenditure Monitoring Unit (PEMU) of the MoF generates quarterly statements of outstanding payables. In addition to this, the CAGD also generates a list of outstanding payables annually through the GIFMIS at any given time.
PI-22.1 Stock of expenditure arrears
The Government of Ghana defines "arrears" as any payment which has not been made on its due date (refer to Section 102 of the PFM Act of 2016 - Interpretations).
As outlined in Table 3.19 below, the stock of end-year expenditure arrears increased from GH₵ 919.16 million (2.4 percent of total expenditures) in 2015 to GH₵ 8.39 billion (18.7 percent of total expenditures) in 2016. However, most of this increase represents the result of a special audit conducted by the Auditor General on all outstanding commitments (payables) made by the MDAs outside of the GIFMIS. The report of the audit (dated January 23, 2018) certified a total of

123
GH₵ 6.33 billion of such commitments (payables) on the basis of supplier invoices outstanding at the end of 2016. 32
Reasons for the build-up of arrears include large, unbudgeted wage and salary increases, MDAs committing funds outside of the GIFMIS, inadequate cash releases from the MoF, and revenue shortfalls. The revenue shortfalls were partly due to declines in commodity prices, and shortfalls in development partner releases for budget support. Arrears may have also arisen from contractors bringing planned work forward from next year to this year, with payments certificates being submitted earlier than expected. The work planned for next year would not have been registered in the GIFMIS.
Preliminary figures obtained from the CAGD show that expenditure arrears (outstanding payables within the GIFMIS) stood at GH₵ 4.89 billion as of the end of September 2017, of which 53 percent related to suppliers only. This may exclude arrears created by the MDAs outside of the GIFMIS, which may not be known unless GAS conducts another survey similar to the one it conducted on the 2016 arrears. The stocks of expenditure arrears are not yet age-profiled, although it should be possible to derive an age profile of payables in the GIFMIS on the basis of invoices submitted.
The stock of arrears, as noted above, does not include overdue VAT refunds to suppliers, businesses, and corporate entities. Representatives of the Association of Ghana Industries met by the team indicated that these are substantial in relation to the provisions of the VAT law (Act 897, 2013, section 50(2), which states that a refund can be claimed once the excess of credits over debits exceeds 3 months). 33
Arrears are very high. The special audit conducted by the Auditor General revealed that most MDAs still make commitments outside of the GIFMIS, thereby creating huge expenditure arrears.
Table 3.19: Analysis of the stock of expenditure arrears (cedis)
Particulars 2015 2016
Stock of expenditure arrears (as per annual audited accounts of the
Consolidated Fund)
919,166,885 2,056,734,967
Stock of expenditure arrears (as per the special audit – the MDAs
liabilities report)
- 6,331,326,592
Total stock of arrears 919,166,885 8,388,061,559
Total expenditure 38,574,158,143 44,791,386,715
Percentage of total arrears to total expenditure 2.4% 18.7%
32 Arrears data for FY 2017 was available only up to September. The assessment is therefore based on FYs 2015-
2016.
33 The Budget includes a budget for VAT refunds. This seems very peculiar, as VAT refunds are a ‘negative’ revenue and have to be paid according to the provisions of the VAT law. It would seem that they should not be included in the Appropriations Act.

124
Sources: GoG Consolidated Annual Financial Statements FY2015 and FY2016; MDA liabilities report dated January 23, 2018.
PI-22.2 Expenditure arrears monitoring
At present, the GIFMIS can generate outstanding payable (expenditure arrear) reports at any given time on the basis of approved invoices submitted to it. The Public Expenditure Monitoring Unit of the MoF can also generate quarterly outstanding payables statements with inputs from the MDAs. Section 79(1)(b) of the PFMA (2016) requires all spending units to submit quarterly financial statements (which would include payables) to the Controller and Accountant General; however, not all MDAs comply with this legal provision. The CAGD generates a list of outstanding payables annually, which feeds into the annual financial statements. The stock of payables is, however, not age-profiled.
The GIFMIS expenditure commitment control function is operational (PI-25.1) and capable of limiting expenditures to approved commitment warrants; nevertheless, commitments are still being made outside of the GIFMIS. Section 98(1)(b) of the PFM Act of 2016 makes it an offence punishable by law for any spending officer in the public service to commit and pay for expenditures outside of the GIFMIS, an improvement from the FAA of 2003. In principle, if all proposed expenditure commitments were entered into the GFMIS and approved, outstanding payables should not arise except for a short period of time while the payable is being processed for payment. In practice, however, arrears arise because expenditure commitments are made without the approval within the GIFMIS. The result is that there is no budget for the commitment. In other cases, the commitments are approved within the GIFMIS, but there is insufficient cash to pay the ensuing payables.
The GAS reports mention instances of the MDAs making commitments outside of the GIFMIS. For instance, the 2016 Auditor General report on the Consolidated Fund noted that the MoF transferred GH₵ 56.36 million to the Electoral Commission and the Ministry of Youth and Sport outside of the GIFMIS, a practice which has been consistently raised by the Auditor General. In future, the Auditor General has indicated that all expenditures outside the GIFMIS will be disallowed, and the responsible public officer surcharged accordingly.
The rollout of the GIFMIS has improved the monitoring and recording of the stock of expenditure arrears. However, the GIFMIS has not yet been fully rolled out to all budgeted central government units (still not fully operational in the GoG district offices). As such, the potential for the MDAs to make expenditure commitments outside of the GIFMIS still exists, once again leading to payments arrears.
Ongoing reforms
The PFM Act of 2016 now makes it illegal for expenditures to be committed outside GIFMIS. Such expenditures will be disallowed by the Auditor General and the responsible public officer surcharged accordingly. The difference between the new PFM Act of 2016 and the FAA of 2003 is that the new Act specifically mentions the GIFMIS as the only government financial

125
management system to be used for expenditure commitments. The GIFMIS was not in place in 2003. Expenditure commitments outside of the budget were also illegal under the FAA. However, with manual systems still being used to control commitments, it was easier to make commitments outside of the budget.
The Government is developing new PFM regulations to further strengthen the monitoring mechanism of expenditure arrears.
PI-23. Payroll controls
This indicator assesses how the payroll of the central government is managed, how payroll changes are handled, and how payroll consistency with personnel records management is achieved. Wages for casual labor and discretionary allowances that do not form part of the payroll system are included in the assessment of non-salary internal controls.
Summary of scores and performance table
Indicator/Dimension Score Explanation
PI-23 Payroll controls
(M1-WL scoring method)
C+
23.1 Integration of payroll and personnel records
Time period: At the time of assessment
C
Reconciliation of the payroll with personnel records takes place at least every six months. Staff hiring and promotion is checked against the approved budget prior to authorization.
This dimension comprises two sub-dimensions:.
(i) The personnel records are fully integrated with the payroll record, and updates on personnel records are reflected immediately on the payroll record. By itself, this sub-dimension would score ‘A’.
(ii) In principle, hirings and promotions proposed by MDAs are checked by the Office of the Civil Service for consistency with approved staff positions. This is a manual process, however, and runs the risk of people being hired who are not on the staff/establishment list. Staff hiring and promotions are, in practice, not fully controlled by a list of approved staff positions.
The relatively new Human Resource Management Information System (HRMIS) provides such control, but as yet covers less than 50 percent of the civil service. It provides for automatic checking for consistency between changes in personnel records and the staff/ establishment list. As yet, HRMIS covers less than 50 percent of the wage and salary bill. .

126
Indicator/Dimension Score Explanation
23.2 Management of payroll changes
Time period: At the time of assessment
C
Personnel records and payroll are updated at least quarterly and require some retroactive adjustments.
Most of the changes to personnel data are updated within a month. However, certain changes. including new employees in some MDAs. may take 2-5 months. Retroactive adjustments are not uncommon.
23.3 Internal control of payroll
Time period: At the time of assessment
B
The authority and basis for changes to personnel records and the payroll are clear and adequate, ensuring high integrity of data.
The monthly payroll validation process through the Electronic Salary Payment Voucher (E-SPV), the pre-audit procedure by the CAGD’s Internal Audit Unit, additional verification of personnel input data by the PDD of the CAGD, and the audit trail features within the Integrated Payroll and Personnel Database (IPPD) are adequate to ensuring the high integrity of data.
23.4 Payroll audit
Time period: Last three completed FYs.
B
A payroll audit covering all central government entities has been conducted at least once in the last three completed fiscal years (whether in stages or as one single exercise).
Payroll audit is conducted annually as part of the regular audit of the GAS. The GAS audit covers 95 percent of the budget in a fiscal year, as indicated in PI-30. The Internal Audit Division of the CAGD conducts pre-audits monthly before the final payroll is issued. Internal Audit units of the MDAs also conduct payroll audits. A separate payroll audit is conducted by other consultants.
23.1. Integration of payroll and personnel records
The Integrated Payroll and Personnel Database, version 2 (IPPD2), has been in place since 2009. The system has two components: payroll and personnel management. In the case of the latter, the MDAs update their personnel records manually through the Payroll Processing Section (PPS) . Any changes (e.g. new hires, promotions) are required to be approved by this Office (also through a manual process) prior to the submission of the updated records to the Payroll Processing Department (PPD) CAGD, which feeds these changes into the IPPD2. Some of the large MDAs do this directly through the PPD, as they have their own PPS. Changes in records once fed into IPPD2 thus automatically lead to changes in the monthly payroll.
Initiated in 2012 as a component of the GIFMIS, the HRMIS was introduced. It is replacing the manual functions of the PPSs. Seven ministries and their departments and agencies are now using the new HRMIS. The roll-out process is ongoing. Currently, the HRMIS covers less than 50 percent of the payroll; the payroll (which is very large) of Ghana’s Education Services is not yet covered by the HRMIS.
The implementation of the HRMIS has three phases. The first phase includes position management, and employee profile and employee cost management. Phases 2 and 3, which have yet to be implemented, are expected to contain additional features, including HR planning, recruitment and selection, absence management, termination, posting and performance evaluations.

127
It is the first phase that is the most relevant for assessing this dimension, as the HR database in the HRMIS is electronically linked with the staff establishment list maintained by the Public Service Commission (PSC). The HRMIS enables quick reconciliation of the personnel records with the staff/establishment list maintained by the PSC. Therefore, it is not possible for a MDA connected to HRMIS to hire someone who is not on the staff list. Under the manual processes still in place under the Head of the Office of Civil Service, there is no such automatic check.. The HRMIS integrates with the IPPD2 through the GIFMIS. Changes made in HR records are automatically reflected in the payroll system. In time, the HRMIS will replace the PPS as more MDAs, including their district offices, are linked to it.
23.2. Management of payroll changes
In most cases, MDA personnel units update existing personnel record changes within one month, which should be reflected in the next salary payment. However, for some of the MDAs, it takes 2-5 months for new employees to receive their first salary payments. This is due to MDA delays in data entry, delays in submission of input forms to the CAGD by the MDAs, and delays in biometric registration34. The CAGD does not pay unless data inputs in the IPPD2 are verified against input forms submitted by the MDAs and is also verified by biometric registration. Data entry errors at the PPS require approval to be corrected by the Public Service Commission (PSC). For those departments and agencies which do not have the PPS on their premises, they have to travel to their ministries or the PPS to which they are assigned. As a result, arrears payments are not uncommon35. The rollout of the HRMIS is expected to allow the MDAs to process changes in a timely way. The system will allow the MDAs to attach e-Forms instead of printed copies, which can often take a long time to reach the CAGD for verification.
The roll out of the HRMIS to all the MDAs and MMDAs is expected to minimize the delays in updating the payroll. Regardless of the extent of automation, the commitment and adequate ownership of the head of a management unit to ensure the timely recording of changes in personnel records is the key factor in minimizing irregularities within the payroll system.
23.3. Internal control of payroll
The function of recording and updating personnel data is segregated from the preparation of the payroll. Access to the personnel and payroll databases is restricted by password. The introduction of the Electronic Salary Payment Voucher (E-SPV) in 2014 has helped to strengthen controls, although it has its limitations. There is no written security strategy or policy. Every month, the PPD of the CAGD prepares a test payroll and disseminates it to the Management Units through its web platform called the Electronic Salary Payment Voucher (E-SPV). The E-SPV, introduced in 2014, operates in all 10 regions. The head of the MU and designated personnel are
34 Biometric (finger print) registration was started in 2012 by the Ministry of Finance. All staff in the payroll of the CAGD are registered. The biometric database is a stand-alone feature. The PDD sends new employees to the MoF for verification of registration on the biometric database. 35 Average monthly arrears between January 2017 and June 2017 represent 8 percent of the total salaries paid during the month (for mechanized payroll). This is based on a calculation from the CAGD monthly payroll report.

128
required to review and validate36 the monthly test payroll uploaded onto the E-SPV. The Head of MU should indicate valid staff members and anomalies, if any, taking into account staff members, new staff members, staff who have separated or who have been transferred elsewhere within the public service .
The PDD does not pay invalidated employees. The validation process has decreased the amount and frequency of payments of unearned salaries to separated employees. More than 86 percent37 of MUs perform the validation. Contributing factors to the failure to validate E-SPV by some MU heads include misalignment of some MUs between the payroll data and personnel records, and the inability of some MU heads to follow the due process.
As the E-SPV is not integrated with the payroll and HR records, staff who have been invalidated in the previous month’s payroll may appear again in the following month test payroll — unless personnel records are updated. As the HRMIS is not yet integrated with the GIFMIS, the GFMIS does not prevent a budget override. Monthly payroll statistics reports show significant budget overruns. The anticipated integration of the HRMIS with the GIFMIS is expected to incorporate payroll expenditure controls.
Government staff have access to viewing their monthly pay slip from a web platform called E-Payslip introduced in 2015.
The HRMIS database does not allow new personnel to be added unless the position is vacant. Respective MDAs using the HRMIS are in charge of managing their employees. That said, the PSC has the mandate to approve all changes prior to payroll processing.
The payroll system provides an audit trail, which is reviewed by the PDD team to see if there are any exceptions and/or anomalies. The Internal Audit Division of the CAGD conducted a risk assessment of the IPPD and plans to use the Interactive Data Extraction Audit (IDEA) to validate payroll on a regular basis. Inclusion in the biometric register is also a prerequisite for government staff to receive payment, even if they are fully included in the records of the IPPD or HRMIS.
23.4. Payroll audit
The GAS conducts payroll audits as part of its MDA audit. In addition, a consulting firm conducted a separate payroll audit in 3 selected regions, 6 districts and 824 management units in February 2017. MDA internal audit units also conduct payroll audits. Most of the payroll irregularities are related to the payment of unearned salaries for separated employees. Payroll irregularities amounted to GH¢ 11.43 million (2014), GH¢ 1.59 million (2015) and GH¢ 4.38 million (2016). The audit of the GAS includes verification of payrolls against head counts and HR records.
36 The Financial Administration Regulation 2004 (section 293) requires MUs to validate the payroll. 37 Payroll Report for the Month of September 2017.

129
Recent measures taken by the GoG to strengthen payroll control
Strengthening payroll control is one of the structural reforms emphazised as critical under the Extended Credit Facility (ECF), the 3-year program agreed to between the IMF and the GoG in 2015. The new Government that came to power in January 2017 has placed an increased emphasis on the importance of the ECF. As mentioned in the 4th ECF Review report, by April 2017, the Government had suspended the salaries of 26,589 employees who had not been biometrically registered with the Social Security and National Insurance Trust (SSNIT). The salaries of the bulk of these employees were subsequently reinstated following submissions from the SSNIT.38 Another reform underway is the linking of the payrolls of three public universities with the GFMIS.
PI-24. Procurement
This indicator examines key aspects of procurement management. It focuses on the transparency of procurement arrangements, and emphasizes open and competitive procedures, the monitoring of procurement results, and access to appeal and redress arrangements.
This indicator looks only at public procurement according to GoG laws, meaning only the procurement activities conducted directly by government’s MDAs. It does not look at procurement methods used by donor agencies for the projects/programs they are financing, even if these come under the GoG’s budgets. In Ghana, donor agencies tend to use their own procurement methods rather than GoG’s methods.
Indicator/dimension Score/Scoring criterion Explanation
PI 24: Procurement
(Scoring method: M2-AV)
C+
24.1 Procurement monitoring
Time period: Last completed FY
D
Performance is less than required for a C score
.
The database of the Public Procurement Authority (PPA) captures 70 percent (by value) of public procurement; the information provides details of contract awards, the value of the contract, the method of procurement, and the successful bidder.
However, the information from the PPA database is provisional for FY2016 and FY2017. A score of "C" would have been approrpiate if the information had been independently verified by PPA or the Auditor General
38 Paragraph 36 of the Memorandum of Economic and Financial Policies (MEFP), Appendix I of the IMF’s 4th Review of the ECF program, September 2017.
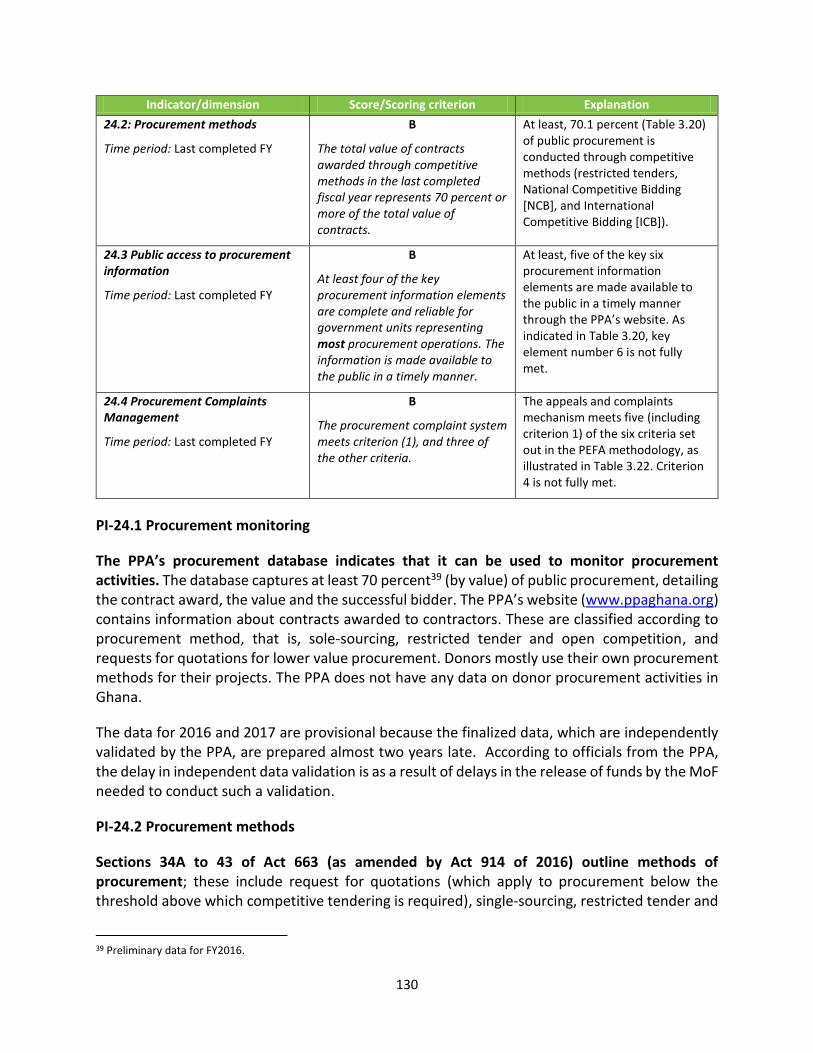
130
Indicator/dimension Score/Scoring criterion Explanation
24.2: Procurement methods
Time period: Last completed FY
B
The total value of contracts awarded through competitive methods in the last completed fiscal year represents 70 percent or more of the total value of contracts.
At least, 70.1 percent (Table 3.20) of public procurement is conducted through competitive methods (restricted tenders, National Competitive Bidding [NCB], and International Competitive Bidding [ICB]).
24.3 Public access to procurement information
Time period: Last completed FY
B
At least four of the key procurement information elements are complete and reliable for government units representing most procurement operations. The information is made available to the public in a timely manner.
At least, five of the key six procurement information elements are made available to the public in a timely manner through the PPA’s website. As indicated in Table 3.20, key element number 6 is not fully met.
24.4 Procurement Complaints Management
Time period: Last completed FY
B
The procurement complaint system meets criterion (1), and three of the other criteria.
The appeals and complaints mechanism meets five (including criterion 1) of the six criteria set out in the PEFA methodology, as illustrated in Table 3.22. Criterion 4 is not fully met.
PI-24.1 Procurement monitoring
The PPA’s procurement database indicates that it can be used to monitor procurement activities. The database captures at least 70 percent39 (by value) of public procurement, detailing the contract award, the value and the successful bidder. The PPA’s website (www.ppaghana.org) contains information about contracts awarded to contractors. These are classified according to procurement method, that is, sole-sourcing, restricted tender and open competition, and requests for quotations for lower value procurement. Donors mostly use their own procurement methods for their projects. The PPA does not have any data on donor procurement activities in Ghana.
The data for 2016 and 2017 are provisional because the finalized data, which are independently validated by the PPA, are prepared almost two years late. According to officials from the PPA, the delay in independent data validation is as a result of delays in the release of funds by the MoF needed to conduct such a validation.
PI-24.2 Procurement methods
Sections 34A to 43 of Act 663 (as amended by Act 914 of 2016) outline methods of procurement; these include request for quotations (which apply to procurement below the threshold above which competitive tendering is required), single-sourcing, restricted tender and
39 Preliminary data for FY2016.
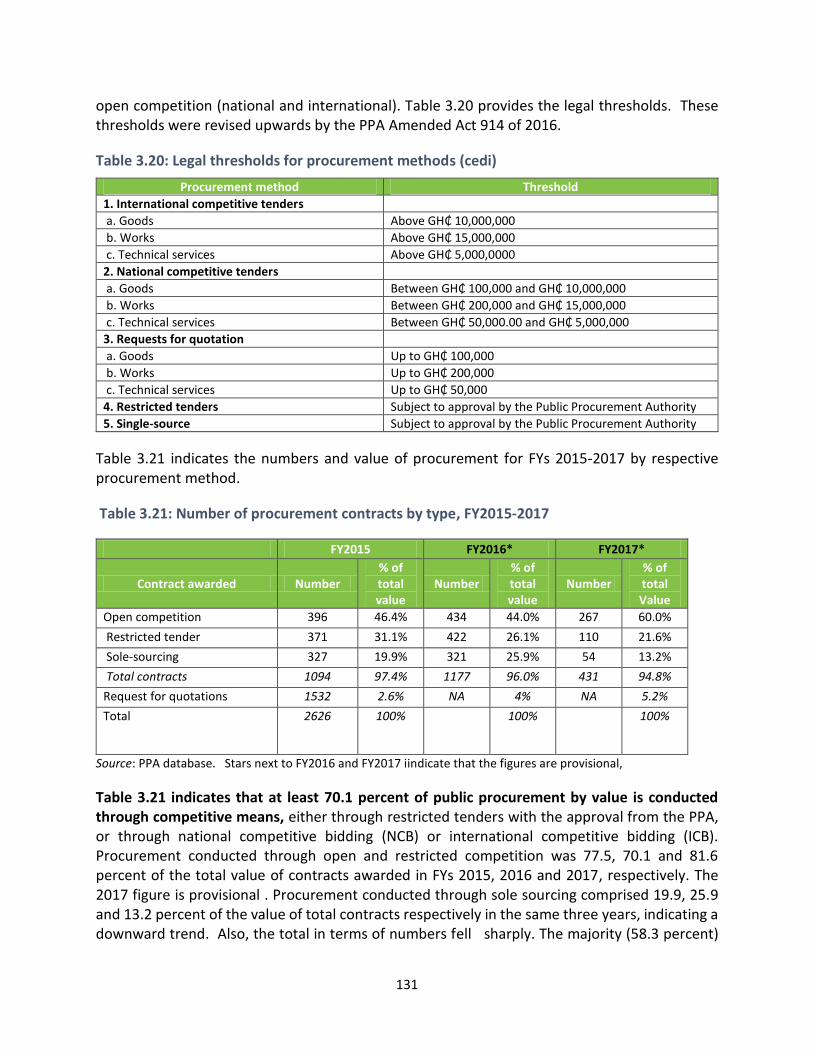
131
open competition (national and international). Table 3.20 provides the legal thresholds. These thresholds were revised upwards by the PPA Amended Act 914 of 2016.
Table 3.20: Legal thresholds for procurement methods (cedi)
Procurement method Threshold
1. International competitive tenders
a. Goods Above GH₵ 10,000,000
b. Works Above GH₵ 15,000,000
c. Technical services Above GH₵ 5,000,0000
2. National competitive tenders
a. Goods Between GH₵ 100,000 and GH₵ 10,000,000
b. Works Between GH₵ 200,000 and GH₵ 15,000,000
c. Technical services Between GH₵ 50,000.00 and GH₵ 5,000,000
3. Requests for quotation
a. Goods Up to GH₵ 100,000
b. Works Up to GH₵ 200,000
c. Technical services Up to GH₵ 50,000
4. Restricted tenders Subject to approval by the Public Procurement Authority
5. Single-source Subject to approval by the Public Procurement Authority
Table 3.21 indicates the numbers and value of procurement for FYs 2015-2017 by respective procurement method.
Table 3.21: Number of procurement contracts by type, FY2015-2017
FY2015 FY2016* FY2017*
Contract awarded Number % of total value
Number % of total value
Number % of total Value
Open competition 396 46.4% 434 44.0% 267 60.0%
Restricted tender 371 31.1% 422 26.1% 110 21.6%
Sole-sourcing 327 19.9% 321 25.9% 54 13.2%
Total contracts 1094 97.4% 1177 96.0% 431 94.8%
Request for quotations 1532 2.6% NA 4% NA 5.2%
Total 2626 100% 100% 100%
Source: PPA database. Stars next to FY2016 and FY2017 iindicate that the figures are provisional,
Table 3.21 indicates that at least 70.1 percent of public procurement by value is conducted through competitive means, either through restricted tenders with the approval from the PPA, or through national competitive bidding (NCB) or international competitive bidding (ICB). Procurement conducted through open and restricted competition was 77.5, 70.1 and 81.6 percent of the total value of contracts awarded in FYs 2015, 2016 and 2017, respectively. The 2017 figure is provisional . Procurement conducted through sole sourcing comprised 19.9, 25.9 and 13.2 percent of the value of total contracts respectively in the same three years, indicating a downward trend. Also, the total in terms of numbers fell sharply. The majority (58.3 percent)

132
of procurement in terms of numbers was conducted in FY 2015 through price quotation and minor value procurement. In terms of value, the amount was 2.63 percent of total procurement.
PI-24.3 Public access to procurement information
At least five key procurement information elements are made available to the public in a timely manner through the website (www.ppaghana.org). In addition, some MDAs also publish some key procurement information on their individual websites (for instance: http://www.moh.gov.gh/tenders). Table 3.22 provides a detailed narrative of key procurement information made available to the public. Public access to procurement information in a timely manner is important because it improves transparency and accountability.
Table 3.22: PEFA requirements to rate this dimension
The following key procurement information is available to the public through the appropriate/respective means:
No. Key procurement information Yes/No
1 Legal and regulatory framework for procurement:
The Public Procurement Act 663 of 2003 is published on the PPA’s website. In 2016, Parliament passed Act 914 to amend sections of Act 663; the reprinted version of Act 663 with amended sections is also published. In addition, hard copies are available for sale at the Government printers (Assembly Press). The Regulations supporting Act 914 are still being prepared.
Yes PPA website
https://www.ppaghana.org
2 Procurement plans:
Section 21 of PPA Act 663 (as amended in 2016) mandates all procuring entities to prepare and submit annual procurement plans not later than one month before the end of the financial year to its entity’s tender committee, as well as to the PPA for publication. As required by law, these procurement plans are published on the PPA’s website. As at December FY 2017, 323 procurement plans had been published.
Yes PPA website
https://www.ppaghana.org
3 Bidding opportunities:
The PPA publishes bidding opportunities on its website (https://www.ppaghana.org). These opportunities are categorized according to procurement item, entity procuring, location of entity according to the regions in Ghana, procurement method, estimated contract amount, and expected start date.
Yes PPA website
https://www.ppaghana.org
4 Contract awards (purpose, contractor and value):
The PPA publishes on its website: contracts awarded by purpose; contract value or amount; and the name of the contractor, categorized into open tender, restricted tender and sole sourcing procurements.
Yes PPA website
https://www.ppaghana.org

133
The following key procurement information is available to the public through the appropriate/respective means:
No. Key procurement information Yes/No
5 Data on resolution of procurement complaints:
Data on administrative resolution of procurement complaints is published on the website; however, it appears that this data are not updated, as the most recent published data relate to 2014, specifically a case between the Marubeni Corporations versus The VRA-T4 Thermal Power Plant Project. Information on 2016 resolutions is available at the offices of PPA. The latest case resolved is between Danbort Company Limited and La Dade-Kotopon Municipal Assembly (LaDMA), dated December 2016.
Yes PPA website
https://www.ppaghana.org
6 Annual procurement statistics
The PPA publishes procurement statistics on its website in terms of contracts awarded by procurement method, as well as data on complaints resolved (although this information is outdated). The most recent published consolidated procurement statistics report relates to FY2012. Hard copies of the 2015 annual PPA report are available to the public at no cost.
No
PI-24.4 Procurement complaints management
As indicated in Table 3.23, the procurement complaints framework meets five out of the six criteria outlined in the PEFA methodology; criterion 4 is not fully met. Sections 78 to 82 of the PPA Act 663 (as amended by PPA Act 914) outline the procedure for complaints and administrative review. A nine-member Appeals and Complaints Board (ACB) is empanelled to receive, consider, review and adjudicate all procurement complaints — once the internal entity review process is exhausted and has proven inconclusive. The membership of the ACB is as follows:
A retired judge of the law court - Chairperson
Private Enterprise Federation - Member
Attorney General's Department - Member
Council for Law Reporting - Member
Institute of Chartered Accountant, Ghana (ICAG) - Member
Representative from Association of Surveyors or Procurement Specialist - Member
Chief Executive Officer (CEO) of Public Procurement Authority - Member
Head of Legal, Public Procurement Authority - Member

134
Head of Benchmarking, Monitoring and Evaluation - Member.
Table 3.23: Mechanisms for reviewing procurement complaints
Complaints are reviewed by an entity which meets the following conditions:
Yes/No
1 The entity is not involved in any capacity in procurement transactions or in the process leading to contract award decisions.
Neither the PPA nor members of the ACB are involved in any procurement transaction in relation to the contract award processes.
Yes
2 The entity does not charge fees that prohibit access by concerned parties.
The ACB does not charge fees for receiving and resolving procurement complaints.
Yes
3 The entity follows processes for submission and resolution of complaints that are clearly defined and publicly available.
The method and procedure for submitting procurement complaints, as well as resolution of those complaints thereof, is clearly defined under Section 81of Act 663 (as amended by Act 914); these processes are published and strictly adhered to.
Yes
4 The entity exercises the authority to suspend the procurement process.
Section 82 of Act 663 (as amended by Act 914) outlines the legal framework for suspending all procurement activities once the ACB receives an official complaint from a dissatisfied bidder. In practice, however, suspension of the procurement process is not always done, especially for very sensitive national issues.
No; not always, especially for very
sensitive national and economic issues, such
as petroleum
5 The entity issues decisions within the timeframe specified in the rules/regulations.
Evidence adduced corroborates the fact that decisions are issued within the legally stipulated time.
Yes
6 The entity issues decisions that are binding on every party (without precluding subsequent access to an external higher authority).
All decisions issued by the ACB are binding; a more recent case dated December 2016 involved Danbort Company Limited versus La Dade Kotopon Municipal Assembly (LaDMA) regarding the "construction of [a] rectangular storm drain around Kenan Factory Area" with tender - ICB No. LaDMA/GSWP/C-3WKS/005; the Board ruled in favour of Danbort against LaDMA. The ruling of the ACB does not prevent any aggrieved party from proceeding to the law courts for redress, as prescribed under Section 78(5) of PPA 663 (as amended by Act 914).
Yes
Ongoing reforms
The World Bank is providing funding for the Government's e-Procurement module under the e-Governance Project. This will improve transparency in public procurement.

135
PI-25. Internal controls on non-salary expenditures
This indicator measures the effectiveness of general internal controls for non-salary expenditures. Specific expenditure controls on public service salaries are considered in PI-23. The indicator assesses segregation of duties, the effectiveness of expenditure commitment controls and compliance with payment rules and procedures.
Summary of scores and performance table
Indicator/Dimension Score Explanation
PI-25 Internal controls on non-salary expenditures
(Scoring method: M2-AV)
B
25.1 Segregation of duties
Time period: At the time of assessment.
A
Appropriate segregation of duties is prescribed throughout the expenditure process. Responsibilities are clearly defined.
Segregation of duties are clearly defined in the expenditure process, as indicated by written regulations and accounting procedure manuals, and procurement and property administrator procedures. The GIFMIS system effectively provides for the separation of roles in the payment process.
25.2: Effectiveness of expenditure commitment controls
Time period: At the time of assessment.
C
Expenditure commitment control procedures exist. They provide partial coverage and are partially effective.
The GIFMIS system provides a commitment control procedure affording only partial coverage due to expenditures financed by retained IGFs outside of the GIFMIS, as well as non-compliance by some MDAs.
25.3 Compliance with payment rules and procedures
Time period: At the time of assessment
B
Most payments are compliant with regular payment procedures. The majority of exceptions are properly authorized and justified.
Most payments (More than 95 percent) are authorized in advance, and are in line with rules and procedures.
25.1. Segregation of duties
This dimension assesses the existence of the segregation of duties, which is a fundamental element of internal control. As such, it prevents an employee or group of employees from being in a position both to perpetrate and/or to conceal errors or fraud in the normal course of their duties.
The PFM Act of 2016 is the prime legal framework. It outlines the broader segregation of duties between the Minister of Finance, the Controller and Accountant-General, and the head of a spending agency (MDA), among others. It also outlines the responsibility of the head of a MDA in the management of assets, bank accounts, and reporting and compliance with rules and regulations. The Financial Administration Regulations (FAR) of 2004, issued according to the repealed Financial Administration Act of 2003 (Act 654), remains in force until the new financial

136
regulations, currently being drafted, is approved in line with PFM Act of 2016. It is expected to be issued by the middle of 2018. The Financial Management Manual for MDAs issued in 2015 and the Accounting Manual for MMDAs (issued in 2011) outlined the detailed processes and segregation of duties in the procurement and payment cycles.
Payment requests have to pass through different steps before being disbursed to a beneficiary. The mandatory workflow process built into the GIFMIS has strengthened the effectiveness of the separation of the different activities in the payment process. The head of a MDA reviews and approves purchase requisitions. As indicated in the Procurement Act of 2003 (as amended in 2016), a procurement unit facilitates the process, and a procurement committee evaluates tenders. The Procurement Unit initiates the Purchase Order within the GIFMIS for the review of the head of finance and the head of the MDA. After the goods and services are received, a Store Receiving Voucher (SRV) is completed by a supplies officer. Supplier invoices are processed by the accountant. The head of the MDA and the head of finance co-approve the payment voucher. The list of payments is populated in the GIFMIS and will be available for the CAGD Chief Cashier, who then transfers the cash from the Consolidated Fund into the operating bank account of the MDA. Finally, the supplier will be paid via electronic funds transfer (EFT) or electronic checks from the account of the MDA, with dual approval of the head of finance and the head of the MDA. The Procurement Unit is not involved in the approval of tenders and effecting of payments to suppliers.
The segregation of duties is generally respected with regard to procurement. The Procurement Act of 2003 (as amended in 2016) and the Guidelines for the disposal of goods and equipment segregate duties for recording, custodianship, control and reconciliation, and disposal of fixed assets and stores. The GAS and internal audit reports indicated instances where purchases were conducted without the approval of the procurement committee and stores were issued without the authorization of the head of departments. However, these irregularities are not significant relative to the total amount of central government transactions.
25.2 Effectiveness of expenditure commitment controls
The PFM Act of 2016 Section 7(1) stipulates that a head of MDA shall authorize commitments within a ceiling set by the MoF following the approval of the annual budget. MDAs submit their cash requirement plans to the MoF for, say, the next quarter. The MoF inserts the quarterly commitment ceiling into the GIFMIS, consistent with the cash requirement and issues warrants40 for the subsequent transfer of cash from the CF into the operating Bank accounts of the MDAs. The approved list of payments is prepared in line with the approved budget and ceiling within the GIFMIS.
Hence, there are two stages of control within the system. The first one is control for budget availability and the second is control not to effect payment beyond the approved ceiling. Through the TSA (the implementation of which is on-going), cash is transferred to MDAs to the extent of
40 Warrants for goods and services and payroll are issued monthly to the MDAs. The MDAs then allocate to their cost centers. Specific warrants (mainly for capital projects) are issued as requested.

137
immediate cash payments, as shown on the approved payment vouchers. Hence, cash resources are, more or less, kept centrally except for cash awaiting disbursement in the operating bank accounts of the MDAs.
Under normal circumstances, the system in place appears to be effective as long as the rules are followed. An anomaly is that the commitment control process is not applicable for expenditures drawn from the portion of IGF funds that MDAs are legally allowed to retain. This situation will change by the end of 2018, as the spending of retained IGFs is in the process of coming under the control of the GIFMIS.
Despite the rules, regulations and procedures, in practice, expenditure commitment controls are violated by some MDAs,41 and liabilities are substantial (See PI-22). Some of the commitments exceed their budgetary allocations. The Auditor General’s Annual Report on the Audit of the Consolidated Fund (2016) highlights payments of cash outside the GIFMIS and budget overruns, as represented by a revenue shortfall of GH₵ 9.7 billion and excess expenditures of GH₵ 3.6 billion. This situation represents the practical limitations on expenditure commitment controls. The budget overrun resulted mainly from the settlement of salary payables (arrears) of previous years.
25.3. Compliance with payment rules and procedures
This dimension assesses the extent of compliance with the payment control rules and procedures based on available evidence.
Payment control rules and procedures are generally respected. The prevalence of pre-audits by most of the internal audit units served as additional control points. In addition, there is a review process within the Controller and Accountant General (CAG) team (which has staff operating in the MDAs) and among the management of the respective MDAs. The Auditor General’s Annual report on the accounts of the MDAs indicates irregularities in the areas of cash, procurement, payroll, taxes, loans and contracts. Irregularities related in part to the violation of payment control rules and procedures are estimated at 4.7 percent of the total annual expenditures in 2016. Internal audit reports of most of the visited MDAs have revealed findings on payments with insufficient documentation. However, the total value of the expenditures with payment procedure irregularities are not large in relation to overall MDA expenditures.
PI-26. Internal audit
This indicator assesses the standards and procedures applied in internal audit.
41 The Auditor General certified GH₵ 6.33 billion out of the total commitment payable of GH₵ 11.8 billion reported by the MDAs as of December 31, 2016 (The Auditor General Report on the Accounts of the MDAs – 2016).

138
Summary of scores and performance table
Indicator/Dimension Score/Scoring criterion Explanation
PI-26 Internal audit
(Scoring method: M1-WL)
C+
26.1 Coverage of internal audit
Time period: At the time of assessment
C
Internal audit is operational for central government entities representing the majority of budgeted expenditures, and for central government entities collecting the majority of budgeted government revenues.
Of the 188 MDAs, 186 have Internal Audit Units (IAUs). The level of implementation of annual audit plans varies between MDAs. The visited MDAs accomplished on average 67 percent of their annual audit plans, which also represents the expenditure coverage.
The IAUs are still performing the “ex-ante” pre-payment verification (commonly known as “pre-audit”) function, which affects the extent of coverage.
The limited resources and delays in budget releases also affected the performances of the IAUs.
26.2 Nature of audits and standards applied
Time period: At the time of assessment
C
Internal audit activities are primarily focused on financial compliance.
Internal audit is mainly focused on financial compliance rather than systemic audit. The risk analysis prepared by the IAUs also primarily focus on compliance risks, rather than the effectiveness and efficiency of the internal control systems. The engagement of IAUs in pre-audit tasks may compromise their independence.
The IAUs prepare annual audit plans. Most of them have approved Audit Charters and use the audit manual prepared by Institute of InternaI Auditors (IAA) in line with the International Professional Practice Framework (IPPF).
26.3 Implementation of internal audits and reporting
Time period: Last completed FY.
C
Annual audit programs exist. The majority of programmed audits are completed, as evidenced by the distribution of their reports to the appropriate parties.
All four visited MDAs prepare an annual audit plan and accomplish about 70 percent of their approved audit plans. About 59 percent of the MDAs and MMDAs submitted annual and quarterly audit reports to the IAA in 2016.

139
Indicator/Dimension Score/Scoring criterion Explanation
26.4 Response to internal audits
Time period: Audit reports issued within the last 3 FYs.
B
Management provides a partial response to audit recommendations for most entities audited within twelve months of the report being produced.
Based on the 2016 IAA report, the audited institutions implement more than 75 percent of IAU recommendations within twelve months. The IAUs of the four visited MDAs indicated that about 80 percent of the auditees respond within three months.
Background
The Internal Audit Agency Act, 2003 (Act 658) and the Financial Administration Act, 2004 (Act 654) govern the internal audit functions of the Internal Audit Agency (IAA) and the Internal Audit Unit (IAU) in each MDA and MMDA. Internal Audit Regulations, 2011 (Legislative Instrument (LI) 1994)) provide further guidance on the governance and conduct of internal audit, the protection of internal auditors, internal audit reports, and the role of the Audit Committee.
The IAA, established in December 2003, co-ordinates, facilitates, monitors and supervises internal audit activities within the MDAs and MMDAs to secure quality assurance of internal audit. The IAA also conducts special audits. In 2017, it conducted a Special Audit into the payroll of the Youth Employment Agency, as well as the financial and procurement activities of the Dambai College of Education. It also provides training on risk management and Interactive Data Extraction Analysis (IDEA) for internal auditors.
The IAA is governed by an Internal Audit Board comprised of 9 representatives from the ministries, the private sector, and professional accountants. The Board is responsible for formulating IIA policies, and establishing appropriate structures. It is also responsible for securing the achievement of the objectives of the Agency, and approving plans for the development and maintenance of an efficient internal audit for bodies and institutions. In addition, it takes reasonable and timely action on the reports submitted to it by the IIA Director-General.
The Act underlines the independence of the IAA Director General in the course of doing his/her job, and also grants unlimited access to books and records. Section 16 of Act 658 states that an Internal Audit Unit shall be established in each of the MDAs. The MDAs and MMDAs are required to submit internal audit reports to the IAA and to their respective management bodies42. Autonomous Constitutional bodies are subject to the standards and procedures of the IAA, but report to the Auditor-General. The IAA prepares consolidated internal audit reports and submits them to the IAA Board. The Board then submits reports to the President, who may make comments on the report prior to submitting it to Parliament through the Minister of Finance, as required by the IAA Act. Since 2007, however, no internal audit report has been submitted to Parliament.
42 PFM Act of 2016, Section 83: 2. The head of the Internal Audit Unit shall report administratively to the Principal Spending Officer and functionally to the Audit Committee of that covered entity.

140
The Audit Report Implementation Committees (ARICs), that had been operational, were replaced by Audit Committees in 2016 in line with the PFM Act of 2016, Section 86, in order to increase audit function effectiveness. The ARICs were established in accordance with Section 30 of the Ghana Audit Service Act of 2000, Act 584, to pursue the implementation of matters arising from all audit reports. The ARICs were submitting reports to the Auditor General on the status of audit recommendations and proposed actions plans on implementation. The ARIC members were mainly from the respective MDAs (5 members, two of whom were nominees from the IAA and the Institute of Internal Auditors in Ghana). The ARICs are chaired by the heads of the MDAs. Their independence had been disputed and is believed to be the main reason for the inability of some of the ARICs to influence the audited entities regarding the implementation of audit findings and recommendations. For this reason, the Public Financial Management Act of 2016 replaced the ARICs with Audit Committees, incorporating independent members outside of the MDAs.
In line with Section 86 of the PFMA (2016), the Audit Committees were inaugurated between May and November 2017 in most of the MDAs. The Audit Committee for each MDA has five members, three of whom are independent from the MDA. They are nominated by the Internal Audit Agency and The Institute of Chartered Accountants of Ghana (see discussion under PI 26.4). One of the three external members of the Audit Committee will be a Chairman of the Committee. Audit Committees review progress of the MDAs in implementing the recommendations of both the GAS reports and the reports prepared by the IAUs (Section 88 of the PFMA).
The Auditor General and the IAA signed a memorandum of understanding in 2007 in support increased cooperation. This arrangement has been successful to date. The two institutions complement each other’s audit efforts by the sharing of risk assessments and audit reports, as confirmed by both the GAS and the IAUs met by the team. Prior to starting their audits, auditors of the GAS review internal audit reports prepared by the IAUs of the MDAs to be audited. They also interview the authors of the reports. In addition, internal auditors follow-up on the findings of the external auditors, and include the status of external audit findings into their annual reports.
26.1. Coverage of internal audit
This dimension assesses the extent to which government entities are subject to internal audit.
Of the total 188 MDAs, 186 have an IAU43. Internal audit units audit all government funds, including IGFs and donor-funded projects. The staff of IAUs comprise qualified accountants and members of the Institute of Internal Auditors of Ghana. According to the 2016 IIA Annual Report, the IAUs of the MDAs and MMDAs accomplished only 18.6 percent44 of their annual audit plans in 2016. The analysis does not separately show the performance of the MDAs’ IAUs. Depending on the staff size, resources available, the timeliness of resources released from the CAGD and the
43 As of December 2017, all of the 216 MMDAs had IAUs. 44 Out of the total of 3,139 audits, 585 audits were conducted. The data represents a review of 243 IAUs of the MDAs and MMDAs (61 percent of all IAUs) who submitted the information to the IAA. Eighty-four of the IAUs (out of the 243) are from the MDAs.

141
extent of pre-audit45 tasks, the IAUs are able to implement 40 to 100 percent of each anticipated audit plan,46 with a weighted average of 67 percent. Data were not available to determine the internal audit coverage in terms of total annual expenditure. The 67 percent audit coverage in terms of annual audit plan probably approximates the coverage in terms of expenditure. One of the assessed IAUs indicated that the unit could not audit projects, including donor-funded projects, due to budget constraints.
Although the IAUs are not required to do pre-audit work, in practice they do, as requested by the heads of the MDAs. Pre-audit of transactions by internal audit units are considered part of the internal control system and are assessed in PI-25. The standards and guidance issued by the IAA indicate that the IAUs are required to conduct ex-post (that is, after transactions have been posted) audits only. However, most of the executives of the MDAs demand that IAUs conduct pre-audits (that is, prior to planned transactions being executed) and sign off on this work.
26.2 Nature of audits and standards applied
This dimension assesses the nature of audits performed and the extent of adherence to professional standards.
The IIA developed and distributed manuals to the IAUs in 2016, in line with International Standards for the Professional Practice of Internal Auditing, referred to as the International Professional Practice Framework (IPPF). According to the IPPF47, the internal audit activity must evaluate and contribute to the improvement of the organization’s governance, risk management, and control processes using a systematic, disciplined, and risk-based approach. Internal auditors are required to be independent and possess professional proficiency. An Internal Audit Unit also needs to have organizational independence.
The IAUs prepare annual audit plans based on a risk rating. However, the annual audit plans place little emphasis on systemic audits, largely focusing on compliance audits. The recurring internal audit findings are indicative of the limited role that the IAUs play in systemic audits. IAU involvement in pre-audit activity further reduces the effectiveness of the IA function. Systemic audits provide assurance of the adequacy and effectiveness of internal controls. Compliance audits focus on the reliability and integrity of financial and operational information and compliance with rules and procedures. Control testing during audit engagement is not based on a control test and sample basis as prescribed in the audit manual issued by the IIA48. A 100 percent examination of audit evidence decreases the efficiency of IA units. Under such circumstances, an internal auditor will have little time to proactively offer new insights by evaluating the adequacy and efficiency of the existing internal control system.
45 Internal Audit units at the Ministry of Road and Highways, the CAGD, MoFA and MoE conduct pre-audits in addition to ex-post audits. 46 Accomplishment of the audit plan: CAGD – 60 percent; MoE – 100 percent; MoH 70 percent, and MoFA 40 percent. 47 IPPF standard 2017, section 2100: Nature of Work. 48 Risk-based Internal Audit Manual: Internal Audit Agency (2017), page 55.

142
The requirements of the IPPF are partially fulfilled. Of the 182 MDAs, 170 have signed Audit Charters. Among the four visited MDAs, three have Audit Charters. Internal auditors are generally independent. However, their involvement in pre-audit activities will put them in a situation of being involved in day-to-day decisions of disbursement processes, which may compromise their independence. The independence of the IAUs is maintained through the dual reporting relationship indicated above (that is, to IAA and MDA management). However, the influence of some MDAs’ management for “pre-audits” may tend to affect the independence of the IAUs.
The relatively new Audit Committee system, which plays an oversight role on behalf of the IAA, has strengthened the organizational independence of the IAUs. However, the resources and capacity limitations within the IAA may not enable it to ensure the level of organizational independence to the IAUs required under the Internal Audit Act. The standard requires internal auditors to possess the required proficiencies by obtaining the appropriate certification and qualification. From the visited MDAs, it was found that 23 to 32 percent of the IAU technical staff are Chartered Accountants. The IAA offers quality assurance support to the IAUs, but its coverage is limited due to too few personnel and the multiple responsibilities imposed on it, including training, follow-up of implementation and auditing.
26.3. Implementation of internal audit and reporting
This dimension assesses specific evidence of an effective internal audit (or systems monitoring) function, as shown by the preparation of annual audit programs and their actual implementation, including the availability of internal audit reports.
All the IAUs of the Ministries visited by the team prepare annual audit plans, implement many of them, and prepare reports on their implementation. Resource limitations and delays in budget releases constrain full implementation. The IAUs prepare their first draft annual audit plan before the commencement of the year. They prepare the final draft after the resources available to them are known, which is often in the first quarter of the year. The head of the MDA and the Audit Committee chairperson review and approve the audit plans submitted to them to the head of the IAU. Most of the visited MDAs complete more than 70 percent of their approved audit plans. As of December 31,2017, 55 percent of IAUs (221 IAUs) had summited their annual audit plans to the IAA.
The IAUs are expected to produce quarterly and annual audit reports. All the visited ministries prepare internal audit reports and submit them to the head of the ministry, the Audit Committee, the IAA, the auditee and the Auditor General. The IAA received 947 audit reports during 2017, which represented 59 percent of the total expected audit reports.49 Most of the assessed ministries indicated that annual audit plans are often not fully implemented due to resource limitations and delays in budget releases.
49 The team was not able to have full access to internal audit reports, as they are internal confidential documents. Access might have been possible, had the reports being provided to Parliament. As noted above, such reports have not been submitted to Parliament since 2007. The team, however, was able to view sections of some reports.

143
26.4. Response to internal audits
This dimension assesses the extent to which action is taken by management on internal audit findings.
Auditees tend to respond to the recommendations of IAU reports, and take actions to implement them. The IAU reports include follow-up of previous audit findings. Outstanding findings are reported to the Audit Committee. It is too early to evaluate the performance of the new Audit Committee system.
According to the Internal Audit Regulations50, auditees should respond to the audit findings and recommendations within 10 days from the date they receive the audit report. In most of the visited institutions, more than 80 percent of the auditees respond and take actions from one week to three months. The MDAs and MMDAs implement more than 75 percent of the recommendations within one year51.
According to the PFM Act of 2016, section 88, the Audit Committee is required to submit an annual report to the relevant sector Minister, Minister of Finance, Parliament, Office of the President and the Auditor General. The report of the Audit Committee includes the internal audit findings, recommendations, and actions taken.
According to 2016 report of the IAA, 165 ARICs were functional in 90 percent of the MDAs in 2015 and 2016. Of the expected 716 quarterly IA reports, 223 (31 percent) were received from the MDAs in 2016, the last year in which the ARICs were operational. In most of the four visited MDAs, the Audit Committees had only one or two meetings —or none — after the first inauguration meeting. One of the visited ministries indicated that the Audit Committee could not meet due to lack of a budget for sitting allowances for the committee members.
Ongoing Reforms
The Public Finance Management Reform Project (PFMRP) in the MoF is supporting the implementation of an Enterprise Risk Management System in the MDAs. This system will enable the IAUs of the MDAs to focus on risk-based and systemic audits. The project is financed by the World Bank and is expected to close in 2019.
The PFMRP is also supporting the establishment of a Training Center at the IAA in order to help internal auditors to obtain certification as “Certified Information Systems Auditors (CISAs)”. The project is also supporting the Implementation of a Document Management System (DMS) to be used by the MDAs and MMDAs. Ongoing training for the IAA and IA unit staff include Computer Assisted Auditing Techniques (CAAT) and Special Audits (including audits of complex contracts). The establishment of the GIFMIS has provided the impetus for this new training. Had the previous
50 Internal Audit Regulations 2011, Section 43(2). 51 Activity report of the IIA: Of the 3,873 findings and recommendations provided in 2016, 2,912 received a response before the end of 2017. Average estimation on action taken by auditee on audit findings of IAUs of visited entities (including the MoH, the MoFA, the MoE, the MoRH, and the CAGD) is close to 75 percent.

144
attempt several years ago to establish a sound computerized financial management not failed, internal auditors could have been using CAAT a long time ago.
PILLAR SIX: Accounting and reporting
PI-27 Financial Data Integrity
This indicator assesses the extent to which treasury bank accounts, suspense accounts, and advance accounts are regularly reconciled and how the processes in place support the integrity of financial data.
Summary of scores and performance table
Indicator/Dimension Score/Scoring criterion Explanation
PI-27: Financial Data Integrity
(Scoring Method: M2-AV)
B
27.1 Bank Account Reconciliation
Time period: At the time of assessment, covering the preceding FY
C
Bank reconciliation for all active central government bank accounts takes place at least quarterly, usually within 8 weeks from the end of each quarter.
All CAGD-managed bank accounts (75 percent by value of all GoG bank account balances) are reconciled monthly, within four weeks after the end of the preceding month.
There are other active MDA bank accounts (mainly for IGFs and donor projects ) held at commercial banks that are reconciled within two months after the end of the month.
Donor project accounts held in the BoG are reconciled on a timely basis, within two weeks after the end of the month.
27.2 Suspense Accounts
Time period: At the time of assessment, covering the preceding FY
A
Reconciliation of suspense accounts takes place at least monthly, within a month from the end of each month. Suspense accounts are cleared in a timely way, no later than the end of the fiscal year, unless duly justified.
The CAGD does not maintain suspense accounts as a matter of policy.
Revenues and expenditures that cannot immediately be classified are temporarily classified under a revenue or expenditure code.
Once the correct classification is identified, a journal entry is made that reverses the temporary classification.
27.3 Advance Accounts
Time period: At the time of assessment, covering the preceding FY
C
Reconciliation of advance accounts takes place annually, within two months from the end of the year. Advance accounts may frequently be cleared, with delay.
Advances are reconciled within two months after the end of the previous financial year; there are, however, significant uncleared balances at the end of the FY.

145
Indicator/Dimension Score/Scoring criterion Explanation
27.4 Financial Data Integrity Processes
Time period: At the time of assessment.
A
Access and changes to records are restricted and recorded, and result in an audit trail. There is an operational body, unit or team in charge of verifying financial data integrity.
Access to the GIFMIS is highly regulated, with passwords granted only by the CAG.
The financial data is encrypted, with read-only mode. User entry to the GIFMIS generates an audit trail.
In addition, the Data Analysis and Capturing Unit (DACU) within the CAGD conducts financial data entry checks to ensure data integrity.
PI-27.1 Bank account reconciliation
This dimension assesses the regularity of bank reconciliations.
The architecture of the Treasury account is as follows: (i) the T-main account (known as the CF) consists of two accounts, one for receipts and payments, and the other for Treasury Bills; (ii) 35 MDA sub-CF accounts; (iii) 216 MMDA sub-CF accounts; (iv) 10 Regional Coordinating Council sub-CF accounts; and (v) specialized accounts created specifically for government projects, such as for oil and gas projects.
All Treasury-managed bank accounts are reconciled monthly within four weeks after the end of the preceding month. These accounts are held under the TSA-Consolidated Fund, sub-consolidated , and MDA accounts transferred to the BoG are under the TSA framework. They represent about 75 percent of central government cash balances. Donor project accounts held in the BoG are reconciled within 2 weeks after the end of the preceding month.
At present, the GIFMIS automatic bank reconciliation (ABR) module is not yet functional. Reconciliations are still done manually through the export of bank statements into Excel. The CAGD has direct access to a BoG platform (i.e. T24) with an internet banking facility that allows for daily electronic bank statements. As indicated in PI-21.1, there are a multiplicity of MDA bank accounts held at commercial banks. These are mainly for IGF revenues retained by the MDAs and for donor partner Project Implementation Unit (PIU) bank accounts, held by the parent MDAs. There are delays of up to two months in reconciling these accounts.
Performance appears to have improved since the previous PEFA assessment. Reconciliations are faster as a result of having direct access to the BoG' T24 platform . Nonetheless, some MDA accounts held at commercial banks, mainly for IGFs, experience delays in monthly reconciliations.
PI-27.2 Suspense accounts
This dimension assesses the extent to which suspense accounts, including sundry deposits/liabilities, are reconciled on a regular basis and cleared on a timely basis. Under the 2011 PEFA Framework, suspense account balances and uncleared advances were assessed under one dimension.

146
Ghana had a history of huge and uncleared suspense accounts at the end of each year. However, the rollout of the GIFMIS has significantly improved financial data entry and classification of all expenditures, resulting in the full reconciliation and acquittal of suspense items within a month after the end of the financial year. This has much improved the way in which ‘suspense’ items are acquitted, resulting in an improvement in the quality and integrity of central government financial statements..
According to the CAGD, there are no suspense accounts as CAGD has made conscious efforts to discourage their use as a way of ‘parking’ temporarily unclassified revenue and expenditure items into such accounts until they can be properly classified. As a temporary measure, such items are credited to line item economic classification codes. Once the items are classified, the process is reversed through a journal entry.
PI-27.3 Advance accounts
PI-27.3 assesses the extent to which advance accounts are reconciled and cleared.
Advances cover the amounts paid to vendors under public procurement contracts, as well as travel advances and operational imprests.
The AFS of the Consolidated Fund (CF) disclose significant amounts and types of advances; these are reconciled as part of the preparation of the AFS by the end of February for the preceding year. However, there tend to be uncleared balances at the end of the year.
The 2017 AFS had yet to be finalized at the time of this assessment. Table 3.24 below therefore analyzes balances outstanding as of the end of 2016. Whereas the departmental revolving fund balance remained unchanged at the end of 2016 from the end of 2015, movements in salary advances indicate reductions. Advances (i.e. imprests) to the MDAs saw a marginal increase from 2015 to 2016, with the most significant uncleared balance being for vehicle advances. Uncleared advances also appear to be on the increase, representing about 0.04 percent of central government expenditures in 2016 compared to 0.03 percent in 2015.
Table 3.24: Analysis of advance accounts
Particulars 2015 2016 Increase/(decrease)
GH₵ GH₵ GH₵
Vehicle advances 6,268,465 15,341,220 9,072,755
Special advances (imprests to MDAs) 311,207 317,190 5,983
Salary advances 2,283,748 1,365,618 - 918,130
Advances (departmental revolving fund) 990,852 990,852 -
Total advances 9,854,272 18,014,880 8,160,608
Total government expenditure 38,574,158,143 44,791,386,715
Advances as % of total expenditures 0.03% 0.04% 0.01%
Sources: 2015 and 2016 AFS of the Consolidated Fund.

147
PI-27.4 Financial data integrity processes
It assesses the extent to which processes support the delivery of financial information. As such, it focuses on data integrity defined as accuracy and completeness of data.
This is a new dimension.
The GIFMIS has strong security protocols that ensure financial data security and integrity. It has an automatic 5-minute logoff module when not in use by the authorized user. It prompts users to compulsorily change their entry password every month, with approval from the Controller and Accountant General (CAG). Access to financial information is highly restricted with password access only granted by the CAG to authorized personnel. The data is encrypted, including a read-only module.
All MDAs at the national level have direct access to the GIFMIS that allows financial data capturing by the authorized accounting staff within each MDA and is then approved by the financial controller in that MDA. Once entered, the data cannot be modified; any modification is done with the approval from senior authorized staff through a journal entry. Another key feature is an audit trail. Any authorized entry has an audit trail and can be queried to generate user reports as part of measures to check authorized access, as well as intrusion.
The CAGD has a unit known as the Data Analysis and Capturing Unit (DACU) within the Public Accounts Department. The unit has 35 permanent staff responsible for data integrity, including ensuring that all financial transactions emanating from the MDAs are accurate. They also ensure that transposition errors and misclassifications are reduced to the barest minimum, if not entirely eliminated. Despite these measures, there are still challenges with regard to data accuracy, as corroborated by the Auditor General.
The rollout of GIFMIS to all budgeted entities including IGFs and Statutory Funds is expected to enhance data accuracy in the short to medium-term.Ongoing reforms
The rollout of the TSA under the PFMRP is expected to bring on board all MDA accounts (including IGFs) held at commercial banks in order to improve bank reconciliation at the level of the general government.
PI-28. In-year budget reports
This indicator assesses the comprehensiveness, accuracy and timeliness of information on budget execution. In-year budget reports must be consistent with budget coverage and classifications to allow for the monitoring of budget performance and, if necessary, the timely use of corrective measures.

148
Summary of scores and performance table
Indicator/Dimension Score/scoring criterion Explanation
PI-28 In-year budget reports
(Scoring method: M1-WL)
D+
28.1 Coverage and comparability of reports
Time period: FY 2016; (data for Q4 2017 not yet available)
D
Performance is less than required for a C score
A score of C requires that coverage and classification of data allows for direct comparison to the original budget for the main administrative headings.
Notes to the monthly financial statements produced by the CAGD in 2016 compare monthly expenditures and revenue outturns against the monthly and annual budget for the MDAs according to economic classification.
With the GIFMIS now operational throughout the country, reported expenditures include those financed by transfers from the center to the district offices.
The spending by MDAs of the IGFs retained by them and of the donor project/program grants they receive is still not reported on, though the budgeted amounts are shown in the annual Appropriations Act. The MoF and the CAGD assume that such expenditures equal grants.
28.2 Timing of in-year budget reports
Time period: As above
A
Budget execution reports are prepared monthly and issued within two weeks from the end of each month.
Issuance of the monthly financial statements in 2016 and the first three-quarters of 2017 was done within 15 days of the end of the month as stipulated under Section 40 of the FAA 2003.
28.3 Accuracy of in-year budget reports
Time period: As above
C
There may be concerns regarding data accuracy. Data is useful for the analysis of budget execution. Expenditures are captured at least at the payment stage.
In-year budget reports prepared by the CAGD are not fully accurate because they exclude expenditures financed by retained IGFs, although MDAs include such expenditures in their in-year reports.
As indicated under PI- 27, delays in reconciling bank accounts held by the MDAs in commercial banks may affect the accuracy of in-year expenditure reports.
Advances to district offices may be classified incorrectly as expenditures in order to meet the deadline for submitting monthly expenditure returns. This is becoming less of an issue with the recent roll out of the GIFMIS to the district offices.

149
28.1. Coverage and comparability of reports
Both the Ministry of Finance and the Controller and Accountant General’s Department (CAGD) prepare in-year budget reports.
The CAGD publishes monthly public accounts (financial statements) in compliance with the provisions of the PFM Act of 2016, which are similar to the provisions of the previous FAA 2003. The financial statements comprise five sections: (i) a balance sheet, (ii) a statement of revenues and expenditures, (iii) a statement of receipts and payments, (iv) a cash flow statement, and (v) notes to the accounts. In relation to 2016 and 2017, the statements show monthly (2016) or quarterly (2017) expenditure and revenue outturns against the corresponding estimates for all MDAs. Expenditures reported go down to the cost center level by broad economic classification.
The statements continue to exclude expenditures funded by the retained portions of the IGFs. With the GIFMIS now operative throughout the country, expenditures now cover those financed by transfers to the district offices. The reports include donor project spending. However, as indicated in the annual financial statements prepared by the CAGD, this is assumed to be the same as the amounts of donor loans and grants (because of the time it takes to receive spending reports from the PIUs) (section 1.12 of the statements).
The Ministry of Finance also prepares monthly ‘Fiscal Data’ reports along the lines of those prepared by the IMF in its monitoring of the GoG’s fiscal performance under the ECF program. The reports show monthly revenues by revenue category, expenditures by economic classification, and financing data by type of financing. Actual performance is shown against ECF program targets.
28.2 Timing of in-year budget reports
The CAGD issued the 2016 and 2017 (up to September) monthly financial statements within 15 days of the end of the month, as stipulated under Section 40 of the FAA of 2003. The CAGD does not circulate the report to budget managers, but publishes them on its website, www.cagd.gov.gh. The website is easily accessible.
28.3. Accuracy of in-year budget reports
Reported expenditure outturns are incomplete. They cover only expenditures financed out of the Consolidated Fund (CF). They exclude three key GoG expenditures – those incurred by MDAs from their retained IGFs, statutory funds (for example, the GETFund), and expenditures under donor-funded projects. Although budgeted expenditures of MDAs funded by these sources are included under the Annual Appropriations Acts, the actual expenditures are not reported, as the financing is outside the CF.
Reported expenditures may be inaccurate if they have not been reconciled accurately with bank transactions reports and/or if advances have not been cleared and have instead been recorded as expenditures. As noted under PI-27, expenditures funded from the CF are routinely

150
reconciled with bank transactions without a long delay (PI-27.1), but there tend to be delays in clearing advances (PI-27.3). As reported in the 2012 PEFA assessment, monthly expenditure reports require reporting by all district offices, as well as by GoG offices in Accra. Such reports might not be available in sufficient time to meet the legal deadline of the middle of the following month. Instead, advances to district offices may be incorrectly counted as expenditures. This is not such a signficant issue now, as the GIFMIS has been rolled out to all district offices, but this has been done only very recently.
Ongoing Reforms
Section 28 of the PFM Act of 2016 requires the Minister of Finance to submit a “mid-year review” (MYR) to the Parliament by the end of July. The MYR shall include, “an analysis of total revenues, expenditures and the financing performance for a period up to the first six months of the financial year”. The report will provide the basis for any revised budget outlook and supplementary budget that may be necessary. The GIFMIS is facilitating this process. The MoF is now able to access all necessary information for preparing reports in real time, without waiting for formal reporting by the MDAs. The first MYR is yet to be prepared.
PI-29. Annual financial reports
This indicator assesses the extent to which annual financial statements are complete, timely, and consistent with generally accepted accounting principles and standards. This is crucial for the accountability and transparency of the PFM system.
Summary of scores and performance table
Indicator/Dimension Score Explanation
eBrief justification for score
PI-29 Annual financial reports
(Scoring method: M1-WL)
D+ The CAGD prepares final accounts on the CF, and the heads of the MDAs do the same for “other funds”, but in un-consolidated form. The accounts are not yet IPSAS-compliant, but they have been consistent over time and comply with local regulations.

151
Indicator/Dimension Score Explanation
eBrief justification for score
29.1 Completeness of annual financial reports
Time coverage: Last completed FY (2016, as financial reports not yet completed for 2017)
D
Performance is less than required for a C score
A score of C requires that financial reports for the budgetary central government are prepared annually, and they are comparable with the approved budget. They include information on revenues, expenditures, and cash balances.
CF final accounts show revenue and expenditure outturns against the budget, as well as financial assets, and short and long-term liabilities.
The accounts are not complete, as they exclude actual expenditures of MDAs financed by retained IGFs and donor partners. These are shown in individual non-consolidated annual financial reports prepared by MDAs.
29.2 Submission of reports for external audit
Coverage: Last financial report submitted for audit (FY 2016)
A
Financial reports for the budgetary central government are submitted for external audit within 3 months of the end of the fiscal year.
The date of submission of the 2016 CF Statements to the GAS was March 31, 2017, meeting the deadline of 3 months after the end of the FY.
29.3: Accounting standards
(Coverage: Last 3 years financial reports: 2014-16)
C
Accounting standards applied to all financial reports are consistent with the country’s legal framework and ensure consistency of reporting over time. The standards used in preparing annual financial reports are disclosed.
Ghana is transitioning from cash-based to accrual-based accounting. The financial statements do not disclose any transitional provisions, but have followed a consistent format over time and comply with local regulations.
Background
The public accounts of Ghana comprise the Consolidated Fund, the Contingency Fund, and any other fund established by Parliament (Article 175 of the Constitution). The Controller and Accountant-General (CAG) is responsible for the custody, safety, and integrity of all public funds
(Section 3(1) of the Financial Administration Act (FAA) 654 of 2003).52 However, the FAA mandated the CAGD to prepare final accounts on the CF only (Section 40), whereas the heads of departments (MDAs) should prepare final accounts on the ‘other funds’ under their control (Section 3(2)) using instructions given by the CAG (Sections 3(2), and 41). These provisions contained some ambiguity, because Section 3(2) also made the CAG “responsible for the compilation and management of the accounts prepared in relation to the Consolidated Fund and other public funds”.
52 This was repealed following the enactment of the PFM Act of 2016; however, the FAA was the applicable law for the 2016 financial statements.

152
The PFM Act (PFMA) 2016 has removed the ambiguity by requiring the CAGD to produce final accounts for the Public Accounts, and not just the CF. This is not yet being done, as the Financial Regulations for the PFMA are still being prepared. The FAA 2003 provisions therefore govern the preparation of the 2016 final accounts, not the PFMA. The ‘final accounts’ prepared by the CAGD for FY 2016 reported only on the transactions of the CF. The receipts reported are monies accruing to the CF. The payments cover expenditures under the CF, as well as transfers to ‘other funds’ to run their respective expenditures. Expenditures funded through the CF comprise about 80 percent of all GoG expenditures. Accounts prepared by MDAs cover the revenues and expenditures of the ‘other funds’, comprising the retained revenues of MDAs and grants and loans from development partners to fund projects and programs and the expenditures thereof, as well as the funding provided by Statutory and other Funds. There is no consolidation of these accounts.
29.1. Completeness of annual financial reports
The ‘receipts and payments’ statement of the 2016 CF final accounts compares the original and revised appropriations under the annual Appropriations Act against the outturns. The Appropriations Act represents the GoG’s total annual budget. The receipts side covers the following items: tax revenues, grants, nontax revenues, national health insurance premium receipts, loans, non-treasury operations, recoveries, and trust monies. Items on the payments side include CF expenditures, such as employee compensation, goods and services, acquisition of nonfinancial assets, interest, government subsidies, social benefits and other expenses They also include statutory payments itemized in Note 20 of the accounts to the GETFund, the District Assembly Common Fund, the Petroleum/Road/Energy Funds, the Energy Sector Levy, the NHIL, and the GIIF.
Excluded from the final accounts of the CF are the revenues and expenditures of IGFs earned and retained by the MDAs and the expenditures of donor-funded projects in the cases where these are funded through the commercial bank accounts held by MDAs for PIUs. It is difficult to calculate the total amount of these revenues and expenditures, as this requires adding up the figures prepared by the MDAs in the process of preparing their final accounts. By definition, the retained revenues and other receipts and the expenditures thereof are not included in the final accounts of the CF because the receipts are not deposited in the CF. 53. Although transfers to the Statutory Funds are shown, as noted above, the expenditures are not, as such bodies have their own legal framework.
The CF final accounts include year-end assets and liabilities. The assets comprise current assets (cash and cash equivalents), receivables (vehicles, salaries, and special advances), prepayments, equity investments, property, plant and equipment, work in-progress, and intangible assets. The liabilities comprise payables, trust monies, and domestic and external loans. Schedules and explanatory notes attached to the accounts show the composition of these assets and liabilities. 53 Donor loan-funded projects/programs tend to have bank accounts in the BoG. The actual expenditures of the receipts from donors are not included in the CF final accounts. As indicated in Note 1.12 of the accounts, these expenditures are assumed to be the same as the monies provided, as the detailed data on their disbursements and expenditures are not readily available. This is even more the case for donor-funded projects with PIU accounts held by MDAs in commercial banks.

153
A cash flow statement derived from the income and expenditure statement as well as the balance sheet is prepared.
The MDAs are required to prepare and submit final accounts for audit. A sample of 9 departmental annual accounts for 2016 obtained show that the accounts vary in the level of detail provided. For instance, all the accounts include statements of revenues/income and expenditures (for example, the District Assemblies Common Fund [DACF] has a ‘Receipts and Expenditure’ statement), showing only actual revenues/income, GoG budgetary subventions, IGFs, grants and the expenditures thereof. However, most do not show the approved budgets; only the Ministry of Food and Agriculture’s (MoFA) accounts do. The accounts of the MoFA show the approved budget revenues from GoG funds; receipts from ABFA, IGF, and donor funded projects; and the approved budget for expenditures on a broad economic classification basis. In addition, the final accounts of the MoFA and the DACF do not include statements of cashflows as the others do (for instance, the MoH prepared a consolidated statement of changes in fund balances). The MoFA accounts also do not include a balance sheet, but the others do. The MOFA and MoH accounts include a statement of receipts and payments; the others do not.
Table 3.25 shows the content of financial reports prepared by the nine MDAs referred to above, as well as for the CF.
Table 3.25: Budgetary Central Government (BCG) Financial Reports for 2016
Financial Report
Date annual report
submitted for
external audit
Content of annual financial reports (Y/N):
Reconciled cash flow statement
(Y/N)
Expenditures and revenues by economic classification
Financial and non-financial
assets and liabilities
Guarantees and long-
term obligations
2016 Annual Accounts on the Consolidated Fund of the Republic of Ghana
10-Apr-17 Yes Yes Long-term loans and
guarantees Yes
Representative Sample of MDA Annual Financial Reports/Accounts
Ministry of Food and Agriculture Yes No No No
Ministry of Health Yes No No Yes
District Assemblies Common Fund Yes No No No
Ghana Education Trust Fund (GETFund) Yes Yes Yes Yes
Ghana Audit Service (Office of the Auditor General (2015 Accounts)
Yes Yes No Yes
Kwame Nkrumah University of Science and Technology
Yes Yes Yes Yes
Koforidua Technical University Yes Yes No No
University of Ghana Yes Yes Yes Yes
Road Fund Yes Yes No Yes
Consolidation of annual reports is necessary in the case of Ghana, particularly, because of the many reporting bodies – public tertiary institutions, hospitals, schools, special funds,

154
authorities, etc. (possibly up to 100, according to estimates). Most retain a portion or all of their IGFs. Each prepares its final accounts, which is, often, not timely. The evidence suggests that the quality of the final accounts differ among the institutions, being higher in the bigger institutions that receive donor support, because they have better capacity, needed to meet the reporting requirements for such assistance. Examples of such institutions are the Ministries of Health, Food and Agriculture, and Education. Tertiary educational institutions are self-accounting, and therefore, have a quality of financial reporting. Notwithstanding this, the ministries of Finance and Education have long suspected them of underreporting their IGFs. Consequently, the government is instituting measures for independent verification of their collections. The only way to confirm the completeness of the final accounts of individual reporting entities is by inspecting their respective financial statements. It was not possible to obtain sufficient copies of these reports to form an opinion on the completeness of their reporting.
The GoG recognizes the incomplete nature of this fragmented reporting and has moved to curb it. The new PFM Law enacted in 2016 requires consolidation at the BCG level. The 2017 final accounts will be the first prepared under this new regime. However, this assessment was for 2014 – 2016.
29.2 Submission of reports for external audit
In order to compare similar items, this dimension is scored according to the timeliness of the financial reports prepared under PI-29.1, which are for the CF only. The CAGD submitted its FY2016 financial statements on the CF for audit on March 31, 2017.
As noted above, the transactions under the CF do not represent the transactions of the central government in their entirety. 54 The Appropriations Act for FY 2018 indicates that GoG expenditures funded out of the CF comprise about 80 percent of total BCG expenditures: expenditures out of retained IGFs, statutory and other funds, and donor-funded projects and programs comprise the remainder (transfers from the GoG to the Statutory Funds are netted out).
29.3. Accounting standards
The annual accounts are prepared on a modified accrual basis using the historical cost convention, as indicated in paragraph 1.3 of the Summary of Significant Accounting Policies in the notes to the 2015 and 2016 financial statements. They are prepared with “the adoption of (IPSAS) full accrual in mind”. The financial statements reflect several aspects of accrual accounting standards, as required by IPSAS.55 These include the reporting of fixed assets, treatment of depreciation of assets, and the provision for irrecoverable investment. In addition, the notes include a section on accounting policies that discloses the measurement bases used for assets, investments, foreign exchange and losses, and so on, as required in IPSAS 1 (Paragraph
54 The stamp of receipt shows April 10, 2017, but the accounts were apparently received by GAS at the end of March, as required by legislation, the stamp not immediately being applied. 55 See: International Public-Sector Accounting Standards Board, Handbook of International Public-Sector Accounting Pronouncements, 2016 Edition, International Federation of Accountants, New York 10017, USA, paragraph 16, page 15.

155
132 of IPSAS 1: Presentation of Financial Statements). Revenues, however, continue to be reported on a cash basis, once lodged into the CF.
The financial statements do not disclose whether the transitional provisions in any of the standards to facilitate the migration from IPSAS cash to accrual have been adopted, as required in the same paragraph 132 of IPSAS 1. Without such a disclosure, it is difficult to know what “modified accrual basis” means and how long the transition will take. This is important, because as provided in paragraph 28 of IPSAS and reiterated in paragraphs 17 – 19 of the “Handbook of International Public-Sector Accounting Pronouncements, 2016/e”: “An entity whose financial statements comply with IPSASs shall make an explicit and unreserved statement of such compliance in the notes. Financial statements shall not be described as complying with IPSASs unless they comply with all the requirements of IPSASs.”
The 2015 and 2016 financial statements do not “make an explicit and unreserved statement of such compliance in the notes”. The financial statements are, therefore, not yet IPSAS compliant.
However, the presentation of the financial statements has been consistent over the years. The format used for the 2016 statements is the same as that used for the 2015 and 2014 statements, allowing for a comparison. For instance, the statements of revenues and expenditures, cashflows, and the balance sheet show the preceding year’s figures alongside the current years. The accounts also comply with the provisions of the “Financial Administration Act (FAA) 2003, Act 654 and the accompanying Financial Administration Regulation (FAR) 2004, LI 1802”. Although the FAA has now been replaced by the PFMA (2016), the FAR will continue to be in effect until the new financial regulations have been prepared to accompany the PFMA.
PILLAR SEVEN: External scrutiny and audit
PI-30. External audit
This indicator examines the characteristics of external audit.
Summary of scores and performance table
Indicator/Dimension Score/scoring criterion Explanation
PI-30 External audit
(Scoring method: M1-WL)
Overall score
B+
30.1 Audit coverage and standards
Time period: Last 3 completed FYs (2014-16, as FY 2017 accounts not yet completed)
B
Financial reports of central government entities representing most of total expenditures and revenues have been audited using ISSAIs or national auditing standards during the last three completed fiscal years. The audits have highlighted any relevant material issues, as well as systemic and control risks.
The financial audit covers more than 95 percent of the central government’s annual expenditures. The audit is conducted in accordance with ISSAIs standards, and significant findings are highlighted.
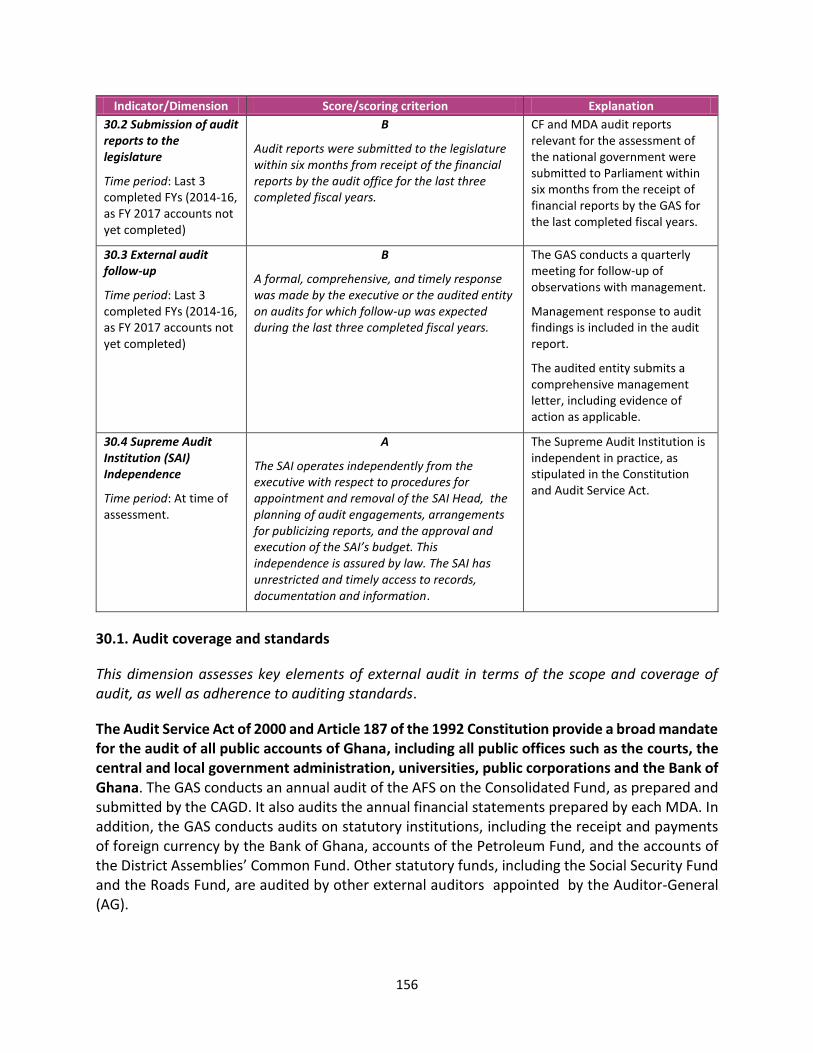
156
Indicator/Dimension Score/scoring criterion Explanation
30.2 Submission of audit reports to the legislature
Time period: Last 3 completed FYs (2014-16, as FY 2017 accounts not yet completed)
B
Audit reports were submitted to the legislature within six months from receipt of the financial reports by the audit office for the last three completed fiscal years.
CF and MDA audit reports relevant for the assessment of the national government were submitted to Parliament within six months from the receipt of financial reports by the GAS for the last completed fiscal years.
30.3 External audit follow-up
Time period: Last 3 completed FYs (2014-16, as FY 2017 accounts not yet completed)
B
A formal, comprehensive, and timely response was made by the executive or the audited entity on audits for which follow-up was expected during the last three completed fiscal years.
The GAS conducts a quarterly meeting for follow-up of observations with management.
Management response to audit findings is included in the audit report.
The audited entity submits a comprehensive management letter, including evidence of action as applicable.
30.4 Supreme Audit Institution (SAI) Independence
Time period: At time of assessment.
A
The SAI operates independently from the executive with respect to procedures for appointment and removal of the SAI Head, the planning of audit engagements, arrangements for publicizing reports, and the approval and execution of the SAI’s budget. This independence is assured by law. The SAI has unrestricted and timely access to records, documentation and information.
The Supreme Audit Institution is independent in practice, as stipulated in the Constitution and Audit Service Act.
30.1. Audit coverage and standards
This dimension assesses key elements of external audit in terms of the scope and coverage of audit, as well as adherence to auditing standards.
The Audit Service Act of 2000 and Article 187 of the 1992 Constitution provide a broad mandate for the audit of all public accounts of Ghana, including all public offices such as the courts, the central and local government administration, universities, public corporations and the Bank of Ghana. The GAS conducts an annual audit of the AFS on the Consolidated Fund, as prepared and submitted by the CAGD. It also audits the annual financial statements prepared by each MDA. In addition, the GAS conducts audits on statutory institutions, including the receipt and payments of foreign currency by the Bank of Ghana, accounts of the Petroleum Fund, and the accounts of the District Assemblies’ Common Fund. Other statutory funds, including the Social Security Fund and the Roads Fund, are audited by other external auditors appointed by the Auditor-General (AG).

157
The audit coverage with respect to financial audit for the central government and the MDAs is estimated at more than 95 percent. The overall performance in reference to the number of planned audits in 2016 was about 80 percent. Table 3.26 provides a highlight of the GAS’s audit performance for 2016. The total number of staff as of December 31, 2016 was 1,697, of whom 123 were professional accountants and 678 were 1st and 2nd Degree holders.
Table 3.26: Ghana Audit Service Performance Appraisal Review for FY 2016
Departments of GAS Planned Executed Percentage
Central Government Audit 318 235 73.9
Educational Institutions and District Assemblies 3,463 2,770 80.0
Commercial Audit a/ 56 51 91.1
Performance Audit and Special Audit Department 6 1 16.7
3,843 3,057 79.5
Source: Activity Report of the GAS (2015/2016). a/ The Commercial Audit Department conducts financial audits on public boards, corporations and other statutory institutions, as well as universities and other tertiary institutions. The Department audits the Statements of Foreign Exchange Receipts and Payments of the Bank of Ghana, and reviews audits carried out by private firms appointed by the Auditor-General.
The financial statements submitted by the CAGD and audited by the AG are prepared on a modified accrual basis of accounting using the historical cost convention. The statement comprises assets and liabilities, revenues and expenditures, cash flows, and the balance sheet (statement of financial position). The report also captures the position of public borrowings, pending commitments, trust monies, investments in SOEs, and budget execution schedules. The MDAs also produce financial statements. The GAS conducted seven performance and special audits in 2015 and 2016.
The GAS is a member of the African Organization of English-Speaking Supreme Audit Institutions (AFROSAI-E) and adopted the Regulatory Audit Manual (RAM) which is compliant with International Standards for Supreme Audit Institutions (ISSAIs). The GAS conducted the audit of the Consolidated Fund accounts for 2014, 2015 and 2016 in accordance with the standards of the International Organization of Supreme Audit Institutions (INTOSAI). The GAS prepares its annual audit plans based on the level of risk, financial outlay involved, the frequency of past audits and the public interest. Furthermore, the GAS conducts systemic audits, including testing the control and integrity of the GIFMIS. However, the financial audit focuses mainly on transaction level testing and compliance issues.
The Quality Assurance Unit (QAU) of the GAS reviews the audit works including risk assessments, audit plans, the management of audit working papers, and the sufficiency of evidence for audit findings in accordance with the RAM. The QAU reviewed 15 audit reports in 2016, and 54 reports in 201556. The QAU indicated that some of the procedures in the RAM were not properly
52 The report of the Quality Assurance Unit indicated that the decline in the number of reviews is due to delays in budget releases.

158
implemented by auditors, mainly due to capacity limitations. The officials indicated that the AFROSAI-E quality assurance team conducted a quality assurance review of the GAS. The report prepared by the AFROSAI team was not made available to the PEFA assessment team.
30.2. Submission of audit reports to the legislature
This dimension assesses the timeliness of audit report submissions on budget execution to the legislature as a key element in ensuring the timely accountability of the executive to the legislature and the public.
The GAS should submit the audit report within six months after the end of each financial year to Parliament in accordance with Article 187 of the Constitution and the Audit Service Act, 2000 (Act 584).
The GAS submitted to Parliament the audited financial statements of the CF for the FYs 2014 and 2016 on June 30, 2015 and June 30, 2017 respectively, which is the last day of the submission deadline. The audit of the CF’s financial statements for FY 2015 was submitted to the Parliament two and half months after the deadline. The GAS indicated that the reason for the delay was the disagreement between the outgoing and incoming Deputy Directors as to whom should sign on and release the audited financial statement.
According to Section 80 of the PFMA (2016), the MDAs are required to submit their AFS to the GAS within 2 months after the end of the FY. The GAS then has 4 months to audit them and prepare a consolidated report for submission to the Parliament by the end of June. Relative to the preparation of the AFS on the CF, the GAS has an additional month to prepare the consolidated audit report on the MDAs. This has been submitted to Parliament a few months late during the last few years (for example, December 21, 2015 and 2016 for FYs 2014 and 2015; and August 7, 2017 for FY 2016).
The GAS also submitted other audit reports to the Parliament during 2014-16, including financial audit and performance audit reports, such as: the performance audit reports on the MDAs; the reports on the DACF and other Statutory Funds, District Assemblies, Public Boards and Corporations, pre-university educational institutions, the Petroleum Fund, Polytechnics, Local Content in the Oil and Gas Sector in Ghana, and liabilities of MDAs. In addition, performance audits were conducted on the Governance of theNational Apprenticeship, the disposal of GoG vehicles by the MoFA, the Ghana Health Services, and the Management of the Expanded Plantation Program.
30.3. External audit follow-up
This dimension assesses the extent to which effective and timely follow-up on external audit observations is undertaken by the executive of the audited entity.
Section 30 of the Audit Service Act of 2000 led to the establishment of Audit Report Implementation Committees (ARICs) in the MDAs. They were later replaced by Audit

159
Committees, as per Section 88 of the PFM Act of 2016 (see PI-26). Audit Committees are responsible for following up on the implementation of recommendations of the Auditor General reports. It is also the responsibility of these Committees to prepare an annual statement showing the status of implementation of any recommendations contained in internal audit reports; the Parliament’s decision on the Auditor General’s report; the Auditor General’s management letter; and other related matters.
An Audit Committee is composed of five members, two appointed by the respective MDAs. The other three are independent members nominated by the Internal Audit Agency and the Institute of Charted Accounts, Ghana.
The GAS maintains an audit follow-up file57 for each auditee. It tracks the status of management responses and actions taken. The GAS conducts a quarterly meeting with the auditee to discuss the status of findings and recommendations.
The Report of the Auditor General on the Consolidated Fund provides information about the status of previous audit recommendations. Six 0f the eight major findings noted in the 2015 CF audit report were implemented in 2016. More than 50 percent of the ARICs submitted status reports to the GAS regarding the implementation by MDA management of the recommendations of GAS reports for the FY 2016 accounts. The absence of chief executives due to official duties has tended to delay responses to audit findings, also partly indicated as a factor for delays in responding to audit findings58.
The review of the CF and MDA audit reports for 2014, 2015 and 2016 shows the re-occurrence of some key findings.
Unsupported payment vouchers
Unauthorized use of IGFs
Unearned salary payments (PI-23)
Failure to comply with procurement procedures
Inconsistencies in reporting loan receivables
Payments outside of the GIFMIS.
Follow-up by the audit committees, internal audit units and the Public Accounts Committee (PAC) have significantly improved the timeliness of management actions on audit findings.
53 The auditors in charge of an audit maintain a template designed in Microsoft Word format. It updates the correspondence with the auditee, including details of findings, audit recommendations, responses of management, actions taken, and auditors’ comments on evidence gathered to verify the conduct of the action. 54 Activity report of the GAS: 2015 and 2016.

160
30.4. Supreme Audit Institution independence
This dimension assesses the independence of the SAI from the executive.
Articles 146 and 187 of the 1992 Constitution provide for the independence of the GAS and its members, including security of tenure and legal immunity. The AG enjoys the same privileges as a High Court Judge of the Republic of Ghana with respect to the provisions relating to his/ her removal from office. Section 10, sub-section 8 of the Audit Service Act, 2000, states that the Auditor General (in line with Article 146 of the 1992 Constitution) cannot be removed from office except for stated misbehavior or incompetence, or on grounds of inability to perform the functions of his/her office arising from infirmity of body or mind. The determination of these factors can only be made by a panel duly constituted by the Chief Justice to investigate and recommend the next line of action as far as his/her removal from office is concerned. The AG’s tenure of office expires once he/ she attains the age of sixty — but may be re-engaged for a limited period of not more than two years at a time, not exceeding five years.
As indicated in PI 30.1 above, the Constitution and the Audit Service Act provide a broad mandate to the GAS and full discretion in the discharge of its functions, including the audit of all public accounts. As per Section 11 of the Audit Service Act of 2000, the GAS has full access to all records including computerized and electronic documents. The AG is to plan and implement the audit work without interference.
The financial independence of the GAS was undermined by the fact that the AG had to apply for funds, and its proposal had to be scrutinized by the MoF. One of the principles of independence, according to the ISSAI, is the financial and administrative autonomy and the availability of appropriate human, material, and monetary resources (ISSAI 10). The performance of the GAS was affected in 2015 and 2016 the delay in the budget release from the MoF.
Since 2017, the MoF has not been setting ceilings on the GAS’ annual budget. The AG submits its budget and negotiates with the MoF for the final figure,59 and funds are released in a timely way. The GAS pays above the average compensation rate to its staff. Staff turnover is insignificant. As indicated in the Quality Assurance Review reports, the GAS is required to upgrade its staff capabilities to ensure proper implementation of the RAM.
Ongoing Reforms
The GoG has signed a credit agreement with the World Bank (Public Financial Management
Project (PFMRP)) to support the External Audit Capacity Strengthening . One of the project components has a budget of US$1.4 million for the period 2015-2018. Some of the activities under this component include: (i) the provision of continuous training of GAS staff in electronic audit; (ii) the acquisition, installation and deployment of Computer-Assisted Auditing Techniques (CAAT) and and IT-based Audit Management Information System (AMIS); (iii) the undertaking of selected performance and specialized audits using the new electronic tools; and (iv) 55 The annual budget of GAS increased from GH₵ 186 million in 2017 to GH₵ 218 million in 2018. The total budget in 2016 was GH₵ 130 million.

161
strengthening the capacity of the audit teams in completing audits of the MMDAs within the statutory deadline of six months after the end of the fiscal year through additional bought-out technical assistance. The capacity development training and implementation of CAAT are underway. To date, the AMIS has not yet been implemented. 60
PI-31. Legislative scrutiny of audit reports
This indicator focuses on legislative scrutiny of the audited financial reports of the central government, including institutional units, to the extent that either: (a) they are required by law to submit audit reports to the legislature; or (b) their parent or controlling unit must answer questions and take action on their behalf. The assessment of this indicator is based on the audit reports submitted to the legislature within the last three years.
According to the 1992 Constitution , the Parliament debates the report of the Auditor-General. As stipulated in the Standing Order of the Parliament of Ghana 162, the PAC has 25 Members and is chaired by a member from the largest opposition party. No specific fixed time schedule is stipulated for the parliamentary scrutiny of external audit reports submitted by the Auditor General. The Committee shall report to the House at least twice a year.
Summary of scores and performance table
Indicator/Dimension Score/Scoring Criterion Explanation
PI-31 Legislative scrutiny of audit reports
(Scoring method =M2-AV)
Overall score
D
31.1 Timing of audit report scrutiny
Time period: Last 3 completed FYs
D
Performance is less than required for a C score.
A score of C requires that scrutiny of audit reports on annual financial reports has been completed by the legislature within twelve months from receipt of the reports.
The audited financial statements of the Consolidated Fund for 2014 and 2015 were reviewed by PAC more than twelve months from the date of their receipt from the Auditor General. At the time of preparing the first draft of this report, PAC had not reviewed the report for 2016, ten months after its receipt. .
31.2 Hearings on audit findings
Time period: Last 3 completed Fys
D
Performance is less than required for a C score.
A score of C requires: ‘In-depth hearings on
key findings of audit reports take place occasionally, covering a few audited entities or may take place with ministry of finance officials only’.
In-depth hearings, if they take place, are conducted in the presence of officers of the audited entities and the AuditorGeneral.
The PAC held a number of hearings during 2014-16 on the audited CF financial statements and on the audited financial statements of individual MDAs. All of these, however, related to the audited
56 Project Appraisal Document, issued on April 23,2015, World Bank Progress Report of the PFMRP in January 2017.

162
Indicator/Dimension Score/Scoring Criterion Explanation
financial statements covering FYs 2012-13.
The hearings, if held, are in depth and are only for those MDAs that have displayed financial weaknesses and irregularities (equivalent to a qualified or adverse opinion).
31.3 Audit recommendations by the legislature
Time period: Last 3 completed FYs
D
Performance is less than required for a C score.
A higher score requires recommendations should be issued by the Parliament based on the PAC reports for each of the last three FYs.
The PAC reports issued contain recommendations, but relate to years prior to FYs 2014-15.
The legislature should issue recommendations on actions to be implemented, based on the findings of the PAC reports.. The GAS mainly conducts the follow-up on the implementation during the next year’s audit.
. Parliament does not have a recording system to facilitate follow-up on implementation.
31.4: Transparency of legislative scrutiny of audit reports
Time period: Last 3 completed FYs
D
Performance is less than for a C score.
A score of C requires: ‘Committee reports are published on an official website or by any other means easily accessible to the public’
.
PAC hearings have yet to be held on the audited annual financial reports on the Consolidated Fund covering 2014-16, as the reports have yet to be reviewed by PAC. (Table 3.27)
The PAC report on the audited Pubic Accounts of MDAs was prepared and tabled to Pariament only for FY 2014. The PAC report for 2015 has not yet been prepared (Table 3.27) though hearings have been held. The PAC has not yet reviewed the audit report for 2016.
When they happen, PAC hearings are conducted in public and reports are published following debate on them in Parliament.
31.1. Timing of audit report scrutiny
This dimension assesses the timeliness of the legislature’s scrutiny, which is a key factor in the effectiveness of the accountability function.

163
As indicated in Table 3.27 below, at the time of the PEFA assessment field visit, none of the three audited financial statements on the Consolidated Fund for FYs 2014-2016 had been reviewed by the Public Accounts Committee (PAC).
The House adopted the Public Accounts audit of the MDAs for FY 2014 within three months from the date of receipt of the report (as shown in Table 3.22). The PAC discussed the Public Accounts Audit of the MDAs for FY 2015 eleven months after the date of receipt. At the time of the field visit of the 2018 PEFA Assessment, the audit report had not yet been tabled before the Parliament. The PAC has not yet discussed the Public Accounts Audit of the MDAs for FY 2016.
Obtaining information from the Parliament about the dates of receipt of audit reports and their eventual tabling before the Parliament following a review by the PAC was not easy. The PAC does not seem to have a system of recording such dates. In this context, there is no register, log book or filing system to keep track of the dates on which PAC receives reports and supporting documents, discusses them, conducts public hearings, and submits them to the full chamber.
Table 3.27: Time between the receipt of reports by the PAC and completion of their review by the legislature
GAS Reports on financial statements for FY 2014
GAS Reports on financial statements for FY 2015
GAS Reports on financial statements for FY 2016
Consolidated Fund61 Received from the GAS on June 30, 2015. Not yet reviewed by the PAC, 34 months after date of receipt.
Received from the GAS on September 14, 2016.
Not yet reviewed by the PAC, 17 months after date of receipt.
Received from the GAS on June 30, 2017.
Not yet reviewed by the PAC, 10 months after date of receipt.
Public Accounts of MDAs 62
Received from the GAS on December 21, 2015.
The Parliament adopted the report on March 8, 2016, less than 3 months after the date of receipt from the GAS.
Received from the GAS on December 21, 2016.
PAC discussions on November 1, 2017.
Not yet tabled before the Parliament, 16 months after the date of receipt from the GAS.
Received from the GASon August 7, 2017.
Not yet reviewed by the PAC, 8 months after the date of receipt.
Source: Parliament of Ghana.
31.2 Hearings on audit findings
From 2014-2016, the Public Accounts Committee (PAC) held hearings on only two GAS reports regarding the CF annual financial statements. These were for the reports for FYs 2012 and 2013 and so fall outside the scope of this PEFA report. In 2016, the PAC conducted 7 public sittings to 61 The Reports of the Auditor General on the Public Accounts of Ghana (Consolidated Fund) were tabled on October 12, 2016. On October 29, 2016, the House adopted the report of the Public Accounts Committee for the report of the Auditor General on the Public Accounts of Ghana (Consolidated Fund) for the year ending December 31, 2012 and for 2013. 62 On February 10, 2015, the House adopted the Public Account Audit of the MDAs for the year ending December 2013.

164
consider these two reports. These reports were subsequently tabled before the Parliament that year. As indicated in Table 3.27, the PAC has not yet reviewed the GAS reports for 2014-16, indicating a sizeable backlog
The PAC held 23 days of public hearings in 2017 to consider five different audit reports of the
Auditor General. One of the reports considered was the audited Public Accounts of the MDAs
for 2015, the only one relevant for this indicator as PAC hearings on the audit report on the
annual financial statements for 2014-16 have not yet been held. . The other four covered other
subjects, as noted under PI-30.2. Hearings were held only for the 22 MDAs (about half the total)
for which financial weaknesses and irregularities were identified by GAS. MDAs do not prepare
individual annual financial statements for audit, the result of which an audit opinion, but
financial weaknesses and irregularities imply a qualified or adverse opinion.63
Representatives of the audited agency attend hearings.The representatives of the GAS also attend in
order to answer questions from the PAC. The hearings are therefore generally in-depth (as defined in
the Framework document). This was also the case in previous years, as indicated in previous PEFA
assessments.
31.3. Audit recommendations by the legislature
In 2016, the PAC made 13 recommendations involving retrieval of misappropriated public funds64. Yet, the PAC does not maintain a record to keep track of the implementation of its recommendations. The PAC official indicated that it depends on the Auditor General to follow-up on actions taken by the audited entity. The Auditor General reports submitted to the Parliament contain actions taken by the audited entity (PI-30).
The large backlog of audit reports facing the PAC tends to preclude its effectiveness in prescribing recommendations. In any case, the meaningfulness of these recommendations is diminished by the fact that they come a long time after the year in which the problems occurred.
31.4. Transparency of legislative scrutiny of audit reports
The PAC hearings on the audited PublicAccounts are covered live on television and radio held in the Parliament House and have appeared on YouTube. Public hearings are also open to the Parliamentary Press Corps, an association of 150 journalists. There is no restriction to access.
63 Part 1 of the report summarizes financial weaknesses and irregularities according to seven categories: Tax
Irregularities, cash irregularities, outstanding debts/loans, payables irregularities, contracts irregularities, rent
payment irregularities, and stores/payments irregularities. The financial impact of these came to GHC 2.16 billion
of which GHC 2-05 billion represented cash irregularities.
64 These were cited in the reports of recommendations issued by the Public Account Committee. Recommendations were provided on the performance audit reports.

165
The PAC reports are debated in the full chamber of the legislature. Parliamentary Press Corps members sit in the Press gallery. PAC reports are debated in the full chamber of the legislature. The debates are published and shared with the respective entities, though not published on the official website of the legislature. However, the debates are broadcasted on television and radios. The assessment team watched and reviewed some of the video posts from YouTube. Some of the hearings are available on YouTube posts by news agencies. A sample of YouTube links is included in Annex 3 of the PEFA report.
Ongoing Reforms
The World Bank65 is supporting the upgrading of PAC’s review process for audit reports. As part of the PFM reform process, orientation and training were provided to PAC members and the staff of the PAC Secretariat in 2015.
65 Public Financial Management Reform Project (P151447) – Project period: May 15, 2015 to June 30, 2019.

166
4. CONCLUSIONS OF THE ANALYSIS OF PFM SYSTEMS
4.1 Integrated assessment of PFM performance
Pillar 1: Budget Reliability
The scores for PIs 1-3 are a D, C+ and D+ respectively, indicating that the approved budget was not a reliable predictor of actual expenditure and revenue performance. Actual aggregate expenditures were much higher than budgeted amounts. The reasons were that expenditure commitments were being made that were not budgeted for and were made outside of the GIFMIS. This was particularly the case for 3 MDAs, namely, the Ministry of Roads and Highways, the Ministry of Works and Housing, and the Ministry of Local Government and Rural Development. The deviations were particularly high in 2016, which was an election year. Election years in Ghana tend to be associated with an expenditure boom. Large civil service wage increases also contributed to the D score. At the same time, revenue performance fell far short of budget amounts, partly because of sharp declines in international crude oil prices, as well as in the volumes of crude oil produced in Ghana.
The combination of expenditure overruns and revenue underperformance led to fiscal slippage relative to the fiscal targets under the IMF-supported ECF program.
The expenditure commitments made outside of the GIFMIS led to large payment arrears outstanding at the end of 2016 (PI-22). This, in turn, led to the new Government (that took power in early 2017) making a request of the GAS to conduct an investigation. The report, issued later in 2017, unveiled the internal control weaknesses that led to the over-expenditure commitments (PI-25.2 scores a C on commitment control). The GIFMIS can guard against over-expenditure commitments, but this does not work if the MDAs are able to circumvent the GIFMIS.
Revenue under-performance, though partly due to exogenous factors, also reflects continuing problems in the GRA in enforcing compliance with the law. This is reflected in D scores for PI 19.2, 19.3 and 19.4. The GRA still does not have an effective compliance improvement plan, and risk-based auditing is still in its early stages. Revenue arrears are high. There may also be problems in accurate revenue forecasting. Slow progress is being made in reducing the scope of tax exemptions (the last mentioned being a structural reform benchmark under the ECF). One of the 3 components of the World Bank-financed GEMSP is the strengthening of GRA’s performance.
Pillar 2: Transparency of public finances (PIs 4-9)
PIs 5-7 score low. PI-5 on the content of budget documentation scores a C because of the lack of information on budget performance in the previous year. This seems to be mainly due to the time it takes for data on actual performance in the previous year to be published. However,

167
performance in this area seems to be improving due to the roll out of the GIFMIS over much of the country.
PI.6 on the extent that extrabudgetary operations are captured in financial reports scores a D. This is because expenditures of the retained portions of IGFs, Statutory Funds (for example, the GETFund) and donor-funded projects/programs are not reported in financial reports, as they are considered extrabudgetary. The main financial report prepared by the GoG is the annual financial statement prepared by the CAGD. This only covers expenditures financed through the Consolidated Fund, which excludes the afore-mentioned three items.
This situation will change due to the PFMA (2016), which requires annual financial reports to cover all GoG spending, regardless of the source of funding. PI-6.3 on the preparation of annual financial statements by legally autonomous agencies providing public services scores a D because the preparation of such statements lags significantly behind the legally mandated deadlines. This seems to be due to capacity constraints in these agencies.
PI-7 on the transparency of the system of transfers to sub-national governments scores a C+. The first dimensions on the transparency of rules-based transfer formulae scores a C. This is because DACF’s rules-based formula for transferring funds is transparent for less than 30 percent of the funds to be transferred. PI-7.2 on the timeliness of the information provided to District Assemblies on the amount of transfers scores a D because of the new DACF formula not being known to the MMDAs until after the start of the new FY.
Pillar 3: Management of Assets and Liabilities
PI.10 on fiscal risk reporting scores low, with a D score (10.1), for the monitoring of the financial performance of state-owned enterprises (SOEs), due to their very late submission of audited annual financial statements to the State Enterprise Commission (SEC). This would not matter so much if these SOEs were in good financial condition, but the opposite is the case. Given their importance to the economy, their poor financial state poses large fiscal risks to the GoG to the extent that they threaten macroeconomic stability. The financial linkages between SOEs implies that one poorly performing SOE that cannot pay its bills and/or taxes causes a loss of revenues to other SOEs. Inter-enterprise arrears start to pile up, liquidity tightens due to a lack of cash, and production falls. Tax revenues fall, causing the GoG to cut expenditures, with resultant negative downstream impacts. Alternatively, the GoG borrows more, leading to debt sustainability problems. The fees that the GRA collects (3 percent of revenues collected) fall, leading to cost-cutting by the GRA — and perhaps an adverse impact on tax collection. Private sector companies that do business with SOEs are financially impacted by the S0Es inability to pay their bills, also leading to an adverse chain reaction.
Some of the SOEs are in debt to their creditors. Many of these loans are guaranteed by the GoG, which also poses a fiscal risk to it if the guarantees are called. Rather than guaranteeing loans, the GoG prefers to use on-lending arrangements, whereby it borrows funds and on-lends them to SOEs. This provides scope for the MoF to apply pressures on the SOEs that are delaying debt

168
service payments to it, but in the end the MoF is required service the loans if the SOAs cannot pay.
The IMF, through its ECF review, expresses alarm at this situation and stresses the urgent need for the GoG to do something about it. Through its periodic Memorandum of Economic and Financial Policies (MEFP), which are appendices to the ECF reports (available on the IMF website), the GoG has indicated some actions it is taking to help SOEs to improve their financial performance. The scope of the GEMSP, referred to above, also includes measures to strengthen the SEC.
PIs 11 and 12 cover public investment planning and financial and non-financial asset management. PI-11 has not been rated, as it only covers planned capital projects with a cost of over 1 percent of the budget. Also, the Public Investment Management Department established in the MoF in 2010 is still not fully operational. It is receiviing assistancethrough the GEMSP. A World Bank study on the quality of public investment in Ghana considered it to be low, with new capital projects being selected without proper justification. This posed both a fiscal risk (including expensive, but non-productive, capital projects placing stress on the overall budgetary framework) and fiduciary risk (a misallocation of resources through funds being used to finance inefficient and ineffective expenditures). In the meantime, risk could be reduced through more care being taken in the selection of capital projects as a part of the budget preparation cycle (PI.17).
PI- 12 on asset management scores a D+, as the CAGD at present does not pro-actively manage its financial and non-financial assets in order to increase the yield from them. This is because the types of assets it has are generally not amenable to active trading (for example, cash, loans and shares in loss-making SOEs). It keeps a record of fixed assets, but it does not actively manage them (D score). This does not mean much, as they are expensed on purchase. If accrual accounting is adopted at some point in the future, more pro-active fixed asset management may be desirable to determine annual depreciation expenses. In the meantime, the low scores do not pose any significant fiscal and fiduciary risk.
PI-13 on debt management scores a B overall. A major improvement in recent years has been the preparation of rigorous medium-term debt management strategies. This is important in the context of Ghana’s adverse macro-fiscal situation in recent years, and the desirability of substituting costly short-term domestic debt by longer-term debt. The IMF, in its ECF reviews, has focused on this point. The periodic issue of medium-term Eurobonds to replace expensive domestic debt is a case in point. Another improvement in terms of transparency is the production of the MoF’s first-ever annual debt management report in 2017. Debt reconciliation issues arise between the DMD and the CAGD, and between the CAGD and the BoG, but these do not appear to be major issues. Perhaps a more important reconciliation issue concerns the correct value of GoG-guaranteed debt, which is incurred by SOEs reporting to their parent MDAs. The MoF needs to have accurate records of such debt in order to avoid unpleasant shocks if guaranteed loans are called.

169
Pillar 4: Policy-based Fiscal Strategy and Budgeting, PIs 14-18.
These score a B, B, B, C and B+ respectively. PIs 14-16 are new indicators. Regarding PI-15 on Fiscal Strategy, the main element is the requirement under the PFMA that a Fiscal Strategy Document (FSD) be prepared for approval by the Cabinet by May. The FSD indicates the fiscal outcomes that that GoG wants to see in the medium term (such as macroeconomic stability, the strategic allocation of resources consistent with medium-term goals for socioeconomic development, and the efficient allocation of resources) and how these outcomes will be achieved. The FSD would inform the preparation of the Budget Call Circular, issued to the MDAs later in the year. Such a document (also known as a Pre-Budget Statement in some countries) has become commonplace in many countries.
To some extent, the annual Budget Statement and Economic Policy submitted to the Parliament in November of each year contains the fiscal strategy for the medium term. The Treasury Guidelines issued by the MoF at the start of the budget preparation period also outline the fiscal strategy for the medium term.
The first-ever FSD was prepared in May 2017. The FSD is approved by the Cabinet, but it is not provided by the Parliament. The Cabinet considers this to be a confidential working document that presents different scenarios for the Cabinet to discuss (the IMF in its third review of the ECF considered that the FSD should be presented to the Parliament; the GoG may consider doing this at some point).
PI-17 on the annual budget preparation, rather surprisingly perhaps, scores a C. This is because of insufficient time being given to the MDAs to prepare their draft budgets after they have received the Budget Circular (PI.17.1). PI-17.2 on the clarity of the budget preparation guidelines only scores a C because the Budget Circular is not first approved by the Cabinet prior to its circulation to the MDAs. If the the FSD were to be issued earlier in the year, this might help to resolve these issues.
Achieving high scores for these indicators does not guarantee perfect annual budgets. This is because inefficiency and ineffectiveness may be built into approved budgets, which may then carry forward to future years. Periodic comprehensive spending reviews outside of the budget cycle are needed to prevent this from occurring. These are not yet practiced in Ghana.
Pillar 5: Predictability and Control in Budget Execution, PIs 19-26.
PIs 19 & 20 on revenue administration and accounting. As indicated under Pillar 1, weaknesses under PI 19 may be causing revenue collections to be lower than they could be, thus potentially contributing to macroeconomic instability. PI-20 on revenue accounting scores a C+ because insufficient knowledge of the stock of revenue arrears under PI-19.4 hinders complete reconciliation between taxes assessed and revenues arriving in the Consolidated Account (low score for PI 20.3).

170
PIs 21 & 22 on budget execution, scores a C+ and D+. The budget execution system does not deliver a predictable and timely release of funds to the MDAs during the year. A cash rationing system seems to be in place. The MDAs can commit expenditures for payment up to 3 months ahead (B score for PI 21.3), but the number and value of invoices presented for payment is often more than the cash available, leading to delayed payment of invoices and enhancing the chances of unpaid bills at the end of the year. The selection of which invoice to pay requires a degree of prioritization, which seems rather arbitrary.
All MDAs met by the team said that the main problem they had with the MoF was delays in budget releases, hindering the timely execution of their budgets. A suggestion in one of the IMF’s reviews on progress in implementing the ECF was that the time horizon for making commitments should be for only 1 month ahead, thus matching the monthly cash releases. However, such a short time horizon might make it more difficult to effectively plan budget execution.
There are many reasons for such uncertainties, including: problems in estimating budgets accurately in the first place; difficulties in the day-to-day inflows and outflows of funds; spare cash sitting in bank accounts that cannot be accessed (a problem that the TSA system would address); unexpected demands for cash (for example, for VIP travel abroad); and contractors bringing forward planned project implementation to the current year from the next year. The IMF has indicated it may provide more technical assistance for improving cash flow forecasting (PI 21.2).
As noted PI-1, PI-22 on payments arrears scores a D.
PIs 23-25 on internal controls and procurement
PI-23: Payroll controls: Strengthened payroll control is one of the most important structural reforms required under the IMF-supported ECF program. Weak controls pose considerable fiscal risk. The periodic ECF reviews indicate that payroll control is strengthening. The gradual roll-out of the Human Resource Management Information System (HRMIS), the biometric personnel registration, the monthly payroll validation system via E-SPV, and a strengthening of the payroll audit system are all contributing to a strengthening of payroll controls. Unlike IPPD2, the HRMIS, located in the Public Service Commission, can check that employees are on staff establishment lists. Therefore, it is not possible to hire someone who is not on that list.
The PEFA score is a C+. Delays in placing new employees into specific positions still occur, and retro-active adjustments continue to be made (C score for 17.2).
PI-24: Procurement: The score is a B, indicating a procurement system that is operating reasonably well, due to reforms in earlier years.
PI-25: Non-salary internal controls: As with payroll controls, strong non-salary internal controls are a pre-requisite for strong PFM as a whole. Weak controls pose significant fiscal and fiduciary risk. Therefore, addressing such weaknesses should be a high priority in any PFM reform program, as it can also enable other PFM reforms.

171
The establishment of the GIFMIS has succeeded in strengthening controls. Most payments are compliant with payment procedures. The exception is expenditure commitment control, which scores a C. Proposed commitments entered into the GIFMIS that are not consistent with the approved budget and quarterly budget allocation systems are rejected. The expanding coverage of the GIFMIS, which now covers much of proposed spending financed by retained IGFs, is reducing the scope for proposed commitments escaping the controls. However, it still happens, as noted under PI-1.
Part two of this chapter elaborates more on internal control systems.
PI-26: Internal audit: Internal audit has been functional for some time, but falls short of international standards in some respects, resulting in an overall score of a C+. Nearly all MDAs have internal audit units (IAUs), which follow international audit standards. The main issue is that IAUs focus primarily on compliance checks rather than systemic issues. Also, auditors still carry out pre-audit functions, because they are requested to do so by management to help alleviate staff shortages. PIs 26.1 and 26.2 therefore score a C. The IAUs prepare and implement up to 75 percent of them, thus scoring a C. More than 75 percent of audit recommendations are implemented within a year (score B).
Pillar 6: Accounting and Reporting, PIs 27-29
The scores are a B, C+ and C+ covering Financial Data Integrity, in-year budget reports and annual financial statements. PI-27.1 scores a C for the regularity of bank account reconciliation. It would be a B, but reconciliation of commercial bank accounts for retained IGFs and donor projects takes longer than for the Consolidated Fund. The score for PI-28 is also affected by in-year budget reports prepared by the CAGD that do not include expenditures of retained IGF and donor-funded projects. The same goes for PI-29. The CF bank accounts comprise about 75 percent of all GoG-held bank accounts. Thus, the fiduciary risk associated with the less timely reconciliation of bank accounts for retained IGFs and donor-funded projects is limited.
Pillar 7: External Scrutiny and Audit
The external audit function (PI-30) performs well, scoring a B. The annual external audit reports on the Consolidated Fund and the MDAs are very useful in helping to assess how well internal controls are working.
The quality of the reports also helps the legislature in its job of reviewing the reports submitted to it by the GAS. PI-31 assesses the effectiveness of legislative scrutiny of external audit reports. It scores an overall B, but this masks a major weakness, namely, that by the time the legislature starts to look at audit reports, it is already more than 2 years after it has received them (PI 31.1 scores D). By that time, the meaningfulness of the scrutiny is beginning to fade. Moreover, although the legislature issues recommendations on what actions the Executive needs to take in response to audit findings, it does not have a recording system to track the extent to which such recommendations are being addressed (PI 31.3). This results in a reduction in the power of the

172
Legislature to exert its influence on the Executive — and to ensure that the Executive is taking the legislative scrutiny exercise seriously.
4.2 Effectiveness of the internal control framework
The Internal Control Framework, when functioning well, is expected to achieve three objectives, namely: ensuring the effectiveness and efficiency of government operations; ensuring accurate and reliable internal and external financial and non-financial reporting to stakeholders; and ensuring compliance with laws and regulations, including accounting standards.
Control Environment: There is an overall commitment at the top to integrity and ethical values. Indeed, fighting corruption is high on the agenda for the Government of Ghana, as outlined in the National Anti-Corruption Action Plan. Oversight responsibilities are exercised by Parliament, as well as at the management level. The Auditor General, the Commission on Human Rights and Administrative Justice (CHRAJ) and the Economic and Organized Crime Office (EOCO)66 are exercising their enforcement roles. The government structure clearly defines authority and responsibility according to (PI-25 (i)).
Despite the overall commitments to manpower development, constraints in the full application of accounting and auditing standards — including IPSAS (PI-29) and INTOSAI (PI-30). (PI-26) —are mainly attributed to limitations in staff capacity and resources for operating costs. The Public Service Commission is working toward ensuring the right number and quality of personnel and the establishment of an efficient human resource management system. The quality of personnel databases are concerns for the PSC, which is working on the implementation of the HRMIS and ongoing HR audits.
Risk Assessment: The various ongoing PFM reforms will have a significant impact on existing internal control processes. The organizational level risk assessment is instrumental in becoming more proactive in assessing the impacts of the reforms and changes in business models on existing control activities. As part of their annual audit plan, the Audit Service and Internal Audit Units are conducting their own risk assessment. These risk assessment exercises are not prepared at the organizational level with the full participation of the management. In addition, these risk assessments are inclined to deal more with compliance rather than systemic risks. In addition, with the influence of executives at the MDAs, most of the internal auditors are allocating a substantial part of their time to pre-audit functions — despite the fact that it is not a requirement, according to the internal audit standard adopted by the Internal Audit Agency (IAA). The IAA officials have indicated their plan for the implementation of organizational risk assessment in collaboration with the Commonwealth.
Control Activities: Control activities are in place for various PFM areas, including cash management, expenditures, procurement, asset management, budgeting, accounting, and recording and reporting. The control activities are deployed through procedural manuals,
66 The EOCO investigated 211 cases, with 18 cases in 2017. Three convictions were secured and five confiscation hearings are pending. The EOCO also recovered GH¢26,749,458.00 from two companies. (Budget Statement 2018).

173
regulations and acts. The segregation of duties (PI-25), monthly verifications (for example, the payroll) and reconciliations (for example, bank accounts and debts) are among the control activities being implemented. The control activities in the application of technologies are embedded into the respective systems (including the GIFMIS, IPPD, HRMIS, and budget module). The use of these systems is based on the level of access permitted and in line with specific tasks. Control activities should be regularly reviewed for effectiveness, taking into account changes in business models and working methods. The lack of organizational level risk assessment and the limited coverage of systemic audit limit the opportunity for identification of new control activities and revision of existing ones. The recurring nature of irregularities in payroll and procurement, as well as the unauthorized use of IGFs, shows the limitation in the effectiveness of control activities.
Information and Communication: Financial and non-financial reports are prepared by the MDAs and submitted to their management. The IAUs submit their reports on a quarterly basis to management, the audit committee and the Internal Audit Agency. Fifty-nine percent of the overall expected internal audit reports were issued by the IAUs in 2016. As stipulated in the various Acts, the MDAs are submitting quarterly financial reports and annual financial reports on a timely basis. The GAS submits audited financial reports to Parliament. In-year and annual budget execution reports issued by the CAGD are not complete because they do not include IGFs and donor-funded activities contained in the budget document. However, the MDAs are reporting internally and externally, as applicable, their financial reports, which include IGFs and donor-funded activities.
The implementation and roll-out of the GIFMIS has enabled the timeliness and accuracy of financial reports with multiple analytical reports. The use of the IPPD, E-SPV, and HRMIS has enabled the generation of relevant payroll and HR reports which facilitate the evaluation of the effectiveness and efficiency of the internal control systems in place for payroll expenditure control.
Monitoring Activities: Oversight bodies, including the Parliament, the MDA heads, and the audit committees, monitor the implementation of findings and recommendations. The IAA plays an oversight role in the performance of the IAUs, including quality assurance — although its level of support is constrained by capacity. The number of performance audits conducted by the GAS declined sharply from six audits in 2015 to one audit in 2016. The Quality Assurance Unit of the GAS conducts quality assurance activities, including the observance of auditing standards. The official of GAS indicated that AFROSAI-E also conducts a quality assurance review. Although performance audit manuals are distributed by the IAA, the IAUs do not conduct performance audits, mainly due to capacity and resource limitations. The hearings of audit findings by the Parliament are public, and they have contributed to the range and timeliness of management responses. The delay in hearings by the Parliament on audit reports (PI 31.1) affects the timeliness of communications and actions regarding reported deficiencies.

174
4.3 PFM strengths and weaknesses
PFM strengths
The 1992 Constitution provides a solid foundation for PFM, guaranteeing autonomy for Independent Government Institutions (IGIs) such as Parliament, Ghana Audit Service, the Judiciary, Electoral Commission, and National Commission for Civic Education, among others. The main strength is a solid legal and institutional setting for PFM, accompanied by a skilled, dedicated and well-led civil service. Ghana has been independent since 1957 and has been able to develop these strengths over the course of six decades. The structure is robust, and the Ministry of Finance and the CAGD serve as the two main institutional pillars. They provide solid guidance and leadership to the MDAs that deliver the public goods and services that Ghana needs as a prerequisite to socioeconomic development. Ghana is now a middle-income country, with strong PFM playing a major role in achieving this status. Many other African countries tend to esteem Ghana as an example of how to use PFM systems to support such successful development.
PFM could be improved. However, its institutional strengths indicate that the wherewithal to strengthen PFM is firmly in place.
PFM Weaknesses
Fiscal risk
Fiscal risk represents the risks to aggregate fiscal discipline posed by weaknesses in PFM performance. As indicated in Section 2, macroeconomic stability was adversely affected during 2013-17 by falling world prices of crude oil and cocoa, as well as by disruptions to the supply of crude oil to the main oil refinery. The GoG entered into a financial support arrangement, the ECF, with the IMF. To receive this support, the GoG undertook the implementation of a number of fiscal tightening measures (for both revenues and expenditures), as well as some structural reforms in relation to SOEs, and revenue administration and payroll control. Measures were also taken with regard to budget execution, and reporting and accounting though the establishment of the GIFMIS, starting in 2010, and the establishment of the TSA, starting in 2015.
Performance in implementing the ECF program during 2015 was generally good, but major fiscal slippage occurred during 2016, partly related to the general election in late 2016. Performance was much improved during 2017. This was partly because of improving crude oil prices, but also because the new incoming government appeared determined to implement the revenue and expenditure measures needed to ensure fiscal sustainability, as well as to fully implement the structural reforms agreed to through the ECF. The latest ECF review (5th and 6th) posted on the IMF’s website (in early May of 2018) was very positive in its assessment of the GoG’sability to meet the fiscal targets agreed to with IMF. However, it highlighted the strong need to ensure that structural reforms are indeed implemented.

175
The most critical structural reform identified under the ECF program was the reform of SOEs, the financial performance of which continues to pose a major fiscal risk to the GoG and the whole economy. The SOEs comprise a major part of the economy and their financial weaknesses can reverberate over the entire economy. The SOEs are strongly interlinked, thereby reinforcing the chain reaction caused when some SOEs get into trouble This is discussed under PI-10.1 in Section 3 (D score). Financial weaknesses impact on revenues collected by the Ghana Revenue Agency (GRA), potentially further undermining macro-fiscal stability. The three previous PEFA assessments also identified the fiscal risks posed by loss-making SOEs. Thus, the issue is not a new one.
PI 10.3 and PI 13.1 on debt management cover the potential risk posed by contingent liabilities to the GoG in the form of government guarantees provided on loans to SOEs. It is not clear that the MoF’s Debt Management Department is systematically monitoring such loans. In this regard, the recording of such guarantees appeared for the first time in the Public Debt Management Report of 2016, the first one ever prepared, as required by the new PFMA.
Another critical structural reform agreed to under the ECF program was the need to strengthen revenue administration. Fiscal tightening has mainly been on the expenditure side, with adverse effects on service delivery. Opportunities to mobilize more revenues through both tax policy measures (for example, reducing the number of exemptions) and structural reforms (for example, strengthening compliance with tax laws and procedures,placing more emphasis on risk-based audits, and focusing on the major areas of non-compliance) have yet to be taken. PI 19 on revenue administration scores an overall D+ (A, D, D and D). Revenue arrears are large (D for dimension 4), indicating that a large source of revenues have, to date, been foregone.
Fiduciary risk
Fiduciary risk represents the risks posed to cost effectiveness (both in terms of the strategic allocation of resources and the efficiency of service delivery) in the use of fiscal resources.Fiduciary risk arises in the following areas:
Budget preparation
Annual budgets and medium-term expenditure frameworks need to be well prepared so that they accurately reflect the costs of the public services that a government wants to provide, consistent with its development goals. Inaccurate costing runs the risk of over- or under- expenditure, thereby requiring budget adjustments during the year. This implies both an original sub-optimum allocation of resources and lower efficiency of service delivery than would otherwise be the case. Inefficiencies may become entrenched in the budget framework, as they are carried over from year to year.
PI-17 on annual budget preparation scores low (C) for dimensions (i) and (ii) due to insufficient time given to the MDAs to prepare their draft budgets, and the Cabinet only approving the budget circular after it has been distributed to the MDAs. It is not clear, however, whether this

176
impacts on the quality of the approved budget. However, even if the scores were As, this would not rule out the budgets being inaccurately costed.
To deal with this issue, some countries (for example, the UK) routinely carry out periodic comprehensive spending reviews in order to eliminate inefficient and ineffective spending, thereby reducing fiduciary risk.
Budget execution appears to be less than optimum, with MDAs only receiving budget releases after a long delay. The number one complaint of the four large MDAs met by the team was delays in budget releases. This, in turn, leads to delays in the MDAs being able to provide the public services according to their approved budgets. Revenue shortfalls (PI-3) and unpredictable expenditure demands contribute to this situation. Even when budget releases are approved, they still do not provide the certainty that the cash to pay the bills will indeed be available. In this context, the amount of the approved invoices tends to exceed the amount of cash available (according to the Cashier’s Office in the CAGD). Underlying factors include ineffective commitment controls, due to controls in the GIFMIS being circumvented (as pointed out by the Auditor General in his review of the large stock of payment arrears outstanding at the end of 2016), along with surplus cash sitting in the commercial bank accounts of the MDAs. As a result, PIs 21 (predictability in the availability of resources for budget execution), 22 (expenditure arrears) and 25.2 (expenditure commitment control) score low.
This situation should improve as the GIFMIS becomes firmly entrenched and the TSA becomes fully established. However, the bypassing of commitment controls will remain a concern.
Payroll control
Weaknesses in payroll control have been a major area of fiduciary risk for the GoG. A key structural reform agreed to between the GoG and the IMF under the ECF agreement focused on strengthening payroll control. The ECF reviews indicate considerable progress in strengthening controls, as also indicated under PI-23 in Section 3.
Transparency of annual financial reports
As noted, PI-6 (Central Government operations outside financial reports) scores low (D), implying a degree of fiduciary risk. Due to the way in which the Financial Administration Act (2003) was formulated, the annual financial reports prepared by the CAGD cover only expenditures financed from the Consolidated Fund, into which the revenues collected by the GRA are deposited. They do not cover expenditures financed by the IGFs that the MDAs are allowed to retain; the expenditures financed by donor funds; or the expenditures financed by Statutory Funds, such as the GETFUND. The GETFUND provides statements directly to the Parliament. However, this situation is not as transparent as it would have been if the resources channeled through the GETFUND had instead been channeled directly to the annual budgets of the Ministry of Education. The amount of extrabudgetary spending on the provision of public services appears to be at least 10 percent of the GoG’s approved budgets.

177
Autonomous agencies that provide public services financed in part by IGFs do not prepare their annual accounts in a timely manner, also implying a degree of non-transparency —and thus a degree of fiduciary risk (D for PI 6.3).
This situation will improve once the PFMA (2016) becomes effective. It is awaiting the finalization and approval of the accompanying Financial Regulations.
Transparency of inter-governmental transfers (PI-7)
This scores a C+ due to the non-transparency of about two-thirds of the transfers to the District Assemblies (DAs) from the GoG, and to the late provision of governmental information to the DAs regarding the amount of annual funding they will receive. As a result, the MMDA budgets are not approved until well after the start of the new FY, leading perhaps to a lower quality of service delivery than otherwise would have been the case.
Public Investment Management (PI-11)
A World Bank study in 2010, later confirmed by an IMF study, indicated that large public investment projects tend to be inadequately prepared and executed, representing a significant degree of fiduciary risk. The GoG is in the process of addressing this through the World Bank-financed GEMSP approved in 2015.
4.4 Performance changes since the 2012 PEFA assessment (the latest one)
The 2012 PEFA assessment was conducted using the 2011 PEFA Framework. As per the PEFA Secretariat Guidance Note and the Concept Note specific to this Ghana PEFA assessment, the 2011 PEFA Framework is used to assess the situation at the time of the 2018 Framework. A summary table and accompanying narrative is provided in the Summary, and the detailed table is provided in Annex 5.
Table 2 of the Summary indicates changes in PFM performance since the 2012 assessment. The
changes are assessed by applying the 2011 PEFA Framework to the situation at the time of the
2018 PEFA Framework. Due to the many differences between the 2011 and 2016 Frameworks,
comparability issues arise if the 2016 Framework is used to assess performance changes. In many,
but not all, cases, resolving these issues is straightforward. The PEFA Guidance Note on
conducting repeat PEFA assessments thus stipulates that the same Framework should be used
when assessing performance change.
PFM performance has strengthened to some extent, helped by the establishment of GIFMIS
shortly after 2012 PEFA assessment. The main areas of strengthening are:
PI-4 on payments arrears; score increased to D+ from D. This is due to the strengthening
of the monitoring of arrears, which should help GoG to take more effective action to
guard against the arrears being incurred in the first place. Significantly sized arrears risks
damageing the credibility of the budget, with potential negative impact on all the three

178
budget outcomes (aggregate fiscal risk, strategic allocation of resources and efficient
service delivery).
PI-9: Monitoring of the financial situation of MMDAs; score increased to C+ from C.
MMDAs potentially pose significant risk for GoG and thereby impact negatively on
aggregate budget discipline and the strategic allocation of resources (bailing out MMDA
if financed by borrowing could: (i) jeopardise the aggregate fiscal discipline of GoG; (ii)
could impact negatively on the strategic allocation of resources if GoG finances the bail
out by reducing expenditure in sectors of strategic importance; or (iii) reducing
expenditures that could impact negatively on efficient service delivery.
Strengthened knowledge of the financial situation of MMDAs would help GoG to identify
financial problems of MMDAs ahead of time and to help MMDAs to plan and implement
mitigative actions.
Payroll control (PI-18). Strengthening is underway, though not yet reflected in the
scoring, through:
(i) the introduction of the Human Resource Management Information System (HRMIS)
into the Office of the Civil Service, which makes possible the linking of the establishment
list, kept by the Office of the Civil Service, with IPPD. This strengthens payroll control, as
it prevents any one from being hired who is not on the establishment list. This is still work
-in-progress as less than 50 percent of GoG employees have been put into the system (PI-
18(i)).
(ii) More timely updating of payroll records and fewer retro-active adjustments, still
work-in-progress ; (PI-18 (ii); and
(iii) Establishment of Electronic Salary Verification (E-SLV), which helps strengthen
internal control. still work-in-progress (PI-18 (iii))
Weak payroll controls pose both fiscal risk (threat to aggregate fiscal discipline) and
fiduciary risk (wasteful spending on wages and salaries detracting from efficient and
effective service delivery. The IMF program of support for Ghana places considerable
emphasis on the importance of strengthening payroll systems.
Procurement systems (PI-19) improvement; score increased to B from C. More
procurement is taking place on a competitive basis and more procurement information
is being made available to the public, thus strengthening transparency. More competitive
procurement impacts positively on the efficiency of service delivery and reduces the
fiduciary risk of wasteful spending. Improved transparency helps the public to increase
its trust of the procurement system and encourages businesses to use it.

179
Expenditure commitment controls and compliance with controls (PI-20 (i) and (iii)) have
strengthened, helped by the establishment of GIFMIS; increase in score to C+ from D+.
Fiduciary risk to the efficiency of service delivery is diminishing as a result.
Resources received by primary service delivery units (PI-23): Score increased to C from D.
The advent of GIFMIS appears to have considerably strengthened the transparency of
the delivery of resources to service delivery units –those in the health sector in particular.
This has lowered the fiduciary risk of wastefulness in the use of resources, thereby
increasing the efficiency of service delivery.
Bank account reconciliation (PI-22 (i)): Timeliness has improved, mainly due to GIFMIS.
Score increased to C from D. Accurate financial statements are critical for assuring the
public that it is obtaining an accurate picture of GoG accounts. Having accurate bank
reconciliations (i.e. minimal reconciliation errors) helps to ensure that GoG’s annual
financial statements give a true picture if its financial situation and that the incidence of
unwanted and disruptive shocks (with adverse impact on the three budget outcomes)
will be minimized.
External audit (PI-26): Performance has strengthened due to more effective follow-up.
Score increased to B from D+. Lack of effective follow-up may undermine the
effectiveness of the external audit function. An ineffective external audit function may
lead to internal control weaknesses of MDAs not being identified. Such weaknesses could
lead to mis-use of GoG’s financial resources with adverse impacts on the efficiency of
service delivery and perhaps the strategic allocation of resources
The main ‘problem’ areas still outstanding are:
(i) The extent of extra-budgetary operations (EBOs) that are not reported on (PI-7, score D
for both years and for both dimensions). These arise partly from the actual spending by
MDAs of Internally Generated Funds (IGFs) which are retained by them, but not reported on
in the annual financial statements. They also arise from the actual spending by MDAs of
donor grants and funds received from Statutory Funds. Transparency of this spending is
limited, and accountability is limited as the spending is not captured in the annual financial
statements and the monthly budget execution reports prepared by CAGD). The scores for PI-
24 and 25 are low as a result.The fiduciary risk to efficient service delivery and the strategic
allocation of resources is probably significant.
This issue may soon resolved, as the 2016 Public Finance Management Law (PFMA) may soon
come into force when its supporting Financial Regulations are issued. Under PFMA, the
extent of these EBOs should fall sharply.;
(ii) The extent that the financial operations of State-Owned Enterprises (SoE) are not being
sufficiently monitored (and, linked with this, the apparent lack of transparency of loan

180
guarantees provided to them by GoG); (PI 9 (i)) scores D in both years. The fiscal risk is large,
as SOEs requiring extra funding from GoG because of financial difficulties, could lead to
macro-fiscal problems if GoG borrows the funds to pay for the extra funding. The risk to the
strategic allocation of resources is also significant if GoG reduces other spending in order to
finance the needs of SoEs. The cash rationing system operated by CAGD to execute the
budget during the year is due to number of factors (such as unreaiistic budgeting,
expenditure commitments entered into that are not covered by the approved budget) but
the financial difficulties of SoEs are likely another factor.
(iii) Revenue administration (PIs 14-15; scores of C and D respectively for both years. The
low scores indicate deficiencies in revenue administration that are causing revenue
collections to be below what is possible. This could cause spending to be lower than what it
would otherwise be. The strategic allocation of resources may thus be not as optimum as
GoG would like. Or else, GoG borrows more in order raise to raise the resources it wants to
spend. But could then lead to macro-fiscal sustainability problems.
(iv) Parliamentary scrutiny of external audit reports (PI-28); the scores are D in the 2018
PEFA.The PAC is very backlogged in its review of the audited financial statements of GoG.
The PAC as a result only starts hearings 2-3 years after the year in question. The PAC has not
reviewed the audited financial statements for 2014-2016. It is holding hearings on the
reviewed statements from previous years. Likewise, Parliament has not issued any
recommendations on what MDAs should do to address audit findings related to the 2014-16
financial years.
The Parliament has a fundamental role to play in holding the Executive to account for its
financial management. Its ability to play this role appears to be compromised by the long
delays in its review of audit reports. Playing a stronger role would likely reduce the likelihood
of deficient public finance management and thus reduce of negative impacts of this on the
three budgetary outcomes.

181
5. GOVERNMENT PFM REFORM PROCESS
Background
5.1 Approach to PFM reforms
The Government has been implementing PFM reform programs since 1997:
From 1997-2003, and then to 2009, under the PFM Reform Program (PUFMARP). The development of the IFMIS began, a Medium-Term Expenditure Framework was introduced, and external and internal audit functions were launched. According to the Project Appraisal Document (PAD) for the current Public Finance Management Reform Project (PFMRP), the PUFMARP had very mixed results, failing to address issues concerning budget management. The reforms were guided mainly by projects in individual areas which resulted in a lack of synergy in the overall PFM reforms.
2010-2014: The establishment of the GIFMIS as the main driver of PFM reform. The GIFMIS replaced the failed Budget and Public Expenditure Management System (BPEMS), which was a component of the PUFMARP. The GIFMIS focused on renovating core budgeting, accounting and financial reporting systems. By 2014, it was beginning to interface with other PFM systems.
Various weaknesses in institutions, systems and processes (collectively categorized as governance issues) detracted, however, from the effectiveness of the GIFMIS. Budget credibility was low, and the budget execution process was characterized by a lack of discipline. This was particularly evident in budget execution, cash and debt management, payroll systems, financial reporting, the management of accounts receivables and payables, asset management, the identification and management of fiscal risks — in particular those posed by SOEs. In addition, there were connectivity and user issues with PFM IT systems. Low PEFA assessment scores in three PEFA assessments (2006, 2009 and 2012) were reflective of this situation.67
Accordingly, a new PFMR Strategy was established in 2015, the implementation of which was to occur under a PFMRP in the form of a World Bank-financed project. The Strategy would also take governance issues into account.
Government ownership of the PFMRP is important for its success. Accordingly, the Ministry of Finance, under the leadership of the Minister, is responsible for the overarching strategic coordination and oversight of the project. The specific details of the institutional and implementation arrangements to support the project are summarized below.
67 Extracted from paragraph 19 in the PAD, World Bank, (2015).

182
PFM Reform Steering Committee: This Committee provides strategic guidance and oversight of the reform implementation process. It helps in addressing interministerial issues pertaining to the entire PFM reform agenda of the Government.
PFM Reform Technical Committee: This Committee reviews and evaluates all technical issues related to the implementation of the PFMRS. It makes recommendations to the Steering Committee for its consideration. Its work extends to activities of the existing PFM Sector Working Group where development partners are represented. Members comprise program managers of key PFM areas (for example, the budget, the GIFMIS, procurement, and internal audit).
PFM Reform Coordination Office. This Office was established under the leadership of the Chief Director of the MoF. Its key role is to coordinate and consolidate key PFM reform activities.
PFM Reform Project Management: A Project Director is responsible for overall project coordination and leading the Project Management Team (PMT). He/she reports directly to the Chief Director. The PMT comprises financial management specialists, procurement officers, a change management specialist, a communications officer and a monitoring and evaluation specialist. The GIFMIS Secretariat was transformed into the PMT. Its functions are to coordinate the preparation of Annual Work Plans and Budgets (AWPBs), procurement plans, progress reports, quarterly interim financial statements, and annual project accounts. It also arranges the audits of these. The PEFA assessment team reported directly to the Project Director and used the PFMRP’s conference room as a base for operations during the PEFA fieldwork. 68
Program Management: Program managers were appointed to oversee the implementation of project activities under each PFM reform sub-component (including the GIFMIS, the Budget, the HRMIS, Payroll, Internal Audit, External Audit, Procurement, and Legislative Oversight).
5.2 Recent and ongoing reform actions
The PFMRP has four broad components, each with a number of sub-components. Implementation takes place during 2015-2018: Table 5.1 provides a summary.
Table 5.1: PFMRP components 1/
Ghana - PFM Reform Project
1. Enhancing Budget Credibility
1.1. Strengthening Budgetary Planning and Macro-Fiscal Management
1.2. Strengthening Public Investment Management Capacity
68 The PFMRP office occupies two stories of an office building located close to the MoF and the CAGD.

183
Ghana - PFM Reform Project
1.3 Strengthening the Budget Operational Framework
1.4 Fiscal Risk Management and Reporting
2. Public Financial Management Systems and Control
2.1. Strengthening Government Information Systems
2.2. Cash and Treasury Management
2.3. Strengthening Internal Audit Capacity
2.4. Public Procurement Planning, Management and Capacity
2.5. Strengthening Payroll and Pensions Management
2.6. Improving Financial Reporting and Asset Management
3. Reinforcing Financial Oversight and Accountability
3.1. External Audit Capacity Strengthening
3.2. Legislative Oversight
4. PFM Reform Coordination and Change Management
4.1. Project Management and Reform Coordination
4.2. Monitoring, Evaluation and Communications
4.3. Project Financial Management and Procurement
4.4. Just-in-time Interventions and Change Management
1/ Extracted from Table 1: Project Cost Summary, in the PAD, World Bank (2015).
The PFMRP Office prepares annual progress reports on project implementation, the latest of which covers 2017. The report indicates progress has been made in a number of areas. Key results are summarized below.
(1) Improved management and credibility of the national budget
The quality and timeliness of the budget preparation process improved as a result of the enhancement of the budget operational framework, the expansion of the coverage of the budget module (Hyperion, part of the Oracle suite of products), as well as the PBB training and technical support provided to the MDAs and MMDAs. The time taken to capture the detailed budget estimates in Hyperion fell to one month, from two months in 2015.
(2) Increased coverage of the Government PFM systems
GIFMIS coverage: The percentage of public expenditures that passes through the GIFMIS increased from 66 percent in 2015 to 73.25 percent (provisional) in December 2017 and is expected to increase further. The GIFMIS is now capturing transactions of IGFs and Statutory Funds (SFs).in the Annual Financial Statements of the CAGD (this was not the case in 2016, as noted under PI-6s and 29 in Section 3 of this report).
TSA coverage: By the end of 2017, 100 account balances— out of a target of 234 bank accounts — held in 21 commercial banks had been transferred to the BoG. The amount transferred was GH₵ 1.1 billion.

184
HRMIS rollout. The HRMIS has reduced the time allotted to human resource management and has enabled new employees in the pilot MDAs to be paid within one month after recruitment. The operationalization of the system in the pilot MDAs has also reduced the backlog of personnel data awaiting transfer into the payroll system.
Payroll and Personnel verification system (E-SPV): The establishment of this system in 3 regions led to the removal of 11 people from the payroll, which resulted in a savings of unearned salaries of GH₵ 51,849.
Internal audit: The capacity of internal auditors to conduct specialized audits has been enhanced. Seventy-nine staff of selected IAUs and the Internal Audit Agency have been trained in Computer Assisted Auditing Techniques (CAAT), and have been equipped with new computers. Another 10 staff benefited from Certified Information Systems Auditor (CISA) training facilitated by the Ghana Institute of Management and Public Administration (GIMPA). Currently six are CISA certified.
Procurement: The capacity of the PPA to support effective and timely procurement planning and implementation has been enhanced. The online procurement planning tool was upgraded
through the PFMRP. The process of linking the tool to Hyperion and the GIFMIS was initiated. Further, as part of the effort to enhance value for money in the execution of infrastructure projects, a database of the unit costs of infrastructure was developed. This was done after the completion of the value chain analysis in procurement planning, processing and contract management.
(3) Enhanced financial oversight and accountability.
GAS capacity in the use of ICT Tools was strengthened. The networking of 8 out of the 9 regional offices was completed, and an IT Audit Manual was developed to facilitate their work.
The capacity of the Public Accounts Committee, the Finance Committee and research staff of the Parliament was enhanced in the analysis of sector budgets and external loans. Twenty-four staff were trained. The capacity building enabled the Parliament’s Research Unit to prepare 12 sector budget briefs based on the 2016 budget. These in turn helped to inform the Parliamentary committee discussions and debates on the 2017 budget.
The rest of the report provides information on the significant extent to which the planned outputs have been delivered.The fiscal risk component was transferred to the GEMSP.
5.3 Institutional considerations
Government leadership and ownership
Government leadership and ownership are critical in Ghana. The pace of PFM reform is likely to be much slower if the Government shows little interest in it. One example is the 2005 PEFA assessment. This was conducted by development partners with very little participation by the

185
Government, which refused to accept the report. The PEFA website indicates that the 2006 PEFA was the first one conducted in Ghana.
The change in government at the end of 2016 has acted as a boost for PFM reports. The new government appears to be more supportive of PFM reform than the previous government. This is also apparent from the ECF review reports. These have become much more positive since the election, as indicated in the 4th, 5th and 6th ECF reviews. Fiscal and monetary measures taken by the new Government have led to a big improvement in the macro-fiscal situation, and the size of the external and fiscal imbalances is beginning to fall relative to GDP.
Co-ordination across Government
Following the Anglophone tradition, much of PFM in Ghana is the responsibility of the line ministries. PFM reform would probably go nowhere if the ministries were not interested in these reforms, particularly if substantial changes in the way they do things is required. For example, the manual budget execution processes, although less efficient than IT-based processes, provide more scope for leakage of funds than for the IFMIS processes. In Kenya, for example, financial management staff still use the manual processes alongside the IFMIS processes.
In Ghana, staff met by the team give the impression that they understand the GIFMIS processes and see the advantages in them. The PFMRP management structures (noted in 5.1 above) support good coordination across Government, both with regard to the line ministries and in terms of the political leadership.

186
ANNEX 1: PERFORMANCE INDICATOR SUMMARY
COUNTRY NAME: Current assessment
GHANA
Pillar Indicator/Dimension Score Description of requirements met
Bu
dge
t R
elia
bili
ty
PI-1 Aggregate expenditure out-turn
D
The outturn exceeded the original approved budget by more than 15 percent in all 3 years (2014-2016), 18.8, 16.8 and 28.9 percent, respectively. This was the case for all MDAs, but it was particularly high for three MDAs. The main reasons were: (i) expenditure commitments being larger than implied by approved budgets, leading to payment arrears that eventually had to be paid; and (ii) large wage increases, also leading to payment arrears.
PI-2 Expenditure composition outturn
C+ Composition variances for both administrative and
economic classifications were high.
(i) Expenditure composition outturn by function
D
The variance, based on administrative classification, was more than 15 percent in 2 of the 3 years, that is, 14.7, 27.5, and 24.9 percent, respectively. As noted under PI-1, the positive expenditure deviations were very high for three large MDAs.
(ii) Expenditure composition outturn by economic type
C The deviations were 10.4, 12.6, and 21 percent,
respectively, in 2014-16. The deviations mainly reflect the composition variance under 2.1.
(iii) Expenditure from contingency reserves
A
Expenditure from contingency reserves was 0
percent of the original approved budget in each of 2014, 2015, and 2016, indicating that the expenditure contingency was allocated to the MDAs.
PI-3 Revenue outturn D+
(i) Aggregate revenue outturn
D
Actual revenues were less than 92 percent of budgeted revenues in 2 of the 3 years, that is, 90.5, 92.5 and 88. 5, respectively, in 2014-16. Contributory factors included declines in gold and crude oil prices, declines in production volumes for gold and cocoa, and budget support grants from donors.
(ii) Revenue composition outturn C
The variance in revenue composition was less than 15 percent in all three years 2014-2016, that is, 10.4, 8.1and 12.9 percent, respectively.

187
COUNTRY NAME: Current assessment
GHANA
Pillar Indicator/Dimension Score Description of requirements met
Tran
spar
en
cy o
f P
ub
lic F
inan
ces
PI-4 Budget Classification
B
The budget guidelines include the chart of accounts (CoA) to be used by the MDAs for the preparation of their budgets. Budgets are prepared on a program/sub-program basis,and are increasingly being executed and reported as such through the GIFMIS. The reports are at 2-digit GFS 2001 economic classification level, but in principle they can be reported at a lower GFS 2001 level.
PI-5 Budget Documentation
C
In order to score a B, 7 elements need to be included in the budget documentation, including at least 3 basic elements. The fourth basic element is not included (revenue and expenditure data for current and previous years). Three non-basic elements are included in the budget documentation, one less than necessary to score a B.
PI-6 Central government operations outside financial reports
D
(i) Expenditures outside of financial reports
D
MDA expenditures outside of the Consolidated Fund Financial Statements were at least 8.8 percent of Budgetary Central Government (BCG) expenditures in 2016. This represents the estimated spending of retained IGF and donor project grants. Total spending financed by the Funds is not reported on, but budgeted amounts were 14 percent of budgeted BCG expenditures. It is highly likely that actual spending increases the percentage to over 10 percent.
(ii) Revenues outside of financial reports D
Revenues outside of the Consolidated Fund Financial Statements were at least 27 percent percent of BCG revenues in 2016.
(iii) Financial reports of extrabudgetary units
D
Less than 50 percent of extrabudgetary units by value submit audited financial reports within nine months of the end of the financial year.
PI-7 Transfers to subnational governments
C+
(i) System for allocating transfers
C
The transfer of about 34 percent of amounts due to the MMDAs in 2016 was through transparent, rule-based processes. Of this, 24.6 percent was through the procedures

188
COUNTRY NAME: Current assessment
GHANA
Pillar Indicator/Dimension Score Description of requirements met
for block grant transfers through the DACF, and 9.6 percent was through the procedures for block grant transfers through the DDF.
Sixty-six percent of the transfers to the MMDAs represent the institutional and indirect transfers from the DACF. These were not done through transparent, rules-based procedures.
(ii) Timeliness of information on transfers
D
The two main issues are: (i) MMDAs have the same budget calendar as the GoG. They are required to wait until the GoG budget is passed before they know how much they will receive in transfers.
(ii) The Parliament is required each year to approve the horizontal allocation formula for the DACF. This approval may not be given until late in the first quarter of the next fiscal year.
PI-8 Performance information for service delivery
B+
(i) Performance plans for service delivery
A
Performance plans are contained in the program-based budgets that have been prepared by all MDAs beginning in 2014. They are then submitted to Parliament for approval.
(ii) Service delivery performance
A
Service delivery information is published annually in the Program-Based Budget (PBB) estimates and in the Budget Performance Report.
(iii) Resources received by the service delivery units
B
An analysis was conducted on the Ghana Health Services, the main service delivery agency of the Ministry of Health, and one hospital (Korle-bu teaching hospital). Information on resources received is collected and recorded at least annually.
(iv)Performance evaluation of service delivery B
Evaluations of service delivery are conducted annually for the majority of the MDAs. However. independent evaluations are limited
PI-9 Public access to information
A
The Public Financial Management Act of 2016 clearly sets out the timelines for the preparation of fiscal information. The 2017 year was the first full year of implementation of this law, and most fiscal documents were prepared on time.

189
COUNTRY NAME: Current assessment
GHANA
Pillar Indicator/Dimension Score Description of requirements met
Man
age
me
nt
of
asse
ts a
nd
liab
iliti
es
PI-10 Fiscal risk reporting C+
(i) Monitoring of public corporations
D*
Insufficient information is available to score this dimension. As of end-February 2018, the SEC had received the 2016 financial statements from only five of the 39 SOEs it monitors. No GOG department collects financial statements.
(ii) Monitoring of sub-national government (SNG)
B
The Ghana Audit Service’s 2016 consolidated annual report on the accounts of the MMDAs was published in August 2017. It incorporated the audit results of 82 percent of MMDAs.
(iii) Contingent liabilities and other fiscal risks
D
GoG documents, in particular the annual Budget Statement and Economic Policy, contain very little information on the types of contingent liabilities identified in the 2016 Framework. Contingent liabilities in relation to SoEs and MMDAs are
discussed under 10.1 and 10.2)..
PI-11 Public investment management
NA
The 2016 PEFA Framework stipulates that this indicator is applicable to proposed capital projects that are at least 1 percent of total budgeted expenditures. Under the current budgeting system in Ghana, it is difficult to identify these.
The Government may have capital projects that can be assessed using the PEFA Framework methodology. However, to date, it has not developed its own definition of a major investment project.
(i) Economic analysis of investment proposals
NA
(ii) Investment project selection
NA
(iii) Investment project costing
NA
(iv) Investment project monitoring
NA
PI-12 Public asset management C+
(i) Financial asset monitoring
C
The Non-tax Department of the Ministry of Finance maintains a record of government holdings of stocks and equities, one component of financial assets. The Annual Financial Statements prepared by the CAGD includes a table showing the end-year stock of

190
COUNTRY NAME: Current assessment
GHANA
Pillar Indicator/Dimension Score Description of requirements met
all the financial assets of the GoG, disaggregated by type of asset.
(ii) Non-financial asset monitoring
D
The AFS prepared by the CAGD contains a list of fixed assets held by the MDAs. The list shows beginning year and end-year values, reflecting disposal, acquisition, and depreciation. The MDAs do not collect information on the usage and age of their assets.
(iii) Transparency of asset disposal
D
Rules for asset disposal exist and individual MDAs observe them when disposing of their assets. However, budget documents, financial reports, or other information do not include information on such transfers and disposals.
PI-13 Debt management B
(i) Recording and reporting of debt and guarantees
C
Debt records are maintained and up-dated regularly. There are some reconciliation issues, including: (i) between the DMD in the MoF and the DPI in the CAGD; and (ii) between the DPI and the Bank of Ghana with regard to external debt.
Records on GoG- guaranteed debt are harder to keep up-to-date. It is hard to know how accurate they are, as they are based on SOE records. They are shown in the 2016 Annual Debt Report (ADR) prepared by the DMD, the first time that this has been produced. They are not shown in the BoG’s reports, or in the CAGD’s annual report on the Consolidated Fund.
(ii) Approval of debts and guarantees
B
The 1970 Loans Act sets out the legal basis for the GoG’s management of debt and the procedures for incurring debt and issuing loan guarantees. The PFMA (2016) does the same, but in more detail. Only the Minister for Finance may borrow money and issue loan guarantees. Cabinet approval is required. The National Assembly approval of the terms and conditions of any loan and of loan guarantees is required.

191
COUNTRY NAME: Current assessment
GHANA
Pillar Indicator/Dimension Score Description of requirements met
(iii) Debt management strategy
B
The current MTDMS has a horizon of 3 years, covering 2017-19, as prepared by the MoF. The summary is on the MoF’s website. It includes 3 risk benchmarks that it will pursue (foreign currency, interest rates, and re-financing). The detailed report, not published, includes sensitivity analysis. The Budget Statement for 2018 assesses the effectiveness of the 2016-18 MTDMS, but not as a specific report. It designated target ranges for specific indicators in general terms.
The current MTDMS is more rigorous and detailed than previous strategies.
Po
licy-
bas
ed
fis
cal s
trat
egy
an
d b
ud
geti
ng
PI-14 Macroeconomic and fiscal forecasting
B
(i) Macroeconomic forecasts
B
The annual budget statements presented to the Parliament (the last of which is for FY 2018) include a section on the Macroeconomic Outlook under Section 4 of the Macroeconomic Targets for 2018 and the Medium Term. Tables show real and fiscal sector projections, but not monetary and external sector projections. A table showing the projected medium-term macroeconomic framework is not provided.
Paragraphs 148 -149 and 159 list targets for real GDP growth, inflation, the fiscal and primary balance, monetary growth, the current account balance and foreign exchange reserve import coverage.
(ii) Fiscal forecasts
B
Fiscal forecasts and the underlying assumptions are included in the annual Budget Statements (disaggregated tables are contained in Appendix 3 of the Statement) and presented to Parliament, the most recent of which is for 2018.
Differences from the forecast made a year earlier are not explained.

192
COUNTRY NAME: Current assessment
GHANA
Pillar Indicator/Dimension Score Description of requirements met
(iii) Macro-fiscal sensitivity analysis
C
Macro-fiscal forecasts are prepared internally by the GoG using different assumptions made about the future path of relevant parameters (for example, inflation, and interest rates). The draft forecasts are not shown in the Budget Statement, only the actual forecast which is eventually selected.
PI-15 Fiscal strategy B
(i) Fiscal impact of policy proposals
C
The fiscal impacts of the proposed changes in the revenue and expenditure policy are not explicitly shown in Section 6 of the Annual Budget Statement, except in some cases.
Nevertheless, the impacts are calculated internally, and are reflected in the estimates of revenues and expenditures shown in the Budget Statements for FYs 2014-18.
(ii) Fiscal strategy adoption
B
In line with Section 15 of the PFMA (2016), the MoF is required to prepare an annual Fiscal Strategy Document (FSD), which shows fiscal objectives and how to best meet them for the next 2 years. The 2017 FSD is the first of its kind.
The full FSD is not submitted to the Parliament, but the main points are reflected in the annual Budget Statement and Economic Policy for 2018-21.
(iii) Reporting on fiscal outcomes
B
The GoG prepares budget performance reports each year. These compare actual outputs to planned targets, and provide reasons for deviations. The annual Budget Statement and Economic Policy assesses performance in macro-fiscal and sectoral terms during the first 9 months of the current budget year.
PI-16 Medium-term perspective in expenditure budgeting
B
(i) Medium-term expenditure estimates
A
The GoG started preparing PBB estimates in 2014 and submitted them to Parliament for approval. Clearly identified program classification is now included in the budget documents.

193
COUNTRY NAME: Current assessment
GHANA
Pillar Indicator/Dimension Score Description of requirements met
(ii) Medium-term expenditure ceilings
A
Prior to 2018, expenditure ceilings for the new MTEF period were guided largely by the new Medium-Term Fiscal Framework and the previous year’s MTEF.
(iii) Alignment of strategic plans and medium-term budgets
B
The National Development Planning Commission is responsible for National Planning (GSGDA 2) in Ghana. They also assist the MDAs with the preparation of the medium-term strategic plans for 2014-2017, which are also costed.
(iv) Consistency of budgets with previous year estimates
D
The budget documents do not fully quantify and explain the variation between the corresponding years in each medium-term budget.
PI-17 Budget preparation process
C
(i) Budget calendar
C
The annual budget calendar for preparing the 2018 budget was issued by the MoF in February 2017. - The Budget Circular was issued to the MDAs on August 15, 2017. The MDAs were required to submit the budget documents by August 31. This allowed only 2 weeks for the MDAs to prepare their budget submissions, and many MDAs were late.
(ii) Guidance on budget preparation
C
The Budget Circular is clear and relatively comprehensive. It includes ceilings, and guidelines, including templates. The Circular for the 2018 budget preparation was approved for issue by the MoF, but not by the Cabinet. This may not matter too much as the Cabinet had already approved the FSD.
(iii) Budget submission to the legislature
C
The dates of submission of the annual Budget
Statement and Economic Policy to the
Parliament were as follows:
November 19, 2015,
March 2, 2017, and
November 15, 2017, respectively.
PI-18 Legislative scrutiny of budgets
B+
(i) Scope of budget scrutiny B
The Parliament scrutinizes both aggregate and detailed budget estimates for both revenues and expenditures at the national

194
COUNTRY NAME: Current assessment
GHANA
Pillar Indicator/Dimension Score Description of requirements met
(consolidated) level and at the sectoral level, including to some extent fiscal policies and macroeconomic forecasts for the coming year. The review does not include outer year estimates.
(ii) Legislative procedures for budget scrutiny
A
Clear rules exist for legislative budget scrutiny. These rules are enshrined in the Standing Orders. They are well respected and allow for public consultation and solicitation of technical support with regard to budget review. The rules also make a provision for specialized budget review committees (such as the select committee, and the finance committee).
(iii) Timing of budget approval
A
The Parliament passed the Appropriations Act before the beginning of the new financial year in all three of the last three completed fiscal years.
(iv) Rules for budget adjustments by the Executive
B
Articles 179(8) and (9) of the Constitution, and Section 32 of the PFM Act of 2016 outline the rules for in-year budget reallocations; they are clear and respected. The law places no limitation on the number and value of virements. This provides potential for extensive administration reallocation, but in practice, their issue is highly restricted. One Supplementary Appropriations Bill was passed ex-ante in 2016 to increase the aggregate budget by 2 percent of the originally approved budget.
Pre
dic
tab
ility
an
d c
on
tro
l in
bu
dge
t e
xecu
tio
n
PI-19 Revenue administration D+
(i) Rights and obligations for revenue measures
A
The Communications and Public Affairs Department of the Ghana Revenue Authority (GRA) provides taxpayers with information about their rights and obligations, as well as redress processes and procedures through a variety of means and over a variety of media.
(ii) Revenue risk management
D The GRA does not have explicit risk-based systems to assess taxpayer compliance.
(iii) Revenue audit and investigation D
The GRA undertakes audits and fraud investigations, but it does not have a compliance improvement plan.

195
COUNTRY NAME: Current assessment
GHANA
Pillar Indicator/Dimension Score Description of requirements met
(iv) Revenue arrears monitoring
D
The GRA acknowledges significant concerns regarding the completeness and integrity of the reported arrears data. There was no age analysis of either the DTRD- or the CD- administered arrears as of end-2016.
PI-20 Accounting for revenues C+
(i) Information on revenue collections
A
The GRA prepares monthly consolidated reports on all central government revenues and shares such reports with all ministries and agencies involved in the collection and administration of revenues, including the the MOF, the CAGD and the BoG.
(ii) Transfer of revenue collection
B
Most GRA-administered revenues are collected from taxpayers by two commercial banks, which remit collected funds within 48 hours to the Treasury Single Account administered by the CAGD.
(iii) Revenue account reconciliation
C
The GRA and the CAGD perform detailed reconciliations of transfers to the Treasury Single Account within one month of every month-end. However, this reconciliation does not include assessments and arrears, as would be required to achieve a higher PEFA score.
PI-21 Predictability of in-year resource allocation
C+
(i) Consolidation of cash balances
C
At least 75 percent of central government bank balances are consolidated daily. There still over 2,500 other government accounts, plus a multitude of donor-financed projects accounts as well as statutory funds, outside the TSA framework.
(ii) Cash forecasting and monitoring
C
The MoF prepares consolidated cash flow plans annually based on inputs from the MDAs; these cash plans are not updated on the basis of actual cash flows.
(iii) Information on commitment ceilings
B
The MoF issues expenditure commitment warrants quarterly in advance, providing the MDAs sufficient and reliable information for expenditure commitment.
(iv) Significance of in-year budget adjustments
B
The frequency of virements has fallen in recent years. Only one Supplementary Appropriations Bill was passed by the Parliament in February

196
COUNTRY NAME: Current assessment
GHANA
Pillar Indicator/Dimension Score Description of requirements met
2016. This increased MDAs’ original expenditure by 2 percent in aggregate. This was fairly transparent, but not entirely predictable.
PI-22 Expenditure arrears D+
(i) Stock of expenditure arrears
D
The stock of expenditure arrears was 2.4 percent and 18.7 percent of total actual expenditures in FY2015 and FY2016 respectively, averaging 10.55 percent of total actual expenditures. The stock of arrears does not include arrears in VAT refunds; therefore, arrears could be substantially higher than reported.
(ii) Expenditure arrears monitoring
B
The PEMU of the MoF generates a quarterly statement of outstanding payables. In addition to this, the CAGD also generates a list of outstanding payables annually through the GIFMIS at any given time.
PI-23 Payroll controls C+
(i) Integration of payroll and personnel records
B
The personnel records are fully integrated with the payroll record, and updates on personnel records are reflected immediately on the payroll record. The approved staff lists maintained by the heads of MDAs or Management Units (MUs) might not be reconciled with the personnel database in a timely way. The on-going establishment of the HRMIS is facilitating more timely reconciliation.
(ii) Management of payroll changes
C
Most of the changes to personnel data are updated within a month. However, certain changes, involving the inclusion of new employees in some MDAs, may take 2-5 months. Retroactive adjustments are not uncommon.
(iii) Internal control of payroll
B
The following are adequate to ensure high integrity of data: the monthly payroll validation process via the E-SPV; the pre-audit procedure by the CAGD internal audit unit; additional verification of personnel input data by the PDD of the CAGD; and the audit trail features within the Integrated Personal Payroll Database (IPPD).

197
COUNTRY NAME: Current assessment
GHANA
Pillar Indicator/Dimension Score Description of requirements met
(iv) Payroll audit
B
The payroll audit is conducted annually as part of the regular audit of the GAS. The GAS audit covers __% of the budget in a fiscal year, as indicated in PI-30. The Internal Audit Division of the CAGD conducts a monthly pre-audit before the final payroll is issued. The Internal Audit Units of the MDAs also conduct payroll audits. A separate payroll audit is conducted by other consultants.
PI-24 Procurement B
(i) Procurement monitoring
C
The Public Procurement Authority (PPA) database captures 70 percent (by value) of public procurement; the information provides details of contract awards, the value of the contract, the method of procurement, and the successful bidder.
(ii) Procurement methods
B
At least, 70.1 percent (Table 3.20) of public procurement is conducted through competitive methods (restricted tenders, NCB, and ICB).
(iii) Public access to procurement information
B
At least, five of the six key procurement information elements are made available in a timely manner to the public through the PPA’s website. As indicated in Table 3.21, key element number 6 is not fully met.
(iv) Procurement complaints management
B
The appeals and complaints mechanism meets five (including criterion 1) of the six criteria set out in the PEFA methodology, as illustrated in Table 3.22. Criterion 4 is not fully met.
PI-25 Internal controls on non-salary expenditures
B
(i) Segregation of duties
A
Segregation of duties are clearly defined in the expenditure process, as indicated by written regulations and accounting procedure manuals, and procurement and property administrator procedures. The GIFMIS system provides for effective separation of roles in the payment process.
(ii) Effectiveness of expenditure commitment controls C
The GIFMIS system provides a commitment control procedure which offers partial coverage due to expenditures financed by retained IGFs outside of the GIFMIS, as well as non-compliance by some MDAs.

198
COUNTRY NAME: Current assessment
GHANA
Pillar Indicator/Dimension Score Description of requirements met
(iii) Compliance with payment rules and procedures
B Most payments (more than 95 percent) are authorized in advance, and are in line with rules and procedures.
PI-26 Internal audit effectiveness C+
(i)Coverage of internal audit
C
Of the 188 MDAs, 186 of have Internal Audit Units (IAUs). The level of implementation of annual audit plans varies between MDAs. The visited MDAs accomplished on average 67 percent of their annual audit plans, which also represents the expenditure coverage. The IAUs are still performing “ex-ante” pre-payment verification function (commonly known as the “pre-audit”), which affects the extent of coverage. The limited resources and delays in budget releases also affected the performances of the IAUs.
(ii) Nature of audits and standards applied
C
Internal audit is mainly focused on financial compliance rather than systemic audit. The risk analysis prepared by the IAUs also primarily focuses on compliance risks rather than effectiveness and efficiency of the internal control systems. The engagement of the IAUs in pre-audit tasks may compromise their independence.
The IAUs prepare annual audit plans. Most of them have approved Audit Charters and use the audit manual prepared by the Institute of InternaI Auditors (IAA), which is in line with the International Professional Practice Framework (IPPF).
(iii) Implementation of internal audits and reporting C
All four visited MDAs prepare an annual audit plan and accomplish about 70 percent of their approved audit plans. About 59 percent of the MDAs and MMDAs submitted annual and quarterly audit reports to the IAA in 2016.
(iv) Response to internal audits
B
Based on the 2016 IAA report, the audited institutions implement more than 75 percent of IAU recommendations within twelve months. The IAUs of the four visited MDAs indicated that about 80 percent of the auditees respond within three months.

199
COUNTRY NAME: Current assessment
GHANA
Pillar Indicator/Dimension Score Description of requirements met
Acc
ou
nti
ng
and
Re
po
rtin
g
PI-27 Financial data integrity B
(i)Bank account reconciliation
C
All CAGD-managed bank accounts (75 percent by value of all GoG bank account balances) are reconciled monthly within four weeks after the end of the preceding month.
There are other active MDA bank accounts (mainly for IGFs and donor projects) held at commercial banks; these are reconciled within two months after the end of the month.
Donor project accounts held in the BoG are reconciled in a timely way, that is, within two weeks after the end of the month.
(ii) Suspense accounts
A
The CAGD does not maintain suspense accounts as a matter of policy.
Revenues and expenditures that cannot immediately be classified are temporarily classified under a revenue or expenditure code. Once the correct classification is identified, a journal entry is made that reverses the temporary classification.
(iii) Advance accounts
C
Advances are reconciled within two months after the end of the previous financial year; there are however significant un-cleared balances at the end of the FY
(iv) Financial data integrity processes
A
Access to the GIFMIS is highly regulated, with passwords granted only by the CAG.The financial data is encrypted, with a “read-only” mode. User entry to the GIFMIS generates an audit trail.
In addition, the DACU within the CAGD conducts financial data entry checks to ensure data integrity.
PI-28 In-year budget reports C+
(i)Coverage and comparability of reports
C
Notes to the monthly financial statements produced by the CAGD in 2016 compare monthly expenditures and revenue outturns against the monthly and annual budget for the MDAs according to economic classification.

200
COUNTRY NAME: Current assessment
GHANA
Pillar Indicator/Dimension Score Description of requirements met
With the GIFMIS now operative throughout the country, reported expenditures include those financed by transfers from the center to the district offices. MDA spending of IGFs is still not reported. Grant-financed donor project spending is also not reported; the MoF and the CAGD assume that expenditures equal grants.
(ii) Timing of in-year budget reports
A
The issuance of the monthly financial statements in 2016 and the first three quarters of 2017 within 15 days of the end of the month was done, as stipulated under Section 40 of the FAA 2003.
(iii)Accuracy of in-year budget reports
C
In-year budget reports prepared by the CAGD are not fully accurate because they exclude expenditures financed by retained IGFs, although the MDAs include such expenditures in their in-year reports.
As indicated under PI- 27, delays in reconciling bank accounts held by the MDAs in commercial banks may affect the accuracy of in-year expenditure reports. Advances to district offices may be incorrectly classified as expenditures in order to meet the deadline for submitting monthly expenditure returns. This is becoming less of an issue with the recent roll out of the GIFMIS to district offices.
PI-29 Annual financial reports C+
(i) Completeness of annual financial reports
C
Final accounts on the Consolidated Fund show revenue and expenditure outturns against the budget, as well as financial assets, and short and long-term liabilities.
The accounts are not complete, as they exclude expenditures of MDAs financed by retained IGFs and donor partners. These are shown in individual, non-consolidated annual financial reports.

201
COUNTRY NAME: Current assessment
GHANA
Pillar Indicator/Dimension Score Description of requirements met
(ii) Submission of reports for external audit
A
The date of submission of the 2016 CF Statements to the GAS was March 31, 2017, thereby meeting the deadline of 3 months after the end of the FY.
(iii) Accounting standards
C
Ghana is transitioning from cash-based to accrual-based accounting. The financial statements do not disclose any transitional provisions, but they have followed a consistent format over time and comply with local regulations.
Exte
rnal
scr
uti
ny
and
au
dit
PI-30 External audit B+
(i)Audit coverage and standards
B
The financial audit covers more than 95 percent of the central government annual expenditures. The audit is conducted in accordance with ISSAI standards, and significant findings are highlighted.
(ii) Submission of audit reports to the legislature
B
CF and MDA audit reports relevant for the assessment of the national government were submitted to Parliament within six months from the receipt of financial reports by the GAS for the last completed fiscal years.
(iii) External audit follow-up
B
The GAS conducts a quarterly meeting for
follow-up of observations with management.
The management response to audit findings is
included in the audit report.
The audited entity submits a comprehensive management letter, including evidences of actions as applicable.
(iv)Supreme Audit Institution (SAI) independence
A The Supreme Audit Institution is independent in practice as stipulated in the Constitution and Audit Service Act.
PI-31 Legislative scrutiny of audit reports
D
(i)Timing of audit report scrutiny
D
The audited CF financial statements were submitted to the Parliament more than two years from the date of their receipt from the Auditor General.
(ii) Hearings on audit findings D
Hearings have not been held yet as the reviews by PAC on the audited AFS for 2014-16 have not been completed..

202
COUNTRY NAME: Current assessment
GHANA
Pillar Indicator/Dimension Score Description of requirements met
(iii) Audit recommendations by the legislature
D
Recommendations have not been issued as
Parliament has received PAF’s report prepared
after the hearings, as the hearings have not
been held, as PAC has not reviewed the audit
report on the Annual Financial Statements.
Reports of the Auditor General contains a
status of findings and a list of observations
from the previous audit. Parliament does not
have a recording system to facilitate follow up
on implementation.
(iv)Transparency of legislative scrutiny of audit reports D
All hearings are conducted in public. Hearings are also transmitted live on national television. Some of the hearings are available in YouTube. Journalists attend hearings and report on them.
Total Scored 31

203
ANNEX 2: SUMMARY OF OBSERVATIONS ON THE INTERNAL CONTROL FRAMEWORK
Internal control components and
elements Summary of observations
1. Control environment
Organizational structures are clear, and positions are fairly defined. Clear reporting lines established within the respective MDAs, and between the MDAs and the Executive, as well as with the oversight bodies. Effective and efficient HR planning and decision making is often affected by the HR database limitations. Performance management is also an area of concern. The ongoing implementation of the HRMIS and HR audits are among the initiatives being taken by the PSC to address these limitations. Each MDA has an internal audit unit. The Internal Audit Agency is an independent agency accountable to the President of the State. The Agency has oversight responsibility of internal audit functions in all MDAs and local governments, excluding institutions which are autonomous by law. The Internal Audit Agency reports of audit findings used to be submitted to Parliament as indicated in the Audit Service Act, but this practice has been discontinued since 2007. The Audit committees established at each institution are responsible for the follow-up of audit findings and recommendations. In addition, to enhance the independence of the audit committee, majority members are nominated externally from the Ghana Institution of Chartered Accountants. By law, institutions are required to send a copy of their internal audit report to the GAS. The Public Service Commission conducts job analysis on the MDAs and determines the appropriate job requirements, positions and staff requirements. Most of the MDAs visited indicated that their staff retention level is very high, but budgets for staff development are not satisfactory. The officials of the Internal Audit Agency indicated that they are understaffed which constrained the scope of their work. The personal and professional integrity and ethical values of management and staff are generally good. There is an overall supportive attitude toward internal control systems, though this may not always be the case (e.g. some managers trying to influence auditors (PI-26) to undertake more pre-audit functions which, in turn, affects the professional independence of internal auditors. The compliance and responsiveness of management to findings and recommendations has improved over the years. The Auditor General has a power of surcharge, as stipulated in the 1992 Constitution and Audit Service Act of 2000.

204
Internal control components and
elements Summary of observations
The GoG has functioning state institutions that are supportive of ethical values and enforcement of the rule of law. These include the Commission on Human Rights and Administrative Justice (CHRAJ) which is responsible for of anti-corruption, human rights and administrative justice; and the Economic and Organized Crime Office (EOCO), which is a specialized state agency set up to monitor, investigate and — on the authority of the Attorney-General — prosecute any offence involving serious financial and economic loss to the State. The GoG is implementing a 10-year National Anti-Corruption Action Plan (NACAP) which ends in 2021. The NACAP was approved by the Parliament in 2014. The Action Plan aims to institutionalize efficiency, accountability and transparency in the public, private and not-for-profit sectors, as well as conduct effective investigations and prosecution of corrupt conduct. The NACAP is supported by the EU under a five-year project called the EU-Ghana Anti-Corruption, Rule of Law and Accountability Program (ARAP),69 launched in 2016. Outside institutions such as the Ghana Integrity Initiative (GII), which is a local chapter of Transparency International; the Center for Democratic Development (CDD); and the Ghana Anti-Corruption Coalitions are also contributing to the overall integrity and ethical values of government management and staff. Ghana ranks 80 out of 180 countries in the 2017 Corruption Perception Index according to Transparency International. Nonetheless, the findings on internal and external audits, and assessment of institutions like Transparency International, indicate that integrity and ethical values still require strengthening.
2. Risk assessment
The management of MDAs do not conduct organization-wide risk assessments to evaluate the impact of changes in the internal business process and external environment on the existing systems of internal control. The risk assessment would have been a basis to identify risks at all levels, measuring their significance and determining the appropriate mitigation strategy. Most of the internal audit units conduct their own risk assessment for the purpose of annual audit plans. However, this is not prepared with the participation of management. The risk assessments often deal with common compliance issues and areas with significant financial transactions. The IIA is planning to introduce an enterprise risk assessment at the level of the MDAs with the support of the Commonwealth.
3. Control activities
The GoG deploys control activities through policies outlined in the PFM-related Acts. These are put in action through procedures outlined in the regulations and manuals. Duties of different functions are segregated, including payroll, personnel management, procurement, disbursement, bank management, revenue collection, the budget processes, asset management, revenue administration, and debt management. Duties are also segregated in terms of requesting, authorizing, recording, processing and reviewing, as applicable. Access
69 The objective is to build the capacity of civic education providers such as the National Commission on Civic Education (NCCE), CHRAJ, CSOs and the media to conduct campaigns, advocate and lobby for increased accountability and a reduction in corruption. Secondly, it is aimed at strengthening law enforcement agencies. This includes building the capacity of prosecutors to prosecute corruption and related offences. It also means building the capacity of the Judiciary to hear and decide on corruption cases and related offences, as the best means of enhancing accountability standards in country. Finaly, it also means supporting the police and Judiciary in combatting corruption among their ranks.

205
Internal control components and
elements Summary of observations
to records is generally permitted only for authorized personnel. Automated processes, including the GIFMIS and the PPDP, have inbuilt audit trails to trace irregularities within the system. Bank accounts are reconciled monthly. Test payroll lists are reviewed and validated by the head of the MUs on a monthly basis. A review of operating performance is often produced annually. The workflow management and the inbuilt segregation of duties within the GIFMIs provide for effective control of payments. Some irregularities in compliance to commitment control, asset management, payroll and procurement indicate the need to revisit the effectiveness and efficiency of the already established control activities.
4. Information and communication
Internal control procedures and roles are clearly defined in the various Acts, regulations and manuals. Generally, internal control procedures are well-communicated and manuals are available. Performance reports are published annually. The MDAs are required to prepare and submit quarterly and annual financial reports (PI-28, PI-29). Monthly payroll statistics reports are prepared by the CAGD, which provides detailed information about monthly payments, irregularities, validation levels and area payments. Some of the institutions published their reports on their websites. The public has access to hearings on audit findings by the Parliament, which are broadcasted live.
5. Monitoring
MDA management reviews interim and annual reports, and submits reports to the next level of the hierarchy. The internal audit units and the Audit Service conduct ongoing monitoring of internal control deficiencies (PI-26 and PI-30). However, they focus is more on compliance audit than evaluation of the efficiency and effectiveness of internal controls. Management and the executive generally take corrective actions. IAUs, Audit Committees, the Audit Service, the Internal Audit Agency and the Parliament follow-up on the implementation of findings and recommendations. In addition, the Parliament reviews annual budgets and performance reports. Despite the various, ongoing monitoring and evaluation activities,the recurring nature of irregularities in various PFM aspects signals the need for more systemic audits, comprehensive risk assessments and strong management commitment to take action.

206
ANNEX 3: SOURCES OF INFORMATION BY INDICATOR
Indicator Information sources
PI- 1. Aggregate expenditure outturn
MoF, Fiscal Data Reports, 2014, 2015 and 2016.
1.1 Aggregate expenditure outturn
PI-2. Expenditure composition outturn
Public Financial Management Act, 2016, Act 921
Appropriation Act, 2013, December 30, 2013
Appropriation Act, 2014, December 30, 2014
Appropriation Act,2015, December 30, 2015
Contingency Vote Expenditure Reports for 2014, 2015 and 2016
Republic of Ghana, Report of the Auditor General on the Consolidated Fund of Ghana for the year ending December 31, 2014
Republic of Ghana, Report of the Auditor General on the Consolidated Fund of Ghana for the year ending December 31, 2015
Republic of Ghana, Report of the Auditor General on the Public Accounts of Ghana for the year ending December 31, 2016
2.1 Expenditure composition outturn by function
2.2 Expenditure composition outturn by function
2.3 Expenditures from contingency reserves
PI-3. Revenue Outturn CAG, Annual Accounts of the Consolidated Fund, 2014
CAG, Annual Accounts of the Consolidated Fund, 2015
CAG, Annual Accounts of the Consolidated Fund, 2016
MoF, Fiscal Data Reports, 2014, 2015 and 2016
3.1 Aggregate revenue outturn
3.2 Revenue composition outturn
PI-4. Budget classification CAG, Government of Ghana Chart of Accounts, 2018
Republic of Ghana, Budget Guidelines for the Preparation of the 2018-2020 Budget Proposals
4.1 Budget classification
PI-5. Budget documentation Republic of Ghana, Budget Statement and Economic Policy of the Government of Ghana for the 2014 Financial Year
Republic of Ghana, Budget Statement and Economic Policy of the Government of Ghana for the 2015 Financial Year
Republic of Ghana, Budget Statement and Economic Policy of the Government of Ghana for the 2016 Financial Year
Medium-Term Expenditure Framework (MTEF) and Program-Based Budget Estimates for 2014, 2015 and 2016 for all MDAs
5.1 Budget documentation

207
Indicator Information sources
PI-6. Central government operations outside of financial reports
6.1 Expenditures outside of financial reports
6.2 Revenues outside of financial reports
6.3 Financial reports of extrabudgetary units
Articles 175 and 176 of the 1992 Constitution of Ghana
Articles 39 - 41 of the now-repealed Financial Administration Act of 2003 (applicable as at the time covered by the report)
Financial statements of some universities , the National Health Insurance Fund (NHIA), the Ghana Education Tax Fund (GETFUND), the Ghana Investment Infrastructure Fund, the District Assemblies Common Fund (DACF), the Road Fund, the Ministries of Food and Agriculture, Health, and Education, and the Ghana Audit Service
Annual Financial Statement on the Consolidated Fund of Ghana, 2014 – 2016
Auditor General’s Reports on the Consolidated Fund of Ghana, 2014 – 2016
Auditor General’s Report on Ministries. Departments, and Agencies for 2014-2016
Approved budgets for 2015-2018
PI-7. Transfers to subnational governments
7.1 System for allocating transfers
7.2 Timeliness of information on transfers
Articles 175 and 176 of the 1992 Constitution of Ghana
2016 Formula for Sharing the District Assemblies Common Fund, available on the DACF website: www.commonfund.gov.gh
MoF: 2018 Budget Guidelines
MoF (Fiscal Decentralization Unit, FDU): Formula for Sharing District Assemblies Common Fund, 2017
Ministry of Local Government and Rural Development: DDF Allocations for 2016
Ministry of Local Government and Rural Development: Operational Manual for the Implementation and Administration of the District Development Facility, Version 1.3, October 2012
Ministry of Local Government and Rural Development: Functional and Organizational Assessment Tool (FOAT), Operational Manual, 6th Cycle, Baseline Year: 2012; Implementation Year: 2013; Disbursement Year: 2014; published in June 2013
Ministry of Local Government and Rural Development: Consolidated Report on the FOAT VI (2012) Assessment of MMDAs in July and August 2013, 6th Cycle of FOAT, 2012 Assessment, Implementation Year: 2013, Disbursement Year: 2014; published in January 2014
Ministry of Local Government and Rural Development: Transfers to MMDAs based on results of the FOAT VI (2012)
Audited 2016 Final Accounts on the CF
2016 Auditor General's Report on the DACF
PI-8. Performance information for service delivery

208
Indicator Information sources
8.1 Performance plans for service delivery
Republic of Ghana, Budget Statements and Economic Policies of the Government of Ghana for the 2014, 2015 and 2016 FYs, respectively
Republic of Ghana, Ministry of Roads and Highways, Sector Medium-Term Development Plan, 2014-2017
Medium-Term Expenditure Framework (MTEF) and Program-Based Budget Estimates for 2014, 2015 and 2016
Korle-Bu Teaching Hospital, Annual Report, 2016
Ghana Health Services, Annual Report, 2016
Republic of Ghana, Ministry of Health, Sector Medium-Term Development Plan, 2014-2017,
Government of Ghana, NDPC, The Implementation of the Ghana Shared Growth and Development Agenda (GSGDA) II, 2014-2017, 2015 and 2016 Annual Progress Reports
GOG, End-of-year Reports on the Budget Statement and Economic Policy of the Republic of Ghana for the 2014 and 2015 FYs, respectively
8.2 Performance achieved for service delivery
8.3 Resources received by service delivery units
8.4 Performance evaluation for service delivery
PI-9 Public access to fiscal information
Republic of Ghana, A Citizen’s Guide to the 2018 Budget Statement in Abridged and Simplified Version
International Budget Partnership (IBP), Open Budget Index, 2018, Ghana
Ghana Audit Service website
CAG website
MoF website
9.1 Public access to fiscal information

209
Indicator Information sources
PI- 10 Fiscal risk reporting
10.1 Monitoring of public corporations
10.2 Monitoring of sub-national governments (SNGs)
10.3 Contingent liabilities and other fiscal risks
Report of the Auditor General on the Public Accounts of Ghana (Consolidated Fund) for the financial year ending December 31, 2016
Public Financial Management Act, 2016
SOE Annual Aggregate Report, Ministry of Finance, 2016,
Record of Submission of SOE Documents as at end-February 2018, as submitted by the State Enterprises Commission
Draft Memorandum on the State Equity Investments and Governance Authority Bill, 2018, dated February 27, 2018 by the Ministry of Finance
Project Appraisal Document on a Proposed Credit in the Amount of SDR 10.8 million to the Republic of Ghana for an Economic Management Strengthening Project, World Bank, August 9, 2016
Local Governance Act of 2016
Excel spreadsheet listing individual MMDA revenues and expenditures for 2016 as prepared by the Ministry of Local Government
Excel spreadsheets for each MMDA with monthly revenues and expenditures for 2016 as prepared by the Controller and Accountant General’s Department
Report of the Auditor General on the Accounts of District Assemblies for the financial year ending December 31, 2016
Annual Debt Management Report for the year 2016 by the Ministry of Finance
Medium-Term Debt Management Strategy 2017-2019 approved by the Minister of Finance
November 2016 Report on Arrears presentation dated December 2016
PI- 11: Public investment management
11.1 Economic analysis of investment proposals
11.2 Investment project selection
11.3 Investment project costing
11.4 Investment project monitoring
MoF (Project Investment Department): National Policy on Public Investment Management, that is, the Public Investment Management Policy
MDA 2017 and 2018 budgets (especially for the Ministries of Food and Agriculture, Roads and Highways, and Aviation) available on the Ministry of Finance's website: www.MoF.gov.gh
2016 Final Accounts on the Consolidated Fund of the Republic of Ghana, www.cagd.gov.gh
Isabella Alloisio, “Good Governance for PPPs for the Transformation of the Energy System in West Africa”, available on the Internet. The document includes a case study on Ghana’s PPPs.

210
Indicator Information sources
PI-12: Public asset management
12.1 Financial asset monitoring
12.2 Non-financial asset monitoring
12.3 Transparency of asset disposal
2016 Final Accounts on the Consolidated Fund of the Republic of Ghana, www.cagd.gov.gh
Ghana Public Procurement Act 663, Re-Printed with Act 914 (the 2016 Amendment Act)
Public Procurement Board: Guidelines for Disposal of Goods and Equipment, Accra, Ghana
PI-13: Debt management
13.1 Recording and reporting of debts and guarantees
13.2 Approval of debts and guarantees
13.3 Debt management strategy
Loans Act, 1970 and PFMA, 2016
2016 Annual Debt Management Report, Debt Management Division, MoF
Annual Financial Statement of the Consolidated Fund for 2016, CAGD
Auditor General’s Report on the Annual Accounts of the GoG, 2016
Medium-Term Debt Management Strategy for 2016-18, and 2017-19, DMD, “read-only” access.
Annual Budget Statements and Economic Policy presented to the Parliament, 2014-2017
Annual Budget Performance Reports, 2014-2017
IMF ECF Review Reports (2nd-6th) and Article IV Consultation Reports
PI-14: Macroeconomic and fiscal forecasting
14.1 Macroeconomic forecasts
14.2 Fiscal forecasts
14.3 Macro-fiscal sensitivity analysis
Annual Budget Statements and Economic Policy, presented to Parliament, 2014-2017
Annual Budget Performance Reports, 2014-2017
Budget Preparation Guidelines for Preparation of the 2018-21 Budget, MoF, August 2017.
IMF ECF Review Reports (2nd-6th) and Article IV Consultation Reports
Annual Macroeconomic Reports, Economic Research and Forecasting Division, Ministry of Finance, 2014-2015
PI-15 Fiscal strategy
15.1 Fiscal impact of policy proposals
15.2 Fiscal strategy adoption
15.3 Reporting on fiscal outcomes
Section 15, PFMA, 2016
Budget Preparation Guidelines for the preparation of the 2018-21 Budget
Fiscal Strategy Document, May 2017 (“read-only” access).
PI-16. Medium-term perspective on expenditure budgeting
Republic of Ghana, Budget Guidelines for the Preparation of the 2018-2020 Budget Proposals
16.1 Medium-term expenditure estimates

211
Indicator Information sources
16.2 Medium-term expenditure ceilings 16.3 Alignment of strategic plans and medium-term budgets
Development Agenda (GSGDA) II, 2014-2017, Annual Progress Reports, 2015 and 2016
Republic of Ghana, Budget Statement and Economic Policy of the Government of Ghana for the 2014 Financial Year
Republic of Ghana, Budget Statement and Economic Policy of the Government of Ghana for the 2015 Financial Year
Republic of Ghana, Budget Statement and Economic Policy of the Government of Ghana for the 2016 Financial Year
16.4 Consistency of budgets with previous year’s estimates
PI-17. Budget preparation process Republic of Ghana, Budget Guidelines for the Preparation of the 2018-2020 Budget Proposals
Republic of Ghana, Budget Calendar, 2017 and 2018
Report from the Parliament of Ghana
17.1 Budget calendar
17.2 Guidance on budget preparation
17.3 Budget submission to the legislature
PI-18: Legislative scrutiny of budgets
18.1 Scope of budget scrutiny
18.2 Legislative procedures for budget scrutiny
18.3 Timing of budget approval
18.4 Rules for budget adjustments by the Executive
The 1992 Constitution
PFM Act, 2016; Financial Administration Regulation, 2004
Standing Orders of the Parliament; Hanzard (official records of the legislature)
Budget documentation
Interviews with Parliamentarians and officials from the budget department

212
PI-19 Revenue administration
19.1 Rights and obligations for revenue measures
19.2 Revenue risk management
19.3 Revenue audit and investigation
19.4 Revenue arrears monitoring
Public Financial Management Act, 2016
Ghana Revenue Authority Act, 2016
Taxpayer identification Numbering System Act, 2002
Internal Revenue (Registration of Business) Act, 2005
Income Tax Act, 2015
Income Tax (Amendment) Act, 2016
Value Added Tax Act, 1998
Value Added Tax Regulations, 1998
Customs, Excise and Preventive Service (Management) Law, 1993
Excise Tax Stamp Act, 2013
Petroleum Revenue Management Act, 2011
Petroleum Revenue Management (Amendment) Act, 2015
Annual Report on the Petroleum Funds submitted to Parliament by the Ministry of Finance, 2017
Report of the Auditor General on The Management of Petroleum Funds for the Financial Year ending December 31, 2016
Energy Sector Levies Act, 2015
Second GRA Strategic Plan, 2015-2017
Ghana Revenue Authority websites
Publications of the Communications and Public Affairs Department of the GRA
Client Charter of the GRA, 2013
Interim Taxpayer Services Operational Manual of 2013 of the DTRD of the GRA
Draft Risk Management Policy of the Risk Management Unit of the GRA
Risk Management Report of the Risk Management Unit of the GRA, 2017
TADAT (Tax Administration Diagnostic Assessment Tool) Performance Assessment Report of Ghana by the Fiscal Affairs Department of the International Monetary Fund, July 2017
Handing Over Notes of GRA Investigations Unit dated January 25, 2018
Draft Document of Compliance Management Strategy
Operational Manual of the Debt Management, Compliance and Enforcement Unit (DMCEU) of the GRA, 2013
Analysis of Debt and Institutional Debt as of end-2016 by the DMCEU
Analysis of Debt and Institutional Debt as of end-2017 by the DMCEU
Aged analysis of DTRD debt as of end-2017 by the DMCEU

213
Indicator Information sources
PI-20 Accounting for Revenues
20.1 Information on revenue collections
20.2 Transfer of revenue collections
20.3 Revenue accounts reconciliation
Presentation of Ghana’s TSA Implementation
Minutes of the meeting of January 31, 2018 of the Revenue Sub-Committee of the Economic Policy Coordinating Committee
Tax Revenue Performance, presentation by the GRA, 2017
Tax Revenue Performance, presentation for the IMF by the GRA, 2017
GRA DTRD Annual Report (Provisional), 2016
CAGD Tax Revenue Unit presentation
CAGD Tax Revenue Report for the year 2017
CAGD bank reconciliation for Import VAT for December 2017
CAGD Excel spreadsheet of 2017 tax revenues lodged at BoG
CAGD-GRA revenue and bank reconciliation for Customs for December 2017
CAGD-GRA revenue and bank reconciliation for DTRD Indirect Tax for December 2017
CAGD-GRA revenue and bank reconciliations for DTRD Direct Tax for each week of December 2017
PI-21 Predictability of in-year resource allocation
21.1 Consolidation of cash balances
21.2 Cash forecasting and monitoring
21.3 Information on commitment ceilings
21.4 Significance of in-year budget adjustments
Copy of consolidated annual cash flow statement from the MoF; sample copies of cash flow statements from the Ministry of Education, the Ministry of Health and the Ministry of Agriculture
Copy of statement of budget reallocation from the MoF; sample copies of MDAs (Education, Agriculture, and Health) budget virement requests
Interviews with officials from the Bank of Ghana and the CAGD
PI-22 Expenditure arrears
22.1 Stock of expenditure arrears
22.2 Expenditure arrears monitoring
Consolidated annual financial statements, CAGD, FY2014, 2015 and 2016
Annual expenditure report from Controller and Accountant General's Department for first quarter, 2018
Special GAS report on expenditure arrears, January 2017
Expenditure report from PEMU/MoF

214
Indicator Information sources
PI-23 Payroll controls
23.1 Integration of payroll and personnel records
23.2 Management of payroll changes
23.3 Internal control of payroll
23.4 Payroll audit
CAGD Monthly Payroll report for the month of January 2017 to
June 2017, and for the month of September 2017.
Payroll and Personnel Verification Exercises in Three Regions,
final report issued on 16th May 2017 – EY.
Payroll Procedure Manual – Issued by CAGD – 2013
E-SPV Manual – issued in June 2014
https://www.gogspv.com/index.php?action=Login
Ghana E-Pay Slip platform:
https://www.gogpayslip.com/index.php?action=Login
Monthly Reports on E-SPV validation
List of MDAs using Payroll processing system – issued by CAGD
Interim Progress Report on Payroll Clean-up Plan – December
2016
HRMIS project Profile: https://www.psc.gov.gh/hrmis.html
Human Resource Audit Report – Ghana News Agency – Issued
by Public Service Commission - 2017
Payroll Statistics Report 2017
Various Internal Audit reports (Ministry of Road and High Way,
CAGD, MoE, MoFA& MoH)
http://www.cagd.gov.gh/portal/
PI-24 Procurement
24.1 Procurement monitoring
24.2 Procurement methods
24.3 Public access to procurement information
24.4 Procurement complaints management
Database of procurement information from the Public Procurement Authority
PPA website; Ministry of Finance website
PFM Act, 2016 and PPA Act, 2016 as amended
Annual activity report of PPA for FY2015; data on resolution of procurement complaints for FY2016
Preliminary data from PPA on methods of procurement and contract values for 2017
Interviews with CSOs (Association of Ghana Industries and Ghana Integrity Initiative)

215
Indicator Information sources
PI.25. Non-salary internal financial controls
25.1 Segregation of duties
25.2 Effectiveness of expenditure commitment controls
25.3 Compliance with payment rules and procedures
PFMRP Progress Report 2017
Performance Audit Report of the Auditor General on the disposal of
Government vehicles by the Ministry of Food & Agriculture and The
Ghana Health Service
Internal control related documents - EU-Ghana Anti-
Corruption, Rule of Law and Accountability Programme
(ARAP) launched in Accra
NATIONAL ANTI-CORRUPTION ACTION PLAN (NACAP)
(2012-2021)
Acts, regulations, guidelines and manuals
Guidelines for Disposal of Goods and Equipment
Financial Administration Act 2016
Financial Administration Regulations 2004
Ghana Public Procurement Act 2003
Government of Ghana Accounting Manual for Ministries,
Departments and Agencies (MDAs) - 2015
Internal Audit Reports (indicated under PI-26)
External audit reports indicated (PI-30) are used as evidence to
evaluate the effectiveness of expenditure commitment and
compliances to payment rules and procedures
Management letters of MDAs

216
PI-26 Internal audit
26.1 Coverage of internal audit
26.2 Nature of audits and standards applied
26.3 Implementation of internal audits and reporting
26.4 Response to internal audits
Internal Audit Agency Act, 2003 (Act 658)
Internal Audit Agency Regulation 2011
Internal Audit Manual for MDAs
Risk Based Internal Audit Manual
Overview of countries Supreme Audit Institutions with
surcharging powers – Ghana - Transparency International
COSO Internal Control – Integrated Framework 2013
International Professional Practice Framework (IPPF) –
International Standards for the Professional Practice of Internal
Auditing (Standards)2017
Internal Audit Agency – 10th Annual Internal Audit Forum
presentation
Internal Audit Charters of – CAGD, Ministry of Highway and
Roads
Internal Audit reports (some of them)
o Ministry of Road and Highway (MoRH)
Internal Audit Report of Koforidua Training
Center for the year ended December 31st
2016
Final Internal Audit report on the accounts of
Ministry of Roads and Highways for the year
ended 31st December 2016
Report on the audit inspection and current
status of implementation of
recommendations of the audit general
management letter on GHA in the Enteral
regional for the year ended 31st December
2016
Final report on monitoring of Ghana Road
Fund Revenue from six driver vehicle and
licensing authority (DVLA) – for the year
ended December 31st 2016
Report on the audit inspection and current
status of implementation of
recommendations of the auditor general’s
management letters on Dur and DFR in the
Norther region for the year ended 31st
December 2016
Management letters in Department of
Feeder Roads for the year ended 31/12/2016
- Koforidua
Management letters in DFR – Koforidua for
the period Ending May 2017
Management letters - Koforidua Training
Center for the year ended December 31,2016
Management letters - KTC for the period Jan
– June 2016

217
o CAGD
Audit of value books store
Internal audit report – 2015 (Jan 2015 to
December 2015) Pension only
Internal Audit Report of the Review of the
business process of pensions payment
section of the CAGD – From January 1, 2015
to December 31, 2015
Risk Assessment of operational risks at the
transport unit of the CAGD
Audit report on payment of commuted
pensions and death gratitude by the
administrator general for the period January
1, 2012 to December 31, 2013
Report on Operational Risks of the Integrated
Personnel and Payroll Database (IPPD)
o MoFA
Internal Audit Report on Non-Tax Revenue of
Veterinary Services Directorate for The
Period January To December, 2016
Internal Audit Report on the Accounts of
West Africa Agricultural Productivity
Programme For the Year January, 2015 To
December, 2015
Internal Audit Report on the Activities of
Ghana Agricultural Sector Investment
Programme for the Period January 1, 2017 To
June 30, 2017
2015 Annual report -Internal Audit
o MoH
MoH quarterly internal audit reports ( 4
reports for 2014, 2 reports for 2015 and 3
reports for 2016)
MoH – Management letters on Internal audit
reports – 2017
Internal Audit performance reports – Ministry of Food and
Agriculture – 3 years samples
Internal audit programs: CAGD, Ministry of Food and
Agriculture, Ministry of Road and High Way
MoU signed between Internal Audit Agency and Audit Service –
2007
Self-Assessment with Independent Validation under the
Internal Audit Quality Assurance and Improvement Program
(QAIP) – May 2017
Extracts from the Annual Reports of the Internal Audit Agency:
2014, 2015 and 2016.
Challenges in Implementation of internal audit findings – By
Richard Kwame Asante http://iaa.gov.gh/pages.aspx?id=55

218
Indicator Information sources
PI-27 Financial data integrity
27.1 Bank account reconciliation
27.2 Suspense accounts
27.3 Advance accounts
27.4 Financial data integrity processes
Bank statements and reconciliation statements from the CAGD and selected MDAs (Agriculture, Education and Health)
Auditor-General's audit reports for 2014, 2015, and 2016
Consolidated annual financial statements for 2014, 2015, and 2016
GIFMIS functionality manual; walk-through test of GIFMIS functions; interviews with government officials (CAGD, MoF, Bank of Ghana)
PI-28 In-year budget reports
28.1 Coverage and comparability of reports
28.2 Timing of in-year budget reports
28.3 Accuracy of in-year budget reports
MoF: End-Year Report on the Budget Statement and Economic Policy of the Republic of Ghana for the 2015 Financial Year, published in June 2016
Quarterly Accounts on the Consolidated Fund of Ghana, 2017 www.cagd.gov.gh
Monthly Accounts on the Consolidated Fund of Ghana, 2016 www.cagd.gov.gh
PI-29 Annual financial reports
29.1 Completeness of annual financial reports
29.2 Submission of the reports for external audit
29.3 Accounting standards
Final Accounts on the Consolidated Fund of the Republic of Ghana, 2016 www.cagd.gov.gh
2016 Auditor General’s Report on the Consolidated Fund
2016 Auditor General’s Report on Ministries, Departments and Agencies
2016 Final Accounts for the following: Ministry of Food and Agriculture, Ministry of Health, District Assemblies Common Fund, Ghana Education Trust Fund (GETFUND), Ghana Audit Service (Office of the Auditor General (2015 Accounts), Kwame Nkrumah University of Science and Technology, Koforidua Technical University, the University of Ghana, and the Road Fund

219
PI-30 External audit
30.1 Audit coverage and standards
30.2 Submission of audit reports to the legislature
30.3 External audit follow up
30.4 Supreme Audit Institution independence
Reports of the Auditor General on the Public Accounts of Ghana (Consolidated Fund) For the Financial Year Ended 31 December 2016, 2015 and 2014
Report of The Auditor General on the Liabilities of Ministries, Departments and Agencies as At 31 December 2016
Reports of the Auditor General on the Management of Petroleum Funds for the Financial Year Ended 31, 2016, 2015 and 2014
Reports of the Auditor General on the Public Accounts of Ghana Ministries, Department and other Agencies (MDAs) for the Financial Year Ended 31 December 2016, 2015 and 2014
Reports of the Auditor General on the Public Accounts of Ghana District Assemblies for the Financial Year Ended 31 December 2016, 2015 and 2014
Reports of the Auditor-General on the Public Accounts of Ghana Pre-University Educational Institutions for the Financial Year Ended 31 December 2016, 2015 and 2014
Activities Reports of Audit Service for the year 2014, 2015 and 2016
Annual Quality Assurance Report for the year ended 2014, 2015 and 2016 – Issued by Quality Assurance Department of Audit Service
Various management letters issues by auditees (Ministry of Education, Ministry of Health, CAGD)
Transmittal letters of Audit Services and CAGD on annual financial reports for 2014, 2015 and 2016.
Ghana’s Constitution of 1992 with amendment through 1996
Ghana Audit Service Act 2000 (Act 584)
The International Standards of Supreme Audit Institutions, ISSAI: ISSAI 100, ISSAI 200, ISSAI 300 and ISSAI 400.
www.ghaudit.org
Sample External audit follow-up registers of Ghana Audit Service
Samples Management letters issued by MDAs to Ghana Audit Services
o Ministry of Roads and Highway o Department of Urban Roads o Opportunities Industrialization center o MoFA: Policy Planning, Monitoring and Evaluation
Department o MoFA: Finance Directorate o MoFA: National Premix Fuel Secretariat o Ministry of Environment, Science, Technology and
Innovation o Ghana Education Service
Metro Education Service

220
Indicator Information sources
PI-31 Legislative scrutiny of audit reports
31.1 Timing of audit report scrutiny
31.2 Hearings on audit findings
31.3 Recommendations on audit by the legislature
31.4 Transparency of legislative scrutiny of audit reports
Remittance letter of Ghana Audit service for the submission of the audit reports on the Consolidated Fund and also on MDAs for the year ended December 2014, 2015 and 2016
Log sheet of Parliament (Record of Business) for the year 2014, 2015, 2016 and 2017
Various reports of the Public Accounts Committee on the performance audit report of the Auditor General
Public Finance Reform Project Document (World Bank Project No P151447)
Performance Report on the 2015 Budget
Extracts from Annual Report of Parliament
Videos posted on YouTube on public hearing o https://www.youtube.com/watch?v=9uNOIXqOHEM o https://www.youtube.com/watch?v=V1zMfkOOkCg o https://www.youtube.com/watch?v=NhLdpfCi6dY o https://www.youtube.com/watch?v=Lyi8tJzFFBs o https://www.youtube.com/watch?v=ulsDO6nn6g0 o https://www.youtube.com/watch?v=1TWC00GqxPM o https://www.youtube.com/watch?v=sjcw7zzH3v0 o https://www.youtube.com/watch?v=O6VV9T9mD0U o
I. Accounting and reporting

221

222
ANNEX 5: TRACKING CHANGE IN PERFORMANCE BASED ON THE 2011 VERSION OF PEFA
Indicator/Dimension Score of 2012 assessment
Score of current assessment
Description of requirements met in current assessment
Explanation of change (include comparability issues)
PI- 1. Aggregate expenditure outturn compared to original approved budget
C NR Total primary actual expenditure is not known, as actual expenditures financed by IGFs and Statutory Funds are not fully reported on.
Performance unchanged. The score in the 2012 PEFA assessment should have been NR also, as in fact shown under PI-2..
As per 2011 PEFA Framework, total budgeted expenditure excludes debt service payments and donor-funded program and project expenditure.
PI-2. Composition of expenditure outturn to original approved budget
NR NR .
(i) Extent of variance in expenditure composition in last 3 years
NR NR Total primary actual expenditure is
not known, as actual expenditures
financed by IGFs and Statutory
Funds are not fully reported on.
Not possible to assess performance change. Valid comparison is not possible. PI-2 was rated NR in the 2012 assessment, which attempted to compare actual expenditures against all the expenditure categories indicated in the Appropriations Acts, but was unable to do so, for the reasons explained under PI-1.
(ii) The average amount of expenditure actually charged to the contingency vote over the last three years
A A Expenditure from contingency
reserves was 0 percent of the
original approved budget in each of
2014, 2015, and 2016, indicating
that the expenditure contingency
was allocated to the MDAs.
Performance unchanged.
PI-3. Aggregate revenue outturn compared to original approved budget
C
D Actual domestic revenue was below 92 percent or above 116 percent of budgeted domestic revenue in two or all of the last three years. It was 91.4, 88.5 and 89.3 percent for each of the three years, respectively.
Domestic revenue performance appears
to have fallen, probably due to the
adverse external situation confronting
Ghana. Declines in gold and crude oil
prices, as well as declines in production
volumes for gold and cocoa were
contributory factors, leading to greater
revenue unpredictability.
Actual domestic revenues exceeded
budgeted amounts by 27 percent in 2011,
indicating that the under-performance of
revenues during 2014-2016 does not
necessarily indicate systemic under-
performance.
PI-4 Stock and monitoring of expenditure payment arrears (M1)
D D+

223
Indicator/Dimension Score of 2012 assessment
Score of current assessment
Description of requirements met in current assessment
Explanation of change (include comparability issues)
(i) Stock of expenditure payment arrears and a recent change in the stock
D D The stock of expenditure arrears is more than 10 percent of total central government expenditures.
Performance is unchanged. Score and performance are directly comparable.
(ii) Availability of data for monitoring the stock of expenditure payment arrears
D B The PEMU/MoF captures expenditure arrears every quarter. The CAGD also prepares a list of outstanding payables every year, although incomplete. None of these reports is age-profiled.
Performance is strengthened. Score and performance are directly comparable. There is improvement in both score and performance as a result of the quarterly and annual generation of the stock of expenditure arrears, although not complete.
PI-5. Classification of the budget C C
Budgets are prepared on a
program/sub-program basis, and
they are increasingly being executed
and reported as such through the
GIFMIS. The reports are at 2-digit
GFS 2001 economic classification
level, but in principle can be
reported at a lower GFS 2001 level.
Performance improved due to the introduction of program-based budgeting in 2014. This was not enough to improve the score.
PI-6. Comprehensiveness of information included in budget documentation
C B
Five out of the 9 elements have been fulfilled, as listed in the 2011 Framework.
Performance has improved.
PI-7 Extent of unreported government operations (M1)
C+ D D
(i) Extent of unreported domestic operations
A D Scores in the 2012 assessment were too high, as indicated in the 2018 PEFA assessment using the 2016 PEFA Framework.
Performance is unchanged. The 2012 assessment indicated that IGFs retained by MDAs were only 0.05 percent of total expenditures. This probably should have read as ‘5’ percent. The assessment also states that the expenditures of the Statutory Funds were reported to Parliament. This is the case, but they are largely financed by transfers from the Consolidated Fund, and the expenditures of these transfers should be reported to the Executive.
(ii) Extent that donor-financed operations are reported
C D The score was too high in the 2012 assessment. It did not take into account that: (i) though grants and loans from donors are generally recorded, they do not represent 100 percent of all such loans and grants (although coverage is more complete for loans); and (ii) expenditures out of these loans and grants are not reported.
Performance is unchanged. The system for reporting on the amounts of donor grants and loans, and the spending thereof, is broadly unchanged.
PI-8: Transparency of Inter-governmental Operations (M2)
D+ D+
8.(i): Transparency and objectivity in the horizontal allocation among Sub-national Governments
C C The system of horizontal allocations and the transparency thereof has not changed. .
Performance is unchanged.

224
Indicator/Dimension Score of 2012 assessment
Score of current assessment
Description of requirements met in current assessment
Explanation of change (include comparability issues)
8.(ii): Timeliness and reliable information to Sub-National Governments on their allocations
D D Timeliness and reliability have not changed,
Performance is unchanged.
8. (iii) Extent of consolidation of fiscal data for general government according to sectoral categories
D D Fiscal data for GoG and MMDAs are still not consolidated, though this should now be possible because of the advent of GIFMIS. This dimension is not included in the 2016 PEFA Framework.
Performance is unchanged.
PI-9 Oversight of aggregate fiscal risk from other public-sector entities. (M1) (Note that scoring method should have been M2, not M1).
C D+ Performance improved under dimension (ii). Overall performance improved to C from C+, taking into account the wrong score for dimension (i) in the 2012 assessment and using the M2 scoring method, not the M1 method that was incorrectly used in the 2012 assessment.
9. (i)Extent of central government monitoring of autonomous entities and public enterprises
C D As of end-February 2018, the SEC had received the 2016 financial statements from only five of the 39 SOEs it monitors. No GOG department collects financial statements from or presents a consolidated view of all 128 SOEs.
Performance is unchanged. Re-reading the narrative under the 2012 Assessment, it is clear that the score should have been D.
9 (ii) Extent of central government monitoring of Sub-National Government’s fiscal position
C B The MLGRD and the CAGD receive monthly summaries of revenues and expenditures from all MMDAs. The Ghana Audit Service produced a 2016 consolidated annual report on the accounts of MMDAs that was published in August 2017. It incorporated the audit results of 82 percent of the MMDA’s in terms of revenues, expenditures, assets and liabilities.
Performance is improved. The same arrangements are currently in place, as described in 2012/13 (that the MLGRD and CAGD prepare monthly summaries). However, whereas in 2012/13, the central government did not prepare a consolidated report, it is now the case that there is a consolidated report, although it is prepared by the GAS.
PI-10 Public access to key fiscal information
B B
Four out of the 6 elements as listed in the 2011 Framework have been met: (i), (ii), (iii), & (iv).
Performance is unchanged. (i) Annual budget documentation. (ii) In-year budget execution reports. (iii) Year-end financial statements. (iv) External audit reports.
PI-11. Orderliness and participation in the annual budget process
C C No change in performance. The scoring criteria for 17.1 and 17.2 are the same as for PI-11 (i) and PI-11 (ii) in the 2011 PEFA Framework. The criterion for 17.3 is different, but it is the same as for PI-27.3 in the 2011 PEFA Framework. Direct comparability is therefore possible.

225
Indicator/Dimension Score of 2012 assessment
Score of current assessment
Description of requirements met in current assessment
Explanation of change (include comparability issues)
(i) Existence of, and adherence to, a fixed budget calendar
C C The annual budget calendar for preparing the 2018 budget was issued by the MoF in February 2017. The Budget Circular was issued to the MDAs on August 15, 2017. The MDAs were required to submit the budget documents by August 31. This allowed only 3 weeks for the MDAs to prepare their budget submissions, and many MDAs were late.
Performance is unchanged.
(ii) Guidance on the preparation of budget submissions
C C The Budget Circular is clear and
relatively comprehensive. It includes
ceilings and guidelines, including
templates. The Circular for the 2018
budget preparation was approved
for issue by the MoF, but not by the
Cabinet.
Performance is unchanged.
(iii) Timely approval of the budget by the Parliament over the last 3 FYs.
A A Performance is unchanged. (PI-18.3 in 2016 Framework)
PI-12 Multi-year perspective in fiscal planning, expenditure policy and budgeting
C+ B )
(i) Multi-year forecasts & functional allocations
C C Forecasts of fiscal aggregates on the basis of the main categories of program and economic classification are made for 3 years ahead on a rolling annual basis. These are shown in the annual Budget Statement and Economic Policy document. Links between multi-year estimates and subsequent setting of budget ceilings are not made and differences are not explained.
Performance unchanged.
(ii) Scope and frequency of debt sustainability analysis
A A The Debt Management Department in MoF continues to conduct an annual DSA.
Performance unchanged.
(iii) Existence of costed sector strategies
C B Assisted by the National Development Planning Commission (NDPC), all MDAs prepared costed medium-term strategic plans (2014-2017) in support of GSGDA 2 (the overall long term plan). These plans are available on NDPC’s website. They are broadly consistent with fiscal forecasts.
Performance improved. due to the medium term development plans (MTDPs) being costed and NDPC providing oversight, including checking that the MTDPs are consistent with GSGDA 2..
(iv) Linkages between investment budgets and forward expenditure budgets.
C C The linkages continue to be somewhat tenuous. The future recurrent costs implied by committed investment projects continue not be only partially estimated.
Performance unchanged.

226
Indicator/Dimension Score of 2012 assessment
Score of current assessment
Description of requirements met in current assessment
Explanation of change (include comparability issues)
PI-13 Transparency of taxpayer obligations and liabilities (M2)
C+ B
(i) Clarity and comprehensiveness of tax liabilities
D B Legislation continues to be generally comprehensive and clear. Discretionary powers continue to be limited.
Performance is unchanged. The 2012/13 assessment regarded large areas of taxation as having important elements of administrative discretion. The 2018 team disagrees and regards administration as having only fairly limited discretionary powers.
(ii) Taxpayer access to information on tax liabilities and administrative procedures
A A The Communications and Public Affairs Department of the Ghana Revenue Authority provides taxpayers with information about their rights and obligations, as well as redress processes and procedures.
Performance is unchanged.
(iii) Existence and functioning of a tax appeal mechanism.
C C There continues to be clear administrative procedures for appeals. There continues to be no data on or monitoring of appeals received, processed, resolved and so on. Business groups report considerable delays in processing appeals.
Performance is unchanged.
PI-14 Effectiveness of measures for taxpayer registration and tax assessment (M2)
C C Performance is unchanged.
(i) Controls in the taxpayer registration system
C C The legal framework continues to require taxpayers to register. The Domestic Tax Revenue Department (DTRD) TRIPS™ is still being rolled out, with weak links to other government databases. That said, GRA conducts sites visits to taxpayers in addition to surveys to update taxpayer database
Performance is unchanged.
(ii) Effectiveness of penalties for non-compliance
C C Penalties continue to be high to encourage compliance, but no data are available comparing possible penalties with imposed penalties and paid penalties. It is understood that registration of non-compliance continues to be a significant problem.
Performance is unchanged.
(iii) Planning and monitoring of tax audit and fraud investigation programs
C C The GRA performs audits across all taxes and types of taxpayers. Customs Division audits are selected on the basis of clear risk criteria. The DTRD audits tend to be performed to meet targets in terms of coverage, numbers and types of audits rather than clear risk criteria.
Performance is unchanged.
PI-15 Effectiveness in collection of tax payments (M1)
D+ NR Performance is unchanged for all 3 dimensions.

227
Indicator/Dimension Score of 2012 assessment
Score of current assessment
Description of requirements met in current assessment
Explanation of change (include comparability issues)
(i) Collection ratio for gross tax arrears
B NR Based on GRA data, the stock of arrears continues to remain in the range of 3-4 percent of total GRA-administered revenues, and is therefore significant according to the 2011 PEFA Framework. The TADAT report (2017) on tax administration in Ghana considers, however, that the data on tax arrears are too unreliable to enable the estimation of the ratio ot tax arrears to total tax revenues. The collection ratio cannot therefore meaningfully be calculated. Hence, not rated (NR)
Given the unreliability of tax arrears data, it is not possible to assess change in performance.s
(ii) Effectiveness of transfer of tax collections to the Treasury by the revenue administration
A B All tax revenues continue to be paid directly into the accounts controlled by the CAGD, that is, the GRA Zero-Balance Accounts (ZBAs) held at two commercial banks, Ecobank and GCB Bank, as well as the RA Revenue Transit Accounts (GRTAs) that form part of the TSA held at the BoG. It takes about 2 days for revenues to reach the accounts managed by CAGD.
Performance is unchanged. The score should have shown as B in the 2016 PEFA assessment.
(iii) Frequency of complete accounts reconciliation between tax assessments
D D There continues to be no complete reconciliation of all the following elements: tax assessments, collections, arrears and transfers to the Consolidated Fund Account.
PI-16 Predictability in the availability of funds for commitment of expenditures (M1)
D+ C+ Overall performance is improved.
(i) Extent to which cash flows are forecasted and monitored
C C The MDAs prepare annual cash flows which are consolidated by the MoF; however, they are not updated.
Performance and score are unchanged. Score and performance are directly comparable.
(ii) Reliability and horizon of periodic in-year information to MDAs on ceilings for expenditures
D+ C The MoF issues reliable quarterly expenditure commitment warrants to all MDAs.
Performance is improved. Score and performance are directly comparable. In 2012, monthly expenditure commitment warrants were issued, but they were not reliable. The improvement does not mean much, however, as the cash to pay the invoices arising from the commitments may not be available.
(iii) Frequency and transparency of adjustments to the budget
C B Significant budget reallocations take place only once a year. Within the assessment period, only one supplementary budget was prepared and approved by the Parliament.
Performance is improved. Score and performance are directly comparable. Improvement is due to the reduced frequency in budget reallocations.
PI-17 Recording and management of cash balances, debts and guarantees (M2)
B
C Drop in overall score due to slippage in dimension (i)

228
Indicator/Dimension Score of 2012 assessment
Score of current assessment
Description of requirements met in current assessment
Explanation of change (include comparability issues)
(i) Quality of debt data recording and reporting
B C The 2012 PEFA assessment noted challenges in monitoring the performance of on-lent loans. This still seems to be the case. It indicates no reconciliation issues, but there probably were some, as these remain issues, as noted in the Auditor General reports.
Performance dropped; monitoring of guarantees is weak
(ii) Extent of consolidation of the government’s cash balances
C▲
C Consolidation of government bank/cash balances is done daily, but it is still limited to Treasury-managed bank accounts. MDAs bank accounts with commercial banks, as well as donor-financed project accounts, are not part of the daily consolidation process.
No change in both score and performance. Score and performance are directly comparable. The introduction of the TSA in August 2017 is seen as a major step to improving the consolidation of government bank/cash balances. It is too early to warrant any change in score and performance.
(iii) Systems for contracting loans and issuance of guarantees
C C The systems have not changed. The scoring criterion is specified differently from that specified under the 2016 PEFA Framework.
Performance is unchanged.
PI-18: Effectiveness of payroll controls (M1)
C+ C+ Performance improved under (ii), but score stays the same.
(i) Degree of integration and reconciliation between personnel records and payroll data
A B The scoring criterion in the 2011 Framework did not explicitly require reconciliation of the payroll with the establishment list.
Performance is unchanged, taking into account that the score should have been a B in the 2012 assessment.
(ii) Timeliness of changes to personnel records and the payroll
C C Though timeliness of updates of personell records have improved, the extent of retro-active adjustments keeps the score at C.
Performance unchanged.The timeliness of updates to personnel records improved (mainly on time), but retroactive adjustments are still not un-common..
(iii) Internal controls over changes to personnel records and the payroll
B B The scoring criterion under the 2012 methodology is essentially the same as under the 2016 methodology. The two scores are therefore comparable, though worded slightly differently.
No change in performance.
The E-SPV strengthened internal control, but this does not yet change the scoring. Some Management Units (MUs) are not sufficiently using the E-SPV properly as a validation tool, and the E-SPV is not yet integrated with the HR database.
(iv) Existence of payroll audits to identify control weaknesses and/or ghost workers
B B The scoring criterion is the same for both the 2011 and 2016 Frameworks (payroll audit conducted for all government entities at least once in the last 3 years). The scores are comparable.
Performance is unchanged. The GAS audits the payroll as part of its annual audit of the MDAs.
PI-19 Competition, value for money and controls in procurement
C B Overall performance improved through dimensions (ii) and (iii).
(i) Transparency, comprehensiveness and competition in the legal and regulatory framework.
B B The legal and regulatory framework meets five out of the six PEFA requirements. Criterion (iv) is not fully met, as the law allows for the use of other (sole source) methods, where necessary.
Score and performance are directly comparable. No change in score and performance although an amended PPA Act, 2016, was passed principally to reduce bureaucracy.

229
Indicator/Dimension Score of 2012 assessment
Score of current assessment
Description of requirements met in current assessment
Explanation of change (include comparability issues)
(ii) Use of competitive procurement methods
D C At least 70 percent of all public procurement is done through open competitive procurement methods. This is below the 80 percent required for a 'B' score.
Performance is improved. Score and performance are directly comparable.
(iii) Public access to complete, reliable and timely procurement information
D B All key procurement information (procurement plans, bidding opportunities, contracts awards, and complaint resolutions) are made public, but only for about 70 percent of the value of all government procurements.
Score and performance are directly comparable. Improvement in both score and performance due to consistent publication of all key procurement information for at least 70 percent of all public procurements, which was not the case in 2012.
(iv) Existence of an independent administrative procurement complaint system
B B The procurement complaint mechanism meets all but criterion (vii) of the PEFA benchmarks.
Score and performance are directly comparable. No change.
PI-20 Effectiveness of internal controls for non-salary expenditures (M1)
D+ C+ Overall performance is improved through dimensions (i) and (iii).
(i) Effectiveness of expenditure commitment controls
D C Commitment controls are in place due to the GIFMIS, but, to an extent, commitments continue to be made outside of the GIFMIS.
Performance is improved, but further improvement is needed.
(ii) Comprehensiveness, relevance and understanding of other internal control rules/procedures
B B Not covered under the 2016 Framework. No evidence of any substantial change.
Performance is unchanged.
(iii) Degree of compliance with rules for processing and recording transactions
C B The GIFMIS is now fully established, thus making non-compliance harder.
Performance is improved.
PI-21 Effectiveness of internal audit (M1)
C+ C+ Overall performance is unchanged, but it has improved under dimension (iii).
(i) Coverage and quality of the internal audit function
C C The IA function operates in all MDAs. Systems audits continue to be performed only to a limited extent, mainly due to capacity constraints.
The 2016 Framework is comparable to the 2011 Framework. Performance is unchanged.
(ii) Frequency and distribution of reports
B C This dimension is similar to PI 26.3 in the 2016 Framework, but less quantified in terms of scoring. Performance seems to about the same.
Performance is unchanged.
(iii) Extent of management response to internal audit function.
C B Management response to the recommendations of internal audit reports seems to have significantly improved.
Performance is improved. This dimension is comparable to PI 26.4 in the 2016 Framework, which scores a B.
C(iii) Accounting, Recording and Reporting
PI-22 Timeliness and regularity of accounts reconciliation (M2)
D+ C+ Overall performance is improved.

230
Indicator/Dimension Score of 2012 assessment
Score of current assessment
Description of requirements met in current assessment
Explanation of change (include comparability issues)
(i) Regularity of bank reconciliation
D C All Treasury-managed bank accounts are reconciled monthly within 4 weeks, but there are other MDA bank accounts with commercial banks that are delayed for at least 8 weeks. DP accounts are reconciled monthly, within 4 weeks, but do not form part of the government.
Score and performance directly comparable. Performance and score improved due to all Treasury-managed bank accounts now being reconciled each month within 4 weeks.
(ii) Regularity and clearance of suspense accounts and advances
C C There are no longer any suspense accounts, as a matter of policy. Revenues and expenditures that cannot immediately be classified are temporarily classified under a revenue or expenditure code. Advance accounts are reconciled within two months after the end of the FY, albeit with some un-cleared balances.
Score unchanged. Though suspense accounts have been ended, the C score for advances, and thus the overall score still stand.
PI-23 Availability of information on resources received by service delivery units
D D Information obtained on cash resources received by by primary education and health care service delivery units has improved with the introduction of GIFMIS but there is no evidence of monitoring and reporting of information on in-kind resources .
No change
PI-24 Quality and timeliness of in-year budget reports (M1)
C D+ Overall performance unchanged due to D score for 24.1. . Scope and performance are directly comparable.
(i) Scope of reports in terms of coverage and compatibility with budget estimates
C D Not all budgeted expenditures are reported on in the in-year budget execution reports. The reports do not cover expenditures funded by IGFs, grant-funded donor projects and expenditures funded by Statutory Funds (e.g. GETFUND).
Performance unchanged. The rating should have been D also in the 2012 PEFA assessment.
(ii) Timeliness of the issue of reports
C A Reports are prepared quarterly or more frequently and are issued within 4 weeks of the end of the period.
Performance improved, mainly because of the establishment of the GIFMIS.
(iii) Quality of information C C The reports prepared by the CAGD omit expenditures financed by IGFs and donor funds. Delays in reconciling bank accounts of MDAs held in commercial banks may also affect the quality of information.
Performance is unchanged.
PI-25 Quality and timeliness of annual financial statements (M1)
C+ D+ Overall performance is unchanged. The rating for 25.1 changed to D. Scope and performance are directly comparable.
(i) Completeness of the financial statements
C D The statements still omit information on expenditures financed by retained IGFs, donor funds and Statutory Funds.
Performance is unchanged. The rating in the 2012 assessment should also have been D

231
Indicator/Dimension Score of 2012 assessment
Score of current assessment
Description of requirements met in current assessment
Explanation of change (include comparability issues)
(ii) Timeliness of submissions of the financial statements
A A The statements were submitted for audit 3 months after the end of the FY (this is still an A if submitted by 6 months after the end of the FY).
Performance is unchanged.
(iii) Accounting standards used C C The GoG has not yet adopted IPSAS (required for a score higher than C). It is preparing for the adoption of IPSAS accrual.
Performance is unchanged.
C (iv) External Scrutiny and Audit
PI-26 Scope, nature and follow-up of external audit (M1)
C+ B Performance improved due to more effective follow-up under dimension (iii)
(i) Scope/nature of audit performed (including adherence to auditing standards)
B B The financial audit covers most of the central government’s annual expenditures. It is conducted in accordance with ISSAI standards where significant findings are highlighted.
Performance is unchanged.
(ii) Timeliness of submission of audit reports to the Legislature
B B Audit reports were submitted to Parliament within 6 months after their receipt.
Performance is unchanged.
(iii) Evidence of follow up on audit recommendations
C B The GAS checks whether its recommendations are being implemented.
Performance improved, as the frequency of recurring issues appears to be declining.
PI-27 Legislative scrutiny of the annual budget law (M1) Next one
D+ C+ Performance improved under all dimensions. Scope and performance are directly comparable
(i) Scope of the legislature scrutiny
C B The scoring criterion is the
same as for PI 18.1 in the 2016
Framework. The B rating
requires that Parliament review
fiscal policies and aggregates
for the coming year as well as
details of expenditure and
revenue.
Performance improved. The Parliament scrutinizes both the aggregate and detailed budget estimates for both revenues and expenditures at the national (consolidated) level and at sectoral level, including to some extent the fiscal policies and macroeconomic forecasts for the coming year. The review does not include outer year estimates

232
Indicator/Dimension Score of 2012 assessment
Score of current assessment
Description of requirements met in current assessment
Explanation of change (include comparability issues)
(ii) Extent to which the legislature’s procedures are well established and respected
B A Clear rules exist for legislative budget scrutiny. These rules are enshrined in the Standing Orders. They are well respected, and allow for public consultation and solicitation of technical support with regard to budget review. The rules also make provision for specialized budget review committees (such as a select committee, and finance committee).
Performance appears to have improved due to more time available for debate on documents submitted to Parliament. This may, however, be a matter of interpretation. The scoring criterion of the 2012 and 2016 Frameworks is comparable.
(iii) Adequacy of time for the legislature to provide a response to budget proposals
C C The legislature has at least one month to review the budget proposals.
Performance is unchanged. This indicator is comparable to PI-17(iii) in the 2016 Framework.
(iv) Rules for in-year amendments to the budget without ex-ante approval by the legislature
D B Articles 179(8) & (9) of the Constitution, and Section 32 of the PFM Act of 2016 outline the rules for in-year budget reallocations; they are clear and respected.
The law places no limitation on the number and value of virements.This provides potential for extensive administration reallocation, but in practice, this is highly restricted.
One Supplementary Appropriations Bill was passed ex-ante in 2016 to increase the aggregate budget by 2 percent of the originally approved budget.
Performance improved due to a lower frequency of virements.
PI-28 Legislative scrutiny of external audit reports (M1)
D+ D Overall performance is unchanged due to unchanged performance under (i). Scope and performance are directly comparable.
(i) Timeliness of examination of audit reports by the legislature
D D The audited financial statements of the Consolidated Fund were submitted to Parliament more than two years from the date of their receipt from the Auditor General.
Performance is unchanged.

233
Indicator/Dimension Score of 2012 assessment
Score of current assessment
Description of requirements met in current assessment
Explanation of change (include comparability issues)
(ii) Extent of hearings on key findings undertaken by the legislature
B D The PAC’s focus improved as it holds hearings only with MDAs that have had their audits qualified by the GAS. At the time of the 2012 PEFA assessment, the PAC was reviewing audit reports on the Consolidated Fund and the Public Accounts of MDAs, but these reports were more than 3 years old and outside the scope of this PEFA report’s review.
Performance unchanged. PAC hearings are only being held on audit reports more than 3 years old and thus outside the review of this PEFA report.. But this was also the situation at the time of the 2012 PEFA report. The score for this therefore probably have been D also.
(iii) Issuance of recommended actions by the legislature and implementation by the executive
B D Performance unchanged. The score has also been changed to D for the same reasons as for (ii). In any case, the score in the 2012 assessment appears to be too high, as little has changed since then..

234
ANNEX 6: PIs 1-2 EXPENDITURE DATA (2016 Framework) PIs 1-2 Expenditure Data: 2014 (cedi)
Administrative Head Budget Actual Adjusted Budget Deviation Absolute Deviation Percent
001 - Office of Government Machinery
329,508,729 331,226,549 403,132,779.1 -71,906,229.8 71,906,229.8 17.8%
003 - Parliament of Ghana
208,365,215 165,213,916 254,921,465.8 -89,707,549.7 89,707,549.7 35.2%
005 - Audit Service 119,115,792 108,404,825 145,730,525.6 -37,325,700.8 37,325,700.8 25.6%
006 - Public Services Commission
3,483,805 2,955,916 4,262,211.8 -1,306,295.3 1,306,295.3 30.6%
008 - Electoral Commission
139,477, 234 138,224,289 170,641,442.9 -32,417,153.5 32,417,153,5 19.0%
009 - Ministry of Foreign Affairs and Regional Integration
141,217,551 141,016,079 172,770,609.0 -31,754,530,5 31,754,530,5 18.4%
010 - Ministry of Finance
725,303,369 888,682,404 887,362,115,5 1,320,288.,2 1,320,288,2 0.1%
011 - Ministry of Local Government and Rural Development
82,833,752 427,781,554 101,341,778.6 326,439,775.5 326,439,775.5 322.1%
031 - Ministry of Information and Media Relations
62,385,693 53,079,345 76,324,890.9 -23,245,546.0 23,245,546.0 30.5%
012 - Ministry of Food and Agriculture
73,768,336 57,579,687 90,250,824.0 -32,671,136.5 32,671,136.5 36.2%
013 - Ministry of Lands and Natural Resources
77,074,420 102,251,579 94,295,605.5 7,955,973.3 7,955,973.3 8.4%
017 - Ministry of Environment Science, Technology and Innovation
162,015,714 156,512,790 198,215,826.5 -41,703,036.0 41,703,036.0 21.0%
023 - Ministry of Education
4,560,827,381 5,246,348,295 5,579,879,546.0 -333,531,251.3 333,531,251.3 6.0%
022 - Ministry of Roads and Highways
79,889,295 240,400,805 97,739,424.4 142,661,380.1 142,661,380.1 146.0%
029 - Ministry of Health 1,208,823,014 1,598,288,841 1,478,917,364.6 119,371,476.5 119,371,476.5 8.1%
034 - Ministry of Defence
531,615,816 758,284,828 650,397,827.0 107,887,000.8 107,887,000.8 16.6%
036 - Judicial Service 184,911,744 105,050,218 226,227,649.5 -121,177,431.3 121,177,431.3 53.6%
037 - Ministry of The Interior
963,777,060 1,101,306,782 1,179,119,369.1 -77,812,587.1 77,812,587.1 6.6%
033 - Office of the Attorney General and Ministry of Justice
56,570,545 44,173,413 69,210,430.6 -25,037,017.8 25,037,017.8 36.2%
021 - Ministry of Works and Housing
89,718,844 260,848,399 109,765,246.7 151,083,151.9 151,083,151.9 137.6%
21 (= sum of rest) 415,488,556 571,199,998 508,323,578.5 62,876,419.5 62,876,419.5 12.4%
Total non-interest expenditures, excluding Contingency
10,216,171,865 12,498,830,512 12,498,830,511.7 0.0 1,839,190,931.3
Expenditure contingency
76,508,343 0
Total non-interest expenditures, including Contingency
10,292,682,208
Interest 6,178,597,987 7,080,869,100
Total expenditures 16,471,278,195 19,677,202,003
Aggregate expenditure performance (PI-1)
119.5%
Composition of expenditure variance (PI-2)
14.77%
Contingency share of budget
0.5%
Sources: Appropriation Act, 2013; Ghana Audit Service, Audit Report of the Consolidated Fund, 2014.

235

236
PIs 1-2 Expenditure Data 2015 (cedi)
Administrative Head Budget Actual Adjusted Budget Deviation Absolute Deviation Percent
001 - Office of Government Machinery
285,545,287 460,389,600 393,673,935.5 66,715,664.7 66,715,664.7 16.95%
003 - Parliament of Ghana
184,180,572 157,074,231 253,925,012.7 -96,850,781.8 96,850,781.8 38.14%
005 - Audit Service 125,527,610 117,339,489 173,061,684.0 -55,722,194.7 55,722,194.7 32.20%
006 - Public Service Commission
3,656,582 9,273,446 5,041,235.5 4,232,210.9 4,232,210.9 83.95%
008 - Electoral Commission
31,976,919 215,097,057 44,085,754.9 171,011,301.9 171,011,301.9 387.91%
009 - Ministry of Foreign Affairs and Regional Integration
210,696,969 183,891,195 290,482,486.5 -106,591,291.0 106,591,291.0 36.69%
010 - Ministry of Finance
628,273,859 980,215,820 866,184,993.7 114,030,826.3 114,030,826.3 13.16%
011 - Ministry of Local Government and Rural Development
47,721,743 489,417,723 65,792,738.4 423,624,984.2 423,624,984.2 643.88%
031 - Ministry of Information and Media Relations
68,199,696 66,747,969 94,025,165.0 -27,277,196.2 27,277,196.2 29.01%
012 - Ministry of Food and Agriculture
59,630,081 97,585,346 82,210,457.4 15,374,888.3 15,374,888.3 18.70%
013 - Ministry of Lands and Natural Resources
93,959,587 134,837,117 129,539,663.5 5,297,453.9 5,297,453.9 4.09%
017 - Ministry of Environment Science, Technology and Innovation
146,900,650 172,456,632 202,528,144.0 -30,071,511.8 30,071,511.8 14.85%
023 - Ministry of Education
4,943,782,587 5,670,909,266 6,815,865,768.8 -1,144,956,502.4 1,144,956,502.4 16.80%
022 - Ministry of Roads and Highways
28,754,370 426,577,410 39,642,909.6 386,934,500.1 386,934,500.1 976.05%
029 - Ministry of Health
1,308,131,802 2,220,439,714 1,803,487,635.9 416,952,077.8 416,952,077.8 23.12%
034 - Ministry of Defence
667,010,250 707,146,307 919,589,858.7 -212,443,551.9 212,443,551.9 23.10%
036 - Judicial Service 193,090,718 139,338,883 266,209,201.5 -126,870,318.7 126,870,318.7 47.66%
037 - Ministry of The Interior
1,135,118,927 1,393,012,459 1,564,959,239.6 -171,946,780.3 171,946,780.3 10.99%
033 - Office of the Attorney General and Ministry of Justice
62,574,987 64,902,432 86,270,523.5 -21,368,091.8 21,368,091.8 24.77%
021 - Ministry of Works and Housing
11,321,834 114,285,551 15,609,121.0 98,676,429.6 98,676,429.6 632.17%
21 (= sum of rest) 278,799,485 675,621,555 384,373,671.9 291,247,883.1 291,247,883.1 75.77%
Total non-interest expenditures, excluding contingency
10,514,854 515 14,496,559,202 14,496,559,201.6 .,0 3,988,196,441.2
Expenditure contingency
84,371,351
Total non-interest expenditure, including contingency
10,599,225 866
Interest 9,557,175,000 9,075,338,365
Total expenditures 20,156,400 866 23,571,897,567
Aggregate expenditure performance (PI-1)
116.9%
Composition variance (PI-2)
27.5%
Contingency share of budget
0.42%
Sources: Appropriation Act, 2014; Ghana Audit Service, Audit Report of the Consolidated Fund, 2015.

237
PIs 1-2 Expenditure data 2016 (cedi)
Administrative Head Budget Actual Adjusted budget Deviation Absolute deviation Percent
001 - Office of Government Machinery
578,848,157 594,359,602 844,436,417.0 -250,076,815.1 250,076,815.1 29.61%
003 - Parliament of Ghana
255,865,717 244,217,583 373,262,533.0 -129,044,950.1 129,044,950.1 34.57%
005 - Audit Service 140,611,756 134,385,843 205,127,520.9 -70,741,677.7 70,741,677.7 34.49%
006 - Public Services Commission
2,234,389 2,025,486 3,259,575.8 -1,234,090.2 1,234,090.2 37.86%
008 - Electoral Commission
822,897,500 884,918,230 1,200,460,963.8 -315,542,734.1 315,542,734.1 26.29%
009 - Ministry of Foreign Affairs and Regional Integration
234,085,339 221,639,594 341,488,838.7 -119,849,244.8 119,849,244.8 35.10%
010 - Ministry of Finance 205,658,746 541,681,771 300,019,499.9 241,662,271.1 241,662,271.1 80.55%
011 - Ministry of Local Government and Rural Development
23,707,785 194,903,815 34,585,438.0 160,318,376.8 160,318,376.8 463.54%
031 - Ministry of Information and Media Relations
14,136,179 111,273,512 20,622,168.7 90,651,343.5 90,651,343.5 439,58%
012 - Ministry of Food and Agriculture
59,776,323 227,238,482 87,203,014.1 140,035,467.9 140,035,467.9 160.59%
013 - Ministry of Lands and Natural Resources
102,479,461 185,086,762 149,499,290.6 35,587,471.4 35,587,471.4 23.80%
017 - Ministry of Environment Science, Technology and Innovation
167,642,050 157,087, 527 244,559,908.0 -87,472,380.6 87,472,380.6 35.77%
023 - Ministry of Education
4,862,412,944 6,231,381,621 7,093,394,899.2 -862,013,278.0 862,013,278.0 12.15%
022 - Ministry of Roads and Highways
33,975,503 1,124,012,458 49,564,210.7 1,074,448 247.7 1,074,448 247.7 2,167.79%
029 - Ministry of Health 1,613,366,584 2,141,789,637 2,353,614,641.4 -211,825,004.0 211,825,004.0 9.00%
034 - Ministry of Defence 624,328,113 879,033,917 910,783,576.6 -31,749,659.1 31,749,659.13 3.49%
036 - Judicial Service 188,500,668 132,892,822 274,988,918.5 -142,096,096.3 142,096,096.3 51.67%
037 - Ministry of The Interior
1,316,160,582 1,978,238,286 1,920,043,991.8 58,194,294.2 58,194,294.22 3.03%
033 - Office of the Attorney General and Ministry of Justice
6,725,269 7,489,398 9,810,970.3 -2,321,572.1 2,321,572.127 23.66%
021 - Ministry of Works and Housing
30,142,909 46,332,862 43,973,138.3 2,359,723.2 2,359,723.2 5.37%
21 (= sum of the rest) 973,592,945 1,841,009,098 1,420,298,791.9 420,710,306.1 420,710,306.1 29.62%
Total non-interest expenditure, excluding contingency
12,257,148,919 17,880,998,307 17,880,998,307.2 0.0 4,447,935,004.1
Expenditure contingency 78,063,445
Total non-interest expenditures, including contingency
12,335,212,364
Interest 10,490,600,361 11,528,959,491
Total expenditures 22,825,812,725 29,409,957,798
Aggregate expenditure performance (PI-1)
128.8%
Composition variance (PI-2)
24.9%
Contingency share of budget
0.34%
Sources: Appropriation Act, 2015; Ghana Audit Service, Audit Report of the Consolidated Fund, 2016.

238
ANNEX 7: ANALYSIS FOR PI-2.2 COMPOSITION VARIANCE BY ECONOMIC CLASSIFICATION
Data for year = 2014 (Cedi)
Economic head Budget Actual Adjusted Budget Deviation Absolute Deviation Percent
Compensation of employees
10,597,256,350 10,466,820,494 10,638,771,338.6 -171,950,844.6 171,950,844.6 1.6%
Use of goods and services 1,550,032,400 1,776,632,829 1,556,104,686.6 220,528,142.4 220,528,142.4 14.2%
Capital expenditures 6,017,344,340 6,095,690,485 6,040,917,421.0 54,773,064.0 54,773,064.0 0.9%
Interest 6,178,597,987 7,080,869,100 6,202,802,782.7 878,066,317.3 878,066,317.3 14.2%
Subsidies 50,000,000 473,725,000 50,195,876.1 423,529,123.9 423,529,123.9 843.8%
Grants 6,498,022,790 4,850,786,077 6,523,478,939.5 -1,672,692,862.5 1,672,692,862.5 25.6%
Social benefits 48,531,656 0 48,721,779.8 -48,721,779.8 48,721,779.8 100.0%
Other expenses 5,231,198,140 5,568,160,315 5,251,691,475.6 316,468,839.4 316,468,839.4 6.0%
Total expenditures 36,170,983,663 36,312,684,300 36,312,684,300.0 0.0 3,786,730,974.0
Composition variance 10.4%
Sources: Appropriation Act, 2013; Ministry of Finance, Fiscal Data Report, 2014.
Data for year = 2015 (Cedi)
Economic head Budget Actual Adjusted Budget Deviation Absolute Deviation Percent
Compensation of employees
12,312,909,378 12,111,177,961 11,084,260,161.6 1,026,917,799.4 1,026,917,799.4 9.3%
Use of goods and services
1,970,009,170 1,388,219,696 1,773,430,916.3 -385,211,220.3 385,211,220.3 21.7%
Capital expenditures 6,956,780,498 7,133,557,040 6,262,595,017.9 870,962,022.1 870,962,022.1 13.9%
Interest 9,557,175,000 9,075,338,365 8,603,507,981.5 471,830,383.5 471,830,383,5 5.5%
Subsidies 50,000,000 25,000,000 45,010,727.4 -20,010,727.4 20,010,727.4 44.5%
Grants 7,408,583,655 6,797,969,708 6,669,314,793.1 128,654,914.9 128,654,914.9 1.9%
Social benefits 60,754,863 60,754,863 54,692,411.6 6,062,451.4 6,062,451.4 11.1%
Other expenses 5,705,054,357 3,036,567,311 5,135,772,934.5 -2,099,205,623.5 2,099,205,623.5 40.9%
Total expenditure 44,021,266,921 39,628,584,944 39,628,584,944.0 0.0 5,008,855,142.6
Composition variance 12.6%
Sources: Appropriation Act, 2014; Ghana Audit Service, Ministry of Finance, Fiscal Data Report, 2015.
Data for year = 2016 (Cedi)
Economic head Budget Actual Adjusted Budget Deviation Absolute Deviation Percent
Compensation of employees
14,023,994,590 14,164,789,917 16,491,195,243.0 -2,326,405,326.0 2,326,405,326.0 14.1%
Use of goods and services
2,536,775,747 3,220,757,139 2,983,063,339.3 237,693,799.7 237,693,799.7 8.0%
Capital expenditure 6,676,877,262 7,678,097,236 7,851,520,894.0 -173,423,658.0 173,423,658.0 2.2%
Interest 10,490,600,361 11,528,959,491 12,336,181,225.6 -807,221,734.6 807,221,734.6 6.5%
Subsidies 50,000,000 0 58,796,354.8 -58,796,354.8 58,796,354.8 100.0%
Grants 9,651,420,600 8,607,303,837 11,349,367,005.6 -2,742,063,168.6 2,742,063,168.6 24.2%
Social benefits 75,434,987 0 88,706,045.3 -88,706,045.3 88,706,045.3 100.0%
Other expenses 6,604,748,187 13,725,624,848 7,766,702,360.3 5,958,922,487.7 5,958,922,487.7 76.7%
Total expenditures 50,109,851,734 58,925,532,468 58,925,532,468.0 0.0 12,393,232,574.9
Composition variance 21.0%
Sources: Appropriation Act, 2015; Ministry of Finance, Fiscal Data Report, 2016.

239
ANNEX 8: LIST OF PEOPLE MET Name Organisation Position Telephone Email
Ministry of Finance
Michael Ayesu MoF Director, ERM +233-30-2663304 [email protected]
Eva Esselba Mends MoF Ag Director of Budget +233-20-2030344 [email protected]
Nana K. Adjei-Mensah MoF TA-PFM and Expenditure +233-24-4310534 [email protected]
Dr Mawuli Gaddah MoF Head, MRU +233-24-3226303 [email protected]
Dr Mohammed Sani Abdulai MoF Project Director, PFMRP +233-26-1383837 [email protected]
Kwame Gyesaw MoF Head, FPU +233-20-9563394 [email protected]
Evelyn Arthur MoF Head, Budget Planning & Preparation Unit +233-50-1290125 [email protected]
Thomas Appiagyei MoF Group Head, Budget Implementation +233-50-1290134 [email protected]
Tony Nyamiah MoF Budget BDCU +233-26-6151538 [email protected]
Minta Botwe MoF Deputy Head, BTAS +233-26-7581424 [email protected]
Richard Ebo Amuah MoF Head, Budget Reforms +233-20-9015281 [email protected]
Joseph Amponsah MoF Deputy Head, BDU +233-27-7447494 [email protected]
Deborah Ashun MoF Budget Planning +233-20-6895447 [email protected]
Andy Amedson MoF Budget CMU +233-20-8123183 [email protected]
B. A. Van-Segbefia MoF Economic Officer, PEMU +233-54-2123689 [email protected]
Joyce Abena Agyemang MoF Senior Economic Officer, PEMU +233-24-2747419 [email protected]
Yaa Asanteoa Asante MoF Head, PEMU +233-24-9299995 [email protected]
David Quist MoF Head, Non-tax Unit +233-20-2030361 [email protected]
Evelyn Sam MoF Principal Budget Analysis, NTU +233-23-5209021 [email protected]
Fred Dartey MoF Deputy Head, PIP Unit +233-20-8452069 [email protected]
David Collison MoF Head, PID +233-20-2030359 [email protected]
Jocelyn Awuah MoF PID Schedule Head +233-50-1290104 [email protected]
Irene Addo-Dankwah MoF Head, PPP Unit +233-50-1290096 [email protected]
Joseph Antwi MoF Head, Fiscal Decentralisation Unit +233-24-2537894 [email protected]
Maame E. Munko MoF Assistant Budget Officer +233-27-6294655 [email protected]
Naa Ayongo Mensah MoF Project Accountant +233-26-2919282 [email protected]
Rosemond Appiah MoF Budget Analyst +233-24-1935421 [email protected]
Samuel Aggrey MoF Principal Economic Officer +233-24-6555533 [email protected]
Controller & Accountant General's Department
Mr Eugene A. Ofosuhene CAGD Controller & Accountant General +233-24-2223122 [email protected]
Ben Adade CAGD Ag Deputy CAG, Treasury +233-24-4612590 [email protected]

240
Name Organisation Position Telephone Email
Wisdom K. Messan CAGD Deputy CAG, Internal Audit & Investigation +233-54-9111757 [email protected]
K. Kwaning-Bosompem CAGD Deputy CAG, Payroll Management +233-24-8666789 [email protected]
S. Asare Fianko CAGD Ag Deputy CAG, Finance & Admin +233-20-8180215 [email protected]
Samuel Aryee CAGD Ag Deputy CAG, ICT +233-20-8120892 [email protected]
Kwasi Owusu CAGD Deputy CAG, Financial Management +233-20-6590712 [email protected]
Alhaji Siraj Tanko CAGD-GIFMIS Team lead, GIFMIS Project +233-24-8883290 [email protected]
Daniel A. Sahnoon CAGD-GIFMIS Deputy Component Lead, GIFMIS Project +233-24-4681995 [email protected]
Ebenezer Tackie Yaboi CAGD-GIFMIS Task Team Leader, GIFMIS Project +233-24-4653325 [email protected]
Irene Danquah CAGD Principal Accountant +233-26-4619099 [email protected]
Frank Brobbey CAGD Senior Accountant +233-24-4980457 [email protected]
Wisdom Amedome CAGD Senior Accountant +233-24-8146189 [email protected]
Elsie Adom-Frimpong CAGD Chief Accountant +233-24-4771344 [email protected]
Ted Ashia CAGD Senior Accountant +233-50-8975204 [email protected]
Sheriff Ibrahim CAGD Assistant Accountant +233-24-4844179 [email protected]
Mrs Elizabeth Osei CAGD Director, Payroll +233-30-3974521 [email protected]
Angela Peasah CAGD Director, Public Accounts +233-24-4155509 [email protected]
Dr Gilbert Nyaledzigbor CAGD Chief Cashier +233-20-9792541 [email protected]
David Obuamah CAGD - PDI Head, Public Debt & Investment +233-20-2649901 [email protected]
Sheila Adjetey CAGD - PDI +233-50-9628737 [email protected]
Kwateng Akua CAGD - PDI +233-50-2849070 [email protected]
Diana A. Salifu CAGD - PDI Senior Accountant +233-24-5386080 [email protected]
Kofi Yeboah CAGD - PDI Assistant Accountant +233-20-6637001 [email protected]
Yvonne Dey CAGD - PDI Accounting Technician +233-24-4833408 [email protected]
Albert Kodjoe CAGD - PDI Assistant Accountant +233-24-2911146 [email protected]
Amoh Kissi CAGD - revenue Chief Accountant +233-24-6241475
Godwin Zagbede CAGD - revenue Senior Accountant +233-24-4653915
Wisdom Amedorme CAGD - revenue Assistant Accountant +233-24-8146189
Ghana Revenue Authority
Emmanuel Kofi Nti GRA Ag Commissioner General +233-26-8868155 [email protected]
Kwasi Agyekum GRA Deputy Commissioner, Finance +233-26-2813141 [email protected]
Kwasi Bobie-Ansah GRA Chief Revenue Officer, Communications +233-20-8159478 [email protected]
Florence Asante GRA Chief Revenue Officer +233-30-2675701 [email protected]
Richard Kumah GRA Assistant Commissioner, Customs
Danso Meshach Kwame GRA Sector Commander, ToR
Sulemana Seidu GRA Risk Management Unit, Customs

241
Name Organisation Position Telephone Email
Francis Essel-Okyeahene GRA Domestic Tax Revenue Department
Joseph Oduro Yeboah GRA Assistant Commissioner, Statistics
Eric Ntiamoah Pinamang GRA
Alex Ntow GRA Chief Revenue Officer
Charles Addae GRA Deputy Commissioner, Research, M&E
Charles Addae GRA Assistant Commissioner, M&E
John Yaw Buabeng GRA Chief Revenue Officer - Debt Recovery +233-24-4637785 [email protected]
Dr Dela Heloo GRA Assistant Commissioner, Debt Management +233-24-4806689 [email protected]
Parliament
Mohammed H. Nyagsi Parliament Director, Research +233-24-4660083 [email protected]
Public Procurement Authority
Eric Appiah PPA Director, Compliance M&E +233-27-7597172 [email protected]
Thomas Bondzi PPA Head, IT +233-27-4860421 [email protected]
Joseph Kuruk PPA POO, CM&E +233-24-4376569 [email protected]
Lesley Dodoo PPA Director, Legal +233-20-3006267 [email protected]
Ghana Audit Service
Daniel Yaw Domelevo GAS Auditor General +233-24-4215511 [email protected]
J. Akuamuah GAS Deputy AG +233-24-4654962 [email protected]
George Winful GAS Deputy AG, Central Govt Accounts +233-24-4687494 [email protected]
Roberta A. Appiah GAS Deputy AG, FAHRD +233-27-7427794 [email protected]
Blessed Baffour-Atta GAS Deputy AG, EIDA +233-24-4251949 [email protected]
Benjamin Codjoe GAS Deputy AG, PSAD +233-26-8190600 [email protected]
Samuel Amofa GAS Assistant Auditor General +233-24-6173879 [email protected]
Nii Odartey Lamptey GAS Director +233-24-4725192 [email protected]
Gabriel Azaglo GAS Senior Auditor +233-24-6247822 [email protected]
Internal Audit Agency
Ransford Agyei IAA Acting Director General +233-20-8199069 [email protected]
Benjamin Adjetey IAA Director, Technical , M&E +233-24-3802543 [email protected]
Ministry of Local Government & Rural Development
Alhassan Amidu MLGRD Head, Inspectorate Division +233-24-3264358 [email protected]
David Annan-Bonny MLGRD +233-54-7655964 [email protected]
Felix Owusu Ampadu MLGRD +233-20-8119541 [email protected]
Kwame Opoku Ampnmah MLGRD +233-54-9431512
Freda Faah MLGRD +233-24-4848869 [email protected]
Yvonne Bayitse MLGRD +233-20-8638161 yvobah@gmailcom

242
Name Organisation Position Telephone Email
Abdallah Osman MLGRD +233-26-9098318 [email protected]
Nuhu Amadu MLGRD +233-24-4215767 [email protected]
Emelia Salamatu Timbillah MLGRD +233-24-4313609 [email protected]
Eshun Ofsiwa MLGRD +233-20-8142130 [email protected]
Kassim Rabbi Bakari MLGRD +233-24-4573163 [email protected]
Ministry of Energy & GNPC
Joseph Ben Okai MoEn Coordinator, Project Management +233-24-4089403 [email protected]
Albert Forson MoEn Engineer +233-20-7640636 [email protected]
Yaw Mpare GNPC CSNB +233-24-4262240 [email protected]
Albert Fynn-Aiduanu GNPC Corporate Finance +233-26-8925391 [email protected]
Albert Akomah GNPC CSNB +233-54-5464639 [email protected]
Ministry of Food & Agriculture
Francis Agbemafo MoFA Head, Internal Audit Unit +233-50-1408016
Ebenezer Acheampong MoFA Head, Procurement Unit +233-20-2026941 [email protected]
Diana Kissiwa MoFA Finance Director +233-24-4254232 [email protected]
Dan Oheneng-Boateng MoFA Director, Budget +233-24-4211007 [email protected]
Nuhu Ibrahim MoFA Deputy Director, Budget +233-24-4788920 [email protected]
Philip Osei-Nkrumah MoFA Agric Officer +233-24-3887533 [email protected]
Esther Nuotuo MoFA Deputy Director +233-24-3644067 [email protected]
Ministry of Education / Ghana Education Service / GETFund
Enoch H. Cobbinah MoE Chief Director +233-20-2030286 [email protected]
Daniel Adonu MoE Head, Internal Audit +233-20-3002307 [email protected]
Eugene A. Agyekum MoE Chief Accountant +233-24-4891753 [email protected]
Isaac N. Biney MoE Director, Budget +233-24-4484518 [email protected]
Alexis GETFund +233-20-2016477
Public Service Commission
Bridet Jubilee Katsriku PSC Chairperson +233-27-1733159 [email protected]
Edmund Macheli PSC Consultant +233-57-3302204 [email protected]
Ministry of Roads & Highways / Ghana Road Fund
Ing Edmund Offei-Annor MoR&H Director, Policy & Planning +233-24-4892446 [email protected]
George Addison MoR&H Principal Engineer +233-20-8149535 [email protected]
Richard Gyambiby GHA Budget Manager +233-24-4655879 [email protected]
Emmanuel Kumodzi GHA Budget Officer [email protected]
Kwabena Afrifa DFR Assistant Engineer +233-50-9021824 [email protected]
Christina Dei Sakybea DUR Chief Accountant [email protected]

243
Name Organisation Position Telephone Email
Owusu K. Ansah KTC Administrator
Stephen Nyakah KTC Accountant
Peter Yawson DFR Chief Engineer
Afetsi Avege DUR Head, HR
B. A. Sowah DUR Deputy Director, Finance & Admin +233-24-3248247 [email protected]
Francis Ahlidza Road Fund Coordinator [email protected]
Sulemana Abdul Bary MR&H Accountant [email protected]
Cynthia Abbey MR&H Director, Finance [email protected]
Micheal Esuon MR&H Assistant Director [email protected]
M.B. Alhassan MR&H Director
Patience Okwesie-Arthur MR&H Principal Accountant
Kuadey Selase MR&H Internal Auditor +233-24-2181401 [email protected]
Salifu Hardi DFR Assistant Planning Officer
Wilhemina Fleischer MR&H Chief Personnel Officer
Frank Nadzinja MR&H Assistant Planning Officer
Ministry of Health / Ghana Health Service / National Health Insurance Authority
Hamidu Adakurugu MoH Director, Finance & Administration +233-24-4688558 [email protected]
Robert Cudjoe MoH PRD +233-24-9959605
Daniel Degbotse MoH Head, M&E +233-27-5718809 [email protected]
Dr. Maureen Martey MoH Head, Private Sector Unit +233-24-4369807 [email protected]
Edward Bright Agyekum MoH Head, Procurement Unit +233-24-4691005 [email protected]
Sam Boakye MoH Accountant +233-20-9223583
Kwakye Konta MoH PPME +233-20-8240265 [email protected]
Walter Kwao-Anati MoH Director, HR +233-20-8187238 [email protected]
Dela Kemevor MoH Deputy Director, Finance & Admin +233-24-4870726 [email protected]
Mary Ninsu MoH Deputy Financial Controller +233-24-4238929 [email protected]
State Enterprises Commission
Stephen Asamoah Boateng SEC Executive Chairman +233-24-9722222 Asabeesecghana.gov.gh
Justice Newton-Offei SEC Presidential Executive Assistant +233-24-4845032 [email protected]
John SEC Consultant +233-24-4232482 [email protected]
Joojo Ghansah SEC Executive Director +233-24-2001199 [email protected]
John Kwesi Mensah SEC Ag Executive (PME) +233-20-8127272 [email protected]
National Development Planning Commission
Grace Bediako NDPC Ag Director General +233-20-8228383 [email protected]

244
Name Organisation Position Telephone Email
Kenneth Owusu NDPC Senior Policy Analyst & TA to DG +233-20-8222311 [email protected]
Isaac Mensah-Bonsu NDPC Director, PCD +233-20-8171556 [email protected]
Vera Baffoe NDPC Planning Analyst +233-24-3028581 [email protected]
Isaac Asiamah NDPC Head, Admin +233-27-7455498 [email protected]
Peter Owusu-Afriyie NDPC Head, Accounts +233-27-2097381 [email protected]
Kofi Apenteng NDPC Internal Auditor +233-23-3333010 [email protected]
Bank of Ghana
Kwaku A. Forkuo BoG Head, Public Finance +233-24-4239815 [email protected]
Ivy Acquaye BoG Head, Monitory Policy Division +233-24-4366476 [email protected]
Gabriel Bokor BoG Head, Banking +233-20-8162933 [email protected]
Samuel Anin BoG +233-54-9581303 [email protected]
Kwadwo Amponsah BoG +233-20-8932779 [email protected]
Richard Assan BoG +233-20-2427475 [email protected]
Development Partners
Donald H. Mphande WB Lead Financial Management Specialist +233-50-4316075 [email protected]
Harriet Donkoh GIZ Budget Advisor +233-24-9950443 [email protected]
Verena Wiesner German Embassy Head of Cooperation +233-20-1503018 [email protected]
Stuart Lane Canada Embassy Deputy Director +233-24-4326053 [email protected]
Robert Hanson WB Senior Financial Management Specialist +233-27-7500088 [email protected]
Philip Doghle AfDB Financial Management Specialist +233-20-2097266 [email protected]
Kweku Obeng GIZ Component Manager, PFM +233-24-4073012 [email protected]
Naresh M. Jha IMF/AFRITAC PFM Advisor +233-20-7747592 [email protected]
John Grinder IMF/AFRITAC PFM Advisor [email protected]
Delphine Aupicon EUD Program Officer +233-54-0108491 [email protected]
Hamza Bukari SECO NPO +233-55-4264090 [email protected]
Ama Blankson-Anaman DFID Economic Advisor +233-24-3349126 [email protected]
Civil Society Organisations
Linda Ofori-Kwafo GII Executive Director +233-24-4643886 [email protected]
Michael K. Boadi GII Corporate Affairs Manager +233-24-4286836 [email protected]
Benedict Doh GII Finance Manager +233-24-9889339 [email protected]
John Defor AGI Deputy Director, Policy +233-24-3645088 [email protected]
Theophilus Arthur-Mensah AGI Policy Research Officer +233-24-3765862 [email protected]

245
ANNEX 9: Related recent PFM analysis
Type Sponsor Date of Report
1. Public Investment Management Assessment (PIMA) IMF March 2016
2. TADAT Performance Assessment Report IMF July 2017
3. Auditor General’s Report on MDAs Liability, for FY 2015 Ghana Audit Service January 2018
4. Extended Crefit Facility (ECF) – 5th and 6th Review Report IMF May 2018

246
ANNEX 10: PIs 1-2 EXPENDITURE DATA (2011 Framework)
Data for year = 2014
administrative head budget actual adjusted budget deviation absolute deviation percent
001 - Office of Government Machinery (OGM) 329,508,729 331,226,549 403,132,779.1 -71,906,229.8 71,906,229.8 17.8%
003 - Parliament of Ghana 208,365,215 165,213,916 254,921,465.8 -89,707,549.7 89,707,549.7 35.2%
005 - Audit Service(AS) 119,115,792 108,404,825 145,730,525.6 -37,325,700.8 37,325,700.8 25.6%
006 - Public Services Commission 3,483,805 2,955,916 4,262,211.8 -1,306,295.3 1,306,295.3 30.6%
008 - Electoral Commission 139,477,234 138,224,289 170,641,442.9 -32,417,153.5 32,417,153.5 19.0%
009 - Ministry of Foreign Affairs and Regional Integration 141,217,551 141,016,079 172,770,609.0 -31,754,530.5 31,754,530.5 18.4%
010 - Ministry of Finance (MoF) 725,303,369 888,682,404 887,362,115.5 1,320,288.2 1,320,288.2 0.1%
011 - Ministry of Local Govt and Rural Development 82,833,752 427,781,554 101,341,778.6 326,439,775.5 326,439,775.5 322.1%
031 - Ministry of Information and Media Relations 62,385,693 53,079,345 76,324,890.9 -23,245,546.0 23,245,546.0 30.5%
012 - Ministry of Food and Agriculture (MOFA) 73,768,336 57,579,687 90,250,824.0 -32,671,136.5 32,671,136.5 36.2%
013 - Ministry of Lands and Natural Resources 77,074,420 102,251,579 94,295,605.5 7,955,973.3 7,955,973.3 8.4%
017 - Ministry of Environment Science, Technology and Innovation (MESTI)
162,015,714 156,512,790 198,215,826.5 -41,703,036.0 41,703,036.0 21.0%
023 - Ministry of Education (MOE) 4,560,827,381 5,246,348,295 5,579,879,546.0 -333,531,251.3 333,531,251.3 6.0%
022 - Ministry of Roads and Highways (MoRH) 79,889,295 240,400,805 97,739,424.4 142,661,380.1 142,661,380.1 146.0%
029 - Ministry of Health (MoH) 1,208,823,014 1,598,288,841 1,478,917,364.6 119,371,476.5 119,371,476.5 8.1%
034 - Ministry of Defence (MoD) 531,615,816 758,284,828 650,397,827.0 107,887,000.8 107,887,000.8 16.6%
036 - Judicial Service (JS) 184,911,744 105,050,218 226,227,649.5 -121,177,431.3 121,177,431.3 53.6%
037 - Ministry of The Interior (MINT) 963,777,060 1,101,306,782 1,179,119,369.1 -77,812,587.1 77,812,587.1 6.6%
033 - Office of the Attorney General and Ministry of Justice 56,570,545 44,173,413 69,210,430.6 -25,037,017.8 25,037,017.8 36.2%
021 - Ministry of Works and Housing 89,718,844 260,848,399 109,765,246.7 151,083,151.9 151,083,151.9 137.6%
21 (= sum of rest) 415,488,556 571,199,998 508,323,578.5 62,876,419.5 62,876,419.5 12.4%
allocated expenditure 10,216,171,865 12,498,830,512 12,498,830,511.7 0.0 1,839,190,931.3
Interests 0 0
Grants -1,130,723,000 -904,203,762
Contingency 76,508,343 0
total expenditure 9,161,957,208 11,594,626,750
aggregate outturn (PI-1) 126.6%
composition (PI-2) variance 14.7%
contingency share of budget 0.0%

247
Data for year = 2015
administrative head budget actual adjusted budget deviation absolute deviation percent
001 - Office of Government Machinery (OGM) 285,545,287 460,389,600 393,673,935.5 66,715,664.7 66,715,664.7 16.95%
003 - Parliament of Ghana 184,180,572 157,074,231 253,925,012.7 -96,850,781.8 96,850,781.8 38.14%
005 - Audit Service(AS) 125,527,610 117,339,489 173,061,684.0 -55,722,194.7 55,722,194.7 32.20%
006 - Public Services Commission 3,656,582 9,273,446 5,041,235.5 4,232,210.9 4,232,210.9 83.95%
008 - Electoral Commission 31,976,919 215,097,057 44,085,754.9 171,011,301.9 171,011,301.9 387.91%
009 - Ministry of Foreign Affairs and Regional Integration 210,696,969 183,891,195 290,482,486.5 -106,591,291.0 106,591,291.0 36.69%
010 - Ministry of Finance (MoF) 628,273,859 980,215,820 866,184,993.7 114,030,826.3 114,030,826.3 13.16%
011 - Ministry of Local Govt and Rural Development 47,721,743 489,417,723 65,792,738.4 423,624,984.2 423,624,984.2 643.88%
026 - Ministry of Communication 68,199,696 66,747,969 94,025,165.0 -27,277,196.2 27,277,196.2 29.01%
012 - Ministry of Food and Agriculture (MOFA) 59,630,081 97,585,346 82,210,457.4 15,374,888.3 15,374,888.3 18.70%
013 - Ministry of Lands and Natural Resources 93,959,587 134,837,117 129,539,663.5 5,297,453.9 5,297,453.9 4.09%
017 - Ministry of Environment Science, Technology and Innovation (MESTI)
146,900,650 172,456,632 202,528,144.0 -30,071,511.8 30,071,511.8 14.85%
023 - Ministry of Education (MOE) 4,943,782,587 5,670,909,266 6,815,865,768.8 -1,144,956,502.4 1,144,956,502.4 16.80%
022 - Ministry of Roads and Highways (MoRH) 28,754,370 426,577,410 39,642,909.6 386,934,500.1 386,934,500.1 976.05%
029 - Ministry of Health (MoH) 1,308,131,802 2,220,439,714 1,803,487,635.9 416,952,077.8 416,952,077.8 23.12%
034 - Ministry of Defence (MoD) 667,010,250 707,146,307 919,589,858.7 -212,443,551.9 212,443,551.9 23.10%
036 - Judicial Service (JS) 193,090,718 139,338,883 266,209,201.5 -126,870,318.7 126,870,318.7 47.66%
037 - Ministry of The Interior (MINT) 1,135,118,927 1,393,012,459 1,564,959,239.6 -171,946,780.3 171,946,780.3 10.99%
033 - Office of the Attorney General and Ministry of Justice 62,574,987 64,902,432 86,270,523.5 -21,368,091.8 21,368,091.8 24.77%
021 - Ministry of Works and Housing 11,321,834 114,285,551 15,609,121.0 98,676,429.6 98,676,429.6 632.17%
21 (= sum of rest) 278,799,485 675,621,555 384,373,671.9 291,247,883.1 291,247,883.1 75.77%
allocated expenditure 10,514,854,515 14,496,559,202 14,496,559,201.6 0.0 3,988,196,441.2
Interests 0 0
Grants -1,550,774,000 -2,785,271,000
Contingency 84,371,351 0
total expenditure 9,048,451,866 11,711,288,202
aggregate outturn (PI-1) 129.4%
composition (PI-2) variance 27.5%
contingency share of budget 0.0%

248
Data for year = 2016
administrative head budget actual adjusted budget deviation absolute deviation percent
001 - Office of Government Machinery (OGM) 578,848,157 594,359,602 844,436,417.0 -250,076,815.1 250,076,815.1 29.61%
003 - Parliament of Ghana 255,865,717 244,217,583 373,262,533.0 -129,044,950.1 129,044,950.1 34.57%
005 - Audit Service(AS) 140,611,756 134,385,843 205,127,520.9 -70,741,677.7 70,741,677.7 34.49%
006 - Public Services Commission 2,234,389 2,025,486 3,259,575.8 -1,234,090.2 1,234,090.2 37.86%
008 - Electoral Commission 822,897,500 884,918,230 1,200,460,963.8 -315,542,734.1 315,542,734.1 26.29%
009 - Ministry of Foreign Affairs and Regional Integration 234,085,339 221,639,594 341,488,838.7 -119,849,244.8 119,849,244.8 35.10%
010 - Ministry of Finance (MoF) 205,658,746 541,681,771 300,019,499.9 241,662,271.1 241,662,271.1 80.55%
011 - Ministry of Local Govt and Rural Development 23,707,785 194,903,815 34,585,438.0 160,318,376.8 160,318,376.8 463.54%
021 - Ministry of Water Resources, Works and Housing 14,136,179 111,273,512 20,622,168.7 90,651,343.5 90,651,343.5 439.58%
012 - Ministry of Food and Agriculture (MOFA) 59,776,323 227,238,482 87,203,014.1 140,035,467.9 140,035,467.9 160.59%
013 - Ministry of Lands and Natural Resources 102,479,461 185,086,762 149,499,290.6 35,587,471.4 35,587,471.4 23.80%
017 - Ministry of Environment Science, Technology and Innovation (MESTI)
167,642,050 157,087,527 244,559,908.0 -87,472,380.6 87,472,380.6 35.77%
023 - Ministry of Education (MOE) 4,862,412,944 6,231,381,621 7,093,394,899.2 -862,013,278.0 862,013,278.0 12.15%
022 - Ministry of Roads and Highways (MoRH) 33,975,503 1,124,012,458 49,564,210.7 1,074,448,247.7 1,074,448,247.7 2167.79%
029 - Ministry of Health (MoH) 1,613,366,584 2,141,789,637 2,353,614,641.4 -211,825,004.0 211,825,004.0 9.00%
034 - Ministry of Defence (MoD) 624,328,113 879,033,917 910,783,576.6 -31,749,659.1 31749659.13 3.49%
036 - Judicial Service (JS) 188,500,668 132,892,822 274,988,918.5 -142,096,096.3 142096096.3 51.67%
037 - Ministry of The Interior (MINT) 1,316,160,582 1,978,238,286 1,920,043,991.8 58,194,294.2 58194294.22 3.03%
019 - Ministry of Fisheries and Aquaculture Development 6,725,269 7,489,398 9,810,970.3 -2,321,572.1 2321572.127 23.66%
015 - Ministry of Trade and Industry (MoTI) 30,142,909 46,332,862 43,973,138.3 2,359,723.2 2,359,723.2 5.37%
21 (= sum of rest) 973,592,945 1,841,009,098 1,420,298,791.9 420,710,306.1 420,710,306.1 29.62%
allocated expenditure 12,257,148,919 17,880,998,307 17,880,998,307.2 0.0 4,447,935,004.1
Interests 0 0
Grants -1,607,865,766 -1,618,809,950
Contingency 78,063,445 0
total expenditure 12,335,212,364 17,880,998,307
aggregate outturn (PI-1) 145.0%
composition (PI-2) variance 24.9%
contingency share of budget 0.0%

249