Embed Size (px)
Citation preview
Government and Social Media:
A Case Study of 31 Informational World Cities
Agnes Mainka Sarah Hartmann Wolfgang G. Stock Isabella Peters
Heinrich Heine
University Düsseldorf
Heinrich Heine
University Düsseldorf
Heinrich Heine
University Düsseldorf
Heinrich Heine
University Düsseldorf
Abstract Social media platforms are increasingly being used by
governments to foster user interaction. Particularly in
cities with enhanced ICT infrastructures (i.e.,
Informational World Cities) and high internet
penetration rates, social media platforms are valuable
tools for reaching high numbers of citizens. This
empirical investigation of 31 Informational World
Cities will provide an overview of social media
services used for governmental purposes, of their
popularity among governments, and of their usage
intensity in broadcasting information online.
1. Introduction
Enhanced ICT infrastructures and the increasing
use of technology have reshaped communication. In
2013, YouTube and Facebook reached over one billion
active users [1, 2]. These and other social media
platforms have become popular in citizens’ everyday
lives, and municipalities, too, will use these channels in
order to get in touch with citizens online. ICT
infrastructure and high internet penetration are
important preconditions for guaranteeing that a large
amount of citizens is able to make use of those
communication channels and of the internet in general.
Both these factors can be found in Informational
World Cities [3, 4], meaning prototypical cities of the
knowledge society (such as Singapore, New York, or
Hong Kong). Informational Cities consist of two
spaces: the space of places and the space of flows. The
space of places (i.e., buildings, streets) is dominated by
the space of flows (flows of money, power, and
information). Those cities are metropolises of the 21st
century. Following Manuel Castells’ notion on
“Informational Cities” [5], we use the concept of
“Informational World Cities” [6]. A “World City” is
defined by its degree of “cityness” [7, 8, 9], where a
large population does not necessarily constitute an
Informational World City. But infrastructures such as
those in a digital city [10], ubiquitous city [11], smart
city [12, 13], knowledge city [14], or creative city [15,
16] should be a given. These frameworks guarantee
that a city meets the needs of the space of flows-
dominated knowledge society.
Our analysis of 126 references revealed that this
literature set contained advice for 31 cities with typical
properties of Informational World Cities [6].
Strikingly, those cities are also global centers
distributed all over the world (Figure 1). Our empirical
investigation of indicators for Informational World
Cities showed that the maturity of eGovernment is one
crucial aspect worth intensive exploration.
In the literature, a distinction is made between the
terms eGovernance, eGovernment, and Government
2.0. eGovernance is used as a generic term for
planning, innovation, and funding at the city level [17].
According to Yigitcanlar, eGovernance is the
fundamental basis for innovation in an Informational
World City [18]. It comprises important properties of a
city, such as the improvement of living standards and
the increase of economic growth through better
cooperation between authorities and citizens as well as
businesses. The increasing usage of ICT allows
businesses and citizens to engage in political debates
and decision-making processes online [17, 19, 20].
Five interaction levels are specified by Moon to
describe the function of eGovernment [21]:
information, communication, transaction, integration,
and participation. The second stage, “communication,”
has been evolving from face-to-face conversation in
the office and “snail mail” correspondence to real-time
conversations on social media platforms such as
Facebook or Twitter [22, 23]. The fifth stage,
“participation,” describes an ideological notion. At this
stage citizens are provided, and seize, the opportunity
of engaging in political decision-making processes.
The increasing governmental usage of the web is
referred to as Government 2.0 [24, 25]. The term
“Government 2.0” is not to be equated with “Web 2.0”
[26], which was coined regarding emergent services of
social media. Government 2.0, on the other hand, is
used in conjunction with “a more open, social,
communicative, interactive and user-centered version
of e-government” [27]. Online interaction with

citizens on governmental homepages or on social
media platforms should be citizen-centered [25].
Citizens should be seen as customers whose demands
need to be satisfied. Theoretical benefits of this
technology include cost reductions, enhanced
participation, transparency, and enhanced trust [28,
29]. Most analyses of governmental social media usage
are generally performed in a more in-depth fashion,
e.g. investigating communication on specific platforms
and concerning specific topics [33, 34].
A study of Münchener Kreis [35] evaluated the
needs of citizens in interacting with governments and
administrations. This study was conducted in 2012 and
2013 and represents internet users between the ages of
18 and 70 and living in Germany, the U.S.A., Brazil,
China, India, and South Korea. As shown in Table 1,
more than 40 % of users in Brazil, China, and India
would like to use electronic services for citizens via
social media platforms. Furthermore, citizens are
interested in being involved in political decision-
making processes such as policy debates. However,
users in all these nations have less confidence in these
platforms when it comes to the protection of their
personal data. This study shows that there is an
audience on the world wide web who would like to use
social media to get in touch with governments and
administrations. Accordingly, it is advisable for
governments to be represented on social media
platforms if they want to reach as many of their
citizens as possible.
The free market was an early adopter of social
media platforms as marketing tools [30]. Governments
have inherited this strategy, but social media platforms
do not run themselves and being present on them does
not necessarily entail eParticipation [31]. First, a
strategy is needed. There are two main challenges: 1.
every social media account must be continuously
updated, and 2. every government must find the most
profitable way of reaching its citizens [32].
When analyzing eGovernment in Informational
World Cities with regard to the indicators
“communication” and “participation,” it must first be
proven whether and which communication platforms
(e.g., social media) are used by governments, whether
government accounts are visible on the web, whether
they are used frequently, and whether they reach a
large audience. Hence, this research considers a wide
range of social media platforms that are examined in
light of the following four research questions:
Figure 1. Informational world cities and the URLs of their official websites.

(1) Which social media services are used by
governments and when did they first open up their
account?
(2) Are these social media accounts interconnected
with other social media platforms and
governmental web presences?
(3) Do governments frequently publish social media
content?
(4) Do social media users show an interest in
government accounts on social media platforms
by liking or following them?
Table 1. Citizens’ opinions on interacting with
governments and administrations on social media platforms [35].
Germany U.S.A. Brazil China India S.Korea
I would like to use electronic services for citizens on
Facebook and other social media platforms.
14 % 22 % 41 % 41 % 42 % 31 %
I would like to be involved in policy decisions on
Facebook and other social media platforms.
24 % 19 % 40 % 37 % 39 % 18 %
I trust that my personal data will be handled
responsibly on social media platforms.
9 % 16 % 17 % 21 % 37 % 14 %
2. Method
We started our study by investigating the 31
governmental websites listed in Figure 1. First they
were checked for any links to official social media
accounts representing the government of a city. The
platforms thus identified were then browsed in order to
check whether any governmental accounts of the 31
cities had not been referenced by an official website.
Moreover, we looked at backlinks from all identified
accounts to their official website in order to prove the
services’ government affiliation. In general, one can
find two groups of accounts referenced by government
websites: The first group consists of official
government accounts or blogs for general purposes that
refer to the city’s government as a whole (e.g., the
Facebook account “City Of New York”). The second
group comprises accounts from governmental
institutions, departments, or political persons (e.g., the
account of the city’s mayor or other politicians). This
investigation focused on the first group of accounts
because they seemed to be more sustainable, better
maintained over time, and independent of a particular
political party, mayor, or politician during any given
legislative period.
To evaluate the governments’ activity in social
media, every account was either manually checked or
accessed via provided APIs in order to collect available
information concerning the accounts, the quantity of
published content online, and the reactions of users, i.e.
account creation date, date of first post or other
activity, quantity of posts, tweets, photos, videos, pins,
and comments, as well as followers and likes. Some
social media platforms also allow for a stronger
interaction with users, e.g. via comments on Facebook
pages or retweets of governments’ tweets. Since our
study aimed at learning how often governments make
use of which kind of social media, a deeper analysis of
user interaction has been left for future research.
Because of their vast deviations in website structure
and graphic characters, the Chinese websites were
analyzed with the assistance of a Chinese native
speaker in order to be able to reliably identify any
referenced Chinese social networks. For the
examination of other government websites we used the
English or German version if available, or translated
the website via Google Translate. The research was
conducted between November 28, 2012 and January 3,
2013 and relies on the data which was available online
at that time.
3. Results
In this section we present the results of our analysis
as guided by the aforementioned research questions.
3.1. Governmental accounts on social media
platforms
The 31 cities make use of a variety of social media
services: they use social networking platforms like
Facebook, Google+, and Hyves (a Dutch service); the
business social networks LinkedIn and Xing (a German
service); the location-based social network Foursquare;
the microblogging services Twitter, Sina Weibo, the
video platforms YouTube, Vimeo, Livestream, and
Ustream; the photo-sharing applications Flickr and
Instagram; and content-sharing services like Pinterest,
Storify, Tumblr, and blogs. The total numbers of
general government accounts for each social media
service found on the websites are: 24 on Twitter, 21 on
YouTube, 20 on Facebook, 11 accounts on Google+
and LinkedIn, ten on Instagram, seven on blogs and on
Flickr, six on Pinterest, four on Foursquare and Vimeo,
two on Weibo and Xing and, finally, one each on
Livestream, Ustream and Tumblr. Inactive accounts
(e.g., registered accounts without any posts, photos,
videos etc.) were included in our analysis. Storify and
Hyves have not been considered, because none of them
were used by governments for general purposes. New
York’s blog on Tumblr is counted among blogs since it
serves the same purposes.
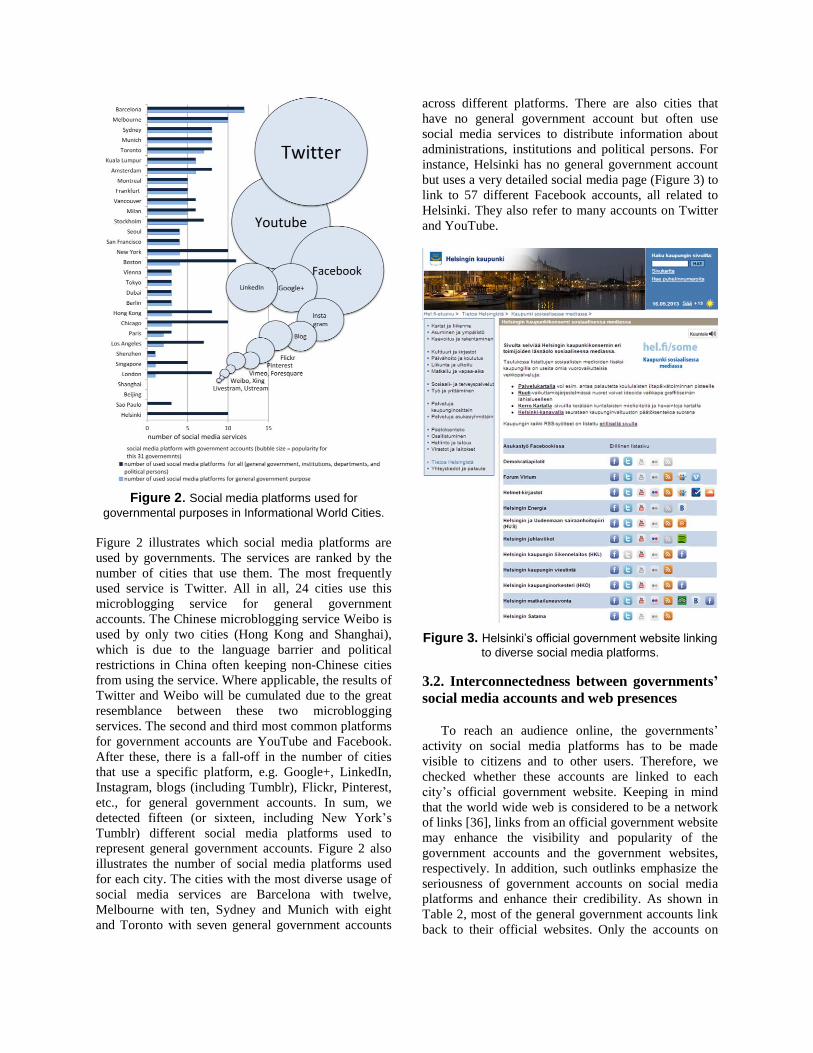
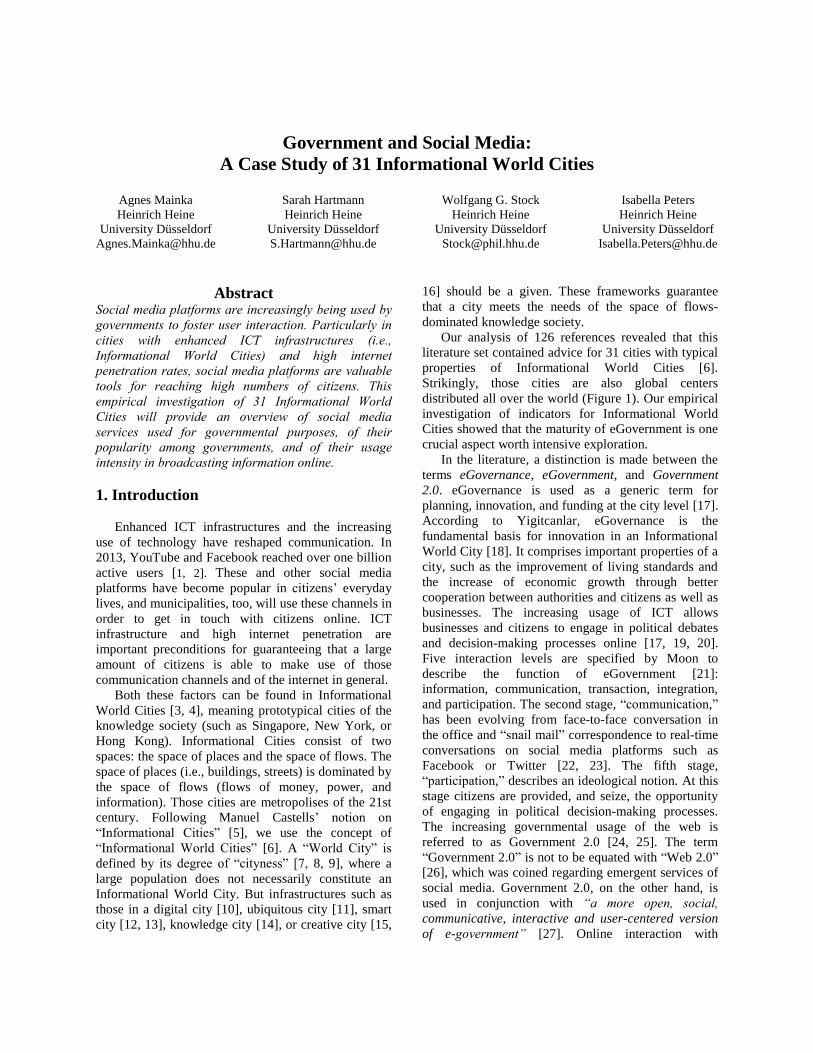
Figure 2. Social media platforms used for
governmental purposes in Informational World Cities.
Figure 2 illustrates which social media platforms are
used by governments. The services are ranked by the
number of cities that use them. The most frequently
used service is Twitter. All in all, 24 cities use this
microblogging service for general government
accounts. The Chinese microblogging service Weibo is
used by only two cities (Hong Kong and Shanghai),
which is due to the language barrier and political
restrictions in China often keeping non-Chinese cities
from using the service. Where applicable, the results of
Twitter and Weibo will be cumulated due to the great
resemblance between these two microblogging
services. The second and third most common platforms
for government accounts are YouTube and Facebook.
After these, there is a fall-off in the number of cities
that use a specific platform, e.g. Google+, LinkedIn,
Instagram, blogs (including Tumblr), Flickr, Pinterest,
etc., for general government accounts. In sum, we
detected fifteen (or sixteen, including New York’s
Tumblr) different social media platforms used to
represent general government accounts. Figure 2 also
illustrates the number of social media platforms used
for each city. The cities with the most diverse usage of
social media services are Barcelona with twelve,
Melbourne with ten, Sydney and Munich with eight
and Toronto with seven general government accounts
across different platforms. There are also cities that
have no general government account but often use
social media services to distribute information about
administrations, institutions and political persons. For
instance, Helsinki has no general government account
but uses a very detailed social media page (Figure 3) to
link to 57 different Facebook accounts, all related to
Helsinki. They also refer to many accounts on Twitter
and YouTube.
Figure 3. Helsinki’s official government website linking
to diverse social media platforms.
3.2. Interconnectedness between governments’
social media accounts and web presences
To reach an audience online, the governments’
activity on social media platforms has to be made
visible to citizens and to other users. Therefore, we
checked whether these accounts are linked to each
city’s official government website. Keeping in mind
that the world wide web is considered to be a network
of links [36], links from an official government website
may enhance the visibility and popularity of the
government accounts and the government websites,
respectively. In addition, such outlinks emphasize the
seriousness of government accounts on social media
platforms and enhance their credibility. As shown in
Table 2, most of the general government accounts link
back to their official websites. Only the accounts on

Instagram, Vimeo and Ustream show few or no
backlinks to their governmental parent sites.
Additionally, most of these accounts on Instagram and
Vimeo are inactive. It might be assumed that inactive
accounts without backlinks are not official government
accounts. A strong interconnectedness between the
websites and social media accounts verifies, to a
certain degree, the accounts’ authenticity. However, a
lack of backlinks to governmental websites on or
inlinks from government websites to active accounts
does not imply fraud, since official government
accounts can also be verified via government-specific
labels, designs or content. In any case, we identified
inactive accounts with inlinks from governmental
websites and were able to authenticate them. Accounts
without any activity and links (inlinks and backlinks)
could not be reliably verified as official government
accounts but are considered in our data analysis.
Table 2. Interconnectedness between government
websites and social media platforms.
Social
media
platform
Outlinks from city’s
government website:
Number of cities
Backlinks to city’s
government website:
Number of cities
Twitter 24 23
YouTube 21 21
Facebook 20 18
LinkedIn 11 10
Google+ 11 10
Instagram 10 5
Flickr 7 5
Pinterest 6 6
Foursquare 4 4
Vimeo 3 0
Xing 2 2
Weibo 2 2
Ustream 1 0
Livestream 1 1
Another way of drawing users’ attention to the
government’s social media activities is cross-linking
between services. With the exception of Twitter, all
services support the linking from account descriptions
to other services. Table 3 shows the number of cities
that outlink from one of their accounts to another social
media presence and the number of cities that have an
inlink from another used service on their account. We
found out that there are not that many links between
the governments’ social media services, which might
be due to the services’ limited linking options. For
example, 13 cities link from another service to Twitter
but just two of these accounts then established links to
other services, probably because of Twitter’s space
limitations on account descriptions.
Table 3. Interconnectedness between governments’
social media accounts.
Social
media
platform
Outlinks to
government account:
Number of cities
Inlinks from
government account:
Number of cities
Twitter 2 13
Facebook 10 9
YouTube 7 6
Pinterest 6 5
Blogs 4 3
Foursquare 5 3
Google+ 1 3
Flickr 0 3
Livestream 1 2
Instagram 1 2
Ustream 1 1
3.3. Social media activity
The third research question is dedicated to the
activity of government accounts on social media
platforms. This activity was measured via the amount
of posted content on each service. Interactive activities,
such as comments from users and retweets on Twitter,
were not studied here as we focus on the governments’
activity in our evaluation of the extent to which they
use social media and of how much content they
produce overall. The results can then be used as
starting points for further studies examining the
reactions of users and their degree of engagement with
governments’ accounts and content. However, the
amount of posted content depends, for one, on the time
span during which a service has been used and on the
effort that has been made to create certain contents.
Therefore, we calculated the average quantities of
posted content per month, across all cities, for the
following platforms: Twitter, Flickr, blogs, Instagram,
Foursquare, and YouTube. Weibo and Pinterest had to
be excluded since they do not provide account creation
dates.
As shown in Figure 4, the highest rate of activity
was found on Twitter with 135 tweets per month and
per city using Twitter. Flickr, with 39 pictures per
month and city, is also used intensively and is more
popular than Instagram with its five pictures.
Surprisingly, blog posts (22 posts) are also very
popular even though they take longer to produce than

Figure 4. Average activity of government accounts on
social media platforms across cities per month.
pictures or tweets. Each month the 31 government
accounts produce five tips on Foursquare and five
videos on YouTube. The latter is often used to
broadcast local events, news, and reports. On
Foursquare, the number of references to other locations
or short posts was shown.
Figure 5 displays the amount of monthly published
content on each social media platform for each city.
The results show that there is a significant difference
between the governments. Beijing, Shanghai, Helsinki
and Sao Paulo contribute no content at all, and are thus
excluded from our analysis. In contrast, the
government accounts of Berlin, Seoul, and Barcelona
publish more than 500 posts per month. However,
Berlin only publishes content on Twitter (563 tweets
per month) whereas Seoul’s strategy is focused on the
two platforms Twitter and blogs, with nearly 500
tweets per month and 40 blog posts. Barcelona is one
of the few cities using more than three services and is
very active on Twitter (more than 300 tweets per
month), Flickr (70 pictures per month), and Instagram
(nearly 30 pictures per month). It is also represented on
YouTube, Foursquare and blogs. Most of the cities use
two services at most. Of crucial importance to our
evaluation of the amount of content published by cities
is their respective period of participation; hence, we
also examined when the governments first started their
activities in social media relative to the average
starting time of all analyzed cities. As illustrated in
Table 4, Sydney was the first city to register any social
media accounts, i.e. official general government
accounts on Flickr and YouTube. Flickr, Twitter, and
YouTube are the longest-used social media services
over any average period of all government accounts.
Stockholm seems to have been active in social media
for a long time as well. It was the first city to run a
blog and a microblog. The first Facebook page was
created by San Francisco in November 2008.
There are long time spans between the launches of
social media services and their factual use by
governments, e.g. Facebook was launched in 2004 but
the average join date for governments was six years
later, in 2010. This may be due to the typically delayed
uptake of social media activities by businesses and
governments. Not before 2009 did social media start to
truly establish themselves in the business world [37]
and in governments, many of which built up a
systematic presence [38]. In contrast, services launched
at a later date, such as Google+, Instagram and
Foursquare, were quickly adopted by governments.
Figure 5. Cities’ government activity on social media
platforms per month.
The same behavior can be shown for Flickr or
YouTube, where the time difference between the first
cities’ join dates and the average join date for all cities
is more than three years. Twitter became a popular
service among most cities almost at the same time as
Flickr and YouTube, although Twitter’s first
government account was registered in August 2008.
Cities have been actively blogging since January 2008,
far earlier than they took up Facebook and Twitter.
Less extensive and more recent usage numbers are
available for Ustream, Google+, Instagram, and
Foursquare. Account creation dates for Weibo,
Livestream, Pinterest, LinkedIn and Xing are missing
because those services do not publicly provide this
information.

3.4. Followers and likes on social media
platforms
Our last research question regards the success of
government accounts on social media platforms, and
will serve to clarify whether government accounts
adequately address social media users. Therefore, all
accounts were examined with regard to their number of
followers, likes, subscribers, etc., which can be
compared to the number of unique visitors on a website
with an additional news subscription. Almost all social
media services provide information about their number
of user subscriptions. Blogs are excluded, since they do
not aim at forming a network of people. Subscriptions
to blogs via RSS-Feeds are possible, but are not made
visible on the blog itself.
As displayed in Figure 6, the platform with the
most user subscriptions is Facebook, with more than
five million likes across cities. On average, there are
about 154,000 likes for each city using Facebook. The
collective number of Twitter and Weibo followers is, at
more than 1.3 million, also very high. The average
value is about 55,000 followers per city using Twitter.
Fewer subscribers are reached on Foursquare, where
the average value is at slightly more than 10,000 likes,
and on LinkedIn and Xing, where an average of 3,400
contacts was calculated. At about 1,300 users in the
circles of government accounts, Google+ has fewer
subscribers. YouTube and Instagram, with about 500,
and Pinterest, with 200 subscribers on average, are of
marginal importance in this area.
Table 4. When did analyzed cities create an account
on social media platforms? Comparison between the earliest and the average join dates of governments.
Social
media
services
First
government
account
online
Governments
average entry
date
Social
media
services'
launch
San Francisco
in 11/2009 09/2010 02/2004
Google+
Melbourne in
11/2011 12/2011 06/2011
Stockholm in
08/2008 11/2009 07/2006
YouTube
Sydney in
10/2006 11/2009 02/2005
Ustream
Seoul in
04/2011 04/2011 03/2007
Flickr
Sydney in
08/2006 11/2009 02/2004
Toronto in
06/2011 01/2012 10/2010
Foursquare
Barcelona in
08/2011 03/2012 03/2009
Blogs
Stockholm in
01/2008 05/2010
Since
1990
Figure 6. Average number of subscribers per city on
social media platforms.
Figure 7. City-wise comparison of governments’
number of subscribers on social media platforms.
Figure 7 presents the summarized numbers of
followers and likes for general government accounts on
social media platforms per city. It is conspicuous that,
at more than two million likes, Paris attracts far more
Facebook likes than any other analyzed city. The
government accounts on Facebook for Munich, San
Francisco, and Frankfurt all reach more than 180,000

likes as well. Although their social media activity is
limited to Weibo, Hong Kong and Shenzhen reach
about 600,000 and 300,000 followers, respectively. In
general, the numbers of followers and likes differ
greatly between the analyzed cities. Some cities, i.e.,
Paris, Hong Kong, Munich, Shenzhen, San Francisco,
Frankfurt, and New York, are very good at collecting
subscribers online. The other cities only have very few
or even minimal numbers of followers.
As has been observed in the case of activity
numbers, users of government social media accounts
concentrate on two or three services at the most when
following or liking cities. Twitter and Facebook are the
most-subscribed services by users, and also the most
used services by governments. Conspicuously,
YouTube, which is the third service with a high
number of government accounts, only has a low
number of subscribers. By contrast, Foursquare is only
used by four cities for general government accounts
but each activates more users than many accounts on
other services do.
4. Discussion
Our analysis of government activities across social
media was conducted for 31 Informational World
Cities. The assumption was that cities which are
important metropolises in the 21st century use social
media services for government-to-citizen interaction.
Our results show that there are strong differences
between the respective popularity of social media
services for each city. The most-used social media
platforms are Twitter, YouTube and Facebook. All in
all, 15 (with Tumblr, 16) different social media
platforms are used by the 31 cities. Twenty-nine cities
use at least one of the social media services; and on
average, four services are used per government.
Weibo is the most popular social network in
Chinese regions [39], providing Twitter-like
functionalities. Hong Kong and Shenzhen reach very
high numbers of followers, placing second and third in
this study in terms of subscribers, respectively. The
two other Chinese cities, Shanghai and Beijing, do not
use any social media services. This could be due to the
access restrictions to globally accessible social media
services imposed by China’s government. In contrast,
Beijing and Shanghai have their own government
microblogs under construction, presumably to exercise
better content control with regard to their political
practices. Hence, the comparability of results between
Chinese cities and the others is not given.
It is remarkable that many cities with government
accounts on social media platforms do not link to them
from their homepage. Some cities, like Helsinki,
subscribe to another information policy and have a
special webpage (Figure 3) where all social media
activities are listed, but some do not link to any
account on Facebook or Twitter from their homepage.
It can probably be assumed that a lack of links from the
government’s homepage to its social media services
hamper citizens’ participation, which results in lower
numbers for followers and likes (except for Hong
Kong). In this study, Twitter is not only the most
popular social media application (in terms of
governments posting content) but also the service with
the highest amount of activity (in terms of users liking
content or following accounts). This is not surprising
as microblogging only takes a few seconds, in contrast
to creating video clips for YouTube, which requires a
greater effort. Therefore, the services’ functionalities
and differences in terms of usage cause different user
behavior and should be kept in mind when comparing
user statistics. Interaction numbers (i.e. comments) on
Facebook were not considered in this analysis because
of the lack of information on Facebook profile pages.
In terms of followers and likes on social media
platforms, Facebook is the most effective service in
terms of animating users to like government profile
pages, compared, for example, to Google+. However,
Google+ is a very young service compared to
Facebook or Instagram. Thus it is not only the
differences within the services that must be considered,
but the services’ periods of activity are equally
important for deciding whether they are appropriate for
government-to-citizen communication.
Whether or not governments do, in fact, reach their
citizens cannot be answered by this study. However, an
attempt to answer this question can be made if we
assume that cities with a high population are more
likely to obtain increased numbers of city-based
Facebook users and likes. In both cases, a strong
positive correlation between both values is to be
expected. We found that the Pearson coefficient
between the number of a city’s inhabitants and the
number of city-based Facebook users is r = +0.87, but
r is -0.22 when correlating the number of city-based
Facebook users with the number of likes. The latter
indicates that it is not necessarily the Facebook users
based in the particular city who are responsible for the
popularity of the Facebook page. Unfortunately, no
other social media services provide the number of
users per city, meaning that the city-wise correlation
cannot be investigated further. When using the
available numbers of a city’s general population and
the number of Facebook likes for government
accounts, the Pearson correlation (two-sided) arrives at
r = -0.26. In contrast, calculations with Twitter
followers (r = +0.42) as well as YouTube subscribers
(r = +0.51) and the number of the city’s inhabitants
show a stronger positive correlation. For the other

services, only a low correlation was found. Due to the
lack of city-specific user data, we used general
population numbers for calculating the correlations
between numbers of likes, followers or subscribers of a
particular account. The results might be misleading,
however, since social media services are available to
every internet user and not only to those based in the
respective city.
To put it in a nutshell, our study showed that no
Informational World City is more prominently active
than all the others. Nevertheless, there are tendencies
for each city to be more or less active in social media
services. In general, more activity engages more users,
but there are a lot of factors that can affect the numbers
of followers and likes, as shown by the follower
numbers of Paris, which outclass all other cities.
However, the cities’ popularity and population size
must also be regarded, e.g., Paris might be more
popular than Helsinki in terms of tourism or events.
5. Conclusion and Future Work
Twitter, YouTube, and Facebook are the social
media services most used by governments. Which
services are most frequently used by users is difficult
to examine due to several reasons. First, there is a lack
of data concerning the services, which is why not all
services could be compared. Second, there are
differences in the services themselves, which results in
divergent user behavior (e.g., concepts of likes and
followers), and third, there are differences in the time
spans of activity, e.g., upcoming services do not have
numbers as high as those of established ones but can
become very popular quickly. Concerning activity,
Twitter is the service with the highest number of posts
by far, and in terms of followers and likes, Facebook
and Twitter are of capital importance [40]. YouTube is
conspicuous in that almost all governments are present
here but their accounts are less often subscribed to by
their users. YouTube did not achieve high numbers for
either activity or subscribers although it is one of the
top three services used by governments in
Informational World Cities. Nevertheless, governments
in Informational World Cities do reach users with their
social media activities, provided they choose the most
appropriate services for their government-to-user
communication. However, only a few services achieve
high numbers of users. Accordingly, we may conclude
that only two or three services are sufficiently capable
of reaching citizens. Furthermore, lower usage
numbers do not have to be due to low user
participation. Presumably, many users watch YouTube
videos without subscribing to the respective YouTube
channel. To summarize, governments should keep an
eye on upcoming services and use those that their
citizens also use. Additionally, cultural differences
must be considered, e.g., Twitter does not work in
Chinese regions.
Another important point for analyzing social media
usage is the content of the actual accounts (e.g., what
type of information is provided by the governments),
the types of posts (e.g., are there text posts only or
videos etc. as well?), and the user-created content (e.g.,
what do users post on government accounts).
Therefore, a more detailed content analysis as well as a
more differentiated analysis of users must be
conducted in the future. Do governments reach the
“real” citizens and do they try to provoke comments
and discussions about future visions of the city? It must
be tracked whether these discussions are officially
considered in the cities’ governance or if social media
services are only used to broadcast news.
Acknowledgment
We thank Paul Becker for checking spelling and
grammar of our text. The work is funded by the
Strategic Research Fund of the HHU Düsseldorf,
Germany (F 2012 279-10).
6. References [1] The Associated Press, “Number of active users at Facebook over the years”, Yahoo!News, May 1, 2013
[2] YouTube, “YouTube hits a billion monthly”, The Official YouTube Blog, March 20, 2013.
[3] W. G. Stock, “Informational cities: Analysis and
construction of cities in the knowledge society”, Journal of
the American Society for Information Science and
Technology, 62(5), 2011, pp. 963-986.
[4] A. Mainka, S. Khveshchanka, and W. G. Stock,
“Dimensions of informational city research”, in Digital Cities
7 – Real World Experiences. International Workshop at C&T 2011, June 30, 2011, Brisbane, Australia.
[5] M. Castells, The Informational City. Information
Technology, Economic Restructuring, and the Urban-
Regional Process, Basil Blackwell, Oxford, UK, Cambridge, MA, 1989.
[6] L. Orszullok, A. Stallmann, A. Mainka, and W. G. Stock,
“Core services of digital and physical libraries in
informational world cities. An empirical investigation”, in
Smart City and Library Service. The Proceedings of the Sixth
Shanghai International Library Forum, Shanghai Scientific
and Technological Literature Publishing House, Shanghai, 2012, pp. 288-301.
[7] J. Friedmann, “Where we stand. A decade of world city
research”, in P. Knox and P. Taylor (Eds.), World Cities in a
World-System. Cambridge University Press, Cambridge, UK, New York, NY, 1995, pp. 21-47.
[8] P. J. Taylor, World City Network. A Global Urban Analysis, Routledge, London, UK, 2004.

[9] S. Sassen, The Global City. New York, London, Tokyo, 2nd
Ed., Princeton Univ. Press, Princeton, NJ, 2001.
[10] T. Yigitcanlar, and H. J. Han, “Urban telecommunic-
ations network. Technology convergence and urban infra-
structure”, in T. Yigitcanlar (Ed.), Sustainable Urban and
Regional Infrastructure Development. Technologies,
Applications and Management, Information Science Reference, Hershey, PA , 2010, pp. 77-90.
[11] J. S. Hwang, “U-city. The next paradigm of urban
development”, in M. Foth (Ed.), Handbook of Research on
Urban Informatics. The Practice and Promise of the Real-
Time City, Information Science Reference, Hershey, PA, 2009, pp. 367-378.
[12] J. M. Shapiro, “Smart cities. Quality of life, product-
ivity, and the growth effects of human capital”, Review of
Economics and Statistics, 88(2), 2006, pp. 324-335.
[13] R. G. Hollands, “Will the real smart city please stand up?”, City, 12(3), 2008, pp. 303-320.
[14] K. Ergazakis, K. Metaxiotis, and J. Psarras, “Towards
knowledge cities: Conceptual analysis and success stories”, Journal of Knowledge Management, 8(5), 2004, pp. 5-15.
[15] C. Landry, The Creative City: A Toolkit for Urban Innovators, Earthscan, London, UK, 2000.
[16] R. L. Florida, Cities and the Creative Class, Routledge, New York, NY, 2005.
[17] S. Sharma, and S. Palvia, “E-government and e-
governance. Definitions/domain framework and status
around the world”, in 5th International Conference on
EGovernance, Foundations of E-Government, New York, NY, 2010, pp. 1–12.
[18] T. Yigitcanlar, “Informational city”, in R. Hutchison
(Ed.), Encyclopedia of Urban Studies, Vol. 1, Sage, New York, NY, 2010, pp. 392-395.
[19] M. Gisler, “Electronic government – mehr als eine Website”, DISP, 144, 2001, pp. 32-38.
[20] K. Sriramesh, and M. Rivera-Sánchez, “E-government
in a corporatist, communitarian society. The case of Singapore”, New Media & Society, 8(5), 2006, pp. 707-730.
[21] M. Moon, “The evolution of e-Government among
municipalities: rhetoric or reality?”, Public Administration
Review, 62(4), 2002, pp. 424-433.
[22] A. Mainka, K. Fietkiewicz, A. Kosior, S. Pyka, and W.
G. Stock, “Maturity and usability of e-government in
informational world cities”, in 13th European Conference on
eGovernment – ECEG 2013, University of Insubria, Como,
Italy, pp. 292-300.
[23] S. Hartmann, A. Mainka, and I. Peters, “Government
activities in social media”, in P. Parycek and N. Edelmann
(Eds.), International Conference for E-Democracy and Open
Government 2013 – CeDEM13, Danube University Krems, Austria, May 22-24, 2013, pp. 173-186.
[24] E. Bonsón, L. Torres, S. Royo, and F. Flores, “Local e-
government 2.0: Social media and corporate transparency in
municipalities”, Government Information Quarterly, 29(2), 2012, pp. 123-132.
[25] W. D. Eggers, Government 2.0: Using Technology to
Improve Education, Cut Red Tape, Reduce Gridlock, and
Enhance Democracy, Rowman & Littlefield, Plymouth, UK, 2005.
[26] T. O'Reilly, What is web 2.0? Design patterns and
business models for the next generation of software. O'Reilly
Media Web 2.0 Conference, 2005.
[27] A. J. Meijer, B.-J. Koops, W. Pieterson, S. Overman,
and S. ten Tije, “Government 2.0: Key challenges to its
realization”, Electronic Journal of e-Government, 10(1), 2012, pp. 59-69.
[28] M. Warkentin, D. Gefen, P. A. Pavlou, and G. M. Rose,
“Encouraging citizen adoption of e-government by building
trust”, Electronic Markets, 12(3), 2002, pp. 157–162.
[29] J. C. Bertot, P. T. Jaeger, and J. M. Grimes, “Using ICTs
to create a culture of transparency: E-government and social
media as openness and anti-corruption tools for societies”,
Government Information Quarterly, 27(3), 2010, pp. 264–
271.
[30] W. G. Mangold, and D. J. Faulds, “Social media: The
new hybrid element of the promotion mix”, Business Horizons, 52(4), 2009, pp. 357-365.
[31] D. Coursey, and D. Norris, “Models of e-government:
Are they correct? An empirical assesment”, In Public Administration Review, 68(3), 2008, pp. 523-536.
[32] United Nations, E-Government Survey 2010. Leveraging
E-Government at a Time of Financial and Economic Crisis,
New York, NY, 2010.
[33] T. Skirbunt, L. Martinez, and D. Meskell, “Government
outreach to the U.S. Spanish-speaking community uses social
media”, in Proceedings of the 10th Annual International
Conference on Digital Government Research: Social
Networks: Making Connections between Citizens, Data and
Government, Digital Government Society of North America, 2009, pp. 16–18.
[34] Q. Zhang, and J. L. Chan, “New development: Fiscal
transparency in China-government policy and the role of
social media”, Public Money & Management, 33(1), 2013,
pp. 71–75.
[35] Münchener Kreis e.V. (Ed.), Innovationsfelder der
digitalen Welt. Bedürfnisse von übermorgen, Zukunftsstudie
Münchener Kreis e.V. Band V, Münchner Kreis e.V., EICT
GmbH, Deutsche Telekom AG, Flughafen München GmbH,
TNS Infratest GmbH, Zweites Deutsches Fernsehen, 2013.
[36] T. Berners-Lee, R. Cailliau, and J.-F. Groff, “The World
Wide Web”, Communications of the ACM, 37(8), 1992, pp. 76-82.
[37] A. M. Kaplan, and M. Haenlein, “Users of the world,
unite! The challenges and opportunities of Social Media”, Business Horizons, 53, 2010, pp. 59-68.
[38] M. Klang, and J. Nolin, “Disciplining social media: An
analysis of social media policies in 26 Swedish municipalities”, First Monday, 18(8), 2011.
[39] P. C. Deans, and J. B. Miles, “A framework for under-
standing social media trends in China”, The 11th
International DSI and APDSI Joint Meeting, Taipei, Taiwan, July 12-16, 2011.
[40] United Nations. E-Government Survey 2012.
E-Government for the People, New York, NY, 2012.


![[40] Hartmann-Sanders 1.800.241](https://img.pdfslide.us/doc/110x75/618f62f6660b103f1b601ec1/40-hartmann-sanders-1800241.jpg)