Embed Size (px)
Citation preview
Goshen Theater Feasibility Study Market Study Report
June, 2012
Goshen Theater Feasibility Study June 15, 2012
Page 2
Table of Contents Summary ................................................................................... 3
Market Assessment and Community Input ............................... 3
Market Analysis .................................................................... 3
Competition ........................................................................... 4
Community Leadership Interest ............................................ 5
Community Survey ............................................................... 6
Potential Users and their Needs ............................................ 7
Comparable Facilities ............................................................... 9
The Paramount Theatre and Visual Arts Center ................... 9
The State Theatre ................................................................ 10
Avalon Theatre .................................................................... 11
Babcock Building ................................................................ 12
Activity Profile........................................................................ 14
Current Activity................................................................... 14
Potential Activity................................................................. 14
Operating Pro Forma............................................................... 16
Notes and Assumptions ....................................................... 16
Summary ............................................................................. 16
Revenue ............................................................................... 17
Expenses .............................................................................. 20
Summary ................................................................................. 22
Appendices .............................................................................. 23
Goshen Theater Feasibility Study June 15, 2012
Page 3
Summary The City of Goshen, in association with Downtown Goshen Inc., engaged the architectural firm Westlake Reed Leskosky (WRL) in partnership with AMS Planning & Research (AMS) to develop a technical and operating plan for a renovated Go-shen Theater. The project is funded in part by a grant from the U.S. Department of the Interior, National Park Service’s Historic Preservation Fund Program, and is administered by the Indiana Department of Natural Resources, Division of His-toric Preservation and Archaeology. AMS engaged in a series of tasks to identify community and market interest in the project, assess potential use of a reno-vated theater, study comparable facilities in the United States, and create an activity profile and operating plan based on in-put received. A renovated and expanded Goshen Theater can provide im-portant community impact and an anchor to downtown vitali-ty. To ensure success the venue must accommodate a signifi-cant variety of uses and users. Conversations with promoters and potential users as well as an analysis of current facility ac-tivity suggest that the Goshen Theater could host at least 100 events annually, with the building in use about twice as many days.
Market Assessment and Community Input Market Analysis AMS conducted a market analysis of the Goshen area in order to determine the relative presence of market characteristics that typically engage in arts and cultural activities. A detailed analysis is provided in Appendix 1.
Three trade areas were analyzed: the city of Goshen, the Elkhart-Goshen CBSA, and the state of Indiana. Goshen, Indi-ana has a total estimated population of 32,206, which is a 9% increase over its population from the census in 2000, and which represents 27% of the CBSA population (112,605). Pop-ulation growth in the City has outpaced that of the CBSA or the state, and, while is projected to slow, it will continue to do so.
The city of Goshen has a markedly higher Hispanic population than the Elkhart-Goshen, IN CBSA and the state of Indiana, and, conversely, both the state of Indiana and the Elkhart-Goshen CBSA have a higher Black population than the city of Goshen. The presence of households with children is fairly consistent across all three geographic areas. The median age for the city of Goshen is slightly younger than the Elkhart-Goshen, IN CBSA at 33.8.
Goshen Theater Feasibility Study June 15, 2012
Page 4
Education level is a significant predictor of interest and partic-ipation in arts and cultural activities. Goshen has a similar percentage of its population with college degrees as the entire state of Indiana, which is also close to the national average.
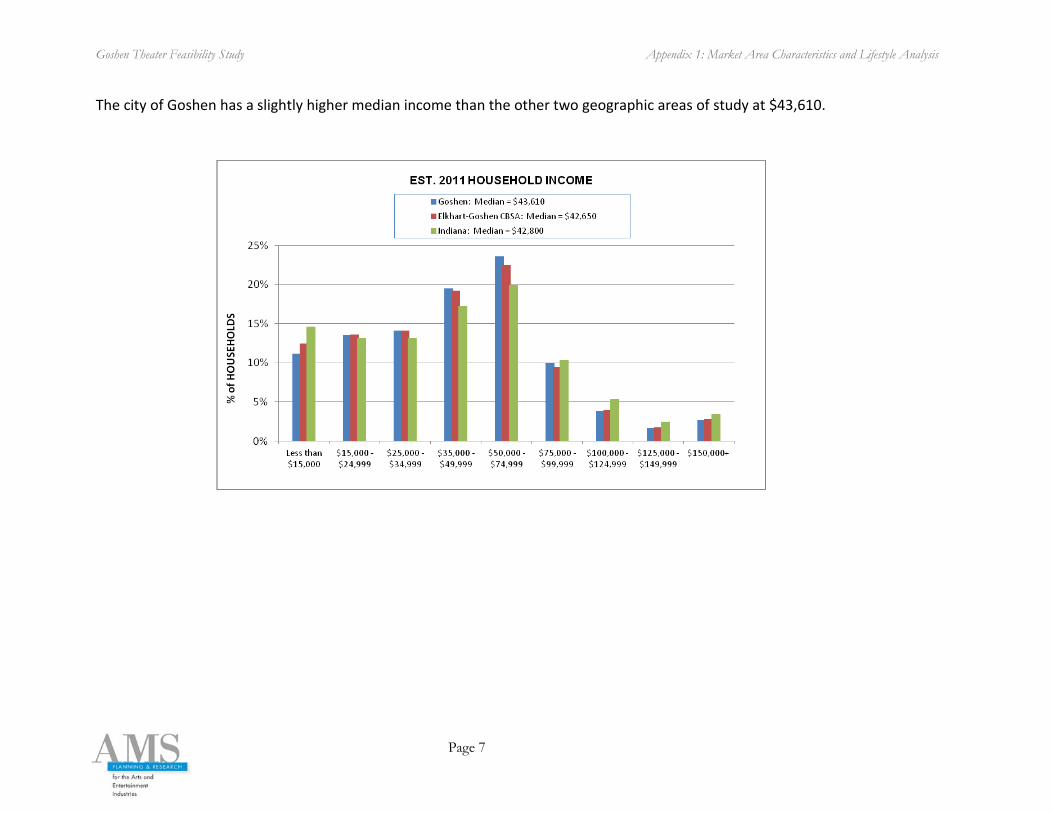
Household income is also significant predictor of arts partici-pation. The city of Goshen has a slightly higher median in-come than the other two geographic areas of study at $43,610 (Elkhart-Goshen CBSA $42,650 and state of Indiana $42,800). The city of Goshen equals or surpasses the CBSA and state in its proportion of households with annual income between $35,000 and $100,000, but falls below the state and region in proportion of households with income above $100,000.
Beyond demographics, AMS reviewed consumer data that in-cluded family life cycle, purchasing patterns, financial behav-ior, and demands for products and services, including cultural activities (see Appendix 1). Our review of the market data suggests that the Goshen, IN area offers a reasonable but not robust market potential for arts participation. The consumer data indicate that household lifestyle attributes related to arts participation in the market area falls at or above the national average in some areas of interest, especially musical (hip hop, contemporary pop, religious/gospel, Latin) but well below the national average in more traditional forms of cultural arts of-ferings (dance, classical music, theater, museums). Further, indices reflect a predisposition towards consuming product, but not attending events.
Program diversity and outreach efforts will be required to grow audiences for the Goshen Theater. Additionally, there is an economic price sensitivity that must be recognized.
Competition Competition for a renovated Goshen Theater is limited. In Go-shen proper there are several smaller venues occasionally or regularly used for bands and popular events including Electric Brew, Concert Spring, The Refuge, and Ignition. Blue Gate Theater at Shipshewana Town Center is a family-oriented the-ater that seats 325, and the Old Bag Factory is used occasion-ally for conferences or performances.
The Music Center at Goshen College includes Sauder Hall, which is a 900-seat purpose built facility for music. In addition to college and Music Center events the annual performing arts series features eight internationally-known artist performanc-es available by subscription. The most recent series included such recognized artists as Manhattan Transfer, Mary Chapin Carpenter, Carolina Chocolate Crops, Nadja Salerno-Sonnenberg, Vance George, Mark O’Connor, and Cherish the Ladies. Individual event ticket prices range from $20 to $40, and season packages of 6, 7 or 8 shows are $130 to $280.
Also at Goshen College is The Umble Center, which includes a 419-seat thrust theater which was renovated in 2001, and which is predominantly used in service of the College Theater Department.
Goshen Theater Feasibility Study June 15, 2012
Page 5
About 12-miles Northwest of Goshen, The Lerner Theatre in Elkhart is a recently renovated 1,700-seat historic theater. Opened in 1924, it was purchased by the City of Elkhart in 1990 to avoid further deterioration or even demolition of this historic building. The $18 million renovation was comple-mented by the creation of a performing arts district.
Under the management of the city the Elkhart Theatre is home to two resident companies: Premier Arts (theater) and The Elkhart Symphony. It hosts more than 200 annual events and shows including concerts, comedians, dance recitals, pri-vate functions and other performances. The Crystal Ballroom is a 6,000 square-foot meeting and event space.
The Elkhart Civic Theatre is a community theater group that performs at Historic Bristol Opera House in Bristol Indiana. They consider Goshen to be outside of their market area and expressed some interest in using the Goshen Theater on a lim-ited basis.
South Bend
While South Bend offers an array of performance venues and events, conversations with regional promoters indicated that there wasn’t much in the area of a similar size to the Goshen Theater. They were enthusiastic about the opportunity to of-fer expanded access to the regional market for certain region-al touring bands.
The Morris Performing Arts Center in South Bend is a 2500-seat performing arts center in downtown South Bend that hosts an array of activities including pop, rock, country and Christian concerts, national touring Broadway shows and oth-er popular acts and comedians. It is the home of Broadway Theatre League of South Bend, Inc., South Bend Symphony Orchestra, and Southold Dance Theater.
Century Center Convention Center includes the 694-fixed seat Bendix Theatre as well as a 166-seat recital hall, which is home to The Acting Ensemble. The DeBartolo Performing Arts Cen-ter at Notre Dame hosts an array of touring productions in its 950-seat concert hall, 570-seat thrust theater, 360-seat pro-scenium theater, and 200-seat cinema.
In 2007 South Bend Civic Theatre acquired the former Scottish Rite Building downtown and renovated it into a 209-seat Mainstage and 70-seat black box theater.
Community Leadership Interest AMS and WRL met in one-on-one, and small group meetings in person and by telephone with area leaders, project stakehold-ers and potential users of a renovated Goshen Theater. The goal was to gather feedback regarding the level of support for the project, the vision for programming, impressions regard-ing the market and competition, and other general concerns or opportunities related to the initiative.
Goshen Theater Feasibility Study June 15, 2012
Page 6
Those interviewed were generally supportive of the renova-tion effort. Most believe that it could be a significant draw to downtown and would support both local groups (theater groups, musical acts) as well as touring musical groups not ac-commodated elsewhere in the area due to its size.
Respondents believe that renovation of the theater would sig-nificantly enhance its current utilization, and would draw from and grow the existing Downtown customer base. Post-renovation it could serve as an anchor for music festivals and other regional events that would complement the already successful First Fridays initiative. Important to many was the preservation of the historic building and its ability to garner attention and serve as a source of civic pride in the area.
The arts community is viewed to be thriving and diverse. Driven by the student population, it is welcoming to new art-ists and entrepreneurial. Events are supported by word of mouth and social media. An emphasis on community is re-flected in preferences and support for Indie and religious mu-sic, folk arts, artist talks and other indigenous forms of expres-sion.
In keeping with this spirit of belonging, or community, success for a renovation Goshen Theater was defined holistically; in-cluding a vibrant downtown with successful shops and restau-rants, and a theater full of diverse activity and audiences serv-ing as a community “hub” or “center” of activity. There is a strong expectation that the Goshen Theater welcome a myri-
ad of activities, with respondents including items such as art classes, youth productions, proms and dances, pageants, “school of rock,” graduations, broadcasting, camps and church alongside the more traditional country, jazz, Indie rock, thea-ter, popular music, inspirational, musical theater, bands and orchestras as events they would expect to find at the theater.
There were limited concerns expressed, the most consistent of which was to ensure that the building be available to a broad array of artists and organizations; that its use not be dominated by a few. Respondents stressed the importance of maintaining reasonable rental fees to ensure access. The need to balance the integrity of the historic renovation with required updates and modest capital investment was also a subject of interest.
Universally respondents expressed appreciation for the cur-rent manager of the Goshen Theater, and noted his capacity to draw acts and his creative approach to marketing and audi-ence development as important assets.
Community Survey AMS conducted a web-based community survey to gather be-havioral and spending data related to participation in, or at-tendance at, arts and cultural events and activities; under-stand programming preferences; and test opinions regarding the potential renovation of the Goshen Theater. The com-plete survey report including methodology can be found in Appendix 2.
Goshen Theater Feasibility Study June 15, 2012
Page 7
98% of respondents were aware of the Goshen Theater, and the same number favored its renovation; however, 41% also cited satisfaction with the current state of the Goshen Thea-ter.
For those who currently attend the Goshen Theater, First Fri-day events are the most widely attended events (76.9%), with popular music (57.1%), dramatic performances (49.5%) and films (48.4%) the next most attended respectively.
Respondents believe a consistent mix of performances, films and other activities should be maintained in a renovated Go-shen Theater. 90.1% of respondents envision First Friday events continuing to take place in a renovated Goshen Thea-ter; 85.6% envision dramatic performances; 81.7% envision films. Local or regional music acts and popular entertainment also ranked quite high. When asked about artists or groups who might use the facility, most cited community-based groups.
Respondents believe ticket pricing for events at a renovated theater should be affordable at $20 or less. More than half of all respondents noted that they both meet friends and have a full meal before or after attending an event. Finally, the con-tent (specific works or performers), quality, and schedule (date/time of the event) are key drivers for decision-making. Those who were not aware of the Goshen Theater also cited cost as a significant factor.
Potential Users and their Needs Current users of the facility are enthusiastic about its renova-tion and, for the most part, anticipate an increase in use should the facility be renovated. Additionally, AMS spoke with representatives from area arts organizations currently housed elsewhere who suggested they might expand offerings to take advantage of the venue on a limited basis. Specific detail is included in the activity profile, below.
Known potential uses include music (both acoustic and ampli-fied), theater, film, and dance. In terms of physical require-ments, it is important that the facility remain flexible and mul-ti-purpose, with the ability to accommodate a wide range of activities, with limited cost to adjust the room for its intended purpose.
Specifically potential users cited the need for a larger stage, sprung for dance, with wing space and a backstage crossover; and a grid system for curtains and ability for hangs. Efficient load-in is a priority, with room backstage for road boxes, carts and storage. Also critical is improved technical equipment in-cluding sound, lighting and projection equipment, with pro-duction space for mixing and live feeds. The current capacity is deemed to be appropriate, although some people would like the flexibility to remove seats in the front for dancing at some events.
From a front-of-house perspective people seek an expanded lobby with concessions, merchandise space and appropriate
Goshen Theater Feasibility Study June 15, 2012
Page 8
restrooms, and that the facility be fully ADA accessible. Exist-ing ancillary spaces are expected to be heavily used for meet-ings, classes, rehearsal space and community and private gatherings.
Goshen Theater Feasibility Study June 15, 2012
Page 9
Comparable Facilities AMS conducted benchmark studies of four relevant venues to provide comparisons for the Goshen Theater’s potential pro-grams, attendance forecasts, staffing, and business plan. Crite-ria established to select theaters for study included market size, seat count, presence of a college or university, diversity of programming including community use, strong film and music programming, and other factors.
The theaters selected for study are The Paramount Theatre and Visual Arts Center in St. Cloud, Minnesota; The State The-atre in State College, Pennsylvania; The Avalon Theatre in Grand Junction, Colorado; and The Babcock Theater in Billings, Montana. Full reports can be found in Appendix 3.
Venue Location Population Capacity The Paramount Theatre and Visual Arts Center
St. Cloud, Minneso-ta
City – 68,842 CBSA – St. Cloud MN 191,082
714 seats
The State Theatre State College, Penn-sylvania
City – 42,034 CBSA – State College PA 148,371
571 seats
The Avalon Theatre
Grand Junction, Colorado
City – 58,566 CBSA – Grand Junction CO 148,772
900 seats
The Babcock Theater
Billings, Montana
City – 104,170 CBSA – Billings, MT 158,761
750 seats
Goshen Theater Goshen, IN City – 32,206
CBSA – Elkhart-Goshen 112,605
750 seats
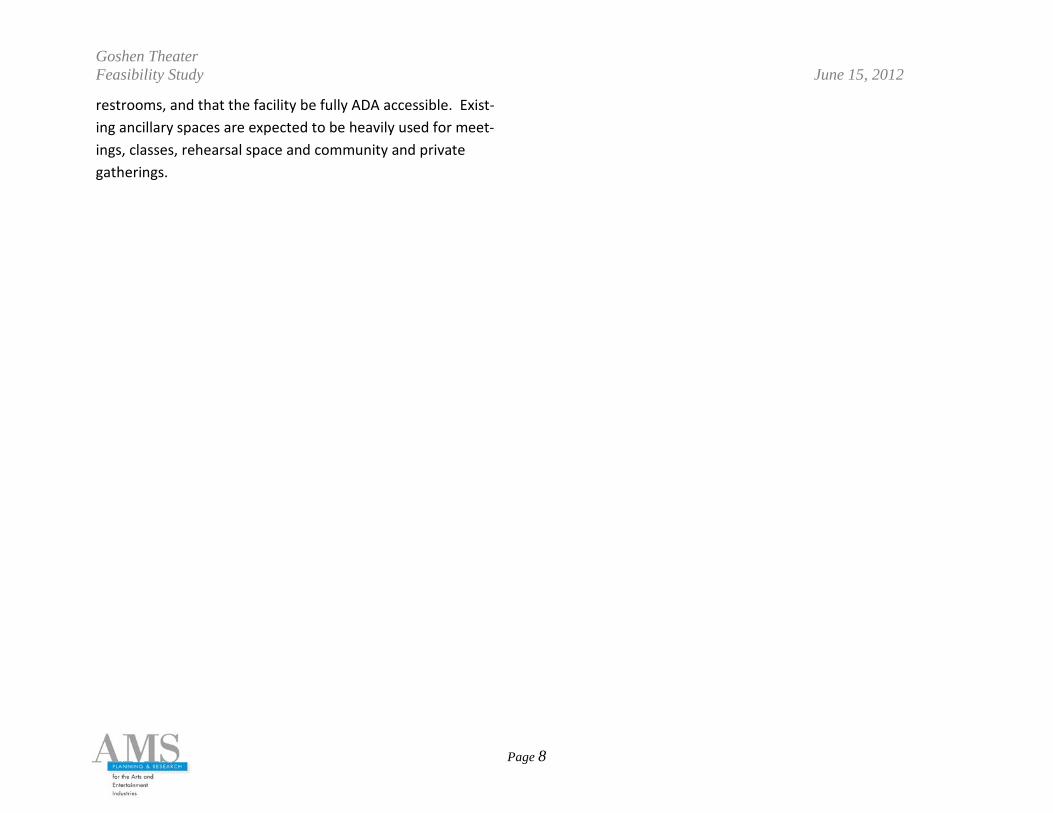
The Paramount Theatre and Visual Arts Center St. Cloud, Minnesota
The mission of the Paramount Theatre & Visual Arts Center is: to provide opportunities for artistic production, creative explo-ration, arts education and the enjoyment of arts and enter-tainment.
The facility is managed to ensure use by a diverse set of pa-trons, enhance artistic opportunity, provide a creative envi-ronment for community involvement in the arts, and generate a positive economic impact on Downtown St. Cloud.
Built in 1921, the theater was first renovated in 1930 and has been upgraded and renovated in phases over multiple years; most recently in the 1990’s.
Goshen Theater Feasibility Study June 15, 2012
Page 10
Owned by the City of St. Cloud and operated by Paramount Arts Resource Trust, a private, nonprofit 501(c)(3) organiza-tion, facilities include a 714-seat theater and a visual arts cen-ter, as well as Paramount Gallery and Gifts next door. There is a board of directors of 16 members and a staff of 9. The 2010 operating budget is $950,000.
The Paramount Theatre and Visual Arts Center is a rental only facility which hosts approximately 50 performances each year, as well as studio art classes. Performances include jazz music, folk music, musical theater, theater, comedy, film, dance, cho-ral music, country music, community band, lectures, and pop-ular music. There are no resident companies, but details on programming offerings are divided into community versus commercial activities, with 80% of the events designated as community rentals.
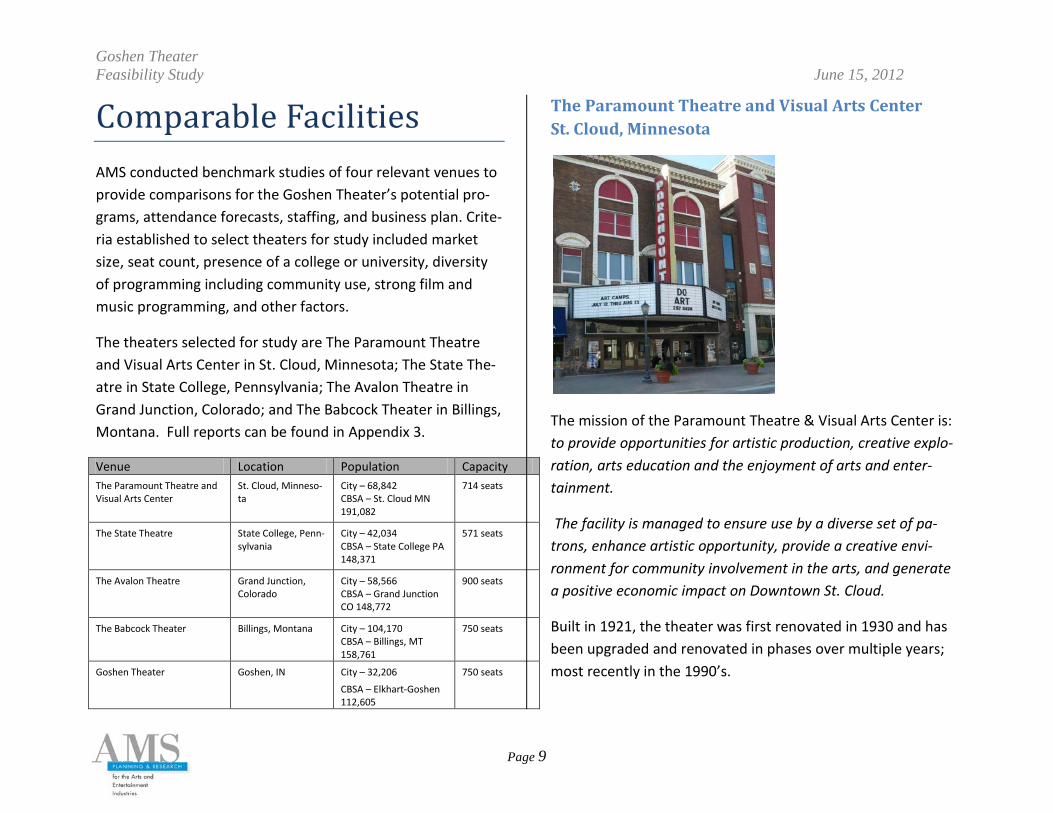
The State Theatre State College, Pennsylvania
The State Theatre is owned by the City of State College and operated by The State Theatre Inc., a 501(c)(3) private, non-profit organization. The theater is 571 seats and is mostly used for rentals, although they do host some presentations. The mission is: We are a vibrant, inclusive theatre, offering our venue as a community stage, a center for local, regional, and international performers, an experiential learning envi-ronment, and a responsive philanthropic space.
Built in 1938 as a movie house, it was renovated in 2006 for live performances and events after being shuttered in 1999. The theater is complemented by an upper lobby / studio thea-tre which is appropriate for receptions, luncheons and din-ners, meetings and smaller productions.
Goshen Theater Feasibility Study June 15, 2012
Page 11
Programming at the State Theatre is a mix of presentations and promoters. The more community based film series and family events are produced by the theater itself, and popular music is booked through promoters. Including film, there were 177 performances from August 2011 to May 2012 in the State Theatre. Performances included film, musical theater, choral music, variety, theater, lecture, family, popular music, orches-tral music, jazz music, dance, and comedy.
The State Theatre has a 14-member Board of Directors and employs a staff of 24. The annual operating budget for fiscal year 2010 was $1,618,838, with revenues of $1,305,781, re-sulting in an operating loss of $300,000. The State is “fine-tuning its programming approach, courting community and corporate interests and maturing its fundraising efforts.”
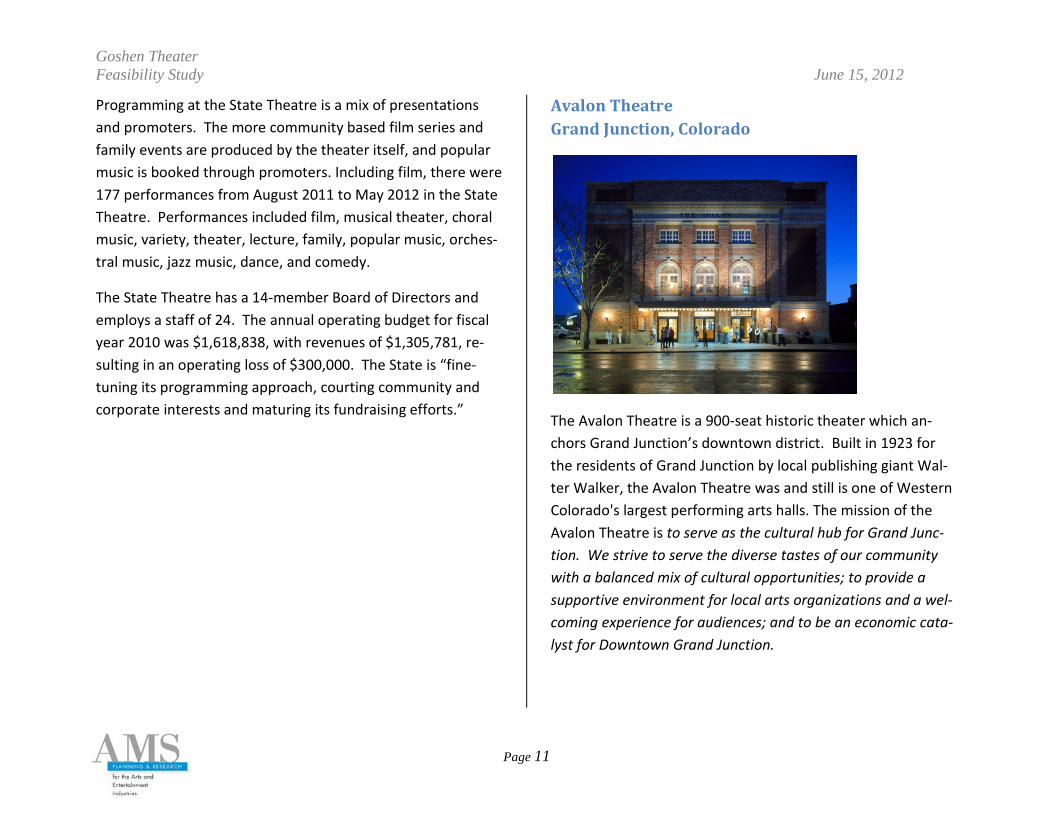
Avalon Theatre Grand Junction, Colorado
The Avalon Theatre is a 900-seat historic theater which an-chors Grand Junction’s downtown district. Built in 1923 for the residents of Grand Junction by local publishing giant Wal-ter Walker, the Avalon Theatre was and still is one of Western Colorado's largest performing arts halls. The mission of the Avalon Theatre is to serve as the cultural hub for Grand Junc-tion. We strive to serve the diverse tastes of our community with a balanced mix of cultural opportunities; to provide a supportive environment for local arts organizations and a wel-coming experience for audiences; and to be an economic cata-lyst for Downtown Grand Junction.
Goshen Theater Feasibility Study June 15, 2012
Page 12
In addition to playing first-run movies, the Avalon Theatre shows independent and foreign films. Live productions include concerts, theatrical performances and dance recitals, and the theater is rented for private functions. There is a Broadway series and it is the home of performances by the Grand Junc-tion Symphony Orchestra. The Avalon Theatre hosts 65 events per season.
The theater is owned by the City of Grand Junction and oper-ated by the Two Rivers Convention Center, an agency of the City of Grand Junction. It is supported by a staff of 2 full-time and 4 part-time staff members which are shared between the facilities. Dedicated operating expenses budgeted in 2012 were $236,000.
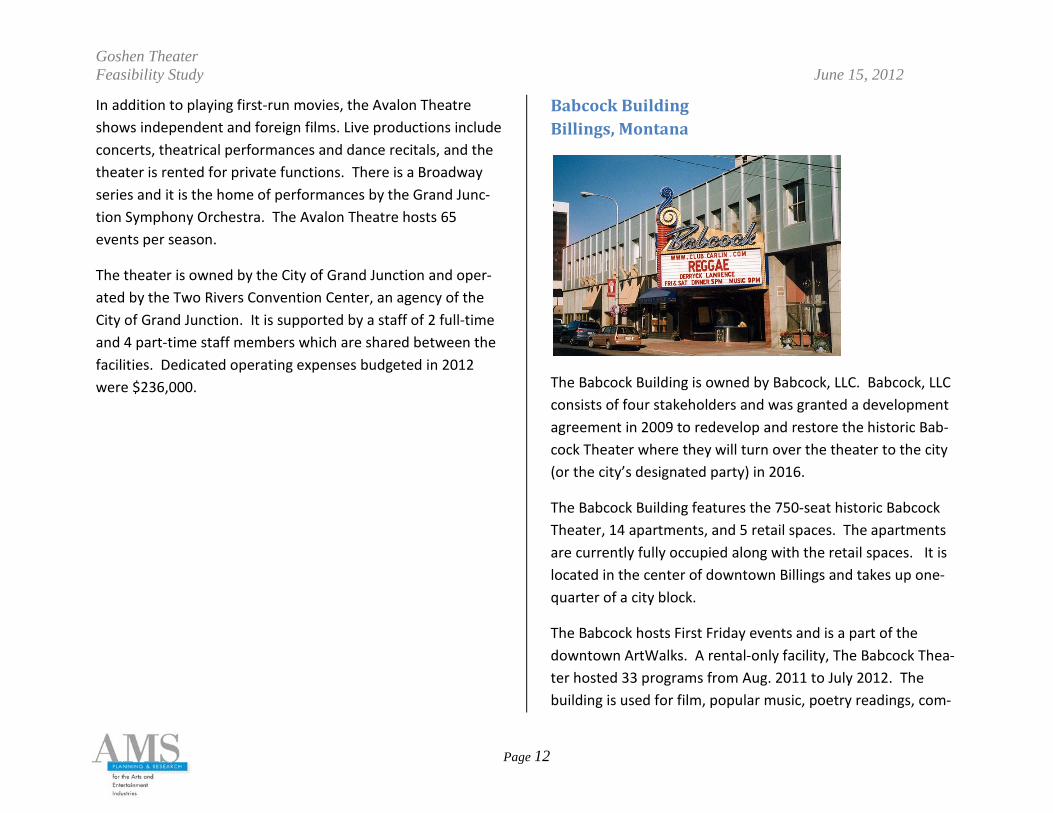
Babcock Building Billings, Montana
The Babcock Building is owned by Babcock, LLC. Babcock, LLC consists of four stakeholders and was granted a development agreement in 2009 to redevelop and restore the historic Bab-cock Theater where they will turn over the theater to the city (or the city’s designated party) in 2016.
The Babcock Building features the 750-seat historic Babcock Theater, 14 apartments, and 5 retail spaces. The apartments are currently fully occupied along with the retail spaces. It is located in the center of downtown Billings and takes up one-quarter of a city block.
The Babcock hosts First Friday events and is a part of the downtown ArtWalks. A rental-only facility, The Babcock Thea-ter hosted 33 programs from Aug. 2011 to July 2012. The building is used for film, popular music, poetry readings, com-
Goshen Theater Feasibility Study June 15, 2012
Page 13
edy, band and orchestral music, dance, and meetings. While there are no resident companies, the Billings Symphony, and Community Band do perform there. All events are considered rentals except for the First Friday events and ArtWalk events which are community-sponsored events that use the facility for free.
The case studies represent a variety of operating models and will serve as benchmarks for activity assumptions, staffing and finances in the business plan for a renovated Goshen Theater.
Goshen Theater Feasibility Study June 15, 2012
Page 14
Activity Profile Current Activity AMS analyzed current activity at the Goshen Theater to un-derstand a baseline from which activity at a renovated theater would grow.
Currently the Goshen Theater is used about 133 days each year. This includes 99 “event days,” (days where an audience is present) and 43 “non-event days” (load-in, rehearsal, etc.).
These figures do not include activity by a number of rental cli-ents that include a church, local dance company, and the Go-shen Park and Recreation Department.
In 2011, activity at the Goshen Theater broke down as follows:
Activity Type Number of Uses
Percentage of Use
Performance
52 58% Private
18 20% Community
13 14% Youth 7 8%
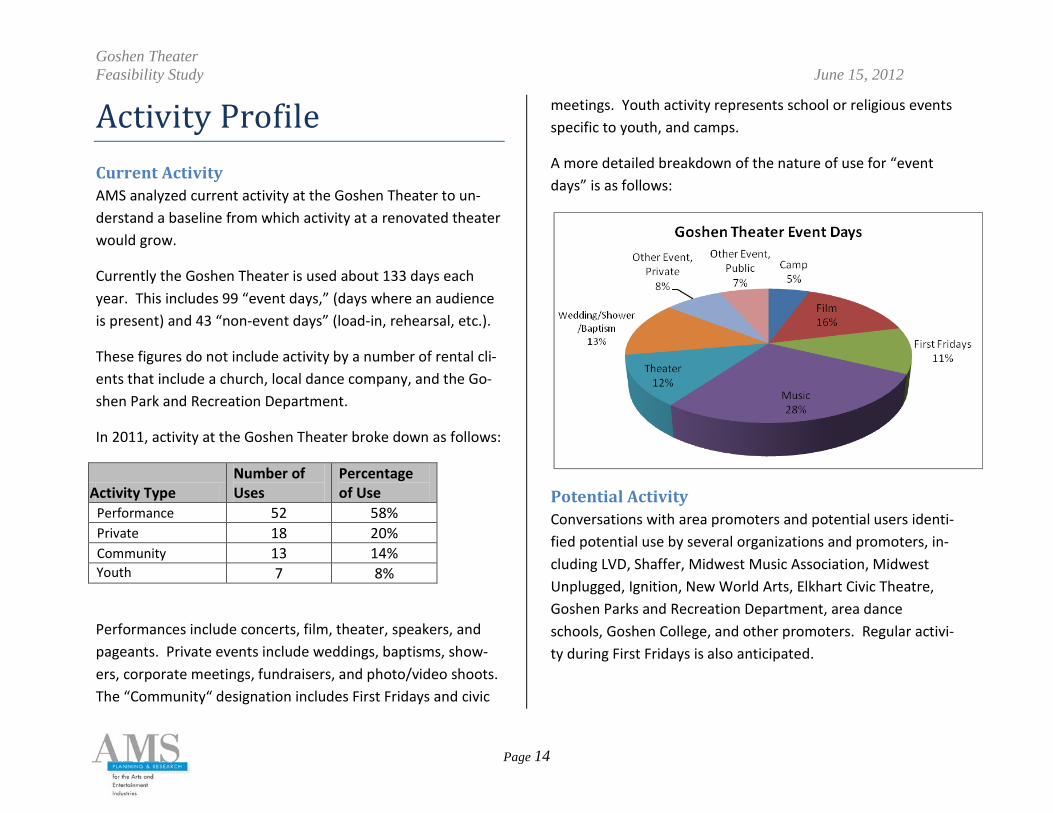
Performances include concerts, film, theater, speakers, and pageants. Private events include weddings, baptisms, show-ers, corporate meetings, fundraisers, and photo/video shoots. The “Community“ designation includes First Fridays and civic
meetings. Youth activity represents school or religious events specific to youth, and camps.
A more detailed breakdown of the nature of use for “event days” is as follows:
Potential Activity Conversations with area promoters and potential users identi-fied potential use by several organizations and promoters, in-cluding LVD, Shaffer, Midwest Music Association, Midwest Unplugged, Ignition, New World Arts, Elkhart Civic Theatre, Goshen Parks and Recreation Department, area dance schools, Goshen College, and other promoters. Regular activi-ty during First Fridays is also anticipated.
Goshen Theater Feasibility Study June 15, 2012
Page 15
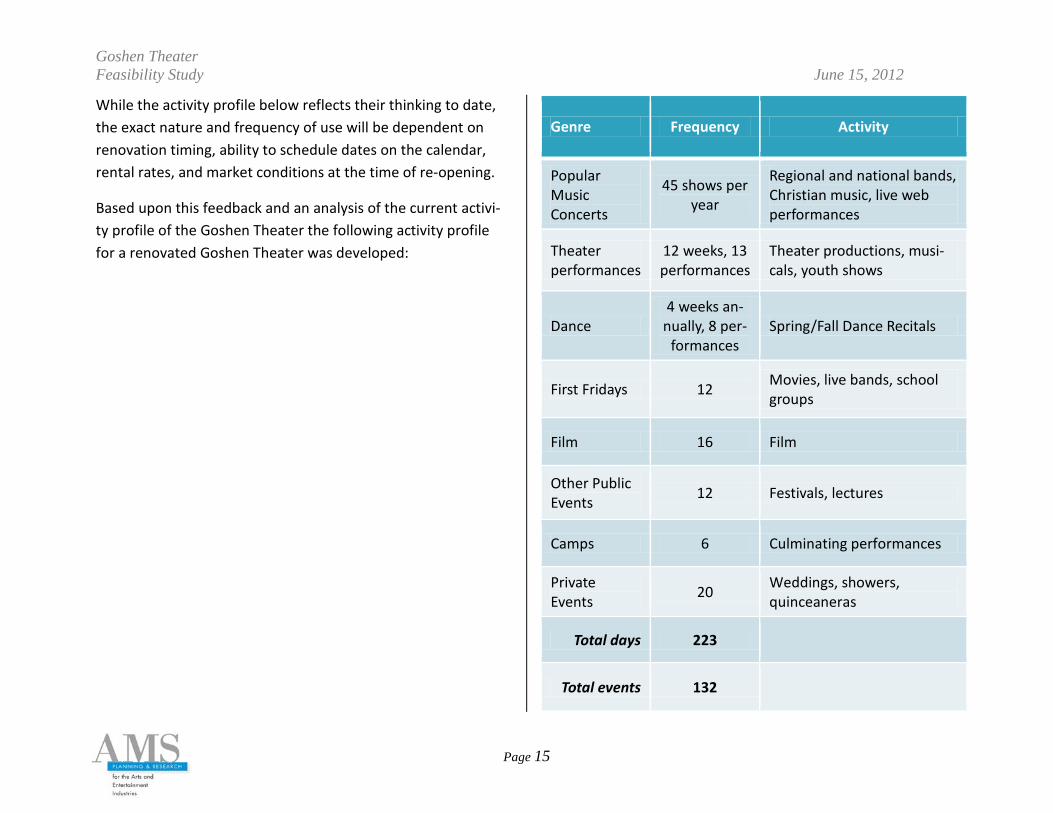
While the activity profile below reflects their thinking to date, the exact nature and frequency of use will be dependent on renovation timing, ability to schedule dates on the calendar, rental rates, and market conditions at the time of re-opening.
Based upon this feedback and an analysis of the current activi-ty profile of the Goshen Theater the following activity profile for a renovated Goshen Theater was developed:
Genre Frequency Activity
Popular Music Concerts
45 shows per year
Regional and national bands, Christian music, live web performances
Theater performances
12 weeks, 13 performances
Theater productions, musi-cals, youth shows
Dance 4 weeks an-
nually, 8 per-formances
Spring/Fall Dance Recitals
First Fridays 12 Movies, live bands, school groups
Film 16 Film
Other Public Events 12 Festivals, lectures
Camps 6 Culminating performances
Private Events 20 Weddings, showers,
quinceaneras
Total days 223
Total events 132
Goshen Theater Feasibility Study June 15, 2012
Page 16
Operating Pro Forma Based on the activity profile, research into comparable facili-ties and our experience with similar venues, AMS prepared the operating pro forma estimate found in Appendix 4.
Notes and Assumptions The report is based on the square footage and capacity figures provided by the Westlake Reed Leskowsky architectural pro-gram.
The five-year model contains the following escalations and assumptions:
o All figures are in 2012 dollars.
o Expenses escalate 3% annually; non-activity based rev-enues escalate 1.5% bi-annually.
o Rental rates increase 2% annually
o Salaries escalate 3% annually; fringe benefits rate for full-time employees is 25%; part-time 12%
o Commercial activity level increases 10% annually. For commercial activity the stated rental rates are a base only; renters pay the greater of this rate or 15% of ticket sales.
o Patrons pay a per-ticket facility charge of $0.50 (non-profit) or $1.00 (commercial) and there is a $0.50 cent charge on tickets sold at the box office.
o At this level of planning AMS includes a 5% expense contingency
o All figures are rounded to the nearest $10 or $100, as appropriate
Summary AMS looks at the third year post-reopening as a base, stable year of operation. In year 3 the Goshen Theater has an oper-ating budget of approximately $400,000, with operating reve-nues of $306,000 and contributed income of $51,000. Net results before capital improvements or contingency are ($43,000).
Goshen Theater Feasibility Study June 15, 2012
Page 17
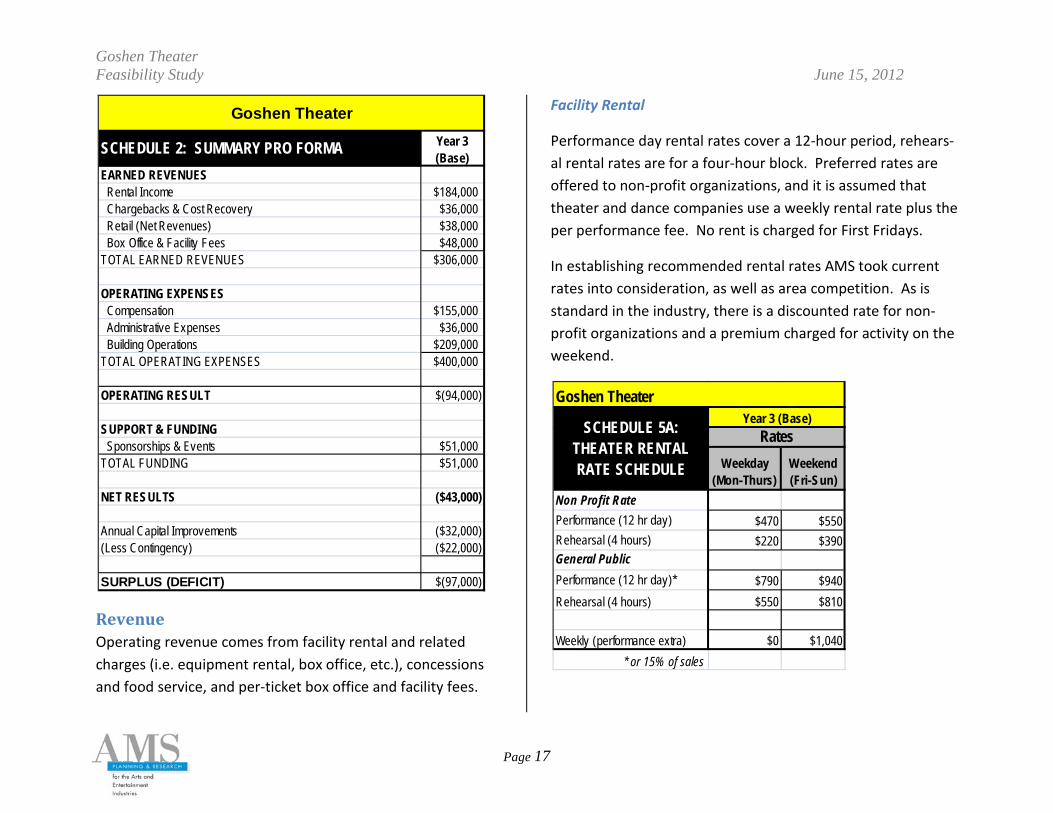
Revenue Operating revenue comes from facility rental and related charges (i.e. equipment rental, box office, etc.), concessions and food service, and per-ticket box office and facility fees.
Facility Rental
Performance day rental rates cover a 12-hour period, rehears-al rental rates are for a four-hour block. Preferred rates are offered to non-profit organizations, and it is assumed that theater and dance companies use a weekly rental rate plus the per performance fee. No rent is charged for First Fridays.
In establishing recommended rental rates AMS took current rates into consideration, as well as area competition. As is standard in the industry, there is a discounted rate for non-profit organizations and a premium charged for activity on the weekend.
EARNED REVENUES Rental Income $184,000 Chargebacks & Cost Recovery $36,000 Retail (Net Revenues) $38,000 Box Office & Facility Fees $48,000TOTAL EARNED REVENUES $306,000
OPERATING EXPENSES Compensation $155,000 Administrative Expenses $36,000 Building Operations $209,000TOTAL OPERATING EXPENSES $400,000
OPERATING RESULT $(94,000)
SUPPORT & FUNDING Sponsorships & Events $51,000TOTAL FUNDING $51,000
NET RESULTS ($43,000)
Annual Capital Improvements ($32,000)(Less Contingency) ($22,000)
SURPLUS (DEFICIT) $(97,000)
Year 3 (Base)SCHEDULE 2: SUMMARY PRO FORMA
Goshen Theater
Goshen Theater
Weekday (Mon-Thurs)
Weekend (Fri-Sun)
Non Profit RatePerformance (12 hr day) $470 $550Rehearsal (4 hours) $220 $390General PublicPerformance (12 hr day)* $790 $940Rehearsal (4 hours) $550 $810
Weekly (performance extra) $0 $1,040* or 15% of sales
SCHEDULE 5A: THEATER RENTAL RATE SCHEDULE
Year 3 (Base)Rates
Goshen Theater Feasibility Study June 15, 2012
Page 18
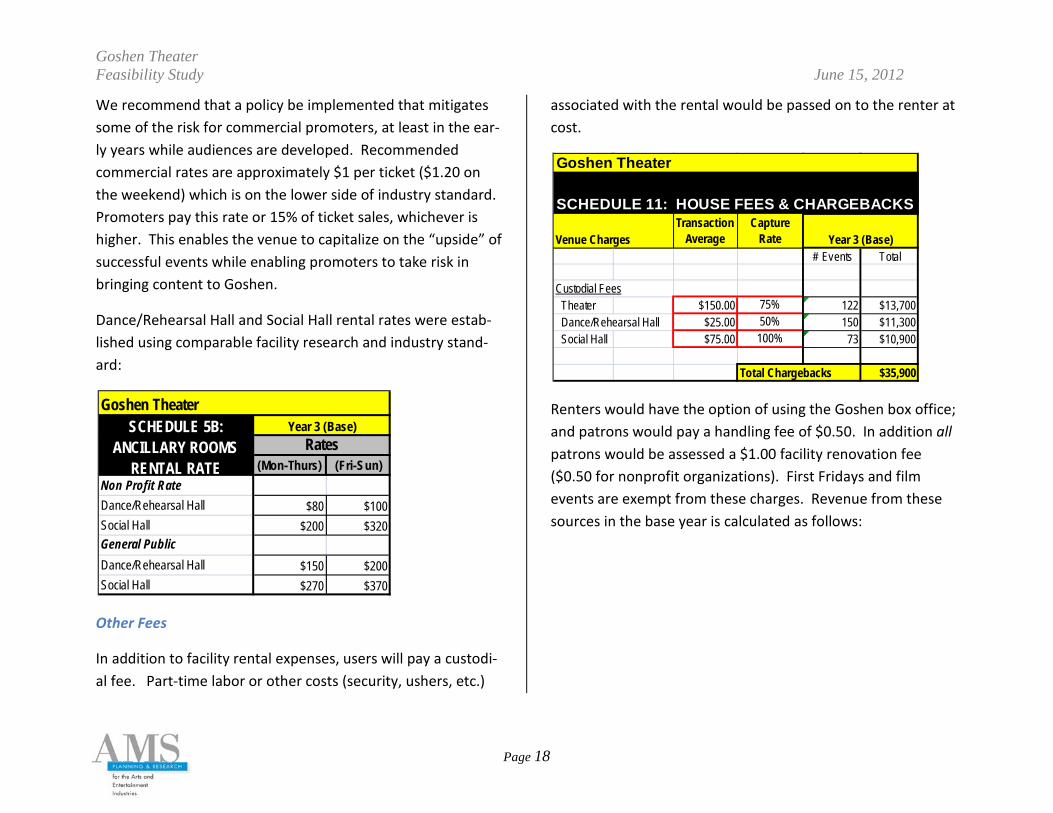
We recommend that a policy be implemented that mitigates some of the risk for commercial promoters, at least in the ear-ly years while audiences are developed. Recommended commercial rates are approximately $1 per ticket ($1.20 on the weekend) which is on the lower side of industry standard. Promoters pay this rate or 15% of ticket sales, whichever is higher. This enables the venue to capitalize on the “upside” of successful events while enabling promoters to take risk in bringing content to Goshen.
Dance/Rehearsal Hall and Social Hall rental rates were estab-lished using comparable facility research and industry stand-ard:
Other Fees
In addition to facility rental expenses, users will pay a custodi-al fee. Part-time labor or other costs (security, ushers, etc.)
associated with the rental would be passed on to the renter at cost.
Renters would have the option of using the Goshen box office; and patrons would pay a handling fee of $0.50. In addition all patrons would be assessed a $1.00 facility renovation fee ($0.50 for nonprofit organizations). First Fridays and film events are exempt from these charges. Revenue from these sources in the base year is calculated as follows:
Goshen Theater
(Mon-Thurs)
(Fri-Sun)
Non Profit RateDance/Rehearsal Hall $80 $100Social Hall $200 $320General PublicDance/Rehearsal Hall $150 $200Social Hall $270 $370
SCHEDULE 5B: ANCILLARY ROOMS
RENTAL RATE Rates
Year 3 (Base)
SCHEDULE 11: HOUSE FEES & CHARGEBACKS
Venue ChargesTransaction
AverageCapture
Rate# Events Total
Custodial Fees Theater $150.00 75% 122 $13,700 Dance/Rehearsal Hall $25.00 50% 150 $11,300 Social Hall $75.00 100% 73 $10,900
Total Chargebacks $35,900
Goshen Theater
Year 3 (Base)
Goshen Theater Feasibility Study June 15, 2012
Page 19
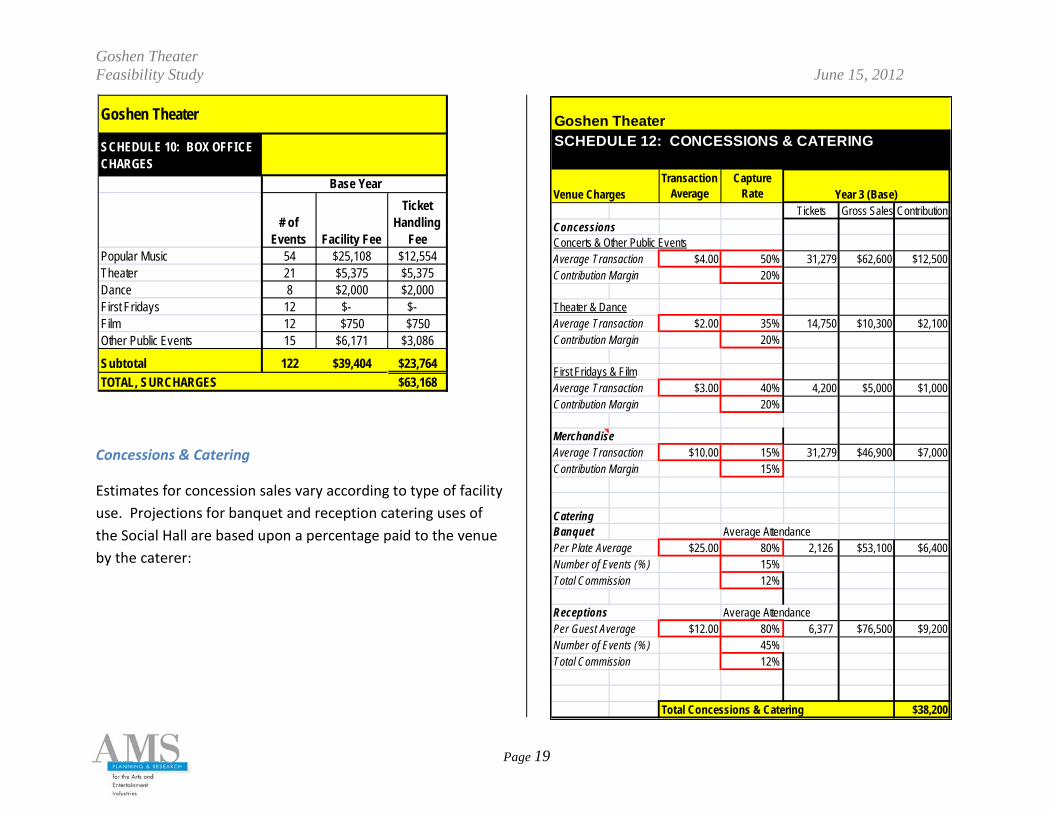
Concessions & Catering
Estimates for concession sales vary according to type of facility use. Projections for banquet and reception catering uses of the Social Hall are based upon a percentage paid to the venue by the caterer:
SCHEDULE 10: BOX OFFICE CHARGES
# of Events Facility Fee
Ticket Handling
FeePopular Music 54 $25,108 $12,554Theater 21 $5,375 $5,375Dance 8 $2,000 $2,000First Fridays 12 $- $-Film 12 $750 $750Other Public Events 15 $6,171 $3,086
Subtotal 122 $39,404 $23,764TOTAL, SURCHARGES $63,168
Goshen Theater
Base Year
SCHEDULE 12: CONCESSIONS & CATERING
Venue ChargesTransaction
AverageCapture
RateTickets Gross Sales Contribution
ConcessionsConcerts & Other Public EventsAverage Transaction $4.00 50% 31,279 $62,600 $12,500Contribution Margin 20%
Theater & DanceAverage Transaction $2.00 35% 14,750 $10,300 $2,100Contribution Margin 20%
First Fridays & FilmAverage Transaction $3.00 40% 4,200 $5,000 $1,000Contribution Margin 20%
MerchandiseAverage Transaction $10.00 15% 31,279 $46,900 $7,000Contribution Margin 15%
CateringBanquet Average AttendancePer Plate Average $25.00 80% 2,126 $53,100 $6,400Number of Events (%) 15%Total Commission 12%
Receptions Average AttendancePer Guest Average $12.00 80% 6,377 $76,500 $9,200Number of Events (%) 45%Total Commission 12%
Total Concessions & Catering $38,200
Goshen Theater
Year 3 (Base)
Goshen Theater Feasibility Study June 15, 2012
Page 20
Expenses Expenses fall into three general categories: staff, building ex-pense (occupancy), and administrative expense.
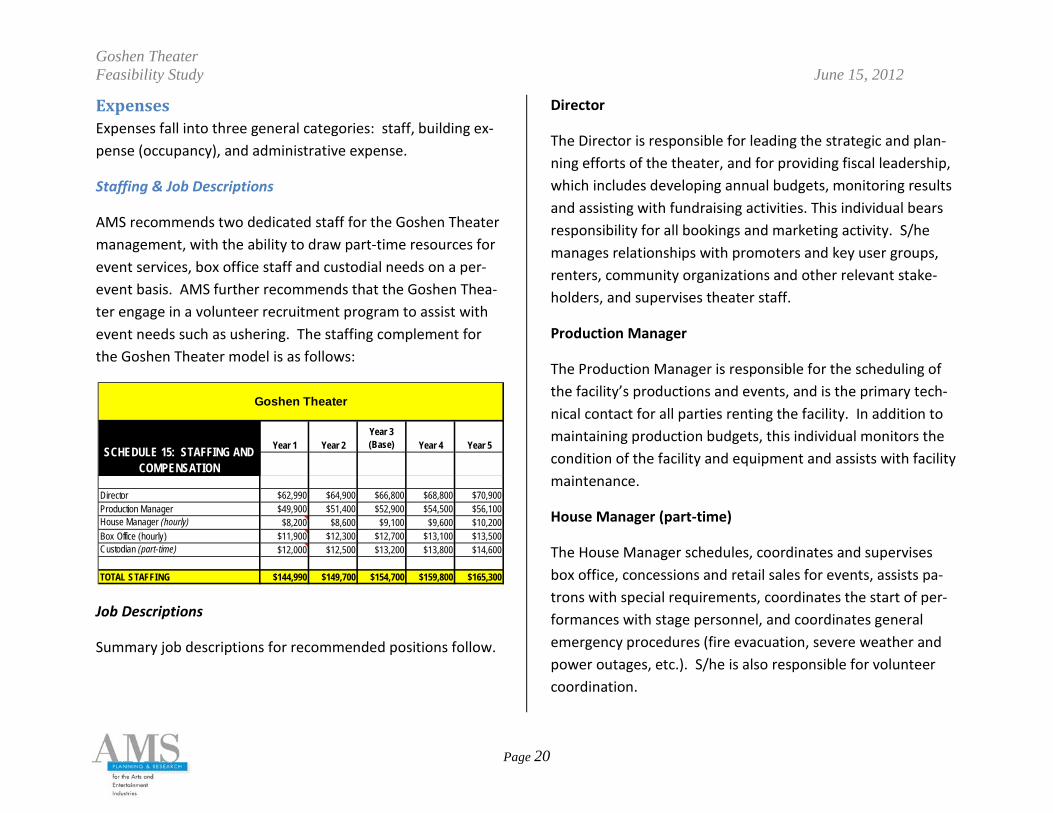
Staffing & Job Descriptions
AMS recommends two dedicated staff for the Goshen Theater management, with the ability to draw part-time resources for event services, box office staff and custodial needs on a per-event basis. AMS further recommends that the Goshen Thea-ter engage in a volunteer recruitment program to assist with event needs such as ushering. The staffing complement for the Goshen Theater model is as follows:
Job Descriptions
Summary job descriptions for recommended positions follow.
Director
The Director is responsible for leading the strategic and plan-ning efforts of the theater, and for providing fiscal leadership, which includes developing annual budgets, monitoring results and assisting with fundraising activities. This individual bears responsibility for all bookings and marketing activity. S/he manages relationships with promoters and key user groups, renters, community organizations and other relevant stake-holders, and supervises theater staff.
Production Manager
The Production Manager is responsible for the scheduling of the facility’s productions and events, and is the primary tech-nical contact for all parties renting the facility. In addition to maintaining production budgets, this individual monitors the condition of the facility and equipment and assists with facility maintenance.
House Manager (part-time)
The House Manager schedules, coordinates and supervises box office, concessions and retail sales for events, assists pa-trons with special requirements, coordinates the start of per-formances with stage personnel, and coordinates general emergency procedures (fire evacuation, severe weather and power outages, etc.). S/he is also responsible for volunteer coordination.
Year 1 Year 2Year 3 (Base) Year 4 Year 5
Director $62,990 $64,900 $66,800 $68,800 $70,900Production Manager $49,900 $51,400 $52,900 $54,500 $56,100House Manager (hourly) $8,200 $8,600 $9,100 $9,600 $10,200Box Office (hourly) $11,900 $12,300 $12,700 $13,100 $13,500Custodian (part-time) $12,000 $12,500 $13,200 $13,800 $14,600
TOTAL STAFFING $144,990 $149,700 $154,700 $159,800 $165,300
SCHEDULE 15: STAFFING AND COMPENSATION
Goshen Theater
Goshen Theater Feasibility Study June 15, 2012
Page 21
Box Office (hourly)
Box office staff sells tickets and fields telephone and walk-up inquiries related to events.
Custodian (part-time)
The custodian is responsible for making sure that the facility is clean and maintained in a manner that ensures the safety of all building occupants, and for reporting needed maintenance and repairs to the appropriate parties.
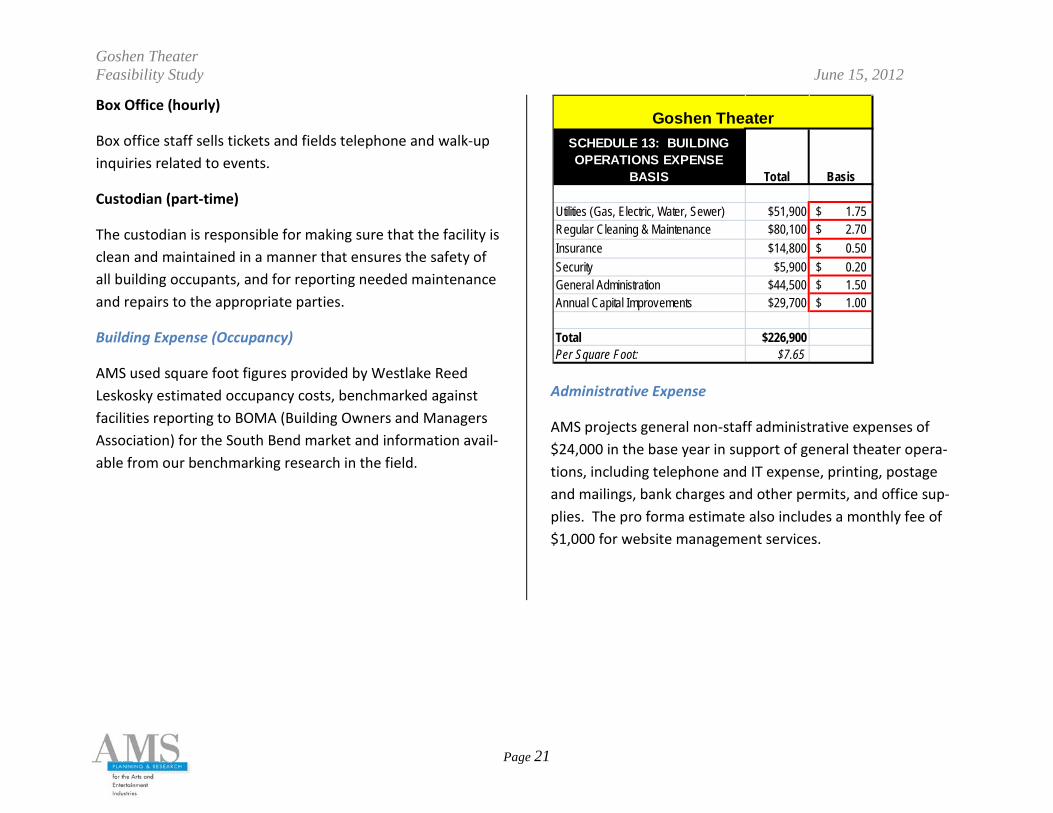
Building Expense (Occupancy)
AMS used square foot figures provided by Westlake Reed Leskosky estimated occupancy costs, benchmarked against facilities reporting to BOMA (Building Owners and Managers Association) for the South Bend market and information avail-able from our benchmarking research in the field.
Administrative Expense
AMS projects general non-staff administrative expenses of $24,000 in the base year in support of general theater opera-tions, including telephone and IT expense, printing, postage and mailings, bank charges and other permits, and office sup-plies. The pro forma estimate also includes a monthly fee of $1,000 for website management services.
Utilities (Gas, Electric, Water, Sewer) $51,900 1.75$ Regular Cleaning & Maintenance $80,100 2.70$ Insurance $14,800 0.50$ Security $5,900 0.20$ General Administration $44,500 1.50$ Annual Capital Improvements $29,700 1.00$
Total $226,900Per Square Foot: $7.65
Goshen TheaterSCHEDULE 13: BUILDING OPERATIONS EXPENSE
BASIS Total Basis
Goshen Theater Feasibility Study June 15, 2012
Page 22
Summary There is considerable support for investment in the Goshen Theater to better accommodate a variety of uses and patrons. A renovated and expanded Goshen Theater can provide im-portant community impact and an anchor to downtown vitali-ty.
To ensure success the venue must accommodate a significant variety of uses and users. Conversations with promoters and potential users as well as an analysis of current facility activity suggest that the Goshen Theater could host at least 100 events annually, with the building in use about twice as many days.
The operating model recommended here contemplates ticket prices and rental fees that allow for broad community partici-pation; however, the resulting revenue is not sufficient to cover operating costs. As audiences and promoter relation-ships are developed, operating subsidy will be required to en-sure success.
Goshen Theater Feasibility Study June 15, 2012
Page 23
Appendices Appendix 1: Market Analysis
Appendix 2: Community Survey Results
Appendix 3: Comparable Facilities Report
Appendix 4: Operating Pro Forma

The City of Goshen, Indiana
Market Area Characteristics
and Lifestyle Analysis
Goshen Theater Feasibility Study
Appendix 1: Market Area Characteristics and Lifestyle Analysis
June, 2012
Goshen Theater Feasibility Study Appendix 1: Market Area Characteristics and Lifestyle Analysis
Page 2
Demographics
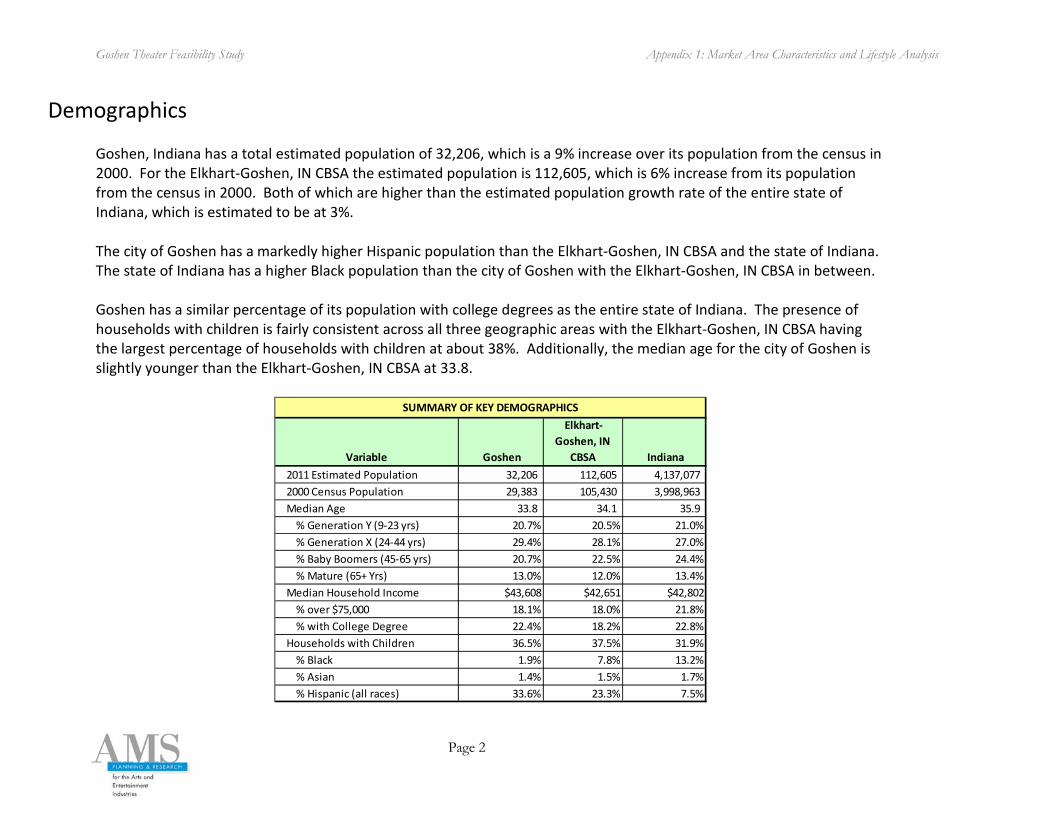
Goshen, Indiana has a total estimated population of 32,206, which is a 9% increase over its population from the census in 2000. For the Elkhart-Goshen, IN CBSA the estimated population is 112,605, which is 6% increase from its population from the census in 2000. Both of which are higher than the estimated population growth rate of the entire state of Indiana, which is estimated to be at 3%. The city of Goshen has a markedly higher Hispanic population than the Elkhart-Goshen, IN CBSA and the state of Indiana. The state of Indiana has a higher Black population than the city of Goshen with the Elkhart-Goshen, IN CBSA in between. Goshen has a similar percentage of its population with college degrees as the entire state of Indiana. The presence of households with children is fairly consistent across all three geographic areas with the Elkhart-Goshen, IN CBSA having the largest percentage of households with children at about 38%. Additionally, the median age for the city of Goshen is slightly younger than the Elkhart-Goshen, IN CBSA at 33.8.
Variable Goshen
Elkhart-Goshen, IN
CBSA Indiana 2011 Estimated Population 32,206 112,605 4,137,077 2000 Census Population 29,383 105,430 3,998,963 Median Age 33.8 34.1 35.9
% Generation Y (9-23 yrs) 20.7% 20.5% 21.0%% Generation X (24-44 yrs) 29.4% 28.1% 27.0%% Baby Boomers (45-65 yrs) 20.7% 22.5% 24.4%% Mature (65+ Yrs) 13.0% 12.0% 13.4%
Median Household Income $43,608 $42,651 $42,802% over $75,000 18.1% 18.0% 21.8%
% with College Degree 22.4% 18.2% 22.8%Households with Children 36.5% 37.5% 31.9% % Black 1.9% 7.8% 13.2% % Asian 1.4% 1.5% 1.7% % Hispanic (all races) 33.6% 23.3% 7.5%
SUMMARY OF KEY DEMOGRAPHICS
Goshen Theater Feasibility Study Appendix 1: Market Area Characteristics and Lifestyle Analysis
Page 3
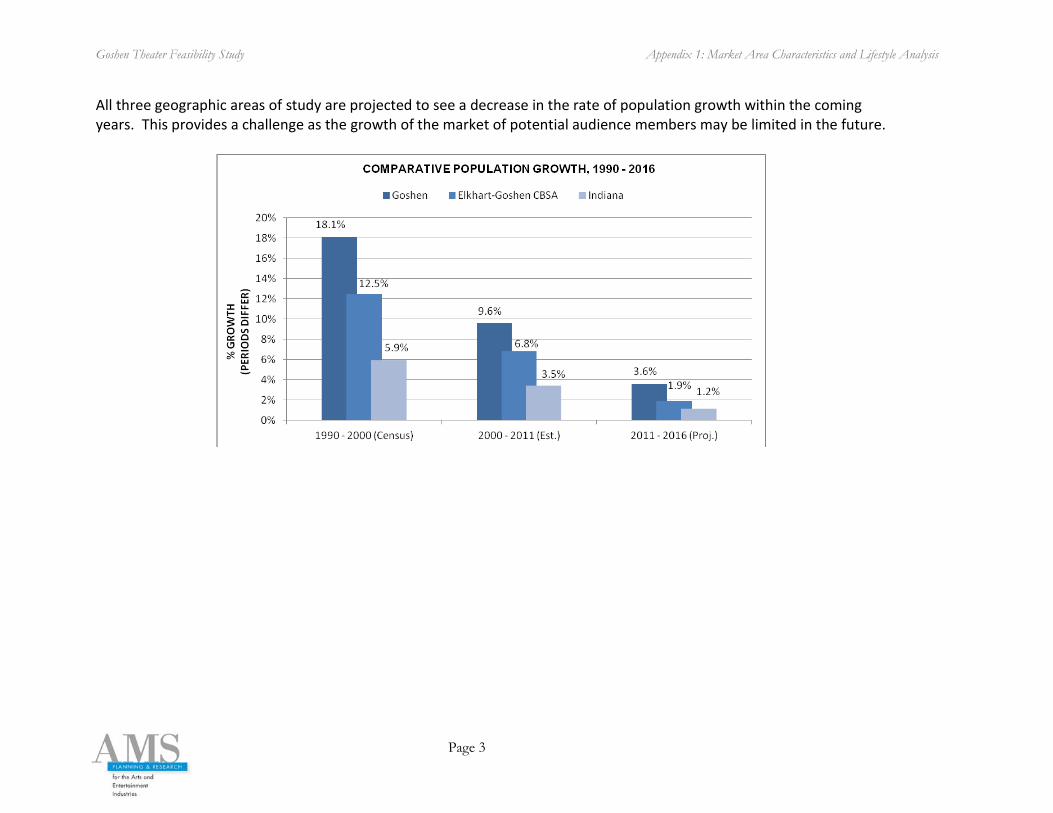
All three geographic areas of study are projected to see a decrease in the rate of population growth within the coming years. This provides a challenge as the growth of the market of potential audience members may be limited in the future.
Goshen Theater Feasibility Study Appendix 1: Market Area Characteristics and Lifestyle Analysis
Page 4
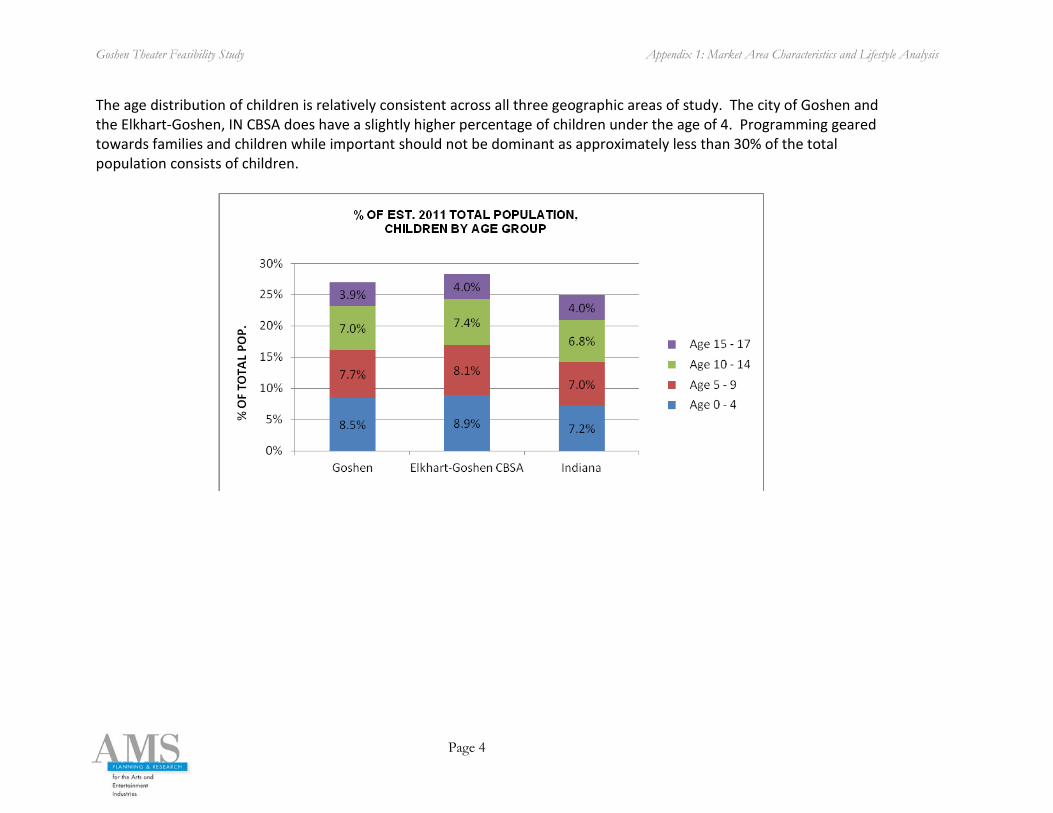
The age distribution of children is relatively consistent across all three geographic areas of study. The city of Goshen and the Elkhart-Goshen, IN CBSA does have a slightly higher percentage of children under the age of 4. Programming geared towards families and children while important should not be dominant as approximately less than 30% of the total population consists of children.
Goshen Theater Feasibility Study Appendix 1: Market Area Characteristics and Lifestyle Analysis
Page 5
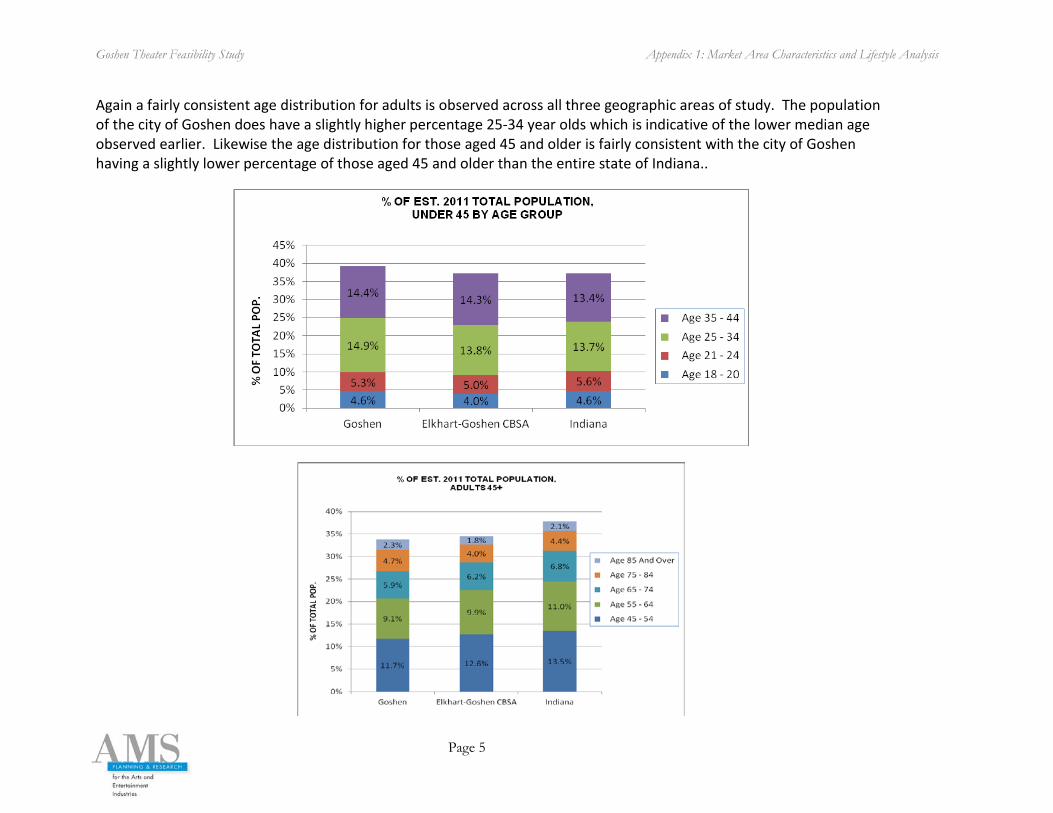
Again a fairly consistent age distribution for adults is observed across all three geographic areas of study. The population of the city of Goshen does have a slightly higher percentage 25-34 year olds which is indicative of the lower median age observed earlier. Likewise the age distribution for those aged 45 and older is fairly consistent with the city of Goshen having a slightly lower percentage of those aged 45 and older than the entire state of Indiana..
Goshen Theater Feasibility Study Appendix 1: Market Area Characteristics and Lifestyle Analysis
Page 6
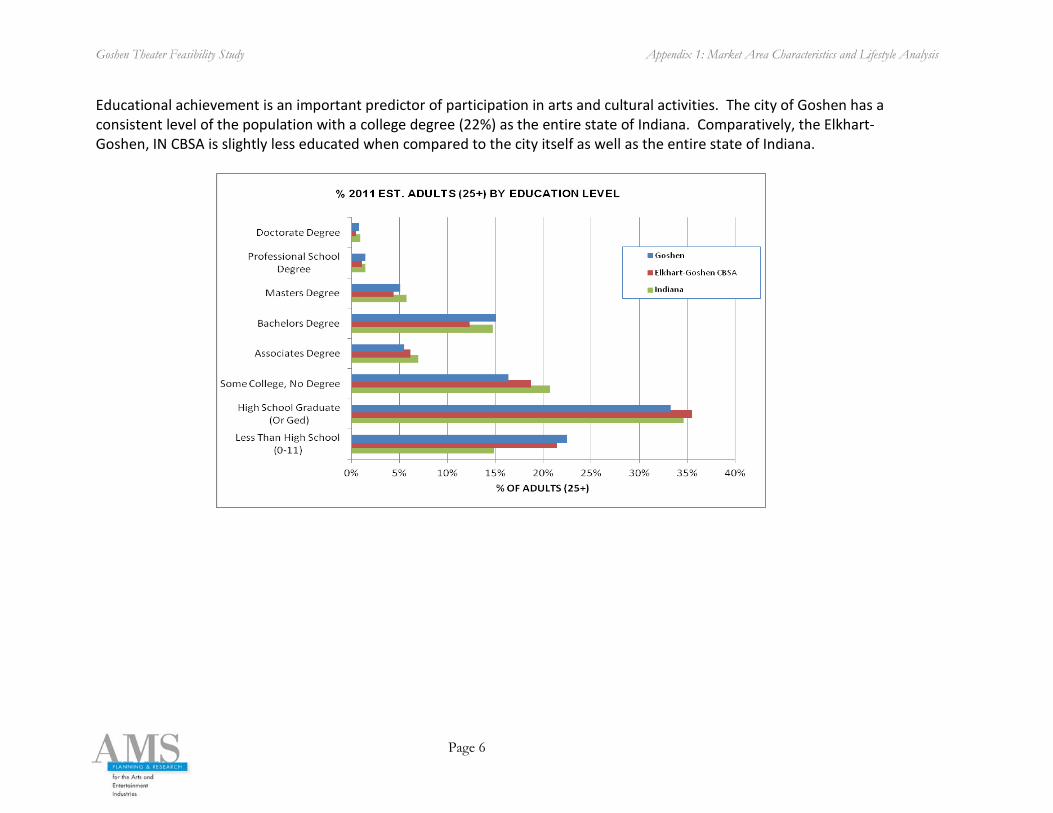
Educational achievement is an important predictor of participation in arts and cultural activities. The city of Goshen has a consistent level of the population with a college degree (22%) as the entire state of Indiana. Comparatively, the Elkhart-Goshen, IN CBSA is slightly less educated when compared to the city itself as well as the entire state of Indiana.
Goshen Theater Feasibility Study Appendix 1: Market Area Characteristics and Lifestyle Analysis
Page 7
The city of Goshen has a slightly higher median income than the other two geographic areas of study at $43,610.
Goshen Theater Feasibility Study Appendix 1: Market Area Characteristics and Lifestyle Analysis
Page 8
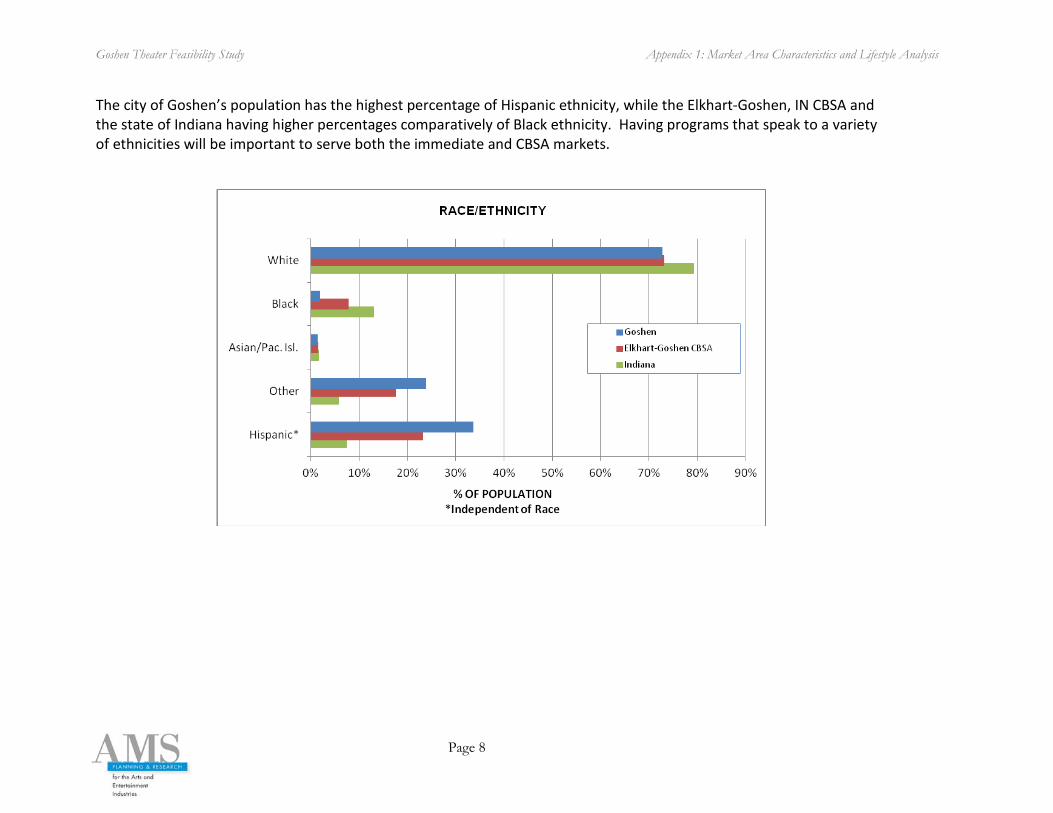
The city of Goshen’s population has the highest percentage of Hispanic ethnicity, while the Elkhart-Goshen, IN CBSA and the state of Indiana having higher percentages comparatively of Black ethnicity. Having programs that speak to a variety of ethnicities will be important to serve both the immediate and CBSA markets.
Goshen Theater Feasibility Study Appendix 1: Market Area Characteristics and Lifestyle Analysis
Page 9
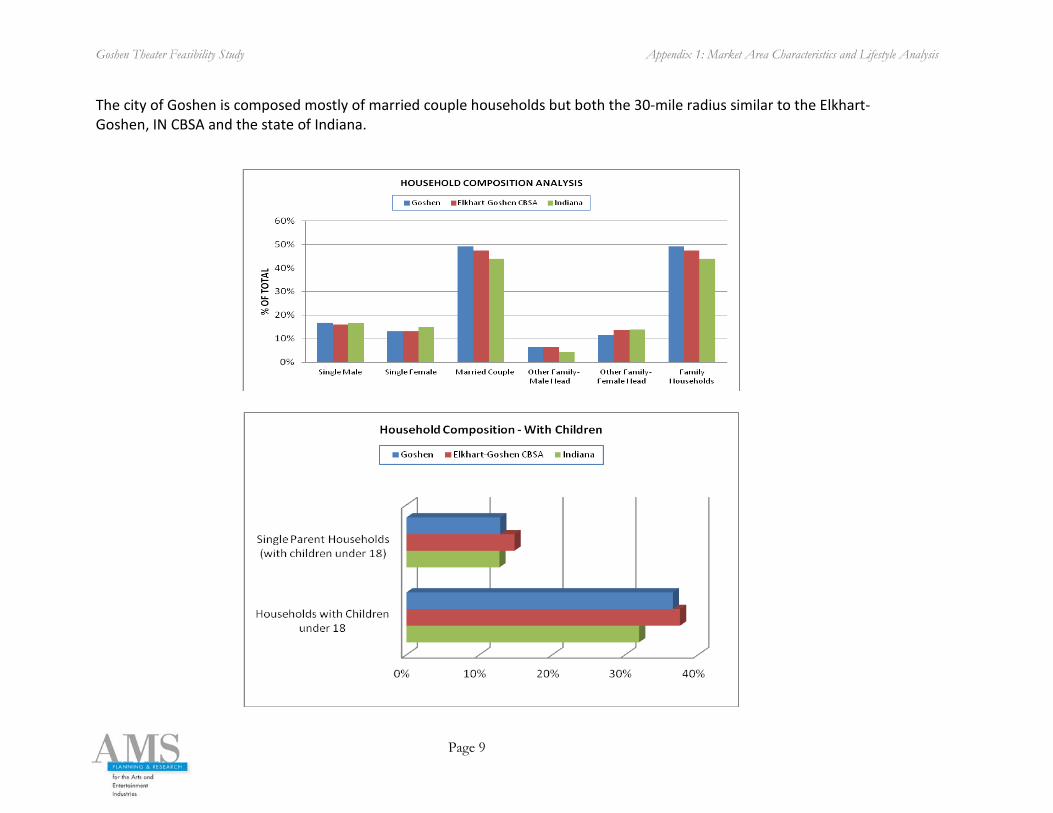
The city of Goshen is composed mostly of married couple households but both the 30-mile radius similar to the Elkhart-Goshen, IN CBSA and the state of Indiana.
Goshen Theater Feasibility Study Appendix 1: Market Area Characteristics and Lifestyle Analysis
Page 10
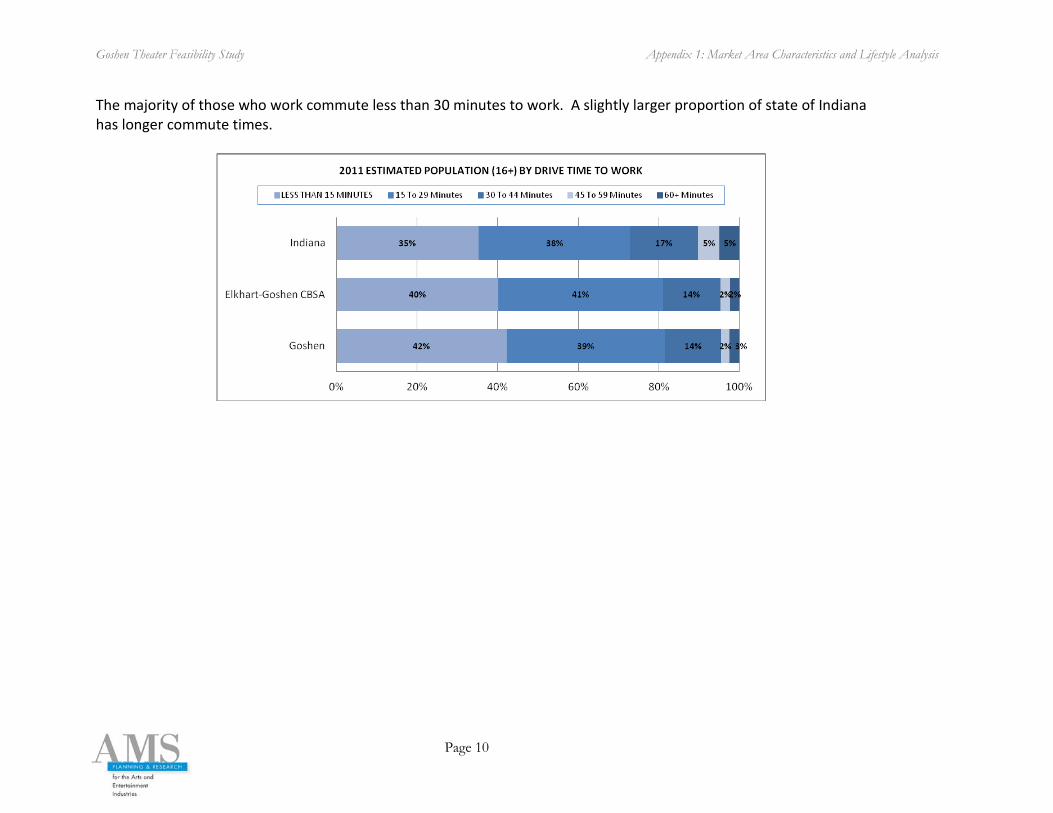
The majority of those who work commute less than 30 minutes to work. A slightly larger proportion of state of Indiana has longer commute times.
Goshen Theater Feasibility Study Appendix 1: Market Area Characteristics and Lifestyle Analysis
Page 11
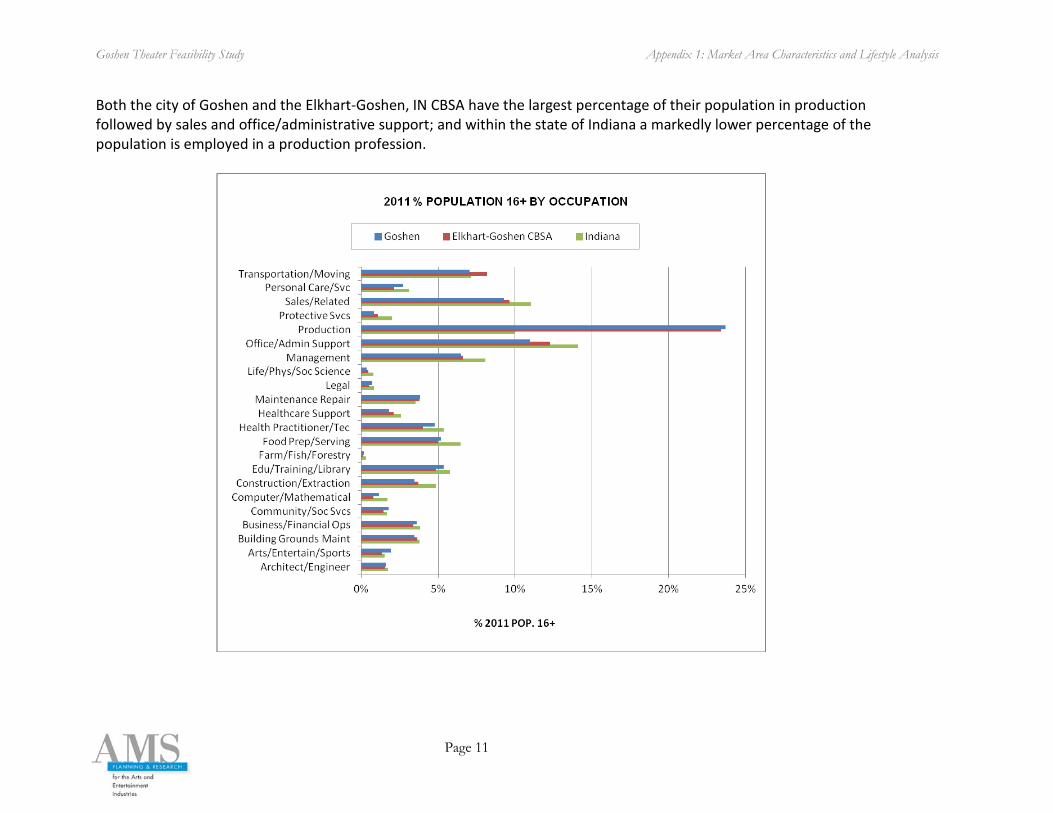
Both the city of Goshen and the Elkhart-Goshen, IN CBSA have the largest percentage of their population in production followed by sales and office/administrative support; and within the state of Indiana a markedly lower percentage of the population is employed in a production profession.
Goshen Theater Feasibility Study Appendix 1: Market Area Characteristics and Lifestyle Analysis
Page 12
Lifestyles Beyond demographics, another useful approach to understanding a market is to look at its “lifestyles.” By identifying homogenous groups of households within a market area, it is possible to target potential households who might be interested in arts and cultural programming. These homogenous groups, or “segments,” are determined by aggregating households with similar demographic and lifestyle characteristics.
PrizmNE, a market segmentation system developed by The Nielsen Corporation, is a geographically-based market analysis system that augments demographic data with consumer information. The analysis system classifies every household in the United States into unique market segments. Each market segment consists of households that are at similar stages in their life cycle and share common interests, purchasing patterns, financial behavior and demands for products and services, including cultural activities.
The classification system was created by combining information from the Equifax Consumer Marketing Database with US Census demographic data. Over 100 unique characteristics for more than 160 million individual consumers are used, including financial and consumer activity, demographic, socioeconomic, leisure activity and housing data.
PRIZMNE groups are clusters of PRIZMNE segments. Social Groups are arranged into fourteen categories based on urbanization and affluence (“SER” or socioeconomic rank). Lifestage groups are arranged into eleven categories based on age, presence of children and SER (socioeconomic rank). PRIZMNE segments are the 66 unique lifestyle segments.
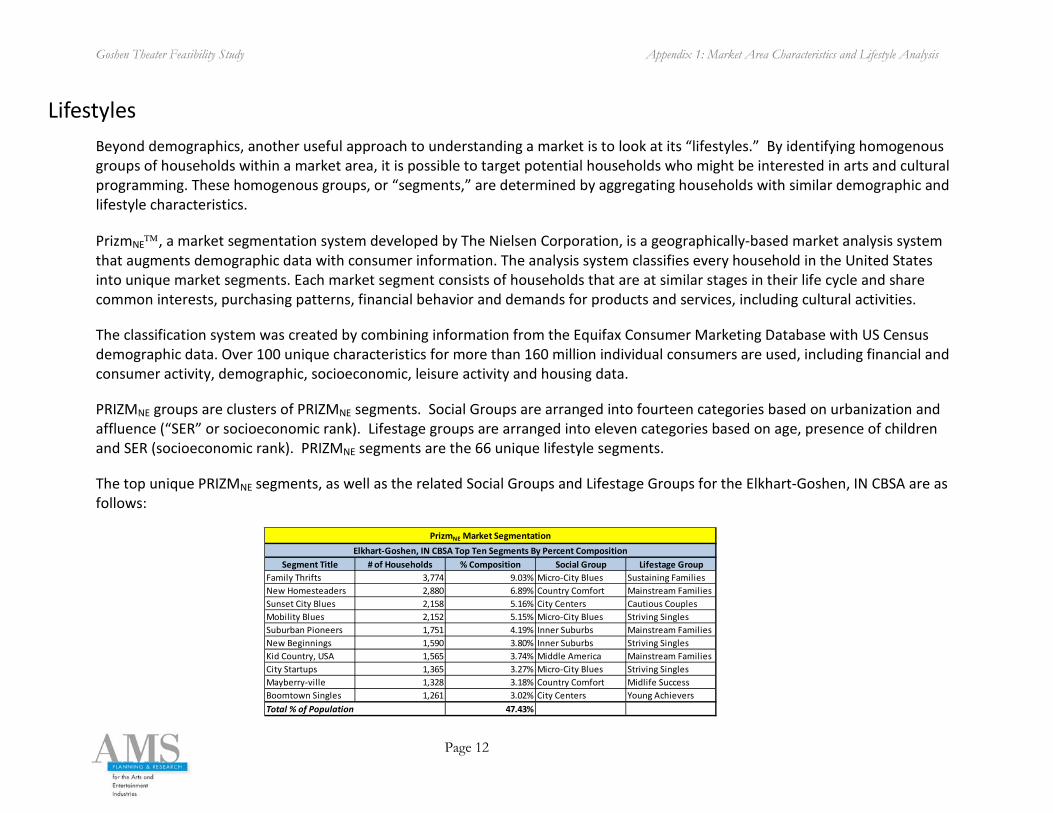
The top unique PRIZMNE segments, as well as the related Social Groups and Lifestage Groups for the Elkhart-Goshen, IN CBSA are as follows:
Segment Title # of Households % Composition Social Group Lifestage GroupFamily Thrifts 3,774 9.03% Micro-City Blues Sustaining FamiliesNew Homesteaders 2,880 6.89% Country Comfort Mainstream FamiliesSunset City Blues 2,158 5.16% City Centers Cautious CouplesMobility Blues 2,152 5.15% Micro-City Blues Striving SinglesSuburban Pioneers 1,751 4.19% Inner Suburbs Mainstream FamiliesNew Beginnings 1,590 3.80% Inner Suburbs Striving SinglesKid Country, USA 1,565 3.74% Middle America Mainstream FamiliesCity Startups 1,365 3.27% Micro-City Blues Striving SinglesMayberry-ville 1,328 3.18% Country Comfort Midlife SuccessBoomtown Singles 1,261 3.02% City Centers Young AchieversTotal % of Population 47.43%
PrizmNE Market SegmentationElkhart-Goshen, IN CBSA Top Ten Segments By Percent Composition
Goshen Theater Feasibility Study Appendix 1: Market Area Characteristics and Lifestyle Analysis
Page 13
Almost 48% of the Elkhart-Goshen, IN CBSA falls into one of 10 PRIZMNE segments, descriptions of which can be found below:
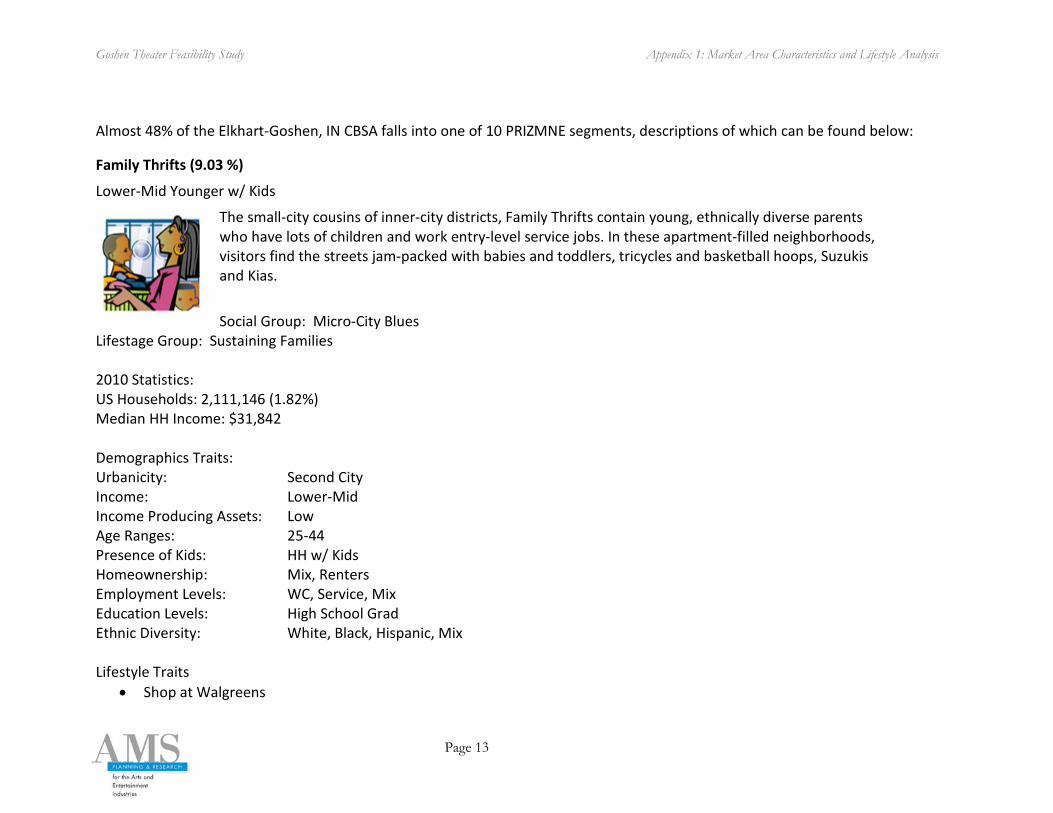
Family Thrifts (9.03 %)
Lower-Mid Younger w/ Kids
The small-city cousins of inner-city districts, Family Thrifts contain young, ethnically diverse parents who have lots of children and work entry-level service jobs. In these apartment-filled neighborhoods, visitors find the streets jam-packed with babies and toddlers, tricycles and basketball hoops, Suzukis and Kias.
Social Group: Micro-City Blues
Lifestage Group: Sustaining Families 2010 Statistics: US Households: 2,111,146 (1.82%) Median HH Income: $31,842 Demographics Traits: Urbanicity: Second City Income: Lower-Mid Income Producing Assets: Low Age Ranges: 25-44 Presence of Kids: HH w/ Kids Homeownership: Mix, Renters Employment Levels: WC, Service, Mix Education Levels: High School Grad Ethnic Diversity: White, Black, Hispanic, Mix Lifestyle Traits
• Shop at Walgreens
Goshen Theater Feasibility Study Appendix 1: Market Area Characteristics and Lifestyle Analysis
Page 14
• Buy large baby dolls • Read Life & Style • Watch Noticiero Univision • Suzuki Cars
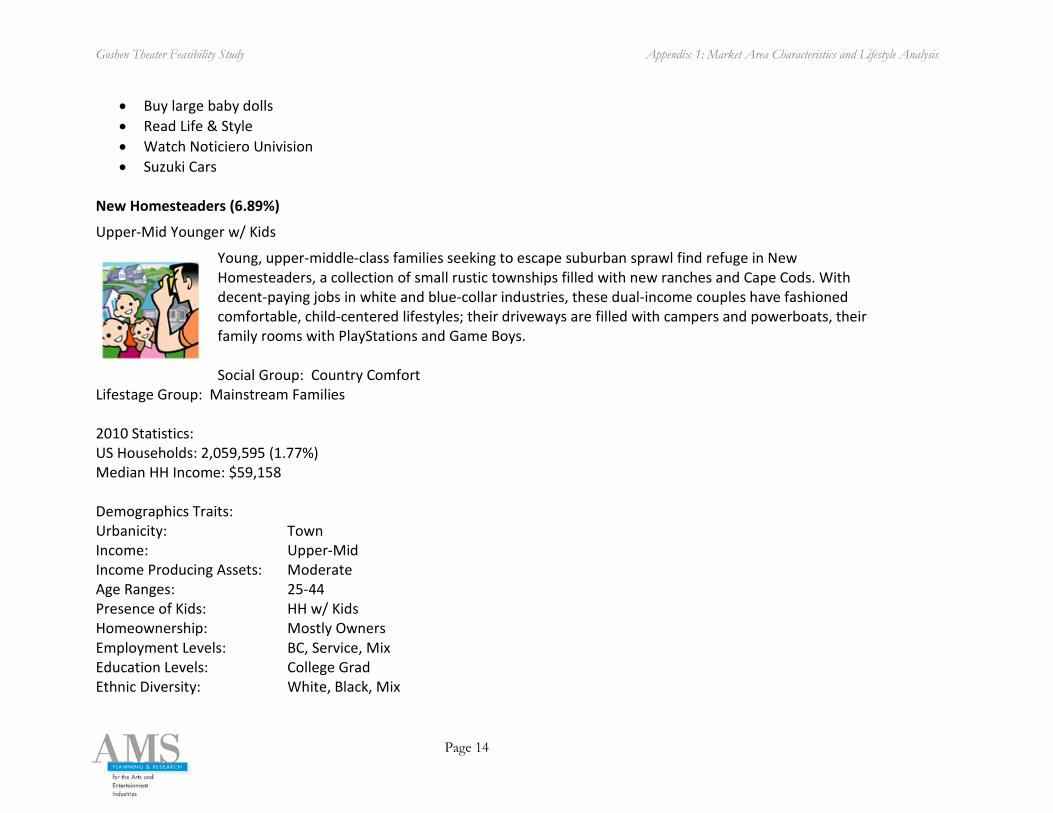
New Homesteaders (6.89%)
Upper-Mid Younger w/ Kids
Young, upper-middle-class families seeking to escape suburban sprawl find refuge in New Homesteaders, a collection of small rustic townships filled with new ranches and Cape Cods. With decent-paying jobs in white and blue-collar industries, these dual-income couples have fashioned comfortable, child-centered lifestyles; their driveways are filled with campers and powerboats, their family rooms with PlayStations and Game Boys. Social Group: Country Comfort
Lifestage Group: Mainstream Families 2010 Statistics: US Households: 2,059,595 (1.77%) Median HH Income: $59,158 Demographics Traits: Urbanicity: Town Income: Upper-Mid Income Producing Assets: Moderate Age Ranges: 25-44 Presence of Kids: HH w/ Kids Homeownership: Mostly Owners Employment Levels: BC, Service, Mix Education Levels: College Grad Ethnic Diversity: White, Black, Mix
Goshen Theater Feasibility Study Appendix 1: Market Area Characteristics and Lifestyle Analysis
Page 15
Lifestyle Traits • Shop at Best Buy • Buy toys • Read American Baby • Watch Cartoon Network • Chevrolet Uplander Flex Fuel
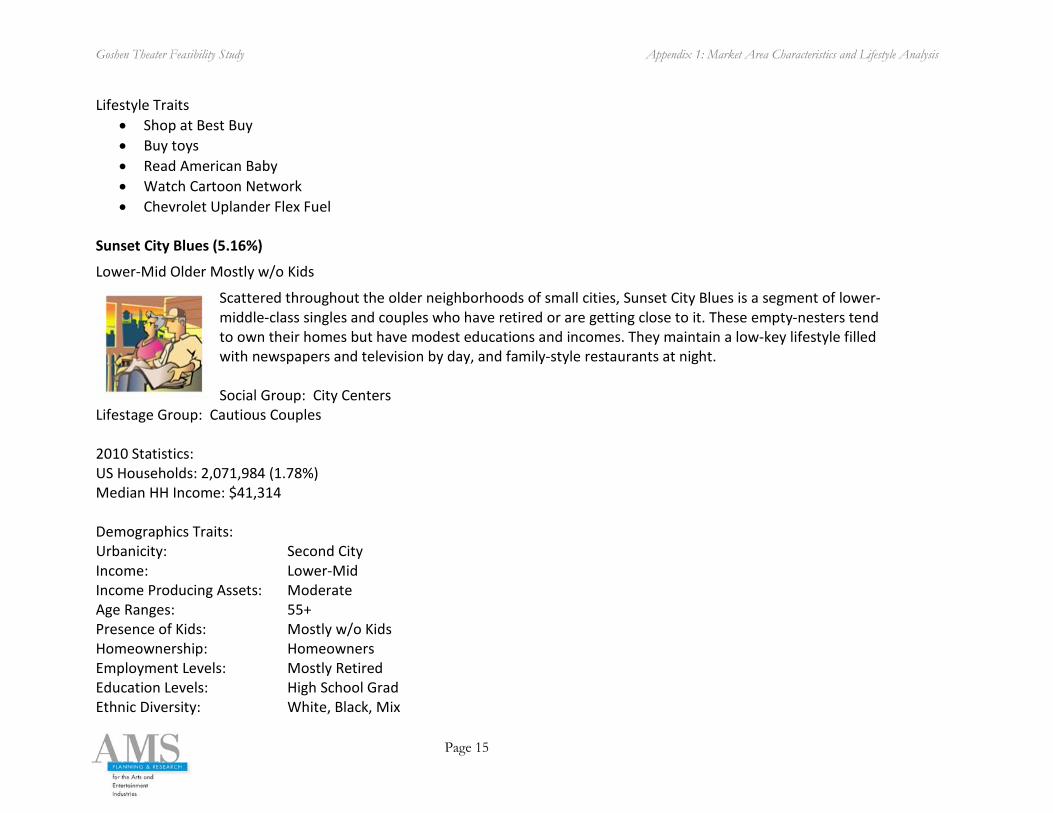
Sunset City Blues (5.16%)
Lower-Mid Older Mostly w/o Kids
Scattered throughout the older neighborhoods of small cities, Sunset City Blues is a segment of lower-middle-class singles and couples who have retired or are getting close to it. These empty-nesters tend to own their homes but have modest educations and incomes. They maintain a low-key lifestyle filled with newspapers and television by day, and family-style restaurants at night. Social Group: City Centers
Lifestage Group: Cautious Couples 2010 Statistics: US Households: 2,071,984 (1.78%) Median HH Income: $41,314 Demographics Traits: Urbanicity: Second City Income: Lower-Mid Income Producing Assets: Moderate Age Ranges: 55+ Presence of Kids: Mostly w/o Kids Homeownership: Homeowners Employment Levels: Mostly Retired Education Levels: High School Grad Ethnic Diversity: White, Black, Mix
Goshen Theater Feasibility Study Appendix 1: Market Area Characteristics and Lifestyle Analysis
Page 16
Lifestyle Traits
• Order from QVC • Collect coins • Read Ladies' Home Journal • Watch One Life to Live • Kia Borrego
Mobility Blues (5.15%)
Downscale Younger w/o Kids
Mobility Blues is a segment of younger singles in working-class neighborhoods in America's satellite cities. Ethnically diverse, these transient Americans tend to have modest lifestyles due to their downscale jobs. Surveys show they excel in going to movies, playing basketball, and shooting pool. Social Group: Micro-City Blues Lifestage Group: Striving Singles
2010 Statistics: US Households: 1,501,362 (1.29%) Median HH Income: $30,719 Demographics Traits: Urbanicity: Second City Income: Downscale Income Producing Assets: Low Age Ranges: <35 Presence of Kids: HH w/o Kids Homeownership: Mix, Renters Employment Levels: WC, Service, Mix Education Levels: Some College Ethnic Diversity: White, Black, Hispanic, Mix
Goshen Theater Feasibility Study Appendix 1: Market Area Characteristics and Lifestyle Analysis
Page 17
Lifestyle Traits
• Shop at Circuit City • Go whitewater rafting • Read WWE Magazine • Watch Telemundo • Hundai Tiburon
Suburban Pioneers (4.19%)
Downscale Middle Age Family Mix
Suburban Pioneers represents one of the nation's eclectic lifestyles, a mix of singles, recent divorcees, and single parents who have moved into older, inner-ring suburbs. They live in aging homes and garden-style apartment buildings, where the jobs are scarce and the money is tight. But what unites these residents--a diverse mix of whites, Asians, Hispanics, and African-Americans--is a working-class sensibility and an appreciation for their off-the-beaten-track neighborhoods.
Social Group: Inner Suburbs Lifestage Group: Mainstream Families 2010 Statistics: US Households: 1,219,638 (1.05%) Median HH Income: $35,221 Demographics Traits: Urbanicity: Suburban Income: Downscale Income Producing Assets: Below Avg. Age Ranges: <55 Presence of Kids: Family Mix Homeownership: Homeowners Employment Levels: WC, Service, Mix
Goshen Theater Feasibility Study Appendix 1: Market Area Characteristics and Lifestyle Analysis
Page 18
Education Levels: Some College Ethnic Diversity: White, Black, Asian, Hispanic Lifestyle Traits
• Shop at Lane Bryant • Mail order toys • Read OK! Magazine • Watch Sabado Gigante • Dodge Charger
New Beginnings (3.8%)
Low Income Middle Age Family Mix
Filled with young, single adults, New Beginnings is a magnet for adults in transition. Many of its residents are twentysomething singles and couples just starting out on their career paths--or starting over after recent divorces or company transfers. Ethnically diverse--with nearly half its residents Hispanic, Asian, or African-American--New Beginnings households tend to have the modest living standards typical of transient apartment dwellers.
Social Group: Inner Suburbs Lifestage Group: Striving Singles 2010 Statistics: US Households: 1,802,267 (1.55%) Median HH Income: $32,558 Demographics Traits: Urbanicity: Suburban Income: Low Income Income Producing Assets: Low Age Ranges: <55 Presence of Kids: Family Mix
Goshen Theater Feasibility Study Appendix 1: Market Area Characteristics and Lifestyle Analysis
Page 19
Homeownership: Renters Employment Levels: WC, Service, Mix Education Levels: Some College Ethnic Diversity: White, Black, Asian, Hispanic Lifestyle Traits
• Shop at Express • Read comic books • Read Vibe • Watch Maury • Kia Spectra
Kid Country, USA (3.74%)
Lower-Mid Middle Age w/ Kids
Widely scattered throughout the nation's heartland, Kid Country, USA is a segment dominated by large families living in small towns. Predominantly white, with an above-average concentration of Hispanics, these young, working-class households include homeowners, renters, and military personnel living in base housing; about 16 percent of residents own mobile homes.
Social Group: Middle America
Lifestage Group: Mainstream Families
2010 Statistics: US Households: 1,469,685 (1.27%) Median HH Income: $44,328
Demographics Traits: Urbanicity: Town Income: Lower-Mid Income Producing Assets: Low
Goshen Theater Feasibility Study Appendix 1: Market Area Characteristics and Lifestyle Analysis
Page 20
Age Ranges: <55 Presence of Kids: HH w/ Kids Homeownership: Mix, Owners Employment Levels: WC, Service, Mix Education Levels: High School Grad Ethnic Diversity: White, Black, Hispanic, Mix Lifestyle Traits
• Order from oldnavy.com • Buy infant toys • Read Fit Pregnancy • Watch Nick at Nite • Nissan Titan Flex Fuel
City Startups (3.27%)
Low Income Younger w/o Kids
In City Startups, young, multi-ethnic singles have settled in neighborhoods filled with cheap apartments and a commercial base of cafés, bars, laundromats, and clubs that cater to twentysomethings. One of the youngest segments in America--with ten times as many college students as the national average--these neighborhoods feature low incomes and high concentrations of African-Americans.
Social Group: Micro-City Blues Lifestage Group: Striving Singles 2010 Statistics: US Households: 1,488,786 (1.28%) Median HH Income: $25,010 Demographics Traits: Urbanicity: Second City
Goshen Theater Feasibility Study Appendix 1: Market Area Characteristics and Lifestyle Analysis
Page 21
Income: Low Income Income Producing Assets: Low Age Ranges: <35 Presence of Kids: HH w/o Kids Homeownership: Renters Employment Levels: White Collar, Mix Education Levels: Some College Ethnic Diversity: White, Black, Asian, Hispanic\ Lifestyle Traits
• Shop at The Limited • Attend college football games • Read Spin • Watch Game Show Network • Suzuki Forenza
Mayberry-ville (3.18%)
Upper-Mid Older w/o Kids
Like the old Andy Griffith Show set in a quaint picturesque berg, Mayberry-ville harks back to an old-fashioned way of life. In these small towns, upper-middle-class couples like to fish and hunt during the day, and stay home and watch TV at night. With lucrative blue-collar jobs and moderately priced housing, residents use their discretionary cash to purchase boats, campers, motorcycles, and pickup trucks.
Social Group: Country Comfort Lifestage Group: Midlife Success 2010 Statistics: US Households: 2,749,917 (2.37%) Median HH Income: $56,558
Goshen Theater Feasibility Study Appendix 1: Market Area Characteristics and Lifestyle Analysis
Page 22
Demographics Traits: Urbanicity: Town/Rural Income: Upper-Mid Income Producing Assets: Above Avg. Age Ranges: 45-64 Presence of Kids: HH w/o Kids Homeownership: Mostly Owners Employment Levels: WC, Service, Mix Education Levels: High School Grad Ethnic Diversity: White Lifestyle Traits
• Shop at Sherwin-Williams • Go hunting with a gun • Read Bassmaster • Watch Daytona 500 • GMC Sierra Diesel
Boomtown Singles (3.02%)
Lower-Mid Middle Age w/o Kids
Affordable housing, abundant entry-level jobs, and a thriving singles scene--all have given rise to the Boomtown Singles segment in fast-growing satellite cities. Single, and working-class, these residents pursue active lifestyles amid sprawling apartment complexes, bars, convenience stores, and laundromats. Social Group: City Centers
Lifestage Group: Young Achievers 2010 Statistics: US Households: 1,610,499 (1.39%) Median HH Income: $41,971
Goshen Theater Feasibility Study Appendix 1: Market Area Characteristics and Lifestyle Analysis
Page 23
Demographics Traits: Urbanicity: Second City Income: Lower-Mid Income Producing Assets: Below Avg. Age Ranges: <55 Presence of Kids: HH w/o Kids Homeownership: Mix, Renters Employment Levels: WC, Service, Mix Education Levels: College Grad Ethnic Diversity: White, Black, Asian, Hispanic Lifestyle Traits
• Shop at Victoria's Secret • Do Karate • Read Elle • Watch VH1 • Suzuki SX4
Goshen Theater Feasibility Study Appendix 1: Market Area Characteristics and Lifestyle Analysis
Page 24
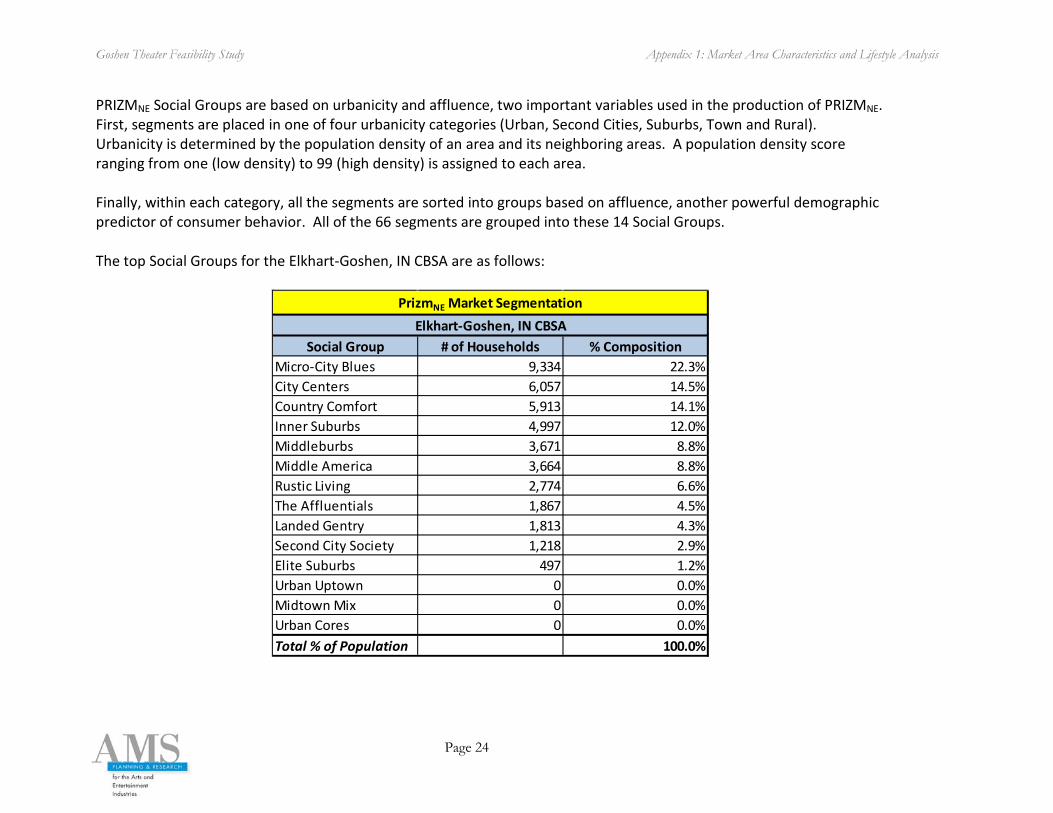
PRIZMNE Social Groups are based on urbanicity and affluence, two important variables used in the production of PRIZMNE. First, segments are placed in one of four urbanicity categories (Urban, Second Cities, Suburbs, Town and Rural). Urbanicity is determined by the population density of an area and its neighboring areas. A population density score ranging from one (low density) to 99 (high density) is assigned to each area. Finally, within each category, all the segments are sorted into groups based on affluence, another powerful demographic predictor of consumer behavior. All of the 66 segments are grouped into these 14 Social Groups. The top Social Groups for the Elkhart-Goshen, IN CBSA are as follows:
Social Group # of Households % CompositionMicro-City Blues 9,334 22.3%City Centers 6,057 14.5%Country Comfort 5,913 14.1%Inner Suburbs 4,997 12.0%Middleburbs 3,671 8.8%Middle America 3,664 8.8%Rustic Living 2,774 6.6%The Affluentials 1,867 4.5%Landed Gentry 1,813 4.3%Second City Society 1,218 2.9%Elite Suburbs 497 1.2%Urban Uptown 0 0.0%Midtown Mix 0 0.0%Urban Cores 0 0.0%Total % of Population 100.0%
PrizmNE Market SegmentationElkhart-Goshen, IN CBSA
Goshen Theater Feasibility Study Appendix 1: Market Area Characteristics and Lifestyle Analysis
Page 25
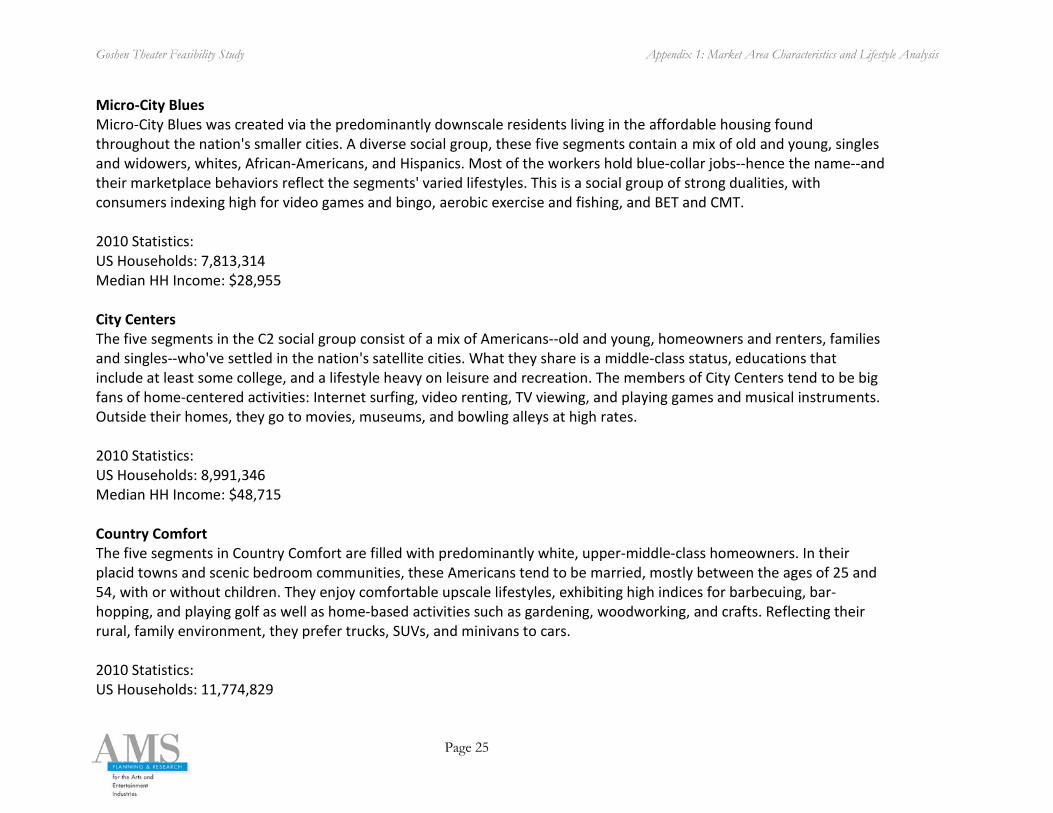
Micro-City Blues Micro-City Blues was created via the predominantly downscale residents living in the affordable housing found throughout the nation's smaller cities. A diverse social group, these five segments contain a mix of old and young, singles and widowers, whites, African-Americans, and Hispanics. Most of the workers hold blue-collar jobs--hence the name--and their marketplace behaviors reflect the segments' varied lifestyles. This is a social group of strong dualities, with consumers indexing high for video games and bingo, aerobic exercise and fishing, and BET and CMT. 2010 Statistics: US Households: 7,813,314 Median HH Income: $28,955 City Centers The five segments in the C2 social group consist of a mix of Americans--old and young, homeowners and renters, families and singles--who've settled in the nation's satellite cities. What they share is a middle-class status, educations that include at least some college, and a lifestyle heavy on leisure and recreation. The members of City Centers tend to be big fans of home-centered activities: Internet surfing, video renting, TV viewing, and playing games and musical instruments. Outside their homes, they go to movies, museums, and bowling alleys at high rates. 2010 Statistics: US Households: 8,991,346 Median HH Income: $48,715 Country Comfort The five segments in Country Comfort are filled with predominantly white, upper-middle-class homeowners. In their placid towns and scenic bedroom communities, these Americans tend to be married, mostly between the ages of 25 and 54, with or without children. They enjoy comfortable upscale lifestyles, exhibiting high indices for barbecuing, bar-hopping, and playing golf as well as home-based activities such as gardening, woodworking, and crafts. Reflecting their rural, family environment, they prefer trucks, SUVs, and minivans to cars. 2010 Statistics: US Households: 11,774,829
Goshen Theater Feasibility Study Appendix 1: Market Area Characteristics and Lifestyle Analysis
Page 26
Median HH Income: $58,867 Inner Suburbs The four segments in the Inner Suburbs social group are concentrated in the inner-ring suburbs of major metros--areas where residents tend to be high school educated, unmarried, and downscale. There's diversity in this group, with segments that are racially mixed, divided evenly between homeowners and renters, and filled with households that are either young or aging in place. However, the consumer behavior of the S4 segments is dominated by older Americans who enjoy social activities at veterans clubs and fraternal orders, TV news and talk shows, and shopping at discount department stores. 2010 Statistics: US Households: 5,357,150 Median HH Income: $34,040
Goshen Theater Feasibility Study Appendix 1: Market Area Characteristics and Lifestyle Analysis
Page 27
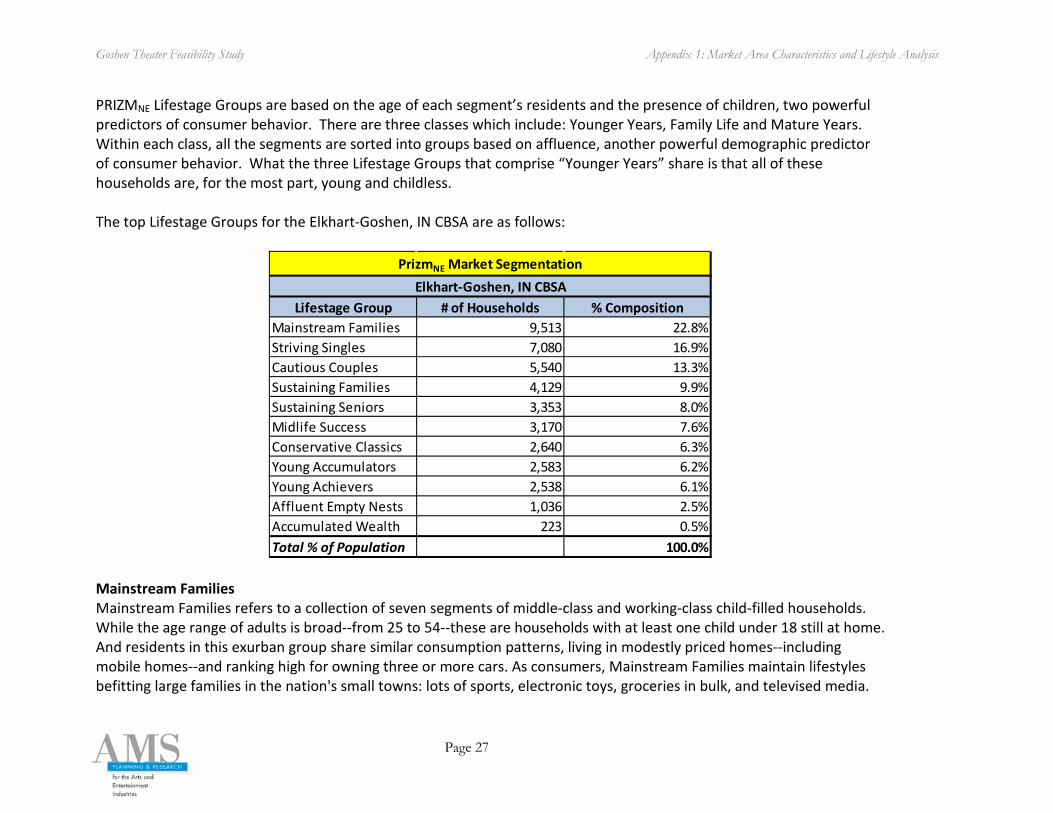
PRIZMNE Lifestage Groups are based on the age of each segment’s residents and the presence of children, two powerful predictors of consumer behavior. There are three classes which include: Younger Years, Family Life and Mature Years. Within each class, all the segments are sorted into groups based on affluence, another powerful demographic predictor of consumer behavior. What the three Lifestage Groups that comprise “Younger Years” share is that all of these households are, for the most part, young and childless. The top Lifestage Groups for the Elkhart-Goshen, IN CBSA are as follows:
Lifestage Group # of Households % CompositionMainstream Families 9,513 22.8%Striving Singles 7,080 16.9%Cautious Couples 5,540 13.3%Sustaining Families 4,129 9.9%Sustaining Seniors 3,353 8.0%Midlife Success 3,170 7.6%Conservative Classics 2,640 6.3%Young Accumulators 2,583 6.2%Young Achievers 2,538 6.1%Affluent Empty Nests 1,036 2.5%Accumulated Wealth 223 0.5%Total % of Population 100.0%
PrizmNE Market SegmentationElkhart-Goshen, IN CBSA
Mainstream Families Mainstream Families refers to a collection of seven segments of middle-class and working-class child-filled households. While the age range of adults is broad--from 25 to 54--these are households with at least one child under 18 still at home. And residents in this exurban group share similar consumption patterns, living in modestly priced homes--including mobile homes--and ranking high for owning three or more cars. As consumers, Mainstream Families maintain lifestyles befitting large families in the nation's small towns: lots of sports, electronic toys, groceries in bulk, and televised media.
Goshen Theater Feasibility Study Appendix 1: Market Area Characteristics and Lifestyle Analysis
Page 28
2010 Statistics: US Households: 13,660,001 Median HH Income: $48,719 Striving Singles The seven segments in Striving Singles make up the most downscale of the Younger Years class. Centered in exurban towns and satellite cities, these twenty-something singles typically have low incomes--often under $30,000 a year--from service jobs or part-time work they take on while going to college. Housing for this group consists of a mix of cheap apartment complexes, dormitories, and mobile homes. As consumers, the residents in these segments score high for outdoor sports, movies and music, fast food, and inexpensive cars. 2010 Statistics: US Households: 12,465,431 Median HH Income: $34,647 Cautious Couples Another large group of Mature Years segments is Cautious Couples, featuring an over-55-year-old mix of singles, couples, and widows. Widely scattered throughout the nation, the residents in these seven segments typically are working-class and white, with some college education and a high rate of homeownership. Given their blue-collar roots, Cautious Couples today pursue sedate lifestyles. They have high rates for reading, travel, eating out at family restaurants, and pursuing home-based hobbies like coin collecting and gardening. 2010 Statistics: US Households: 12,179,381 Median HH Income: $43,334 PRIZMNE profiles can be compared to the PRIZMNE profiles of consumers of other products and services to develop lifestyle attributes. These profiles index against the profiles of consumers of other products and services in the following categories:
Goshen Theater Feasibility Study Appendix 1: Market Area Characteristics and Lifestyle Analysis
Page 29
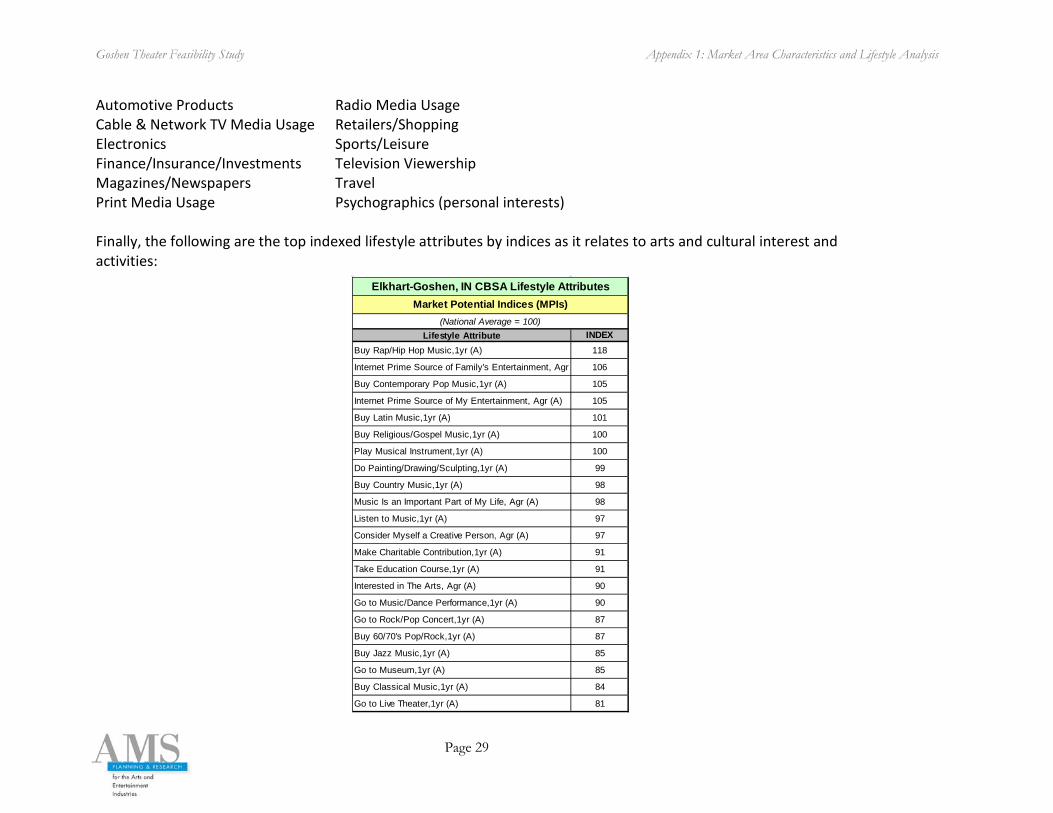
Automotive Products Radio Media Usage Cable & Network TV Media Usage Retailers/Shopping Electronics Sports/Leisure Finance/Insurance/Investments Television Viewership Magazines/Newspapers Travel Print Media Usage Psychographics (personal interests) Finally, the following are the top indexed lifestyle attributes by indices as it relates to arts and cultural interest and activities:
Lifestyle Attribute INDEXBuy Rap/Hip Hop Music,1yr (A) 118
Internet Prime Source of Family's Entertainment, Agr 106
Buy Contemporary Pop Music,1yr (A) 105
Internet Prime Source of My Entertainment, Agr (A) 105
Buy Latin Music,1yr (A) 101
Buy Religious/Gospel Music,1yr (A) 100
Play Musical Instrument,1yr (A) 100
Do Painting/Drawing/Sculpting,1yr (A) 99
Buy Country Music,1yr (A) 98
Music Is an Important Part of My Life, Agr (A) 98
Listen to Music,1yr (A) 97
Consider Myself a Creative Person, Agr (A) 97
Make Charitable Contribution,1yr (A) 91
Take Education Course,1yr (A) 91
Interested in The Arts, Agr (A) 90
Go to Music/Dance Performance,1yr (A) 90
Go to Rock/Pop Concert,1yr (A) 87
Buy 60/70's Pop/Rock,1yr (A) 87
Buy Jazz Music,1yr (A) 85
Go to Museum,1yr (A) 85
Buy Classical Music,1yr (A) 84
Go to Live Theater,1yr (A) 81
Elkhart-Goshen, IN CBSA Lifestyle AttributesMarket Potential Indices (MPIs)
(National Average = 100)