Embed Size (px)
Citation preview

Goniophotometry and assessment of
bidirectional photometric properties of
complex fenestration systems
Marilyne Andersen a,∗, Jan de Boer b
aBuilding Technology Program, Department of Architecture, MassachusettsInstitute of Technology, Room 5-418, 77 Massachusetts Avenue, Cambridge, MA
02139-4307, USAbFraunhofer-Institute for Building Physics, Nobelstrasse 12, 70569 Stuttgart,
Germany
Abstract
This paper seeks to provide an overview of the currently available assessmenttools for Bidirectional Transmission or Reflection Distribution Functions (BTDFs,BRDFs) of complex fenestration systems (CFS). In the first part of the paper, theexisting experimental devices (goniophotometers) developed specifically for CFSmeasurement are described. All but two are based on a scanning process to inves-tigate the emerging light flux distribution, the alternative approach being based ondigital imaging techniques. A critical analysis of their advantages and shortcomingsis proposed to provide both researchers interested in replicating them and moregenerally potential users of BTDF or BRDF data with a lucid idea of the availableoptions.
The second part presents an alternative to physical measurements, made possibleby using computer simulations based on ray-tracing techniques. In this case, everycomponent of the modelled system must be of well-known geometric and materialproperties. Three virtual goniophotometer models are described and their validationresults are analyzed.
Whether they have been generated experimentally or through simulation, BTDFand BRDF data need to be processed into transmission or reflection functions thatare directly related to sky and room conditions for them to be usable. The thirdpart of the paper introduces a new BT(R)DF database management system whoseaim is to become a reference resource for viewing and interpreting these complexdata. The main visualization features of its interface are presented, that include aspecial focus on flexibility and on providing intuitive graphical information, in asimilar way as for luminaires selection in electric lighting design.
Key words: Bidirectional Transmission (Reflection) Distribution Function(BTDF, BRDF), Goniophotometer, Ray-tracing, Daylighting simulation tool,
Preprint submitted to Elsevier Science 3 March 2006

Advanced windows
1 Introduction
To allow an efficient integration of complex fenestration systems (CFS) inbuildings, a detailed knowledge of their directional optical properties is nec-essary. The latter are described by Bidirectional Transmission (or Reflection)Distribution Functions, abbreviated BT(or R)DF, that express the emerginglight distribution for a given incident direction [1]. Having access to such de-tailed transmission or reflection functions will help manufacturers to developand optimize their products and architects in selecting the latter judiciouslyalready at the project’s level [2, 3]. It will also help daylighting simulation tooldesigners to improve their programs’ performances [4, 5, 6, 7, 8] and achievea reliable modelling of light propagation into rooms using CFS.
A serious effort has been made in developing accurate and efficient bidirec-tional goniophotometric devices for detailed studies of such systems, capableof measuring BTDFs and/or BRDFs in an appropriate way. The existing in-struments are described in this paper 1 , the vast majority being based on ascanning process (i.e. on relative individual movements of the detector) and acouple being based on a different approach, that relies on digital imaging tech-niques for detection. The advantages and shortcomings of each approach areanalyzed. For each of the experimental devices developed for CFS, the adoptedvalidation method and estimated accuracy on BT(R)DF data are then given,whenever documented in publications, together with a list of characterizedsystems and available bidirectional data today.
The second part of this paper focuses on virtual goniophotometers that havebeen developed, mainly based on commercial forward ray-tracing simulationtools and allowing to complement experimental assessment in a very efficientway. Indeed, such techniques allow more flexibility in parametric studies, andthe performances expected for variants (in geometry, material) of a same sys-tem can be more easily tested as long as all the parameters are known. Thedifferent existing simulation models are described, together with the valida-tion methods or comparisons that were used. A list of available bidirectionaldatasets based on ray-tracing techniques is also provided.
∗ Corresponding author. Tel: +1-617-253-7714; fax: +1-617-253-6152.Email address: [email protected] (Marilyne Andersen).URL: http://architecture.mit.edu/people/profiles/prander.html
(Marilyne Andersen).1 A more extensive review is given in [9].
2
The light transmittance through complex fenestration systems (CFS) is bydefinition angular-dependent. Therefore, the indoor light penetration schemestrongly depends on the overall outside illumination conditions as well as onthe time and space conditions. These dependencies have to be handled easilyby the designer to help him find appropriate solutions to a given problem. Forthis purpose, a flexible user-interface is introduced for BT(R)DF data in thethird part of the paper. This software aims at providing a quality-controlledsupport for CFS database management comparable to programs developedfor luminaire selection in artificial lighting design [10, 11]. As BT(R)DF datarequire both a sophisticated assessment equipment and expertise in data in-terpretation, having them gathered in one flexible database management andvisualization system will allow them to be more widely used and understood.
2 The Bidirectional Distribution Function
The Bidirectional Transmission (or Reflection) Distribution Function, abbre-viated BT(R)DF, is defined by the Commission Internationale de l’Eclairage[1] as “quotient of the luminance of the medium by the illuminance on themedium”. It is therefore angle-dependent at both the incidence and the emer-gence levels and expresses the emerging light flux distribution for a givenincident direction.
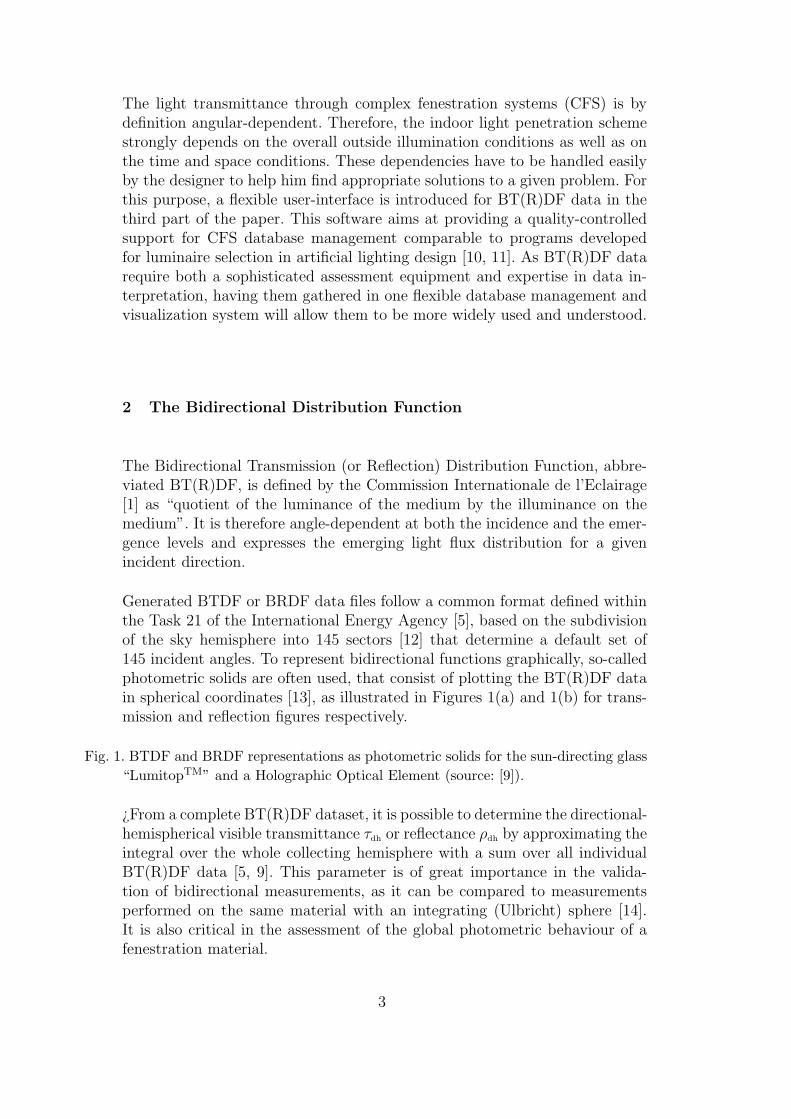
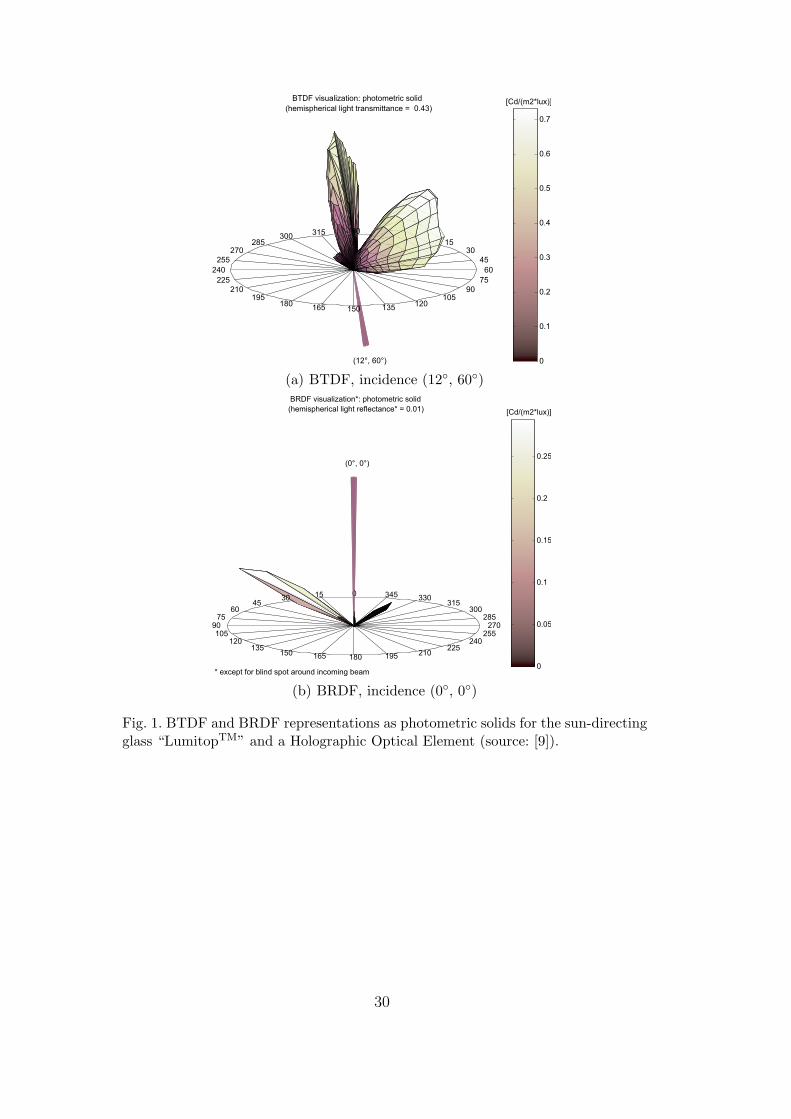
Generated BTDF or BRDF data files follow a common format defined withinthe Task 21 of the International Energy Agency [5], based on the subdivisionof the sky hemisphere into 145 sectors [12] that determine a default set of145 incident angles. To represent bidirectional functions graphically, so-calledphotometric solids are often used, that consist of plotting the BT(R)DF datain spherical coordinates [13], as illustrated in Figures 1(a) and 1(b) for trans-mission and reflection figures respectively.
Fig. 1. BTDF and BRDF representations as photometric solids for the sun-directing glass“LumitopTM” and a Holographic Optical Element (source: [9]).
¿From a complete BT(R)DF dataset, it is possible to determine the directional-hemispherical visible transmittance τdh or reflectance ρdh by approximating theintegral over the whole collecting hemisphere with a sum over all individualBT(R)DF data [5, 9]. This parameter is of great importance in the valida-tion of bidirectional measurements, as it can be compared to measurementsperformed on the same material with an integrating (Ulbricht) sphere [14].It is also critical in the assessment of the global photometric behaviour of afenestration material.
3

3 Experimental methods for goniophotometric assessment
The range of applications for bidirectional goniophotometers has broadenedincreasingly since the early nineties, especially with the strong progress madein computer graphics rendering, for which various devices have been developedspecifically [15, 16, 17]. These applications also include analyzing luminairesand lamps [18, 19, 20, 21], and characterizing ground surfaces [22, 23, 24] orsurface textures [25, 26, 27, 28]. Amongst the latter group, Dana’s paper [28]should be pointed out as it is where a BRDF with spatially-varying reflectanceover the sample surface was first defined as “BTF” for “Bidirectional TextureFunction”.
A serious effort has been made as well in developing accurate and efficientbidirectional goniophotometric devices for detailed studies of fenestration sys-tems, capable of measuring BTDFs and/or BRDFs in an appropriate way forsuch materials, and this is the category the present paper is focusing on.
These devices are almost all based on a scanning process (see Section 3.1),i.e. on relative individual movements of the sample, detector, and/or sourceto monitor all incoming and outgoing light flux directions for which BT(R)DFdata are needed. Some, however, propose a way to reduce this onerous scan-ning process by adopting a video-based approach (Section 3.2), and rely onthe detection of light through digital video capture after being collected on adevice-specific projection surface.
Independently of the investigation method (scanning or video-based), a go-niophotometer that does not analyze the spatial variation of BTDF or BRDFover the material itself (that does not produce “BTF” values [28]), will averagethis variation over the sample’s investigated area, except if it is able to isolatea given direction of emission from a larger sample area, as for the instrumentdeveloped at Cardiff University [29], described below. In any other case, it willassume that light collected on the detecting surface (the photo-sensor’s sur-face or the pixel) comes from a point (or an infinitesimal surface), even thoughrays emitted from the edges of the sample’s investigated area could typicallyalso reach the detecting surface by following a slightly different direction.
In consequence, the detection surface should be able to encompass the pos-sible divergence of the rays that reach it, which is inversely proportional tothe sample’s investigated area. This can be achieved by either choosing a sen-sor element of appropriate dimensions, or, if the detector is too small or tooclose for the investigated sample area, by defining averaging sectors of extentcomparable to the emitted rays’ spread.
If this averaging is not applied properly (within an appropriately-sized angu-
4

lar sector considering the sample’s investigated area), BT(R)DF data becomeinconsistent as they will associate luminance values to specific directions de-spite the possible spread of rays around these directions. Data obtained fora same material might then differ greatly depending on the exact sensingarea and position (unless the investigated material presents perfectly diffusingproperties).
The draw-back of this averaging is that, especially for large sample areas (thuslarge angular sectors), narrow luminance peaks in a BT(R)DF will not be pre-served, as they will be averaged with the surrounding light distribution. Thismight make local (but possibly important) issues in visual comfort and glaredifficult to reveal. The only way to preserve these peaks while keeping a largeinvestigated sample area would be to isolate emerging directions accurately[29] or measure BTFs [28].
3.1 Characterization based on a scanning process
3.1.1 Pros and Cons
The two main draw-backs of the scanning approach are the considerable mea-surement time needed for a BT(R)DF assessment (the finer the angular res-olution, the longer the procedure), and more importantly the fact that theinvestigation is discrete. A preliminary scanning is thus required for everyincident direction to locate luminous “peaks” and assess the general trans-mission and/or reflection properties of the material beforehand - lengtheningthe overall procedure even more -, while the risk of missing some significantfeature between two measurement points can never be avoided completely.
Especially for materials presenting high dynamical luminance ranges, local re-finements of the angular resolution will be necessary for the final scanning sothat interpolation between discrete data points remains reliable. Apart fromrequiring even more time to perform the measurement, these refinements makeit more difficult for simulation programs to implement the BT(R)DF data af-terwards. In addition, the estimation of the global (directional-hemispherical)transmittance or reflectance becomes delicate, as a weighing of data is thennecessary, based on the areas associated to each point; these areas are howeverdifficult to determine as they are distributed irregularly[30].
In most cases, the type of photo-sensor chosen in a scanning approach makes itrelatively easy to deduce BT(R)DF values based on the sensor’s output (volt-age, illuminance, luminance). This approach is therefore often more appealingto someone wanting to construct such an instrument and get it operationalquickly. Finally, for experimental set-ups such as the Cardiff goniospectrome-
5

ter [29], the scanning approach can present the important advantage of beingable to accurately determine the emerging light distribution’s directionality.This is discussed in the next section where this device is described.
3.1.2 Existing scanning-based goniophotometers for CFS: innovations andvalidation results
The first goniophotometer ever developed for BT(R)DF measurements of fen-estration materials was made at the Lawrence Berkeley National Laboratory(LBNL), USA in the late eighties [31]. Achieved BTDFs were used to predictthe performances of multi-layer fenestration systems, and were implementedin matrix-layer calculations to validate this analytical approach against mea-sured solar heat gain values (g-values) [32, 33, 34].Comparisons showed thatcalculated and measured SHGC data were matching to within 10% except forgrazing incident angles, which was considered highly satisfactory consideringthe many parameters involved.
An attempt of comparing BTDFs to ray-tracing calculations was made laterbut proved unsuccessful, the discrepancies between measurements and simu-lations remaining very important from both the quantitative and qualitativepoints of view [35].
At the Fraunhofer Institute for Solar Energy Systems (ISE), Freiburg, Ger-many, Apian-Bennewitz [36, 37] designed a goniophotometer allowing the sam-ple dimensions to be flexible, which was an innovation in regard to LBNL’sdevice. This device was also the first one to apply adaptive refinements inangular resolution (at the unavoidable expense of a longer, two-steps inves-tigation process) and the first one for which bidirectional results were inte-grated and validated against Ulbricht integrating sphere measurements. Thesecomparisons showed discrepancies of about 20% in general 2 . In addition tothis, a comparative study was made with ray-tracing simulations [38] on poly-mers and aerogels; directional-hemispherical transmittance comparisons hereshowed only 5% disagreement for small incident angles, increasing to 61% be-yond 60◦. An upgrade of this device is under way at ISE, with an improvedlight source and a calibrated and movable CCD camera as the detector to iden-tify details on the surface of facade elements. No publication is yet availableon the achieved or expected accuracy of the system, or its validation.
The optical consultancy company pabr-opto [39] now proposes a new gonio-photometer design with a detector fixed on an articulated arm moving aroundthe sample (for both BTDF and BRDF measurements). This apparatus ismeant to be mainly used in-house for project work and consulting jobs, but
2 Approximate value based on reading the comparison graph provided in [37].
6

the goniophotometer is also available as a custom build turn-key system. Oneof its major innovations lies in the variety of light sources that can be used(Xenon, Halogen, laser), and in its modular concept for detection (silicon,pyroelectric, thermopile covering various spectral ranges).
Another goniophotometer based on a scanning process and proposing laserbeams as a possible light source was realized at the University of TechnologySydney (UTS), Australia [40, 41]. Its mechanical concept is close to the onefound at ISE. No validation results could be found in the literature.
At the Berlin University of Technology (TUB), Germany, a former, spiral scan-ning design [42] is now being replaced by a new approach including a rotatingarc and multiple sensors. No measurements have been published yet with thisnew design.
At the TNO Building and Construction Research, Delft, The Netherlands, agoniophotometer of design very similar to the initial version of ISE’s appara-tus [36] has been developed [43, 44]. It was at first meant for characterizingtransparent-insulating (TI) materials; in 2000, it was adjusted to measureother systems as well like simple and complex glazing, plastics and shadingfabrics. Its validation was again based on integrating sphere measurementscomparisons, that led to relative discrepancies generally of 10% (20% for afew samples), except for particularly low transmittance values where discrep-ancies increased drastically [44].
At Cardiff University, UK, Breitenbach and Rosenfeld [29] proposed a ma-jor innovation in goniophotometry by adding spectral analysis capabilities.These have the important advantage of making the assessment of wavelength-selective glazings possible. In addition, a light detection system consisting ofan off-axis parabolic mirror focuses the transmitted light onto the end of anoptical fiber bundle that limits its possible divergence around a given directionto about ±0.5◦. Hence, this set-up is able to achieve a high directional accu-racy while keeping a large investigated sample area, unlike any other approach(including video-based). This technique has in fact been recently adopted atTNO as well. Cardiff’s device is now owned by the Technical University ofDenmark (DTU).
Directional-hemispherical transmittance values based on BTDF integrationwere here again compared to integrating sphere results [29], but also to an-alytic model predictions [45, 46]. The error on goniospectrometric data wasestimated to be of about 11% 3 .
3 Based on error bars and discussion found in references [45, 29, 46].
7
The main features of these devices are summarized in Table 1, together withthose relying on digital imaging.
3.2 Characterization using digital video techniques combined with a projec-tion principle
The use of Charge-Coupled Device (CCD) cameras allows one to achieve afine investigation of the materials while maintaining an appreciable flexibilityand time-efficiency in data acquisition and processing. One of its greatestadvantages is to allow the visualization of many directions or locations at thesame time. Examples of video-photometers and mapping luminance-metersresorting to digital imaging are numerous [47, 48, 49, 50, 51, 52].
To avoid having to move from one acquisition position to the next one with aCCD camera, this image-based detection can be combined with a projectionprinciple.
3.2.1 Pros and cons
Choosing to point an imaging detector towards a projection surface to assessBT(R)DFs allows time-efficiency to be tremendously improved compared to ascanning approach as a single digital image will cover thousands of emergingdirections. This major advantage is combined with an even more important onepertaining to the reliability of measured data: the information is continuousand the collection hemisphere is fully covered, as there is no gap in the pixelmapping of the captured images. This ensures that no feature can be missed,as each pixel represents an average of the light distribution detected withinits area and is adjacent to its neighbor.
The only parameter that limits the angular resolution is the pixels size, whichnowadays has stopped to be a constraint: indeed, even very narrow luminancepeaks due to small heterogeneities of the material (like a perforation e.g.)are likely to be larger than the solid angle covered by one pixel. However,it must be kept in mind that for any approach that does not isolate specificdirections of emission (whether using a scanning or a video-based method),an averaging into sample-dependent angular sectors is necessary to produceconsistent BT(R)DF data. Because information is continuous, this averagingis actually more reliable with digital imaging than point-per-point scanning,as no interpolation is required.
By capturing several images of the same luminous situation at different inte-gration intervals, large dynamics in luminance can be assessed with constantaccuracy, and saturation or under-exposure effects can be prevented.
8

The major difficulty in this approach lies in the complex and numerous cal-ibration procedures needed before the instrument is operational [9], and thedata reliability and accuracy will depend on their careful execution.
3.2.2 Existing video-goniophotometers for CFS: innovations and validationresults
Four instruments based on this alternative method exist today, and only twowere designed for CFS: the first of the four, developed at the Lawrence Berke-ley National Laboratory [53] for computer graphics applications, inspired twomore recent designs. One at the Universite de Rennes 1, in France [54], to en-hance photo-realistic rendering, and the other at the Massachusetts Instituteof Technology (MIT) [55], still under development for the characterization ofCFS and light-redirecting materials. It aims at being able to provide not onlyphotometric functions but also the spectral properties of transmitted and re-flected light to enable selective glazing analyzes. Its other major innovation isto extend the wavelength range to the near-infrared in order to incorporatethermal issues as well.
All three rely on the use of a CCD camera equipped with a fish-eye lens tocollect the light emerging from the sample after being reflected on either aspecular (semi-transparent hemisphere [53] or ellipsoid [55]) or a diffuse (cube[54]) surface. These variants of the same, fish-eye camera approach, reduce themeasurement time to its minimum: a quasi-instantaneous assessment of thefull light distribution in reflection or transmission.
At the Solar Energy and Building Physics Laboratory (LESO-PB) of the SwissFederal Institute of Technology (EPFL), a different design was realized usinga CCD camera with a wide-angle lens aimed at a triangular and diffusing pro-jection screen [56, 57]. The latter collects the light emerging from the sampleand rotates around it to cover the full 2π steradian hemisphere. A procedureis completed after 6 screen positions separated by 60◦, which makes this ap-proach slightly less time-efficient than the previous ones but still considerablymore than any scanning-based method.
This device distinguishes itself from all the other goniophotometers for CFSso far in how extensively its results were validated [58]:
• assessment of error at each intermediate stage of calibration and processing,a final relative error of 10% being deduced;
• bidirectional measurements of systems presenting a known symmetry andverification against standard luminance-meter data or analytical calcula-
9

tions (1.5% to 8% errors);• empirical validation based on bidirectional measurements comparisons be-
tween different devices (5% to 8% differences);• comparison to Ulbricht sphere measurements (6% to 14% variations);• comparison of monitored data with ray-tracing simulations to achieve a
higher level of details in the BT(R)DF behavior assessment (discrepanciesalways lower than simulation model errors [59, 60]).
3.3 Summary of current goniophotometer designs and available datasets
Table 1 summarizes the main features of the different instruments developedfor advanced fenestration systems: research institute, measurement type, de-tection hemisphere coverage, directional accuracy, spectral analysis capabili-ties, measurement time, validation method and estimated accuracy, and devicereproducibility, i.e. how easy it would be to make a replica of these devices.
This feature is outlined in as an emoticon, mainly based on how difficult itwould be to reproduce the calibration procedures. Devices using CCD camerasas light detectors (new device at ISE, devices at EPFL and MIT) definitelyfall in the ”not easy to replicate” category, while pabr-opto’s device, typically,is meant to be easily reproduced.
Table. 1. Main features of current bidirectional goniophotometer designs for the experi-mental assessment of facade components and fenestration systems.
As explained in the introduction part of Section 3, the directional accuracy(“Direc” in Table 1) is generally determined by the sample’s investigatedarea (“sample”), i.e. by the area of the sample that is either viewed by thephoto-sensor in a scanning approach or that is emitting light in a video-basedapproach. The only two exceptions are DTU’s (formerly Cardiff’s) and nowTNO’s devices that offer a much better directional accuracy while keepinglarge sample areas, as mentioned in Section 3.1, in addition to ISE’s devicethat will provide BTF’s.
The measurement time per incident direction is rarely stated explicitly inpublications for scanning-based devices, as it varies strongly with angular res-olution. Based on discussions with several people working with such devices,typical procedures tend to require between 10 minutes and several hours forone incident direction, depending on the resolution chosen. Reference [29] men-tions 5 to 10 hours but this is largely due to the additional spectral scans per-formed at each position. Monitoring times of 40 minutes per incident directionfor scanning-based goniophotometers were therefore assumed when calculat-ing the total measurement times in Table 1, unless other monitoring timeswere indicated in the literature. The total time estimations are based on a full
10

BTDF or BRDF characterization, which, by default, comprises 145 incidentdirections to investigate (in case the sample presents no symmetry). This leadsto tremendous monitoring times for scanning-based approaches and is one ofthe reasons extensive BTDF and BRDF databases are still rare.
Table 2 presents an overview of the measured BT(R)DF datasets availabletoday for Complex Fenestration Systems (CFS), grouped by type. The tableprovides the usual name of the prototype, its symmetry indicator (0 if nosymmetry, 1 if rotational symmetry, 2 if symmetry to φ = 0◦ − 180◦ axis, 3 ifsymmetry to φ = 90◦ − 270◦ axis, 4 if symmetry to both φ = 0◦ − 180◦ andφ = 90◦−270◦ axes), the number of incident directions that were investigatedand the institute that performed the measurements. As can be seen, EPFL [9]offers the largest one available today, with 37 characterized systems amongstwhich 6 were fully characterized (incident directions set based on the default145 directions, but reduced accounting for symmetries). Published BT(R)DFdata measured in a systematic way (beyond calibration or validation purposes)also include 5 materials measured at TNO along 3 incident directions each [44],and two, resp. one, fully characterized systems measured by TUB, resp. ISE[5].
Table. 2. Overview of the measured BT(R)DF datasets generated at LESO-PB/EPFL,TNO, TUB and ISE (physical goniophotometers): *B.-H. stands for Baumann-Huppe AG; *∗x 3 relates to the 3 slats configurations that were considered foreach blind: 0◦, 45◦ and 90◦).
4 Assessment of bidirectional distribution functions using numericmethods
Ray-tracing simulations provide a useful tool for evaluating complex systemsin full detail. Outside of BT(R)DF and CFS characterization, many assess-ment methods for the optical performances of glazing or shading systems haveresorted to comparisons with ray-tracing simulations:
• to establish a set of quantity and quality criteria for advanced daylightsystems and determine their performances with Radiance simulations [61];
• to test a new ray-tracing approach for thermal radiation [62] or prismaticpanel performances [63];
• to develop an angle-dependent evaluation procedure of solar heat gain co-efficient (g-value) and compare measurements to ray-tracing simulationscarried out with the software OptiCADr 4 [64, 65];
4 Opticad Corporation.
11

• to determine the daylight distribution in a room and compare Radiancesimulations with office room monitoring [66].
Three virtual goniophotometers have been realized based on ray-tracing cal-culations. Two of them are described in more detail below. The third one wasdeveloped based on an extension of the Genelux lighting simulation software[67]. A detection hemisphere was generated on either side of a virtual sampleto record BRDF (incidence side) and BTDF (emitting side) data. Preliminaryresults were obtained with a lambertian diffusor, a glazing panel and severalvenetian blinds with planar slats but no published material could be foundthat described this approach further and validated its results. This numericalgoniophotometer is therefore not discussed in more detail in this paper.
The main advantages of simulation-based approaches in goniophotometry areto increase flexibility and often cost-effectiveness greatly compared to exper-imental approaches. Their main draw-back is that all properties of each andevery component (geometry, material) need to be known in advance, whichoften still requires measurements. Where they become most useful is when sev-eral configurations of a same system are to be assessed, made out of individualcomponents of known properties, or to evaluate and optimize the performancesof products at an early design stage (before a prototype is made).
4.1 LESO-PB/EPFL virtual goniophotometer using TracePror
The experimental conditions for the LESO-PB/EPFL instrument [57] werereproduced virtually with the commercial forward ray-tracer TracePror 5 thatis based on Monte Carlo calculations. Computer simulation results were thencompared to BTDF data assessed with the experimental goniophotometer.
The properties of this numerical goniophotometer are described extensively in[59, 60]; the resulting simulation model for a 5◦ by 5◦ grid is shown on Figure 2with a laser cut panel as the investigated sample.
Fig. 2. Simulation model composed of an opaque diaphragm, the analyzed sample, a non-interacting incident flux detection surface and six absorbing detection screens splitinto adjacent angular sectors.
This model was used to analyze prismatic panels, a laser cut panel, a SerraglazeTM
panel and mirrored venetian blind prototypes manufactured by Baumann-Huppe AG.
5 Lambda Research Corporation, Inc.
12

Detailed comparisons with measured BTDF data were conducted, and led todiscrepancies varying between 5% and 25%, that were checked to be alwaysinferior to the estimated errors due to the ray-tracing method itself [59, 60].
To complement this study, an additional analysis made possible by the flexi-bility of virtual models was carried out. The idea was to assess the extent towhich mechanical and equipment constraints applicable to the original, phys-ical instrument (described in Section 3.2) altered the accuracy of measuredBT(R)DF data. Therefore, an ideal set-up was modelled with a virtual sun asthe light source and a hemispherical detector [59], shown in Figure 3 with aray-tracing plot for an asymmetric prismatic panel manufactured by SiemensAG. As a matter of fact, it was found that the assumptions made for theconstruction of the instrument were good, and that the results obtained forthe ideal model and actual set-up differed by less than 11% in relative terms.
Fig. 3. Ideal set-up model configuration: hemispherical absorbing detector and virtual sun.
4.2 FHG-IBP numerical goniophotometer environment using OptiCadr
The FHG-IBP numerical goniophotometer is based on the commercial forwardray-tracing tool OptiCadr[68].
Unlike the LESO-PB/EPFL virtual goniophotometer, this model does not tryto reproduce a specific (physical) goniophotometer. As depicted in Figure 4,sensor planes that record the flux coming from the sample are arranged as ahemicube, since the program OptiCadrprovides planar sensors only. From theflux received on the individual patches and the relative geometric position ofthe the latter with respect to the sample, both BTDF and BRDF values canbe calculated [69, 70].
Fig. 4. Illustration of FHG-IBP numerical goniophotometer. The flux detected on the sen-sor planes of the hemicube is converted into luminance coefficients (BTDF values).
The set-up parameters such as the distance between the sample and each sen-sor plane or the subdivision of sensor planes into adjacent patches all affect theangular resolution and can be user-defined. For instance, angular resolutions(averaging intervals) of about 4◦ can be obtained with a hemicubic arrange-ment of sensor planes in roughly 5,000 patches, while a 2◦ resolution wouldrequire 20,000 patches.
The adjustable distance between sample and sensor plane also keeps errorsdue to flux recordings in the photometric near-field under control. For a givenmaximum error on BTDF or BRDF data, shorter distances between sample
13

and sensor planes can typically be accepted if the sample is diffuse (scatter-ing), whereas for samples showing highly directional (spiky) properties, largerdistances are required if the same error is to be maintained.
As an example Figure 4(a) illustrates the flux received from venetian blindswith slats tilts 0◦ and 40◦, illuminated by a virtual light source from a 60◦
angle. The slats have a mirror coating on the concave side. In Figure 4(b),normalized BTDFs at slat inclinations 0◦ are depicted for 10,000 and 1,000,000traced rays. Results were validated against analytical and measured referencecases (diffuse,standard and prismatic glazing, laser-cut panel) [70]. Obtainederror ranges were similar to the ones determined for LESO-PB/EPFL virtualgoniophotometer introduced earlier (relative errors ranging from 5% to 25%).
Fig. 5. Flowchart illustrating the program interaction and dataflow of the FHG-IBP nu-merical goniophotometer environment.
As depicted in Figure 5, the numerical goniophotometer is embedded into asemi-automated environment allowing the user to:
• configure a virtual set-up,• parameterize and combine CFS samples,• postprocess data for further use in daylight simulation.
To generate the required OptiCadrcode automatically, a CFS Sample-Generatoris provided. Different combinations of CFS components can be arranged inlayer structures. The specification of the components and of the layer structureis supported by a graphical user interface. A postprocessor that implementscalculated BTDF data into daylighting simulation tools is also included in thevirtual goniophotometer environment, as described in the following section.This environment therefore aims at providing a close interface between theBTDF determination process itself and the process of daylight simulation anddesign. Table 3 gives a selection of the samples currently available, with alisting of the key configuration parameters.
Table. 3. Selection of CFS-models currently supported by the FHG-IBP CFS-SampleGenerator with key configuration parameters.
4.3 Available datasets
Table 4 shows a selection of simulated BTDF datasets. For use in daylightsimulations (see Section 5), a system’s BTDF data have to be available for145 incident angles, this set being reduced if the sample presents known sym-metries [5].
14
Table. 4. Overview of the computed BTDF datasets generated at LESO-PB/EPFL andFHG-IBP (numerical goniophotometers): * according to the manufacturer’s specifi-cations, calculated for different slat inclinations from system open to system closed ;*∗ calculated for 15 incident directions at slat tilts 0◦and 45◦.
5 Incorporation of CFS datasets into daylight design practice
Compared to standard glazing systems, the presence of one or more CFS in afacade makes it much more complex to determine what the spatial and timevariant indoor lighting conditions will be. Indeed, not only will they depend onthe outside illuminance conditions but also on the CFS’ specific bidirectionallight transmittance function, that is defined for each possible incoming lightdirection.
These dependencies have to be made transparent to the designer in an easy-to-handle way, such that for a specific problem, the best solution can be identifiedat low expenses. This requires CFS data to be included in (day-)lighting designtools so that a system’s performance can be simulated under different skies forarbitrary room and facade conditions (geometry, surface reflectance). On theother hand, an appropriately managed database can offer quick pre-simulationsupport in the selection of suitable CFS, in a similar way as in a luminaireselection process in artificial lighting programs.
To make the BT(R)DF data diffusion more efficient, it also seems essentialto gather these data into as few databases as possible, updated as more databecome available.
5.1 Data processing and inclusion into lighting design tools
Based on the outside luminance distribution and the BTDF data provided,the luminous intensity distribution on the inward facing side of a CFS elementis calculated [7]. In this method the BTDF data are to be properly interpo-lated and superimposed first. The luminous intensity distributions are thenintegrated into radiosity or ray-tracing based lighting calculation engines todetermine the indoor illuminance conditions. The method has been validated,differing compared to the reference cases between 2% and 12% in relativeterms, depending on the type of BTDF data and outside luminance distribu-tion considered. Figure 6 shows a photo-realistic visualization of a daylit roomusing a light redirecting glass in the upper part of a window, modelled as alight emitting surface of given luminous intensity distribution. The calcula-tion has been performed for March 21st at noon at the location Stuttgart for
15

a south facing facade.
Fig. 6. Photo-realistic visualization of room illuminated by standard venetian blinds inthe lower facade area and a light redirecting glass in the upper facade area.
5.2 Graphical User Interface assessing a system data base
A graphical user-interface based on a database holding BTDF datasets ofdifferent CFS allows to identify a suited CFS solution for specific problems atlow expenses. Several of the CFS’s characteristics can be viewed, including:
• System Information: Graphics, pictures, and literature about specific sys-tems, and case studies showing applications of such systems in real andsimulated environments.
• Display of the raw data files: Display and analysis of the BTDF data anddirectional hemispherical transmissions.
• Sky Luminance Distributions: Display of CIE sky luminance distributionsfor different facade orientations and tilt angles, including direct sun inter-action for static and dynamic systems.
• Light emitting surfaces: Calculation and display of light distribution throughthe facade system (similarly to candlepower distributions in artificial light-ing).
• Room illumination: Simple (“shoe-box” type) room visualization for differ-ent outside illumination conditions.
The provided functionalities “Light emitting surfaces” and “Room illumina-tion” are incorporating the method mentioned in the previous section [7].Illumination within the room itself is calculated using a simple radiosity algo-rithm. The system runs under MS-WindowsTM operating systems. Being basedon COM-technology [71] it enables an easy data exchange and integration withthird party software. Further information is available under www.talisys.de.For inclusion of additional BTDF datasets and for inclusion of the graphical-user interface with the database into third party software, please contact theauthors.
6 Conclusion
To understand and model the behavior of complex fenestration systems, the in-terest in bidirectional transmission and reflection distribution functions (BTDFsand BRDFs) has grown significantly over the last two decades. Over thisperiod of time, several experimental devices have emerged, called goniopho-
16

tometers. Unlike integrating spheres that are used to record the directional-hemispherical transmission or reflection of a material, goniophotometers areable to assess spatially resolved light transmission or reflection distributions.
This paper presents a critical review of nine such goniophotometric test facili-ties, and points out their respective innovations and capabilities. Two radicallydifferent assessment approaches were found, one based on a scanning process(7 instruments) and one based on digital imaging combined with a projectionprinciple (2 devices). The advantages and shortcomings of these two methodsare discussed: scanning-based approaches are oftentimes easier to reproducedue to less complex calibration procedures while video-based approaches aremuch more time-efficient and offer a continuous investigation of the light fluxdistribution.
Recently, physical measurements are being complemented by numerical ap-proaches based on ray-tracing calculations. They require the characterizedsystem to be of well-known properties, which makes these methods more valu-able for early design and optimization of products, or for testing out differentconfigurations of a system including fully characterized individual components.If efficiently combined with measurements, expenses related to the construc-tion and maintenance of large experimental facilities can thus be reduced andcosts for system-prototyping significantly lowered.
As bidirectional light transmittance through CFS (or bidirectional reflectanceon materials) are dependent on four parameters (incident light altitude andazimuth, emerging light altitude and azimuth), and as outside illuminationconditions vary greatly over time, indoor light penetration is hard to predictif BT(R)DF values and sky luminance distribution patterns are kept as rawdata.
Today’s important efforts in BT(R)DF assessment have therefore to be com-bined with similar efforts in making these data usable for design decisions. Newalgorithms calculating candle power distributions based on raw BTDF dataand outside luminance distributions have therefore been developed to convertthese data into usable input for lighting simulation software used in dailypractice. These algorithms are combined with a new database managementinterface, that includes an intuitive graphical user-interface. This integrationmakes the benefits of choosing one CFS rather than another depending on thesky and room conditions easily identified by the designer (in a way compara-ble to luminaire selection in artificial lighting programs), and more generally,allows the latter to view, analyze and hopefully optimize the illuminationconditions of a room containing one or more Complex Fenestration Systems.
17
Acknowledgements
This work was realized within the framework of Task 31 of the InternationalEnergy Agency (IEA), Solar Heating and Cooling Programme (SHC).
Marilyne Andersen was supported by the Swiss Federal Institute of Technology(EPFL) and the Commission for Technology and Innovation (CTI) duringher PhD thesis, as well as by a joint funding from the Lawrence BerkeleyNational Laboratory and the Swiss National Science Foundation, fellowship81EL-66225, during her stay at LBNL. She is supported by the MassachusettsInstitute of Technology since July 2004. She would like to thank LambdaResearch Corporation for having provided her with a license of TracePror tocomplete this research.
Jan de Boer was supported by the German Ministry of Economics and Labour(BMWA) under Grant Nb. 0329037G and by the ADELINE User Club. Thedatabase has been developed within the framework of a joint project withthe Fraunhofer-Institute for Solar Energy Systems, system developers, andconsultant offices.
References
[1] Commission Internationale de l’Eclairage. Radiometric and photometriccharacteristics of materials and their measurement. CIE, 38(TC-2.3),1977.
[2] J.-L. Scartezzini and B. Paule. Office Lighting. Technical report, EDMZ,Bern, 1994.
[3] M. Fontoynont. Properties of glazings for daylighting applications. FinalReport JOU2-CT940404, ENTPE, Lyon, France, September 1995.
[4] C.F. Reinhart and S. Herkel. The simulation of annual daylight illumi-nance distributions a state-of-the-art comparison of six RADIANCE-based methods. Energy and Buildings, 32(2):167–187, July 2000.
[5] International Energy Agency. Daylight in Buildings - A source book ondaylighting systems and components. IEA SHC Task 21 / ECBCS Annex29, Berkeley, July 2000.
[6] R. Mitanchey, L. Escaffre, and C. Marty. From optical performances char-acterization of a redirecting daylight material to daylighting simulations.In Proceedings of the 3rd European Conference on Energy Performance& Indoor Climate in Buildings EPIC 2002, pages 721–726, Lyon, France,Oct. 23-26, 2002. ENTPE.
[7] J. de Boer. Modelling indoor illumination by complex fenestration sys-tems using bidirectional photometric data. Energy and Buildings, InPress.
18

[8] M. Dirksmoller and H. Erhorn. Adeline 3.0. Documentation, FraunhoferInstitute of Building Physics, Suttgart, 1999.
[9] M. Andersen. Innovative bidirectional video-goniophotometer for ad-vanced fenestration systems. PhD thesis, EPFL, Lausanne, 2004.
[10] Illuminating Engineering Society of North America. Lighting Handbook.IESNA, New York, 1993.
[11] Commission Internationale de l’Eclairage. The photometry and gonio-photometry of luminaires. CIE, 121, 1996.
[12] P.R. Tregenza. Subdivision of the sky hemisphere for luminance mea-surements. Lighting Research and Technology, 19(H.1):13–14, 1987.
[13] M. Andersen. Light distribution through advanced fenestration systems.Building Research and Information, 30(4):264–281, July 2002.
[14] Commission Internationale de l’Eclairage. The Measurement of LuminousFlux. CIE, 84, 1989.
[15] J.F. Murray-Coleman and A.M. Smith. The Automated Measurementof BRDFs and their Application to Luminaire Modeling. Journal of theIlluminating Engineering Society, 19(1):87–99, 1990.
[16] S.C. Foo. A gonioreflectometer for measuring the bidirectional reflectanceof material for use in illumination computation. Master’s thesis, CornellUniversity, Ithaca, NY, August 1997.
[17] P.A. van Nijnatten. An automated directional reflectance/transmittanceanalyser for coating analysis. Thin Solid Films, 442(1-2):74–79, October2003.
[18] I. Ashdown and R. Rykowski. Making Near-Field Photometry Practical.Journal of the Illuminating Engineering Society, 27(1):67–79, 1998.
[19] R. Rykowski. Illumination System Measurement Using CCD Cameras. InInternational Optical Design Conference, Technical Digest, Washington,DC, 1994. Optical Society of America.
[20] I. Lewin and J. O’Farrell. Luminaire Photometry Using Video Camera.Journal of the Illuminating Engineering Society, 28(1):57–63, 1999.
[21] D.R. Jenkins and H. Monch. Source Imaging Goniometer Method of LightSource Characterization for Accurate Projection System Design. In 2000Society for Information Display Conference, Long Beach, CA, 2000. SID.
[22] S. Tsuchida, I. Sato, and S. Okada. Measurement of land surface brdf withspatial instability for vicarious calibration. In Proceedings of SPIE - TheInternational Society for Optical Engineering Vol. 3870, pages 254–258,1999.
[23] A. Demircan, R. Schuster, M. Radke, M. Schnermark, and H.P. Rser.Use of a wide angle CCD line camera for BRDF measurements. InfraredPhysics & Technology, 41(1):11–19, February 2000.
[24] S.R. Sandmeier. Acquisition of Bidirectional Reflectance Factor Datawith Field Goniometers. Remote Sensing of Environment, 73:257–269,2000.
[25] K.F. Karner, H. Mayer, and M. Gervautz. An Image based MeasurementSystem for Anisotropic Reflection. Computer Graphics Forum, 15(3):119–
19

128, September 1996.[26] S.R. Marschner, S.H. Westin, E.P.F. Lafortune, K.E. Torrance, and D.P.
Greenberg. Image-based BRDF measurement including human skin. InProceedings Eurographics Workshop on Rendering, Granada, Spain, June21-23, 1999.
[27] H.P.A. Lensch, J. Kautz, and M. Goesele. Image-Based Reconstruction ofSpatial Appearance and Geometric Detail. ACM Transactions on Graph-ics, 22(2):234–257, April 2003.
[28] K.J. Dana, B. van Ginneken, S.K. Nayar, and J.J. Koenderink. Re-flectance and Texture of Real-World Surfaces. ACM Transactions onGraphics, 18(1):1–34, January 1999.
[29] J. Breitenbach and J.L.J. Rosenfeld. Design of a Photogoniometer toMeasure Angular Dependent Optical Properties. In Proceedings of Inter-national Conference on Renewable Energy Technologies in Cold Climates,pages 386–391, Ottawa, Canada, 1998. Solar Energy Society of CanadaInc.
[30] P. Apian-Bennewitz, J. von der Hardt, and M. Goller. Characterizationof aerogels for computer simulations. November 1994.
[31] K.M. Papamichael, J. Klems, and S. Selkowitz. Determination and Appli-cation of Bidirectional Solar-Optical Properties of Fenestration Materials.Technical Report LBL-25124, Lawrence Berkeley National Laboratory,Berkeley, 1988.
[32] J.H. Klems. A new method for predicting the solar heat gain of complexfenestration systems - I: Overview and derivation of the matrix layercalculation. In ASHRAE Winter Meeting, New Orleans, LA, Jan. 22-26,1994.
[33] J.H. Klems and J.L. Warner. Measurement of bidirectional optical prop-erties of complex shading devices. In ASHRAE Transactions 101 (1),pages 791–801, Chicago, IL, 1995.
[34] J.H. Klems, J.L. Warner, and G.O. Kelley. A comparison between cal-culated and measured SHGC for complex glazing systems. In ASHRAETransactions 102 (1), pages 931–939, Atlanta, Feb. 17-21 (1996), 1997.
[35] R. McCluney and J. Sung. Simulation of venetian blind optical propertieswith monte carlo ray tracing. Technical report, Florida Solar EnergyCenter, Cocoa, FL, December 1999.
[36] P. Apian-Bennewitz. Designing an apparatus for measuring bidirectionalreflection/transmission. In Proceedings SPIE Vol. 2255, Optical Materi-als Technology for Energy Efficiency and Solar Energy Conversion XIII,pages 697–706, 1994.
[37] P. Apian-Bennewitz and J. von der Hardt. Enhancing and calibrating agoniophotometer. Solar Energy Materials and Solar Cells, 54(1-4):309–322, August 1998.
[38] P. Apian-Bennewitz. Messung und Modellierung von lichtstreuenden Ma-terialien zur Computer-Simulation von Tageslichtbeleuchtung. PhD the-sis, Albert-Ludwigs-Universitat, Freiburg, 1995.
20

[39] P. Apian-Bennewitz. pab gonio-photometer ii. Internet WWW page atURL: <http://www.pab-opto.de//> (Accessed 01/12/06), 2006.
[40] G.B. Smith. Photogoniometer at the university of technology, sydney.International Daylighting RD&A, 2-99 (8), p. 13, September 1999. Uni-versity of Sydney, Australia.
[41] G.B. Smith, D.C. Green, G. McCredie, M. Hossain, P.D. Swift, and M.B.Luther. Optical characterisation of materials and systems for daylighting.Renewable Energy, 22(1-3):85–90, January-March 2001.
[42] S. Aydinli. Short description of the spiral goniophotometer for bi-directional measurements (TU Berlin). Report for IEA SHC Task 21,ECBCS Annex 29, Subtask A, Technische Universitat Berlin (TUB),Berlin, 1996.
[43] L. Bakker and D. van Dijk. Measuring and processing optical transmis-sion distribution functions of TI-materials. Private Communication, TNOBuilding and Construction Research, Delft, 1995.
[44] D. van Dijk. Daylighting Products with Redirecting Visual Properties(The project REVIS). Final Report JOE3-CT98-0096, TNO Buildingand Construction Research, Delft, February 2001.
[45] J.L.J. Rosenfeld. On the calculation of the total solar energy transmit-tance of complex glazings. In Proceedings of the 8th International Meetingon Transparent Insulation, Freiburg, Germany, 1996.
[46] J. Breitenbach, S. Lart, I. Langle, and J.L.J. Rosenfeld. Optical andthermal performance of glazing with integral venetian blinds. Energyand Buildings, 33(5):433–442, May 2001.
[47] I. Lewin, R. Laird, and J. Young. Video photometry for quality control -CCD technology produces an all-terrain photometer system. LD&A, pp.16-20, January 1992.
[48] K.D. Song, L.O. Degelman, and L.L. Boyer. Determining DaylightingParameters by a Luminance Mapping System and Scale Models. Journalof the Illuminating Engineering Society, 23(1):65–75, 1994.
[49] V. Berrutto and M. Fontoynont. Applications of CCD cameras to lightingresearch: Review and extension to the measurement of glare indices. InProceedings CIE 119, 23rd Session, pages 192–195, New Delhi, 1995.
[50] C. Loscos. Re-eclairage et Remodelisation Interactifs des Scenes Reellespour la Realite augmentee. PhD thesis, Universite Grenoble I, Grenoble,December 1999.
[51] L. Michel and M. Andersen. Realisation d’un photo-uranotomographea imagerie numerique. In Proceedings Solar Energy in Buildings CIS-BAT’99, pages 289–294, Lausanne, Sept. 22-23, 1999. EPFL.
[52] D. Francioli and J.-J. Meyer. Etude de l’eblouissement au moyen d’unphotoluminancemetre numerique. In Proceedings CISBAT 2003, pages265–270, Lausanne, Oct. 8-9, 2003. EPFL.
[53] G.J. Ward. Measuring and modeling anisotropic reflection. ACM SIG-GRAPH Computer Graphics, 26(2):265–272, July 1992.
[54] J.-M. Deniel. Modelisation des luminaires et des BRDF: realisation,
21

mesure et compression. PhD thesis, Universite de Rennes 1, Rennes,April 2002.
[55] M. Andersen, D. Ljubicic, C. Browne, S. Kleindienst, and M. Culpepper.Combining time-efficient goniophotometry with scale model studies in aunique instrument. In Proceedings of Lux Europa 2005 - Lighting forHumans, pages 271–274, Berlin, September 19-21, 2005. Deutsche Licht-technische Gesellschaft e.V. (LiTG).
[56] M. Andersen, L. Michel, C. Roecker, and J.-L. Scartezzini. Experimen-tal assessment of bi-directional transmission distribution functions usingdigital imaging techniques. Energy and Buildings, 33(5):417–431, May2001.
[57] M. Andersen, C. Roecker, and J.-L. Scartezzini. Design of a time-efficientvideo-goniophotometer combining bidirectional functions assessment intransmission and reflection. Solar Energy Materials and Solar Cells,88(1):97–118, June 2005.
[58] M. Andersen. Validation of the performance of a new bidirectional video-goniophotometer. Lighting Research and Technology, In Press.
[59] M. Andersen, M. Rubin, and J.-L. Scartezzini. Comparison between ray-tracing simulations and bi-directional transmission measurements on pris-matic glazing. Solar Energy, 74(2):157–173, February 2003.
[60] M. Andersen, M. Rubin, R. Powles, and J.-L. Scartezzini. Bi-directionaltransmission properties of venetian blinds: Experimental assessment com-pared to ray-tracing calculations. Solar Energy, 78(2):187–198, 2005.
[61] M. Moeck. On daylight quality and quantity and its application to ad-vanced daylight systems. Journal of the Illuminating Engineering Society,27(1):3–21, 1998.
[62] N.S. Campbell. A Monte Carlo approach to thermal radiation distribu-tion in the built environment. PhD thesis, University of Nottingham,Nottingham, January 1998.
[63] R. Compagnon. Simulations numeriques de systemes d’eclairage naturela penetration laterale. PhD thesis, Ecole Polytechnique Federale de Lau-sanne, Lausanne, 1994.
[64] T.E. Kuhn, C. Buhler, and W.J. Platzer. Evaluation of overheating pro-tection with sun-shading systems. Solar Energy, 69(Suppl. 6):59–74, July-December 2001.
[65] W.J. Platzer. Basic data for model calculations of solar shading sys-tems. Report for IEA SHC Task 27, Subtask A T27-A3-FRG-WJP-2001-2, Fraunhofer Institute for Solar Energy Systems, Freiburg, Germany,January 2002.
[66] C.F. Reinhart and O. Walkenhorst. Validation of dynamic RADIANCE-based daylight simulations for a test office with external blinds. Energyand Buildings, 33(7):683–697, September 2001.
[67] R. Mitanchey, G. Periole, and M. Fontoynont. Goniophotometric mea-surements: Numerical simulation for research and development applica-tions. Lighting Research and Technology, 27(4):189–196, 1995.
22

[68] Opticad. Optical Analysis Program User’s Guide Version 7.0. OpticadCorporation, 2001. Santa Fe.
[69] J. de Boer. Numerical goniophotometer. User Manual, Fraunhofer Insti-tute of Building Physics, Stuttgart, 2004.
[70] J. de Boer. Tageslichtbeleuchtung und Kunstlichteinsatz in Verwaltungs-bauten mit unterschiedlichen Fassaden. PhD thesis, Universitat Stuttgart,Stuttgart, 2004.
[71] S. Wossner and J. de Boer. Plugin-technologies for daylight design toolapplications. Working Document of IEA SHC TASK 31 (DaylightingBuildings in the 21st century) T27-A3-FRG-WJP-2001-2, Fraunhofer In-stitute of Building Physics, Suttgart, Germany, 2004.
23

List of Tables
1 Main features of current bidirectional goniophotometer designsfor the experimental assessment of facade components andfenestration systems. 25
2 Overview of the measured BT(R)DF datasets generatedat LESO-PB/EPFL, TNO, TUB and ISE (physicalgoniophotometers): *B.-H. stands for Baumann-Huppe AG;*∗x 3 relates to the 3 slats configurations that were consideredfor each blind: 0◦, 45◦ and 90◦). 26
3 Selection of CFS-models currently supported by theCFS-Sample Generator with key configuration parameters. 27
4 Overview of the computed BTDF datasets generated at LESO-PB/EPFL and FHG-IBP (numerical goniophotometers): *
according to the manufacturer’s specifications, calculated fordifferent slat inclinations from system open to system closed ;*∗ calculated for 15 incident directions at slat tilts 0◦and 45◦. 28
24

Institute BTDF BRDF Coverage Direc λdep Time Validation Replica
LBNL, USA X - discrete sample - ∼4 days g-val. comp.(10%)
¨
ISE,Germany
X X discrete BTF - ∼4 days old:∫sphere
(5%-61%); new:under devlpmt
a
pabr-opto,Germany
X X discrete sample X ∼4 days not published ¨
TUB,Germany
X - discrete sample - ∼4 days under devlpmt −
TNO, TheNetherlands
X X discrete notpubl.
- ∼4 days∫sphere (10%-20%) −
DTU,Denmark
X - discrete ±0.5◦ X ∼30days
∫sphere, g-val., an.model (∼11%)
−
UTS,Australia
X X discrete sample - ∼4 days not published −
EPFL,Switzerland
X X full sample - 8 hours∫sphere, an.model,ray-trac., BTDFcomp. (2%-14%)
a
MIT, USA X X full sample X < 10 min under devlpmt aTable 1Main features of current bidirectional goniophotometer designs for the experimentalassessment of facade components and fenestration systems.
25

Type of system Name of product Symmetry Nb inc. dir. Institute
Diffusing materials Opal. plexiglas 1 14 LESO/EPFL
” ” ” 7 TUB
” Opal. plastic 1 3 LESO/EPFL
” ” ” 3 TNO
” Diffusing paint 1 1 LESO/EPFL
Sunlight redirect. syst. Laser Cut Panel 4 56 LESO/EPFL
” Acrylic stripes 4 18 LESO/EPFL
” LumitopTM 3 76 LESO/EPFL
” ” ” 61 TUB
” SerraglazeTM 3 76 LESO/EPFL
” Holographic film 3 35 LESO/EPFL
” Curved squ. mirrors 4 17 LESO/EPFL
” Curved asym. mirrors 3 20 LESO/EPFL
Prismatic panels Siemens 45◦ prism 4 48 LESO/EPFL
” Siemens 42◦/5◦ prism 3 35 LESO/EPFL
” 3M SOLFTM film 4 113 LESO/EPFL
” ” ” 33(poor) ISE
Fabric blinds 19 B.-H.* blinds 1 or 4 5 x 19 LESO/EPFL
” 4 REVIS samples 1 or 4 3 x 4 LESO/EPFL
” 4 REVIS samples ” 3 x 4 TNO
Venetian blinds OKASolarTM 3 18 LESO/EPFL
” OKASolarTM “S” 3 76 LESO/EPFL
” 9 B.-H.* mirror blinds 3 23 x 9 x 3*∗ LESO/EPFL
” 3 Koster blinds 3 23 x 3 x 3*∗ LESO/EPFL
” 4 B.-H.* painted blinds 3 7 x 4 LESO/EPFLTable 2Overview of the measured BT(R)DF datasets generated at LESO-PB/EPFL, TNO,TUB and ISE (physical goniophotometers): *B.-H. stands for Baumann-Huppe AG;*∗x 3 relates to the 3 slats configurations that were considered for each blind: 0◦,45◦ and 90◦).
26

System Figure Key Parameters
Prism
• index of refraction
• thickness
• angle of prism elements
Laser Cut Panel
• index of refraction
• thickness of panel
• distance of cuts
• angle of cuts
Light Redirecting Glass
Ready to buy light guiding systembased on same optical principle asLaser Cut Panel. Can be parametrizedfor test purposes.
Blinds
• specular and diffuse reflection
• slat curvature: cylindrical orparabolic
• distance and number of slats
• slats incline
Gratings
• specular and diffuse reflection
• distance of grating slats
• incline of grating slats
Table 3Selection of CFS-models currently supported by the CFS-Sample Generator withkey configuration parameters.
27

Type of system Name of product Symmetry Nb inc. dir. Institute
Hole BTDF of a hole.For testing pur-poses
1 76 FHG/IBP
Diffusor BTDF of an idealdiffusor. For test-ing purposes
1 76 FHG/IBP
Sunlight redirect. syst. 45◦ Prism 4 76 FHG/IBP
” ” ” 8 LESO/EPFL
” 42◦/5◦ Prism 3 20 LESO/EPFL
” Laser Cut Panels 4 76 FHG/IBP
” ” ” 76 LESO/EPFL
” SerraglazeTM 3 76 FHG/IBP
” ” ” 76 LESO/EPFL
Venetian blinds diffusing blinds 3 76 x 10* FHG/IBP
” mirror blinds 3 76 x 20* FHG/IBP
” B.-H. mirror blinds 3 15*∗ LESO/EPFLTable 4Overview of the computed BTDF datasets generated at LESO-PB/EPFL and FHG-IBP (numerical goniophotometers): * according to the manufacturer’s specifications,calculated for different slat inclinations from system open to system closed ; *∗ cal-culated for 15 incident directions at slat tilts 0◦and 45◦.
28
List of Figures
1 BTDF and BRDF representations as photometric solids for thesun-directing glass “LumitopTM” and a Holographic OpticalElement (source: [9]). 30
2 Simulation model composed of an opaque diaphragm, theanalyzed sample, a non-interacting incident flux detectionsurface and six absorbing detection screens split into adjacentangular sectors. 31
3 Ideal set-up model configuration: hemispherical absorbingdetector and virtual sun. 32
4 Illustration of FHG-IBP numerical goniophotometer. The fluxdetected on the sensor planes of the hemicube is convertedinto luminance coefficients (BTDF values). 33
5 Flowchart illustrating the program interaction and dataflow ofthe FHG-IBP numerical goniophotometer environment. 34
6 Photo-realistic visualization of room illuminated by standardvenetian blinds in the lower facade area and a light redirectingglass in the upper facade area. 35
29
(a) BTDF, incidence (12◦, 60◦)
(b) BRDF, incidence (0◦, 0◦)
Fig. 1. BTDF and BRDF representations as photometric solids for the sun-directingglass “LumitopTM” and a Holographic Optical Element (source: [9]).
30

Fig. 2. Simulation model composed of an opaque diaphragm, the analyzed sample,a non-interacting incident flux detection surface and six absorbing detection screenssplit into adjacent angular sectors.
31

Fig. 3. Ideal set-up model configuration: hemispherical absorbing detector and vir-tual sun.
32

slat incline 40°
slat incline 0°
(a) Fluxdetection on hemicube (b) Normalized BTDF at slat inclina-tion 0◦ (upper figure: 10,000 tracedrays, lower figure 1,000,000 traced rays.
Fig. 4. Illustration of FHG-IBP numerical goniophotometer. The flux detected onthe sensor planes of the hemicube is converted into luminance coefficients (BTDFvalues).
33

Virtual facade system
generator
Facade system description
Virtual test stand
generator
Test stand description
Forward ray tracing
(OptiCadq)
Flux distribution
Conversion into
luminance coefficient and
direct-hemispherical
transmission
Standard data set
Data file
Legend: Program
Post processor for
further use in
daylight simulation
Fig. 5. Flowchart illustrating the program interaction and dataflow of the FHG-IBPnumerical goniophotometer environment.
34

Fig. 6. Photo-realistic visualization of room illuminated by standard venetian blindsin the lower facade area and a light redirecting glass in the upper facade area.
35