Embed Size (px)
Citation preview
7World Trade Center at 250 Greenwich Street New York, New York 10007
November 28, 2007
Re: NAIC Hearing on Use of Catastrophe Modeling by Rating Agencies
Dear Ms. Simpson:
We appreciate the opportunity to comment on the use of catastrophe modeling by Moody’s Investors Service in analyzing property & casualty insurers and reinsurers. Moody’s provides insurance financial strength ratings to property and casualty insurers and reinsurers and those ratings express our opinions of the ability of insurance companies to repay punctually senior policyholder claims and obligations. These ratings reflect our opinion of long-term relative risk and are forward-looking in nature because they apply to liabilities that may pay out over long periods of time. Moody’s analytical approach includes significant qualitative analysis in addition to quantitative analysis, and incorporates the opinions and judgments of experienced analysts.
Global Rating Methodologies As outlined in our recently released Global Rating Methodology for Property & Casualty Insurers (September 2006) and Moody’s Global Rating Methodology for Reinsurers (September 2007), Moody’s reviews seven key rating factors underlying (re)insurers’ business and financial profile, discusses why each factor is important to our ratings, what the relevant financial metrics are in analyzing these factors and how we interpret those metrics. Moody’s has long considered catastrophe risk to be the most significant and volatile risk to capital over the short term. Our analysis assesses a company’s risk appetite and its ability to monitor and manage its risk exposures and also considers its reliance on reinsurance as a risk management tool. We evaluate catastrophe risk, both gross and net, relative to earnings and capitalization. We incorporate the views of the company’s third-party vendor models, internal surveys, relative market share analysis, and stress case scenarios. Please refer to Exhibit 1 and Exhibit 2 for additional information on the Global Rating Methodologies. Current Trends in Insurance Catastrophe Risk Management A special comment titled Current Trends in Insurance Catastrophe Risk Management (January 2007) outlines our views on catastrophe risk management. The Appendix of that publication provides additional insight into how Moody’s evaluates property catastrophe risk. Please refer to Exhibit 3 for the special comment. The catastrophe risk profile of individual P&C companies can vary widely, depending on differences in risk-appetite, line of business focus, financial flexibility and capital adequacy, modeling sophistication/rigor, reliance on reinsurance (or other risk transfer mechanisms) and regulation. The principal components of Moody’s analytical framework for assessing catastrophe risk for North American P&C companies include (1) Moody’s Annual Catastrophe Risk Survey, (2) Moody’s Risk

Page 2 November 28, 2007
Adjusted Capital Model (MRAC) for primary companies and (3) Moody’s Probability of Default and Expected Loss Modeling for reinsurers and structured vehicles. Moody’s Annual Catastrophe Risk Survey Moody’s annual catastrophe risk survey includes qualitative and quantitative components. The qualitative portion of the survey asks issuers to respond to a series of questions relating to (1) risk aggregation management, (2) model usage, (3) input data, (4) terrorism exposure, and (5) catastrophe reinsurance protection. Moody’s is particularly interested in how catastrophe risk management fits into a firm’s overall enterprise risk management, including risk committees (top down/bottom up) approaches. The quantitative portion of our survey asks rated issuers to provide aggregate loss Exceedance Probability (EP) profiles (ground, up, gross and net of reinsurance) at various return periods by requested peril. Moody’s also requests that companies provide their entire aggregate EP distribution over all modeled perils. This facilitates a number of analyses that consider the entire tail of the EP curve, instead of simply focusing on losses at specific return periods. However, Moody’s is mindful that an aggregate-all-perils (AAP) EP curve may not completely capture a firm’s catastrophe exposure (given certain perils and other factors are difficult or not conducive to modeling). Moody’s Risk Adjusted Capital Model Moody’s P&C Risk Adjusted Capital model (MRAC) is a tool used to quantify the multiple sources of risk – including catastrophe risk – within U.S. primary P&C insurance groups, and to gauge the adequacy of the group’s resources for covering those risks. The basic data input source is the NAIC Annual Statutory Statement. The model employs Monte Carlo simulation to develop an estimated probability distribution for the aggregate performance of the group (gains or losses) over a one-year time horizon, allowing for comparison to the group’s adjusted book capital at different probability thresholds. For a given company, the model calculates exceedence curves for each of the seven catastrophes, by analyzing gross written premiums by line and by state, using a market share approach. Exceedance curves for the various U.S. hurricane zones have been adjusted to contemplate increased frequency and severity assumptions post-Katrina including greater loadings for demand surge and storm surge similar to the adjustments made to the leading vendor models. In addition, the three zonal earthquake models contemplate increased loadings for fire-following earthquake. Updating the model for revised curves did not result in any rating changes. The particulars of the MRAC model including a summary of industry exceedance curve profiles by peril-zone are detailed in the MRAC Rating Methodology (August 2006). Please refer to Exhibit 4 for additional information. Probability of Default and Expected Loss Modeling for Monoline Reinsurers and Structured Vehicles Moody’s uses annual aggregate all perils curves provided by respondents to our Catastrophe Risk Survey to stochastically model the impact of catastrophe risk on a company’s earnings, and thereby compute estimates of the probability of default and expected loss to policyholders and/or bondholders over a one-year period. These results (incorporating stress testing based on individual analysts judgment) are then compared to Moody’s idealized cumulative default rates and expected credit losses to generate implied insurance financial strength ratings and debt ratings. This type of model is focused on assessing the contribution of catastrophe risk to the income statement volatility, so this approach is most useful for portfolios with a preponderant exposure to catastrophes, such as monoline catastrophe reinsurers, and structured vehicles including catastrophe bonds and reinsurance sidecars. Reinsurance Sidecars: Moody’s Five Principles The evaluation of catastrophe risk is the primary rating driver in the analysis of reinsurance sidecars. In a special comment titled Reinsurance Sidecars: Moody’s Five Principles (March 2007), we discuss our approach to analyzing sidecars which utilizes output from a catastrophe model as a starting point. The original model provides estimated insured losses based on (1) estimated damages (vulnerability function) from (2) estimated hazards (Mother Nature) on (3) estimated exposures (company data). This layering of ‘risk on risk’ suggests that model outputs are highly uncertain. Given risk on risk, our

Page 3 November 28, 2007
approach as outlined in the special comment focuses on – Composition, Calibration, Conservatism, and Comparison. We typically ask a series of questions to the issuer to evaluate their risk management and cat modeling practices, and subsequently make adjustments to the aggregate curves based on our judgment. Please refer to Exhibit 5 for additional information. Thank you for considering our comments. We would be pleased to discuss any questions you may have at your convenience.
Sincerely,
Ted Collins Group Managing Director Global Insurance
Rating Methodology
New YorkTed Collins 1.212.553.1653Robert RiegelSarah HiblerJeffrey BergTorontoAndrew Kriegler 1.416.214.1635Hilary ParkesLondonSimon Harris 44.20.7772.5454Timour BoudkeevFrankfurtMark Hembury 49.69.707.30.700Hong KongJerry Chien 852.2916.1121Michelle TohSingaporeChristina Maynes 65.6398.8308SydneyNatalie Wells 61.2.9270.8100Buenos Aires: Daniel Ruas 54.11.4816-2332TokyoYasunobu Doi 813.5408.4100Yasushi KawasakiSao PabloLuiz Tess 55.11.3043.7300Mexico CityAlberto Jones Tamayo 52.55.1253.5700
Contact Phone
September 2006
Moody's Global Rating Methodology forProperty and Casualty Insurers
Summary
Globally, Moody's rates just over 400 property and casualty insurance companies, with approximately $100 billion ofrated securities and over $500 billion of insurance reserve liabilities as of December 31, 2005. These ratings reflectMoody's opinions of these institutions' creditworthiness, which considers both business and financial fundamentals foreach rated company. The primary purpose of this rating methodology is to enhance the transparency of Moody's rat-ing process by identifying and discussing the key factors that explain our ratings of property and casualty insurers glo-bally and how those key factors are used.
Because the methodology applies globally, it is necessarily general in some respects and not intended to be anexhaustive discussion of all factors that Moody's analysts consider in every property and casualty insurer's rating. Reg-ulatory, accounting, and product characteristics can vary widely from country to country and Moody's rating approachtakes account of such differences, including the financial metrics that correspond to particular rating categories. Thismethodology contains several sections that summarize the key differences in Moody's rating approach by region. Itwill be supplemented, over time, by additional clarifying methodologies focusing on local analytic factors (e.g. regula-tory and accounting), as appropriate, including the top ratios used to rate companies within particular regions.
Moody's approach to rating the various obligations of property and casualty insurance organizations is rooted inan assessment of the financial strength of the main operating units within that organization. This methodology is,therefore, intended primarily to explain Moody's approach to assigning insurance financial strength ratings to operat-
ing insurers. Specifically, the methodology assists in developing a financial strength rating for a stand-alone entitybefore consideration of parental support. The methodology is also applicable to the property & casualty insurancebusiness of composite insurers, which engage in other insurance operations in addition to property and casualty under-writing. Other ratings that may be assigned within the group (e.g., on senior unsecured debt issued by the insurer orits parent company) are typically determined with reference to the insurance financial strength ratings of the group’smain subsidiaries.
In rating property and casualty insurers on a stand-alone basis, Moody's focuses on both qualitative and quantita-tive characteristics in the following areas:
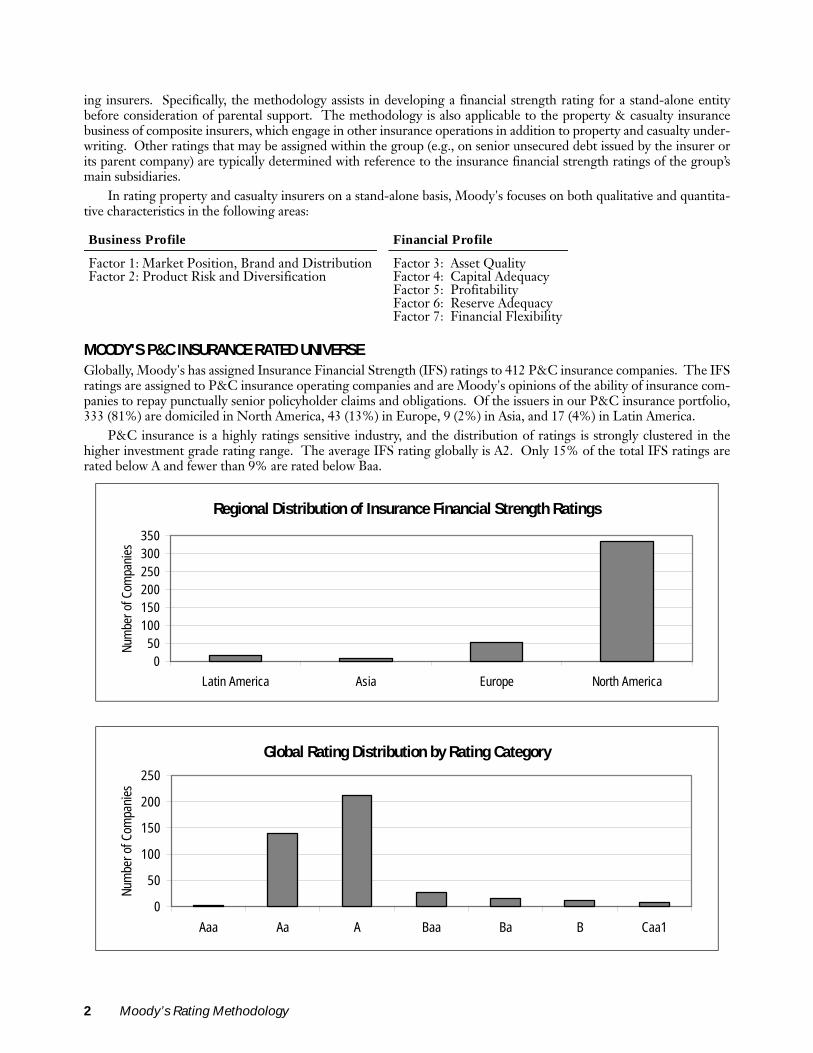
MOODY'S P&C INSURANCE RATED UNIVERSEGlobally, Moody's has assigned Insurance Financial Strength (IFS) ratings to 412 P&C insurance companies. The IFSratings are assigned to P&C insurance operating companies and are Moody's opinions of the ability of insurance com-panies to repay punctually senior policyholder claims and obligations. Of the issuers in our P&C insurance portfolio,333 (81%) are domiciled in North America, 43 (13%) in Europe, 9 (2%) in Asia, and 17 (4%) in Latin America.
P&C insurance is a highly ratings sensitive industry, and the distribution of ratings is strongly clustered in thehigher investment grade rating range. The average IFS rating globally is A2. Only 15% of the total IFS ratings arerated below A and fewer than 9% are rated below Baa.
Business Profile Financial Profile
Factor 1: Market Position, Brand and DistributionFactor 2: Product Risk and Diversification
Factor 3: Asset QualityFactor 4: Capital AdequacyFactor 5: ProfitabilityFactor 6: Reserve AdequacyFactor 7: Financial Flexibility
Regional Distribution of Insurance Financial Strength Ratings
Global Rating Distribution by Rating Category
050
100150200250300350
Latin America Asia Europe North America
Num
ber o
f Com
pani
es
0
50
100
150
200
250
Aaa Aa A Baa Ba B Caa1
Num
ber o
f Com
pani
es
2 Moody’s Rating Methodology
Table of Contents
Framework for Rating Property and Casualty Insurers ..................................................................... 4
Rating Summary Profile .................................................................................................................. 4
KEY RATING FACTORS:
Business Profile
Factor 1: Market Position, Brand and Distribution........................................................................... 6
Factor 2: Product Risk and Diversification ...................................................................................... 7
Financial Profile
Factor 3: Asset Quality................................................................................................................... 9
Factor 4: Capital Adequacy .......................................................................................................... 10
Factor 5: Profitability.................................................................................................................... 11
Factor 6: Reserve Adequacy ........................................................................................................ 12
Factor 7: Financial Flexibility........................................................................................................ 13
Other Considerations in Determining Stand-Alone Ratings
Management, Governance, and Risk Management ....................................................................... 14
Accounting Policy and Disclosure.................................................................................................. 16
Sovereign and Regulatory Environment......................................................................................... 16
Moving From Stand-Alone Rating to Public Rating - Evaluating Support ........................................ 17
Regional Analytic Considerations .................................................................................................. 18
Relationship Between Insurance Financial Strength and Other Ratings.......................................... 20
Appendix 1: Using the Methodology as a Rating Scorecard ........................................................... 23
Appendix 2: Regional Capital Adequacy Measures ........................................................................ 25
Moody’s Rating Methodology 3
Framework for Rating Property and Casualty Insurers
Moody's property and casualty insurance ratings reflect our opinion of long-term relative risk and are, of necessity,forward-looking in nature because they apply to liabilities that may pay out over long periods of time. Because histor-ical experience has shown that looking only at the current financial condition of the company is not always an accuratepredictor of the company's future financial performance and financial strength, Moody's analytical approach includessignificant qualitative analysis in addition to quantitative analysis, and incorporates the opinions and judgments ofexperienced analysts.
In the following sections, we will review the seven key rating factors underlying an insurer's business and financialprofile, discuss why each factor is important to our stand-alone ratings, what the relevant financial metrics are in ana-lyzing these factors and how we interpret those metrics. Some of the factors that we consider important are clearlyquantifiable, while others involve qualitative assessment. In addition, we recognize some of the quantifiable metricsare rather basic in order to facilitate accumulating and comparing the data on a global basis. In this regard, the ana-lyst's interpretation of such metrics, as well as the consideration of regional/supplemental metrics, may also providefurther insight and analysis.
For each of these factors, this methodology will outline Moody's views and expectations about how an insurer'sprofile would typically correspond with a given insurance financial strength rating level--Aaa through Ba. For going-concern insurers rated Ba and lower for insurance financial strength, overall country risk typically plays a dominantrole in Moody's rating analysis. Analysts consider these rating level guidelines, as well as other factors such as manage-ment and governance, accounting policy and disclosure, and sovereign and regulatory considerations, when assigningratings to insurers.
Although this methodology outlines the global framework used to rate insurance companies1, every company'srating may not be consistent with the rating level guidelines for every rating factor. In addition, given the inherentcyclicality of the property & casualty industry, we would expect a company's financial profile to be somewhat betterthan the indicated rating level guidelines during cycle peaks and somewhat lower during cycle troughs (i.e. - an singleA-rated insurer might be expected to perform like a low Aa-rated company at a cyclical peak and a high Baa-ratedcompany in the trough)
However, to the extent, that an insurer is a frequent outlier for its rating category on the factors described below,then a) there is likely pressure on its rating (up or down), b) some element (or elements) of its business or financial pro-file is sufficiently compelling that it dominates the analysis, or c) the unique characteristics of the insurer's accounting,regulatory or market environment limit the comparability of certain key factors and metrics. The interpretation ofhow well a particular insurer fits within its rating category can be found in Moody's published research about thatinsurer.
The quantitative metrics used in the methodology are expected to use a consistent basis of accounting dependingupon the region (Generally Accepted Accounting Principles, International Financial Reporting Standards, etc). Werecognize that different accounting conventions do not necessarily always produce the same financial results, butbelieve that the differences, for the most part, are minimal relative to the rating ranges established. To the extent thatother accounting conventions are used by a company, we may also use that accounting convention as a proxy forGAAP, with appropriate interpretation of the results.
Rating Summary Profile
As part of the rating committee process, analysts complete a Rating Summary Profile which incorporates the analyst'sopinion and judgment on each of the broad factors within the rating methodology, which may include the use of pro-prietary, non-public data. In general, business profile factors represent about one-third of the overall rating determi-nation while financial profile factors represent the remaining two-thirds2.
Analysts then complete an assessment of management, governance, and risk management; accounting policy anddisclosure; sovereign and economic environment; and explicit/implicit support in order to explain the overall stand-alone and final public rating recommendation for the analytic unit. An example of a Rating Summary Profile can befound below.
1. The methodology is best applied at the analytic unit level. An analytic unit is generally all the operating companies with common analytic and credit characteristics operating in a single country or geographic region. An analytic unit could include a group of companies operating outside of a single geographic region if significant intercompany arrangements exist or there is a high degree of integration in the management, systems, distribution, etc.
2. For a more detailed outline of the relative importance of the various factors, please refer to a review of Moody's Rating Scorecard in Appendix 1.
4 Moody’s Rating Methodology
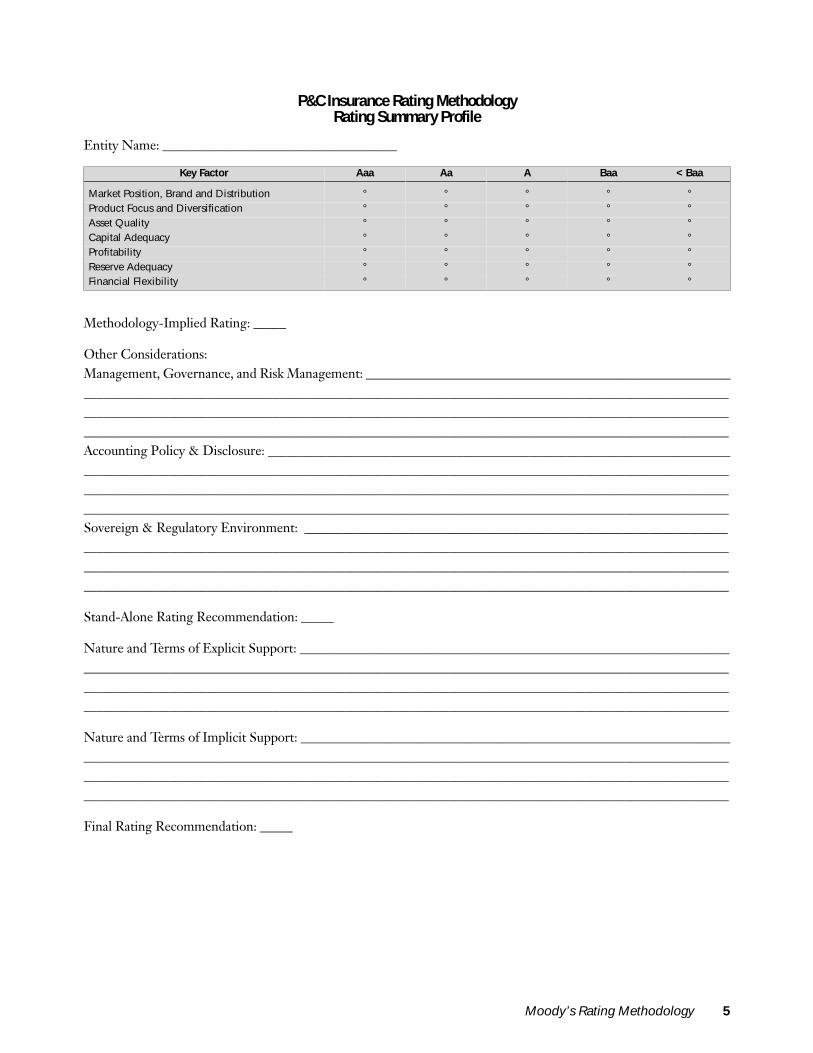
P&C Insurance Rating Methodology Rating Summary Profile
Entity Name: ____________________________________
Methodology-Implied Rating: _____
Other Considerations:Management, Governance, and Risk Management: _________________________________________________________________________________________________________________________________________________________________________________________________________________________________________________________________________________________________________________________________________________________________Accounting Policy & Disclosure: ________________________________________________________________________________________________________________________________________________________________________________________________________________________________________________________________________________________________________________________________________________________________________________Sovereign & Regulatory Environment: __________________________________________________________________________________________________________________________________________________________________________________________________________________________________________________________________________________________________________________________________________________________________________
Stand-Alone Rating Recommendation: _____
Nature and Terms of Explicit Support: ___________________________________________________________________________________________________________________________________________________________________________________________________________________________________________________________________________________________________________________________________________________________________________
Nature and Terms of Implicit Support: ___________________________________________________________________________________________________________________________________________________________________________________________________________________________________________________________________________________________________________________________________________________________________________
Final Rating Recommendation: _____
Key Factor Aaa Aa A Baa < Baa
Market Position, Brand and Distribution ° ° ° ° °Product Focus and Diversification ° ° ° ° °Asset Quality ° ° ° ° °Capital Adequacy ° ° ° ° °Profitability ° ° ° ° °Reserve Adequacy ° ° ° ° °Financial Flexibility ° ° ° ° °
Moody’s Rating Methodology 5
Key Rating Factors - Business Profile
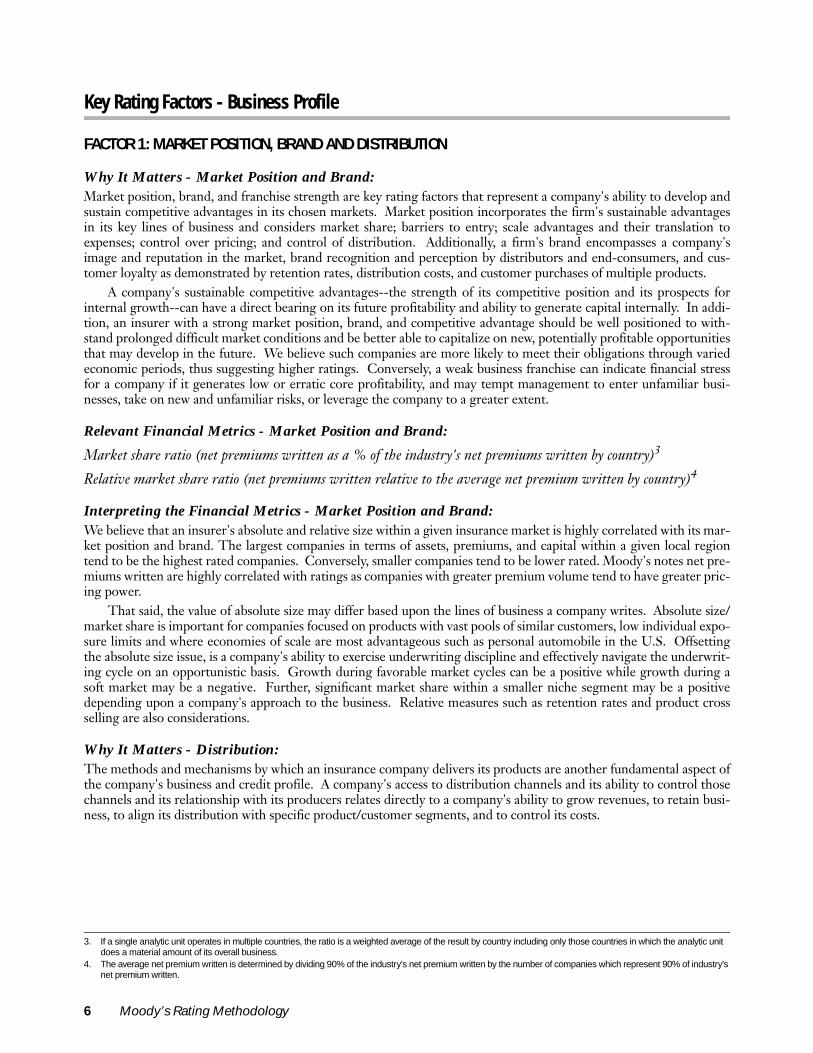
FACTOR 1: MARKET POSITION, BRAND AND DISTRIBUTION
Why It Matters - Market Position and Brand:Market position, brand, and franchise strength are key rating factors that represent a company's ability to develop andsustain competitive advantages in its chosen markets. Market position incorporates the firm's sustainable advantagesin its key lines of business and considers market share; barriers to entry; scale advantages and their translation toexpenses; control over pricing; and control of distribution. Additionally, a firm's brand encompasses a company'simage and reputation in the market, brand recognition and perception by distributors and end-consumers, and cus-tomer loyalty as demonstrated by retention rates, distribution costs, and customer purchases of multiple products.
A company's sustainable competitive advantages--the strength of its competitive position and its prospects forinternal growth--can have a direct bearing on its future profitability and ability to generate capital internally. In addi-tion, an insurer with a strong market position, brand, and competitive advantage should be well positioned to with-stand prolonged difficult market conditions and be better able to capitalize on new, potentially profitable opportunitiesthat may develop in the future. We believe such companies are more likely to meet their obligations through variedeconomic periods, thus suggesting higher ratings. Conversely, a weak business franchise can indicate financial stressfor a company if it generates low or erratic core profitability, and may tempt management to enter unfamiliar busi-nesses, take on new and unfamiliar risks, or leverage the company to a greater extent.
Relevant Financial Metrics - Market Position and Brand:
Market share ratio (net premiums written as a % of the industry's net premiums written by country)3
Relative market share ratio (net premiums written relative to the average net premium written by country)4
Interpreting the Financial Metrics - Market Position and Brand:We believe that an insurer's absolute and relative size within a given insurance market is highly correlated with its mar-ket position and brand. The largest companies in terms of assets, premiums, and capital within a given local regiontend to be the highest rated companies. Conversely, smaller companies tend to be lower rated. Moody's notes net pre-miums written are highly correlated with ratings as companies with greater premium volume tend to have greater pric-ing power.
That said, the value of absolute size may differ based upon the lines of business a company writes. Absolute size/market share is important for companies focused on products with vast pools of similar customers, low individual expo-sure limits and where economies of scale are most advantageous such as personal automobile in the U.S. Offsettingthe absolute size issue, is a company's ability to exercise underwriting discipline and effectively navigate the underwrit-ing cycle on an opportunistic basis. Growth during favorable market cycles can be a positive while growth during asoft market may be a negative. Further, significant market share within a smaller niche segment may be a positivedepending upon a company's approach to the business. Relative measures such as retention rates and product crossselling are also considerations.
Why It Matters - Distribution:The methods and mechanisms by which an insurance company delivers its products are another fundamental aspect ofthe company's business and credit profile. A company's access to distribution channels and its ability to control thosechannels and its relationship with its producers relates directly to a company's ability to grow revenues, to retain busi-ness, to align its distribution with specific product/customer segments, and to control its costs.
3. If a single analytic unit operates in multiple countries, the ratio is a weighted average of the result by country including only those countries in which the analytic unit does a material amount of its overall business.
4. The average net premium written is determined by dividing 90% of the industry's net premium written by the number of companies which represent 90% of industry's net premium written.
6 Moody’s Rating Methodology
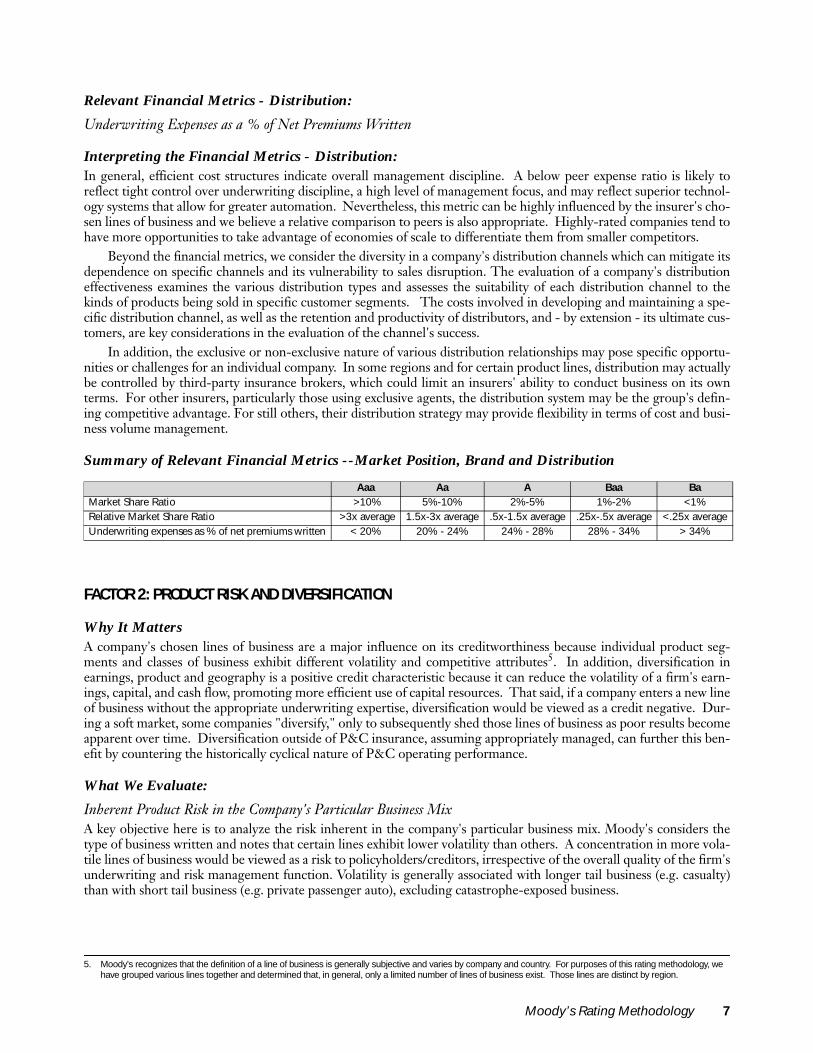
Relevant Financial Metrics - Distribution:
Underwriting Expenses as a % of Net Premiums Written
Interpreting the Financial Metrics - Distribution:In general, efficient cost structures indicate overall management discipline. A below peer expense ratio is likely toreflect tight control over underwriting discipline, a high level of management focus, and may reflect superior technol-ogy systems that allow for greater automation. Nevertheless, this metric can be highly influenced by the insurer's cho-sen lines of business and we believe a relative comparison to peers is also appropriate. Highly-rated companies tend tohave more opportunities to take advantage of economies of scale to differentiate them from smaller competitors.
Beyond the financial metrics, we consider the diversity in a company's distribution channels which can mitigate itsdependence on specific channels and its vulnerability to sales disruption. The evaluation of a company's distributioneffectiveness examines the various distribution types and assesses the suitability of each distribution channel to thekinds of products being sold in specific customer segments. The costs involved in developing and maintaining a spe-cific distribution channel, as well as the retention and productivity of distributors, and - by extension - its ultimate cus-tomers, are key considerations in the evaluation of the channel's success.
In addition, the exclusive or non-exclusive nature of various distribution relationships may pose specific opportu-nities or challenges for an individual company. In some regions and for certain product lines, distribution may actuallybe controlled by third-party insurance brokers, which could limit an insurers' ability to conduct business on its ownterms. For other insurers, particularly those using exclusive agents, the distribution system may be the group's defin-ing competitive advantage. For still others, their distribution strategy may provide flexibility in terms of cost and busi-ness volume management.
Summary of Relevant Financial Metrics --Market Position, Brand and Distribution
FACTOR 2: PRODUCT RISK AND DIVERSIFICATION
Why It Matters A company's chosen lines of business are a major influence on its creditworthiness because individual product seg-ments and classes of business exhibit different volatility and competitive attributes5. In addition, diversification inearnings, product and geography is a positive credit characteristic because it can reduce the volatility of a firm's earn-ings, capital, and cash flow, promoting more efficient use of capital resources. That said, if a company enters a new lineof business without the appropriate underwriting expertise, diversification would be viewed as a credit negative. Dur-ing a soft market, some companies "diversify," only to subsequently shed those lines of business as poor results becomeapparent over time. Diversification outside of P&C insurance, assuming appropriately managed, can further this ben-efit by countering the historically cyclical nature of P&C operating performance.
What We Evaluate:
Inherent Product Risk in the Company's Particular Business MixA key objective here is to analyze the risk inherent in the company's particular business mix. Moody's considers thetype of business written and notes that certain lines exhibit lower volatility than others. A concentration in more vola-tile lines of business would be viewed as a risk to policyholders/creditors, irrespective of the overall quality of the firm'sunderwriting and risk management function. Volatility is generally associated with longer tail business (e.g. casualty)than with short tail business (e.g. private passenger auto), excluding catastrophe-exposed business.
Aaa Aa A Baa BaMarket Share Ratio >10% 5%-10% 2%-5% 1%-2% <1%Relative Market Share Ratio >3x average 1.5x-3x average .5x-1.5x average .25x-.5x average <.25x averageUnderwriting expenses as % of net premiums written < 20% 20% - 24% 24% - 28% 28% - 34% > 34%
5. Moody's recognizes that the definition of a line of business is generally subjective and varies by company and country. For purposes of this rating methodology, we have grouped various lines together and determined that, in general, only a limited number of lines of business exist. Those lines are distinct by region.
Moody’s Rating Methodology 7

Relevant Financial Metrics:
Product Diversification - absolute number of material distinct product lines
Geographic diversification - absolute number of individual regulated regions without meaningful concentrations in which the analytic unit transacts business
Interpreting the Financial Metrics:The evaluation of market diversity considers the breadth and depth of markets and products the company targets. Theevaluation of product/market diversity (within a geographic region6 or across different geographic regions or indus-tries) includes an assessment of the concentration and competition in the product/market; correlation of revenues andearnings of different markets and products; and whether the product is viewed as a commodity or a value-added offer-ing. Analysts' judgment is particularly important in assessing diversification within product lines given that the typesof product offerings can vary significantly across the globe.
Regulatory diversification tries to capture the extent of regulatory risk faced by a company. Diversification of rev-enues in and of itself is not a positive factor if profits are also not diversified or if geographic diversification comes inregions which are overly restrictive in terms of pricing controls or capital measures. Moody's separately considers theunderwriting risk associated with geographic concentrations in the evaluation of risk management.
Beyond the financial metrics, we also consider a company's underwriting controls, pricing sophistication, staff,and technology in the context of the company's chosen lines of business. We also consider whether the analytic unithas operations outside of property & casualty insurance which may enhance diversification. As such, we also considerthe quality of diversification; the company's ability to manage diverse businesses unrelated to the core; the synergies orlack thereof among diversified businesses; and the degree to which diversified businesses detract from a focus on thecore or add value to the enterprise as a whole.
Summary of Relevant Financial Metrics -Product Focus and Diversification
6. For purposes of the methodology, a geographic region is generally considered to be any market with a single regulator.
Aaa Aa A Baa BaProduct Risk Very granular
exposures; short-tail lines; very low risk of estimating ultimate claim costs
Granular exposures; short- and medium-tailed lines represent more than 2/3rd of premiums; generally moderate risk of estimating ultimate claim costs, but may have manageable property catastrophe risk
Policies may have high gross limits relative to equity; risk of estimating ultimate claim costs is meaningful; longer-tailed lines may represent more than 1/3rd of premiums; manageable catastrophe risk may be present in either casualty or property exposures
Longer-tailed lines are majority of premiums and/or policies have high gross limits relative to equity; risk of estimating ultimate claim cost may be significant; significant catastrophe risk may be present in either casualty or property exposures
Combination of size of in-force portfolio and size of individual policies limits application of "law of large numbers"; claim cost estimation risk is high; catastrophe risk is substantial
Product Diversification 5 or more distinct lines of business each produce at least 10% of total net P&C premiums written
4 distinct lines of business each produce at least 10% of total net P&C premiums written
3 distinct lines of business each produce at least 10% of total net P&C premiums written
2 distinct lines of business each produce at least 10% of total net P&C premiums written
1 distinct line of business produces more than 90% of total net P&C premiums written
Regulatory Diversification No single regulated region generates more than 10% of total net P&C premiums written
No single regulated region generates more than 20% of total net P&C premiums written
No single regulated region generates more than 30% of total net P&C premiums written
No single regulated region generates more than 40% of total net P&C premiums written
One regulated region generates more than 40% of total net P&C premiums written
8 Moody’s Rating Methodology
Key Rating Factors - Financial Profile
FACTOR 3: ASSET RISK
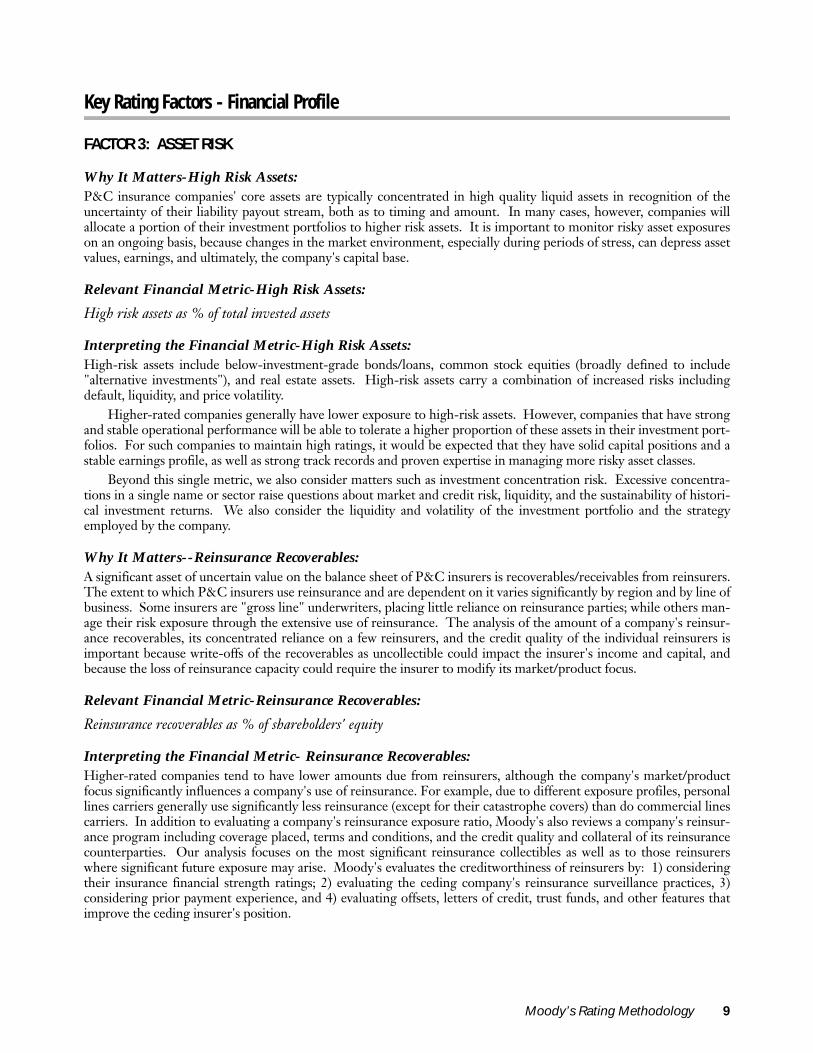
Why It Matters-High Risk Assets: P&C insurance companies' core assets are typically concentrated in high quality liquid assets in recognition of theuncertainty of their liability payout stream, both as to timing and amount. In many cases, however, companies willallocate a portion of their investment portfolios to higher risk assets. It is important to monitor risky asset exposureson an ongoing basis, because changes in the market environment, especially during periods of stress, can depress assetvalues, earnings, and ultimately, the company's capital base.
Relevant Financial Metric-High Risk Assets:
High risk assets as % of total invested assets
Interpreting the Financial Metric-High Risk Assets:High-risk assets include below-investment-grade bonds/loans, common stock equities (broadly defined to include"alternative investments"), and real estate assets. High-risk assets carry a combination of increased risks includingdefault, liquidity, and price volatility.
Higher-rated companies generally have lower exposure to high-risk assets. However, companies that have strongand stable operational performance will be able to tolerate a higher proportion of these assets in their investment port-folios. For such companies to maintain high ratings, it would be expected that they have solid capital positions and astable earnings profile, as well as strong track records and proven expertise in managing more risky asset classes.
Beyond this single metric, we also consider matters such as investment concentration risk. Excessive concentra-tions in a single name or sector raise questions about market and credit risk, liquidity, and the sustainability of histori-cal investment returns. We also consider the liquidity and volatility of the investment portfolio and the strategyemployed by the company.
Why It Matters--Reinsurance Recoverables:A significant asset of uncertain value on the balance sheet of P&C insurers is recoverables/receivables from reinsurers.The extent to which P&C insurers use reinsurance and are dependent on it varies significantly by region and by line ofbusiness. Some insurers are "gross line" underwriters, placing little reliance on reinsurance parties; while others man-age their risk exposure through the extensive use of reinsurance. The analysis of the amount of a company's reinsur-ance recoverables, its concentrated reliance on a few reinsurers, and the credit quality of the individual reinsurers isimportant because write-offs of the recoverables as uncollectible could impact the insurer's income and capital, andbecause the loss of reinsurance capacity could require the insurer to modify its market/product focus.
Relevant Financial Metric-Reinsurance Recoverables:
Reinsurance recoverables as % of shareholders' equity
Interpreting the Financial Metric- Reinsurance Recoverables:Higher-rated companies tend to have lower amounts due from reinsurers, although the company's market/productfocus significantly influences a company's use of reinsurance. For example, due to different exposure profiles, personallines carriers generally use significantly less reinsurance (except for their catastrophe covers) than do commercial linescarriers. In addition to evaluating a company's reinsurance exposure ratio, Moody's also reviews a company's reinsur-ance program including coverage placed, terms and conditions, and the credit quality and collateral of its reinsurancecounterparties. Our analysis focuses on the most significant reinsurance collectibles as well as to those reinsurerswhere significant future exposure may arise. Moody's evaluates the creditworthiness of reinsurers by: 1) consideringtheir insurance financial strength ratings; 2) evaluating the ceding company's reinsurance surveillance practices, 3)considering prior payment experience, and 4) evaluating offsets, letters of credit, trust funds, and other features thatimprove the ceding insurer's position.
Moody’s Rating Methodology 9
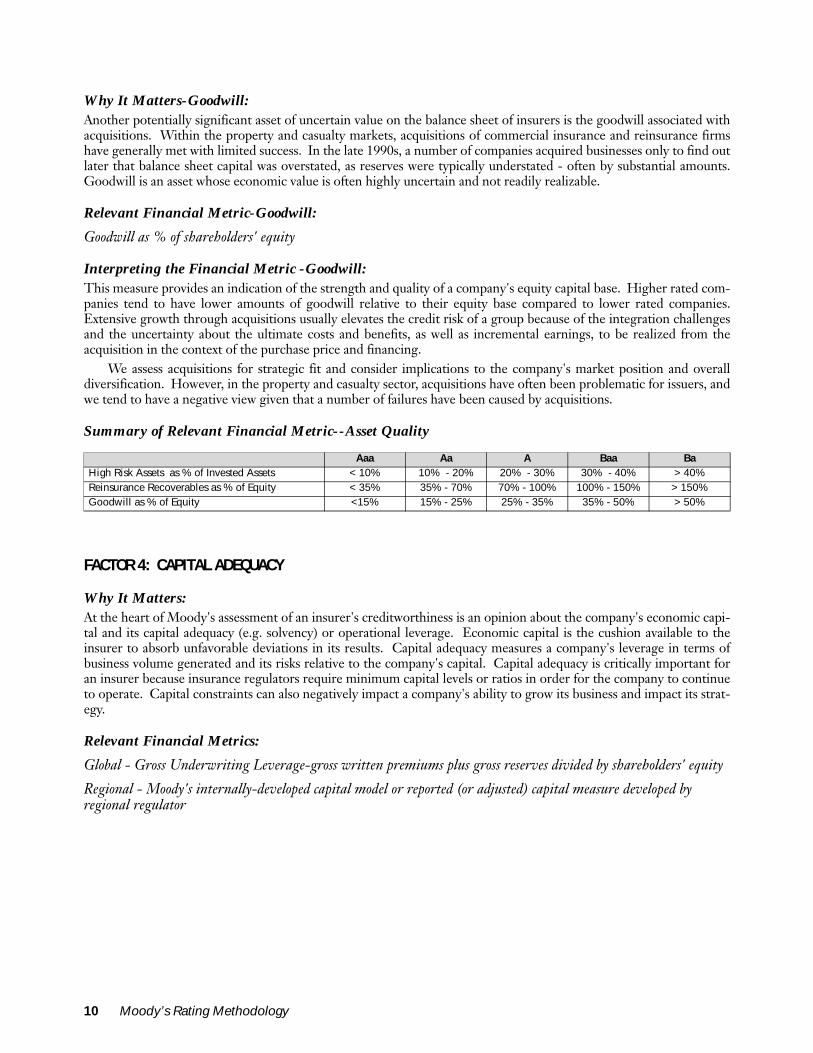
Why It Matters-Goodwill:Another potentially significant asset of uncertain value on the balance sheet of insurers is the goodwill associated withacquisitions. Within the property and casualty markets, acquisitions of commercial insurance and reinsurance firmshave generally met with limited success. In the late 1990s, a number of companies acquired businesses only to find outlater that balance sheet capital was overstated, as reserves were typically understated - often by substantial amounts.Goodwill is an asset whose economic value is often highly uncertain and not readily realizable.
Relevant Financial Metric-Goodwill:
Goodwill as % of shareholders' equity
Interpreting the Financial Metric -Goodwill: This measure provides an indication of the strength and quality of a company's equity capital base. Higher rated com-panies tend to have lower amounts of goodwill relative to their equity base compared to lower rated companies.Extensive growth through acquisitions usually elevates the credit risk of a group because of the integration challengesand the uncertainty about the ultimate costs and benefits, as well as incremental earnings, to be realized from theacquisition in the context of the purchase price and financing.
We assess acquisitions for strategic fit and consider implications to the company's market position and overalldiversification. However, in the property and casualty sector, acquisitions have often been problematic for issuers, andwe tend to have a negative view given that a number of failures have been caused by acquisitions.
Summary of Relevant Financial Metric--Asset Quality
FACTOR 4: CAPITAL ADEQUACY
Why It Matters: At the heart of Moody's assessment of an insurer's creditworthiness is an opinion about the company's economic capi-tal and its capital adequacy (e.g. solvency) or operational leverage. Economic capital is the cushion available to theinsurer to absorb unfavorable deviations in its results. Capital adequacy measures a company's leverage in terms ofbusiness volume generated and its risks relative to the company's capital. Capital adequacy is critically important foran insurer because insurance regulators require minimum capital levels or ratios in order for the company to continueto operate. Capital constraints can also negatively impact a company's ability to grow its business and impact its strat-egy.
Relevant Financial Metrics:
Global - Gross Underwriting Leverage-gross written premiums plus gross reserves divided by shareholders' equity
Regional - Moody's internally-developed capital model or reported (or adjusted) capital measure developed by regional regulator
Aaa Aa A Baa BaHigh Risk Assets as % of Invested Assets < 10% 10% - 20% 20% - 30% 30% - 40% > 40%Reinsurance Recoverables as % of Equity < 35% 35% - 70% 70% - 100% 100% - 150% > 150%Goodwill as % of Equity <15% 15% - 25% 25% - 35% 35% - 50% > 50%
10 Moody’s Rating Methodology

Interpreting the Financial Metrics:In general, the higher a company's gross underwriting leverage, the more risk it is assuming and the greater the impacton its capital position from variations in actual performance. The concept of gross underwriting leverage is sufficientlybroad to allow Moody's to evaluate an insurer's use of reinsurance to determine the degree to which the companyrelies on it for leverage. Higher rated insurers tend to have lower gross underwriting leverage than lower rated com-panies.
With advances in economic capital models, gross underwriting leverage is a rather blunt measure which necessi-tates further analysis of a company's mix of business and rate driven volume changes; as a result, it is most useful whencomparing companies that have a similar business mix. Other meaningful influences on gross underwriting leverageinclude the duration of liabilities and an assessment on a company's payout patterns.
In several regions, additional capital metrics are also included to supplement gross underwriting leverage. Thesemetrics may be developed internally by Moody's or are calculated under existing regulatory models. See Appendix 2for a discussion of regional capital measures.
Summary of Relevant Financial Metrics--Capital Adequacy
FACTOR 5: PROFITABILITY
Why It Matters:An insurer's earnings capacity--quality and sustainability--is a critical component of its creditworthiness because earn-ings are a primary determinant of the insurer's ability to meet its policy and financial obligations, the primary source ofinternal capital generation to assure capital adequacy, and a key determinant of access to the capital markets on favor-able terms. Diversification across multiple product lines and markets can result in more stable levels of earnings,increasing the predictability of internal capital growth and strengthening claims/debt paying ability.
Relevant Financial Metrics:
Return on Equity (ROE)-Net income as a % of average shareholders' equity (5 year average)
Sharpe Ratio of Growth in Net income-Absolute value of the mean of the company's growth in annual net income divided by the standard deviation of growth in net income (5 year period)7
Interpreting the Financial Metrics:In general, higher rated companies tend to have higher profitability as measured by ROE and have less earnings vola-tility than lower rated companies.
The ROE ratio is a good measure of how well the insurer is utilizing its capital funds. Although creditors rankahead of shareholders in insolvency, one cannot ignore the impact of shareholder pressure on management to generatesufficient returns on invested capital. This is especially the case as the forces of return and capital adequacy sometimescompete against each other such as when capital cushions that support high ratings may suppress the return on equity.Therefore, ROE must be viewed in concert with both a company's financial leverage and organizational/legal struc-ture. The relationship to financial leverage is important because companies utilizing higher amounts of leverage mayexhibit more favorable ROE, as a smaller equity base tends to improve this measure, all else being equal. Also the typeof organization may influence expected ROE as mutual insurers tend to have different return objectives than stockcompanies.
Management's response to shareholder pressures to improve ROE could be to lower the "E" rather than increasethe "R". For these reasons, Return on Revenue (ROR) can be another useful comparative measure of profitability, as itis less influenced by a company's financial leverage policy or its capital adequacy. The ROR metric over time is gener-ally a good indicator of an insurer's underwriting skill and pricing discipline relative to its peers while also capturinginvestment performance.
Aaa Aa A Baa BaGross Underwriting Leverage <2x 2x - 3x 3x - 5x 5x - 7x >7x
7. If an analytic unit has reported a net loss in any of the past six calendar years, the ratio is not calculated and the analytic unit is automatically placed in the Ba rating category.
Moody’s Rating Methodology 11
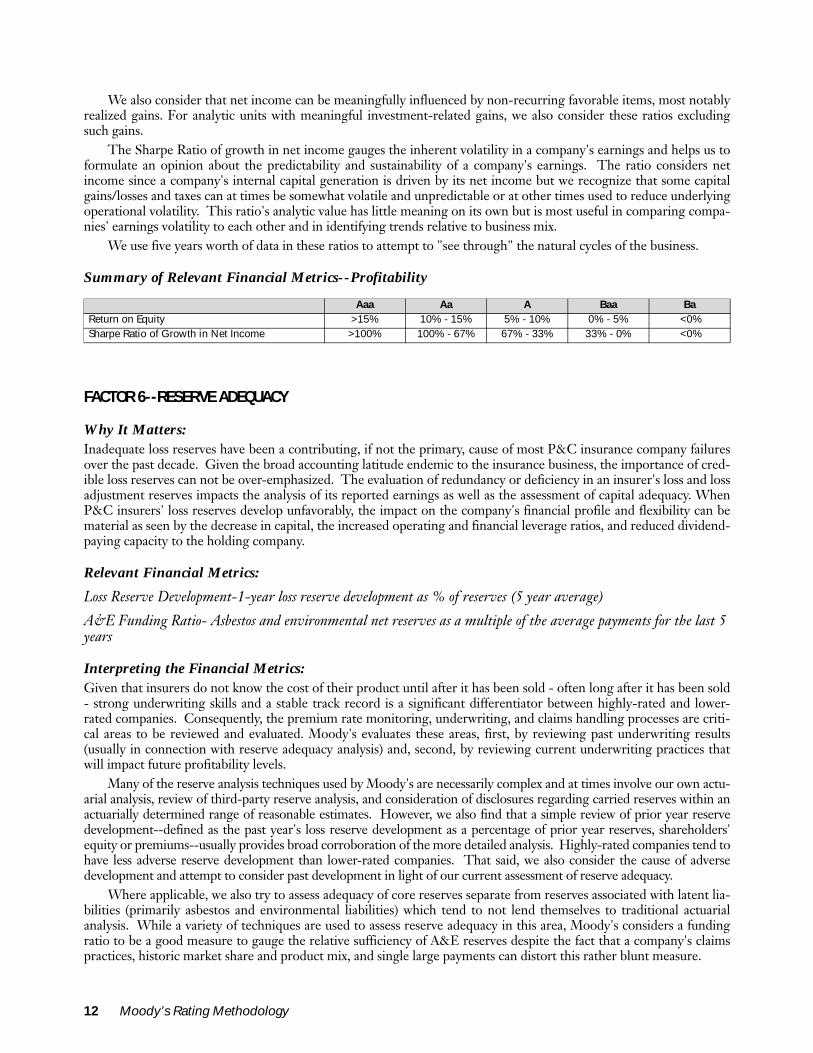
We also consider that net income can be meaningfully influenced by non-recurring favorable items, most notablyrealized gains. For analytic units with meaningful investment-related gains, we also consider these ratios excludingsuch gains.
The Sharpe Ratio of growth in net income gauges the inherent volatility in a company's earnings and helps us toformulate an opinion about the predictability and sustainability of a company's earnings. The ratio considers netincome since a company's internal capital generation is driven by its net income but we recognize that some capitalgains/losses and taxes can at times be somewhat volatile and unpredictable or at other times used to reduce underlyingoperational volatility. This ratio's analytic value has little meaning on its own but is most useful in comparing compa-nies' earnings volatility to each other and in identifying trends relative to business mix.
We use five years worth of data in these ratios to attempt to "see through" the natural cycles of the business.
Summary of Relevant Financial Metrics--Profitability
FACTOR 6--RESERVE ADEQUACY
Why It Matters:Inadequate loss reserves have been a contributing, if not the primary, cause of most P&C insurance company failuresover the past decade. Given the broad accounting latitude endemic to the insurance business, the importance of cred-ible loss reserves can not be over-emphasized. The evaluation of redundancy or deficiency in an insurer's loss and lossadjustment reserves impacts the analysis of its reported earnings as well as the assessment of capital adequacy. WhenP&C insurers' loss reserves develop unfavorably, the impact on the company's financial profile and flexibility can bematerial as seen by the decrease in capital, the increased operating and financial leverage ratios, and reduced dividend-paying capacity to the holding company.
Relevant Financial Metrics:
Loss Reserve Development-1-year loss reserve development as % of reserves (5 year average)
A&E Funding Ratio- Asbestos and environmental net reserves as a multiple of the average payments for the last 5 years
Interpreting the Financial Metrics:Given that insurers do not know the cost of their product until after it has been sold - often long after it has been sold- strong underwriting skills and a stable track record is a significant differentiator between highly-rated and lower-rated companies. Consequently, the premium rate monitoring, underwriting, and claims handling processes are criti-cal areas to be reviewed and evaluated. Moody's evaluates these areas, first, by reviewing past underwriting results(usually in connection with reserve adequacy analysis) and, second, by reviewing current underwriting practices thatwill impact future profitability levels.
Many of the reserve analysis techniques used by Moody's are necessarily complex and at times involve our own actu-arial analysis, review of third-party reserve analysis, and consideration of disclosures regarding carried reserves within anactuarially determined range of reasonable estimates. However, we also find that a simple review of prior year reservedevelopment--defined as the past year's loss reserve development as a percentage of prior year reserves, shareholders'equity or premiums--usually provides broad corroboration of the more detailed analysis. Highly-rated companies tend tohave less adverse reserve development than lower-rated companies. That said, we also consider the cause of adversedevelopment and attempt to consider past development in light of our current assessment of reserve adequacy.
Where applicable, we also try to assess adequacy of core reserves separate from reserves associated with latent lia-bilities (primarily asbestos and environmental liabilities) which tend to not lend themselves to traditional actuarialanalysis. While a variety of techniques are used to assess reserve adequacy in this area, Moody's considers a fundingratio to be a good measure to gauge the relative sufficiency of A&E reserves despite the fact that a company's claimspractices, historic market share and product mix, and single large payments can distort this rather blunt measure.
Aaa Aa A Baa BaReturn on Equity >15% 10% - 15% 5% - 10% 0% - 5% <0%Sharpe Ratio of Growth in Net Income >100% 100% - 67% 67% - 33% 33% - 0% <0%
12 Moody’s Rating Methodology
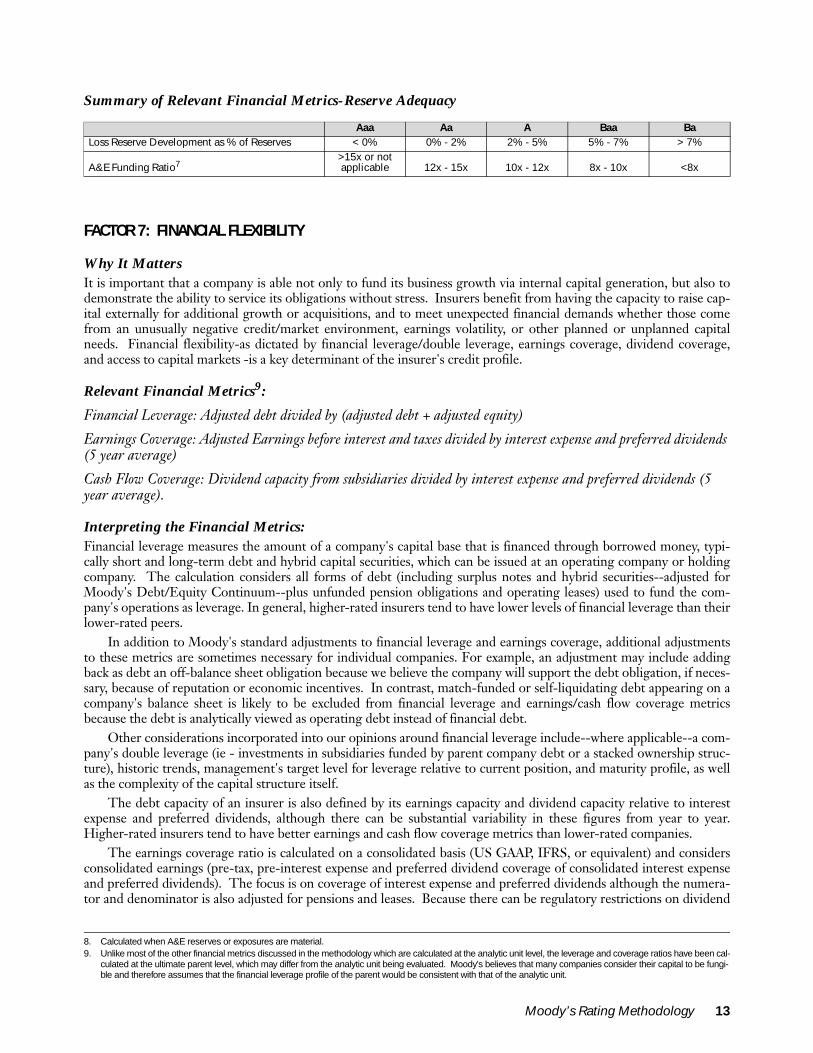
Summary of Relevant Financial Metrics-Reserve Adequacy8
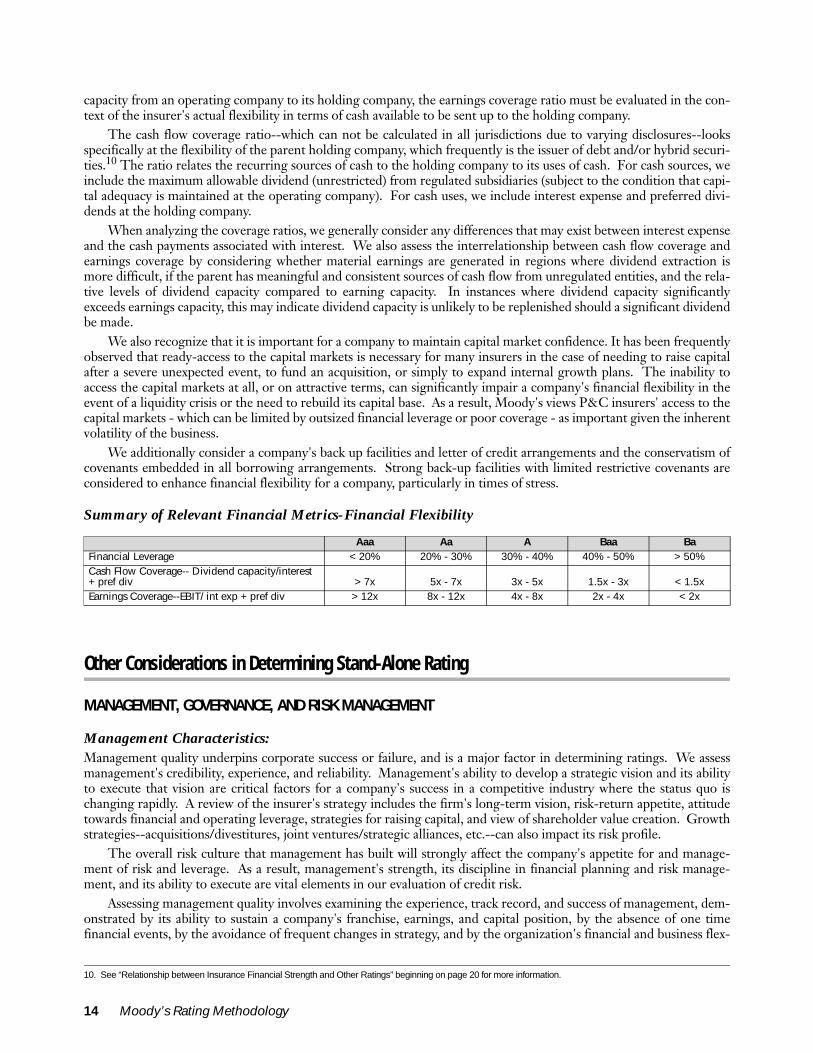
FACTOR 7: FINANCIAL FLEXIBILITY
Why It Matters It is important that a company is able not only to fund its business growth via internal capital generation, but also todemonstrate the ability to service its obligations without stress. Insurers benefit from having the capacity to raise cap-ital externally for additional growth or acquisitions, and to meet unexpected financial demands whether those comefrom an unusually negative credit/market environment, earnings volatility, or other planned or unplanned capitalneeds. Financial flexibility-as dictated by financial leverage/double leverage, earnings coverage, dividend coverage,and access to capital markets -is a key determinant of the insurer's credit profile.
Relevant Financial Metrics9:
Financial Leverage: Adjusted debt divided by (adjusted debt + adjusted equity)
Earnings Coverage: Adjusted Earnings before interest and taxes divided by interest expense and preferred dividends (5 year average)
Cash Flow Coverage: Dividend capacity from subsidiaries divided by interest expense and preferred dividends (5 year average).
Interpreting the Financial Metrics:Financial leverage measures the amount of a company's capital base that is financed through borrowed money, typi-cally short and long-term debt and hybrid capital securities, which can be issued at an operating company or holdingcompany. The calculation considers all forms of debt (including surplus notes and hybrid securities--adjusted forMoody's Debt/Equity Continuum--plus unfunded pension obligations and operating leases) used to fund the com-pany's operations as leverage. In general, higher-rated insurers tend to have lower levels of financial leverage than theirlower-rated peers.
In addition to Moody's standard adjustments to financial leverage and earnings coverage, additional adjustmentsto these metrics are sometimes necessary for individual companies. For example, an adjustment may include addingback as debt an off-balance sheet obligation because we believe the company will support the debt obligation, if neces-sary, because of reputation or economic incentives. In contrast, match-funded or self-liquidating debt appearing on acompany's balance sheet is likely to be excluded from financial leverage and earnings/cash flow coverage metricsbecause the debt is analytically viewed as operating debt instead of financial debt.
Other considerations incorporated into our opinions around financial leverage include--where applicable--a com-pany's double leverage (ie - investments in subsidiaries funded by parent company debt or a stacked ownership struc-ture), historic trends, management's target level for leverage relative to current position, and maturity profile, as wellas the complexity of the capital structure itself.
The debt capacity of an insurer is also defined by its earnings capacity and dividend capacity relative to interestexpense and preferred dividends, although there can be substantial variability in these figures from year to year.Higher-rated insurers tend to have better earnings and cash flow coverage metrics than lower-rated companies.
The earnings coverage ratio is calculated on a consolidated basis (US GAAP, IFRS, or equivalent) and considersconsolidated earnings (pre-tax, pre-interest expense and preferred dividend coverage of consolidated interest expenseand preferred dividends). The focus is on coverage of interest expense and preferred dividends although the numera-tor and denominator is also adjusted for pensions and leases. Because there can be regulatory restrictions on dividend
8. Calculated when A&E reserves or exposures are material.
Aaa Aa A Baa BaLoss Reserve Development as % of Reserves < 0% 0% - 2% 2% - 5% 5% - 7% > 7%
A&E Funding Ratio7 >15x or not applicable 12x - 15x 10x - 12x 8x - 10x <8x
9. Unlike most of the other financial metrics discussed in the methodology which are calculated at the analytic unit level, the leverage and coverage ratios have been cal-culated at the ultimate parent level, which may differ from the analytic unit being evaluated. Moody's believes that many companies consider their capital to be fungi-ble and therefore assumes that the financial leverage profile of the parent would be consistent with that of the analytic unit.
Moody’s Rating Methodology 13
capacity from an operating company to its holding company, the earnings coverage ratio must be evaluated in the con-text of the insurer's actual flexibility in terms of cash available to be sent up to the holding company.
The cash flow coverage ratio--which can not be calculated in all jurisdictions due to varying disclosures--looksspecifically at the flexibility of the parent holding company, which frequently is the issuer of debt and/or hybrid securi-ties.10 The ratio relates the recurring sources of cash to the holding company to its uses of cash. For cash sources, weinclude the maximum allowable dividend (unrestricted) from regulated subsidiaries (subject to the condition that capi-tal adequacy is maintained at the operating company). For cash uses, we include interest expense and preferred divi-dends at the holding company.
When analyzing the coverage ratios, we generally consider any differences that may exist between interest expenseand the cash payments associated with interest. We also assess the interrelationship between cash flow coverage andearnings coverage by considering whether material earnings are generated in regions where dividend extraction ismore difficult, if the parent has meaningful and consistent sources of cash flow from unregulated entities, and the rela-tive levels of dividend capacity compared to earning capacity. In instances where dividend capacity significantlyexceeds earnings capacity, this may indicate dividend capacity is unlikely to be replenished should a significant dividendbe made.
We also recognize that it is important for a company to maintain capital market confidence. It has been frequentlyobserved that ready-access to the capital markets is necessary for many insurers in the case of needing to raise capitalafter a severe unexpected event, to fund an acquisition, or simply to expand internal growth plans. The inability toaccess the capital markets at all, or on attractive terms, can significantly impair a company's financial flexibility in theevent of a liquidity crisis or the need to rebuild its capital base. As a result, Moody's views P&C insurers' access to thecapital markets - which can be limited by outsized financial leverage or poor coverage - as important given the inherentvolatility of the business.
We additionally consider a company's back up facilities and letter of credit arrangements and the conservatism ofcovenants embedded in all borrowing arrangements. Strong back-up facilities with limited restrictive covenants areconsidered to enhance financial flexibility for a company, particularly in times of stress.
Summary of Relevant Financial Metrics-Financial Flexibility
Other Considerations in Determining Stand-Alone Rating
MANAGEMENT, GOVERNANCE, AND RISK MANAGEMENT
Management Characteristics:Management quality underpins corporate success or failure, and is a major factor in determining ratings. We assessmanagement's credibility, experience, and reliability. Management's ability to develop a strategic vision and its abilityto execute that vision are critical factors for a company's success in a competitive industry where the status quo ischanging rapidly. A review of the insurer's strategy includes the firm's long-term vision, risk-return appetite, attitudetowards financial and operating leverage, strategies for raising capital, and view of shareholder value creation. Growthstrategies--acquisitions/divestitures, joint ventures/strategic alliances, etc.--can also impact its risk profile.
The overall risk culture that management has built will strongly affect the company's appetite for and manage-ment of risk and leverage. As a result, management's strength, its discipline in financial planning and risk manage-ment, and its ability to execute are vital elements in our evaluation of credit risk.
Assessing management quality involves examining the experience, track record, and success of management, dem-onstrated by its ability to sustain a company's franchise, earnings, and capital position, by the absence of one timefinancial events, by the avoidance of frequent changes in strategy, and by the organization's financial and business flex-
10. See “Relationship between Insurance Financial Strength and Other Ratings” beginning on page 20 for more information.
Aaa Aa A Baa BaFinancial Leverage < 20% 20% - 30% 30% - 40% 40% - 50% > 50%Cash Flow Coverage-- Dividend capacity/interest + pref div > 7x 5x - 7x 3x - 5x 1.5x - 3x < 1.5xEarnings Coverage--EBIT/ int exp + pref div > 12x 8x - 12x 4x - 8x 2x - 4x < 2x
14 Moody’s Rating Methodology
ibility. We consider its management depth as well as its financial track record in such areas as reserves, investments,profitability, and risk management. Management's strategy, as measured by overall growth or new business develop-ment, also plays an important role in our opinion of an insurer's credit profile. Throughout the rating process,Moody's forms an opinion of a management team's likely response to challenges in the firm's economic, competitiveand regulatory environment given their goals and motivations.
Corporate GovernanceCorporate governance as promoted by the board of directors, as the natural counterpart to management, is equallyresponsible for the financial health and credit profile of the company. Depth of corporate governance is evaluated bythe corporate board's independence, expertise, and involvement, as well as its ability to align governance practices withproper oversight of the management team and corporate strategy. Independent review of the key financial reportingand risk management processes is important, as is oversight of compliance and regulatory issues. The board plays acentral role in ensuring management sets the appropriate ethical tone within the company. Compensation schemesand the board's oversight of compensation practices are also considered for their potential impact on management'smotivations. Plans that reward management and employees for building long-term value in the company tend to beviewed positively from a credit perspective.
Moody's also contemplates the interests, motivations, track-record, and resources of large shareholders in order toanticipate how they may be expected to behave and respond with regards to their investment, both in the normalcourse of events and in times of stress. The often conflicting interests of shareholders and policyholders are also takeninto account when considering an insurer's governance, in terms of how the board and management team balancesthese demands.
In this regard, Moody's believes that there is a natural and effective alignment between the interests of managersand directors with policyholders and creditors at a mutual insurer, compared to the case with a public-stock company,where shareholders can pressure the managers for payouts and shorter-term results. However, drawbacks associatedwith the mutual structure often include less management accountability and transparency. The latter concernbecomes significant when the mutual has adopted an aggressive strategy that is more characteristic of a stock company.
Risk ManagementManagement's and the board's ability to identify, monitor, manage, and mitigate its risks goes to the heart of a com-pany's success in minimizing unexpected events and volatility and in protecting the interests of its policyholders andother stakeholders. Taking risks, whether in underwriting, investments, sales practices, acquisitions, or other areas, is anecessary activity for an insurance company. However, it is vitally important that management (and the board of direc-tors) understand the risks assumed and engage in active measures to manage those risks in order for the company tomaintain its financial performance and flexibility, reputation, market position, and confidence in the capital markets.The risk management discipline at an insurer is an essential part of its overall governance and management.
What We Evaluate Related to Management, Governance, and Risk Management:Given all the various inputs, the influence from management and governance on ratings is subjective. That said,Moody's has a general presumption that management is competent and governance and risk management protocoland procedures are appropriately designed and working. Moody's typically meets annually with members of manage-ment, and at times board members, in order to assess this important area. As noted in recently published research11,corporate governance does not typically affect ratings, except in rare situations.
In the area of risk management, Moody's has long considered catastrophe risk management - both natural andman-made - to be the most significant and volatile risk to capital over the short term. Our analysis assesses a com-pany's risk appetite and its ability to monitor and manage its risk exposures and also considers its reliance on reinsur-ance as a risk management tool. We evaluate catastrophe risk, both gross and net, relative to earnings andcapitalization. We incorporate the views of the company's third-party vendor models, internal surveys, relative marketshare analysis, and stress case scenarios.
11. See Moody's Special Comment: Assessing Corporate Governance As A Ratings Driver For North American Financial Institutions, April, 2006 (#97279) for further information.
Moody’s Rating Methodology 15
ACCOUNTING POLICY & DISCLOSURERelevant and timely financial information is a critical part of any financial analysis. Many insurers prepare financialinformation under generally accepted accounting principles either developed by their home country or based on inter-national standards. Financial information is also generally prepared on a regulatory basis of accounting which may dif-fer from generally accepted accounting principles. The presence of a strong government/independent body forfinancial standards is considered a positive factor when evaluating an accounting regime.
Disclosure of financial information varies widely on a global basis and within regions. In certain locations, regula-tory bodies provide access to financial information, although the depth of that information also varies. Some compa-nies have chosen to provide easy access to there own financial data which Moody's view favorably.
The consistent application of financial information is a fundamental presumption of financial analysis. Whenevaluating accounting principles, we consider how well financial reporting mirrors economic reality. Where webelieve the economics of a transaction are not consistent with financial reporting, we may adjust financial statements tofacilitate our analysis.
SOVEREIGN AND REGULATORY ENVIRONMENT The local jurisdiction's economic and political stability and the degree of government support/interference can have astrong impact--either positive or negative--on the credit profile of an insurance company. The presence of a well-developed local capital market may determine a company's ability to raise sufficient capital efficiently to grow or cush-ion itself against adverse financial conditions.
The insurer's credit profile is influenced by the regulatory rules and practices within its market, as well as potentialchanges in regulations or taxation of its products that could affect an insurer's competitive position, or could lead to arestructuring of segments of the industry. The failure-resolution mechanism and practices of the regulatory authori-ties can also impact an insurer's default rate and loss given default.
Measurement of a company's sovereign and regulatory environment incorporates the use of Moody's ForeignCurrency Country Ceiling as well as Moody's Local Currency Guideline. The local currency guideline reflects ourview of the country's political, economic and regulatory stability. We focus on Moody's Local Currency Guideline forthe insurer's primary market as this guideline generally sets the ceiling for the most financial secure company in agiven region.
16 Moody’s Rating Methodology
Moving From Stand-Alone Rating to Public Rating-Evaluating Support
While the above factors are critical in order to determine the stand-alone rating of P&C insurers, the analytic consid-eration of support-explicit or implicit-from a parent company or affiliate is necessary to get to the public rating, whichis usually higher than the company's stand-alone rating.
Support from a Parent Company or AffiliateThe credit rating of an insurer can ultimately be affected by its relationship to its parent, to a subsidiary, or to affiliatecompanies through either explicit or implicit support12. Support, once determined, is then generally "added to" therating by narrowing the spread between the stand-alone credit rating of the entity/security and the rating of the entityproviding the support.
Ultimately, the extent to which the affiliation benefits the rating is a matter of judgment, not convention, owing tothe large number of variables that must be considered. Our assessment of this support may vary depending on ourview of how important that entity is to the overall enterprise business model, its integration with the rest of the organi-zation from a branding, management, distribution, and operating perspective, as well as our view of the company'sability and willingness to support that entity. Support is evaluated in terms of past actions of the supporter as well ascurrent public statements of support.
In all cases, Moody's judgment about how the prospective supporting entity is likely to behave in the future isstrongly influenced by our assessment of its prospective economic motivations. Accordingly, strong public statementsof support would not be persuasive in raising the rating of a weaker subsidiary if a sound economic rationale for doingso was missing. Although support may raise a company's rating, it may not necessarily raise it to the same level as thatof the supporting entity.
While, in most instances, support is incrementally positive, there are instances where group affiliation may con-strain the public rating of an entity/security relative to its stand-alone rating level. For example, if the insurer is affili-ated with weak or highly-leveraged entities, such weaknesses usually, in turn, weaken the insurer. History has shownthat capital often flows from stronger to weaker companies within a controlled group, and frequently before regulatoryaction can occur.
Explicit support is usually intended to transfer the credit of the supporting entity to the supported affiliate or obli-gation. Explicit support is generally in the form of a capital maintenance agreement, minimum net worth agreement,or some type of direct guarantee. It can also take the form of management contracts, marketing arrangements, rein-surance agreements, or tax-sharing agreements. Specific to property and casualty insurers are pooling arrangementswhereby several members of the group share in the combined results of each individual company on a preset basis. Ingeneral, Moody's rates the members of a property and casualty pooling arrangement at the same rating level.
In analyzing this type of explicit support, we examine the specific legal nature and enforceability of the support, aswell as its possible termination. Explicit support, properly structured, can achieve credit transference and bring theaffiliate's rating up to that of the supporting entity. However, it is also necessary to make an assessment as to whetherthe extension of this support (as well as with implicit support) will weaken the credit profile of the parent or affiliateand result in a downgrade of the supporting entity.
Factoring in Support from Other Than Related EntitiesMoody's does not ascribe a meaningful level of implicit support to insurance companies from their governments.Indeed, past history has shown that insurers - even large ones - have been allowed by local and national governmentsto fail without intervention. If the insurer were directly owned by the government, however, support would be consid-ered according to Moody's methodology on "The Application of Joint Default Analysis to Government Related Issu-ers (April 2005)".
Finally, if the insurer is part of a bancassurance group, and there is clear evidence that failure of the insurer willhave negative implications on the creditworthiness of banking operations, the likelihood of support by the governmentmay increase. However, we expect such support to be highly selective and focused on limiting any damage to the bankfranchise.
12. For additional discussion of Moody's rating policy related to support, please see Rating Non-Guaranteed Subsidiaries: Credit Considerations in Assigning Subsidiary Ratings In the Absence of Legally Binding Parental Support, December, 2003. In addition, affiliate companies generally refer to companies outside of the analytic unit being rated.
Moody’s Rating Methodology 17
Regional Analytic Considerations
Moody's employs the same analytic approach to evaluating P&C insurance companies worldwide, incorporating thebusiness and financial profile dimensions discussed in this methodology. However, each of the various regions has itsown market nuances which reflect the local political, social and economic climates. These include the regulatory envi-ronment, governance and capital structures, taxation, accounting rules and public reporting requirements, and lawsand the litigation environment. Moody's incorporates these regional factors into its rating process.
North AmericaIn the United States, property and casualty insurance companies are required to provide a substantial amount ofdetailed financial information to state regulators. This financial information is prepared under Statutory AccountingPrinciples (SAP), which are the accounting practices and procedures developed by the National Association of Insur-ance Commissioners (NAIC) and adopted by each state through its legislative or rule-making process.
Financial information is also prepared under general accepted accounting principles (GAAP) for publicly-tradedcompanies and by some mutuals. Based upon both statutory and GAAP financial information, Moody's annually pub-lishes its "Top Ten Ratios" by rating category for U.S. primary insurance companies13.
For U.S.-rated companies, Moody's also evaluates a separate capital adequacy model, Moody's Risk Adjusted Cap-ital (MRAC) Model. For additional information, please refer to "Moody's Risk Adjusted Capital Model" published inSeptember, 2004 and Appendix 2.
Lastly, for the past several years in North America, Moody's analytical teams have produced reports that discussboth U.S. financial reporting and corporate governance14. These research pieces provide additional insight into ourrating process.
EuropeUnlike in the U.S., many European insurance groups are composites, i.e. writing both life and P&C business. While invirtually all European countries, life business can only be written out of a distinct legal entity solely dedicated to thatpurpose, there is no such restriction on P&C business (the P&C carriers only have to be licensed). As a result, it is notuncommon for the ultimate holding company to be the main P&C operating company but at the same time havesmaller, usually international, P&C subsidiaries. These complicated ownership structures usually necessitate a higherdegree of reliance on consolidated financial statements for credit analysis.
A distinctive feature of the European regulatory and reporting environment is its significant variability by jurisdiction. As far as insurance supervision is concerned, there are two major factors to consider: (1) quality of supervision and
(2) adequacy of regulatory capital requirements. Quality of supervision varies greatly, with the UK, the Netherlandsand Nordic countries ranking highest in Moody's view and southern and eastern European countries lowest. Absenceof a credible regulator is viewed by Moody's as a negative rating factor.
Currently, regulatory capital requirements across Europe are calculated on a deterministic, or formulaic basis(known as EU Solvency). Although the resulting capital requirement is consistent, it is not always meaningful, sincethe underlying formula does not capture well the full range of insurance risks. Some territories (such as the UK, theNetherlands and, to some extent, Switzerland) are in the process of implementing stochastic capital requirements,which may lead to higher required capital levels for P&C insurers in the future. However, the implementation of newrequirements (frequently referred to as Solvency II) is likely to be implemented simultaneously by all EU members noearlier than 2010.
Availability and comparability of financial information in Europe presents another analytical challenge. Whilemost (but not all) publicly-traded insurers in Europe now present their financial statements under IFRS, operatingcompanies still report under local GAAP accounting, rendering their financial metrics less useful in cross-regionalcomparisons.
13. For additional information, please refer to "North American P&C Insurance Top Ten Ratios 2004 Update" published in December 2005.14. Please refer to "No Assurance of Good Governance: Observations on Corporate Governance in the U.S. Insurance Sector" published in October 2005.
18 Moody’s Rating Methodology
Latin AmericaAs in Europe, statutory financial information for Latin American insurers is usually presented on a national GAAPaccounting basis, rather than according to a separate regime for insurance accounting and can vary from country tocountry. Key financial metrics, however, tend to exclude holding company consolidated financial information becauseof the scarcity of publicly-held concerns and limited debt issuance.
One very significant risk consideration in Latin America is the low average sovereign credit profile in that region(among the major Latin American economics, only Mexico and Chile currently maintain investment-grade sovereignratings). That results in the high concentration of non-investment-grade holdings (particularly national debt obliga-tions) in insurers' investment portfolios. In some cases - such as Argentina in recent years - these bonds may be in ornear default, or may have restructured terms, thereby greatly influencing the insurer's credit profile, regardless of itsperceived franchise strength in other respects.
Finally, because of the preponderance of bank-owned insurers in countries such as Brazil and Mexico, Moody'sconsiders the credit profile of the insurer in the context of its implied support and strategic fit within its overall organi-zation, as well as the bank's own credit profile, as an indicator of commitment to financial responsibility and potentialcapital needs at the insurer.
AsiaThe Asian insurance markets are at varying stages of development, as measured in terms of composition and structure,type and complexity of products, the extent of liberalization and competition. Most Asian markets prepare timelyfinancial statements based on local GAAP requirements as well as statutory insurance accounting regimes. However,these are not readily accessible in the public domain. These markets generally strive to align their local GAAP tointernational accounting standards as closely as possible and practicable.
Several more-developed markets, such as Australia, Japan, Singapore and Taiwan, have already introduced or arein the process of adopting risk-based capital regulatory regimes, which relate the minimum capital requirement of aninsurer to its type of business and risk profile. On the other hand, simple solvency regimes are typically in place forless-developed insurance markets, but we expect these markets to make continued progress towards more robust risk-based capital regimes.
Moody's also notes several distinct characteristics within the Asian markets that play an important part in shapingthe way insurers manage their investments and capital. First, there is generally a lack of depth in the local bond mar-kets in most Asian countries, which has implications for the asset liability matching of individual companies. Secondly,there is a limited level of debt issuance by Asian insurers. This may give insurers relatively more financial flexibilitygiven the lack of committed debt-related interest payments/obligations.
Finally, there is an increasing trend in several more-developed markets such as Taiwan and Australia for insurers tooperate as part of a diversified financial services group, comprising banking, insurance, and fund management opera-tions. Moody's considers the credit profile of the insurer in the context of its strategic fit within the overall organiza-tion, as well as potential capital demands on the insurer or support to the insurer from the group.
Moody’s Rating Methodology 19
Relationship Between Insurance Financial Strength and Other Ratings
Insurance Financial Strength and Debt RatingsMoody's insurance financial strength or claims paying ability ratings are opinions of the ability of insurance and rein-surance companies to punctually repay senior policyholder obligations and claims. These ratings apply to companiesengaged in the business of providing insurance and taking direct insurance risk, typically known as insurance operatingcompanies. While many insurance groups manage their operations by business unit, Moody's insurance financialstrength ratings are always assigned to legal entities.
In contrast, Moody's long-term debt ratings are assigned to specific securities issued by either a holding or operat-ing company. The relationship between the insurance financial strength and debt ratings is dependent upon the legaland regulatory framework in a particular jurisdiction and the relative standing of policyholders and debt holders in theevent of insolvency, bankruptcy, reorganization, or liquidation of the entity.
The relationship between the ratings for these different classes of creditors is discussed in the sections below, withguidance about the typical degree of difference (expressed in number of rating "notches") that can be expected in theseratings. These are not to be taken as absolute rules, but rather as guidelines in interpreting the relationship betweenfinancial strength ratings and debt ratings. It is important to note that a well capitalized, profitable insurance operat-ing company with a highly leveraged parent or a weak affiliate will often have a lower financial strength rating than itwould have were it a free-standing company because of the pressure those factors can place on its earnings and capital.Conversely, an IFS rating of a particular entity can be raised by implicit support associated with ownership by a finan-cially strong group.
Priority of Claim Notching Between Operating Company IFS and Other RatingsIFS ratings are typically the highest credit ratings within an enterprise. From an analytic perspective, the IFS rating isalso the starting point for the development of all the other ratings of securities issued by insurance operating compa-nies, their related holding companies, financing affiliates, etc. We generally consider the IFS rating as the anchor rat-ing and the rating differential between the IFS and other ratings, referred to as priority of claim notching, as aderivative of the IFS assessment, based upon the specifics of the instrument and convention.
At the insurance operating company level, regulators generally accord policyholder obligations a preferred statusin liquidation, above that of financial creditors including debt and preferred stock obligations. As a result, Moody'swill usually notch down (i.e. assign a lower rating to) other rated obligations of the operating company. In certainjurisdictions, policyholder claims (or reinsurance claims) are pari pasu with senior financial obligations and our IFSrating and senior debt rating for the operating company will be the same. However, in this case, it is likely that therewill be wider notching (e.g., two notches instead of one) to the subordinated debt rating at the operating companyentity because of the greater expected loss for that creditor class compared to the policyholder and senior creditorclasses. Exceptions to this practice include cases where the operating insurer maintains unusually high double leverageand where the insurer's financial strength approaches the secure/vulnerable cutoff (i.e., Baa/Ba).
Priority of Claim Notching Between IFS and Holding Company RatingsThe IFS rating at the operating company will also usually be higher than the insurance holding company's senior debtrating, reflecting the favorable influence of regulation on the operating insurer, as well as the typically subordinatedposition of a holding company. Although the default probability of an insurance operating company and its holdingcompany are highly correlated, the loss severity (given default) for holding company creditors will be significantlygreater given their structural subordination to both policyholder claims and operating company financial obligations-e.g. holding company creditor claims usually do not benefit from the regulatory oversight and typically represent sim-ply an equity investment in the regulated company which will be paid after all obligations of the operating companyare met.
Typical notching between the IFS rating at an operating company and the senior debt rating at the holding com-pany (in the case of a simple organizational structure with one primary operating company in a jurisdiction of strongregulatory oversight) is three notches. Similar to the examples discussed above, in cases of unusually high doubleleverage and of an operating insurer's rating approaching the Baa/Ba cutoff, the notching would typically widen.
20 Moody’s Rating Methodology
Taking Account of Differences in Regulatory JurisdictionIn jurisdictions where the regulatory regime and oversight is regarded as being more lenient (e.g. modest minimumcapital requirements) and the dividend capacity available to the holding company from its operating company rela-tively substantial, then there is a rationale for narrower notching than typical for an operating company/holding com-pany relationship. A Bermuda domicile, at least for simple holding company structures, would typically provide suchan advantage, and here we would expect to maintain two notches between IFS rating at an operating company andsenior debt at holding company for a Bermudian insurer.
Taking Account of the Impact of Holding Company Diversification and LiquidityWhereas the typical notching between the IFS rating at the operating company and the senior debt rating at its hold-ing company is three notches, there can be narrower notching if the holding company benefits from multiple sourcesof sizable, uncorrelated earnings and dividend cash flows (e.g. significant banking, life and P&C operations and earn-ings). Similarly, if a holding company benefits from significant sources of dividends from unregulated subsidiaries(which are not highly correlated with the regulated subsidiaries), notching would be compressed. The reduction innotching will vary depending on the breadth and depth of the holding company's diverse sources of subsidiary cashflows.
In certain cases, a holding company may consistently maintain significant amounts of high-quality liquid assets,which it could use in a time of financial stress to repay a substantial portion of its outstanding debt obligations. Thedifference between the operating company IFS and the holding company senior debt rating would ordinarily bereduced by one notch in these cases as well, to reflect lower default risk.
Global and National Scale RatingsWith the extension of credit ratings from highly-developed capital markets to newer emerging markets, Moody's rat-ing scales have evolved to provide comparability on both a globally consistent and nationally comparable basis. Thisdevelopment has become necessary for a number of reasons which include the development of local-currency-basedcapital markets in a number of countries and an increased demand on the part of investors and intermediaries in lower-rated countries for a higher degree of credit differentiation among firms within a given national market, regardless ofthe sovereign's credit profile. In order to address these issues, Moody's has developed two rating scale conventions,namely Global Foreign & Local Currency Ratings (GFC & GLC Ratings) and National Scale Ratings (NSRs).
Global RatingsMoody's Global ratings, encompassing both Foreign and Local currency designations, are intended to be globallycomparablerelative rankings of credit risk.
GLC ratings reflect Moody's opinion about risk of loss and default, for obligations denominated in local currency.GFC ratings, in contrast, address the risk of obligations denominated in a foreign currency. Thus, GLC and GFC rat-ings are identical except that GFC ratings must incorporate the additional sovereign risk - that a payment default couldresult from the imposition of convertibility restrictions or some other sovereign-imposed payment moratorium. Insuch a case, the individual issuer might have the capacity to pay obligations in full and on time in its own local cur-rency, but is denied access to the currency of payment, resulting in a default. The foreign currency country ceiling rep-resents the risk that a country might impose a moratorium on foreign currency payments in the event the governmentdefaults on its own foreign currency debt. However, if an issuer’s GLC debt rating is above the ceiling, then its GFCdebt rating might still “pierce” the ceiling if the debt obligation is sold under foreign law and Moody’s believes that theissuer might escape such a moratorium. On the other hand, foreign currency IFSRs cannot pierce the ceiling.15
National Scale RatingsIn contrast to Moody's global ratings, National Scale Ratings (NSRs) are relative measures of creditworthiness withina single domestic market, and across industry sectors. Unlike GLC ratings, NSRs do have modifiers that indicate towhich country they refer (e.g. A2.xx, with 'xx' designating the respective country; mx = Mexico, br = Brazil, etc.). Inmany countries, NSRs are required either by insurance or securities regulation, or by convention. Because NSR scalesare different for each country and are relative measures of credit quality in that country, they are not comparable fromone country to another (e.g. A2.mx is not comparable with a A2.br). That said, they are useful tools for assessing rela-tive credit strength within a national market.
15. For additional information, please refer to "Rating Methodology: Piercing the Country Ceiling: An Update" January, 2005
Moody’s Rating Methodology 21
Local Currency Guidelines and Their Effect on Moody's RatingsMoody’s Local Currency Guideline summarizes the general country level risks (excluding foreign currency transferrisk) that should be taken into account in assigning local currency ratings to locally-domiciled obligors. In many coun-tries the local currency guideline is higher than the sovereign’s own local currency debt ratings. The guideline indi-cates the rating level that will generally be assigned to the financially strongest obligation in the country. Accordingly,the Local Currency Guideline will usually be a constraint on the GLC rating for any company or obligation. TheGLC rating generally and the Local Currency IFS rating in particular, is always the starting point for Moody’s insur-ance rating analysis and is related to other Moody’s ratings in the following ways.
The Global Foreign Currency IFS rating is the same as the Local Currency IFS rating, except where the LC IFS rat-ing is above the Country Ceiling, in which case the FC IFS rating will be the same as the Country Ceiling. By conven-tion, references to an insurer's financial strength rating are understood to refer to the Foreign Currency IFS rating,unless otherwise specified.
Global Local Currency Debt Ratings are determined from the Local Currency IFS rating based on holding companyanalysis and the notching conventions previously described.
Global Foreign Currency Debt Ratings are determined from the Local Currency Debt Rating, as constrained by theCountry Ceiling, as discussed above.
The National Scale IFS rating is determined based on the Local Currency IFS rating and a national scale ratingmatrix that is distinct for each country and applied to all global local currency ratings within that country.
National Scale Debt Ratings are determined based on the Local or Foreign Currency Debt Rating, using the samenational scale rating matrix as above.
22 Moody’s Rating Methodology
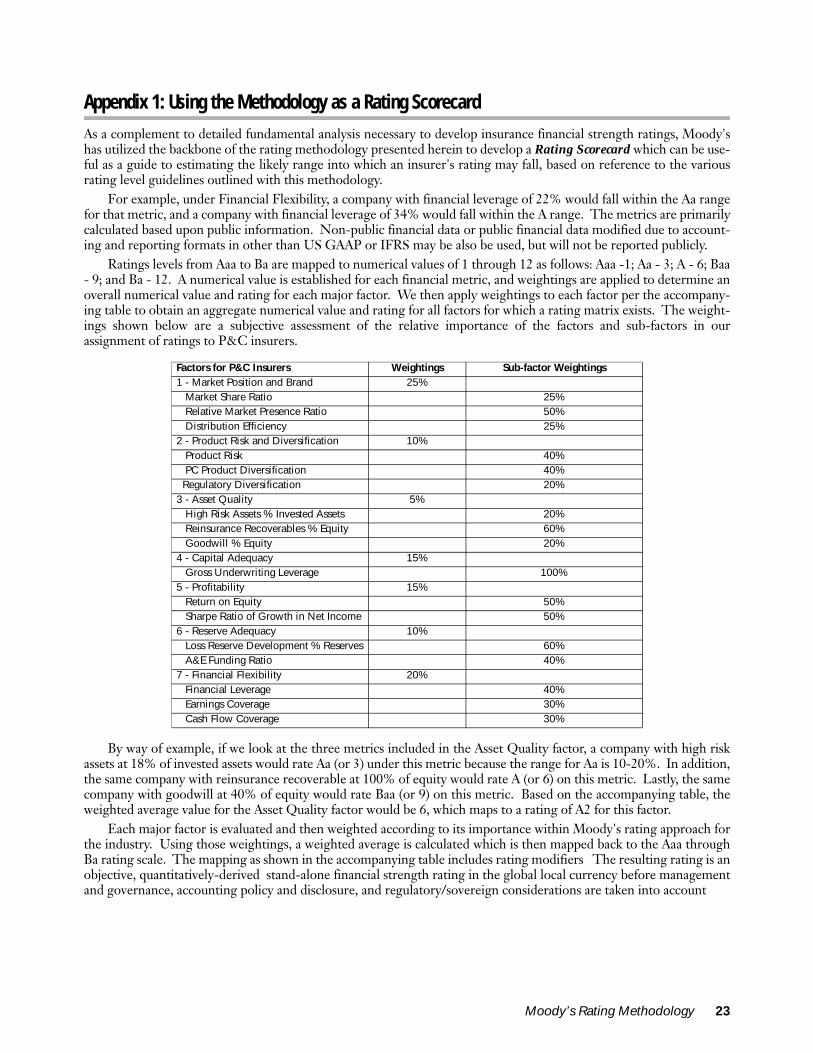
Appendix 1: Using the Methodology as a Rating Scorecard
As a complement to detailed fundamental analysis necessary to develop insurance financial strength ratings, Moody'shas utilized the backbone of the rating methodology presented herein to develop a Rating Scorecard which can be use-ful as a guide to estimating the likely range into which an insurer's rating may fall, based on reference to the variousrating level guidelines outlined with this methodology.
For example, under Financial Flexibility, a company with financial leverage of 22% would fall within the Aa rangefor that metric, and a company with financial leverage of 34% would fall within the A range. The metrics are primarilycalculated based upon public information. Non-public financial data or public financial data modified due to account-ing and reporting formats in other than US GAAP or IFRS may be also be used, but will not be reported publicly.
Ratings levels from Aaa to Ba are mapped to numerical values of 1 through 12 as follows: Aaa -1; Aa - 3; A - 6; Baa- 9; and Ba - 12. A numerical value is established for each financial metric, and weightings are applied to determine anoverall numerical value and rating for each major factor. We then apply weightings to each factor per the accompany-ing table to obtain an aggregate numerical value and rating for all factors for which a rating matrix exists. The weight-ings shown below are a subjective assessment of the relative importance of the factors and sub-factors in ourassignment of ratings to P&C insurers.
By way of example, if we look at the three metrics included in the Asset Quality factor, a company with high riskassets at 18% of invested assets would rate Aa (or 3) under this metric because the range for Aa is 10-20%. In addition,the same company with reinsurance recoverable at 100% of equity would rate A (or 6) on this metric. Lastly, the samecompany with goodwill at 40% of equity would rate Baa (or 9) on this metric. Based on the accompanying table, theweighted average value for the Asset Quality factor would be 6, which maps to a rating of A2 for this factor.
Each major factor is evaluated and then weighted according to its importance within Moody's rating approach forthe industry. Using those weightings, a weighted average is calculated which is then mapped back to the Aaa throughBa rating scale. The mapping as shown in the accompanying table includes rating modifiers The resulting rating is anobjective, quantitatively-derived stand-alone financial strength rating in the global local currency before managementand governance, accounting policy and disclosure, and regulatory/sovereign considerations are taken into account
Factors for P&C Insurers Weightings Sub-factor Weightings1 - Market Position and Brand 25% Market Share Ratio 25% Relative Market Presence Ratio 50% Distribution Efficiency 25%2 - Product Risk and Diversification 10% Product Risk 40% PC Product Diversification 40% Regulatory Diversification 20%3 - Asset Quality 5% High Risk Assets % Invested Assets 20% Reinsurance Recoverables % Equity 60% Goodwill % Equity 20%4 - Capital Adequacy 15% Gross Underwriting Leverage 100%5 - Profitability 15% Return on Equity 50% Sharpe Ratio of Growth in Net Income 50%6 - Reserve Adequacy 10% Loss Reserve Development % Reserves 60% A&E Funding Ratio 40%7 - Financial Flexibility 20% Financial Leverage 40% Earnings Coverage 30% Cash Flow Coverage 30%
Moody’s Rating Methodology 23
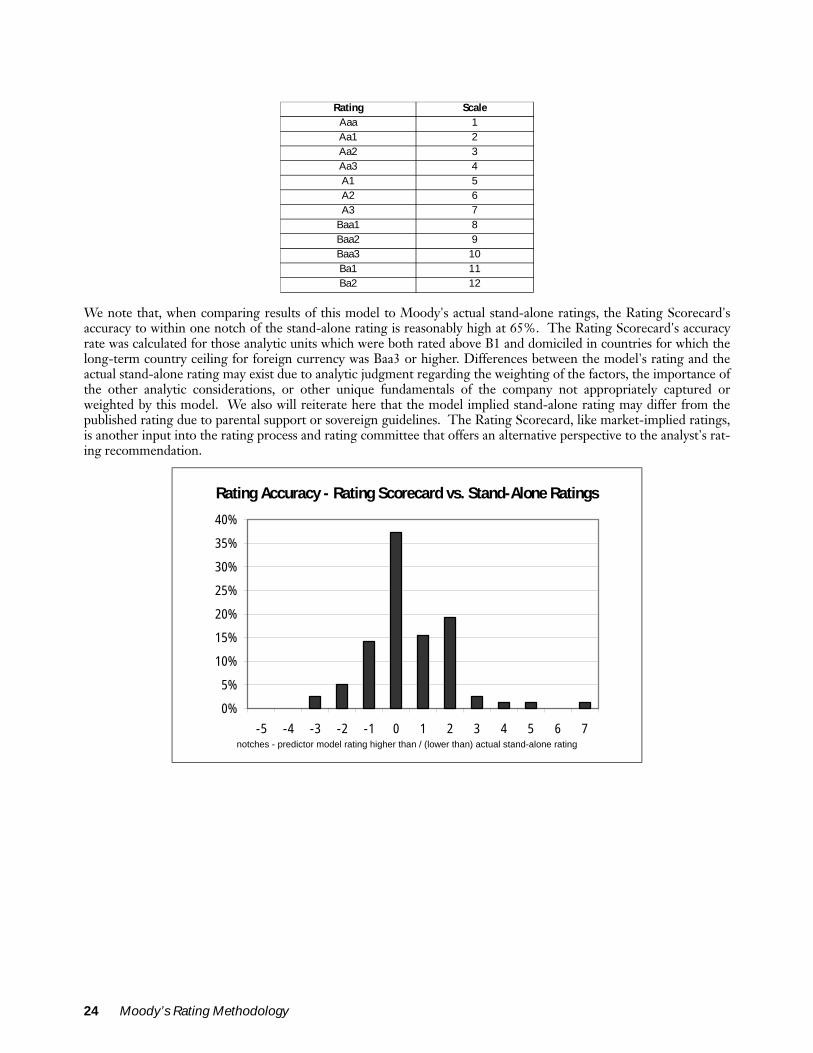
We note that, when comparing results of this model to Moody's actual stand-alone ratings, the Rating Scorecard'saccuracy to within one notch of the stand-alone rating is reasonably high at 65%. The Rating Scorecard's accuracyrate was calculated for those analytic units which were both rated above B1 and domiciled in countries for which thelong-term country ceiling for foreign currency was Baa3 or higher. Differences between the model's rating and theactual stand-alone rating may exist due to analytic judgment regarding the weighting of the factors, the importance ofthe other analytic considerations, or other unique fundamentals of the company not appropriately captured orweighted by this model. We also will reiterate here that the model implied stand-alone rating may differ from thepublished rating due to parental support or sovereign guidelines. The Rating Scorecard, like market-implied ratings,is another input into the rating process and rating committee that offers an alternative perspective to the analyst's rat-ing recommendation.
Rating ScaleAaa 1Aa1 2Aa2 3Aa3 4A1 5A2 6A3 7
Baa1 8Baa2 9Baa3 10Ba1 11Ba2 12
Rating Accuracy - Rating Scorecard vs. Stand-Alone Ratings
notches - predictor model rating higher than / (lower than) actual stand-alone rating
0%
5%
10%
15%
20%
25%
30%
35%
40%
-5 -4 -3 -2 -1 0 1 2 3 4 5 6 7
24 Moody’s Rating Methodology
Appendix 2: Regional Capital Adequacy Measures
As previously highlighted, Moody's utilizes gross underwriting leverage in the global methodology and Rating Score-card because of its ability to be calculated consistently for all P&C insurers globally. In order to supplement this ratherbasic and blunt ratio, in several regions, internally developed or existing regulatory model capital metrics are also used.The insurance regulators in most regions have developed more refined measures of capital adequacy/solvency by eval-uating the available capital relative to the risk exposures of the company. The level of sophistication of the risk-basedcapital (RBC) regime, the scale on which it is measured, and its usefulness in the rating process varies considerablyamong regulatory jurisdictions.
In countries where such risk-based capital schemes yield reasonable results, Moody's uses the local RBC metrics tosupplement other measures of capital strength. An example of an internally developed model is Moody's Risk-Adjusted Capital Model (MRAC) used for P&C insurers domiciled in the United States while local RBC metrics suchas the Solvency Margin are used for insurers domiciled in Japan. Additional regional ratios will be introduced in thefuture.
Where applicable, Moody's also reviews a company's proprietary model for economic capital to assess capital ade-quacy. However, because assumptions made in one company's model may be quite different from assumptions used inanother company's model, it is challenging to compare capital positions using companies' proprietary economic capitalmodels within a peer group.
Moody’s Rating Methodology 25

PAGE INTENTIONALLY LEFT BLANK

PAGE INTENTIONALLY LEFT BLANK
© Copyright 2006, Moody’s Investors Service, Inc. and/or its licensors and affiliates including Moody’s Assurance Company, Inc. (together, “MOODY’S”). All rights reserved. ALLINFORMATION CONTAINED HEREIN IS PROTECTED BY COPYRIGHT LAW AND NONE OF SUCH INFORMATION MAY BE COPIED OR OTHERWISE REPRODUCED, REPACKAGED,FURTHER TRANSMITTED, TRANSFERRED, DISSEMINATED, REDISTRIBUTED OR RESOLD, OR STORED FOR SUBSEQUENT USE FOR ANY SUCH PURPOSE, IN WHOLE OR IN PART, INANY FORM OR MANNER OR BY ANY MEANS WHATSOEVER, BY ANY PERSON WITHOUT MOODY’S PRIOR WRITTEN CONSENT. All information contained herein is obtained byMOODY’S from sources believed by it to be accurate and reliable. Because of the possibility of human or mechanical error as well as other factors, however, such information is provided “asis” without warranty of any kind and MOODY’S, in particular, makes no representation or warranty, express or implied, as to the accuracy, timeliness, completeness, merchantability or fitnessfor any particular purpose of any such information. Under no circumstances shall MOODY’S have any liability to any person or entity for (a) any loss or damage in whole or in part caused by,resulting from, or relating to, any error (negligent or otherwise) or other circumstance or contingency within or outside the control of MOODY’S or any of its directors, officers, employees oragents in connection with the procurement, collection, compilation, analysis, interpretation, communication, publication or delivery of any such information, or (b) any direct, indirect,special, consequential, compensatory or incidental damages whatsoever (including without limitation, lost profits), even if MOODY’S is advised in advance of the possibility of suchdamages, resulting from the use of or inability to use, any such information. The credit ratings and financial reporting analysis observations, if any, constituting part of the informationcontained herein are, and must be construed solely as, statements of opinion and not statements of fact or recommendations to purchase, sell or hold any securities. NO WARRANTY,EXPRESS OR IMPLIED, AS TO THE ACCURACY, TIMELINESS, COMPLETENESS, MERCHANTABILITY OR FITNESS FOR ANY PARTICULAR PURPOSE OF ANY SUCH RATING OR OTHEROPINION OR INFORMATION IS GIVEN OR MADE BY MOODY’S IN ANY FORM OR MANNER WHATSOEVER. Each rating or other opinion must be weighed solely as one factor in anyinvestment decision made by or on behalf of any user of the information contained herein, and each such user must accordingly make its own study and evaluation of each security and ofeach issuer and guarantor of, and each provider of credit support for, each security that it may consider purchasing, holding or selling. MOODY’S hereby discloses that most issuers of debt securities (including corporate and municipal bonds, debentures, notes and commercial paper) and preferred stock rated byMOODY’S have, prior to assignment of any rating, agreed to pay to MOODY’S for appraisal and rating services rendered by it fees ranging from $1,500 to $2,400,000. Moody’s Corporation(MCO) and its wholly-owned credit rating agency subsidiary, Moody’s Investors Service (MIS), also maintain policies and procedures to address the independence of MIS’s ratings and ratingprocesses. Information regarding certain affiliations that may exist between directors of MCO and rated entities, and between entities who hold ratings from MIS and have also publiclyreported to the SEC an ownership interest in MCO of more than 5%, is posted annually on Moody’s website at www.moodys.com under the heading “Shareholder Relations — CorporateGovernance — Director and Shareholder Affiliation Policy.” This credit rating opinion has been prepared without taking into account any of your objectives, financial situation or needs. You should, before acting on the opinion, consider theappropriateness of the opinion having regard to your own objectives, financial situation and needs.
28 Moody’s Rating Methodology
To order reprints of this report (100 copies minimum), please call 1.212.553.1658.Report Number: 98046
Author Production Associate
Jeffrey S Berg Yelena Ponirovskaya
www.moodys.com
ReinsuranceMoody’s Global
Rating Methodology ve
Table of Contents: Framework for Rating Reinsurers 3
Rating Summary Profile 4 KEY RATING FACTORS: Business Profile 6 Financial Profile 9 Other Considerations in Determining Stand-Alone Ratings 16 Moving From Stand-Alone Rating to Public Rating - Evaluating Support 18 Relationship between Insurance Financial Strength and Other Ratings 19 Special Considerations for Start-Up 21 Appendix 1: Using the Methodology as a Rating Scorecard 23 Appendix 2: Analysing Life Reinsurers 26
Analyst Contacts: London 44.20.7772.5454
0 Timour Boudkeev Vice President –Senior Credit Officer
Simon Harris Team Managing Director
New York 1.212.553.1653
Jeffrey Berg Senior Vice President
0 Sarah Hibler Senior Vice President
Ted Collins Group Managing Director
Robert Riegel Team Managing Director
September 2007
Moody's Global Rating Methodology for Reinsurers Summary Globally, Moody's rates over 60 reinsurance companies, with approximately $27 billion of rated securities and over $475 billion of insurance reserve liabilities as of July 15, 2007. These ratings reflect Moody's opinions of these institutions' creditworthiness, which considers both business and financial fundamentals for each rated company. The primary purpose of this rating methodology is to enhance the transparency of Moody's rating process by identifying and discussing the key factors that explain our ratings of reinsurers globally and how those key factors are used.
Because the methodology applies globally, it is necessarily general in some respects and not intended to be an exhaustive discussion of all factors that Moody's analysts consider in every reinsurer's rating. Regulatory, accounting, and product characteristics can vary widely from country to country and Moody's rating approach takes account of such differences, including the financial metrics that correspond to particular rating categories.
Moody's approach to rating the various obligations of reinsurance organizations is rooted in an assessment of the financial strength of the main operating units within that organization. This methodology is, therefore, intended primarily to explain Moody's approach to assigning insurance financial strength ratings to reinsurers. Specifically, the methodology assists in developing a financial strength rating for a stand-alone entity before consideration of parental support. The methodology is also applicable to the reinsurance business of primary insurers. Other ratings that may be assigned within the group (e.g., on senior unsecured debt issued by the insurer or its parent company) are typically determined with reference to the insurance financial strength ratings of the group’s main subsidiaries.
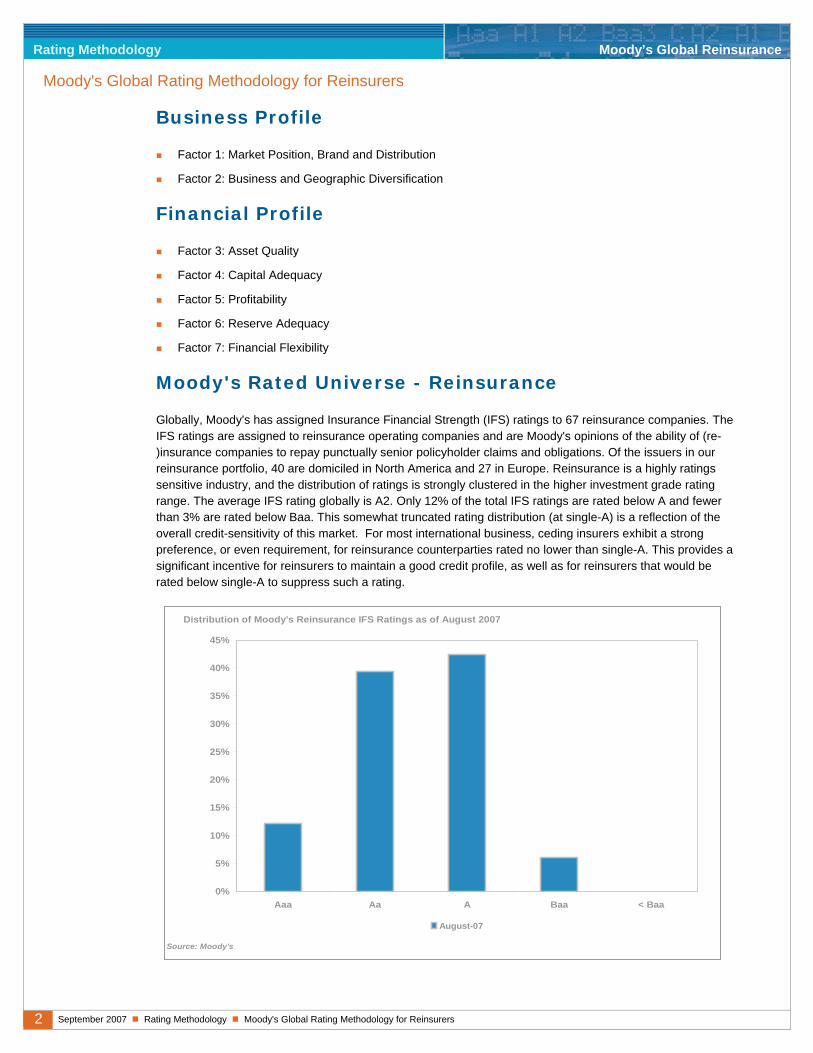
2 September 2007 Rating Methodology Moody's Global Rating Methodology for Reinsurers
Rating Methodology Moody’s Global Reinsurance
Moody's Global Rating Methodology for Reinsurers
Business Profile
Factor 1: Market Position, Brand and Distribution
Factor 2: Business and Geographic Diversification
Financial Profile
Factor 3: Asset Quality
Factor 4: Capital Adequacy
Factor 5: Profitability
Factor 6: Reserve Adequacy
Factor 7: Financial Flexibility
Moody's Rated Universe - Reinsurance
Globally, Moody's has assigned Insurance Financial Strength (IFS) ratings to 67 reinsurance companies. The IFS ratings are assigned to reinsurance operating companies and are Moody's opinions of the ability of (re-)insurance companies to repay punctually senior policyholder claims and obligations. Of the issuers in our reinsurance portfolio, 40 are domiciled in North America and 27 in Europe. Reinsurance is a highly ratings sensitive industry, and the distribution of ratings is strongly clustered in the higher investment grade rating range. The average IFS rating globally is A2. Only 12% of the total IFS ratings are rated below A and fewer than 3% are rated below Baa. This somewhat truncated rating distribution (at single-A) is a reflection of the overall credit-sensitivity of this market. For most international business, ceding insurers exhibit a strong preference, or even requirement, for reinsurance counterparties rated no lower than single-A. This provides a significant incentive for reinsurers to maintain a good credit profile, as well as for reinsurers that would be rated below single-A to suppress such a rating.
Distribution of Moody's Reinsurance IFS Ratings as of August 2007
0%
5%
10%
15%
20%
25%
30%
35%
40%
45%
Aaa Aa A Baa < Baa
August-07
Source: Moody's
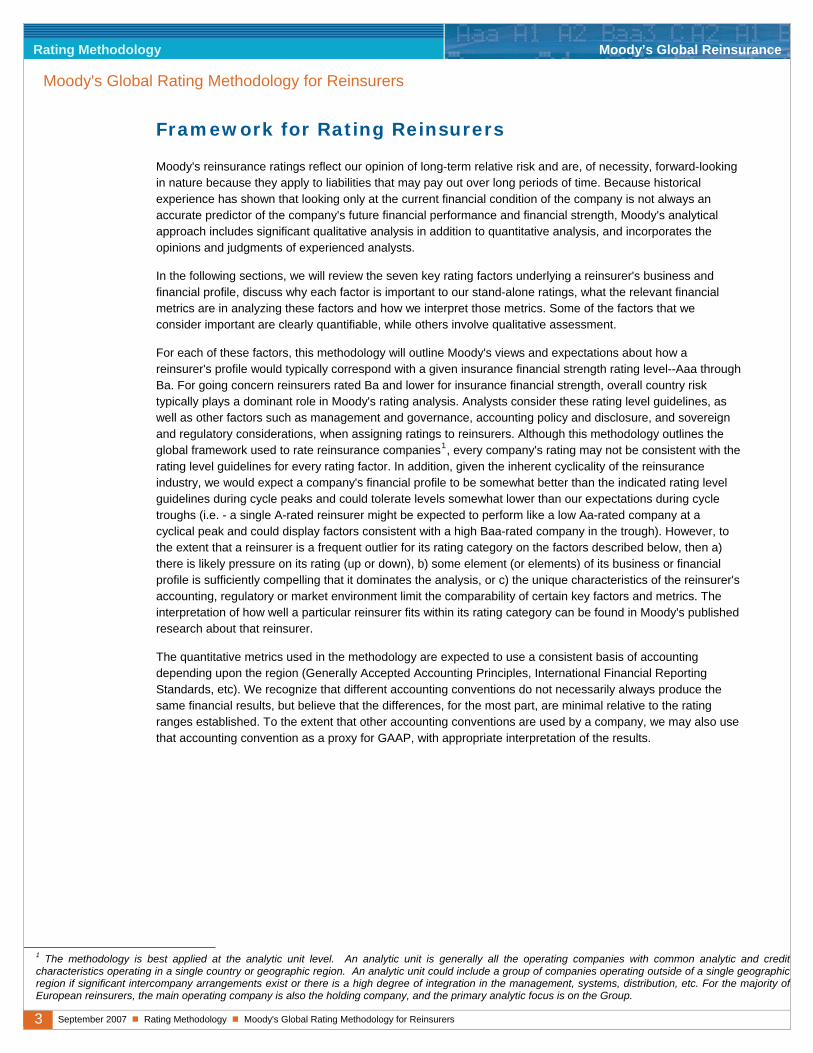
3 September 2007 Rating Methodology Moody's Global Rating Methodology for Reinsurers
Rating Methodology Moody’s Global Reinsurance
Moody's Global Rating Methodology for Reinsurers
Framework for Rating Reinsurers
Moody's reinsurance ratings reflect our opinion of long-term relative risk and are, of necessity, forward-looking in nature because they apply to liabilities that may pay out over long periods of time. Because historical experience has shown that looking only at the current financial condition of the company is not always an accurate predictor of the company's future financial performance and financial strength, Moody's analytical approach includes significant qualitative analysis in addition to quantitative analysis, and incorporates the opinions and judgments of experienced analysts.
In the following sections, we will review the seven key rating factors underlying a reinsurer's business and financial profile, discuss why each factor is important to our stand-alone ratings, what the relevant financial metrics are in analyzing these factors and how we interpret those metrics. Some of the factors that we consider important are clearly quantifiable, while others involve qualitative assessment.
For each of these factors, this methodology will outline Moody's views and expectations about how a reinsurer's profile would typically correspond with a given insurance financial strength rating level--Aaa through Ba. For going concern reinsurers rated Ba and lower for insurance financial strength, overall country risk typically plays a dominant role in Moody's rating analysis. Analysts consider these rating level guidelines, as well as other factors such as management and governance, accounting policy and disclosure, and sovereign and regulatory considerations, when assigning ratings to reinsurers. Although this methodology outlines the global framework used to rate reinsurance companies1, every company's rating may not be consistent with the rating level guidelines for every rating factor. In addition, given the inherent cyclicality of the reinsurance industry, we would expect a company's financial profile to be somewhat better than the indicated rating level guidelines during cycle peaks and could tolerate levels somewhat lower than our expectations during cycle troughs (i.e. - a single A-rated reinsurer might be expected to perform like a low Aa-rated company at a cyclical peak and could display factors consistent with a high Baa-rated company in the trough). However, to the extent that a reinsurer is a frequent outlier for its rating category on the factors described below, then a) there is likely pressure on its rating (up or down), b) some element (or elements) of its business or financial profile is sufficiently compelling that it dominates the analysis, or c) the unique characteristics of the reinsurer's accounting, regulatory or market environment limit the comparability of certain key factors and metrics. The interpretation of how well a particular reinsurer fits within its rating category can be found in Moody's published research about that reinsurer.
The quantitative metrics used in the methodology are expected to use a consistent basis of accounting depending upon the region (Generally Accepted Accounting Principles, International Financial Reporting Standards, etc). We recognize that different accounting conventions do not necessarily always produce the same financial results, but believe that the differences, for the most part, are minimal relative to the rating ranges established. To the extent that other accounting conventions are used by a company, we may also use that accounting convention as a proxy for GAAP, with appropriate interpretation of the results.
1 The methodology is best applied at the analytic unit level. An analytic unit is generally all the operating companies with common analytic and credit characteristics operating in a single country or geographic region. An analytic unit could include a group of companies operating outside of a single geographic region if significant intercompany arrangements exist or there is a high degree of integration in the management, systems, distribution, etc. For the majority of European reinsurers, the main operating company is also the holding company, and the primary analytic focus is on the Group.

4 September 2007 Rating Methodology Moody's Global Rating Methodology for Reinsurers
Rating Methodology Moody’s Global Reinsurance
Moody's Global Rating Methodology for Reinsurers
Rating Summary Profile
As part of the rating committee process, analysts complete a Rating Summary Profile which incorporates the analyst's opinion and judgment on each of the broad factors within the rating methodology, which may include the use of proprietary, non-public data. The rating committee uses the Rating Summary Profile to facilitate an in-depth discussion of the credit characteristics of the insurer.
The Rating Summary Profile documents the analyst’s “Adjusted Score” (i.e. the rating) for each factor as well as the “Score” (i.e. the rating) derived from the rating predictor model discussed in Appendix 1 (Financial Strength Rating Scorecard). Analysts then complete an assessment of management, governance, and risk management; accounting policy and disclosure; sovereign and economic environment; and explicit/implicit support in order to explain the overall standalone and final public rating recommendation for the analytic unit. This assessment is translated into a number of notches up or down that the Adjusted Score should be increased/decreased by in order to derive the stand-alone and final rating recommendations.2
An example of a Rating Summary Profile can be found below.
2 In general, the Rating Summary Profile is only altered for these items on limited occasions.

5 September 2007 Rating Methodology Moody's Global Rating Methodology for Reinsurers
Rating Methodology Moody’s Global Reinsurance
Moody's Global Rating Methodology for Reinsurers
Reinsurance Rating Methodology
Rating Summary Profile
Financial Strength Rating Scorecard (weights) Aaa Aa A Baa <
Baa Score Adjusted Score
Business Profile
Market Position, Brand and Distribution (20%)
Relative Market Share Ratio
Direct Reinsurance Premiums % GPW
Business and Geographic Diversification (15%)
Business and Geographic Diversification
Financial Profile
Asset Quality (10%)
High Risk Assets % Invested Assets
Reinsurance Recoverable and Goodwill % Equity
Capital Adequacy (20%)
Gross Underwriting Leverage
Net Natural Catastrophe Exposure at the 99.6% agg. PML
Gross Natural Catastrophe Exposure at the 99.6% agg. PML
Profitability (10%)
Return on Equity (5 yr. avg.)
Sharpe Ratio of Return on Revenue (5 yr.)
Reserve Adequacy (10%)
Adv/(Fav) Reserve Dev. % Beg. Reserves (5 yr. avg.)
A&E Net Funding Ratio (5 yr. avg.)
Financial Flexibility (15%)
Financial Leverage
Earnings Coverage (5 yr. avg.)
Aggregate Profile
Total Scorecard Rating -- Value
Other Considerations (if applicable, insert notches to be added to the adjusted total scorecard rating above):
Management, Governance, and Risk Management:
Accounting Policy & Disclosure:
Sovereign & Regulatory Environment:
Stand-Alone Rating Recommendation:
Support (if applicable, insert notches to be added to the standalone rating above):
Nature and Terms of Explicit Support:
Nature and Terms of Implicit Support:
Final Rating Recommendation:
6 September 2007 Rating Methodology Moody's Global Rating Methodology for Reinsurers
Rating Methodology Moody’s Global Reinsurance
Moody's Global Rating Methodology for Reinsurers
Key Rating Factors - Business Profile
Factor 1: Market Position, Brand And Distribution
Why It Matters - Market Position and Brand:
Market position, brand, and franchise strength are key rating factors that represent a company's ability to develop and sustain competitive advantages in its chosen markets. Market position incorporates the firm's sustainable advantages in its key lines of business and considers market share; barriers to entry; scale advantages and their translation to expenses; control over pricing; and control of distribution. Additionally, a firm's brand encompasses a company's image and reputation in the market, brand recognition and perception by distributors and reinsurance purchasers, and customer loyalty as demonstrated by retention rates and distribution costs.
A company's sustainable competitive advantages--the strength of its competitive position and its prospects for internal growth--can have a direct bearing on its future profitability and ability to generate capital internally. In addition, a reinsurer with a strong market position, brand, and competitive advantage should be well positioned to withstand prolonged difficult market conditions and be better able to capitalize on new, potentially profitable opportunities that may develop in the future. We believe such companies are more likely to meet their obligations through varied economic periods, thus suggesting higher ratings. Conversely, a weak business franchise can indicate financial stress for a company if it generates low or erratic core profitability, and may tempt management to enter unfamiliar businesses, take on new and unfamiliar risks, or leverage the company to a greater extent.
Relevant Financial Metrics - Market Position and Brand:
Relative market share ratio, Global Reinsurance (net premiums written as a % of NPW of an average Top 50 reinsurer3)
Interpreting the Financial Metrics - Market Position and Brand:
We believe that a reinsurer's size is highly correlated with its market position and brand. The largest companies in terms of assets, premiums, and capital tend to be the highest rated companies. Conversely, smaller companies tend to be lower rated. Moody's notes net premiums written are highly correlated with ratings as companies with greater premium volume tend to have greater pricing power.
Offsetting the absolute size issue, is a company's ability to exercise underwriting discipline and effectively navigate the underwriting cycle on an opportunistic basis. Growth during favourable market cycles can be a positive while growth during a soft market may be a negative. Further, significant market share within a smaller niche segment or within a certain geographical area with material barriers to entry may be a positive depending upon a company's approach to the business. Relative measures such as retention rates and product cross selling are also considerations.
Why It Matters - Distribution:
The methods and mechanisms by which a reinsurance company delivers its products are another fundamental aspect of the company's business and credit profile. A company's direct access to cedants as well as the nature of its relationship with brokers relates to its ability to grow revenues, to retain business, to enhance diversification by peak exposures and by geography, and to control its costs.
3 Estimated to be US$3.0 billion in 2006.
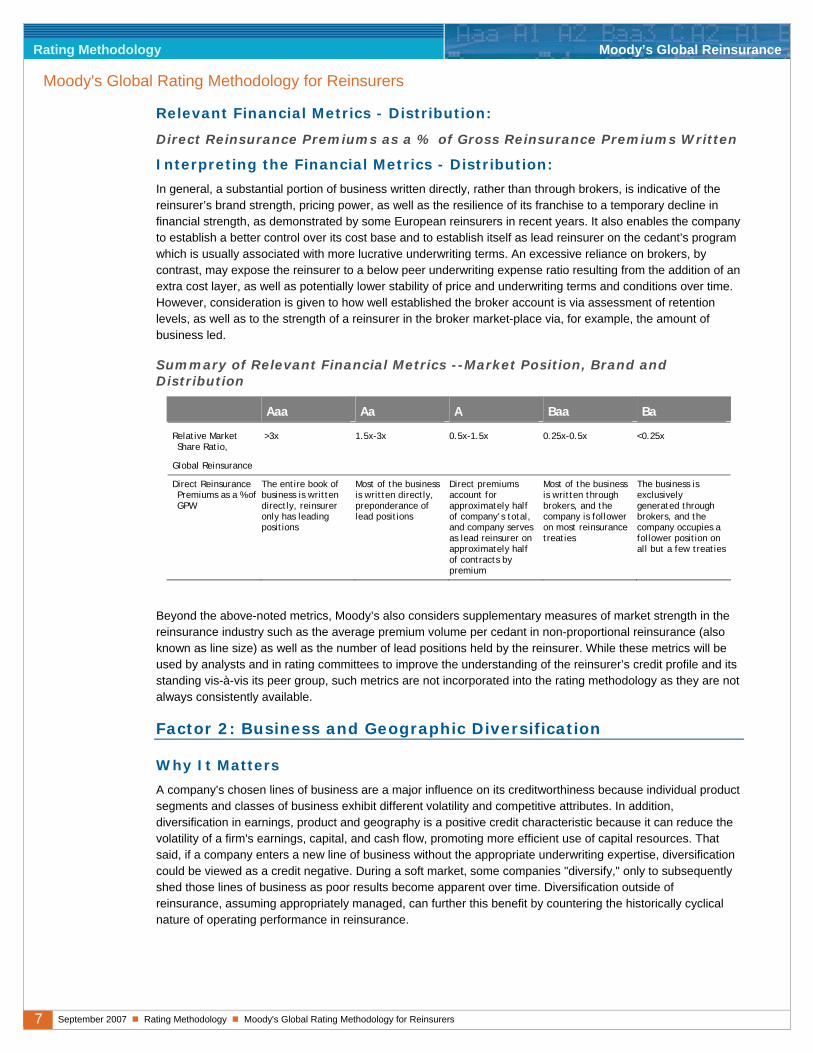
7 September 2007 Rating Methodology Moody's Global Rating Methodology for Reinsurers
Rating Methodology Moody’s Global Reinsurance
Moody's Global Rating Methodology for Reinsurers
Relevant Financial Metrics - Distribution:
Direct Reinsurance Premiums as a % of Gross Reinsurance Premiums Written
Interpreting the Financial Metrics - Distribution:
In general, a substantial portion of business written directly, rather than through brokers, is indicative of the reinsurer’s brand strength, pricing power, as well as the resilience of its franchise to a temporary decline in financial strength, as demonstrated by some European reinsurers in recent years. It also enables the company to establish a better control over its cost base and to establish itself as lead reinsurer on the cedant’s program which is usually associated with more lucrative underwriting terms. An excessive reliance on brokers, by contrast, may expose the reinsurer to a below peer underwriting expense ratio resulting from the addition of an extra cost layer, as well as potentially lower stability of price and underwriting terms and conditions over time. However, consideration is given to how well established the broker account is via assessment of retention levels, as well as to the strength of a reinsurer in the broker market-place via, for example, the amount of business led.
Summary of Relevant Financial Metrics --Market Position, Brand and Distribution
Aaa Aa A Baa Ba
Relative Market Share Ratio,
Global Reinsurance�
>3x 1.5x-3x 0.5x-1.5x 0.25x-0.5x <0.25x
Direct Reinsurance Premiums as a % of GPW
The entire book of business is written directly, reinsurer only has leading positions
Most of the business is written directly, preponderance of lead positions
Direct premiums account for approximately half of company’s total, and company serves as lead reinsurer on approximately half of contracts by premium
Most of the business is written through brokers, and the company is follower on most reinsurance treaties
The business is exclusively generated through brokers, and the company occupies a follower position on all but a few treaties
Beyond the above-noted metrics, Moody’s also considers supplementary measures of market strength in the reinsurance industry such as the average premium volume per cedant in non-proportional reinsurance (also known as line size) as well as the number of lead positions held by the reinsurer. While these metrics will be used by analysts and in rating committees to improve the understanding of the reinsurer’s credit profile and its standing vis-à-vis its peer group, such metrics are not incorporated into the rating methodology as they are not always consistently available.
Factor 2: Business and Geographic Diversification
Why It Matters
A company's chosen lines of business are a major influence on its creditworthiness because individual product segments and classes of business exhibit different volatility and competitive attributes. In addition, diversification in earnings, product and geography is a positive credit characteristic because it can reduce the volatility of a firm's earnings, capital, and cash flow, promoting more efficient use of capital resources. That said, if a company enters a new line of business without the appropriate underwriting expertise, diversification could be viewed as a credit negative. During a soft market, some companies "diversify," only to subsequently shed those lines of business as poor results become apparent over time. Diversification outside of reinsurance, assuming appropriately managed, can further this benefit by countering the historically cyclical nature of operating performance in reinsurance.
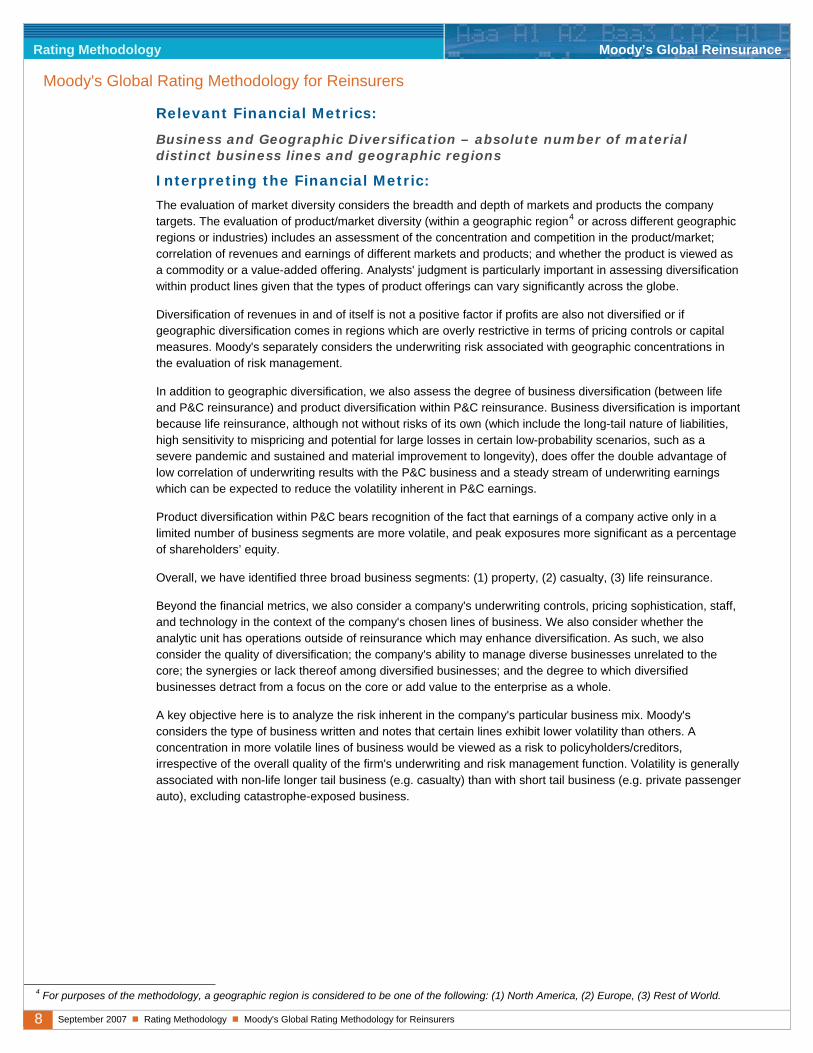
8 September 2007 Rating Methodology Moody's Global Rating Methodology for Reinsurers
Rating Methodology Moody’s Global Reinsurance
Moody's Global Rating Methodology for Reinsurers
Relevant Financial Metrics:
Business and Geographic Diversification – absolute number of material distinct business lines and geographic regions
Interpreting the Financial Metric:
The evaluation of market diversity considers the breadth and depth of markets and products the company targets. The evaluation of product/market diversity (within a geographic region4 or across different geographic regions or industries) includes an assessment of the concentration and competition in the product/market; correlation of revenues and earnings of different markets and products; and whether the product is viewed as a commodity or a value-added offering. Analysts' judgment is particularly important in assessing diversification within product lines given that the types of product offerings can vary significantly across the globe.
Diversification of revenues in and of itself is not a positive factor if profits are also not diversified or if geographic diversification comes in regions which are overly restrictive in terms of pricing controls or capital measures. Moody's separately considers the underwriting risk associated with geographic concentrations in the evaluation of risk management.
In addition to geographic diversification, we also assess the degree of business diversification (between life and P&C reinsurance) and product diversification within P&C reinsurance. Business diversification is important because life reinsurance, although not without risks of its own (which include the long-tail nature of liabilities, high sensitivity to mispricing and potential for large losses in certain low-probability scenarios, such as a severe pandemic and sustained and material improvement to longevity), does offer the double advantage of low correlation of underwriting results with the P&C business and a steady stream of underwriting earnings which can be expected to reduce the volatility inherent in P&C earnings.
Product diversification within P&C bears recognition of the fact that earnings of a company active only in a limited number of business segments are more volatile, and peak exposures more significant as a percentage of shareholders’ equity.
Overall, we have identified three broad business segments: (1) property, (2) casualty, (3) life reinsurance.
Beyond the financial metrics, we also consider a company's underwriting controls, pricing sophistication, staff, and technology in the context of the company's chosen lines of business. We also consider whether the analytic unit has operations outside of reinsurance which may enhance diversification. As such, we also consider the quality of diversification; the company's ability to manage diverse businesses unrelated to the core; the synergies or lack thereof among diversified businesses; and the degree to which diversified businesses detract from a focus on the core or add value to the enterprise as a whole.
A key objective here is to analyze the risk inherent in the company's particular business mix. Moody's considers the type of business written and notes that certain lines exhibit lower volatility than others. A concentration in more volatile lines of business would be viewed as a risk to policyholders/creditors, irrespective of the overall quality of the firm's underwriting and risk management function. Volatility is generally associated with non-life longer tail business (e.g. casualty) than with short tail business (e.g. private passenger auto), excluding catastrophe-exposed business.
4 For purposes of the methodology, a geographic region is considered to be one of the following: (1) North America, (2) Europe, (3) Rest of World.
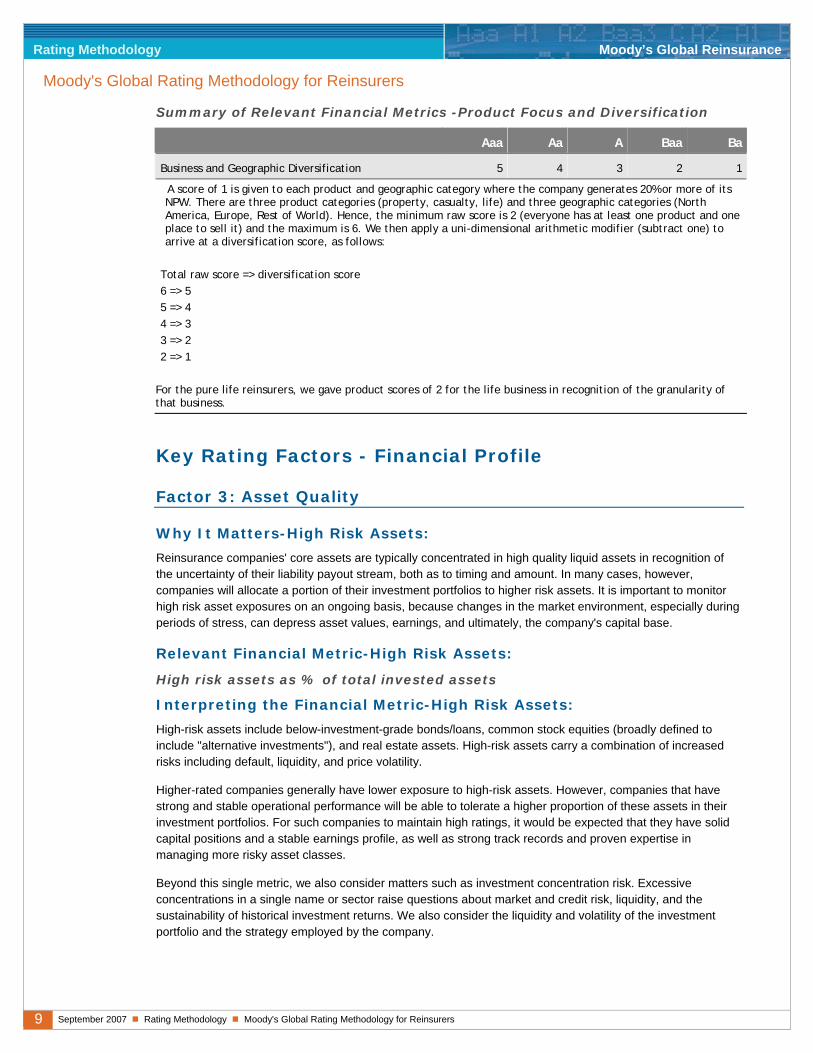
9 September 2007 Rating Methodology Moody's Global Rating Methodology for Reinsurers
Rating Methodology Moody’s Global Reinsurance
Moody's Global Rating Methodology for Reinsurers
Summary of Relevant Financial Metrics -Product Focus and Diversification
Aaa Aa A Baa Ba
Business and Geographic Diversification 5 4 3 2 1
A score of 1 is given to each product and geographic category where the company generates 20% or more of its NPW. There are three product categories (property, casualty, life) and three geographic categories (North America, Europe, Rest of World). Hence, the minimum raw score is 2 (everyone has at least one product and one place to sell it) and the maximum is 6. We then apply a uni-dimensional arithmetic modifier (subtract one) to arrive at a diversification score, as follows:
Total raw score => diversification score 6 => 5 5 => 4 4 => 3 3 => 2 2 => 1
For the pure life reinsurers, we gave product scores of 2 for the life business in recognition of the granularity of that business.
Key Rating Factors - Financial Profile
Factor 3: Asset Quality
Why It Matters-High Risk Assets:
Reinsurance companies' core assets are typically concentrated in high quality liquid assets in recognition of the uncertainty of their liability payout stream, both as to timing and amount. In many cases, however, companies will allocate a portion of their investment portfolios to higher risk assets. It is important to monitor high risk asset exposures on an ongoing basis, because changes in the market environment, especially during periods of stress, can depress asset values, earnings, and ultimately, the company's capital base.
Relevant Financial Metric-High Risk Assets:
High risk assets as % of total invested assets
Interpreting the Financial Metric-High Risk Assets:
High-risk assets include below-investment-grade bonds/loans, common stock equities (broadly defined to include "alternative investments"), and real estate assets. High-risk assets carry a combination of increased risks including default, liquidity, and price volatility.
Higher-rated companies generally have lower exposure to high-risk assets. However, companies that have strong and stable operational performance will be able to tolerate a higher proportion of these assets in their investment portfolios. For such companies to maintain high ratings, it would be expected that they have solid capital positions and a stable earnings profile, as well as strong track records and proven expertise in managing more risky asset classes.
Beyond this single metric, we also consider matters such as investment concentration risk. Excessive concentrations in a single name or sector raise questions about market and credit risk, liquidity, and the sustainability of historical investment returns. We also consider the liquidity and volatility of the investment portfolio and the strategy employed by the company.
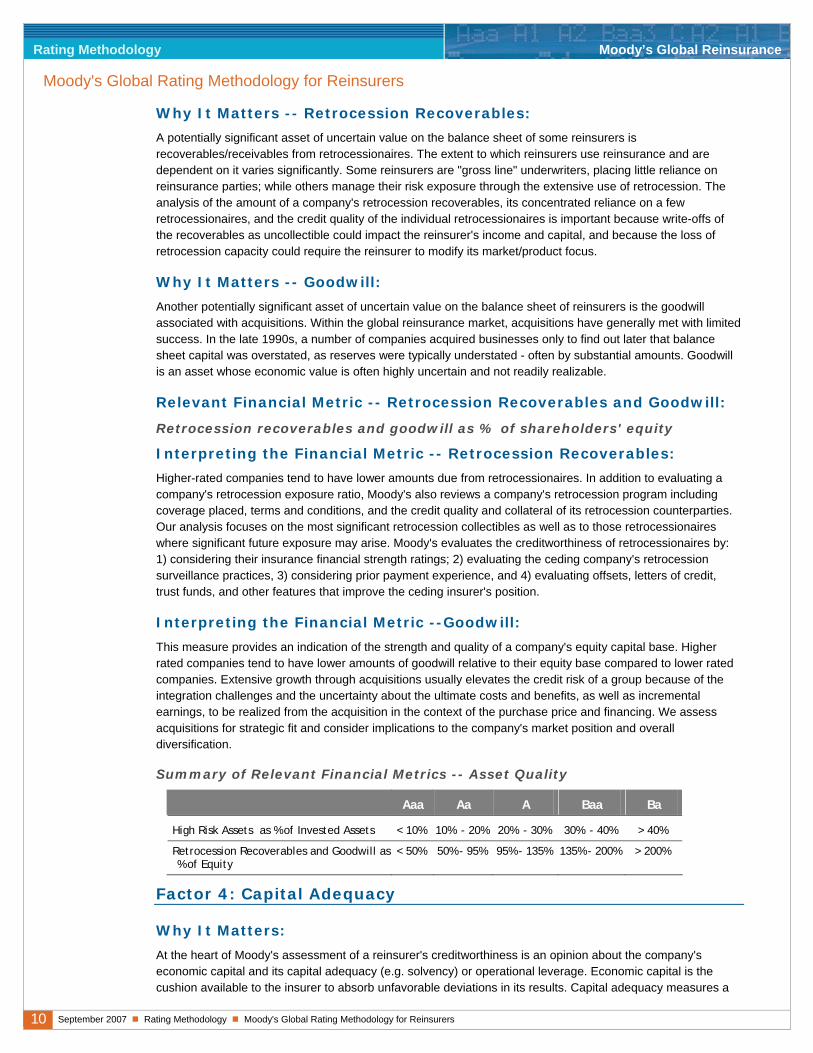
10 September 2007 Rating Methodology Moody's Global Rating Methodology for Reinsurers
Rating Methodology Moody’s Global Reinsurance
Moody's Global Rating Methodology for Reinsurers
Why It Matters -- Retrocession Recoverables:
A potentially significant asset of uncertain value on the balance sheet of some reinsurers is recoverables/receivables from retrocessionaires. The extent to which reinsurers use reinsurance and are dependent on it varies significantly. Some reinsurers are "gross line" underwriters, placing little reliance on reinsurance parties; while others manage their risk exposure through the extensive use of retrocession. The analysis of the amount of a company's retrocession recoverables, its concentrated reliance on a few retrocessionaires, and the credit quality of the individual retrocessionaires is important because write-offs of the recoverables as uncollectible could impact the reinsurer's income and capital, and because the loss of retrocession capacity could require the reinsurer to modify its market/product focus.
Why It Matters -- Goodwill:
Another potentially significant asset of uncertain value on the balance sheet of reinsurers is the goodwill associated with acquisitions. Within the global reinsurance market, acquisitions have generally met with limited success. In the late 1990s, a number of companies acquired businesses only to find out later that balance sheet capital was overstated, as reserves were typically understated - often by substantial amounts. Goodwill is an asset whose economic value is often highly uncertain and not readily realizable.
Relevant Financial Metric -- Retrocession Recoverables and Goodwill:
Retrocession recoverables and goodwill as % of shareholders' equity
Interpreting the Financial Metric -- Retrocession Recoverables:
Higher-rated companies tend to have lower amounts due from retrocessionaires. In addition to evaluating a company's retrocession exposure ratio, Moody's also reviews a company's retrocession program including coverage placed, terms and conditions, and the credit quality and collateral of its retrocession counterparties. Our analysis focuses on the most significant retrocession collectibles as well as to those retrocessionaires where significant future exposure may arise. Moody's evaluates the creditworthiness of retrocessionaires by: 1) considering their insurance financial strength ratings; 2) evaluating the ceding company's retrocession surveillance practices, 3) considering prior payment experience, and 4) evaluating offsets, letters of credit, trust funds, and other features that improve the ceding insurer's position.
Interpreting the Financial Metric --Goodwill:
This measure provides an indication of the strength and quality of a company's equity capital base. Higher rated companies tend to have lower amounts of goodwill relative to their equity base compared to lower rated companies. Extensive growth through acquisitions usually elevates the credit risk of a group because of the integration challenges and the uncertainty about the ultimate costs and benefits, as well as incremental earnings, to be realized from the acquisition in the context of the purchase price and financing. We assess acquisitions for strategic fit and consider implications to the company's market position and overall diversification.
Summary of Relevant Financial Metrics -- Asset Quality
Aaa Aa A Baa Ba
High Risk Assets as % of Invested Assets < 10% 10% - 20% 20% - 30% 30% - 40% > 40%
Retrocession Recoverables and Goodwill as % of Equity
< 50% 50% - 95% 95% - 135% 135% - 200% > 200%
Factor 4: Capital Adequacy
Why It Matters:
At the heart of Moody's assessment of a reinsurer's creditworthiness is an opinion about the company's economic capital and its capital adequacy (e.g. solvency) or operational leverage. Economic capital is the cushion available to the insurer to absorb unfavorable deviations in its results. Capital adequacy measures a
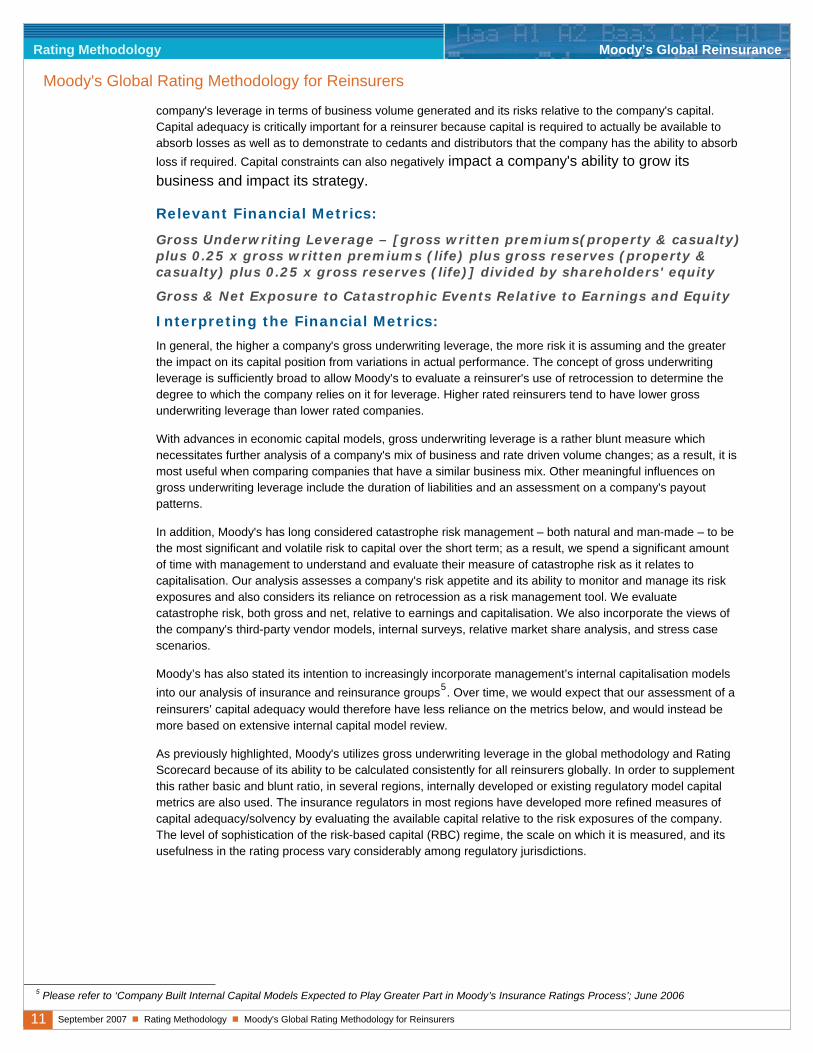
11 September 2007 Rating Methodology Moody's Global Rating Methodology for Reinsurers
Rating Methodology Moody’s Global Reinsurance
Moody's Global Rating Methodology for Reinsurers
company's leverage in terms of business volume generated and its risks relative to the company's capital. Capital adequacy is critically important for a reinsurer because capital is required to actually be available to absorb losses as well as to demonstrate to cedants and distributors that the company has the ability to absorb loss if required. Capital constraints can also negatively impact a company's ability to grow its business and impact its strategy.
Relevant Financial Metrics:
Gross Underwriting Leverage – [gross written premiums(property & casualty) plus 0.25 x gross written premiums (life) plus gross reserves (property & casualty) plus 0.25 x gross reserves (life)] divided by shareholders' equity
Gross & Net Exposure to Catastrophic Events Relative to Earnings and Equity
Interpreting the Financial Metrics:
In general, the higher a company's gross underwriting leverage, the more risk it is assuming and the greater the impact on its capital position from variations in actual performance. The concept of gross underwriting leverage is sufficiently broad to allow Moody's to evaluate a reinsurer's use of retrocession to determine the degree to which the company relies on it for leverage. Higher rated reinsurers tend to have lower gross underwriting leverage than lower rated companies.
With advances in economic capital models, gross underwriting leverage is a rather blunt measure which necessitates further analysis of a company's mix of business and rate driven volume changes; as a result, it is most useful when comparing companies that have a similar business mix. Other meaningful influences on gross underwriting leverage include the duration of liabilities and an assessment on a company's payout patterns.
In addition, Moody's has long considered catastrophe risk management – both natural and man-made – to be the most significant and volatile risk to capital over the short term; as a result, we spend a significant amount of time with management to understand and evaluate their measure of catastrophe risk as it relates to capitalisation. Our analysis assesses a company's risk appetite and its ability to monitor and manage its risk exposures and also considers its reliance on retrocession as a risk management tool. We evaluate catastrophe risk, both gross and net, relative to earnings and capitalisation. We also incorporate the views of the company's third-party vendor models, internal surveys, relative market share analysis, and stress case scenarios.
Moody’s has also stated its intention to increasingly incorporate management’s internal capitalisation models into our analysis of insurance and reinsurance groups5. Over time, we would expect that our assessment of a reinsurers’ capital adequacy would therefore have less reliance on the metrics below, and would instead be more based on extensive internal capital model review.
As previously highlighted, Moody's utilizes gross underwriting leverage in the global methodology and Rating Scorecard because of its ability to be calculated consistently for all reinsurers globally. In order to supplement this rather basic and blunt ratio, in several regions, internally developed or existing regulatory model capital metrics are also used. The insurance regulators in most regions have developed more refined measures of capital adequacy/solvency by evaluating the available capital relative to the risk exposures of the company. The level of sophistication of the risk-based capital (RBC) regime, the scale on which it is measured, and its usefulness in the rating process vary considerably among regulatory jurisdictions.
5 Please refer to ‘Company Built Internal Capital Models Expected to Play Greater Part in Moody’s Insurance Ratings Process’; June 2006
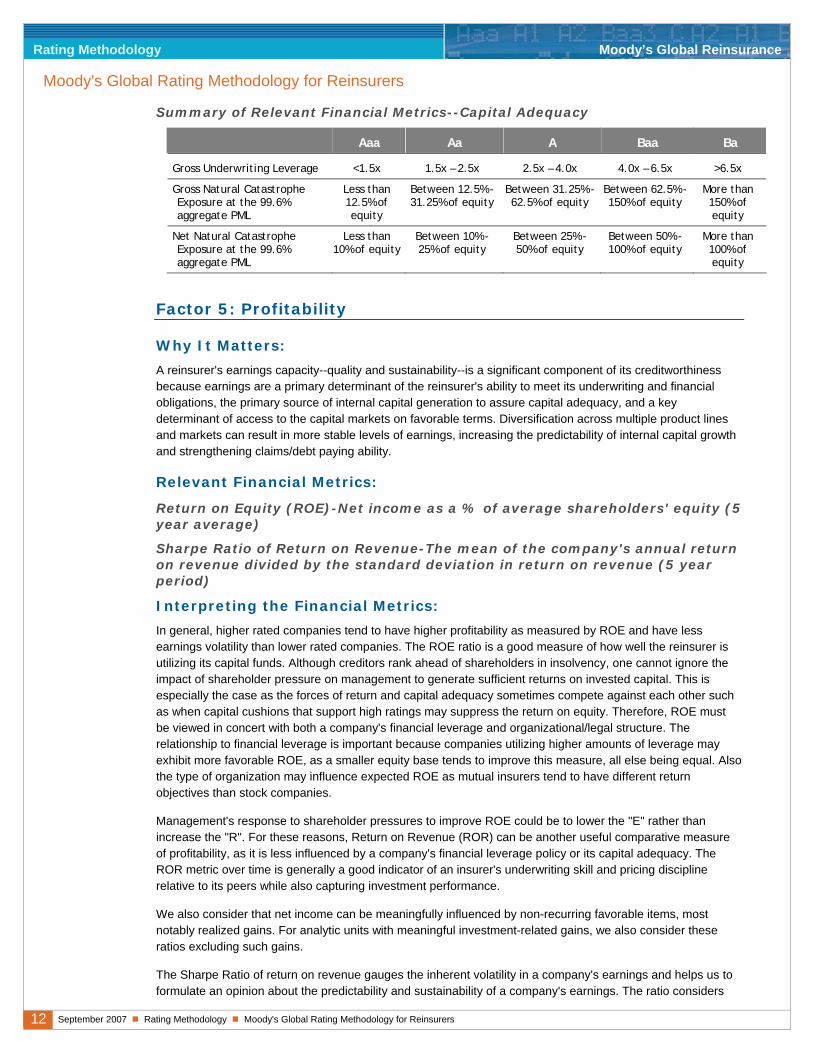
12 September 2007 Rating Methodology Moody's Global Rating Methodology for Reinsurers
Rating Methodology Moody’s Global Reinsurance
Moody's Global Rating Methodology for Reinsurers
Summary of Relevant Financial Metrics--Capital Adequacy
Aaa Aa A Baa Ba
Gross Underwriting Leverage <1.5x 1.5x – 2.5x 2.5x – 4.0x 4.0x – 6.5x >6.5x
Gross Natural Catastrophe Exposure at the 99.6% aggregate PML
Less than 12.5% of equity
Between 12.5% - 31.25% of equity
Between 31.25% - 62.5% of equity
Between 62.5% - 150% of equity
More than 150% of equity
Net Natural Catastrophe Exposure at the 99.6% aggregate PML
Less than 10% of equity
Between 10% - 25% of equity
Between 25% - 50% of equity
Between 50% - 100% of equity
More than 100% of equity
Factor 5: Profitability
Why It Matters:
A reinsurer's earnings capacity--quality and sustainability--is a significant component of its creditworthiness because earnings are a primary determinant of the reinsurer's ability to meet its underwriting and financial obligations, the primary source of internal capital generation to assure capital adequacy, and a key determinant of access to the capital markets on favorable terms. Diversification across multiple product lines and markets can result in more stable levels of earnings, increasing the predictability of internal capital growth and strengthening claims/debt paying ability.
Relevant Financial Metrics:
Return on Equity (ROE)-Net income as a % of average shareholders' equity (5 year average)
Sharpe Ratio of Return on Revenue-The mean of the company's annual return on revenue divided by the standard deviation in return on revenue (5 year period)
Interpreting the Financial Metrics:
In general, higher rated companies tend to have higher profitability as measured by ROE and have less earnings volatility than lower rated companies. The ROE ratio is a good measure of how well the reinsurer is utilizing its capital funds. Although creditors rank ahead of shareholders in insolvency, one cannot ignore the impact of shareholder pressure on management to generate sufficient returns on invested capital. This is especially the case as the forces of return and capital adequacy sometimes compete against each other such as when capital cushions that support high ratings may suppress the return on equity. Therefore, ROE must be viewed in concert with both a company's financial leverage and organizational/legal structure. The relationship to financial leverage is important because companies utilizing higher amounts of leverage may exhibit more favorable ROE, as a smaller equity base tends to improve this measure, all else being equal. Also the type of organization may influence expected ROE as mutual insurers tend to have different return objectives than stock companies.
Management's response to shareholder pressures to improve ROE could be to lower the "E" rather than increase the "R". For these reasons, Return on Revenue (ROR) can be another useful comparative measure of profitability, as it is less influenced by a company's financial leverage policy or its capital adequacy. The ROR metric over time is generally a good indicator of an insurer's underwriting skill and pricing discipline relative to its peers while also capturing investment performance.
We also consider that net income can be meaningfully influenced by non-recurring favorable items, most notably realized gains. For analytic units with meaningful investment-related gains, we also consider these ratios excluding such gains.
The Sharpe Ratio of return on revenue gauges the inherent volatility in a company's earnings and helps us to formulate an opinion about the predictability and sustainability of a company's earnings. The ratio considers
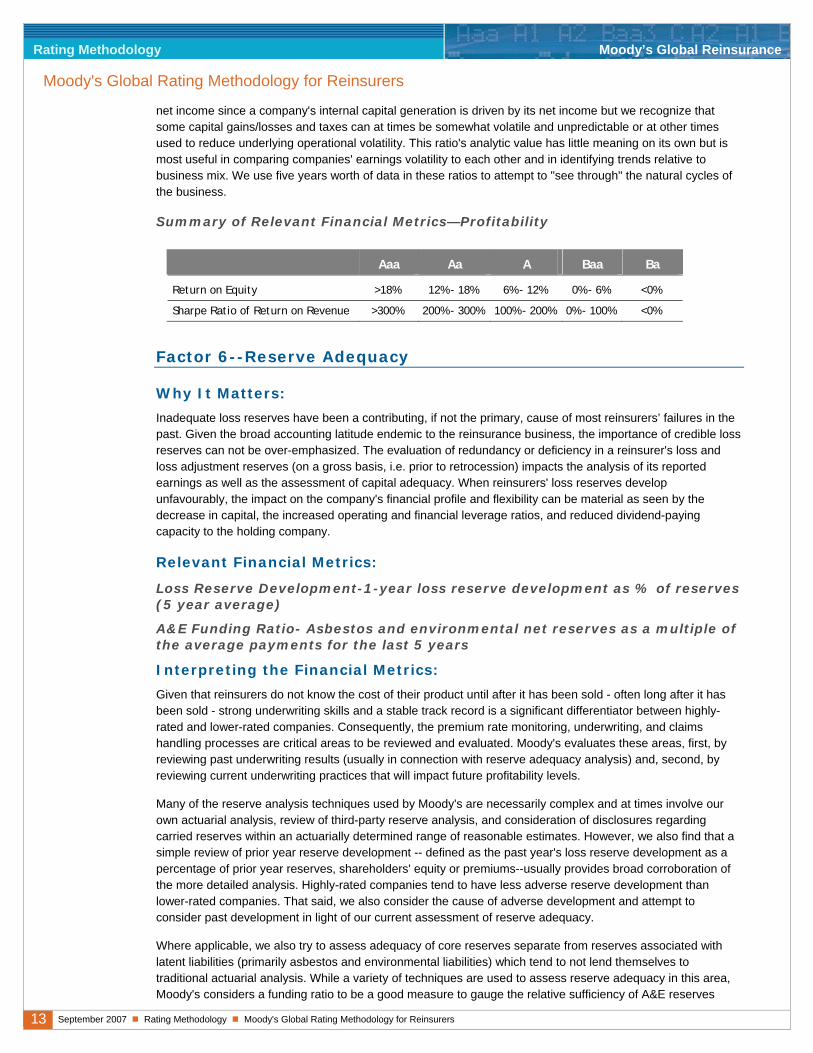
13 September 2007 Rating Methodology Moody's Global Rating Methodology for Reinsurers
Rating Methodology Moody’s Global Reinsurance
Moody's Global Rating Methodology for Reinsurers
net income since a company's internal capital generation is driven by its net income but we recognize that some capital gains/losses and taxes can at times be somewhat volatile and unpredictable or at other times used to reduce underlying operational volatility. This ratio's analytic value has little meaning on its own but is most useful in comparing companies' earnings volatility to each other and in identifying trends relative to business mix. We use five years worth of data in these ratios to attempt to "see through" the natural cycles of the business.
Summary of Relevant Financial Metrics—Profitability
Aaa Aa A Baa Ba
Return on Equity >18% 12% - 18% 6% - 12% 0% - 6% <0%
Sharpe Ratio of Return on Revenue >300% 200% - 300% 100% - 200% 0% - 100% <0%
Factor 6--Reserve Adequacy
Why It Matters:
Inadequate loss reserves have been a contributing, if not the primary, cause of most reinsurers’ failures in the past. Given the broad accounting latitude endemic to the reinsurance business, the importance of credible loss reserves can not be over-emphasized. The evaluation of redundancy or deficiency in a reinsurer's loss and loss adjustment reserves (on a gross basis, i.e. prior to retrocession) impacts the analysis of its reported earnings as well as the assessment of capital adequacy. When reinsurers' loss reserves develop unfavourably, the impact on the company's financial profile and flexibility can be material as seen by the decrease in capital, the increased operating and financial leverage ratios, and reduced dividend-paying capacity to the holding company.
Relevant Financial Metrics:
Loss Reserve Development-1-year loss reserve development as % of reserves (5 year average)
A&E Funding Ratio- Asbestos and environmental net reserves as a multiple of the average payments for the last 5 years
Interpreting the Financial Metrics:
Given that reinsurers do not know the cost of their product until after it has been sold - often long after it has been sold - strong underwriting skills and a stable track record is a significant differentiator between highly-rated and lower-rated companies. Consequently, the premium rate monitoring, underwriting, and claims handling processes are critical areas to be reviewed and evaluated. Moody's evaluates these areas, first, by reviewing past underwriting results (usually in connection with reserve adequacy analysis) and, second, by reviewing current underwriting practices that will impact future profitability levels.
Many of the reserve analysis techniques used by Moody's are necessarily complex and at times involve our own actuarial analysis, review of third-party reserve analysis, and consideration of disclosures regarding carried reserves within an actuarially determined range of reasonable estimates. However, we also find that a simple review of prior year reserve development -- defined as the past year's loss reserve development as a percentage of prior year reserves, shareholders' equity or premiums--usually provides broad corroboration of the more detailed analysis. Highly-rated companies tend to have less adverse reserve development than lower-rated companies. That said, we also consider the cause of adverse development and attempt to consider past development in light of our current assessment of reserve adequacy.
Where applicable, we also try to assess adequacy of core reserves separate from reserves associated with latent liabilities (primarily asbestos and environmental liabilities) which tend to not lend themselves to traditional actuarial analysis. While a variety of techniques are used to assess reserve adequacy in this area, Moody's considers a funding ratio to be a good measure to gauge the relative sufficiency of A&E reserves
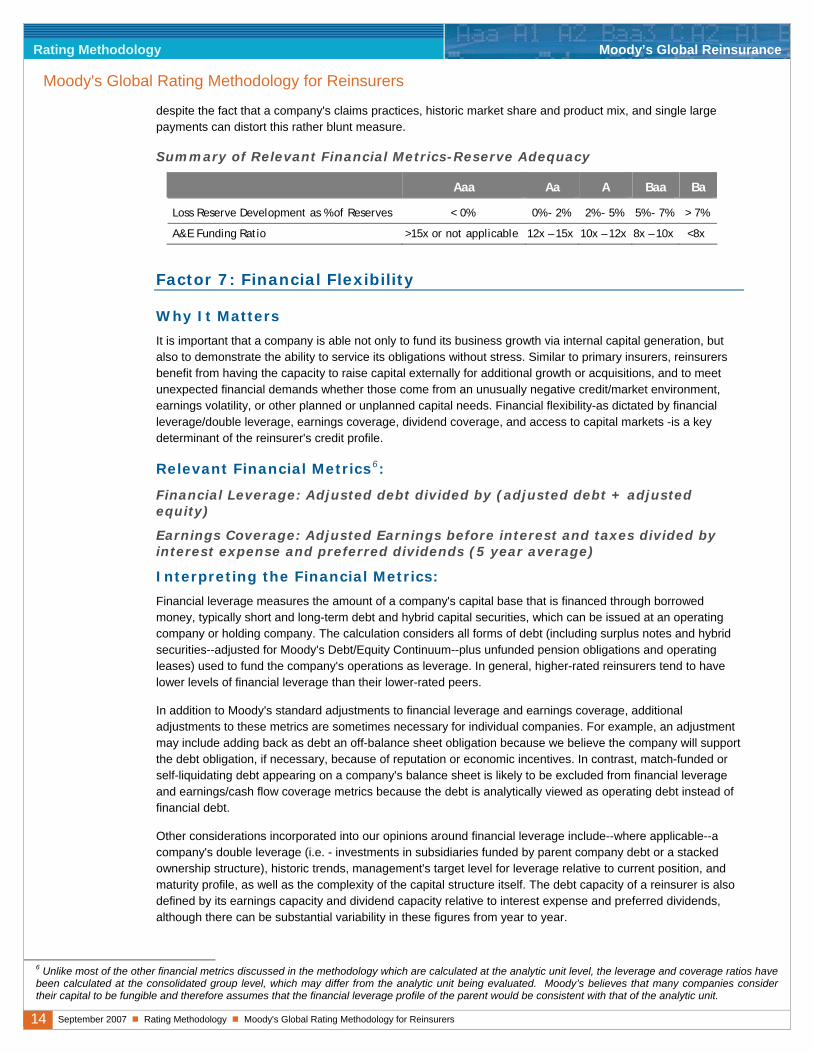
14 September 2007 Rating Methodology Moody's Global Rating Methodology for Reinsurers
Rating Methodology Moody’s Global Reinsurance
Moody's Global Rating Methodology for Reinsurers
despite the fact that a company's claims practices, historic market share and product mix, and single large payments can distort this rather blunt measure.
Summary of Relevant Financial Metrics-Reserve Adequacy8
Aaa Aa A Baa Ba
Loss Reserve Development as % of Reserves < 0% 0% - 2% 2% - 5% 5% - 7% > 7%
A&E Funding Ratio� >15x or not applicable 12x – 15x 10x – 12x 8x – 10x <8x
Factor 7: Financial Flexibility
Why It Matters
It is important that a company is able not only to fund its business growth via internal capital generation, but also to demonstrate the ability to service its obligations without stress. Similar to primary insurers, reinsurers benefit from having the capacity to raise capital externally for additional growth or acquisitions, and to meet unexpected financial demands whether those come from an unusually negative credit/market environment, earnings volatility, or other planned or unplanned capital needs. Financial flexibility-as dictated by financial leverage/double leverage, earnings coverage, dividend coverage, and access to capital markets -is a key determinant of the reinsurer's credit profile.
Relevant Financial Metrics6:
Financial Leverage: Adjusted debt divided by (adjusted debt + adjusted equity)
Earnings Coverage: Adjusted Earnings before interest and taxes divided by interest expense and preferred dividends (5 year average)
Interpreting the Financial Metrics:
Financial leverage measures the amount of a company's capital base that is financed through borrowed money, typically short and long-term debt and hybrid capital securities, which can be issued at an operating company or holding company. The calculation considers all forms of debt (including surplus notes and hybrid securities--adjusted for Moody's Debt/Equity Continuum--plus unfunded pension obligations and operating leases) used to fund the company's operations as leverage. In general, higher-rated reinsurers tend to have lower levels of financial leverage than their lower-rated peers.
In addition to Moody's standard adjustments to financial leverage and earnings coverage, additional adjustments to these metrics are sometimes necessary for individual companies. For example, an adjustment may include adding back as debt an off-balance sheet obligation because we believe the company will support the debt obligation, if necessary, because of reputation or economic incentives. In contrast, match-funded or self-liquidating debt appearing on a company's balance sheet is likely to be excluded from financial leverage and earnings/cash flow coverage metrics because the debt is analytically viewed as operating debt instead of financial debt.
Other considerations incorporated into our opinions around financial leverage include--where applicable--a company's double leverage (i.e. - investments in subsidiaries funded by parent company debt or a stacked ownership structure), historic trends, management's target level for leverage relative to current position, and maturity profile, as well as the complexity of the capital structure itself. The debt capacity of a reinsurer is also defined by its earnings capacity and dividend capacity relative to interest expense and preferred dividends, although there can be substantial variability in these figures from year to year.
6 Unlike most of the other financial metrics discussed in the methodology which are calculated at the analytic unit level, the leverage and coverage ratios have been calculated at the consolidated group level, which may differ from the analytic unit being evaluated. Moody’s believes that many companies consider their capital to be fungible and therefore assumes that the financial leverage profile of the parent would be consistent with that of the analytic unit.
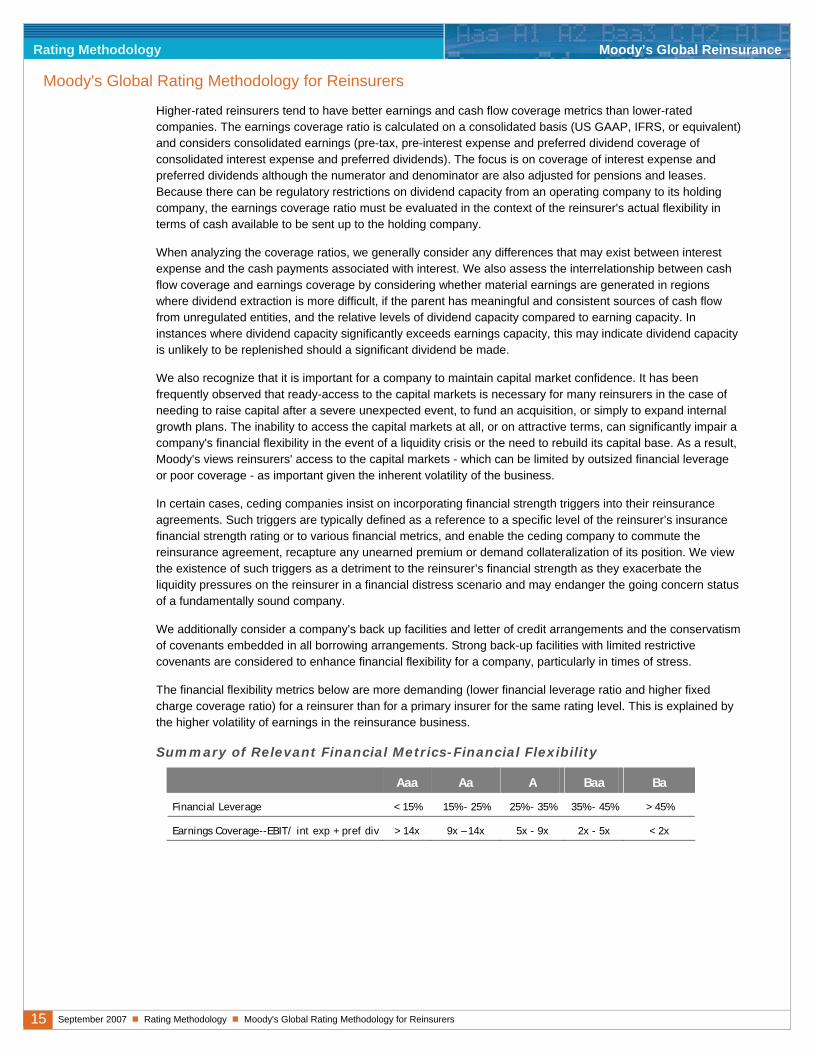
15 September 2007 Rating Methodology Moody's Global Rating Methodology for Reinsurers
Rating Methodology Moody’s Global Reinsurance
Moody's Global Rating Methodology for Reinsurers
Higher-rated reinsurers tend to have better earnings and cash flow coverage metrics than lower-rated companies. The earnings coverage ratio is calculated on a consolidated basis (US GAAP, IFRS, or equivalent) and considers consolidated earnings (pre-tax, pre-interest expense and preferred dividend coverage of consolidated interest expense and preferred dividends). The focus is on coverage of interest expense and preferred dividends although the numerator and denominator are also adjusted for pensions and leases. Because there can be regulatory restrictions on dividend capacity from an operating company to its holding company, the earnings coverage ratio must be evaluated in the context of the reinsurer's actual flexibility in terms of cash available to be sent up to the holding company.
When analyzing the coverage ratios, we generally consider any differences that may exist between interest expense and the cash payments associated with interest. We also assess the interrelationship between cash flow coverage and earnings coverage by considering whether material earnings are generated in regions where dividend extraction is more difficult, if the parent has meaningful and consistent sources of cash flow from unregulated entities, and the relative levels of dividend capacity compared to earning capacity. In instances where dividend capacity significantly exceeds earnings capacity, this may indicate dividend capacity is unlikely to be replenished should a significant dividend be made.
We also recognize that it is important for a company to maintain capital market confidence. It has been frequently observed that ready-access to the capital markets is necessary for many reinsurers in the case of needing to raise capital after a severe unexpected event, to fund an acquisition, or simply to expand internal growth plans. The inability to access the capital markets at all, or on attractive terms, can significantly impair a company's financial flexibility in the event of a liquidity crisis or the need to rebuild its capital base. As a result, Moody's views reinsurers' access to the capital markets - which can be limited by outsized financial leverage or poor coverage - as important given the inherent volatility of the business.
In certain cases, ceding companies insist on incorporating financial strength triggers into their reinsurance agreements. Such triggers are typically defined as a reference to a specific level of the reinsurer’s insurance financial strength rating or to various financial metrics, and enable the ceding company to commute the reinsurance agreement, recapture any unearned premium or demand collateralization of its position. We view the existence of such triggers as a detriment to the reinsurer’s financial strength as they exacerbate the liquidity pressures on the reinsurer in a financial distress scenario and may endanger the going concern status of a fundamentally sound company.
We additionally consider a company's back up facilities and letter of credit arrangements and the conservatism of covenants embedded in all borrowing arrangements. Strong back-up facilities with limited restrictive covenants are considered to enhance financial flexibility for a company, particularly in times of stress.
The financial flexibility metrics below are more demanding (lower financial leverage ratio and higher fixed charge coverage ratio) for a reinsurer than for a primary insurer for the same rating level. This is explained by the higher volatility of earnings in the reinsurance business.
Summary of Relevant Financial Metrics-Financial Flexibility
Aaa Aa A Baa Ba
Financial Leverage < 15% 15% - 25% 25% - 35% 35% - 45% > 45%
Earnings Coverage--EBIT/ int exp + pref div > 14x 9x – 14x 5x - 9x 2x - 5x < 2x
16 September 2007 Rating Methodology Moody's Global Rating Methodology for Reinsurers
Rating Methodology Moody’s Global Reinsurance
Moody's Global Rating Methodology for Reinsurers
Other Considerations in Determining Stand-Alone Rating
Management, Governance, And Risk Management
Management Characteristics:
Management quality underpins corporate success or failure, and is a major factor in determining ratings. We assess management's credibility, experience, and reliability. Management's ability to develop a strategic vision and its ability to execute that vision are critical factors for a company's success in a competitive industry where the status quo is changing rapidly. A review of the reinsurer's strategy includes the firm's long-term vision, risk-return appetite, attitude towards financial and operating leverage, strategies for raising capital, and view of shareholder value creation. Growth strategies--acquisitions/divestitures, joint ventures/strategic alliances, etc.--can also impact its risk profile.
The overall risk culture that management has built will strongly affect the company's appetite for and management of risk and leverage. As a result, management's strength, its discipline in financial planning and risk management, and its ability to execute are vital elements in our evaluation of credit risk.
Assessing management quality involves examining the experience, track record, and success of management, demonstrated by its ability to sustain a company's franchise, earnings, and capital position, by the absence of one time financial events, by the avoidance of frequent changes in strategy, and by the organization's financial and business flexibility. We consider its management depth as well as its financial track record in such areas as reserves, investments, profitability, and risk management. Management's strategy, as measured by overall growth or new business development, also plays an important role in our opinion of an insurer's credit profile. Throughout the rating process, Moody's forms an opinion of a management team's likely response to challenges in the firm's economic, competitive and regulatory environment given their goals and motivations.
Corporate Governance
Corporate governance as promoted by the board of directors, as the natural counterpart to management, is equally responsible for the financial health and credit profile of the company. Depth of corporate governance is evaluated by the corporate board's independence, expertise, and involvement, as well as its ability to align governance practices with proper oversight of the management team and corporate strategy. Independent review of the key financial reporting and risk management processes is important, as is oversight of compliance and regulatory issues. The board plays a central role in ensuring management sets the appropriate ethical tone within the company. Compensation schemes and the board's oversight of compensation practices are also considered for their potential impact on management's motivations. Plans that reward management and employees for building long-term value in the company tend to be viewed positively from a credit perspective.
Moody's also contemplates the interests, motivations, track-record, and resources of large shareholders in order to anticipate how they may be expected to behave and respond with regards to their investment, both in the normal course of events and in times of stress. The often conflicting interests of shareholders and cedants are also taken into account when considering a reinsurer's governance, in terms of how the board and management team balances these demands.
Risk Management
Management's and the board's ability to identify, monitor, manage, and mitigate its risks goes to the heart of a company's success in minimizing unexpected events and volatility and in protecting the interests of its policyholders and other stakeholders. Taking risks, whether in underwriting, investments, sales practices, acquisitions, or other areas, is a necessary activity for a reinsurance company. However, it is vitally important that management (and the board of directors) understand the risks assumed and engage in active measures to manage those risks in order for the company to maintain its financial performance and flexibility, reputation,
17 September 2007 Rating Methodology Moody's Global Rating Methodology for Reinsurers
Rating Methodology Moody’s Global Reinsurance
Moody's Global Rating Methodology for Reinsurers
market position, and confidence in the capital markets. The risk management discipline at an insurer is an essential part of its overall governance and management.
What We Evaluate Related to Management, Governance, and Risk Management:
Given all the various inputs, the influence from management and governance on ratings is subjective. That said, Moody's has a general presumption that management is competent and governance and risk management protocol and procedures are appropriately designed and working. Moody's typically meets annually with members of management, and at times board members, in order to assess these important areas. As noted in recently published research7, corporate governance does not typically affect ratings, except in rare situations.
In terms of Risk Management techniques, Moody’s recently set out its Risk Management Assessment Framework for each of Life and Non-Life insurance, setting out what it regards as best practice in a number of relevant areas8. Moody’s uses these frameworks in assessing the Risk Management capabilities of insurance and reinsurance groups. Highly rated groups would typically be expected to have risk management practices approaching or in line with Moody’s view of global best practice.
Accounting Policy & Disclosure
Relevant and timely financial information is a critical part of any financial analysis. Many reinsurers prepare financial information under generally accepted accounting principles either developed by their home country or based on international standards. Financial information is also generally prepared on a regulatory basis of accounting which may differ from generally accepted accounting principles. The presence of a strong government/independent body for financial standards is considered a positive factor when evaluating an accounting regime. Disclosure of financial information varies widely on a global basis and within regions. In certain locations, regulatory bodies provide access to financial information, although the depth of that information also varies. Some companies have chosen to provide easy access to their own financial data which Moody's view favorably.
The consistent application of financial information is a fundamental presumption of financial analysis. When evaluating accounting principles, we consider how well financial reporting mirrors economic reality. Where we believe the economics of a transaction are not consistent with financial reporting, we may adjust financial statements to facilitate our analysis.
Sovereign And Regulatory Environment
The local jurisdiction's economic and political stability and the degree of government support/interference can have a strong impact--either positive or negative--on the credit profile of a reinsurance company. The presence of a well-developed local capital market may determine a company's ability to raise sufficient capital efficiently to grow or cushion itself against adverse financial conditions.
The reinsurer's credit profile is influenced by the regulatory rules and practices within its market, as well as potential changes in regulations or taxation of its products that could affect a reinsurer's competitive position, or could lead to a restructuring of segments of the industry. The failure-resolution mechanism and practices of the regulatory authorities can also impact a reinsurer's default rate and loss given default.
Measurement of a company's sovereign and regulatory environment incorporates the use of Moody's Foreign Currency Ceiling as well as Moody's Local Currency Ceiling. The local currency guideline reflects our view of the country's political, economic and regulatory stability. We focus on Moody's Local Currency Ceiling for the
7 See Moody’s Special Comment: Assessing Corporate Governance As A Ratings Driver For North American Financial Institutions, April, 2006 (#97279) for further information. 8 Please refer to ‘Risk Management Assessment : Non-Life Insurance Companies’ and ‘Risk Management Assessment : Life Insurance Companies’, March 2007.
18 September 2007 Rating Methodology Moody's Global Rating Methodology for Reinsurers
Rating Methodology Moody’s Global Reinsurance
Moody's Global Rating Methodology for Reinsurers
insurer's primary market as this guideline generally sets the ceiling for the most financial secure company in a given country.
Moving From Stand-Alone Rating to Public Rating-Evaluating Support
While the above factors are critical in order to determine the stand-alone rating of reinsurers, the analytic consideration of support -- explicit or implicit -- from a parent company or affiliate is necessary to get to the public rating, which is usually higher than the company's stand-alone rating.
Support from a Parent Company or Affiliate
The credit rating of a reinsurer can ultimately be affected by its relationship to its parent, to a subsidiary, or to affiliate companies through either explicit or implicit support9. Support, once determined, is then generally "added to" the rating by narrowing the spread between the stand-alone credit rating of the entity/security and the rating of the entity providing the support. Ultimately, the extent to which the affiliation benefits the rating is a matter of judgment, not convention, owing to the large number of variables that must be considered. Our assessment of this support may vary depending on our view of how important that entity is to the overall enterprise business model, its integration with the rest of the organization from a branding, management, distribution, and operating perspective, as well as our view of the company's ability and willingness to support that entity.
Support is evaluated in terms of past actions of the supporter as well as current public statements of support. In all cases, Moody's judgment about how the prospective supporting entity is likely to behave in the future is strongly influenced by our assessment of its prospective economic motivations. Accordingly, strong public statements of support would not be persuasive in raising the rating of a weaker subsidiary if a sound economic rationale for doing so was missing. Although support may raise a company's rating, it may not necessarily raise it to the same level as that of the supporting entity.
While, in most instances, support is incrementally positive, there are instances where group affiliation may constrain the public rating of an entity/security relative to its stand-alone rating level. For example, if the reinsurer is affiliated with weak or highly-leveraged entities, such weaknesses usually, in turn, weaken the reinsurer. History has shown that capital often flows from stronger to weaker companies within a controlled group, and frequently before regulatory action can occur.
Support to operating companies that write reinsurance business is usually implicit. It can manifest itself in a variety of ways, e.g. common branding and worldwide marketing campaigns, sharing of underwriting practices and full integration of IT systems, oral representations made by senior management of the Group to cedants and to the wider financial community, extensive intragroup reinsurance, both on a quota share and stop-loss basis, as well as intragroup financing with the objective to improve the standalone creditworthiness of the supported entity vis-à-vis cedants, e.g. subordinated loans. While such support may have a beneficial effect on the creditworthiness of the supported reinsurer, the assigned rating of the supported entity could still differ from that of the strongest operating entity of the Group. In Moody’s view, the decision to continue providing implicit support could be reconsidered by the parent in extremis, particularly in a situation where strengthening the capital base of the supported entity would appear uneconomical.
Explicit support is usually intended to transfer the credit of the supporting entity to the supported affiliate or obligation. Explicit support is generally in the form of a capital maintenance agreement, minimum net worth agreement, or some type of direct guarantee. It can also take the form of management contracts, marketing arrangements, reinsurance agreements, or tax-sharing agreements.
In analyzing explicit support, we examine the specific legal nature and enforceability of the support, as well as its possible termination. Explicit support, properly structured, can achieve credit transference and bring the affiliate's rating up to that of the supporting entity. However, it is also necessary to make an assessment as to
9 For additional discussion of Moody’s rating policy related to support, please see Rating Non-Guaranteed Subsidiaries: Credit Considerations in Assigning Subsidiary Ratings In the Absence of Legally Binding Parental Support, December, 2003.
19 September 2007 Rating Methodology Moody's Global Rating Methodology for Reinsurers
Rating Methodology Moody’s Global Reinsurance
Moody's Global Rating Methodology for Reinsurers
whether the extension of this support (as well as with implicit support) will weaken the credit profile of the parent or affiliate and result in a downgrade of the supporting entity.
Factoring in Support from Other Than Related Entities
Moody's does not ascribe a meaningful level of implicit support to reinsurance companies from their governments. Indeed, past history has shown that reinsurers - even large ones - have been allowed by local and national governments to fail without intervention. If the insurer were directly owned by the government, however, support would be considered according to Moody's methodology on "The Application of Joint Default Analysis to Government Related Issuers (April 2005)".
Relationship Between Insurance Financial Strength and Other Ratings
Insurance Financial Strength and Debt Ratings
Moody's insurance financial strength or claims paying ability ratings are opinions of the ability of insurance and reinsurance companies to punctually repay senior policyholder obligations and claims. These ratings apply to companies engaged in the business of providing reinsurance and taking insurance risk, typically known as reinsurance operating companies. While many reinsurance groups manage their operations by business unit, Moody's insurance financial strength ratings are always assigned to legal entities.
In contrast, Moody's long-term debt ratings are assigned to specific securities issued by either a holding or operating company. The relationship between the insurance financial strength and debt ratings is dependent upon the legal and regulatory framework in a particular jurisdiction and the relative standing of policyholders and debt holders in the event of insolvency, bankruptcy, reorganization, or liquidation of the entity.
The relationship between the ratings for these different classes of creditors is discussed in the sections below, with guidance about the typical degree of difference (expressed in number of rating "notches") that can be expected in these ratings. These are not to be taken as absolute rules, but rather as guidelines in interpreting the relationship between financial strength ratings and debt ratings. It is important to note that a well capitalized, profitable reinsurance operating company with a highly leveraged parent or a weak affiliate will often have a lower financial strength rating than it would have were it a free-standing company because of the pressure those factors can place on its earnings and capital. Conversely, an IFS rating of a particular entity can be raised by implicit support associated with ownership by a financially strong group.
Priority of Claim Notching Between Operating Company IFS and Other Ratings
IFS ratings are typically the highest credit ratings within an enterprise. From an analytic perspective, the IFS rating is also the starting point for the development of all the other ratings of securities issued by reinsurance operating companies, their related holding companies, financing affiliates, etc. We generally consider the IFS rating as the anchor rating and the rating differential between the IFS and other ratings, referred to as priority of claim notching, as a derivative of the IFS assessment, based upon the specifics of the instrument and convention.
Unlike in primary insurers, where at the insurance operating company level, regulators generally accord policyholder obligations a preferred status in liquidation, above that of financial creditors, in operating reinsurance companies underwriting liabilities typically rank pari passu with senior unsecured debt (assuming it was issued by the operating reinsurance company). As a result, Moody's will normally rate senior debt issued by reinsurance operating companies at the same level as their IFS rating, however, it is likely that there will be wider notching (e.g., two notches instead of one) to the subordinated debt rating at the operating company entity because of the greater expected loss for that creditor class compared to the policyholder and senior creditor classes. Exceptions to this practice include cases where the reinsurance operating company maintains unusually high double leverage and where the reinsurer's financial strength approaches the secure/vulnerable cutoff (i.e., Baa/Ba).
20 September 2007 Rating Methodology Moody's Global Rating Methodology for Reinsurers
Rating Methodology Moody’s Global Reinsurance
Moody's Global Rating Methodology for Reinsurers
Priority of Claim Notching Between IFS and Holding Company Ratings
The IFS rating at the operating company will also usually be higher than the reinsurance holding company's senior debt rating, reflecting the typically subordinated position of holding company creditors. Although the default probability of a reinsurance operating company and its holding company are highly correlated, the loss severity (given default) for holding company creditors will be significantly greater given their structural subordination to operating company financial obligations -- e.g. holding company creditor claims typically represent simply an equity investment in the regulated company which will be paid after all obligations of the operating company are met.
Typical notching between the IFS rating at an operating company and the senior debt rating at the holding company (in the case of a simple organizational structure with one primary operating company in a jurisdiction of strong regulatory oversight) is three notches. Similar to the examples discussed above, in cases of unusually high double leverage and of an operating insurer's rating approaching the Baa/Ba cutoff, the notching would typically widen.
Taking Account of Differences in Regulatory Jurisdiction
In jurisdictions where the regulatory regime and oversight is regarded as being more lenient (e.g. modest minimum capital requirements) and the dividend capacity available to the holding company from its operating company relatively substantial, then there is a rationale for narrower notching than typical for an operating company/holding company relationship. A Bermuda domicile, at least for simple holding company structures, would typically provide such an advantage, and here we would expect to maintain two notches between IFS rating at an operating company and senior debt at holding company for a Bermudian reinsurer.
Taking Account of the Impact of Holding Company Diversification and Liquidity
Whereas the typical notching between the IFS rating at the operating company and the senior debt rating at its holding company is three notches, there can be narrower notching if the holding company benefits from multiple sources of sizable, uncorrelated earnings and dividend cash flows (e.g. significant banking, primary life and P&C operations and earnings). Similarly, if a holding company benefits from significant sources of dividends from unregulated subsidiaries (which are not highly correlated with the regulated subsidiaries), notching would be compressed. The reduction in notching will vary depending on the breadth and depth of the holding company's diverse sources of subsidiary cash-flows.
In certain cases, a holding company may consistently maintain significant amounts of high-quality liquid assets, which it could use in a time of financial stress to repay a substantial portion of its outstanding debt obligations. The difference between the operating company IFS and the holding company senior debt rating
Global and National Scale Ratings
With the extension of credit ratings from highly-developed capital markets to newer emerging markets, Moody's rating scales have evolved to provide comparability on both a globally consistent and nationally comparable basis. This development has become necessary for a number of reasons which include the development of local-currency-based capital markets in a number of countries and an increased demand on the part of investors and intermediaries in lower-rated countries for a higher degree of credit differentiation among firms within a given national market, regardless of the sovereign's credit profile. In order to address these issues, Moody's has developed two rating scale conventions, namely Global Foreign & Local Currency Ratings (GFC & GLC Ratings) and National Scale Ratings (NSRs).
Global Ratings
Moody's Global ratings, encompassing both Foreign and Local currency designations, are intended to be globally comparable relative rankings of credit risk. GLC ratings reflect Moody's opinion about risk of loss and default, for obligations denominated in local currency. GFC ratings, in contrast, address the risk of obligations denominated in a foreign currency. Thus, GLC and GFC ratings are identical except that GFC ratings must incorporate the additional sovereign risk - that a payment default could result from the imposition of convertibility restrictions or some other sovereign-imposed payment moratorium. In such a case, the individual

21 September 2007 Rating Methodology Moody's Global Rating Methodology for Reinsurers
Rating Methodology Moody’s Global Reinsurance
Moody's Global Rating Methodology for Reinsurers
issuer might have the capacity to pay obligations in full and on time in its own local currency, but is denied access to the currency of payment, resulting in a default. The foreign currency ceiling represents the risk that a country might impose a moratorium on foreign currency payments in the event the government defaults on its own foreign currency debt. However, if an issuer’s GLC debt rating is above the ceiling, then its GFC debt rating might still “pierce” the ceiling if the debt obligation is sold under foreign law and Moody’s believes that the issuer might escape such a moratorium. On the other hand, foreign currency IFSRs cannot pierce the ceiling.
National Scale Ratings
In contrast to Moody's global ratings, National Scale Ratings (NSRs) are relative measures of creditworthiness within a single domestic market, and across industry sectors. Unlike GLC ratings, NSRs do have modifiers that indicate to which country they refer (e.g. A2.xx, with 'xx' designating the respective country; mx = Mexico, br = Brazil, etc.). In many countries, NSRs are required either by insurance or securities regulation, or by convention. Because NSR scales are different for each country and are relative measures of credit quality in that country, they are not comparable from one country to another (e.g. A2.mx is not comparable with a A2.br). That said, they are useful tools for assessing relative credit strength within a national market.
Local Currency Ceilings and Their Effect on Moody's Ratings
Moody’s Local Currency Ceiling summarizes the general country level risks (excluding foreign currency transfer risk) that should be taken into account in assigning local currency ratings to locally-domiciled obligors. In many countries the local currency guideline is higher than the sovereign’s own local currency debt ratings. The guideline indicates the rating level that will generally be assigned to the financially strongest obligation in the country. Accordingly, the Local Currency Ceiling will usually be a constraint on the GLC rating for any company or obligation. The GLC rating generally and the Local Currency IFS rating in particular, is always the starting point for Moody’s insurance rating analysis and is related to other Moody’s ratings in the following ways.
The Global Foreign Currency IFS rating is the same as the Local Currency IFS rating, except where the LC IFS rating is above the Foreign Currency Ceiling, in which case the FC IFS rating will be the same as the Foreign Currency Ceiling. By convention, references to an insurer's financial strength rating are understood to refer to the Foreign Currency IFS rating, unless otherwise specified.
Global Local Currency Debt Ratings are determined from the Local Currency IFS rating based on holding company analysis and the notching conventions previously described.
Global Foreign Currency Debt Ratings are determined from the Local Currency Debt Rating, as constrained by the Foreign Currency Ceiling, as discussed above.
The National Scale IFS rating is determined based on the Local Currency IFS rating and a national scale rating matrix that is distinct for each country and applied to all global local currency ratings within that country.
National Scale Debt Ratings are determined based on the Local or Foreign Currency Debt Rating, using the same national scale rating matrix as above.
Special Considerations for Start-Ups
In recent years, there has been a considerable increase of investor interest in committing capital to start-up ventures in the global reinsurance market. This trend is reinforced by low barriers to entry in the industry, the somewhat limited competitive advantage offered by a well-recognized and long-standing brand, as well as reluctance of financial investors to acquire incumbent reinsurers due to concerns about their reserve adequacy. For these reasons, emergence of start-ups can be expected to continue in the foreseeable future.
The credit analysis of start-up reinsurers presents additional challenges as they lack a track record of risk selection, loss reserving and profitability; in addition, their market presence and pricing power is typically very limited at the outset and the extent to which they will improve in the future cannot be accurately ascertained.
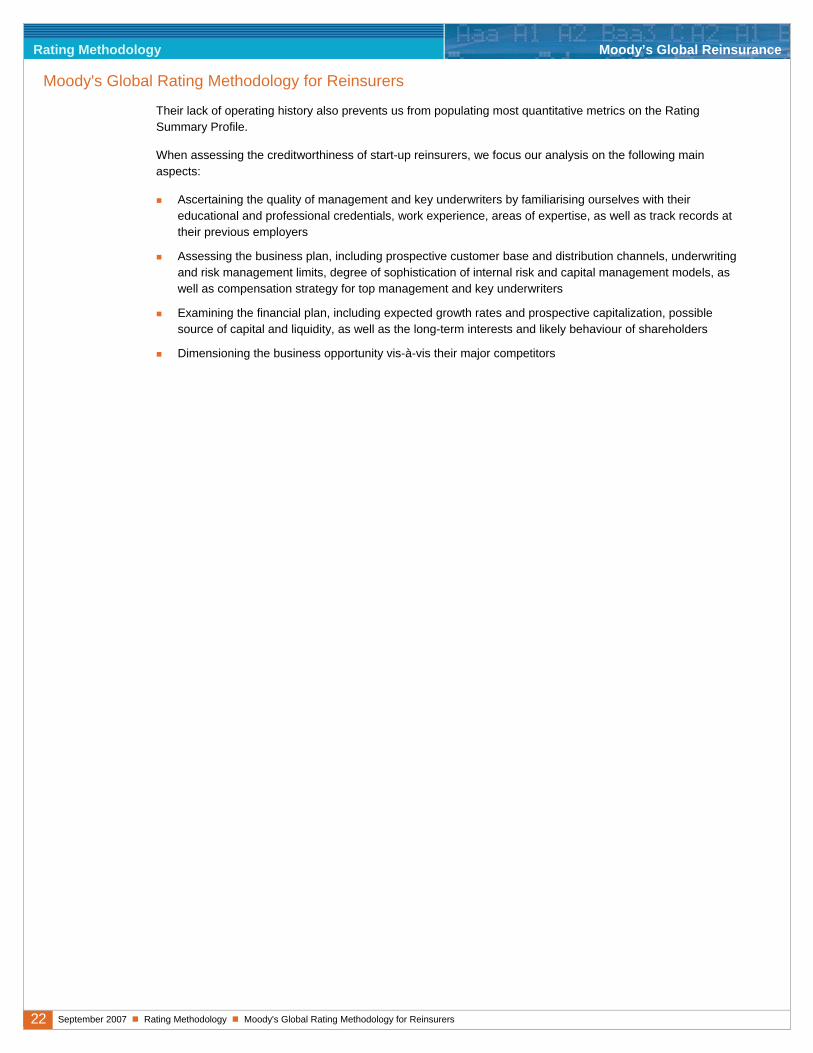
22 September 2007 Rating Methodology Moody's Global Rating Methodology for Reinsurers
Rating Methodology Moody’s Global Reinsurance
Moody's Global Rating Methodology for Reinsurers
Their lack of operating history also prevents us from populating most quantitative metrics on the Rating Summary Profile.
When assessing the creditworthiness of start-up reinsurers, we focus our analysis on the following main aspects:
Ascertaining the quality of management and key underwriters by familiarising ourselves with their educational and professional credentials, work experience, areas of expertise, as well as track records at their previous employers
Assessing the business plan, including prospective customer base and distribution channels, underwriting and risk management limits, degree of sophistication of internal risk and capital management models, as well as compensation strategy for top management and key underwriters
Examining the financial plan, including expected growth rates and prospective capitalization, possible source of capital and liquidity, as well as the long-term interests and likely behaviour of shareholders
Dimensioning the business opportunity vis-à-vis their major competitors
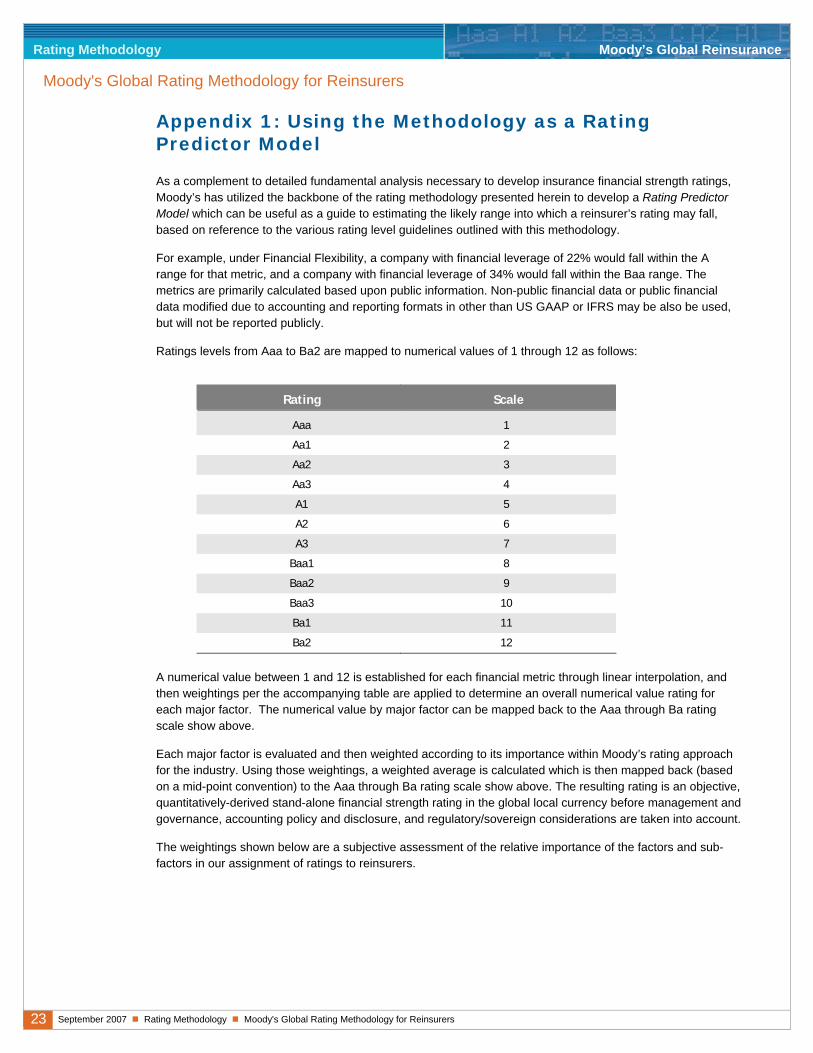
23 September 2007 Rating Methodology Moody's Global Rating Methodology for Reinsurers
Rating Methodology Moody’s Global Reinsurance
Moody's Global Rating Methodology for Reinsurers
Appendix 1: Using the Methodology as a Rating Predictor Model
As a complement to detailed fundamental analysis necessary to develop insurance financial strength ratings, Moody’s has utilized the backbone of the rating methodology presented herein to develop a Rating Predictor Model which can be useful as a guide to estimating the likely range into which a reinsurer’s rating may fall, based on reference to the various rating level guidelines outlined with this methodology.
For example, under Financial Flexibility, a company with financial leverage of 22% would fall within the A range for that metric, and a company with financial leverage of 34% would fall within the Baa range. The metrics are primarily calculated based upon public information. Non-public financial data or public financial data modified due to accounting and reporting formats in other than US GAAP or IFRS may be also be used, but will not be reported publicly.
Ratings levels from Aaa to Ba2 are mapped to numerical values of 1 through 12 as follows:
Rating Scale
Aaa 1
Aa1 2
Aa2 3
Aa3 4
A1 5
A2 6
A3 7
Baa1 8
Baa2 9
Baa3 10
Ba1 11
Ba2 12
A numerical value between 1 and 12 is established for each financial metric through linear interpolation, and then weightings per the accompanying table are applied to determine an overall numerical value rating for each major factor. The numerical value by major factor can be mapped back to the Aaa through Ba rating scale show above.
Each major factor is evaluated and then weighted according to its importance within Moody’s rating approach for the industry. Using those weightings, a weighted average is calculated which is then mapped back (based on a mid-point convention) to the Aaa through Ba rating scale show above. The resulting rating is an objective, quantitatively-derived stand-alone financial strength rating in the global local currency before management and governance, accounting policy and disclosure, and regulatory/sovereign considerations are taken into account.
The weightings shown below are a subjective assessment of the relative importance of the factors and sub-factors in our assignment of ratings to reinsurers.
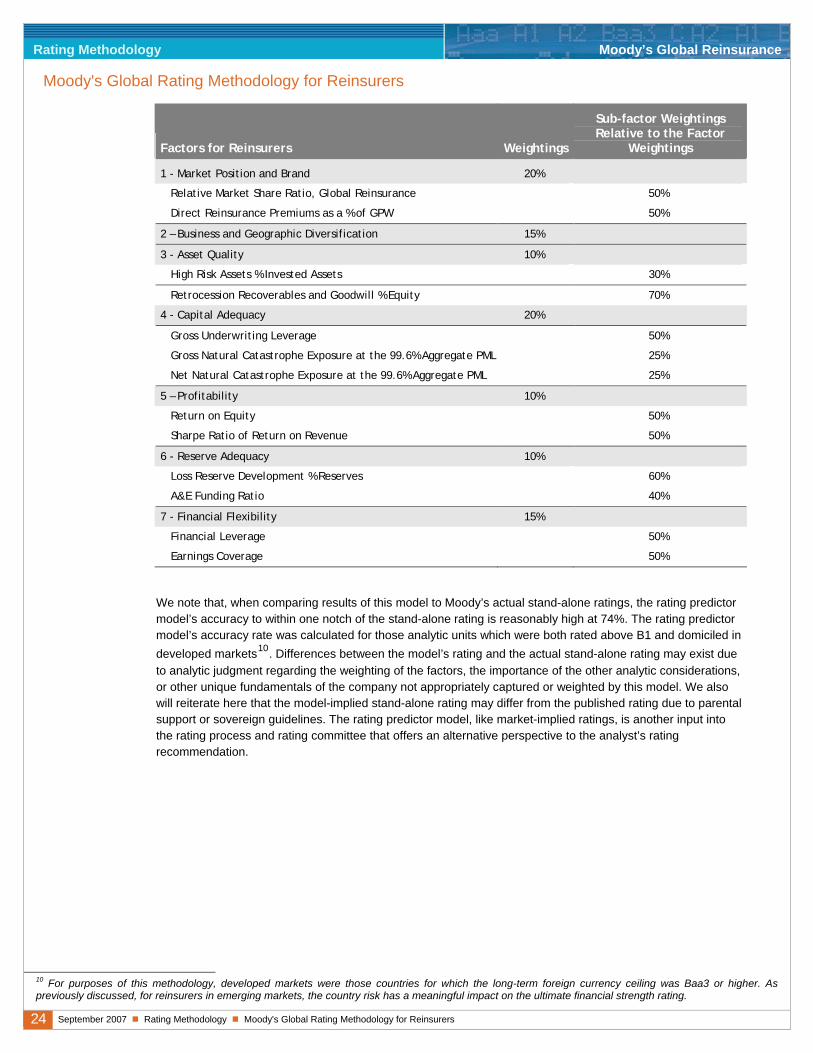
24 September 2007 Rating Methodology Moody's Global Rating Methodology for Reinsurers
Rating Methodology Moody’s Global Reinsurance
Moody's Global Rating Methodology for Reinsurers
Factors for Reinsurers Weightings
Sub-factor Weightings Relative to the Factor
Weightings
1 - Market Position and Brand 20%
Relative Market Share Ratio, Global Reinsurance 50%
Direct Reinsurance Premiums as a % of GPW 50%
2 – Business and Geographic Diversification 15%
3 - Asset Quality 10%
High Risk Assets % Invested Assets 30%
Retrocession Recoverables and Goodwill % Equity 70%
4 - Capital Adequacy 20%
Gross Underwriting Leverage 50%
Gross Natural Catastrophe Exposure at the 99.6% Aggregate PML 25%
Net Natural Catastrophe Exposure at the 99.6% Aggregate PML 25%
5 – Profitability 10%
Return on Equity 50%
Sharpe Ratio of Return on Revenue 50%
6 - Reserve Adequacy 10%
Loss Reserve Development % Reserves 60%
A&E Funding Ratio 40%
7 - Financial Flexibility 15%
Financial Leverage 50%
Earnings Coverage 50%
We note that, when comparing results of this model to Moody’s actual stand-alone ratings, the rating predictor model’s accuracy to within one notch of the stand-alone rating is reasonably high at 74%. The rating predictor model’s accuracy rate was calculated for those analytic units which were both rated above B1 and domiciled in developed markets10. Differences between the model’s rating and the actual stand-alone rating may exist due to analytic judgment regarding the weighting of the factors, the importance of the other analytic considerations, or other unique fundamentals of the company not appropriately captured or weighted by this model. We also will reiterate here that the model-implied stand-alone rating may differ from the published rating due to parental support or sovereign guidelines. The rating predictor model, like market-implied ratings, is another input into the rating process and rating committee that offers an alternative perspective to the analyst’s rating recommendation.
10 For purposes of this methodology, developed markets were those countries for which the long-term foreign currency ceiling was Baa3 or higher. As previously discussed, for reinsurers in emerging markets, the country risk has a meaningful impact on the ultimate financial strength rating.
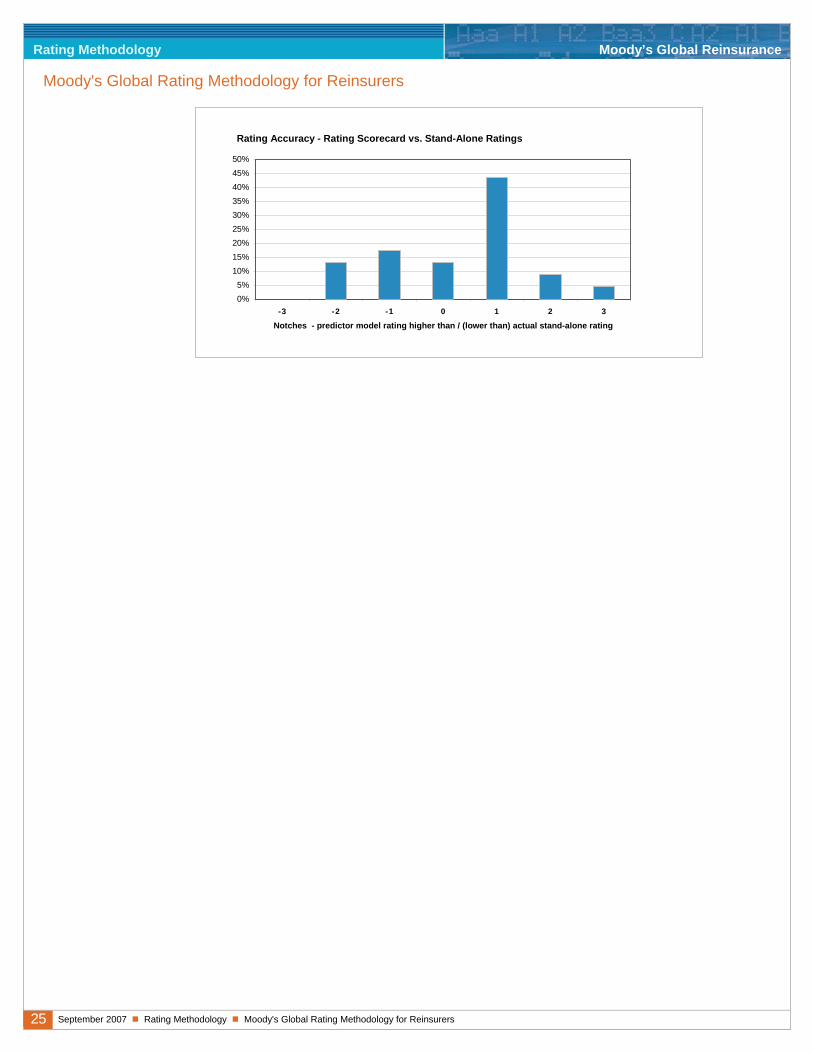
25 September 2007 Rating Methodology Moody's Global Rating Methodology for Reinsurers
Rating Methodology Moody’s Global Reinsurance
Moody's Global Rating Methodology for Reinsurers
Rating Accuracy - Rating Scorecard vs. Stand-Alone Ratings
0%5%
10%15%20%25%30%35%40%45%50%
-3 -2 -1 0 1 2 3
Notches - predictor model rating higher than / (lower than) actual stand-alone rating
26 September 2007 Rating Methodology Moody's Global Rating Methodology for Reinsurers
Rating Methodology Moody’s Global Reinsurance
Moody's Global Rating Methodology for Reinsurers
Appendix 2: Analysing Life Reinsurers
In order to apply the global methodology to life reinsurers, some additional guidance is necessary. To accommodate the unique characteristics of life reinsurers, we will collect additional information and consider only those ratios that are relevant.
Specifically, we may make the following adjustments for life only reinsurers:
1. In interpreting product diversification related to Factor 2, we will consider the split between mortality, morbidity and asset-based products.
2. When viewing retrocession recoverables related to Factor 3, we will consider the counterparty risk and the terms of the retrocession agreement, including where the assets are held and if there is actual credit exposure to the retrocessionaire.
3. For capital adequacy, we will look at the impact of 1.5 deaths / thousand as a proxy for mortality catastrophe exposure (which will be used instead of natural catastrophe exposure) at the 99.6% PML (1-in-250 year event). In addition, for capital adequacy, instead of gross underwriting leverage, we will focus on regional regulatory risk-based capital measures, or the metric of equity-to-total assets (used in our Global Rating Methodology for Life Insurers), if no other measure is available.
4. Reserve adequacy (Factor 6) will not be calculated as it is generally not a relevant analytic issue for life only reinsurers (unless the life reinsurer has substantial disability or health business).
27 September 2007 Rating Methodology Moody's Global Rating Methodology for Reinsurers
Rating Methodology Moody’s Global Reinsurance
Moody's Global Rating Methodology for Reinsurers
© Copyright 2007, Moody’s Investors Service, Inc. and/or its licensors and affiliates including Moody’s Assurance Company, Inc. (together, “MOODY’S”). All rights reserved. ALL INFORMATION CONTAINED HEREIN IS PROTECTED BY COPYRIGHT LAW AND NONE OF SUCH INFORMATION MAY BE COPIED OR OTHERWISE REPRODUCED, REPACKAGED, FURTHER TRANSMITTED, TRANSFERRED, DISSEMINATED, REDISTRIBUTED OR RESOLD, OR STORED FOR SUBSEQUENT USE FOR ANY SUCH PURPOSE, IN WHOLE OR IN PART, IN ANY FORM OR MANNER OR BY ANY MEANS WHATSOEVER, BY ANY PERSON WITHOUT MOODY’S PRIOR WRITTEN CONSENT. All information contained herein is obtained by MOODY’S from sources believed by it to be accurate and reliable. Because of the possibility of human or mechanical error as well as other factors, however, such information is provided “as is” without warranty of any kind and MOODY’S, in particular, makes no representation or warranty, express or implied, as to the accuracy, timeliness, completeness, merchantability or fitness for any particular purpose of any such information. Under no circumstances shall MOODY’S have any liability to any person or entity for (a) any loss or damage in whole or in part caused by, resulting from, or relating to, any error (negligent or otherwise) or other circumstance or contingency within or outside the control of MOODY’S or any of its directors, officers, employees or agents in connection with the procurement, collection, compilation, analysis, interpretation, communication, publication or delivery of any such information, or (b) any direct, indirect, special, consequential, compensatory or incidental damages whatsoever (including without limitation, lost profits), even if MOODY’S is advised in advance of the possibility of such damages, resulting from the use of or inability to use, any such information. The credit ratings and financial reporting analysis observations, if any, constituting part of the information contained herein are, and must be construed solely as, statements of opinion and not statements of fact or recommendations to purchase, sell or hold any securities. NO WARRANTY, EXPRESS OR IMPLIED, AS TO THE ACCURACY, TIMELINESS, COMPLETENESS, MERCHANTABILITY OR FITNESS FOR ANY PARTICULAR PURPOSE OF ANY SUCH RATING OR OTHER OPINION OR INFORMATION IS GIVEN OR MADE BY MOODY’S IN ANY FORM OR MANNER WHATSOEVER. Each rating or other opinion must be weighed solely as one factor in any investment decision made by or on behalf of any user of the information contained herein, and each such user must accordingly make its own study and evaluation of each security and of each issuer and guarantor of, and each provider of credit support for, each security that it may consider purchasing, holding or selling.
MOODY’S hereby discloses that most issuers of debt securities (including corporate and municipal bonds, debentures, notes and commercial paper) and preferred stock rated by MOODY’S have, prior to assignment of any rating, agreed to pay to MOODY’S for appraisal and rating services rendered by it fees ranging from $1,500 to approximately $2,400,000. Moody’s Corporation (MCO) and its wholly-owned credit rating agency subsidiary, Moody’s Investors Service (MIS), also maintain policies and procedures to address the independence of MIS’s ratings and rating processes. Information regarding certain affiliations that may exist between directors of MCO and rated entities, and between entities who hold ratings from MIS and have also publicly reported to the SEC an ownership interest in MCO of more than 5%, is posted annually on Moody’s website at www.moodys.com under the heading “Shareholder Relations — Corporate Governance — Director and Shareholder Affiliation Policy.”
To order reprints of this report (100 copies minimum), please call 1.212.553.1658. Report Number: 104453
Author(s) Production Associates Timour Boudkeev Jeffrey Berg
Cassina Brooks William L. Thompson
Special Comment
New YorkPano Karambelas 1.212.553.1653Sarah HiblerRobert Riegel
Contact Phone
January 2007
Current Trends in Insurance Catastrophe Risk Management
Summary Opinion
Catastrophe risk management has received much attention in the property and casualty (P&C) insurance industryfollowing the 2005 hurricane season. Following the storms, company directors and their appointed risk committeeshave become more active in risk management oversight. Consequently, insurers and reinsurers have shed exposures,increased prices and/or pursued more conservative reinsurance (or alternative risk transfer) protection. In the springof 2006, the major cat modeling firms revised their models to incorporate greater conservatism, particularly regardingsevere events.
All of these forces acting in concert have created a demand/supply imbalance - and this is in spite of significantamounts of new capacity that has entered the industry looking for outsized returns. With a benign 2006 storm season,the mild activity bodes well for investors in catastrophe-focused carriers and alternative risk transfer vehicles. Moody'sbelieves that reduced activity could also signal softening market conditions for peak catastrophe zones some time in2007.
The key findings of our 2006 US catastrophe survey are as follows:• Companies are paying greater attention to managing difficult-to-model risk factors by monitoring zonal
aggregations, exiting certain lines of business, or adhering to more conservative contract terms andconditions.
• Companies are more often than not turning on the switches for demand surge, storm surge, and firefollowing.
• Issuers reported a near universal use of models to manage portfolio accumulations, though tie-ins ofportfolio management to “front-end” applications (e.g., pricing), were less common and varied considerablyin sophistication.
• Issuers are more aware of capturing accurate exposure data, particularly commercial lines, beyond preciselocation coding (e.g. replacement cost information), although this remains an area for further improvement,particularly as demographic and real estate trends increase exposures in high-risk zones.
Catastrophe risk remains a major driver in Moody’s rating analysis, albeit one of many factors discussed in ourrecently released rating methodology1. In order to understand a company’s catastrophe risk, Moody’s utilizes acombination of approaches including Moody’s Risk Adjusted Capital (MRAC)2 and a comprehensive survey sent toour rated issuers.
The catastrophe module continues to look at risk in the tail of the distribution as opposed to a pegged returnperiod. However, based upon discussions with the modeling firms and industry participants, Moody’s has updated theindustry loss exceedance curves in MRAC’s catastrophe module to include revised frequency and severity assumptions.
Moody’s believes that the majority of our P&C insurer ratings will remain stable over the next year as (re)insurersa) continue to re-evaluate their risk appetite and shed business where catastrophe exposures are outsized; b) purchasehigher levels of reinsurance protection where available; and c) utilize alternative risk-transfer mechanisms (e.g.sidecars, catastrophe bonds).
1. Moody’s Global Rating Methodology for Property & Casualty Insurers, September 20062. Used for primary P&C insurers including a module that utilizes publicly available data to evaluate catastrophe risk. For details, please see the appendix of this report
or Moody’s August 2006 Special Comment, Moody’s Incorporates Market Feedback into Revised Capital Model for US Non-Life Insurers and Moody’s August 2006 Rating Methodology, Moody’s Risk Adjusted Capital Model for US P&C Insurers.
Pricing, Terms, and Risk Management Strengthened In 2006
A Tale of Two Reinsurance Markets: Peak Zones vs. Everything Else The current catastrophe reinsurance market reflects a sharp divide between loss-affected classes of business (e.g., catexcess of loss) in peak US wind-zones (steep price increases, scarce capacity, stricter terms and conditions) and allremaining classes of business.
After the July 2006 renewal season, some reinsurers announced that they were shifting capacity from catastrophe-exposed homeowners quota share business to higher-layer catastrophe excess of loss (including retrocessional)business. They decided to do this in order to take advantage of favorable market conditions in the excess of lossmarket.
Given the benign catastrophe experience in 2006, reinsurers writing property catastrophe have benefitedsignificantly from the current peak-zone pricing environment. Moody's expects that these carriers will continue toadhere to the constraints of their catastrophe risk management programs, many of which were recently revised toreflect reduced gross and net exposure levels following 2005 storm losses.
Generally speaking, the catastrophe reinsurance market outside of loss-affected zones continues to experiencecompetition (both on price and contract terms). Reinsurers have thus far actively sought diversification by writing innon-peak, less capital-intensive classes of business. Renewal pricing in January 2007 for U.S. peak-zone business isfirmer compared to prior-year levels but has not exceeded the peak achieved during the June 2006 renewal season.
Growth in Alternative Risk-Transfer MechanismsMany catastrophe retrocessional programs suffered full limit losses from the storms of 2005, causing retrocessionairesto completely exit the market, reduce their writings, or become more selective, avoiding US and global programs infavor of non-US risks. The resulting shortfall in capacity for US high-risk zones has raised the demand for alternativemarket structures to absorb such risks.
In some cases, the terms and pricing of alternative structures have become competitive with traditionalretrocessional programs. At the same time, hedge funds and private equity firms have become increasingly interestedin assuming (re)insurance risks, which are generally uncorrelated with traditional investment risks. The pricing parityand the investor appetite have spurred significant growth in the formation of sidecars3, the issuance of catastrophebonds, and the trading of industry loss warranties. Moody's regards hedge funds and private equity firms asopportunistic players in the (re)insurance space, ready to pull back or shift direction quickly as market conditionsdictate.
U.S. Primary Insurers: Personal vs. Commercial Lines Writers Price increases and stricter terms and conditions are expected to continue to prevail over the medium term on primaryproperty catastrophe-exposed lines of business. Nevertheless, it is important to distinguish between the dynamicsaffecting personal lines versus commercial lines carriers.
The personal lines market is subject to substantial state regulatory oversight, which may affect the extent to whichapplications for rate increases are granted, or the ability to quickly shed policyholders (without repercussions) in peakzones.
In contrast, commercial lines carriers have historically been far less sensitive to regulatory scrutiny than personallines companies, and they have had the additional option to offer coverage (including rates and policy forms) throughthe still less regulated excess and surplus (E&S) lines market. The additional flexibility is particularly valuable in a hardmarket as insurers attempt to achieve targeted pricing and/or terms and conditions. Finally, rates on casualty businesshave continued to exhibit softening and have not been affected by post-Katrina increases in property rates.
Investors Came to the Rescue, Again; But The Current Paradigm is Not Guaranteed Investors frequently have rescued (re)insurers or helped to form new companies immediately following largecatastrophes on the presumption that post-event, contractions in capacity as well as heightened perceptions of risk, canpotentially drive substantial surges in pricing, precipitating favorable investment returns.
This investment paradigm has to date been surprisingly resilient, playing an important role in stabilizing theindustry in times of stress and dislocation, notably in the aftermaths of Hurricane Andrew (1992), the 9/11 attacks
3. See Moody’s April 2006 Special Comment: Reinsurance Side-Cars: Going Along for the Ride
2 Moody’s Special Comment
(2001), and the 2005 Hurricanes. Following the 2005 storms through June 30, 2006, $27 billion in new capital enteredthe reinsurance industry largely through existing and start-up reinsurers and, to a lesser degree, through sidecars andcatastrophe bonds. In general, however, there is no specific reason to believe that investors will continue torecapitalize companies after large losses, particularly if they reach the conclusion that a couple of years of hard marketreturns do not compensate for the eventual “blow-up” risk.
Moody’s does view post-event capital raises (particularly those with equity characteristics) as positivedevelopments in addressing concerns relating to an issuer’s financial condition. However, our ratings also incorporateexpectations regarding the quality of an issuer’s underwriting and catastrophe risk management processes, as well as itsappetite for catastrophe risk relative to capital levels. As a consequence, an issuer with outsized catastrophe losses maynot be able to maintain its current ratings levels, even assuming an equity raise that completely offsets catastrophelosses.
2005 Storms Force Review of Risk Mangement Processes
The 2005 storm losses (particularly Hurricane Katrina) served to highlight the distinction between a firm’s actualcatastrophe exposure and modeled results. Although this distinction was or should have been understood beforeKatrina, the increasing sophistication of catastrophe models, when combined with the relatively benign naturalcatastrophe experience over the decade preceding the spike in activity in 2004 and 2005, may have precipitated anuncritical reliance on these tools for certain carriers.
Katrina’s larger than expected commercial property losses (partially flood-driven), significant time-element losses,outsized impact from storm surge and demand surge, as well as the risk of that contractual coverage exclusions thatcould be reversed either by regulation and/or judicial/legislative action, have now focused attention on identifying andmitigating factors contributing significant levels of error and uncertainty. Risk management teams have renewedefforts to assess difficult-to-model and non-modeled risks, the quality of data, and the potential for “hidden”correlations between business lines (e.g., catastrophe clash).
Potential For Further Adverse Development Remains
Estimation of losses from the 2005 storms has proved to be quite challenging, even well after the occurrences of theevents. Moody's notes that a number of firms (reinsurers, in particular) have recorded significant upward revisions intheir estimates during 2006. Moody's believes that estimate uncertainty is heightened, given the record claims volumefrom three major storms, the high levels of demand surge, and the coverage disputes arising from flood and timeelement claims.
The possibility exists that future judicial or regulatory decisions may mandate coverage for losses caused by perilspreviously believed by insurers to be contractually excluded (e.g., residential flood). On the commercial lines side,Moody’s believes that additional adverse development could occur, particularly in offshore energy and marine risks,exposing both primary carriers and their reinsurers. Moody’s notes that the significant impact of storm losses has, insome cases, exhausted limits on reinsurance (particularly retrocessional) contracts, thus leaving the net loss positions ofsome cedants potentially exposed should losses develop further.
2006 Vendor Catastrophe Models Increase Expected Loss
Several third-party catastrophe modeling firms have released updated versions of their models, whereby the revisions,(depending upon model options selected) are likely to significantly increase expected losses for (re)insurers.Companies have reviewed the impact of these changes on their individual portfolios and have utilized the informationto manage gross and net catastrophe risk.
The specifics of each vendor model update vary, but the revisions have generally incorporated adjustments to bothseverity and frequency drivers. Severity driver changes include updated databases of building/construction/structurevulnerability functions, as well enhancements to storm and demand surge modules. On the frequency side, modelsnow offer several databases, such as forward-looking views incorporating increased mean frequency assumptions(based on recent climate research), in addition to existing databases based on historical occurrences.
Moody’s Special Comment 3
Results of Moody’s 2006 Catastrophe Survey
During the first half of 2006, Moody’s requested that its rated P&C issuers respond to a comprehensive survey focusedon catastrophe risk management. Survey respondents represented a diverse group of (re)insurers, comprising over70% of industry direct premiums (all lines combined).
The survey consisted of a detailed questionnaire covering qualitative aspects of catastrophe risk managementpractices. There were also requests for quantitative data, including loss exceedance probability (EP) profiles andsummaries of aggregate exposure data by peril and geographic zone. Although the results of our survey (and relateddiscussions with issuers) do not reflect the catastrophe model revisions, we plan to resurvey respondents for updatedProbable Maximum Loss (PML) information in 2007.
Qualitative Factors Assessed in Survey The qualitative portion of the survey asked issuers to respond to a series of questions, including management ofexposure accumulations, uses of models, and data quality issues.
• Aggregation Methodology: Survey respondents reported a wide range of challenges regarding themanagement of catastrophe risk aggregations for difficult-to-model perils or lines of business. For commercial lines carriers, the most commonly cited problem areas were terrorism (impactingworkers compensation and property lines), earthquake (affecting workers compensation), flood/water loss,and marine and aviation. Reinsurers also cited terrorism and marine/aviation and, in addition,retrocessional catastrophe excess, winter freeze/winter storms, wild fire/brush fire, tornado/hail, non-USzones, and property per risk. Companies detailed a variety of approaches to managing terrorism exposure with the main themeinvolving the monitoring of zonal aggregations using scenario testing to set limits on maximum foreseeableloss (MFL) by zone and/or across all zones.
• Model Usage: Companies are almost universally applying models to manage accumulations of exposure intheir portfolios and to structure reinsurance programs. Most companies also reported “front-end” applications of models (e.g., to underwriting and pricingdecisions) though specific methodology and sophistication vary considerably. For example, personal linescarriers use the models to calculate the average annual loss (AAL) arising from hurricanes as part of aratemaking process or to determine the long-term cost of reinsurance. Less commonly, companies (particularly those with large domestic property catastrophe exposure),combine pricing and portfolio management to inform both risk-return and portfolio-optimizationdecisions. Moody’s views firms that combine a “front-end” use of models with portfolio management ashaving stronger catastrophe risk management than firms relying on models solely to manageaccumulations.
• Data Quality: Based on our survey, insurers’ approaches to data quality issues vary considerably. Theindustry has made strides in identifying (and in some cases capturing) the level of precision necessary todescribe various risk characteristics in order to improve model results (e.g., location coding). Nevertheless,comprehensive approaches to assurance of data accuracy are not widespread, currently. Data qualityrepresents the single largest opportunity for users to improve model output. A study4 by AIR “revealedsignificant problems with completeness and quality of exposure data, particularly in the case of commercialproperties” and noted that replacement cost coding in models will likely significantly underestimate actualreplacement costs. Given current demographic and real estate trends5, assurance of accurate data is acrucial part of the modeling process.
4. Refer to Underwriting Catastrophe Risk: Post Hurricane Katrina, Journal of Reinsurance (Spring 2006). See also AIR Worldwide Analysis: Exposure Data Quality (November 2005).
5. Refer to Insurance Services Office (ISO) April 25, 2006 Press Release entitled: Catastrophe Losses Will Double About Every 10 Years, Says Leading Catastro-phe Modeling Expert at PCS Conference.
4 Moody’s Special Comment
Monitoring Future Developments
Moody’s is monitoring the following situations as they develop:• The ongoing debate among climatologists about whether recently observed increases in Atlantic hurricane
frequency and severity represent a true departure from historical patterns reflecting changes in globalclimate.
• The possible involvement of the Federal Government in providing a national catastrophe pool. Given thelack of specific implementation details, it is difficult to assess the impact of a government catastrophebackstop on the credit profile of the industry. Broadly speaking, however, and depending on the coveredperils, affected lines of business, and the attachment point of the backstop, the impact is likely to differsignificantly between primary carriers and reinsurers (and retrocessionaires). In the former instance, abackstop is likely to add stability to the primary market by providing a highly rated stand-by reinsurancemarket for tail risks. The effect on reinsurers is less clear, depending on the size of the overlap betweenreinsurance markets and government participation. The positive impact of reduced exposure andadditional capacity would need to be weighed against the potential crowding out of the private market.
• The impact of the January 2007 special legislative session in the State of Florida on the Property andCasualty insurance and reinsurance market in Florida.
• Improvements in the quality and quantity of public disclosure regarding catastrophe risk.
Moody’s Special Comment 5
6 Moody’s Special Comment
Appendix – How Moody's Evaluates Property Catastrophe Risk of US Insurers
The catastrophe risk profile of individual P&C companies can vary widely, depending on differences in risk-appetite,line of business focus, financial flexibility and capital adequacy, modeling sophistication/rigor, reliance on reinsurance(or other risk transfer mechanisms) and regulation.
Moody’s analytical framework for assessing catastrophe risk incorporates a variety of qualitative and quantitativefactors, which are synthesized to form an overall assessment. The principal components of this framework for NorthAmerican P&C companies include (1) Moody’s Annual Catastrophe Risk Survey, (2) Moody’s Risk Adjusted CapitalModel (MRAC), and (3) Moody’s Probability of Default and Expected Loss Modeling.
For primary carriers, Moody’s will consider the ratings impact (if any) of losses from natural catastrophes based ontheir impact on the company’s MRAC score. For reinsurers, catastrophe exposure and losses relative to capital will beassessed based on a probabilistic analysis of the company’s catastrophe exposed reinsurance portfolio.
In a severe event or series of events, Moody’s would expect that its higher rated companies would have losses(relative to capital and earnings) at levels significantly below those of companies rated in the A/Baa range (insurancefinancial strength). In general, net losses for companies rated in the single A range would not be expected to exceed10% of capital, depending upon business profile.
MOODY’S CATASTROPHE RISK SURVEYDuring the first half of 2006, Moody’s requested that its rated issuers respond to a comprehensive survey focused oncatastrophe risk management. The survey consists of a detailed questionnaire covering qualitative aspects ofcatastrophe risk management practices as well as requests for quantitative data, including loss exceedance probability(EP) profiles and summaries of aggregate exposure data by peril and geographic zone.
Although Moody’s analysis has long encompassed cat risk, the formal survey allows respondents to providedetailed catastrophe risk management information based on a uniform data request, facilitating greater consistency incomparing insuers’ exposures. Further, Moody’s will compare information obtained in the survey (e.g., EP data) withthe assumptions in the MRAC model (discussed later in this piece), particularly in cases where these assumptions differsignificantly from survey data.
Qualitative Factors Assessed in Survey The qualitative portion of the survey asks issuers to respond to a series of questions relating to (1) Risk AggregationManagement, (2) Model Usage, (3) Input Data, (4) Terrorism Exposure, and (5) Catastrophe Reinsurance Protection.Moody’s is particularly interested in how catastrophe risk management fits into a firm’s overall enterprise riskmanagement, including risk committees (top down/bottom up approaches).
1. Risk Aggregation Management – As shown in Hurricane Katrina, many P&C lines of business are subject to a variety of catastrophe perils.6 A real potential exists for outsized “clash” losses due to unexpected correlations between diverse, difficult-to-model business lines. As a result, Moody’s has asked issuers to detail their approach to managing catastrophe accumulations. For business classes or coverages that do not permit description using EP curves, respondents are asked to detail the risk mitigation techniques used to manage these exposures.
2. Model Usage – Moody’s has asked respondents to describe the top five uses of catastrophe models. Models are well suited to support underwriting, pricing/ratemaking, capital allocation, scenario testing, and risk financing decisions. Survey respondents are also asked to describe the manner in which results from multiple vendor models are used.7 Access to multiple model perspectives is valuable given the potential for differences in vendor models, presuming that firms take advantage of the differences responsibly and conservatively. Moody’s also expects that model results include the impact of severity drivers, such as secondary uncertainty, fire-following earthquake, demand surge and storm surge. If certain switches are “turned off” in the models, respondents have the opportunity to describe reasons for doing so.
3. Input Data – Data quality issues represent the single largest opportunity for users to improve the efficacy of modeled results. Survey respondents are asked to summarize, by line of catastrophe-exposed business, the types of exposure data required to perform model analyses8, and to describe any data quality procedures in place.
6. They include homeowners, auto physical damage, commercial multi-peril, fire and allied lines, boiler & machinery, earthquake, business interruption, general liability and workers’ compensation, marine and energy, U.S. and international property catastrophe, facultative and retrocessional business.
7. Often, firm access to multiple model results is provided by reinsurance intermediaries. 8. Including premium volume by level of geographic resolution (e.g., street address, zip code, etc.)
When stress testing PML and EP information received from issuers, Moody’s considers the natural uncertainty in model results as well as the potential impact of modeling error (e.g., data quality coding issues, difficult to model factors).
4. Terrorism risk –Significant progress has been made in the past several years with respect to modeling terrorism risk, but derivation of frequency assumptions will continue to remain an intractable problem. Although companies may utilize a traditional EP approach to terrorism risk, they often utilize scenario-testing and monitor zonal concentrations from an MFL perspective. Moody’s takes a cautious approach to terrorism risk, given modeling challenges and a general lack of substantive public disclosures. Since TRIA9 deductibles for many carriers can represent a significant portion of statutory capital, Moody’s Catastrophe Survey asks issuers to report their 2006 TRIA deductible and provide details of any private market reinsurance coverage (certified and non-certified) for terrorism. Moody’s compares gross terrorism exposure and net terrorism risk retention relative to a company’s surplus. In general, terrorism events that affect the insurance industry widely and result in losses of less than 10% of an insurer’s equity capital are not likely to have a ratings impact, unless they augur a change in the industry’s risk profile or result in further disruption to financial markets more broadly.
5. Reinsurance Protection – Moody’s monitors both gross and net catastrophe exposure because reinsurance/retrocessional protection may not be available or affordable. Issuers are asked to provide a summary of their overall reinsurance/retrocessional program (e.g., in the form of a “layer cake” chart), including information about “non-cat” reinsurance contracts, both proportional and non-proportional, which may actually cover losses from catastrophic events, adding insight about net catastrophe exposure. Moody’s also asks for details involved in their current catastrophe reinsurance program, including a summary of perils covered and excluded, attachment points and occurrence limits, and availability of reinstatement options (number and cost). Additionally, Moody’s considers the impact of alternative forms of catastrophe risk management and transfer; these include catastrophe bonds, industry loss warranties (ILWs), resinsurance sidecars, and contingent capital facilities. The credit quality of reinsurers continues to factor into our assessment of a reinsurance panel. Financial strength ratings have long been a concern for ceding companies reinsuring long-tail casualty lines of business. Given the failures of several reinsurers following the Australian hailstorms of 1999 and the failures and “close calls” from the events of September 11 and Hurricane Katrina, Moody’s views reinsurance recovery credit risk to also be important for short-tail property lines. Given the shortage and pricing of reinsurance capacity, the ceding companies sometimes must evaluate and balance the need to complete a reinsurance program with lower-rated/unrated carriers with retaining the net exposure.
Quantitative Factors, Including Exceedance Probability (EP) Profiles The quantitative portion of the survey asks issuers to provide aggregate loss EP profiles (ground-up10, gross and net ofreinsurance), at various return periods by requested peril. In particular, for U.S.-based catastrophe exposures,requested perils correspond to those used by the MRAC model11. For modeled perils that fall outside the scope ofMRAC, issuers are asked to provide EP information coming as output from the company’s internal models.
Moody’s also requests that companies provide their entire aggregate EP distribution over all modeled perils. Thisfacilitates a number of analyses that consider the entire tail of the EP curve, instead of simply focusing on losses atspecific return periods (e.g., 1-in-100, 1-in-250, etc). However, Moody’s is mindful that an aggregate-all-perils (AAP)EP curve may not completely capture a firm’s catastrophe exposure (given certain perils and other factors are difficultor not conducive to modeling).
For each of the aforementioned perils and zones, issuers are also asked to provide aggregate in-force exposureinformation. (for insurers: total insured value; for reinsurers: total limits on exposed contracts). This information oftenprovides insight about concentrations from a Maximum Foreseeable Loss (MFL) perspective. In particular, such anapproach is useful when comparing issuers with otherwise similar PML profiles, particularly when trying to gauge losspotential due to perils or risk characteristics not amenable to robust analysis using traditional catastrophe models.
9. The Terrorism Risk Insurance Act of 2002, extended in November 2005. For additional information, please see Moody’s December 2005 Special Comment, Terror-ism Risk Insurance Extension Act of 2005 Buys Some Time for P&C Insurers.
10. Refers to losses before the application of both policy deductibles and reinsurance. 11. See the MRAC Section in this Special Comment for the definitions of the peril-zones used.
Moody’s Special Comment 7
For example, for a given peril and zone, two companies may have similar EP profiles at various return periods, butone may be a commercial lines writer with a large book of heterogeneous commercial risks (e.g., including offshoreenergy), which are more difficult to model, while the other may be a personal lines carrier with a diversified book oftraditional homeowners’ risks. As such, each carrier may have a vastly different risk profile in an extreme event.
One helpful metric to understand is the Conditional Tail Expectation (CTE) which has long been used in the lifeinsurance industry relative to a benchmark (e.g. capital). The CTE (calculated using a firm’s PML curve) representsthe average value of losses in excess of a chosen loss level (usually remote). As a result, the CTE is often viewed as ameasure of the “thickness” of the tail of a firm’s PML curve and is a more complete characterization of tail risk thanreliance on arbitrarily chosen loss returns periods (e.g., 1-in-100, or 1-in-500) when comparing issuer PML profiles.
MOODY’S RISK ADJUSTED CAPITAL MODEL (MRAC) Moody’s P&C Risk Adjusted Capital model (MRAC) is a tool used to quantify the multiple sources of risk—includingcatastrophe risk—within U.S. primary P&C insurance groups, and to gauge the adequacy of the group’s resources forcovering those risks.
Moody’s uses MRAC results in conjunction with other analytical tools as input into the rating process. The basicdata input source is the NAIC Annual Statutory Statement; however, outside the USA, model features are adaptable toa variety of data types, as available and appropriate. The model employs Monte Carlo simulation to develop anestimated probability distribution for the aggregate performance of the group (gains or losses) over a one-year timehorizon, allowing for comparison to the group's adjusted book capital at different probability thresholds.
MRAC’s Catastrophe ModuleMRAC’s catastrophe risk module is an important component of the overall MRAC model. Within MRAC,catastrophe losses from underwriting risk are simulated separately from general underwriting risk. Moody's hasestimated industry loss exceedence curves for 7 major catastrophes — South Atlantic Wind, Gulf Wind, Mid-AtlanticWind, North Atlantic Wind, New Madrid Earthquake (1 and 2)12, California Earthquake, and Pacific NWEarthquake. We would expect that these curves could be adjusted yearly based on discussions with modeling firms andissuers.
For a given company, the model calculates exceedence curves for each of the seven catastrophes, by analyzinggross written premiums by line and by state, using a market share approach. Exceedance curves for the various U.S.hurricane zones have been adjusted to contemplate increased frequency and severity assumptions post-Katrina,including greater loadings for demand surge and storm surge. In addition, the three zonal earthquake modelscontemplate increased loadings for fire-following earthquake. (The particulars of the MRAC model including asummary of industry exceedance curve profiles by peril-zone are detailed in the MRAC Rating Methodology, August2006.)
In giving credit for outwards catastrophe reinsurance protection, MRAC makes a fixed set of assumptions anddoes not incorporate information specific to an individual issuer’s program. In particular, the model incorporates theassumption that 90% of losses from catastrophes with return periods between 25 years and 100 years are ceded, atwhich point reinsurance coverage is assumed to be exhausted. The catastrophe reinsurance retention and limitparameters are based on Moody’s general observations about the industry, along with judgment. It should also benoted that MRAC considers the average credit risk of an issuer’s reinsurers by applying a risk charge to MRAC’smodeled ceded losses.
Moody’s is aware that companies often purchase catastrophe reinsurance protection extending well beyond the100-year return period for loss occurrences. The model is run on publicly available data, but Moody’s has the abilityto utilize a company’s internal loss exceedance curves and reinsurance program to analyze the overall capital adequacyscore. However, Moody’s published MRAC scores will only include publicly available data with a description ofvarious adjustments (such as reinsurance) that may be made for a specific company.
PROBABILITY OF DEFAULT AND EXPECTED LOSS MODELMoody’s uses (annual) AAP EP curves provided by respondents to our Catastrophe Risk Survey to stochastically modelthe impact of catastrophe risk on a company’s earnings, and thereby compute estimates of the probability of defaultand expected loss to policyholders and/or bondholders over a one-year period. Individual iterations of the incomestatement are modeled by combining three separate components: (1) catastrophe losses, computed by sampling from
12. Within MRAC, the states comprising the New Madrid earthquake region are partitioned into two zones determined by a pair of concentric circles. These two zones are modeled separately, though perfect correlation is assumed. All other MRAC catastrophes are assumed to be statistically independent. For further details, please see the MRAC Rating Methodology.
8 Moody’s Special Comment
issuer-provided aggregate all-perils EP curves; (2) total returns on invested assets, also computed by random sampling;and (3) all remaining income statement items including earned premiums, acquisition and operating expenses, interestexpense, and preferred and common share dividends, each computed deterministically under various assumptions.
Taken together, a sufficiently large number of such iterations determine an empirical probability distribution ofthe company’s full year income statement and corresponding year-end capital position. In particular, the relativefrequency of iterations resulting in net losses in excess of policyholder surplus (or in the case of debt instruments,policyholder surplus less debt) are used to estimate the probability of default and expected loss for various liabilityclasses during the year.
These results (incorporating stress testing), are then compared to Moody’s idealized cumulative default rates andexpected credit losses to generate implied insurance financial strength and debt ratings.
This type of model is focused on assessing the contribution of catastrophe risk to the income statement volatility,so this approach is most useful for portfolios with a preponderant exposure to catastrophes, such as monolinecatastrophe reinsurers, and structured vehicles including catastrophe bonds and reinsurance sidecars.
Moody’s Special Comment 9
Related Research
Rating Methodology:Moody's Global Rating Methodology for Property and Casualty Insurers, September 2006 (98046)Moody's Risk Adjusted Capital Model For US Property & Casualty Insurers, August 2006 (96353)Special Comments:Moody's Incorporates Market Feedback into Revised Capital Model for US Non-Life Insurers August 2006 (97872)Reinsurance Side-Cars: Going Along for the Ride, March 2005 (96863)Terrorism Risk Insurance Extension Act of 2005 Buys Some Time for P&C Insurers, December 2005 (95940)
To access any of these reports, click on the entry above. Note that these references are current as of the date of publication of this reportand that more recent reports may be available. All research may not be available to all clients.
10 Moody’s Special Comment

PAGE INTENTIONALLY LEFT BLANK
© Copyright 2007, Moody’s Investors Service, Inc. and/or its licensors and affiliates including Moody’s Assurance Company, Inc. (together, "MOODY’S"). All rights reserved. ALLINFORMATION CONTAINED HEREIN IS PROTECTED BY COPYRIGHT LAW AND NONE OF SUCH INFORMATION MAY BE COPIED OR OTHERWISE REPRODUCED, REPACKAGED,FURTHER TRANSMITTED, TRANSFERRED, DISSEMINATED, REDISTRIBUTED OR RESOLD, OR STORED FOR SUBSEQUENT USE FOR ANY SUCH PURPOSE, IN WHOLE OR IN PART, INANY FORM OR MANNER OR BY ANY MEANS WHATSOEVER, BY ANY PERSON WITHOUT MOODY’S PRIOR WRITTEN CONSENT. All information contained herein is obtained byMOODY’S from sources believed by it to be accurate and reliable. Because of the possibility of human or mechanical error as well as other factors, however, such information is provided “asis” without warranty of any kind and MOODY’S, in particular, makes no representation or warranty, express or implied, as to the accuracy, timeliness, completeness, merchantability or fitnessfor any particular purpose of any such information. Under no circumstances shall MOODY’S have any liability to any person or entity for (a) any loss or damage in whole or in part caused by,resulting from, or relating to, any error (negligent or otherwise) or other circumstance or contingency within or outside the control of MOODY’S or any of its directors, officers, employees oragents in connection with the procurement, collection, compilation, analysis, interpretation, communication, publication or delivery of any such information, or (b) any direct, indirect,special, consequential, compensatory or incidental damages whatsoever (including without limitation, lost profits), even if MOODY’S is advised in advance of the possibility of suchdamages, resulting from the use of or inability to use, any such information. The credit ratings and financial reporting analysis observations, if any, constituting part of the informationcontained herein are, and must be construed solely as, statements of opinion and not statements of fact or recommendations to purchase, sell or hold any securities. NO WARRANTY,EXPRESS OR IMPLIED, AS TO THE ACCURACY, TIMELINESS, COMPLETENESS, MERCHANTABILITY OR FITNESS FOR ANY PARTICULAR PURPOSE OF ANY SUCH RATING OR OTHEROPINION OR INFORMATION IS GIVEN OR MADE BY MOODY’S IN ANY FORM OR MANNER WHATSOEVER. Each rating or other opinion must be weighed solely as one factor in anyinvestment decision made by or on behalf of any user of the information contained herein, and each such user must accordingly make its own study and evaluation of each security and ofeach issuer and guarantor of, and each provider of credit support for, each security that it may consider purchasing, holding or selling. MOODY’S hereby discloses that most issuers of debt securities (including corporate and municipal bonds, debentures, notes and commercial paper) and preferred stock rated byMOODY’S have, prior to assignment of any rating, agreed to pay to MOODY’S for appraisal and rating services rendered by it fees ranging from $1,500 to $2,400,000. Moody’s Corporation(MCO) and its wholly-owned credit rating agency subsidiary, Moody’s Investors Service (MIS), also maintain policies and procedures to address the independence of MIS’s ratings and ratingprocesses. Information regarding certain affiliations that may exist between directors of MCO and rated entities, and between entities who hold ratings from MIS and have also publiclyreported to the SEC an ownership interest in MCO of more than 5%, is posted annually on Moody’s website at www.moodys.com under the heading “Shareholder Relations — CorporateGovernance — Director and Shareholder Affiliation Policy.” This credit rating opinion has been prepared without taking into account any of your objectives, financial situation or needs. You should, before acting on the opinion, consider theappropriateness of the opinion having regard to your own objectives, financial situation and needs.
12 Moody’s Special Comment
To order reprints of this report (100 copies minimum), please call 1.212.553.1658.Report Number: 100833
Author Editor Production Manager
Pano Karambelas Richard Jupa William L. Thompson
Rating Methodology
New YorkThomas Barker 1.212.553.1653Jim HenleyKevin LeeBruce BallentinePaul BauerJeffrey BergPano KarambelasEnrico LeoSarah HiblerRobert RiegelTed Collins
Contact Phone
August 2006
Moody's Risk Adjusted Capital Model For US Property & Casualty Insurers
Moody's P&C Risk Adjusted Capital (MRAC) model is a tool to quantify the various sources of risk within a property &casualty (P&C) insurance group, and to gauge the adequacy of a group's resources for covering those risks. In addition,Moody's uses MRAC to enhance the dialogue with issuers by identifying sources of risk and trends in capital adequacy.Understandably, Moody's uses MRAC results as just one among many quantitative tools that inform the rating process.While we believe the model to be consistent and fair overall, like any model, it is subject to limitations in data inputs as wellas the ability of the model to fully reflect the dynamics of complex businesses such as property & casualty insurers.
Model Overview
• MRAC employs Monte Carlo simulations to develop an estimated probability distribution for the aggre-gate future performance of the group, allowing for comparison to the group's book adjusted capital at dif-ferent probability thresholds. The model output is summarized as a ratio (the MRAC ratio), which iscomputed by dividing available capital by required capital (as estimated by the model).
• MRAC is a one-year model in that it simulates (typically 60,000 iterations) one year's worth of future per-formance (gains or losses) to estimate the level of capital required (the denominator of the MRAC ratio).Certain adjustments are made to discount cash flows (e.g., for claims payments) that are expected to stretchout over a longer period. The basic data input source is the NAIC Annual Statement. Outside the USA, fea-tures of the model may be adapted to different data sets as available and appropriate.
• For purposes of the model, Moody's currently estimates a group's book adjusted capital (the numerator ofthe MRAC ratio) one year in the future by making what are effectively valuation adjustments to reportedstatutory surplus and adding one year of expected performance. The most significant of these are adjust-ments to "true-up" reserves - based on a series of standard actuarial computations - and to discount thosereserves to present value - based on claims payout patterns associated with different lines of business. Otherfairly modest adjustments are also made to investments and reinsurance balances. Finally, adjustments aremade to credit the group's surplus with expected underwriting profit/loss from a full year of business, andone year's investment income. This allows for an "apples-to-apples" comparison to estimated required cap-ital, which projects these items over the one-year period.
• To estimate required capital, MRAC simulates underlying exposures in four key areas: Investments, Rein-surance, Reserves and Underwriting. The results of these simulations are then combined, allowing for cor-relation effects, to provide an aggregate probability distribution of expected performance. In each of theseareas, simulations are run at lower levels of detail (e.g., investment-grade bonds within Investments, A-ratedreinsurers within Reinsurance, or commercial property within Reserves and Underwriting) and then aggre-gated. For less material component risks, such as Mortgage Loans, static factors are applied.
• Information from MRAC is used within Moody's rating process in a few different ways. First, MRAC pro-duces quantitative data about the discrete sources of risk within a P&C insurance group, which Moody'sanalysts can use to focus their inquiry and investigation of certain business/risk areas. Second, MRAC pro-vides information about the estimated rank ordering of creditworthiness among P&C groups based on afairly extensive and consistent examination of their different risks. Third, Moody's analysts will consider theMRAC Ratio as well as its estimates of default risk and expected loss for an insurance group when compar-ing the existing rating to other independent indicators of creditworthiness, such as option-adjusted tradingspreads or credit-default swap spreads.

Adjusted Capital (The Numerator) Required Capital (The Denominator)
+ Reported Capital Asset Risk
+ Reserve Redundancy (Deficiency) Reserve Risk
Reserve Discount Catastrophe Risk
+ Book to Market Adjustment for Bonds Reinsurance Risk
+ One Year Expected Profitability (Loss) Underwriting Risk
- Reinsurance Haircut Other Risks
= Adjusted Capital = Required Capital
Adjusted CapitalMRAC Ratio = Required Capital Including Adjustments
2 Moody’s Rating Methodology
Table of ContentsPage
Model Overview ....................................................................................................................................... 1
Calculating Book Adjusted Capital (The Numerator)................................................................................... 5Investments ...................................................................................................................................................... 5Reinsurance ..................................................................................................................................................... 5Reserves .......................................................................................................................................................... 5
Core Reserves .............................................................................................................................................. 5Asbestos and Environmental (A&E) Reserves ................................................................................................. 6
Underwriting ..................................................................................................................................................... 6Overall Book Adjusted Capital ........................................................................................................................... 6
Calculating Required Capital (The Denominator)........................................................................................ 7Investments ...................................................................................................................................................... 7
Overview ...................................................................................................................................................... 7Stocks .......................................................................................................................................................... 8Bonds ........................................................................................................................................................... 8Other Asset Classes ...................................................................................................................................... 8
Reinsurance Exposure ...................................................................................................................................... 9Overview ...................................................................................................................................................... 9The Basic Charge on Reported Reinsurance Assets ....................................................................................... 9
Correlation Adjustment ............................................................................................................................. 9Contingent Reinsurance Assets - Core Reserve and A&E Reserve Development .......................................... 10
Contingent Exposure to Ceded Reserve Development - Core Reserves .................................................... 10Contingent Exposure to Ceded Reserve Development - A&E Reserves ..................................................... 10
Contingent Reinsurance Assets - Underwriting Performance and Catastrophes ........................................... 10Reserve Risk ................................................................................................................................................... 11
Overview .................................................................................................................................................... 11Step 1A. Developing Distribution Parameters - Mean Estimate of Reserve Development ......................... 11Step 1B. Developing Distribution Parameters - Estimated Standard Deviation of Reserve Development ... 12
Simulating Core Reserve Development......................................................................................................... 12Reserve Risk (Asbestos and Environmental) ................................................................................................ 13
Underwriting Risk ........................................................................................................................................... 13Catastrophe Losses ........................................................................................................................................ 14Operating Risk ................................................................................................................................................ 15Overall Required Capital .................................................................................................................................. 15
Interpreting MRAC Results ..................................................................................................................... 16Quantifying Sources of Risk ............................................................................................................................ 16Rank Ordering Financial Strength of Insurers Based on MRAC Ratio ................................................................ 18The MRAC Ratio .............................................................................................................................................. 18Scaling the MRAC Ratio for Liability Duration .................................................................................................. 19Relating MRAC Results to Moody's Insurance Financial Strength Ratings ........................................................ 20Ratio Mapping ................................................................................................................................................ 20Expected Default Probability ........................................................................................................................... 20Expected Policyholder Loss ............................................................................................................................. 20
Moody’s Rating Methodology 3
Table of ContentsPage
4 Moody’s Rating Methodology
Related Research .................................................................................................................................. 22
Appendix I - Parameters for Asset Distributions within Investment Risk ................................................. 23
Appendix II - Example of Core Reserve Risk Calculation ......................................................................... 24
Chain Link Method to Calculate Expected Ultimate Loss ......................................................................... 24
Implied Development Factors ................................................................................................................. 25Application of Development Factors ................................................................................................................ 25Loss Ratio Trending/Bornhuetter-Ferguson (BF) Method for Recent Accident Years ......................................... 26Reconciling the BF Method Estimate to the Chain Link Method ....................................................................... 26Method to Calculate Standard Deviation of Ultimate Loss ................................................................................ 27Credibility of Data ........................................................................................................................................... 29Discounting of Ultimate Losses ....................................................................................................................... 29Aggregating Reserve Risk Across All Business Lines ....................................................................................... 29Simulating Reserve Losses ............................................................................................................................. 31
Appendix III - Changes in Premium and Loss Cost Trends by Business Line ........................................... 32
Appendix IV - Industry Loss Ratios and Standard Deviation .................................................................... 32
Appendix V - Correlations by Business Line ........................................................................................... 33
Appendix VI - Industry Gross Exceedence Curves by Catastrophe ........................................................... 34
Appendix VII - Duration of Liabilities by Line of Business ........................................................................ 34
Appendix VIII - Discount Factors by Line of Business and Accident Years ............................................... 35
Calculating Book Adjusted Capital (The Numerator)
Within the model, several adjustments are made to reported surplus to yield an amount more reflective of the com-pany's true, or book adjusted, capital one year in the future. The most significant of these include: 1) marking theinvestment portfolio to "market" and calculating one year's worth of investment income; 2) assessing collectibility ofreinsurance recoverables; 3) "true-up" of reserves - based on a series of standard actuarial computations, discounted topresent value based on claims payout patterns associated with different lines of business; and 4) calculating underwrit-ing profit/loss from a full year of business. All of these adjustments are appropriately tax-effected and discussed in thefollowing sections.
INVESTMENTSA U.S. insurer's statutory surplus generally reflects investments in bonds at book value rather than market value. Thebond value adjustment is computed as the difference between the statement value and market value of the company'sbonds. This difference is added back, or subtracted from, reported surplus, as appropriate.
A second adjustment is made to calculate the one year expected return on invested assets, which is also added tobook capital. The model first allocates the company's assets to its various asset classes, and then applies expectedinvestment returns by asset class to arrive at a one-year expected return. Refer to Appendix I for a listing of expectedreturns by asset class.
REINSURANCEReported statutory surplus reflects a penalty for reinsurance recoverables overdue by more than 90 days from autho-rized and unauthorized reinsurers. Under U.S. statutory accounting, a haircut of 20% is applied to these recoverableswhen calculating book surplus (Schedule F Penalty). In calculating Book Adjusted Capital, two adjustments are madefor reinsurance. First, the model adds back the 20% Schedule F Penalty to book surplus. Second, the model calculatesa charge against individual recoverables based on Moody's insurance financial strength (IFSR) ratings of the individualreinsurer. The charges by rating category are described below.
These charges reflect: 1) the credit risk of the reinsurer, 2) the risk of dispute and/or negotiated settlement whichaccompanies any reinsurance transaction, and 3) the timeliness of payment (a time value of money concept). If a recov-erable is supported by funds withheld, the exposure amount is reduced by the funds withheld before applying thecharge. If a letter of credit (LOC) supports the recoverable, the exposure amount is reduced by 95% of the LOC valuebefore applying the charge.
Three additional modules also include an adjustment for reinsurance risk including core reserve risk, underwritingrisk, and asbestos and environmental risk. The expected losses from each of these risks are multiplied by the company'shistorical average ceded-to-net loss ratio to arrive at the expected ceded losses from these risks. The ceded to net ratiois calculated in one of two ways. For reserve risk and asbestos and environmental risk, the ceded to net ratio is calcu-lated based on ceded and net reserves. For underwriting risk, the ceded to net ratio is based on ceded and net premi-ums written. Then, within each module, the weighted average recoverable charge is applied to ceded losses to arrive ata reinsurance adjustment.
RESERVES
Core ReservesMRAC estimates expected reserve development using a combination of the actuarial chain-link method, loss ratiotrending, and the Bornhuetter-Ferguson (BF) method. Projected losses are discounted based on the line of businessand accident year. The methodology is discussed more completely in Appendix II. The core reserve adjustment to sur-plus is the difference between the model's estimate of ultimate losses and the reported ultimate, adjusted for a 35%marginal corporate tax rate. Below is an example of the business line analysis.
Reinsurance Recoverable Charges by Rating CategoryAaa 1%Aa 2%A 5%Baa 10%All Other 25%
Moody’s Rating Methodology 5
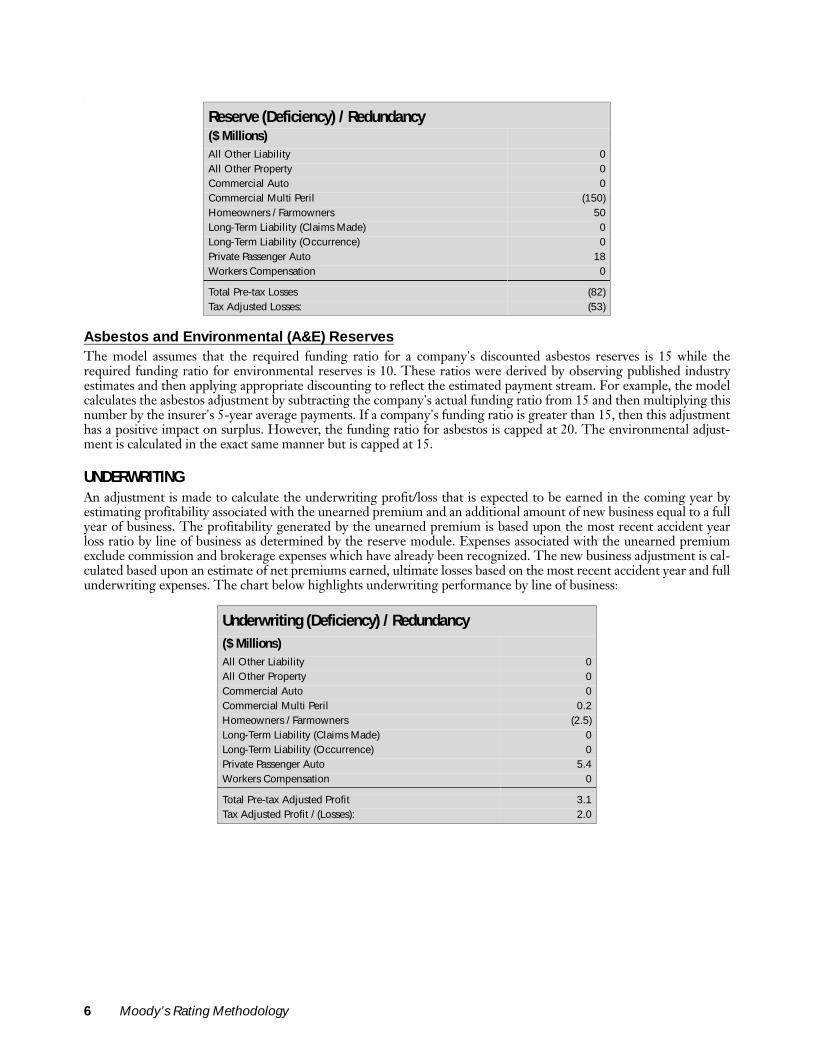
.
Asbestos and Environmental (A&E) ReservesThe model assumes that the required funding ratio for a company's discounted asbestos reserves is 15 while therequired funding ratio for environmental reserves is 10. These ratios were derived by observing published industryestimates and then applying appropriate discounting to reflect the estimated payment stream. For example, the modelcalculates the asbestos adjustment by subtracting the company's actual funding ratio from 15 and then multiplying thisnumber by the insurer's 5-year average payments. If a company's funding ratio is greater than 15, then this adjustmenthas a positive impact on surplus. However, the funding ratio for asbestos is capped at 20. The environmental adjust-ment is calculated in the exact same manner but is capped at 15.
UNDERWRITINGAn adjustment is made to calculate the underwriting profit/loss that is expected to be earned in the coming year byestimating profitability associated with the unearned premium and an additional amount of new business equal to a fullyear of business. The profitability generated by the unearned premium is based upon the most recent accident yearloss ratio by line of business as determined by the reserve module. Expenses associated with the unearned premiumexclude commission and brokerage expenses which have already been recognized. The new business adjustment is cal-culated based upon an estimate of net premiums earned, ultimate losses based on the most recent accident year and fullunderwriting expenses. The chart below highlights underwriting performance by line of business:
Reserve (Deficiency) / Redundancy($ Millions)All Other Liability 0All Other Property 0Commercial Auto 0Commercial Multi Peril (150)Homeowners / Farmowners 50Long-Term Liability (Claims Made) 0Long-Term Liability (Occurrence) 0Private Passenger Auto 18Workers Compensation 0
Total Pre-tax Losses (82)Tax Adjusted Losses: (53)
Underwriting (Deficiency) / Redundancy($ Millions)All Other Liability 0All Other Property 0Commercial Auto 0Commercial Multi Peril 0.2Homeowners / Farmowners (2.5)Long-Term Liability (Claims Made) 0Long-Term Liability (Occurrence) 0Private Passenger Auto 5.4Workers Compensation 0
Total Pre-tax Adjusted Profit 3.1Tax Adjusted Profit / (Losses): 2.0
6 Moody’s Rating Methodology
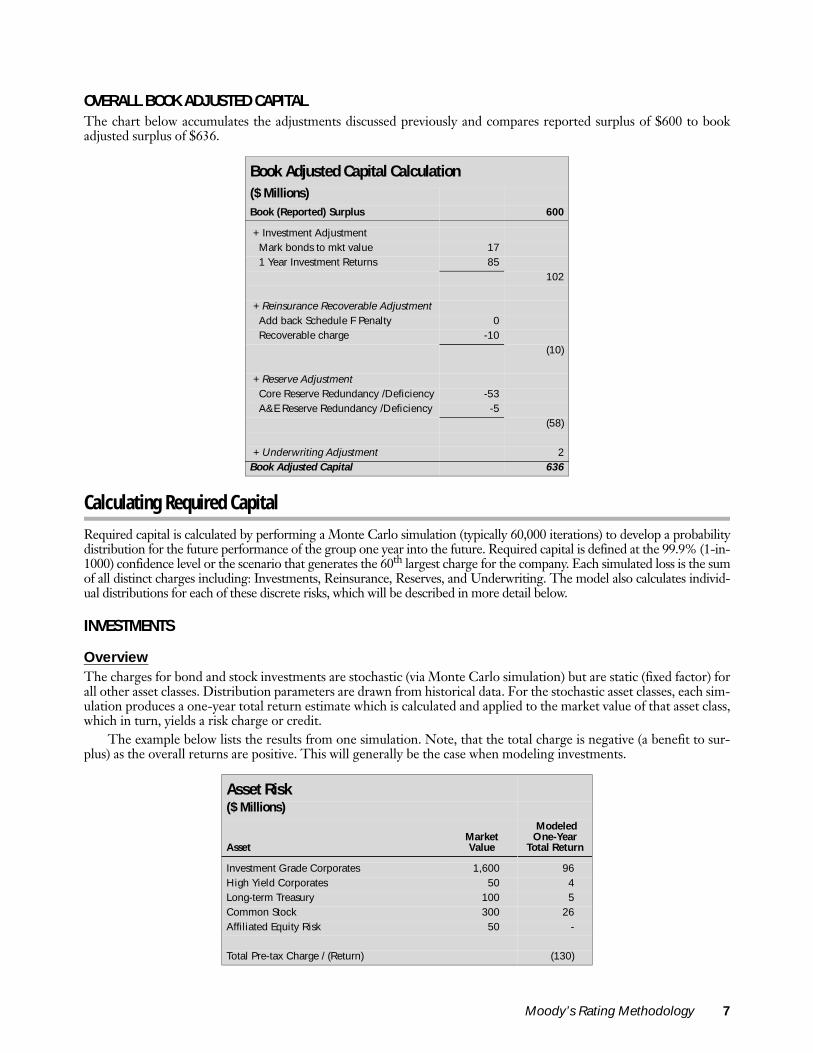
OVERALL BOOK ADJUSTED CAPITALThe chart below accumulates the adjustments discussed previously and compares reported surplus of $600 to bookadjusted surplus of $636.
Calculating Required Capital
Required capital is calculated by performing a Monte Carlo simulation (typically 60,000 iterations) to develop a probabilitydistribution for the future performance of the group one year into the future. Required capital is defined at the 99.9% (1-in-1000) confidence level or the scenario that generates the 60th largest charge for the company. Each simulated loss is the sumof all distinct charges including: Investments, Reinsurance, Reserves, and Underwriting. The model also calculates individ-ual distributions for each of these discrete risks, which will be described in more detail below.
INVESTMENTS
OverviewThe charges for bond and stock investments are stochastic (via Monte Carlo simulation) but are static (fixed factor) forall other asset classes. Distribution parameters are drawn from historical data. For the stochastic asset classes, each sim-ulation produces a one-year total return estimate which is calculated and applied to the market value of that asset class,which in turn, yields a risk charge or credit.
The example below lists the results from one simulation. Note, that the total charge is negative (a benefit to sur-plus) as the overall returns are positive. This will generally be the case when modeling investments.
Book Adjusted Capital Calculation($ Millions)Book (Reported) Surplus 600
+ Investment Adjustment Mark bonds to mkt value 17 1 Year Investment Returns 85
102
+ Reinsurance Recoverable Adjustment Add back Schedule F Penalty 0 Recoverable charge -10
(10)
+ Reserve Adjustment Core Reserve Redundancy /Deficiency -53 A&E Reserve Redundancy /Deficiency -5
(58)
+ Underwriting Adjustment 2Book Adjusted Capital 636
Asset Risk($ Millions)
Asset Market Value
Modeled One-Year
Total Return
Investment Grade Corporates 1,600 96High Yield Corporates 50 4Long-term Treasury 100 5Common Stock 300 26Affiliated Equity Risk 50 -
Total Pre-tax Charge / (Return) (130)
Moody’s Rating Methodology 7
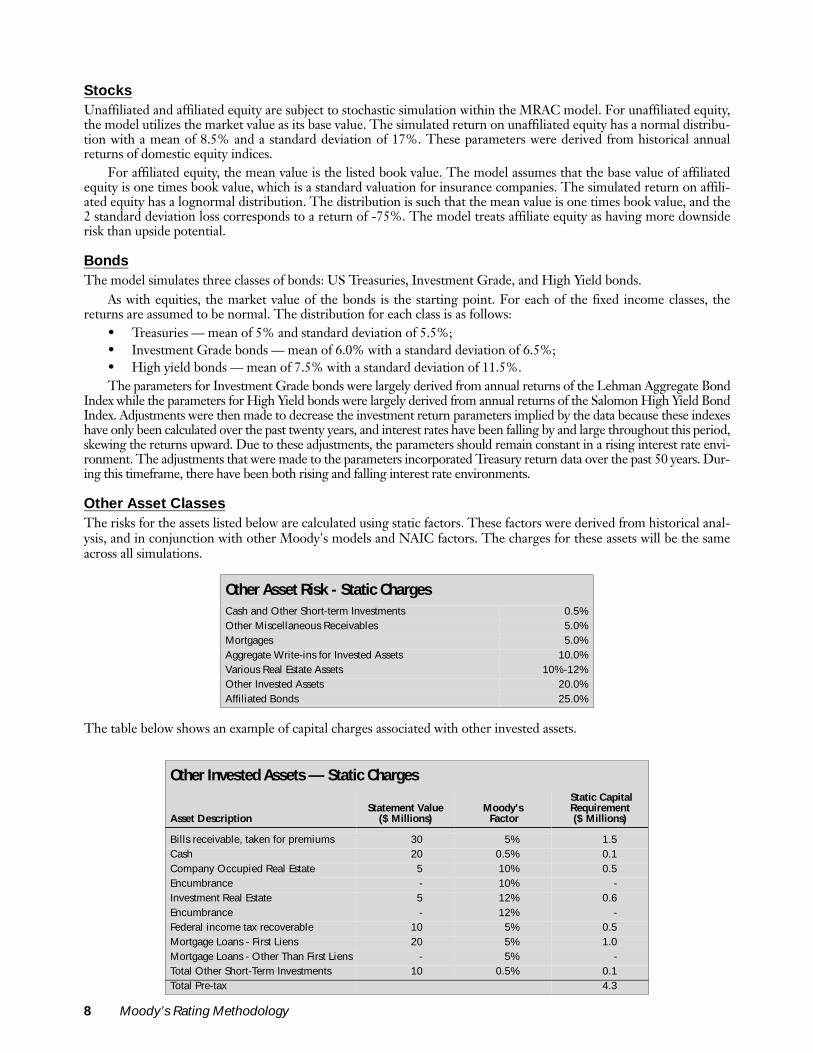
StocksUnaffiliated and affiliated equity are subject to stochastic simulation within the MRAC model. For unaffiliated equity,the model utilizes the market value as its base value. The simulated return on unaffiliated equity has a normal distribu-tion with a mean of 8.5% and a standard deviation of 17%. These parameters were derived from historical annualreturns of domestic equity indices.
For affiliated equity, the mean value is the listed book value. The model assumes that the base value of affiliatedequity is one times book value, which is a standard valuation for insurance companies. The simulated return on affili-ated equity has a lognormal distribution. The distribution is such that the mean value is one times book value, and the2 standard deviation loss corresponds to a return of -75%. The model treats affiliate equity as having more downsiderisk than upside potential.
BondsThe model simulates three classes of bonds: US Treasuries, Investment Grade, and High Yield bonds.
As with equities, the market value of the bonds is the starting point. For each of the fixed income classes, thereturns are assumed to be normal. The distribution for each class is as follows:
• Treasuries — mean of 5% and standard deviation of 5.5%;• Investment Grade bonds — mean of 6.0% with a standard deviation of 6.5%;• High yield bonds — mean of 7.5% with a standard deviation of 11.5%.The parameters for Investment Grade bonds were largely derived from annual returns of the Lehman Aggregate Bond
Index while the parameters for High Yield bonds were largely derived from annual returns of the Salomon High Yield BondIndex. Adjustments were then made to decrease the investment return parameters implied by the data because these indexeshave only been calculated over the past twenty years, and interest rates have been falling by and large throughout this period,skewing the returns upward. Due to these adjustments, the parameters should remain constant in a rising interest rate envi-ronment. The adjustments that were made to the parameters incorporated Treasury return data over the past 50 years. Dur-ing this timeframe, there have been both rising and falling interest rate environments.
Other Asset ClassesThe risks for the assets listed below are calculated using static factors. These factors were derived from historical anal-ysis, and in conjunction with other Moody's models and NAIC factors. The charges for these assets will be the sameacross all simulations.
The table below shows an example of capital charges associated with other invested assets.
Other Asset Risk - Static ChargesCash and Other Short-term Investments 0.5%Other Miscellaneous Receivables 5.0%Mortgages 5.0%Aggregate Write-ins for Invested Assets 10.0%Various Real Estate Assets 10%-12%Other Invested Assets 20.0%Affiliated Bonds 25.0%
Other Invested Assets — Static Charges
Asset DescriptionStatement Value
($ Millions)Moody's Factor
Static Capital Requirement ($ Millions)
Bills receivable, taken for premiums 30 5% 1.5Cash 20 0.5% 0.1Company Occupied Real Estate 5 10% 0.5Encumbrance - 10% -Investment Real Estate 5 12% 0.6Encumbrance - 12% -Federal income tax recoverable 10 5% 0.5Mortgage Loans - First Liens 20 5% 1.0Mortgage Loans - Other Than First Liens - 5% -Total Other Short-Term Investments 10 0.5% 0.1Total Pre-tax 4.3
8 Moody’s Rating Methodology
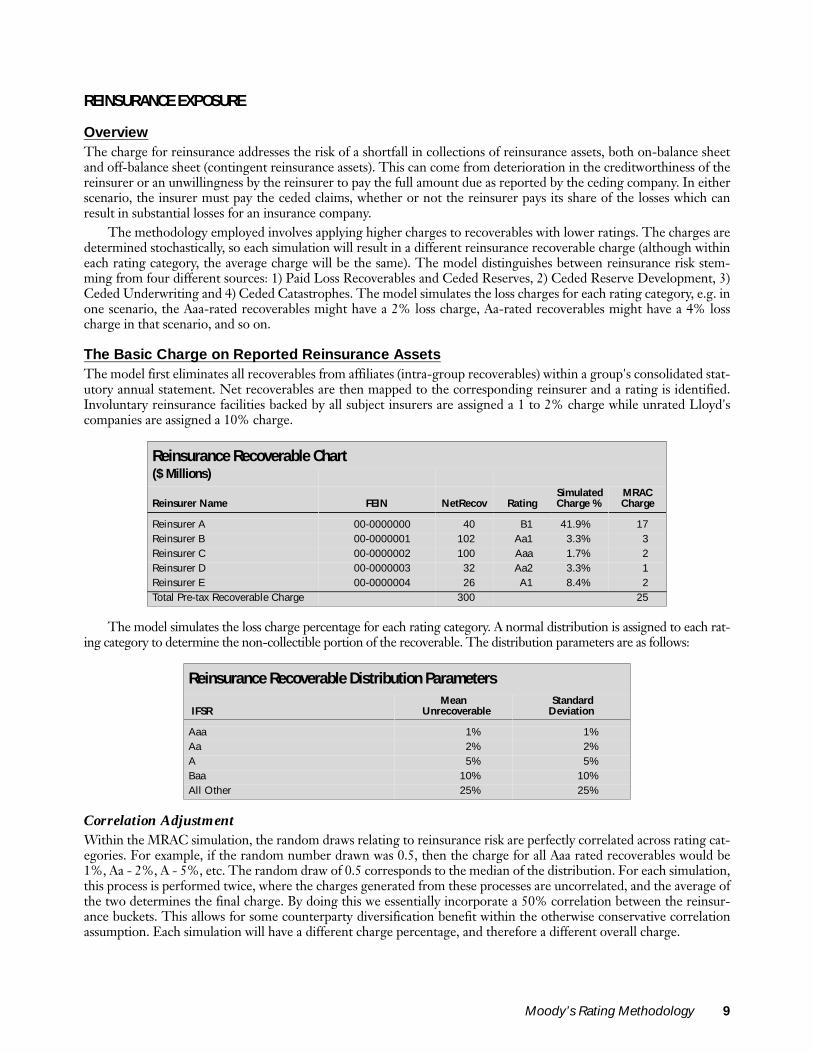
REINSURANCE EXPOSURE
OverviewThe charge for reinsurance addresses the risk of a shortfall in collections of reinsurance assets, both on-balance sheetand off-balance sheet (contingent reinsurance assets). This can come from deterioration in the creditworthiness of thereinsurer or an unwillingness by the reinsurer to pay the full amount due as reported by the ceding company. In eitherscenario, the insurer must pay the ceded claims, whether or not the reinsurer pays its share of the losses which canresult in substantial losses for an insurance company.
The methodology employed involves applying higher charges to recoverables with lower ratings. The charges aredetermined stochastically, so each simulation will result in a different reinsurance recoverable charge (although withineach rating category, the average charge will be the same). The model distinguishes between reinsurance risk stem-ming from four different sources: 1) Paid Loss Recoverables and Ceded Reserves, 2) Ceded Reserve Development, 3)Ceded Underwriting and 4) Ceded Catastrophes. The model simulates the loss charges for each rating category, e.g. inone scenario, the Aaa-rated recoverables might have a 2% loss charge, Aa-rated recoverables might have a 4% losscharge in that scenario, and so on.
The Basic Charge on Reported Reinsurance AssetsThe model first eliminates all recoverables from affiliates (intra-group recoverables) within a group's consolidated stat-utory annual statement. Net recoverables are then mapped to the corresponding reinsurer and a rating is identified.Involuntary reinsurance facilities backed by all subject insurers are assigned a 1 to 2% charge while unrated Lloyd'scompanies are assigned a 10% charge.
The model simulates the loss charge percentage for each rating category. A normal distribution is assigned to each rat-ing category to determine the non-collectible portion of the recoverable. The distribution parameters are as follows:
Correlation AdjustmentWithin the MRAC simulation, the random draws relating to reinsurance risk are perfectly correlated across rating cat-egories. For example, if the random number drawn was 0.5, then the charge for all Aaa rated recoverables would be1%, Aa - 2%, A - 5%, etc. The random draw of 0.5 corresponds to the median of the distribution. For each simulation,this process is performed twice, where the charges generated from these processes are uncorrelated, and the average ofthe two determines the final charge. By doing this we essentially incorporate a 50% correlation between the reinsur-ance buckets. This allows for some counterparty diversification benefit within the otherwise conservative correlationassumption. Each simulation will have a different charge percentage, and therefore a different overall charge.
Reinsurance Recoverable Chart($ Millions)
Reinsurer Name FEIN NetRecov RatingSimulated Charge %
MRAC Charge
Reinsurer A 00-0000000 40 B1 41.9% 17Reinsurer B 00-0000001 102 Aa1 3.3% 3Reinsurer C 00-0000002 100 Aaa 1.7% 2Reinsurer D 00-0000003 32 Aa2 3.3% 1Reinsurer E 00-0000004 26 A1 8.4% 2Total Pre-tax Recoverable Charge 300 25
Reinsurance Recoverable Distribution Parameters
IFSRMean
Unrecoverable Standard Deviation
Aaa 1% 1%Aa 2% 2%A 5% 5%Baa 10% 10%All Other 25% 25%
Moody’s Rating Methodology 9
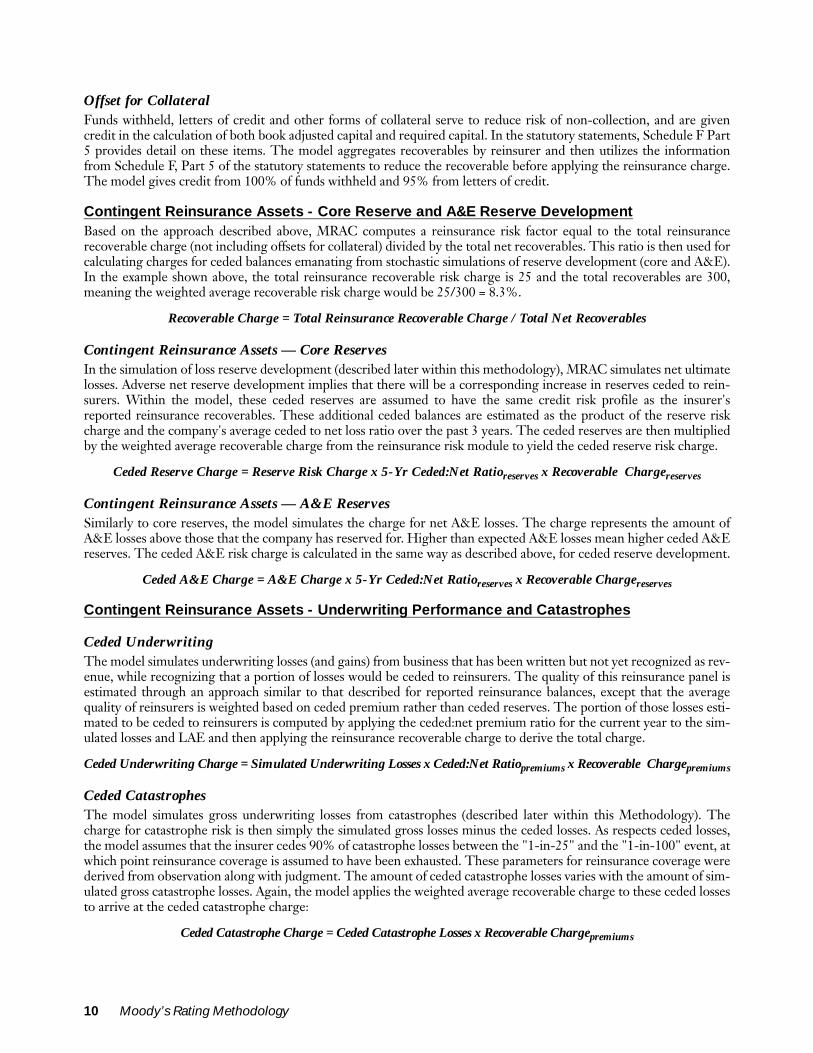
Offset for CollateralFunds withheld, letters of credit and other forms of collateral serve to reduce risk of non-collection, and are givencredit in the calculation of both book adjusted capital and required capital. In the statutory statements, Schedule F Part5 provides detail on these items. The model aggregates recoverables by reinsurer and then utilizes the informationfrom Schedule F, Part 5 of the statutory statements to reduce the recoverable before applying the reinsurance charge.The model gives credit from 100% of funds withheld and 95% from letters of credit.
Contingent Reinsurance Assets - Core Reserve and A&E Reserve DevelopmentBased on the approach described above, MRAC computes a reinsurance risk factor equal to the total reinsurancerecoverable charge (not including offsets for collateral) divided by the total net recoverables. This ratio is then used forcalculating charges for ceded balances emanating from stochastic simulations of reserve development (core and A&E).In the example shown above, the total reinsurance recoverable risk charge is 25 and the total recoverables are 300,meaning the weighted average recoverable risk charge would be 25/300 = 8.3%.
Recoverable Charge = Total Reinsurance Recoverable Charge / Total Net Recoverables
Contingent Reinsurance Assets — Core ReservesIn the simulation of loss reserve development (described later within this methodology), MRAC simulates net ultimatelosses. Adverse net reserve development implies that there will be a corresponding increase in reserves ceded to rein-surers. Within the model, these ceded reserves are assumed to have the same credit risk profile as the insurer'sreported reinsurance recoverables. These additional ceded balances are estimated as the product of the reserve riskcharge and the company's average ceded to net loss ratio over the past 3 years. The ceded reserves are then multipliedby the weighted average recoverable charge from the reinsurance risk module to yield the ceded reserve risk charge.
Ceded Reserve Charge = Reserve Risk Charge x 5-Yr Ceded:Net Ratioreserves x Recoverable Chargereserves
Contingent Reinsurance Assets — A&E ReservesSimilarly to core reserves, the model simulates the charge for net A&E losses. The charge represents the amount ofA&E losses above those that the company has reserved for. Higher than expected A&E losses mean higher ceded A&Ereserves. The ceded A&E risk charge is calculated in the same way as described above, for ceded reserve development.
Ceded A&E Charge = A&E Charge x 5-Yr Ceded:Net Ratioreserves x Recoverable Chargereserves
Contingent Reinsurance Assets - Underwriting Performance and Catastrophes
Ceded UnderwritingThe model simulates underwriting losses (and gains) from business that has been written but not yet recognized as rev-enue, while recognizing that a portion of losses would be ceded to reinsurers. The quality of this reinsurance panel isestimated through an approach similar to that described for reported reinsurance balances, except that the averagequality of reinsurers is weighted based on ceded premium rather than ceded reserves. The portion of those losses esti-mated to be ceded to reinsurers is computed by applying the ceded:net premium ratio for the current year to the sim-ulated losses and LAE and then applying the reinsurance recoverable charge to derive the total charge.
Ceded Underwriting Charge = Simulated Underwriting Losses x Ceded:Net Ratiopremiums x Recoverable Chargepremiums
Ceded CatastrophesThe model simulates gross underwriting losses from catastrophes (described later within this Methodology). Thecharge for catastrophe risk is then simply the simulated gross losses minus the ceded losses. As respects ceded losses,the model assumes that the insurer cedes 90% of catastrophe losses between the "1-in-25" and the "1-in-100" event, atwhich point reinsurance coverage is assumed to have been exhausted. These parameters for reinsurance coverage werederived from observation along with judgment. The amount of ceded catastrophe losses varies with the amount of sim-ulated gross catastrophe losses. Again, the model applies the weighted average recoverable charge to these ceded lossesto arrive at the ceded catastrophe charge:
Ceded Catastrophe Charge = Ceded Catastrophe Losses x Recoverable Chargepremiums
10 Moody’s Rating Methodology
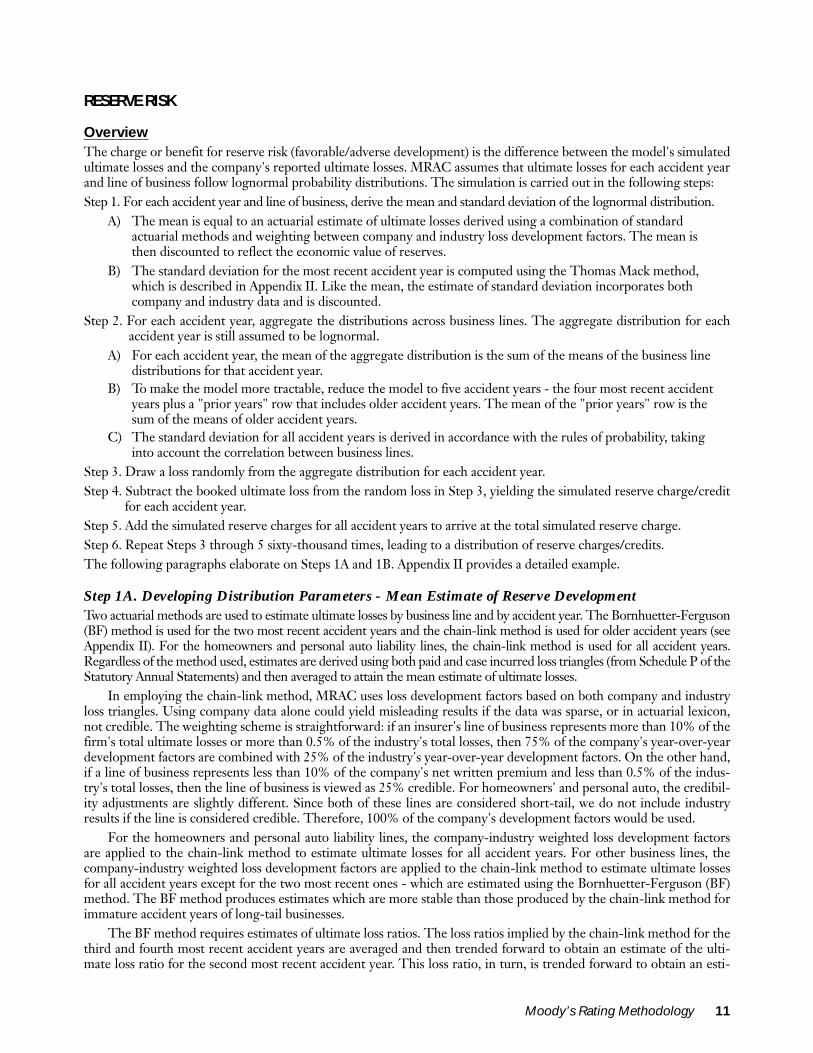
RESERVE RISK
OverviewThe charge or benefit for reserve risk (favorable/adverse development) is the difference between the model's simulatedultimate losses and the company's reported ultimate losses. MRAC assumes that ultimate losses for each accident yearand line of business follow lognormal probability distributions. The simulation is carried out in the following steps:Step 1. For each accident year and line of business, derive the mean and standard deviation of the lognormal distribution.
A) The mean is equal to an actuarial estimate of ultimate losses derived using a combination of standard actuarial methods and weighting between company and industry loss development factors. The mean is then discounted to reflect the economic value of reserves.
B) The standard deviation for the most recent accident year is computed using the Thomas Mack method, which is described in Appendix II. Like the mean, the estimate of standard deviation incorporates both company and industry data and is discounted.
Step 2. For each accident year, aggregate the distributions across business lines. The aggregate distribution for eachaccident year is still assumed to be lognormal.
A) For each accident year, the mean of the aggregate distribution is the sum of the means of the business line distributions for that accident year.
B) To make the model more tractable, reduce the model to five accident years - the four most recent accident years plus a "prior years" row that includes older accident years. The mean of the "prior years" row is the sum of the means of older accident years.
C) The standard deviation for all accident years is derived in accordance with the rules of probability, taking into account the correlation between business lines.
Step 3. Draw a loss randomly from the aggregate distribution for each accident year.Step 4. Subtract the booked ultimate loss from the random loss in Step 3, yielding the simulated reserve charge/credit
for each accident year.Step 5. Add the simulated reserve charges for all accident years to arrive at the total simulated reserve charge.Step 6. Repeat Steps 3 through 5 sixty-thousand times, leading to a distribution of reserve charges/credits.The following paragraphs elaborate on Steps 1A and 1B. Appendix II provides a detailed example.
Step 1A. Developing Distribution Parameters - Mean Estimate of Reserve DevelopmentTwo actuarial methods are used to estimate ultimate losses by business line and by accident year. The Bornhuetter-Ferguson(BF) method is used for the two most recent accident years and the chain-link method is used for older accident years (seeAppendix II). For the homeowners and personal auto liability lines, the chain-link method is used for all accident years.Regardless of the method used, estimates are derived using both paid and case incurred loss triangles (from Schedule P of theStatutory Annual Statements) and then averaged to attain the mean estimate of ultimate losses.
In employing the chain-link method, MRAC uses loss development factors based on both company and industryloss triangles. Using company data alone could yield misleading results if the data was sparse, or in actuarial lexicon,not credible. The weighting scheme is straightforward: if an insurer's line of business represents more than 10% of thefirm's total ultimate losses or more than 0.5% of the industry's total losses, then 75% of the company's year-over-yeardevelopment factors are combined with 25% of the industry's year-over-year development factors. On the other hand,if a line of business represents less than 10% of the company's net written premium and less than 0.5% of the indus-try's total losses, then the line of business is viewed as 25% credible. For homeowners' and personal auto, the credibil-ity adjustments are slightly different. Since both of these lines are considered short-tail, we do not include industryresults if the line is considered credible. Therefore, 100% of the company's development factors would be used.
For the homeowners and personal auto liability lines, the company-industry weighted loss development factorsare applied to the chain-link method to estimate ultimate losses for all accident years. For other business lines, thecompany-industry weighted loss development factors are applied to the chain-link method to estimate ultimate lossesfor all accident years except for the two most recent ones - which are estimated using the Bornhuetter-Ferguson (BF)method. The BF method produces estimates which are more stable than those produced by the chain-link method forimmature accident years of long-tail businesses.
The BF method requires estimates of ultimate loss ratios. The loss ratios implied by the chain-link method for thethird and fourth most recent accident years are averaged and then trended forward to obtain an estimate of the ulti-mate loss ratio for the second most recent accident year. This loss ratio, in turn, is trended forward to obtain an esti-
Moody’s Rating Methodology 11
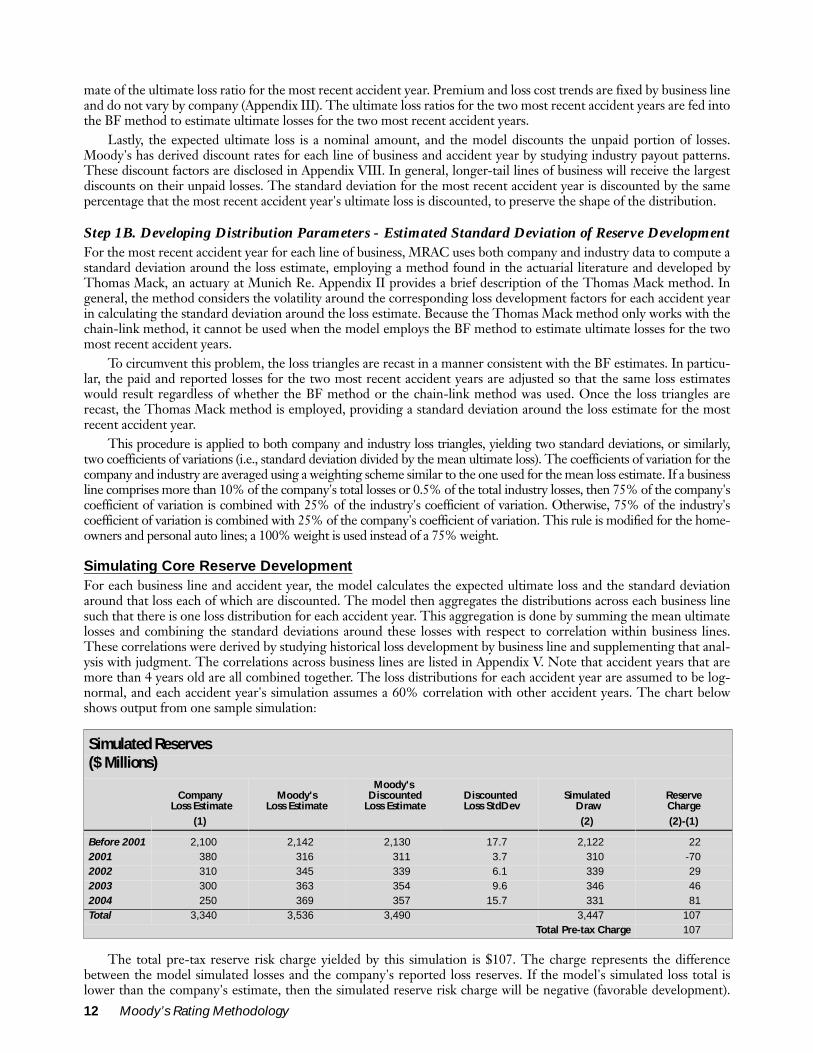
12 Moody’s Rating Methodology
mate of the ultimate loss ratio for the most recent accident year. Premium and loss cost trends are fixed by business lineand do not vary by company (Appendix III). The ultimate loss ratios for the two most recent accident years are fed intothe BF method to estimate ultimate losses for the two most recent accident years.
Lastly, the expected ultimate loss is a nominal amount, and the model discounts the unpaid portion of losses.Moody's has derived discount rates for each line of business and accident year by studying industry payout patterns.These discount factors are disclosed in Appendix VIII. In general, longer-tail lines of business will receive the largestdiscounts on their unpaid losses. The standard deviation for the most recent accident year is discounted by the samepercentage that the most recent accident year's ultimate loss is discounted, to preserve the shape of the distribution.
Step 1B. Developing Distribution Parameters - Estimated Standard Deviation of Reserve DevelopmentFor the most recent accident year for each line of business, MRAC uses both company and industry data to compute astandard deviation around the loss estimate, employing a method found in the actuarial literature and developed byThomas Mack, an actuary at Munich Re. Appendix II provides a brief description of the Thomas Mack method. Ingeneral, the method considers the volatility around the corresponding loss development factors for each accident yearin calculating the standard deviation around the loss estimate. Because the Thomas Mack method only works with thechain-link method, it cannot be used when the model employs the BF method to estimate ultimate losses for the twomost recent accident years.
To circumvent this problem, the loss triangles are recast in a manner consistent with the BF estimates. In particu-lar, the paid and reported losses for the two most recent accident years are adjusted so that the same loss estimateswould result regardless of whether the BF method or the chain-link method was used. Once the loss triangles arerecast, the Thomas Mack method is employed, providing a standard deviation around the loss estimate for the mostrecent accident year.
This procedure is applied to both company and industry loss triangles, yielding two standard deviations, or similarly,two coefficients of variations (i.e., standard deviation divided by the mean ultimate loss). The coefficients of variation for thecompany and industry are averaged using a weighting scheme similar to the one used for the mean loss estimate. If a businessline comprises more than 10% of the company's total losses or 0.5% of the total industry losses, then 75% of the company'scoefficient of variation is combined with 25% of the industry's coefficient of variation. Otherwise, 75% of the industry'scoefficient of variation is combined with 25% of the company's coefficient of variation. This rule is modified for the home-owners and personal auto lines; a 100% weight is used instead of a 75% weight.
Simulating Core Reserve DevelopmentFor each business line and accident year, the model calculates the expected ultimate loss and the standard deviationaround that loss each of which are discounted. The model then aggregates the distributions across each business linesuch that there is one loss distribution for each accident year. This aggregation is done by summing the mean ultimatelosses and combining the standard deviations around these losses with respect to correlation within business lines.These correlations were derived by studying historical loss development by business line and supplementing that anal-ysis with judgment. The correlations across business lines are listed in Appendix V. Note that accident years that aremore than 4 years old are all combined together. The loss distributions for each accident year are assumed to be log-normal, and each accident year's simulation assumes a 60% correlation with other accident years. The chart belowshows output from one sample simulation:
The total pre-tax reserve risk charge yielded by this simulation is $107. The charge represents the differencebetween the model simulated losses and the company's reported loss reserves. If the model's simulated loss total islower than the company's estimate, then the simulated reserve risk charge will be negative (favorable development).
Simulated Reserves($ Millions)
Company Loss Estimate
Moody's Loss Estimate
Moody's Discounted
Loss EstimateDiscounted
Loss StdDevSimulated
Draw Reserve Charge
(1) (2) (2)-(1)
Before 2001 2,100 2,142 2,130 17.7 2,122 222001 380 316 311 3.7 310 -702002 310 345 339 6.1 339 292003 300 363 354 9.6 346 462004 250 369 357 15.7 331 81Total 3,340 3,536 3,490 3,447 107
Total Pre-tax Charge 107
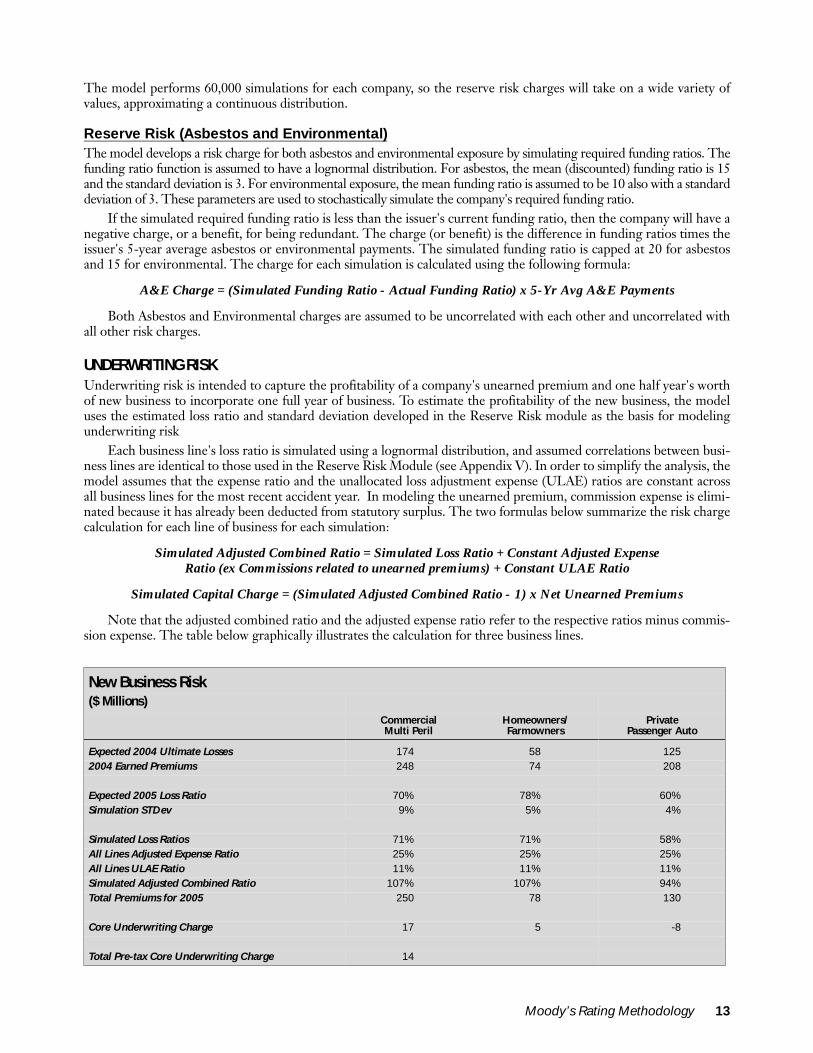
The model performs 60,000 simulations for each company, so the reserve risk charges will take on a wide variety ofvalues, approximating a continuous distribution.
Reserve Risk (Asbestos and Environmental)The model develops a risk charge for both asbestos and environmental exposure by simulating required funding ratios. Thefunding ratio function is assumed to have a lognormal distribution. For asbestos, the mean (discounted) funding ratio is 15and the standard deviation is 3. For environmental exposure, the mean funding ratio is assumed to be 10 also with a standarddeviation of 3. These parameters are used to stochastically simulate the company's required funding ratio.
If the simulated required funding ratio is less than the issuer's current funding ratio, then the company will have anegative charge, or a benefit, for being redundant. The charge (or benefit) is the difference in funding ratios times theissuer's 5-year average asbestos or environmental payments. The simulated funding ratio is capped at 20 for asbestosand 15 for environmental. The charge for each simulation is calculated using the following formula:
A&E Charge = (Simulated Funding Ratio - Actual Funding Ratio) x 5-Yr Avg A&E Payments
Both Asbestos and Environmental charges are assumed to be uncorrelated with each other and uncorrelated withall other risk charges.
UNDERWRITING RISKUnderwriting risk is intended to capture the profitability of a company's unearned premium and one half year's worthof new business to incorporate one full year of business. To estimate the profitability of the new business, the modeluses the estimated loss ratio and standard deviation developed in the Reserve Risk module as the basis for modelingunderwriting risk
Each business line's loss ratio is simulated using a lognormal distribution, and assumed correlations between busi-ness lines are identical to those used in the Reserve Risk Module (see Appendix V). In order to simplify the analysis, themodel assumes that the expense ratio and the unallocated loss adjustment expense (ULAE) ratios are constant acrossall business lines for the most recent accident year. In modeling the unearned premium, commission expense is elimi-nated because it has already been deducted from statutory surplus. The two formulas below summarize the risk chargecalculation for each line of business for each simulation:
Simulated Adjusted Combined Ratio = Simulated Loss Ratio + Constant Adjusted Expense Ratio (ex Commissions related to unearned premiums) + Constant ULAE Ratio
Simulated Capital Charge = (Simulated Adjusted Combined Ratio - 1) x Net Unearned Premiums
Note that the adjusted combined ratio and the adjusted expense ratio refer to the respective ratios minus commis-sion expense. The table below graphically illustrates the calculation for three business lines.
New Business Risk($ Millions)
CommercialMulti Peril
Homeowners/ Farmowners
PrivatePassenger Auto
Expected 2004 Ultimate Losses 174 58 1252004 Earned Premiums 248 74 208
Expected 2005 Loss Ratio 70% 78% 60%Simulation STDev 9% 5% 4%
Simulated Loss Ratios 71% 71% 58%All Lines Adjusted Expense Ratio 25% 25% 25%All Lines ULAE Ratio 11% 11% 11%Simulated Adjusted Combined Ratio 107% 107% 94%Total Premiums for 2005 250 78 130
Core Underwriting Charge 17 5 -8
Total Pre-tax Core Underwriting Charge 14
Moody’s Rating Methodology 13
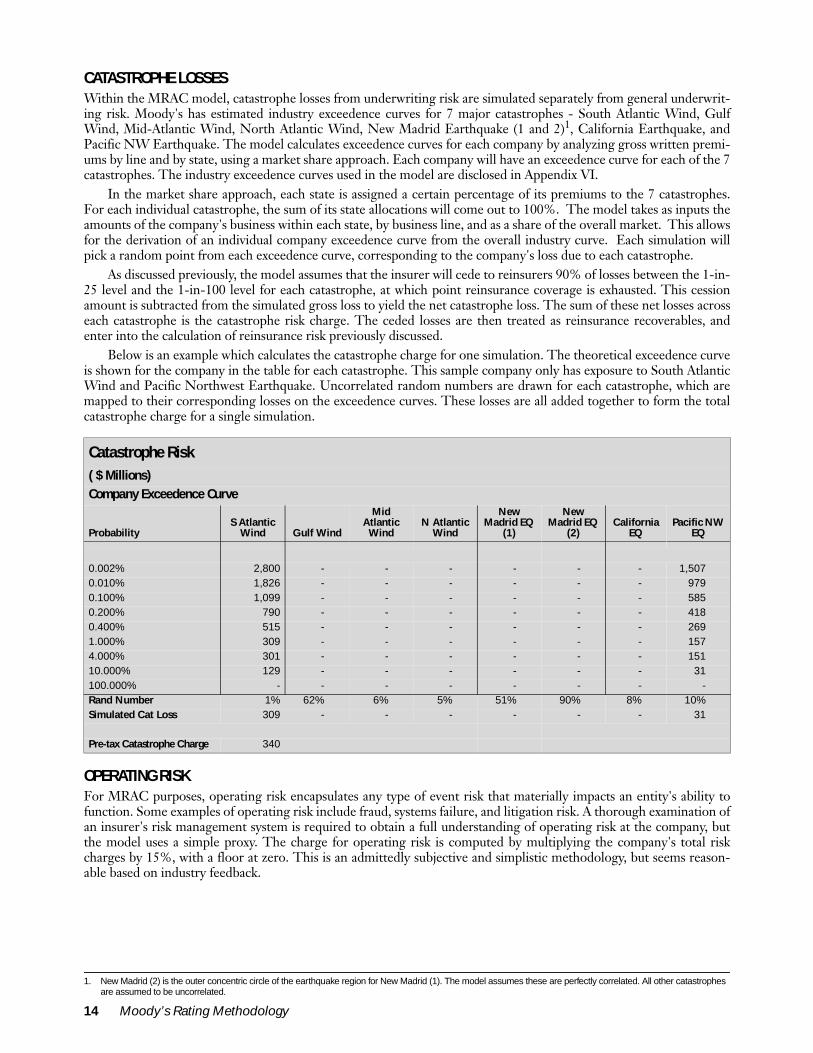
CATASTROPHE LOSSESWithin the MRAC model, catastrophe losses from underwriting risk are simulated separately from general underwrit-ing risk. Moody's has estimated industry exceedence curves for 7 major catastrophes - South Atlantic Wind, GulfWind, Mid-Atlantic Wind, North Atlantic Wind, New Madrid Earthquake (1 and 2)1, California Earthquake, andPacific NW Earthquake. The model calculates exceedence curves for each company by analyzing gross written premi-ums by line and by state, using a market share approach. Each company will have an exceedence curve for each of the 7catastrophes. The industry exceedence curves used in the model are disclosed in Appendix VI.
In the market share approach, each state is assigned a certain percentage of its premiums to the 7 catastrophes.For each individual catastrophe, the sum of its state allocations will come out to 100%. The model takes as inputs theamounts of the company's business within each state, by business line, and as a share of the overall market. This allowsfor the derivation of an individual company exceedence curve from the overall industry curve. Each simulation willpick a random point from each exceedence curve, corresponding to the company's loss due to each catastrophe.
As discussed previously, the model assumes that the insurer will cede to reinsurers 90% of losses between the 1-in-25 level and the 1-in-100 level for each catastrophe, at which point reinsurance coverage is exhausted. This cessionamount is subtracted from the simulated gross loss to yield the net catastrophe loss. The sum of these net losses acrosseach catastrophe is the catastrophe risk charge. The ceded losses are then treated as reinsurance recoverables, andenter into the calculation of reinsurance risk previously discussed.
Below is an example which calculates the catastrophe charge for one simulation. The theoretical exceedence curveis shown for the company in the table for each catastrophe. This sample company only has exposure to South AtlanticWind and Pacific Northwest Earthquake. Uncorrelated random numbers are drawn for each catastrophe, which aremapped to their corresponding losses on the exceedence curves. These losses are all added together to form the totalcatastrophe charge for a single simulation.
OPERATING RISKFor MRAC purposes, operating risk encapsulates any type of event risk that materially impacts an entity's ability tofunction. Some examples of operating risk include fraud, systems failure, and litigation risk. A thorough examination ofan insurer's risk management system is required to obtain a full understanding of operating risk at the company, butthe model uses a simple proxy. The charge for operating risk is computed by multiplying the company's total riskcharges by 15%, with a floor at zero. This is an admittedly subjective and simplistic methodology, but seems reason-able based on industry feedback.
1. New Madrid (2) is the outer concentric circle of the earthquake region for New Madrid (1). The model assumes these are perfectly correlated. All other catastrophes are assumed to be uncorrelated.
Catastrophe Risk( $ Millions)Company Exceedence Curve
ProbabilityS Atlantic
Wind Gulf Wind
Mid Atlantic Wind
N Atlantic Wind
New Madrid EQ
(1)
New Madrid EQ
(2)California
EQPacific NW
EQ
0.002% 2,800 - - - - - - 1,5070.010% 1,826 - - - - - - 9790.100% 1,099 - - - - - - 5850.200% 790 - - - - - - 4180.400% 515 - - - - - - 2691.000% 309 - - - - - - 1574.000% 301 - - - - - - 15110.000% 129 - - - - - - 31100.000% - - - - - - - -Rand Number 1% 62% 6% 5% 51% 90% 8% 10%Simulated Cat Loss 309 - - - - - - 31
Pre-tax Catastrophe Charge 340
14 Moody’s Rating Methodology
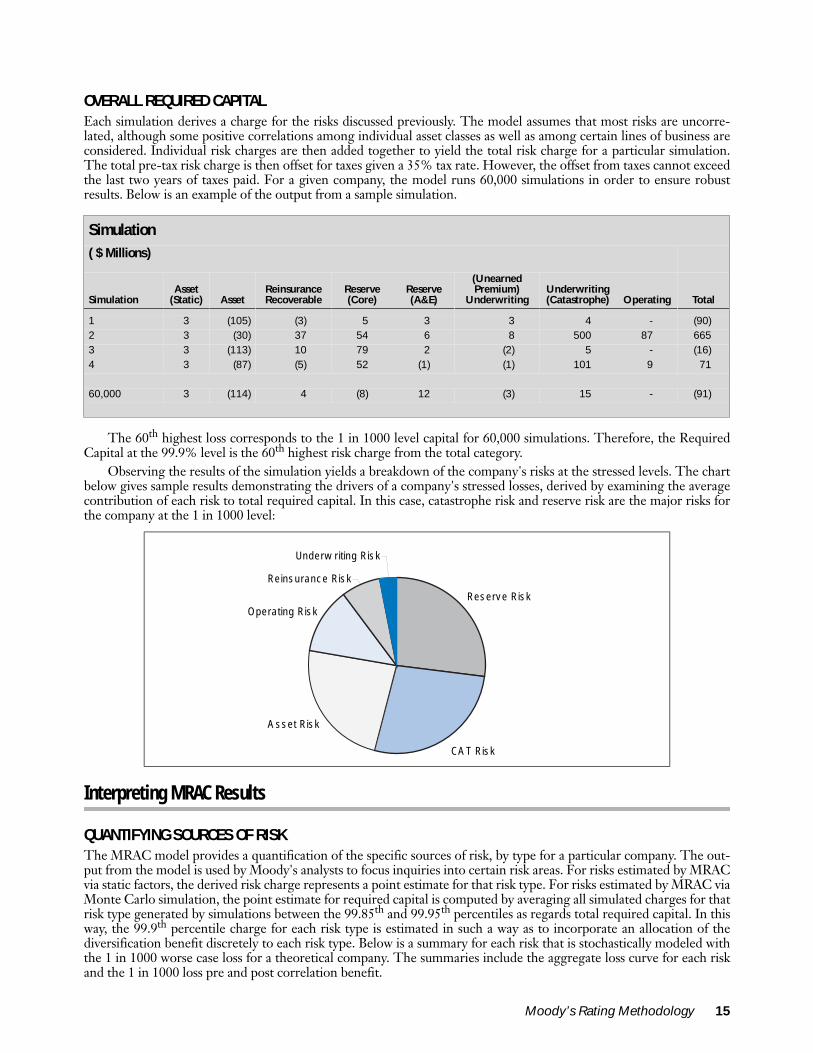
OVERALL REQUIRED CAPITALEach simulation derives a charge for the risks discussed previously. The model assumes that most risks are uncorre-lated, although some positive correlations among individual asset classes as well as among certain lines of business areconsidered. Individual risk charges are then added together to yield the total risk charge for a particular simulation.The total pre-tax risk charge is then offset for taxes given a 35% tax rate. However, the offset from taxes cannot exceedthe last two years of taxes paid. For a given company, the model runs 60,000 simulations in order to ensure robustresults. Below is an example of the output from a sample simulation.
The 60th highest loss corresponds to the 1 in 1000 level capital for 60,000 simulations. Therefore, the RequiredCapital at the 99.9% level is the 60th highest risk charge from the total category.
Observing the results of the simulation yields a breakdown of the company's risks at the stressed levels. The chartbelow gives sample results demonstrating the drivers of a company's stressed losses, derived by examining the averagecontribution of each risk to total required capital. In this case, catastrophe risk and reserve risk are the major risks forthe company at the 1 in 1000 level:
Interpreting MRAC Results
QUANTIFYING SOURCES OF RISKThe MRAC model provides a quantification of the specific sources of risk, by type for a particular company. The out-put from the model is used by Moody's analysts to focus inquiries into certain risk areas. For risks estimated by MRACvia static factors, the derived risk charge represents a point estimate for that risk type. For risks estimated by MRAC viaMonte Carlo simulation, the point estimate for required capital is computed by averaging all simulated charges for thatrisk type generated by simulations between the 99.85th and 99.95th percentiles as regards total required capital. In thisway, the 99.9th percentile charge for each risk type is estimated in such a way as to incorporate an allocation of thediversification benefit discretely to each risk type. Below is a summary for each risk that is stochastically modeled withthe 1 in 1000 worse case loss for a theoretical company. The summaries include the aggregate loss curve for each riskand the 1 in 1000 loss pre and post correlation benefit.
Simulation( $ Millions)
SimulationAsset
(Static) AssetReinsurance Recoverable
Reserve (Core)
Reserve (A&E)
(Unearned Premium)
Underwriting Underwriting (Catastrophe) Operating Total
1 3 (105) (3) 5 3 3 4 - (90)2 3 (30) 37 54 6 8 500 87 6653 3 (113) 10 79 2 (2) 5 - (16)4 3 (87) (5) 52 (1) (1) 101 9 71
60,000 3 (114) 4 (8) 12 (3) 15 - (91)
Res erv e R is k
CA T R is k
A s s et R is k
O pera ting R is k
Re ins urance R is k
Underw riting R is k
Moody’s Rating Methodology 15
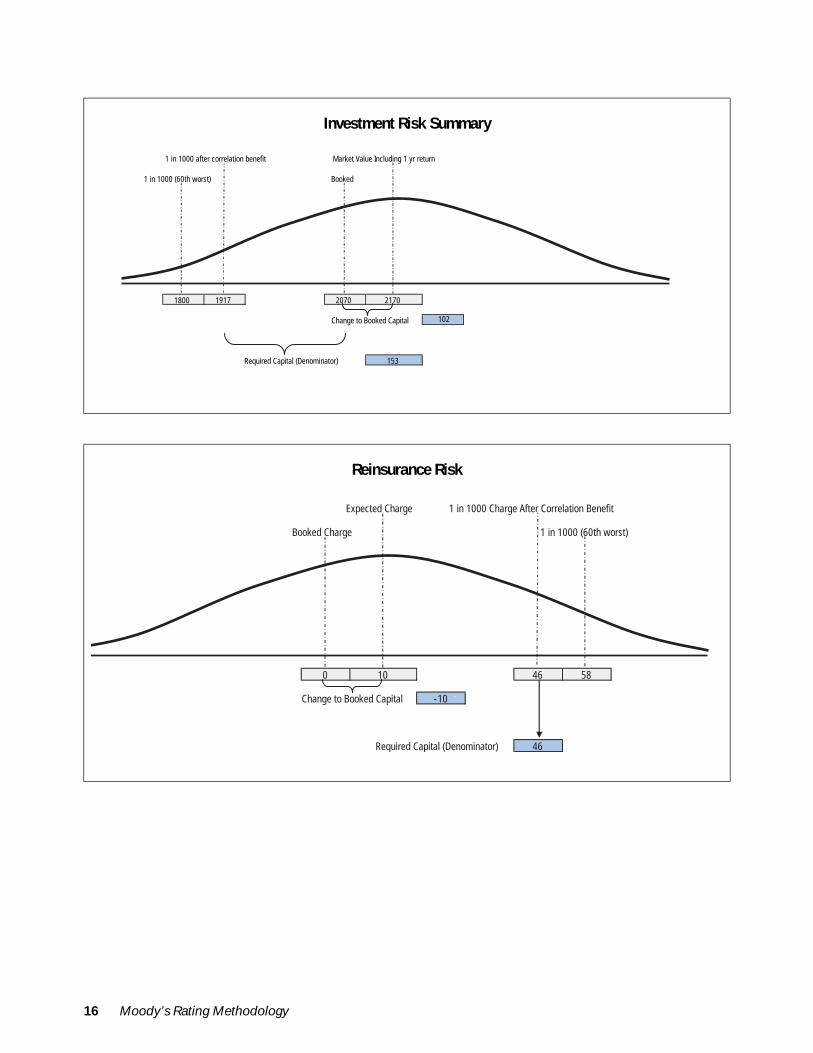
Investment Risk Summary
Reinsurance Risk
1 in 1000 after correlation benefit Market Value Including 1 yr return
1 in 1000 (60th worst) Booked
1800 1917 2070 2170
Change to Booked Capital 102
Required Capital (Denominator) 153
Expected Charge 1 in 1000 Charge After Correlation Benefit
Booked Charge 1 in 1000 (60th worst)
0 10 46 58
Change to Booked Capital -10
Required Capital (Denominator) 46
16 Moody’s Rating Methodology
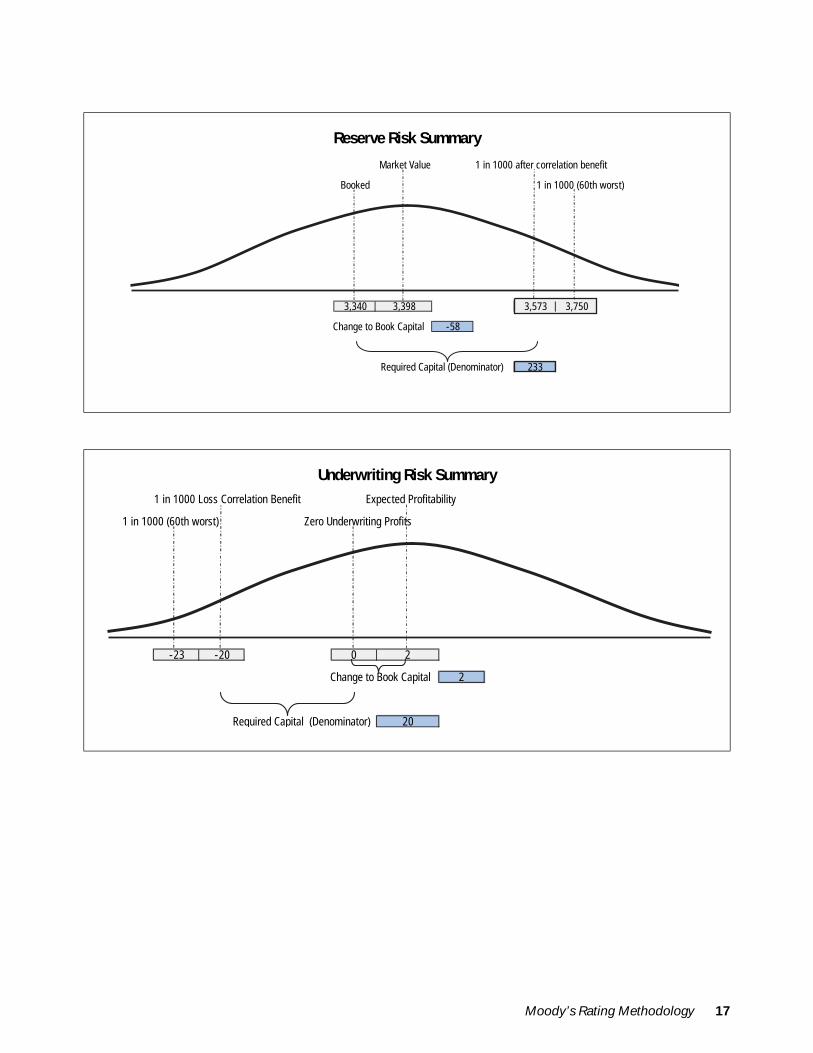
Moody’s Rating Methodology 17
Reserve Risk Summary
Underwriting Risk Summary
Market Value 1 in 1000 after correlation benefit
Booked 1 in 1000 (60th worst)
3,340 3,398 3,573 3,750
Change to Book Capital -58
Required Capital (Denominator) 233
1 in 1000 Loss Correlation Benefit Expected Profitability
1 in 1000 (60th worst) Zero Underwriting Profits
-23 -20 0 2
Change to Book Capital 2
Required Capital (Denominator) 20
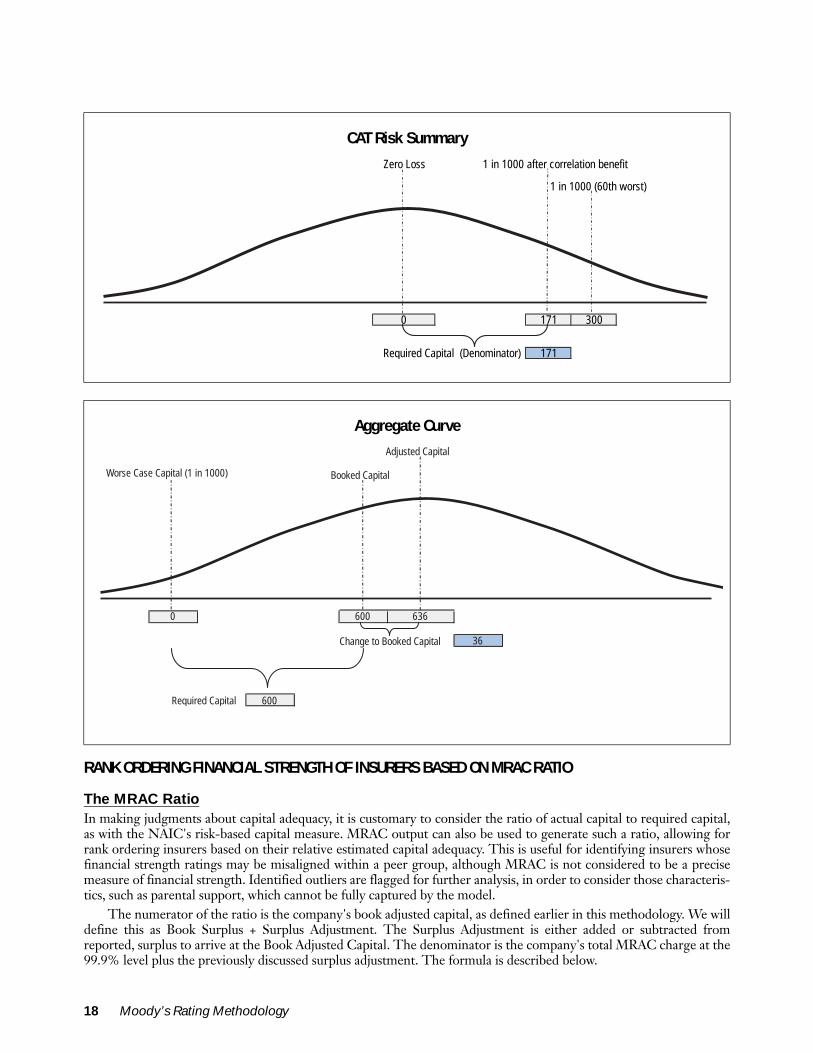
RANK ORDERING FINANCIAL STRENGTH OF INSURERS BASED ON MRAC RATIO
The MRAC RatioIn making judgments about capital adequacy, it is customary to consider the ratio of actual capital to required capital,as with the NAIC's risk-based capital measure. MRAC output can also be used to generate such a ratio, allowing forrank ordering insurers based on their relative estimated capital adequacy. This is useful for identifying insurers whosefinancial strength ratings may be misaligned within a peer group, although MRAC is not considered to be a precisemeasure of financial strength. Identified outliers are flagged for further analysis, in order to consider those characteris-tics, such as parental support, which cannot be fully captured by the model.
The numerator of the ratio is the company's book adjusted capital, as defined earlier in this methodology. We willdefine this as Book Surplus + Surplus Adjustment. The Surplus Adjustment is either added or subtracted fromreported, surplus to arrive at the Book Adjusted Capital. The denominator is the company's total MRAC charge at the99.9% level plus the previously discussed surplus adjustment. The formula is described below.
CAT Risk Summary
Aggregate Curve
Zero Loss 1 in 1000 after correlation benefit
1 in 1000 (60th worst)
0 171 300
Required Capital (Denominator) 171
Adjusted Capital
Worse Case Capital (1 in 1000) Booked Capital
0 600 636
Change to Booked Capital 36
Required Capital 600
18 Moody’s Rating Methodology
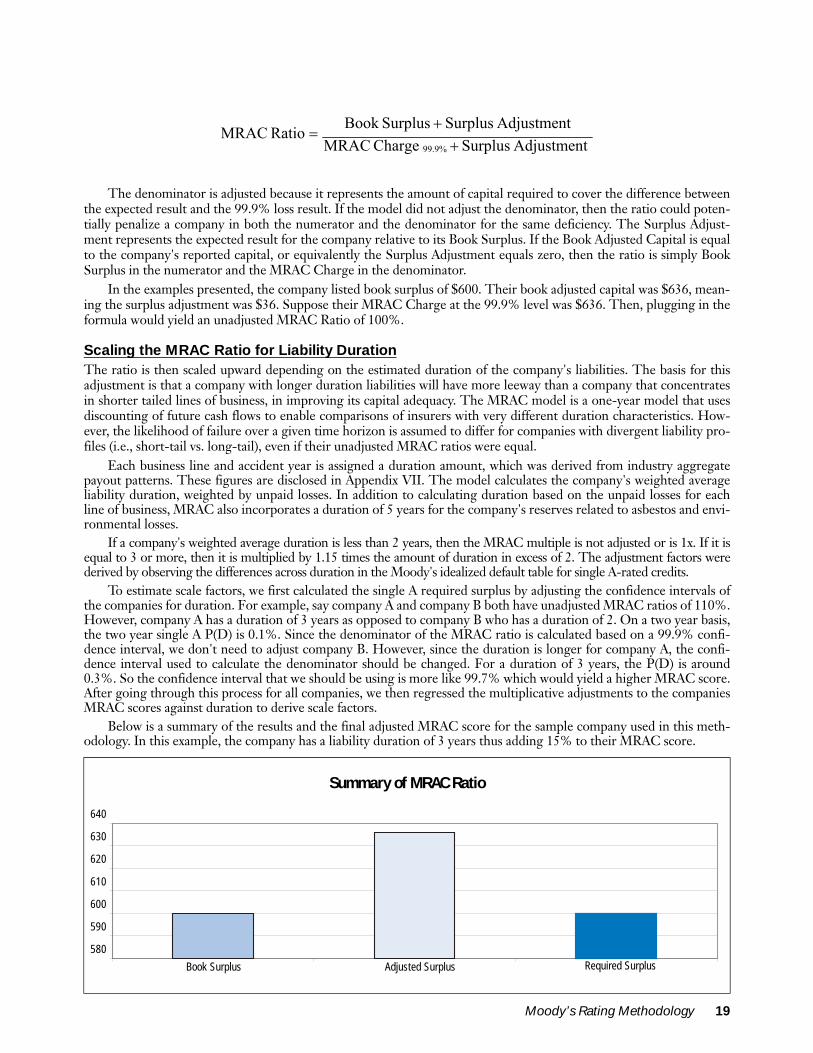
The denominator is adjusted because it represents the amount of capital required to cover the difference between
the expected result and the 99.9% loss result. If the model did not adjust the denominator, then the ratio could poten-tially penalize a company in both the numerator and the denominator for the same deficiency. The Surplus Adjust-ment represents the expected result for the company relative to its Book Surplus. If the Book Adjusted Capital is equalto the company's reported capital, or equivalently the Surplus Adjustment equals zero, then the ratio is simply BookSurplus in the numerator and the MRAC Charge in the denominator.
In the examples presented, the company listed book surplus of $600. Their book adjusted capital was $636, mean-ing the surplus adjustment was $36. Suppose their MRAC Charge at the 99.9% level was $636. Then, plugging in theformula would yield an unadjusted MRAC Ratio of 100%.
Scaling the MRAC Ratio for Liability DurationThe ratio is then scaled upward depending on the estimated duration of the company's liabilities. The basis for thisadjustment is that a company with longer duration liabilities will have more leeway than a company that concentratesin shorter tailed lines of business, in improving its capital adequacy. The MRAC model is a one-year model that usesdiscounting of future cash flows to enable comparisons of insurers with very different duration characteristics. How-ever, the likelihood of failure over a given time horizon is assumed to differ for companies with divergent liability pro-files (i.e., short-tail vs. long-tail), even if their unadjusted MRAC ratios were equal.
Each business line and accident year is assigned a duration amount, which was derived from industry aggregatepayout patterns. These figures are disclosed in Appendix VII. The model calculates the company's weighted averageliability duration, weighted by unpaid losses. In addition to calculating duration based on the unpaid losses for eachline of business, MRAC also incorporates a duration of 5 years for the company's reserves related to asbestos and envi-ronmental losses.
If a company's weighted average duration is less than 2 years, then the MRAC multiple is not adjusted or is 1x. If it isequal to 3 or more, then it is multiplied by 1.15 times the amount of duration in excess of 2. The adjustment factors werederived by observing the differences across duration in the Moody's idealized default table for single A-rated credits.
To estimate scale factors, we first calculated the single A required surplus by adjusting the confidence intervals ofthe companies for duration. For example, say company A and company B both have unadjusted MRAC ratios of 110%.However, company A has a duration of 3 years as opposed to company B who has a duration of 2. On a two year basis,the two year single A P(D) is 0.1%. Since the denominator of the MRAC ratio is calculated based on a 99.9% confi-dence interval, we don't need to adjust company B. However, since the duration is longer for company A, the confi-dence interval used to calculate the denominator should be changed. For a duration of 3 years, the P(D) is around0.3%. So the confidence interval that we should be using is more like 99.7% which would yield a higher MRAC score.After going through this process for all companies, we then regressed the multiplicative adjustments to the companiesMRAC scores against duration to derive scale factors.
Below is a summary of the results and the final adjusted MRAC score for the sample company used in this meth-odology. In this example, the company has a liability duration of 3 years thus adding 15% to their MRAC score.
Summary of MRAC Ratio
Adjustment Surplus Charge MRACAdjustment Surplus SurplusBook Ratio MRAC
99.9% ++
=
580
590
600
610
620
630
640
Book Surplus Adjusted Surplus Required Surplus
Moody’s Rating Methodology 19
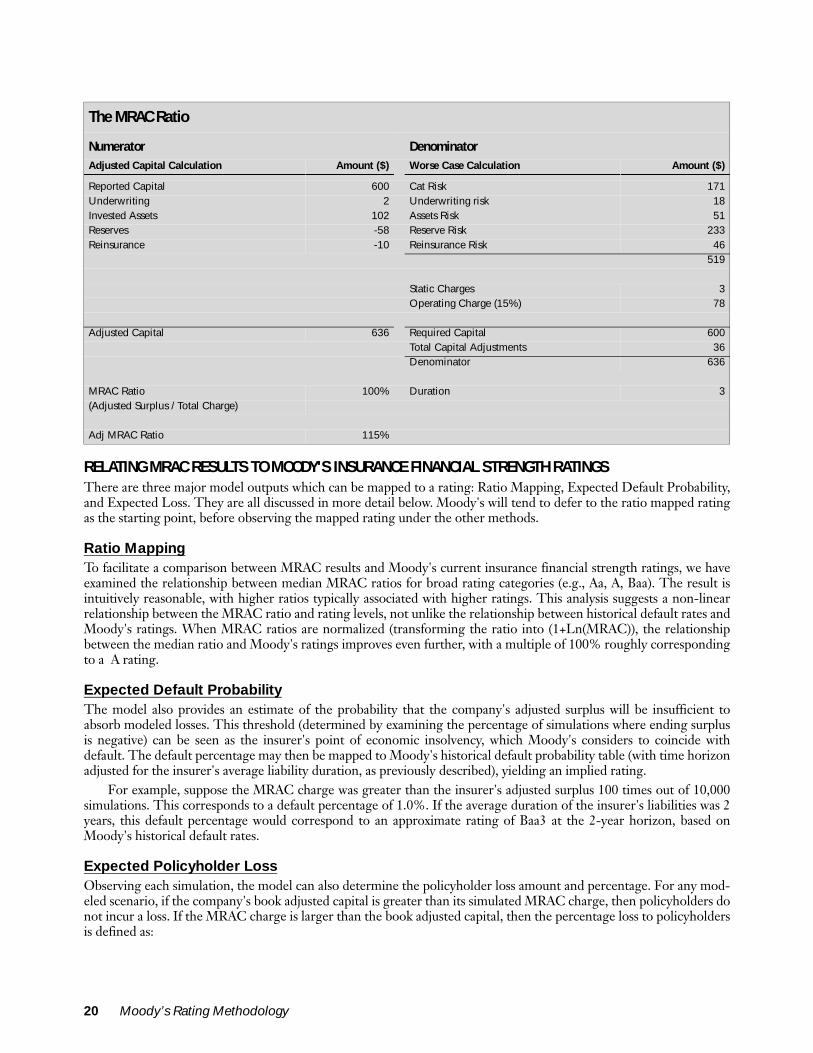
RELATING MRAC RESULTS TO MOODY'S INSURANCE FINANCIAL STRENGTH RATINGSThere are three major model outputs which can be mapped to a rating: Ratio Mapping, Expected Default Probability,and Expected Loss. They are all discussed in more detail below. Moody's will tend to defer to the ratio mapped ratingas the starting point, before observing the mapped rating under the other methods.
Ratio MappingTo facilitate a comparison between MRAC results and Moody's current insurance financial strength ratings, we haveexamined the relationship between median MRAC ratios for broad rating categories (e.g., Aa, A, Baa). The result isintuitively reasonable, with higher ratios typically associated with higher ratings. This analysis suggests a non-linearrelationship between the MRAC ratio and rating levels, not unlike the relationship between historical default rates andMoody's ratings. When MRAC ratios are normalized (transforming the ratio into (1+Ln(MRAC)), the relationshipbetween the median ratio and Moody's ratings improves even further, with a multiple of 100% roughly correspondingto a A rating.
Expected Default ProbabilityThe model also provides an estimate of the probability that the company's adjusted surplus will be insufficient toabsorb modeled losses. This threshold (determined by examining the percentage of simulations where ending surplusis negative) can be seen as the insurer's point of economic insolvency, which Moody's considers to coincide withdefault. The default percentage may then be mapped to Moody's historical default probability table (with time horizonadjusted for the insurer's average liability duration, as previously described), yielding an implied rating.
For example, suppose the MRAC charge was greater than the insurer's adjusted surplus 100 times out of 10,000simulations. This corresponds to a default percentage of 1.0%. If the average duration of the insurer's liabilities was 2years, this default percentage would correspond to an approximate rating of Baa3 at the 2-year horizon, based onMoody's historical default rates.
Expected Policyholder LossObserving each simulation, the model can also determine the policyholder loss amount and percentage. For any mod-eled scenario, if the company's book adjusted capital is greater than its simulated MRAC charge, then policyholders donot incur a loss. If the MRAC charge is larger than the book adjusted capital, then the percentage loss to policyholdersis defined as:
The MRAC Ratio
Numerator DenominatorAdjusted Capital Calculation Amount ($) Worse Case Calculation Amount ($)
Reported Capital 600 Cat Risk 171Underwriting 2 Underwriting risk 18Invested Assets 102 Assets Risk 51Reserves -58 Reserve Risk 233Reinsurance -10 Reinsurance Risk 46
519
Static Charges 3Operating Charge (15%) 78
Adjusted Capital 636 Required Capital 600Total Capital Adjustments 36Denominator 636
MRAC Ratio 100% Duration 3(Adjusted Surplus / Total Charge)
Adj MRAC Ratio 115%
20 Moody’s Rating Methodology
where Policyholder Liability = Losses (Balance Sheet) + LAE (Balance Sheet) + Reserve Charge +Ceded Reserve Charge + A&E Charge + A&E Reserve + Catastrophe Charge + Claims fromUnderwriting
Summing across all the simulations, one can compute the average of the percentage loss to policyholders - thisaverage is the Expected Loss rate on policyholder liabilities. This Expected Loss rate can then be mapped to animplied rating by reference to Moody's idealized expected loss table, using a time horizon consistent with the esti-mated duration of the insurer's liabilities. This implied rating, along with the ratings implied by the ratio mapping anddefault probability methods described above, can be useful to Moody's in assessing whether a particular insurer's ratingis an outlier relative to other ratings within the sector and across industries.
Liabilityer PolicyholdCapital AdjustedBook Charge MRAC −
Moody’s Rating Methodology 21
Related Research
Rating Methodology:North American Property and Casualty Insurance Top Ten Ratios, December 2004 (95210)Industry Outlooks:North American Property & Casualty Commercial Lines Insurance Industry Outlook , March 2006 (96744)Filling Cavities, Core Reserves No Longer the Main Concern for US P&C Insurers, December 2005 (80367)Global Reinsurance Industry Outlook, September 2005 (93985)U.S. Property & Casualty Personal Lines Insurance Industry Outlook, August 2005 (93987)Financial Reporting Assessments:The Property & Casualty Insurance Industry, January 2005 (91045)Property and Casualty Insurance Industry, December 2003 (80061) Update December 2004
To access any of these reports, click on the entry above. Note that these references are current as of the date of publication of thisreport and that more recent reports may be available. All research may not be available to all clients.
22 Moody’s Rating Methodology
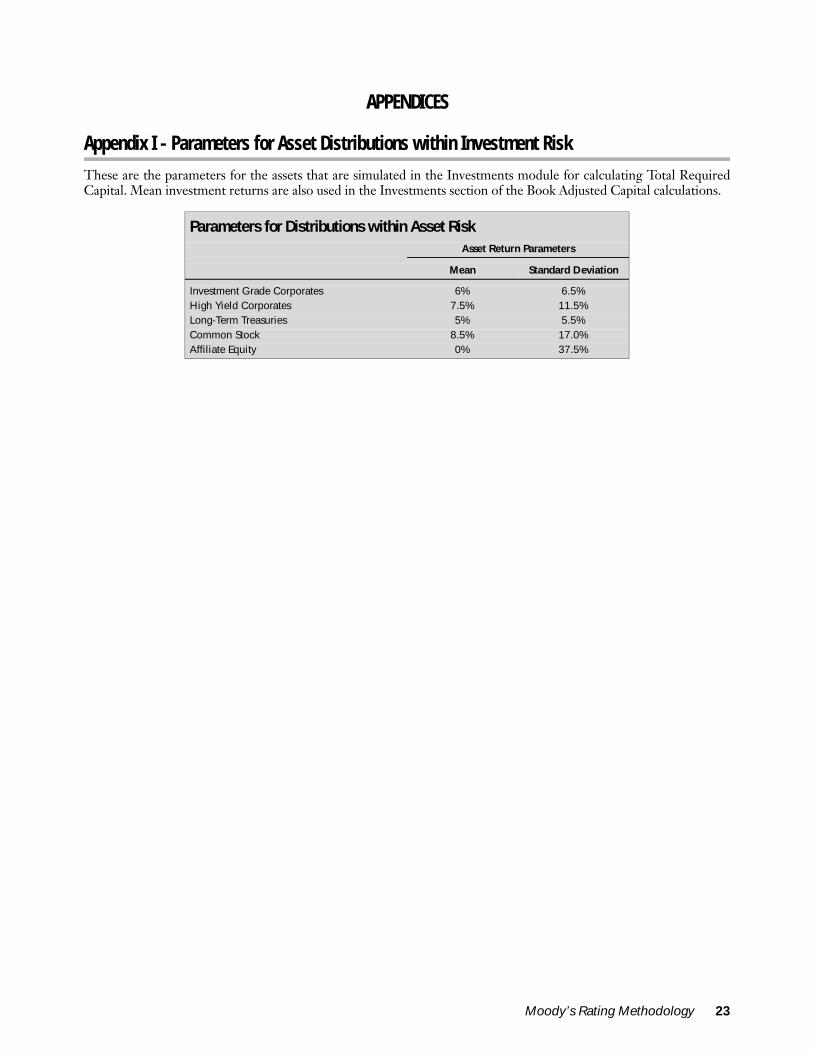
Moody’s Rating Methodology 23
APPENDICES
Appendix I - Parameters for Asset Distributions within Investment Risk
These are the parameters for the assets that are simulated in the Investments module for calculating Total RequiredCapital. Mean investment returns are also used in the Investments section of the Book Adjusted Capital calculations.
Parameters for Distributions within Asset RiskAsset Return Parameters
Mean Standard Deviation
Investment Grade Corporates 6% 6.5%High Yield Corporates 7.5% 11.5%Long-Term Treasuries 5% 5.5%Common Stock 8.5% 17.0%Affiliate Equity 0% 37.5%
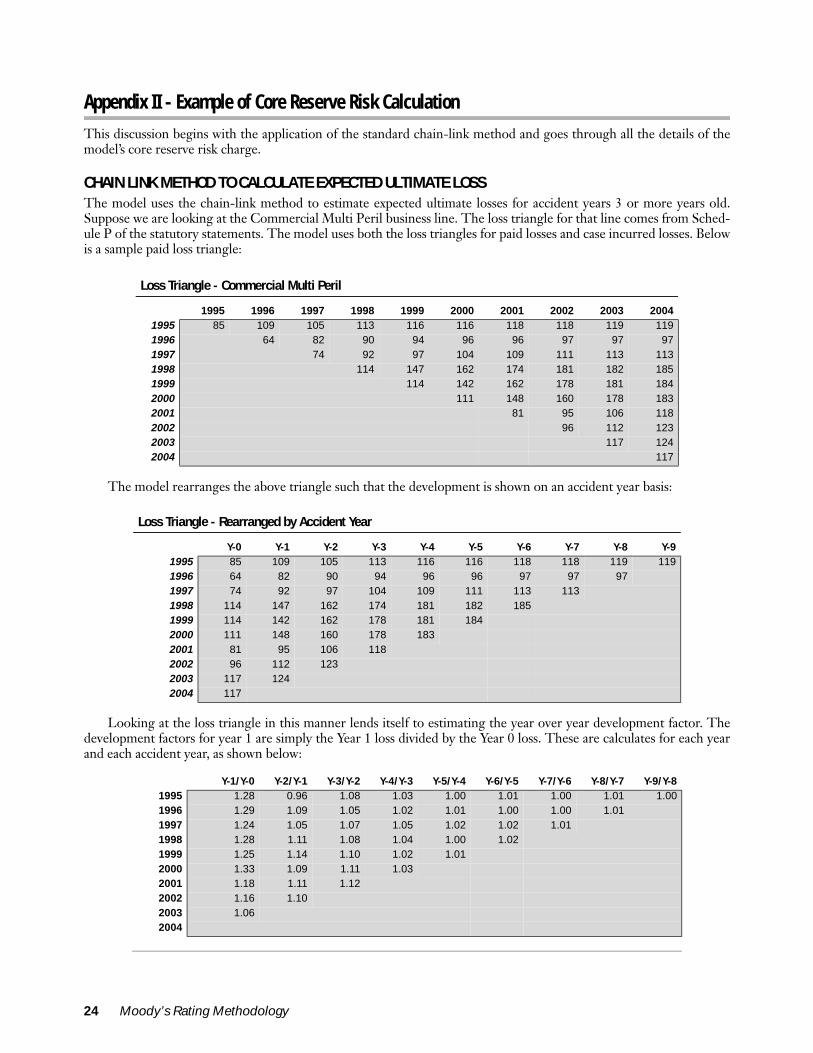
Appendix II - Example of Core Reserve Risk Calculation
This discussion begins with the application of the standard chain-link method and goes through all the details of themodel’s core reserve risk charge.
CHAIN LINK METHOD TO CALCULATE EXPECTED ULTIMATE LOSSThe model uses the chain-link method to estimate expected ultimate losses for accident years 3 or more years old.Suppose we are looking at the Commercial Multi Peril business line. The loss triangle for that line comes from Sched-ule P of the statutory statements. The model uses both the loss triangles for paid losses and case incurred losses. Belowis a sample paid loss triangle:
The model rearranges the above triangle such that the development is shown on an accident year basis:
Looking at the loss triangle in this manner lends itself to estimating the year over year development factor. Thedevelopment factors for year 1 are simply the Year 1 loss divided by the Year 0 loss. These are calculates for each yearand each accident year, as shown below:
Loss Triangle - Commercial Multi Peril
1995 1996 1997 1998 1999 2000 2001 2002 2003 20041995 85 109 105 113 116 116 118 118 119 1191996 64 82 90 94 96 96 97 97 971997 74 92 97 104 109 111 113 1131998 114 147 162 174 181 182 1851999 114 142 162 178 181 1842000 111 148 160 178 1832001 81 95 106 1182002 96 112 1232003 117 1242004 117
Loss Triangle - Rearranged by Accident Year
Y-0 Y-1 Y-2 Y-3 Y-4 Y-5 Y-6 Y-7 Y-8 Y-91995 85 109 105 113 116 116 118 118 119 1191996 64 82 90 94 96 96 97 97 971997 74 92 97 104 109 111 113 1131998 114 147 162 174 181 182 1851999 114 142 162 178 181 1842000 111 148 160 178 1832001 81 95 106 1182002 96 112 1232003 117 1242004 117
Y-1/Y-0 Y-2/Y-1 Y-3/Y-2 Y-4/Y-3 Y-5/Y-4 Y-6/Y-5 Y-7/Y-6 Y-8/Y-7 Y-9/Y-81995 1.28 0.96 1.08 1.03 1.00 1.01 1.00 1.01 1.001996 1.29 1.09 1.05 1.02 1.01 1.00 1.00 1.011997 1.24 1.05 1.07 1.05 1.02 1.02 1.011998 1.28 1.11 1.08 1.04 1.00 1.021999 1.25 1.14 1.10 1.02 1.012000 1.33 1.09 1.11 1.032001 1.18 1.11 1.122002 1.16 1.102003 1.062004
24 Moody’s Rating Methodology
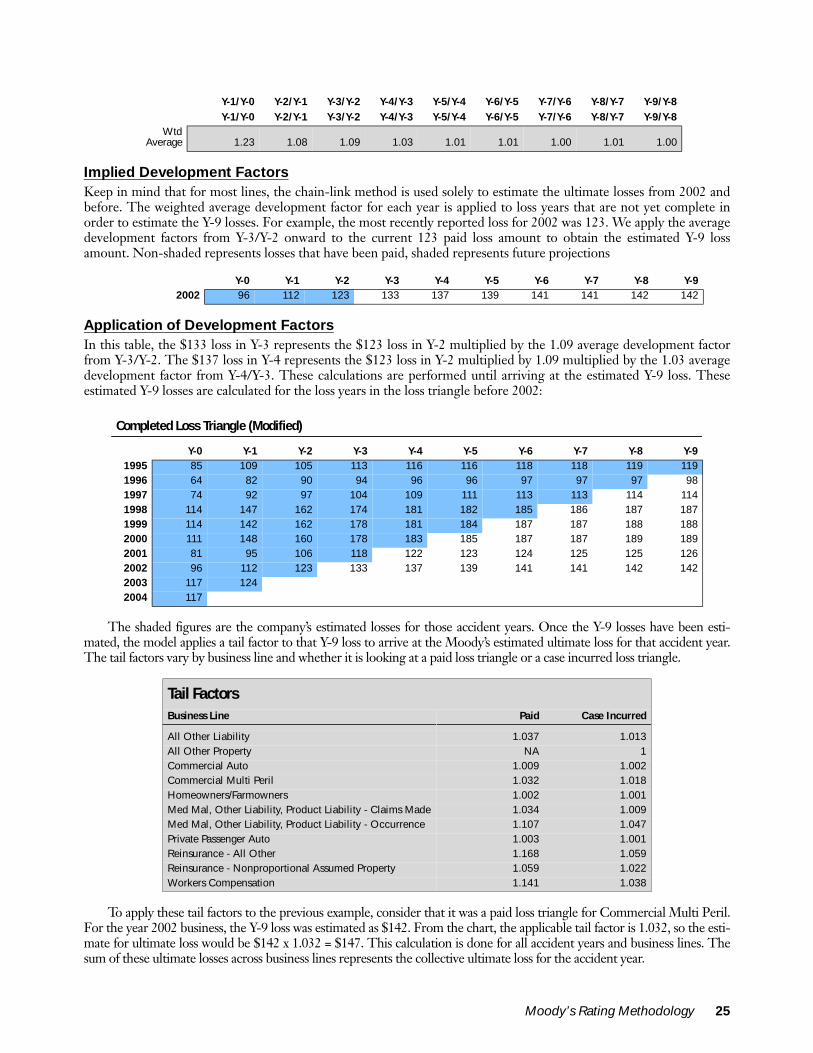
Implied Development FactorsKeep in mind that for most lines, the chain-link method is used solely to estimate the ultimate losses from 2002 andbefore. The weighted average development factor for each year is applied to loss years that are not yet complete inorder to estimate the Y-9 losses. For example, the most recently reported loss for 2002 was 123. We apply the averagedevelopment factors from Y-3/Y-2 onward to the current 123 paid loss amount to obtain the estimated Y-9 lossamount. Non-shaded represents losses that have been paid, shaded represents future projections
Application of Development FactorsIn this table, the $133 loss in Y-3 represents the $123 loss in Y-2 multiplied by the 1.09 average development factorfrom Y-3/Y-2. The $137 loss in Y-4 represents the $123 loss in Y-2 multiplied by 1.09 multiplied by the 1.03 averagedevelopment factor from Y-4/Y-3. These calculations are performed until arriving at the estimated Y-9 loss. Theseestimated Y-9 losses are calculated for the loss years in the loss triangle before 2002:
The shaded figures are the company’s estimated losses for those accident years. Once the Y-9 losses have been esti-mated, the model applies a tail factor to that Y-9 loss to arrive at the Moody’s estimated ultimate loss for that accident year.The tail factors vary by business line and whether it is looking at a paid loss triangle or a case incurred loss triangle.
To apply these tail factors to the previous example, consider that it was a paid loss triangle for Commercial Multi Peril.For the year 2002 business, the Y-9 loss was estimated as $142. From the chart, the applicable tail factor is 1.032, so the esti-mate for ultimate loss would be $142 x 1.032 = $147. This calculation is done for all accident years and business lines. Thesum of these ultimate losses across business lines represents the collective ultimate loss for the accident year.
Y-1/Y-0 Y-2/Y-1 Y-3/Y-2 Y-4/Y-3 Y-5/Y-4 Y-6/Y-5 Y-7/Y-6 Y-8/Y-7 Y-9/Y-8Wtd
Average 1.23 1.08 1.09 1.03 1.01 1.01 1.00 1.01 1.00
Y-0 Y-1 Y-2 Y-3 Y-4 Y-5 Y-6 Y-7 Y-8 Y-92002 96 112 123 133 137 139 141 141 142 142
Completed Loss Triangle (Modified)
Y-0 Y-1 Y-2 Y-3 Y-4 Y-5 Y-6 Y-7 Y-8 Y-91995 85 109 105 113 116 116 118 118 119 1191996 64 82 90 94 96 96 97 97 97 981997 74 92 97 104 109 111 113 113 114 1141998 114 147 162 174 181 182 185 186 187 1871999 114 142 162 178 181 184 187 187 188 1882000 111 148 160 178 183 185 187 187 189 1892001 81 95 106 118 122 123 124 125 125 1262002 96 112 123 133 137 139 141 141 142 1422003 117 1242004 117
Tail FactorsBusiness Line Paid Case Incurred
All Other Liability 1.037 1.013All Other Property NA 1Commercial Auto 1.009 1.002Commercial Multi Peril 1.032 1.018Homeowners/Farmowners 1.002 1.001Med Mal, Other Liability, Product Liability - Claims Made 1.034 1.009Med Mal, Other Liability, Product Liability - Occurrence 1.107 1.047Private Passenger Auto 1.003 1.001Reinsurance - All Other 1.168 1.059Reinsurance - Nonproportional Assumed Property 1.059 1.022Workers Compensation 1.141 1.038
Y-1/Y-0 Y-2/Y-1 Y-3/Y-2 Y-4/Y-3 Y-5/Y-4 Y-6/Y-5 Y-7/Y-6 Y-8/Y-7 Y-9/Y-8
Moody’s Rating Methodology 25
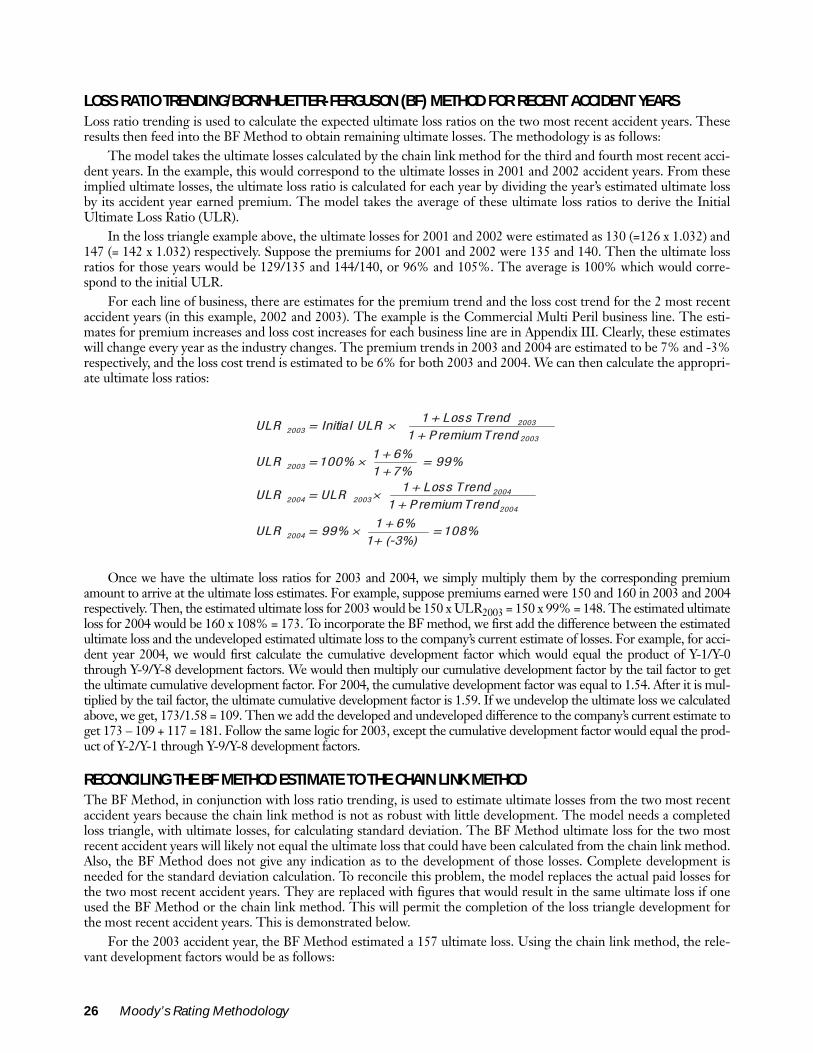
LOSS RATIO TRENDING/BORNHUETTER-FERGUSON (BF) METHOD FOR RECENT ACCIDENT YEARSLoss ratio trending is used to calculate the expected ultimate loss ratios on the two most recent accident years. Theseresults then feed into the BF Method to obtain remaining ultimate losses. The methodology is as follows:
The model takes the ultimate losses calculated by the chain link method for the third and fourth most recent acci-dent years. In the example, this would correspond to the ultimate losses in 2001 and 2002 accident years. From theseimplied ultimate losses, the ultimate loss ratio is calculated for each year by dividing the year’s estimated ultimate lossby its accident year earned premium. The model takes the average of these ultimate loss ratios to derive the InitialUltimate Loss Ratio (ULR).
In the loss triangle example above, the ultimate losses for 2001 and 2002 were estimated as 130 (=126 x 1.032) and147 (= 142 x 1.032) respectively. Suppose the premiums for 2001 and 2002 were 135 and 140. Then the ultimate lossratios for those years would be 129/135 and 144/140, or 96% and 105%. The average is 100% which would corre-spond to the initial ULR.
For each line of business, there are estimates for the premium trend and the loss cost trend for the 2 most recentaccident years (in this example, 2002 and 2003). The example is the Commercial Multi Peril business line. The esti-mates for premium increases and loss cost increases for each business line are in Appendix III. Clearly, these estimateswill change every year as the industry changes. The premium trends in 2003 and 2004 are estimated to be 7% and -3%respectively, and the loss cost trend is estimated to be 6% for both 2003 and 2004. We can then calculate the appropri-ate ultimate loss ratios:
Once we have the ultimate loss ratios for 2003 and 2004, we simply multiply them by the corresponding premiumamount to arrive at the ultimate loss estimates. For example, suppose premiums earned were 150 and 160 in 2003 and 2004respectively. Then, the estimated ultimate loss for 2003 would be 150 x ULR2003 = 150 x 99% = 148. The estimated ultimateloss for 2004 would be 160 x 108% = 173. To incorporate the BF method, we first add the difference between the estimatedultimate loss and the undeveloped estimated ultimate loss to the company’s current estimate of losses. For example, for acci-dent year 2004, we would first calculate the cumulative development factor which would equal the product of Y-1/Y-0through Y-9/Y-8 development factors. We would then multiply our cumulative development factor by the tail factor to getthe ultimate cumulative development factor. For 2004, the cumulative development factor was equal to 1.54. After it is mul-tiplied by the tail factor, the ultimate cumulative development factor is 1.59. If we undevelop the ultimate loss we calculatedabove, we get, 173/1.58 = 109. Then we add the developed and undeveloped difference to the company’s current estimate toget 173 – 109 + 117 = 181. Follow the same logic for 2003, except the cumulative development factor would equal the prod-uct of Y-2/Y-1 through Y-9/Y-8 development factors.
RECONCILING THE BF METHOD ESTIMATE TO THE CHAIN LINK METHODThe BF Method, in conjunction with loss ratio trending, is used to estimate ultimate losses from the two most recentaccident years because the chain link method is not as robust with little development. The model needs a completedloss triangle, with ultimate losses, for calculating standard deviation. The BF Method ultimate loss for the two mostrecent accident years will likely not equal the ultimate loss that could have been calculated from the chain link method.Also, the BF Method does not give any indication as to the development of those losses. Complete development isneeded for the standard deviation calculation. To reconcile this problem, the model replaces the actual paid losses forthe two most recent accident years. They are replaced with figures that would result in the same ultimate loss if oneused the BF Method or the chain link method. This will permit the completion of the loss triangle development forthe most recent accident years. This is demonstrated below.
For the 2003 accident year, the BF Method estimated a 157 ultimate loss. Using the chain link method, the rele-vant development factors would be as follows:
20032003
2003
2003
20042004 2003
2004
2004
1 + Loss T rendULR = Initial ULR ×
1 + P remium T rend
1 + 6%ULR = 100% × = 99%
1 + 7%1 + Loss T rend
ULR = ULR ×1 + P remium T rend
1 + 6%ULR = 99% × = 108%
1+ (-3%)
26 Moody’s Rating Methodology
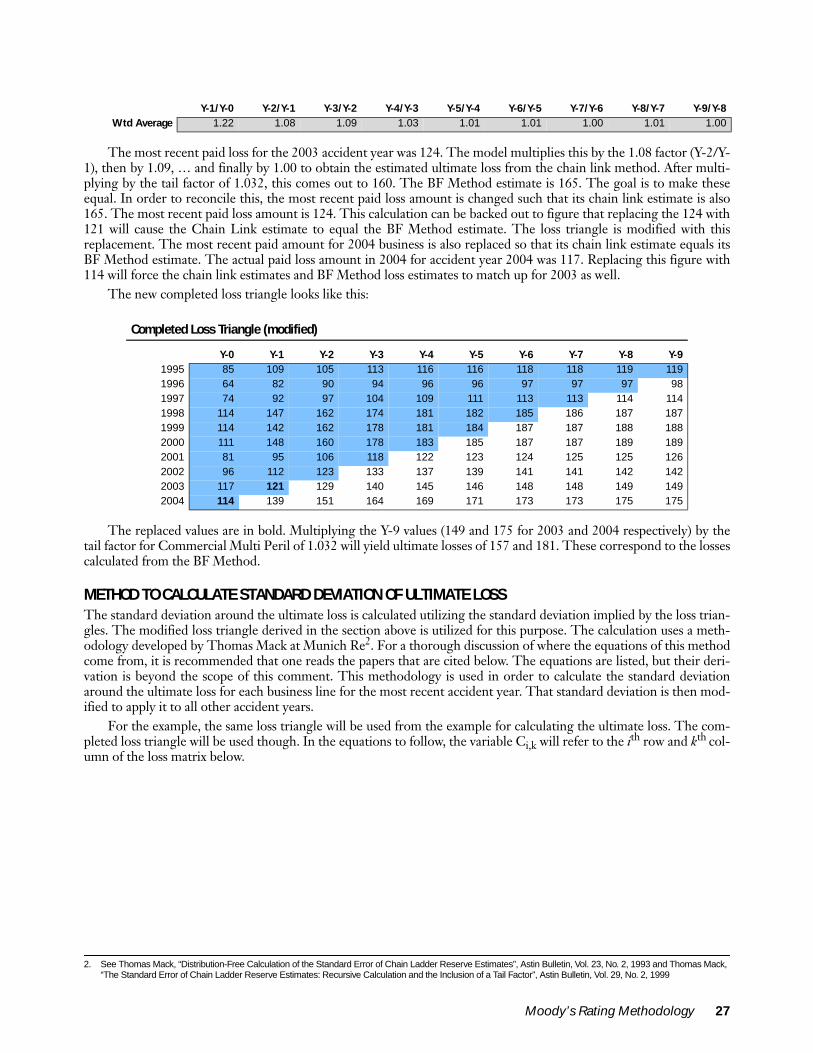
The most recent paid loss for the 2003 accident year was 124. The model multiplies this by the 1.08 factor (Y-2/Y-1), then by 1.09, … and finally by 1.00 to obtain the estimated ultimate loss from the chain link method. After multi-plying by the tail factor of 1.032, this comes out to 160. The BF Method estimate is 165. The goal is to make theseequal. In order to reconcile this, the most recent paid loss amount is changed such that its chain link estimate is also165. The most recent paid loss amount is 124. This calculation can be backed out to figure that replacing the 124 with121 will cause the Chain Link estimate to equal the BF Method estimate. The loss triangle is modified with thisreplacement. The most recent paid amount for 2004 business is also replaced so that its chain link estimate equals itsBF Method estimate. The actual paid loss amount in 2004 for accident year 2004 was 117. Replacing this figure with114 will force the chain link estimates and BF Method loss estimates to match up for 2003 as well.
The new completed loss triangle looks like this:
The replaced values are in bold. Multiplying the Y-9 values (149 and 175 for 2003 and 2004 respectively) by thetail factor for Commercial Multi Peril of 1.032 will yield ultimate losses of 157 and 181. These correspond to the lossescalculated from the BF Method.
METHOD TO CALCULATE STANDARD DEVIATION OF ULTIMATE LOSSThe standard deviation around the ultimate loss is calculated utilizing the standard deviation implied by the loss trian-gles. The modified loss triangle derived in the section above is utilized for this purpose. The calculation uses a meth-odology developed by Thomas Mack at Munich Re2. For a thorough discussion of where the equations of this methodcome from, it is recommended that one reads the papers that are cited below. The equations are listed, but their deri-vation is beyond the scope of this comment. This methodology is used in order to calculate the standard deviationaround the ultimate loss for each business line for the most recent accident year. That standard deviation is then mod-ified to apply it to all other accident years.
For the example, the same loss triangle will be used from the example for calculating the ultimate loss. The com-pleted loss triangle will be used though. In the equations to follow, the variable Ci,k will refer to the ith row and kth col-umn of the loss matrix below.
Y-1/Y-0 Y-2/Y-1 Y-3/Y-2 Y-4/Y-3 Y-5/Y-4 Y-6/Y-5 Y-7/Y-6 Y-8/Y-7 Y-9/Y-8Wtd Average 1.22 1.08 1.09 1.03 1.01 1.01 1.00 1.01 1.00
Completed Loss Triangle (modified)
Y-0 Y-1 Y-2 Y-3 Y-4 Y-5 Y-6 Y-7 Y-8 Y-91995 85 109 105 113 116 116 118 118 119 1191996 64 82 90 94 96 96 97 97 97 981997 74 92 97 104 109 111 113 113 114 1141998 114 147 162 174 181 182 185 186 187 1871999 114 142 162 178 181 184 187 187 188 1882000 111 148 160 178 183 185 187 187 189 1892001 81 95 106 118 122 123 124 125 125 1262002 96 112 123 133 137 139 141 141 142 1422003 117 121 129 140 145 146 148 148 149 1492004 114 139 151 164 169 171 173 173 175 175
2. See Thomas Mack, “Distribution-Free Calculation of the Standard Error of Chain Ladder Reserve Estimates”, Astin Bulletin, Vol. 23, No. 2, 1993 and Thomas Mack, “The Standard Error of Chain Ladder Reserve Estimates: Recursive Calculation and the Inclusion of a Tail Factor”, Astin Bulletin, Vol. 29, No. 2, 1999
Moody’s Rating Methodology 27
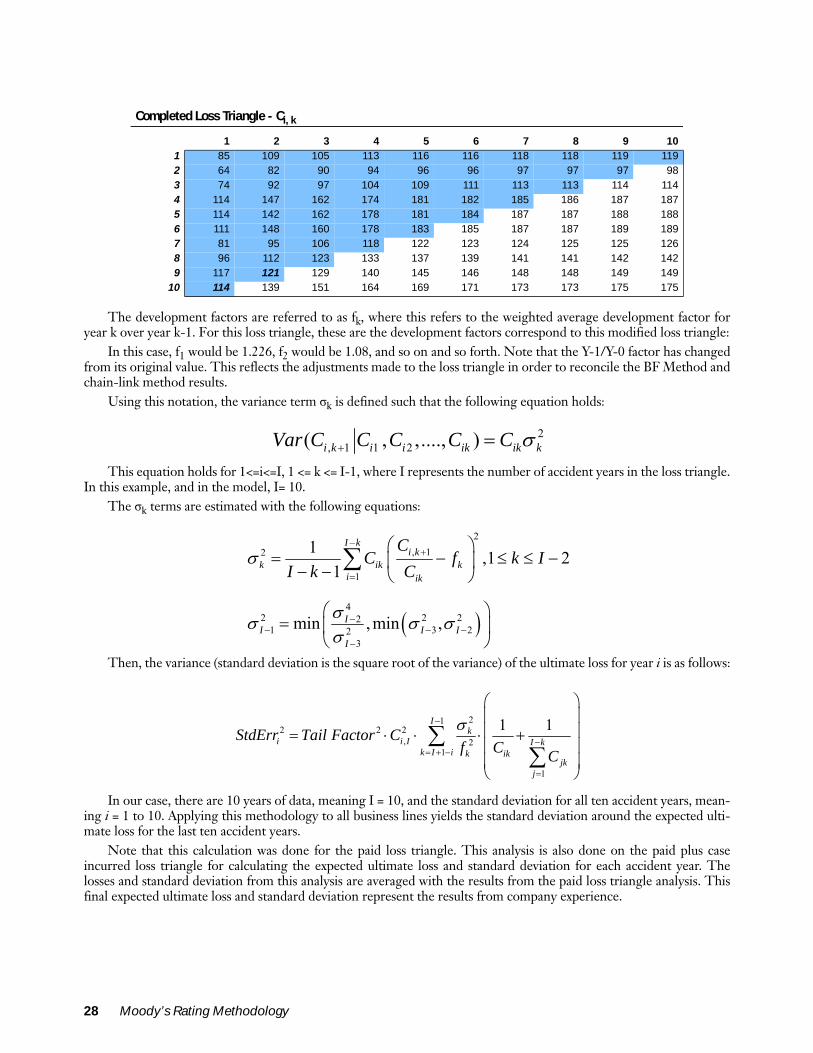
The development factors are referred to as fk, where this refers to the weighted average development factor foryear k over year k-1. For this loss triangle, these are the development factors correspond to this modified loss triangle:
In this case, f1 would be 1.226, f2 would be 1.08, and so on and so forth. Note that the Y-1/Y-0 factor has changedfrom its original value. This reflects the adjustments made to the loss triangle in order to reconcile the BF Method andchain-link method results.
Using this notation, the variance term σk is defined such that the following equation holds:
This equation holds for 1<=i<=I, 1 <= k <= I-1, where I represents the number of accident years in the loss triangle.In this example, and in the model, I= 10.
The σk terms are estimated with the following equations:
Then, the variance (standard deviation is the square root of the variance) of the ultimate loss for year i is as follows:
In our case, there are 10 years of data, meaning I = 10, and the standard deviation for all ten accident years, mean-ing i = 1 to 10. Applying this methodology to all business lines yields the standard deviation around the expected ulti-mate loss for the last ten accident years.
Note that this calculation was done for the paid loss triangle. This analysis is also done on the paid plus caseincurred loss triangle for calculating the expected ultimate loss and standard deviation for each accident year. Thelosses and standard deviation from this analysis are averaged with the results from the paid loss triangle analysis. Thisfinal expected ultimate loss and standard deviation represent the results from company experience.
Completed Loss Triangle - Ci, k
1 2 3 4 5 6 7 8 9 101 85 109 105 113 116 116 118 118 119 1192 64 82 90 94 96 96 97 97 97 983 74 92 97 104 109 111 113 113 114 1144 114 147 162 174 181 182 185 186 187 1875 114 142 162 178 181 184 187 187 188 1886 111 148 160 178 183 185 187 187 189 1897 81 95 106 118 122 123 124 125 125 1268 96 112 123 133 137 139 141 141 142 1429 117 121 129 140 145 146 148 148 149 149
10 114 139 151 164 169 171 173 173 175 175
2, 1 1 2( , ,...., )i k i i ik ik kVar C C C C C σ+ =
( )
2, 12
1
42 2 22
1 3 223
1 ,1 21
min , min ,
I ki k
k ik ki ik
II I I
I
CC f k I
I k Cσ
σσ σ σσ
−+
=
−− − −
−
= − ≤ ≤ − − −
=
∑
212 2 2
, 21
1
1 1Ik
i i I I kk I i k ik
jkj
StdErr Tail Factor Cf C C
σ−
−= + −
=
= ⋅ ⋅ ⋅ +
∑∑
28 Moody’s Rating Methodology
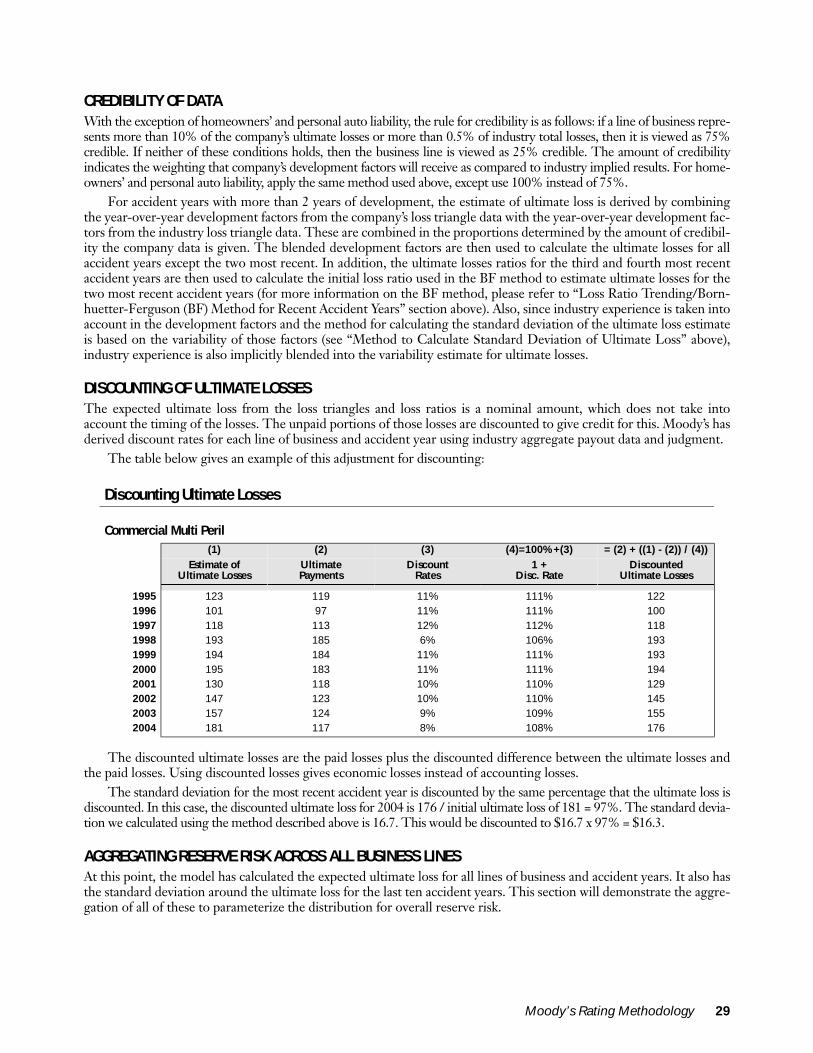
CREDIBILITY OF DATAWith the exception of homeowners’ and personal auto liability, the rule for credibility is as follows: if a line of business repre-sents more than 10% of the company’s ultimate losses or more than 0.5% of industry total losses, then it is viewed as 75%credible. If neither of these conditions holds, then the business line is viewed as 25% credible. The amount of credibilityindicates the weighting that company’s development factors will receive as compared to industry implied results. For home-owners’ and personal auto liability, apply the same method used above, except use 100% instead of 75%.
For accident years with more than 2 years of development, the estimate of ultimate loss is derived by combiningthe year-over-year development factors from the company’s loss triangle data with the year-over-year development fac-tors from the industry loss triangle data. These are combined in the proportions determined by the amount of credibil-ity the company data is given. The blended development factors are then used to calculate the ultimate losses for allaccident years except the two most recent. In addition, the ultimate losses ratios for the third and fourth most recentaccident years are then used to calculate the initial loss ratio used in the BF method to estimate ultimate losses for thetwo most recent accident years (for more information on the BF method, please refer to “Loss Ratio Trending/Born-huetter-Ferguson (BF) Method for Recent Accident Years” section above). Also, since industry experience is taken intoaccount in the development factors and the method for calculating the standard deviation of the ultimate loss estimateis based on the variability of those factors (see “Method to Calculate Standard Deviation of Ultimate Loss” above),industry experience is also implicitly blended into the variability estimate for ultimate losses.
DISCOUNTING OF ULTIMATE LOSSESThe expected ultimate loss from the loss triangles and loss ratios is a nominal amount, which does not take intoaccount the timing of the losses. The unpaid portions of those losses are discounted to give credit for this. Moody’s hasderived discount rates for each line of business and accident year using industry aggregate payout data and judgment.
The table below gives an example of this adjustment for discounting:
The discounted ultimate losses are the paid losses plus the discounted difference between the ultimate losses andthe paid losses. Using discounted losses gives economic losses instead of accounting losses.
The standard deviation for the most recent accident year is discounted by the same percentage that the ultimate loss isdiscounted. In this case, the discounted ultimate loss for 2004 is 176 / initial ultimate loss of 181 = 97%. The standard devia-tion we calculated using the method described above is 16.7. This would be discounted to $16.7 x 97% = $16.3.
AGGREGATING RESERVE RISK ACROSS ALL BUSINESS LINESAt this point, the model has calculated the expected ultimate loss for all lines of business and accident years. It also hasthe standard deviation around the ultimate loss for the last ten accident years. This section will demonstrate the aggre-gation of all of these to parameterize the distribution for overall reserve risk.
Discounting Ultimate Losses
Commercial Multi Peril(1) (2) (3) (4)=100%+(3) = (2) + ((1) - (2)) / (4))
Estimate of Ultimate Losses
Ultimate Payments
Discount Rates
1 + Disc. Rate
Discounted Ultimate Losses
1995 123 119 11% 111% 1221996 101 97 11% 111% 1001997 118 113 12% 112% 1181998 193 185 6% 106% 1931999 194 184 11% 111% 1932000 195 183 11% 111% 1942001 130 118 10% 110% 1292002 147 123 10% 110% 1452003 157 124 9% 109% 1552004 181 117 8% 108% 176
Moody’s Rating Methodology 29
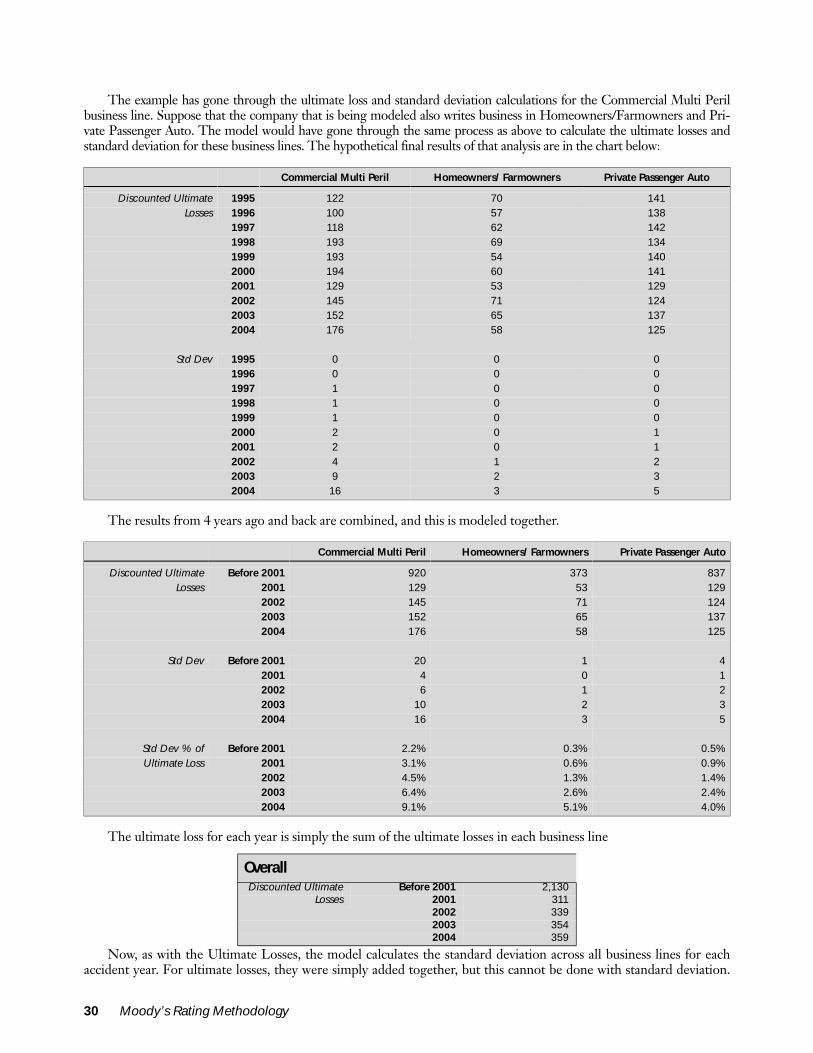
The example has gone through the ultimate loss and standard deviation calculations for the Commercial Multi Perilbusiness line. Suppose that the company that is being modeled also writes business in Homeowners/Farmowners and Pri-vate Passenger Auto. The model would have gone through the same process as above to calculate the ultimate losses andstandard deviation for these business lines. The hypothetical final results of that analysis are in the chart below:
The results from 4 years ago and back are combined, and this is modeled together.
The ultimate loss for each year is simply the sum of the ultimate losses in each business line
Now, as with the Ultimate Losses, the model calculates the standard deviation across all business lines for eachaccident year. For ultimate losses, they were simply added together, but this cannot be done with standard deviation.
Commercial Multi Peril Homeowners/ Farmowners Private Passenger Auto
Discounted Ultimate 1995 122 70 141Losses 1996 100 57 138
1997 118 62 1421998 193 69 1341999 193 54 1402000 194 60 1412001 129 53 1292002 145 71 1242003 152 65 1372004 176 58 125
Std Dev 1995 0 0 01996 0 0 01997 1 0 01998 1 0 01999 1 0 02000 2 0 12001 2 0 12002 4 1 22003 9 2 32004 16 3 5
Commercial Multi Peril Homeowners/ Farmowners Private Passenger Auto
Discounted Ultimate Before 2001 920 373 837Losses 2001 129 53 129
2002 145 71 1242003 152 65 1372004 176 58 125
Std Dev Before 2001 20 1 42001 4 0 12002 6 1 22003 10 2 32004 16 3 5
Std Dev % of Before 2001 2.2% 0.3% 0.5%Ultimate Loss 2001 3.1% 0.6% 0.9%
2002 4.5% 1.3% 1.4%2003 6.4% 2.6% 2.4%2004 9.1% 5.1% 4.0%
OverallDiscounted Ultimate Before 2001 2,130
Losses 2001 3112002 3392003 3542004 359
30 Moody’s Rating Methodology
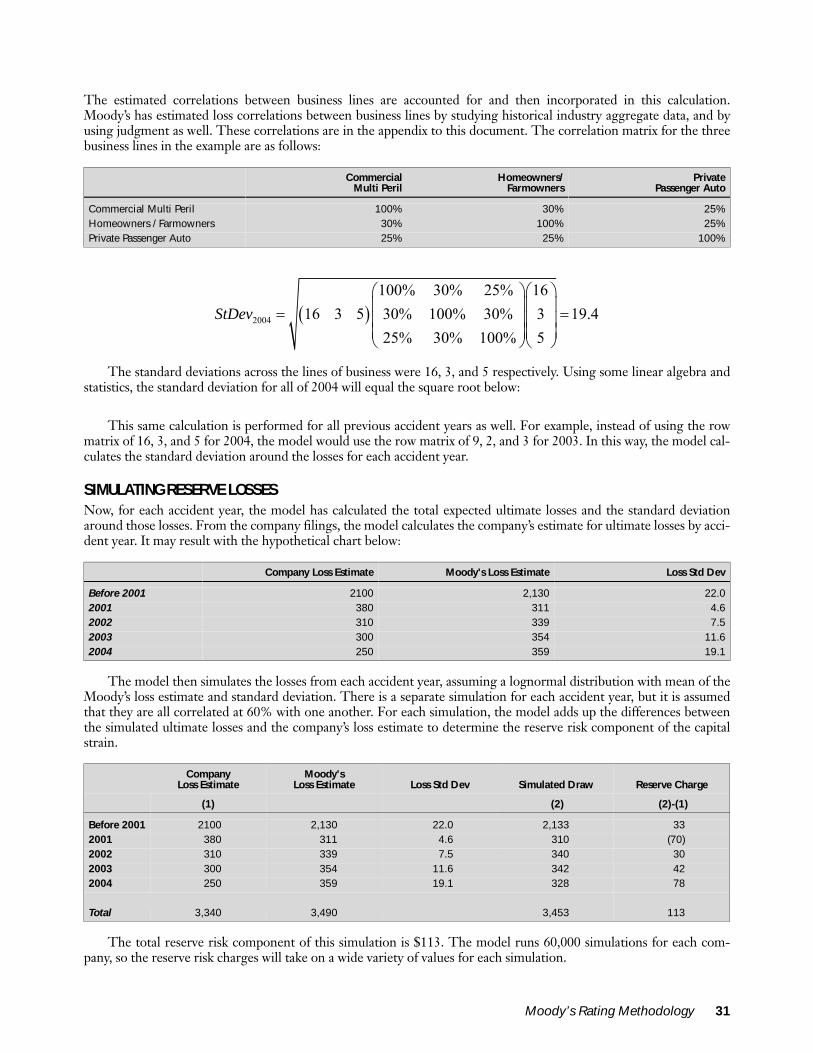
The estimated correlations between business lines are accounted for and then incorporated in this calculation.Moody’s has estimated loss correlations between business lines by studying historical industry aggregate data, and byusing judgment as well. These correlations are in the appendix to this document. The correlation matrix for the threebusiness lines in the example are as follows:
The standard deviations across the lines of business were 16, 3, and 5 respectively. Using some linear algebra andstatistics, the standard deviation for all of 2004 will equal the square root below:
This same calculation is performed for all previous accident years as well. For example, instead of using the rowmatrix of 16, 3, and 5 for 2004, the model would use the row matrix of 9, 2, and 3 for 2003. In this way, the model cal-culates the standard deviation around the losses for each accident year.
SIMULATING RESERVE LOSSESNow, for each accident year, the model has calculated the total expected ultimate losses and the standard deviationaround those losses. From the company filings, the model calculates the company’s estimate for ultimate losses by acci-dent year. It may result with the hypothetical chart below:
The model then simulates the losses from each accident year, assuming a lognormal distribution with mean of theMoody’s loss estimate and standard deviation. There is a separate simulation for each accident year, but it is assumedthat they are all correlated at 60% with one another. For each simulation, the model adds up the differences betweenthe simulated ultimate losses and the company’s loss estimate to determine the reserve risk component of the capitalstrain.
The total reserve risk component of this simulation is $113. The model runs 60,000 simulations for each com-pany, so the reserve risk charges will take on a wide variety of values for each simulation.
CommercialMulti Peril
Homeowners/Farmowners
PrivatePassenger Auto
Commercial Multi Peril 100% 30% 25%Homeowners / Farmowners 30% 100% 25%Private Passenger Auto 25% 25% 100%
Company Loss Estimate Moody's Loss Estimate Loss Std Dev
Before 2001 2100 2,130 22.02001 380 311 4.62002 310 339 7.52003 300 354 11.62004 250 359 19.1
Company Loss Estimate
Moody's Loss Estimate Loss Std Dev Simulated Draw Reserve Charge
(1) (2) (2)-(1)
Before 2001 2100 2,130 22.0 2,133 332001 380 311 4.6 310 (70)2002 310 339 7.5 340 302003 300 354 11.6 342 422004 250 359 19.1 328 78
Total 3,340 3,490 3,453 113
( )2004
100% 30% 25% 1616 3 5 30% 100% 30% 3 19.4
25% 30% 100% 5StDev
= =
Moody’s Rating Methodology 31
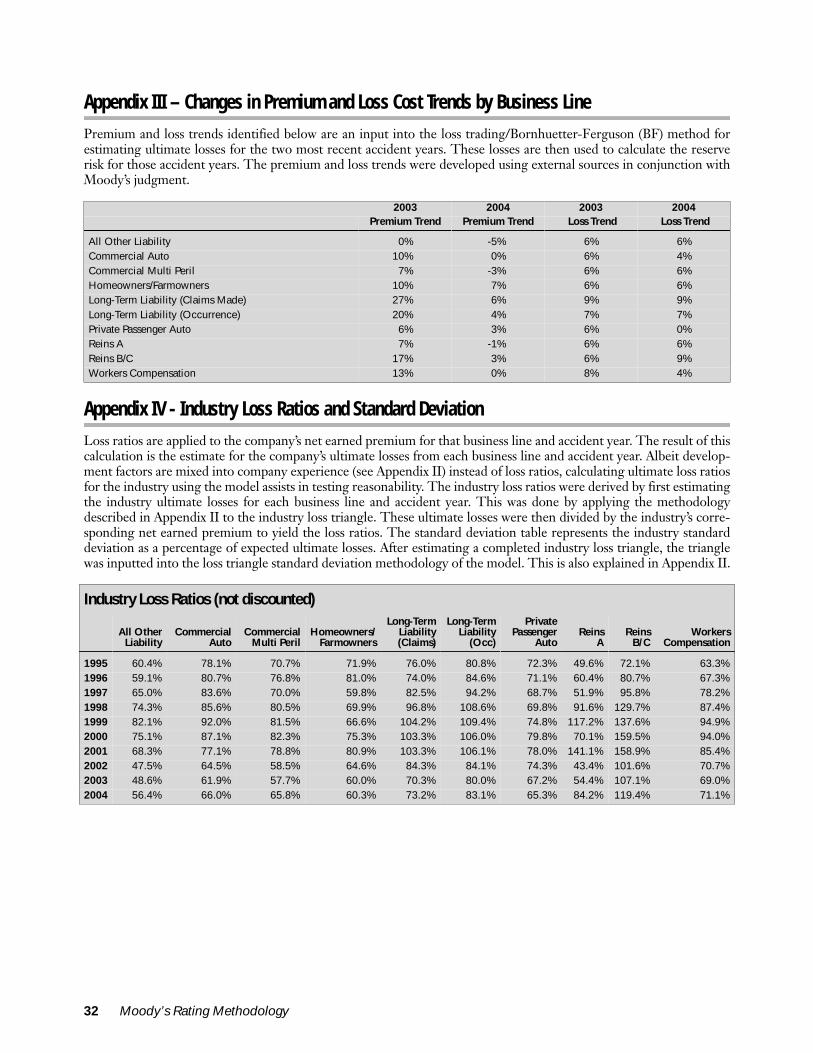
Appendix III – Changes in Premium and Loss Cost Trends by Business Line
Premium and loss trends identified below are an input into the loss trading/Bornhuetter-Ferguson (BF) method forestimating ultimate losses for the two most recent accident years. These losses are then used to calculate the reserverisk for those accident years. The premium and loss trends were developed using external sources in conjunction withMoody’s judgment.
Appendix IV - Industry Loss Ratios and Standard Deviation
Loss ratios are applied to the company’s net earned premium for that business line and accident year. The result of thiscalculation is the estimate for the company’s ultimate losses from each business line and accident year. Albeit develop-ment factors are mixed into company experience (see Appendix II) instead of loss ratios, calculating ultimate loss ratiosfor the industry using the model assists in testing reasonability. The industry loss ratios were derived by first estimatingthe industry ultimate losses for each business line and accident year. This was done by applying the methodologydescribed in Appendix II to the industry loss triangle. These ultimate losses were then divided by the industry’s corre-sponding net earned premium to yield the loss ratios. The standard deviation table represents the industry standarddeviation as a percentage of expected ultimate losses. After estimating a completed industry loss triangle, the trianglewas inputted into the loss triangle standard deviation methodology of the model. This is also explained in Appendix II.
2003 2004 2003 2004Premium Trend Premium Trend Loss Trend Loss Trend
All Other Liability 0% -5% 6% 6%Commercial Auto 10% 0% 6% 4%Commercial Multi Peril 7% -3% 6% 6%Homeowners/Farmowners 10% 7% 6% 6%Long-Term Liability (Claims Made) 27% 6% 9% 9%Long-Term Liability (Occurrence) 20% 4% 7% 7%Private Passenger Auto 6% 3% 6% 0%Reins A 7% -1% 6% 6%Reins B/C 17% 3% 6% 9%Workers Compensation 13% 0% 8% 4%
Industry Loss Ratios (not discounted)
All Other Liability
CommercialAuto
CommercialMulti Peril
Homeowners/ Farmowners
Long-Term Liability(Claims)
Long-Term Liability
(Occ)
Private Passenger
AutoReins
AReins
B/CWorkers
Compensation
1995 60.4% 78.1% 70.7% 71.9% 76.0% 80.8% 72.3% 49.6% 72.1% 63.3%1996 59.1% 80.7% 76.8% 81.0% 74.0% 84.6% 71.1% 60.4% 80.7% 67.3%1997 65.0% 83.6% 70.0% 59.8% 82.5% 94.2% 68.7% 51.9% 95.8% 78.2%1998 74.3% 85.6% 80.5% 69.9% 96.8% 108.6% 69.8% 91.6% 129.7% 87.4%1999 82.1% 92.0% 81.5% 66.6% 104.2% 109.4% 74.8% 117.2% 137.6% 94.9%2000 75.1% 87.1% 82.3% 75.3% 103.3% 106.0% 79.8% 70.1% 159.5% 94.0%2001 68.3% 77.1% 78.8% 80.9% 103.3% 106.1% 78.0% 141.1% 158.9% 85.4%2002 47.5% 64.5% 58.5% 64.6% 84.3% 84.1% 74.3% 43.4% 101.6% 70.7%2003 48.6% 61.9% 57.7% 60.0% 70.3% 80.0% 67.2% 54.4% 107.1% 69.0%2004 56.4% 66.0% 65.8% 60.3% 73.2% 83.1% 65.3% 84.2% 119.4% 71.1%
32 Moody’s Rating Methodology
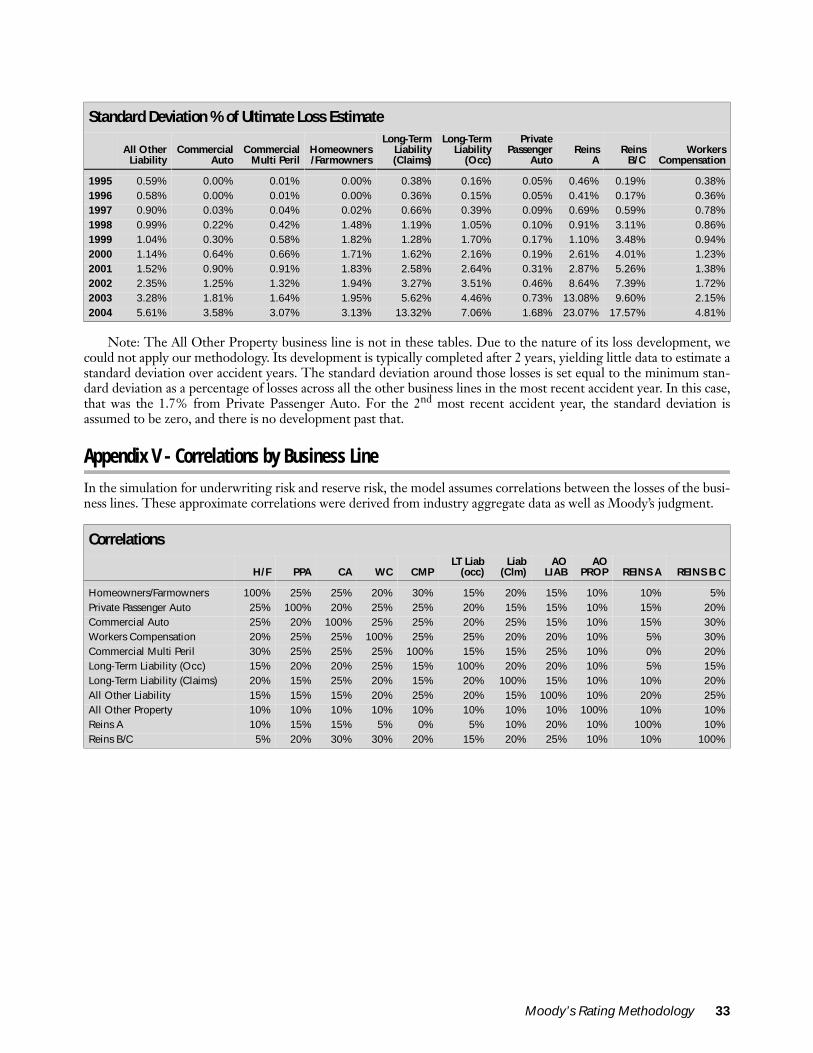
Note: The All Other Property business line is not in these tables. Due to the nature of its loss development, wecould not apply our methodology. Its development is typically completed after 2 years, yielding little data to estimate astandard deviation over accident years. The standard deviation around those losses is set equal to the minimum stan-dard deviation as a percentage of losses across all the other business lines in the most recent accident year. In this case,that was the 1.7% from Private Passenger Auto. For the 2nd most recent accident year, the standard deviation isassumed to be zero, and there is no development past that.
Appendix V - Correlations by Business Line
In the simulation for underwriting risk and reserve risk, the model assumes correlations between the losses of the busi-ness lines. These approximate correlations were derived from industry aggregate data as well as Moody’s judgment.
Standard Deviation % of Ultimate Loss Estimate
All Other Liability
Commercial Auto
Commercial Multi Peril
Homeowners/Farmowners
Long-Term Liability (Claims)
Long-Term Liability
(Occ)
Private Passenger
AutoReins
AReins
B/CWorkers
Compensation
1995 0.59% 0.00% 0.01% 0.00% 0.38% 0.16% 0.05% 0.46% 0.19% 0.38%1996 0.58% 0.00% 0.01% 0.00% 0.36% 0.15% 0.05% 0.41% 0.17% 0.36%1997 0.90% 0.03% 0.04% 0.02% 0.66% 0.39% 0.09% 0.69% 0.59% 0.78%1998 0.99% 0.22% 0.42% 1.48% 1.19% 1.05% 0.10% 0.91% 3.11% 0.86%1999 1.04% 0.30% 0.58% 1.82% 1.28% 1.70% 0.17% 1.10% 3.48% 0.94%2000 1.14% 0.64% 0.66% 1.71% 1.62% 2.16% 0.19% 2.61% 4.01% 1.23%2001 1.52% 0.90% 0.91% 1.83% 2.58% 2.64% 0.31% 2.87% 5.26% 1.38%2002 2.35% 1.25% 1.32% 1.94% 3.27% 3.51% 0.46% 8.64% 7.39% 1.72%2003 3.28% 1.81% 1.64% 1.95% 5.62% 4.46% 0.73% 13.08% 9.60% 2.15%2004 5.61% 3.58% 3.07% 3.13% 13.32% 7.06% 1.68% 23.07% 17.57% 4.81%
Correlations
H/F PPA CA WC CMPLT Liab
(occ)Liab
(Clm)AO
LIABAO
PROP REINS A REINS B C
Homeowners/Farmowners 100% 25% 25% 20% 30% 15% 20% 15% 10% 10% 5%Private Passenger Auto 25% 100% 20% 25% 25% 20% 15% 15% 10% 15% 20%Commercial Auto 25% 20% 100% 25% 25% 20% 25% 15% 10% 15% 30%Workers Compensation 20% 25% 25% 100% 25% 25% 20% 20% 10% 5% 30%Commercial Multi Peril 30% 25% 25% 25% 100% 15% 15% 25% 10% 0% 20%Long-Term Liability (Occ) 15% 20% 20% 25% 15% 100% 20% 20% 10% 5% 15%Long-Term Liability (Claims) 20% 15% 25% 20% 15% 20% 100% 15% 10% 10% 20%All Other Liability 15% 15% 15% 20% 25% 20% 15% 100% 10% 20% 25%All Other Property 10% 10% 10% 10% 10% 10% 10% 10% 100% 10% 10%Reins A 10% 15% 15% 5% 0% 5% 10% 20% 10% 100% 10%Reins B/C 5% 20% 30% 30% 20% 15% 20% 25% 10% 10% 100%
Moody’s Rating Methodology 33
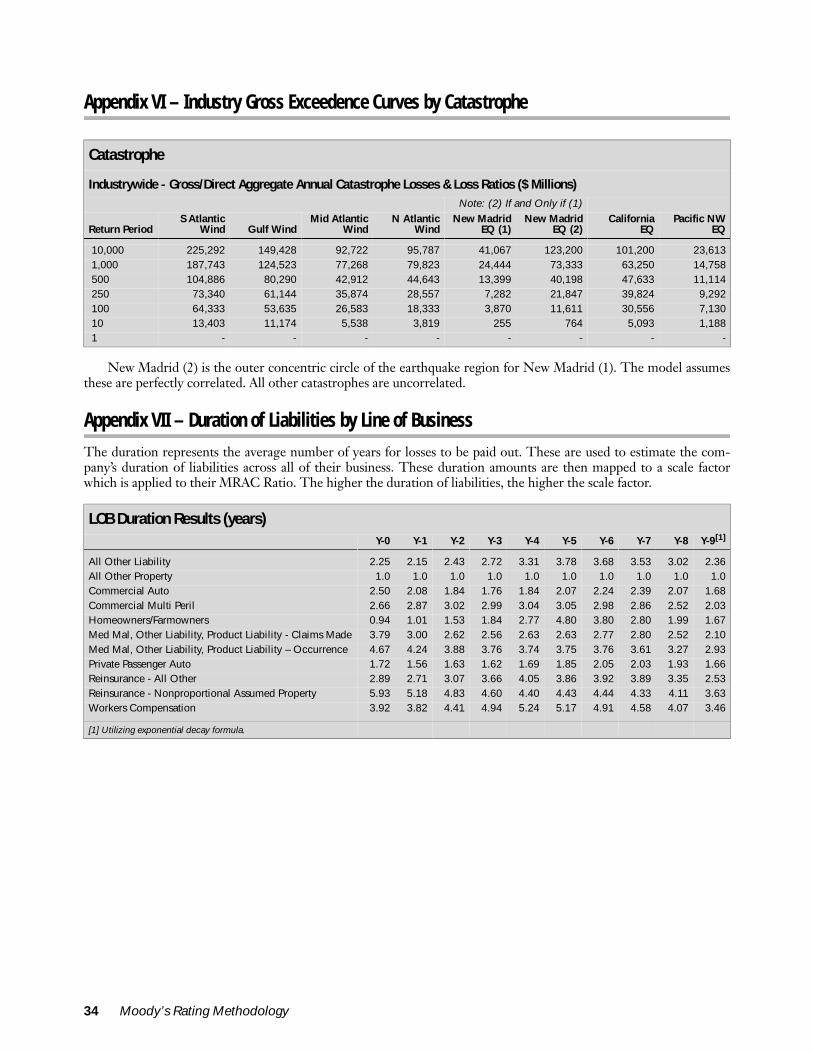
Appendix VI – Industry Gross Exceedence Curves by Catastrophe
New Madrid (2) is the outer concentric circle of the earthquake region for New Madrid (1). The model assumesthese are perfectly correlated. All other catastrophes are uncorrelated.
Appendix VII – Duration of Liabilities by Line of Business
The duration represents the average number of years for losses to be paid out. These are used to estimate the com-pany’s duration of liabilities across all of their business. These duration amounts are then mapped to a scale factorwhich is applied to their MRAC Ratio. The higher the duration of liabilities, the higher the scale factor.
Catastrophe
Industrywide - Gross/Direct Aggregate Annual Catastrophe Losses & Loss Ratios ($ Millions)Note: (2) If and Only if (1)
Return PeriodS Atlantic
Wind Gulf WindMid Atlantic
WindN Atlantic
WindNew Madrid
EQ (1)New Madrid
EQ (2)California
EQPacific NW
EQ
10,000 225,292 149,428 92,722 95,787 41,067 123,200 101,200 23,613 1,000 187,743 124,523 77,268 79,823 24,444 73,333 63,250 14,758 500 104,886 80,290 42,912 44,643 13,399 40,198 47,633 11,114 250 73,340 61,144 35,874 28,557 7,282 21,847 39,824 9,292 100 64,333 53,635 26,583 18,333 3,870 11,611 30,556 7,130 10 13,403 11,174 5,538 3,819 255 764 5,093 1,188 1 - - - - - - - -
LOB Duration Results (years)Y-0 Y-1 Y-2 Y-3 Y-4 Y-5 Y-6 Y-7 Y-8 Y-9[1]
All Other Liability 2.25 2.15 2.43 2.72 3.31 3.78 3.68 3.53 3.02 2.36All Other Property 1.0 1.0 1.0 1.0 1.0 1.0 1.0 1.0 1.0 1.0Commercial Auto 2.50 2.08 1.84 1.76 1.84 2.07 2.24 2.39 2.07 1.68Commercial Multi Peril 2.66 2.87 3.02 2.99 3.04 3.05 2.98 2.86 2.52 2.03Homeowners/Farmowners 0.94 1.01 1.53 1.84 2.77 4.80 3.80 2.80 1.99 1.67Med Mal, Other Liability, Product Liability - Claims Made 3.79 3.00 2.62 2.56 2.63 2.63 2.77 2.80 2.52 2.10Med Mal, Other Liability, Product Liability – Occurrence 4.67 4.24 3.88 3.76 3.74 3.75 3.76 3.61 3.27 2.93Private Passenger Auto 1.72 1.56 1.63 1.62 1.69 1.85 2.05 2.03 1.93 1.66Reinsurance - All Other 2.89 2.71 3.07 3.66 4.05 3.86 3.92 3.89 3.35 2.53Reinsurance - Nonproportional Assumed Property 5.93 5.18 4.83 4.60 4.40 4.43 4.44 4.33 4.11 3.63Workers Compensation 3.92 3.82 4.41 4.94 5.24 5.17 4.91 4.58 4.07 3.46
[1] Utilizing exponential decay formula.
34 Moody’s Rating Methodology
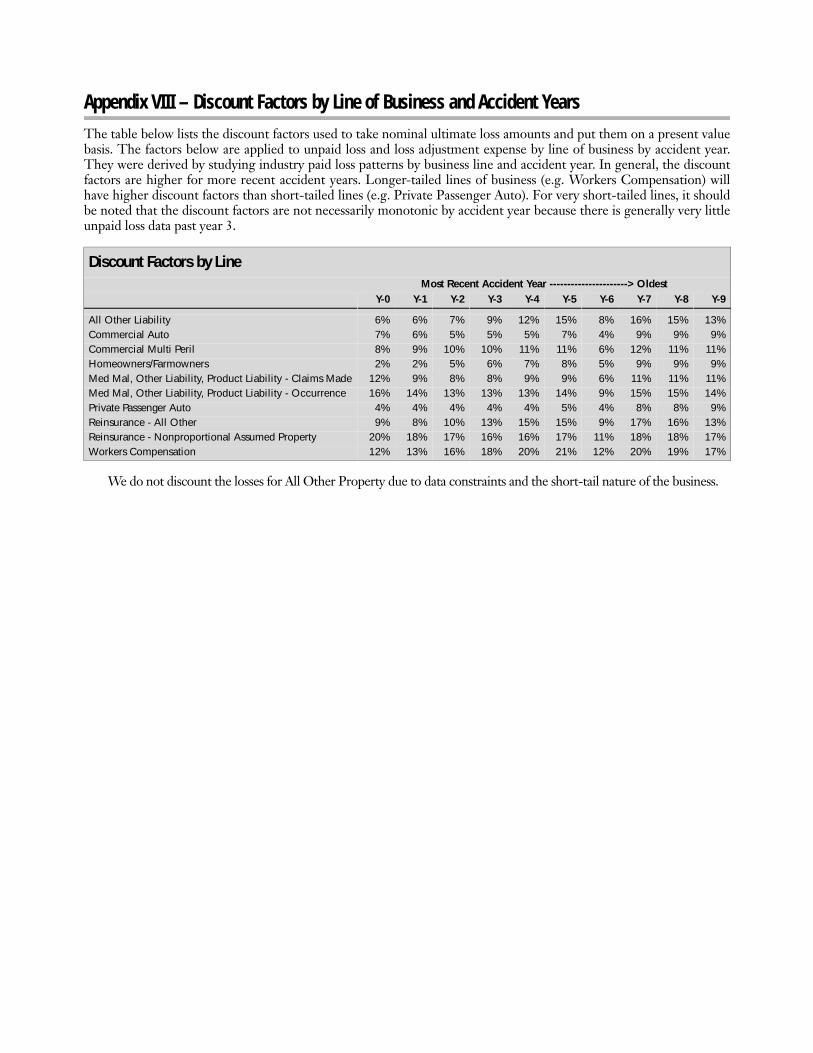
PAGE INTENTIONALLY LEFT BLANK
Appendix VIII – Discount Factors by Line of Business and Accident Years
The table below lists the discount factors used to take nominal ultimate loss amounts and put them on a present valuebasis. The factors below are applied to unpaid loss and loss adjustment expense by line of business by accident year.They were derived by studying industry paid loss patterns by business line and accident year. In general, the discountfactors are higher for more recent accident years. Longer-tailed lines of business (e.g. Workers Compensation) willhave higher discount factors than short-tailed lines (e.g. Private Passenger Auto). For very short-tailed lines, it shouldbe noted that the discount factors are not necessarily monotonic by accident year because there is generally very littleunpaid loss data past year 3.
We do not discount the losses for All Other Property due to data constraints and the short-tail nature of the business.
Discount Factors by LineMost Recent Accident Year ----------------------> Oldest
Y-0 Y-1 Y-2 Y-3 Y-4 Y-5 Y-6 Y-7 Y-8 Y-9
All Other Liability 6% 6% 7% 9% 12% 15% 8% 16% 15% 13%Commercial Auto 7% 6% 5% 5% 5% 7% 4% 9% 9% 9%Commercial Multi Peril 8% 9% 10% 10% 11% 11% 6% 12% 11% 11%Homeowners/Farmowners 2% 2% 5% 6% 7% 8% 5% 9% 9% 9%Med Mal, Other Liability, Product Liability - Claims Made 12% 9% 8% 8% 9% 9% 6% 11% 11% 11%Med Mal, Other Liability, Product Liability - Occurrence 16% 14% 13% 13% 13% 14% 9% 15% 15% 14%Private Passenger Auto 4% 4% 4% 4% 4% 5% 4% 8% 8% 9%Reinsurance - All Other 9% 8% 10% 13% 15% 15% 9% 17% 16% 13%Reinsurance - Nonproportional Assumed Property 20% 18% 17% 16% 16% 17% 11% 18% 18% 17%Workers Compensation 12% 13% 16% 18% 20% 21% 12% 20% 19% 17%

© Copyright 2006, Moody’s Investors Service, Inc. and/or its licensors and affiliates including Moody’s Assurance Company, Inc. (together, “MOODY’S”). All rights reserved. ALLINFORMATION CONTAINED HEREIN IS PROTECTED BY COPYRIGHT LAW AND NONE OF SUCH INFORMATION MAY BE COPIED OR OTHERWISE REPRODUCED, REPACKAGED,FURTHER TRANSMITTED, TRANSFERRED, DISSEMINATED, REDISTRIBUTED OR RESOLD, OR STORED FOR SUBSEQUENT USE FOR ANY SUCH PURPOSE, IN WHOLE OR IN PART, INANY FORM OR MANNER OR BY ANY MEANS WHATSOEVER, BY ANY PERSON WITHOUT MOODY’S PRIOR WRITTEN CONSENT. All information contained herein is obtained byMOODY’S from sources believed by it to be accurate and reliable. Because of the possibility of human or mechanical error as well as other factors, however, such information is provided “asis” without warranty of any kind and MOODY’S, in particular, makes no representation or warranty, express or implied, as to the accuracy, timeliness, completeness, merchantability or fitnessfor any particular purpose of any such information. Under no circumstances shall MOODY’S have any liability to any person or entity for (a) any loss or damage in whole or in part caused by,resulting from, or relating to, any error (negligent or otherwise) or other circumstance or contingency within or outside the control of MOODY’S or any of its directors, officers, employees oragents in connection with the procurement, collection, compilation, analysis, interpretation, communication, publication or delivery of any such information, or (b) any direct, indirect,special, consequential, compensatory or incidental damages whatsoever (including without limitation, lost profits), even if MOODY’S is advised in advance of the possibility of suchdamages, resulting from the use of or inability to use, any such information. The credit ratings and financial reporting analysis observations, if any, constituting part of the informationcontained herein are, and must be construed solely as, statements of opinion and not statements of fact or recommendations to purchase, sell or hold any securities. NO WARRANTY,EXPRESS OR IMPLIED, AS TO THE ACCURACY, TIMELINESS, COMPLETENESS, MERCHANTABILITY OR FITNESS FOR ANY PARTICULAR PURPOSE OF ANY SUCH RATING OR OTHEROPINION OR INFORMATION IS GIVEN OR MADE BY MOODY’S IN ANY FORM OR MANNER WHATSOEVER. Each rating or other opinion must be weighed solely as one factor in anyinvestment decision made by or on behalf of any user of the information contained herein, and each such user must accordingly make its own study and evaluation of each security and ofeach issuer and guarantor of, and each provider of credit support for, each security that it may consider purchasing, holding or selling. MOODY’S hereby discloses that most issuers of debt securities (including corporate and municipal bonds, debentures, notes and commercial paper) and preferred stock rated byMOODY’S have, prior to assignment of any rating, agreed to pay to MOODY’S for appraisal and rating services rendered by it fees ranging from $1,500 to $2,400,000. Moody’s Corporation(MCO) and its wholly-owned credit rating agency subsidiary, Moody’s Investors Service (MIS), also maintain policies and procedures to address the independence of MIS’s ratings and ratingprocesses. Information regarding certain affiliations that may exist between directors of MCO and rated entities, and between entities who hold ratings from MIS and have also publiclyreported to the SEC an ownership interest in MCO of more than 5%, is posted annually on Moody’s website at www.moodys.com under the heading “Shareholder Relations — CorporateGovernance — Director and Shareholder Affiliation Policy.” Moody’s Investors Service Pty Limited does not hold an Australian financial services licence under the Corporations Act. This credit rating opinion has been prepared without taking intoaccount any of your objectives, financial situation or needs. You should, before acting on the opinion, consider the appropriateness of the opinion having regard to your own objectives,financial situation and needs.
36 Moody’s Rating Methodology
To order reprints of this report (100 copies minimum), please call 1.212.553.1658.Report Number: 96353
Author Production Specialists
Thomas Barker Cassina BrooksDavid Ainsworth
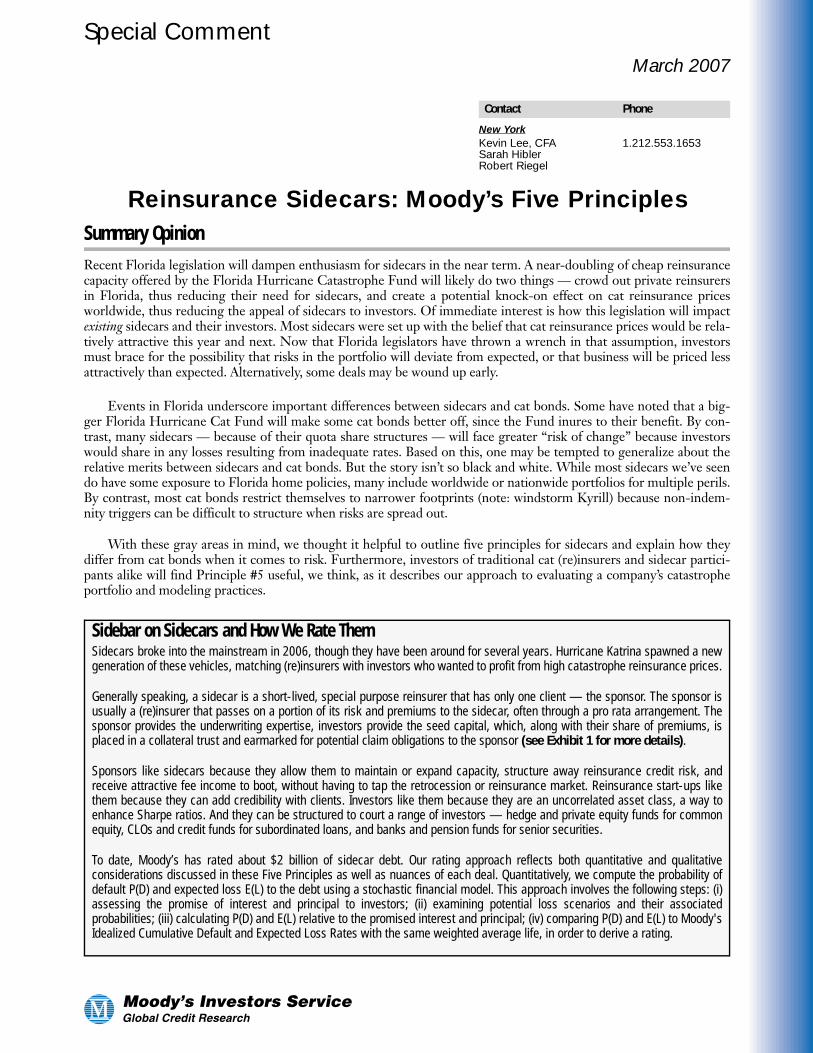
Special Comment
New YorkKevin Lee, CFA 1.212.553.1653Sarah HiblerRobert Riegel
Contact Phone
March 2007
Reinsurance Sidecars: Moody’s Five Principles
Summary OpinionRecent Florida legislation will dampen enthusiasm for sidecars in the near term. A near-doubling of cheap reinsurancecapacity offered by the Florida Hurricane Catastrophe Fund will likely do two things — crowd out private reinsurersin Florida, thus reducing their need for sidecars, and create a potential knock-on effect on cat reinsurance pricesworldwide, thus reducing the appeal of sidecars to investors. Of immediate interest is how this legislation will impactexisting sidecars and their investors. Most sidecars were set up with the belief that cat reinsurance prices would be rela-tively attractive this year and next. Now that Florida legislators have thrown a wrench in that assumption, investorsmust brace for the possibility that risks in the portfolio will deviate from expected, or that business will be priced lessattractively than expected. Alternatively, some deals may be wound up early.
Events in Florida underscore important differences between sidecars and cat bonds. Some have noted that a big-ger Florida Hurricane Cat Fund will make some cat bonds better off, since the Fund inures to their benefit. By con-trast, many sidecars — because of their quota share structures — will face greater “risk of change” because investorswould share in any losses resulting from inadequate rates. Based on this, one may be tempted to generalize about therelative merits between sidecars and cat bonds. But the story isn’t so black and white. While most sidecars we’ve seendo have some exposure to Florida home policies, many include worldwide or nationwide portfolios for multiple perils.By contrast, most cat bonds restrict themselves to narrower footprints (note: windstorm Kyrill) because non-indem-nity triggers can be difficult to structure when risks are spread out.
With these gray areas in mind, we thought it helpful to outline five principles for sidecars and explain how theydiffer from cat bonds when it comes to risk. Furthermore, investors of traditional cat (re)insurers and sidecar partici-pants alike will find Principle #5 useful, we think, as it describes our approach to evaluating a company’s catastropheportfolio and modeling practices.
Sidebar on Sidecars and How We Rate ThemSidecars broke into the mainstream in 2006, though they have been around for several years. Hurricane Katrina spawned a newgeneration of these vehicles, matching (re)insurers with investors who wanted to profit from high catastrophe reinsurance prices.
Generally speaking, a sidecar is a short-lived, special purpose reinsurer that has only one client — the sponsor. The sponsor isusually a (re)insurer that passes on a portion of its risk and premiums to the sidecar, often through a pro rata arrangement. Thesponsor provides the underwriting expertise, investors provide the seed capital, which, along with their share of premiums, isplaced in a collateral trust and earmarked for potential claim obligations to the sponsor (see Exhibit 1 for more details).
Sponsors like sidecars because they allow them to maintain or expand capacity, structure away reinsurance credit risk, andreceive attractive fee income to boot, without having to tap the retrocession or reinsurance market. Reinsurance start-ups likethem because they can add credibility with clients. Investors like them because they are an uncorrelated asset class, a way toenhance Sharpe ratios. And they can be structured to court a range of investors — hedge and private equity funds for commonequity, CLOs and credit funds for subordinated loans, and banks and pension funds for senior securities.
To date, Moody’s has rated about $2 billion of sidecar debt. Our rating approach reflects both quantitative and qualitativeconsiderations discussed in these Five Principles as well as nuances of each deal. Quantitatively, we compute the probability ofdefault P(D) and expected loss E(L) to the debt using a stochastic financial model. This approach involves the following steps: (i)assessing the promise of interest and principal to investors; (ii) examining potential loss scenarios and their associatedprobabilities; (iii) calculating P(D) and E(L) relative to the promised interest and principal; (iv) comparing P(D) and E(L) to Moody'sIdealized Cumulative Default and Expected Loss Rates with the same weighted average life, in order to derive a rating.
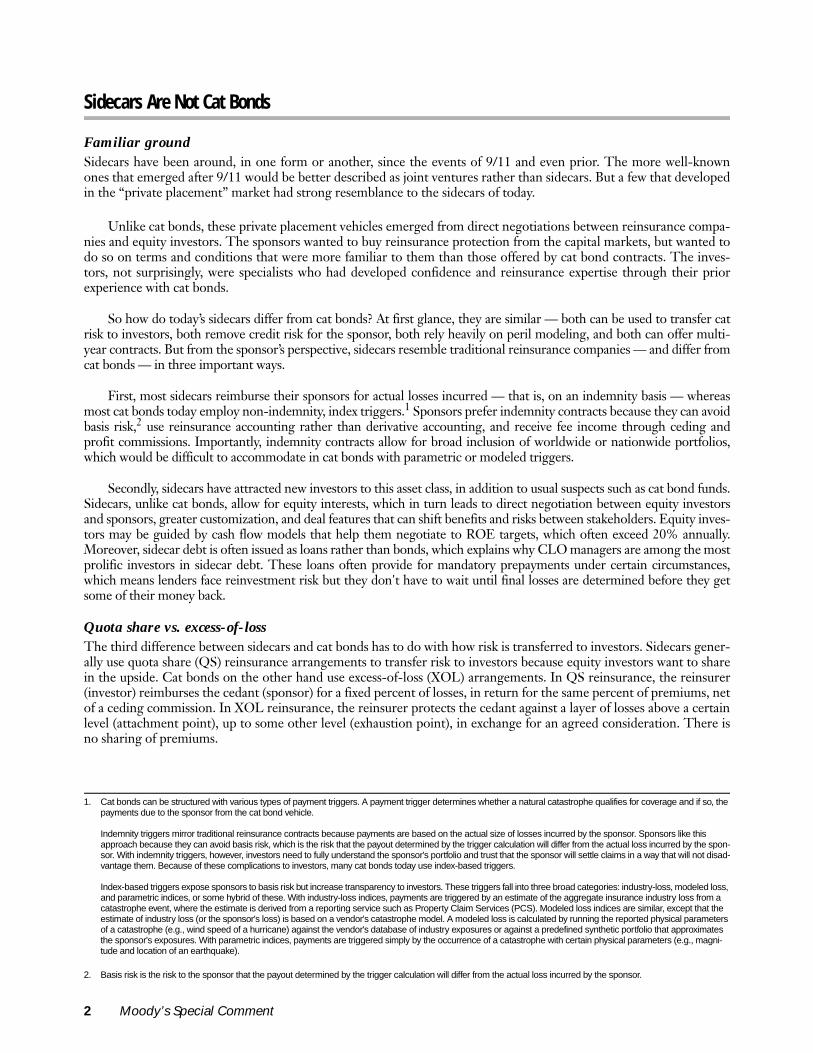
Sidecars Are Not Cat Bonds
Familiar groundSidecars have been around, in one form or another, since the events of 9/11 and even prior. The more well-knownones that emerged after 9/11 would be better described as joint ventures rather than sidecars. But a few that developedin the “private placement” market had strong resemblance to the sidecars of today.
Unlike cat bonds, these private placement vehicles emerged from direct negotiations between reinsurance compa-nies and equity investors. The sponsors wanted to buy reinsurance protection from the capital markets, but wanted todo so on terms and conditions that were more familiar to them than those offered by cat bond contracts. The inves-tors, not surprisingly, were specialists who had developed confidence and reinsurance expertise through their priorexperience with cat bonds.
So how do today’s sidecars differ from cat bonds? At first glance, they are similar — both can be used to transfer catrisk to investors, both remove credit risk for the sponsor, both rely heavily on peril modeling, and both can offer multi-year contracts. But from the sponsor’s perspective, sidecars resemble traditional reinsurance companies — and differ fromcat bonds — in three important ways.
First, most sidecars reimburse their sponsors for actual losses incurred — that is, on an indemnity basis — whereasmost cat bonds today employ non-indemnity, index triggers.1 Sponsors prefer indemnity contracts because they can avoidbasis risk,2 use reinsurance accounting rather than derivative accounting, and receive fee income through ceding andprofit commissions. Importantly, indemnity contracts allow for broad inclusion of worldwide or nationwide portfolios,which would be difficult to accommodate in cat bonds with parametric or modeled triggers.
Secondly, sidecars have attracted new investors to this asset class, in addition to usual suspects such as cat bond funds.Sidecars, unlike cat bonds, allow for equity interests, which in turn leads to direct negotiation between equity investorsand sponsors, greater customization, and deal features that can shift benefits and risks between stakeholders. Equity inves-tors may be guided by cash flow models that help them negotiate to ROE targets, which often exceed 20% annually.Moreover, sidecar debt is often issued as loans rather than bonds, which explains why CLO managers are among the mostprolific investors in sidecar debt. These loans often provide for mandatory prepayments under certain circumstances,which means lenders face reinvestment risk but they don't have to wait until final losses are determined before they getsome of their money back.
Quota share vs. excess-of-lossThe third difference between sidecars and cat bonds has to do with how risk is transferred to investors. Sidecars gener-ally use quota share (QS) reinsurance arrangements to transfer risk to investors because equity investors want to sharein the upside. Cat bonds on the other hand use excess-of-loss (XOL) arrangements. In QS reinsurance, the reinsurer(investor) reimburses the cedant (sponsor) for a fixed percent of losses, in return for the same percent of premiums, netof a ceding commission. In XOL reinsurance, the reinsurer protects the cedant against a layer of losses above a certainlevel (attachment point), up to some other level (exhaustion point), in exchange for an agreed consideration. There isno sharing of premiums.
1. Cat bonds can be structured with various types of payment triggers. A payment trigger determines whether a natural catastrophe qualifies for coverage and if so, the payments due to the sponsor from the cat bond vehicle.
Indemnity triggers mirror traditional reinsurance contracts because payments are based on the actual size of losses incurred by the sponsor. Sponsors like this approach because they can avoid basis risk, which is the risk that the payout determined by the trigger calculation will differ from the actual loss incurred by the spon-sor. With indemnity triggers, however, investors need to fully understand the sponsor's portfolio and trust that the sponsor will settle claims in a way that will not disad-vantage them. Because of these complications to investors, many cat bonds today use index-based triggers.
Index-based triggers expose sponsors to basis risk but increase transparency to investors. These triggers fall into three broad categories: industry-loss, modeled loss, and parametric indices, or some hybrid of these. With industry-loss indices, payments are triggered by an estimate of the aggregate insurance industry loss from a catastrophe event, where the estimate is derived from a reporting service such as Property Claim Services (PCS). Modeled loss indices are similar, except that the estimate of industry loss (or the sponsor's loss) is based on a vendor's catastrophe model. A modeled loss is calculated by running the reported physical parameters of a catastrophe (e.g., wind speed of a hurricane) against the vendor's database of industry exposures or against a predefined synthetic portfolio that approximates the sponsor's exposures. With parametric indices, payments are triggered simply by the occurrence of a catastrophe with certain physical parameters (e.g., magni-tude and location of an earthquake).
2. Basis risk is the risk to the sponsor that the payout determined by the trigger calculation will differ from the actual loss incurred by the sponsor.
2 Moody’s Special Comment
Each form of reinsurance speaks to different motivations, which investors should be aware of. Cedants use QS as aform of capital substitute to enable them to maintain or increase writings which would otherwise require an increase incapital and reserves. Cedants use XOL as a form of protection against large single losses or a large accumulation of losses.
QS and XOL also differ in the extent of coverage provided to the cedant. QS not only reimburses the cedant forlarge losses but for small losses too, without any loss limits per risk or event. QS also provides protection to the cedantagainst (what underwriters call) the “risk of change”, which means that the reinsurer (investor) would share in lossesresulting from inadequate rates charged by the cedant (sponsor).
So which type of reinsurance offers greater alignment of interests? On the surface it would appear to be QSbecause there is a sharing of fortunes between parties. But the sharing isn’t symmetric. The reinsurer often shares itsprofits with the cedant via a profit commission, but it usually isn’t allowed to share its losses. Further, the ceding com-mission may — and often does — exceed what is merely needed to cover the cedant’s operating expenses. XOL con-tracts also provide partial alignment of interests depending on the level of retention; the cedant has incentive not tolose all its money below the attachment point. For both QS and XOL, reinsurers (investors) must ensure that the ced-ant (sponsor) keeps enough “skin in the game” (Principle #3). Furthermore, it goes without saying that the stronger acedant’s risk management practices, the better off the reinsurer will be.
Enough background. Here are our five principles for sidecars. Just be mindful that sidecars (and cat bonds) comein many flavors.
Moody’s Five Principles for Analyzing Sidecars
PRINCIPLE #1: CAT MODELING IS DONE BY MATH, BUSINESS IS DONE BY PEOPLE. SIDECARS ARE A MIX OF BOTH.Put another way, sidecar participants see value in direct negotiation. All else equal, debt investors are better served by anequity investor who is knowledgeable about reinsurance to ensure a ‘fair fight’ during negotiations. For this reason,Moody’s begins its rating process by placing ourselves, hypothetically, on the opposite side of the negotiating table: Whydoes the sponsor prefer this treaty structure? What reinsurance sits below and above this reinsurance contract? Are theceding and profit commissions reasonable? What does the ceding commission say about the diversification of the under-lying portfolio? (In traditional markets, ceding commissions are generally higher for better diversified portfolios.)
PRINCIPLE #2: STRUCTURAL FEATURES REGULATE BEHAVIOR.Structural features in sidecars are often just business rules for traditional insurance concepts like operating leverage,reserve leverage, and reserve development. These rules are established upfront and regulate the behavior of the stake-holders. Just as regulators would step in — to restrict dividends, to limit business written — if certain metrics werebreached at an insurance company, the structural features do the same for the sidecar. And just as regulators look out forthe best interests of the policyholder, the structural features look out for the best interests of the sponsor. The differenceis that the parties can negotiate these features to shift some of the benefits (and risks) from the sponsor to the investors.
A popular feature among sidecars we’ve seen is a minimum collateral test. The test is formulaic. The idea is that ifthe sidecar doesn’t have enough capital to meet this test, the amount of risk ceded to the sidecar will be reduced andpayments to investors will be restricted. Sponsors view the test as protection; equity investors view it as a constraint.Debt investors view the test with more ambivalence. A restrictive test would limit the risk that the sidecar can take on— a credit positive. But if the test is designed with a large reserve cushion to protect the sponsor, more of the investor’smoney will be tied up in the vehicle for a longer period of time, and more money will be exposed to extension andcommutation risk (Principle #3).
PRINCIPLE #3: SIDECARS AND CAT BONDS ARE NOT THE SAME WHEN IT COMES TO RISK.Sidecar investors are exposed to various risks. Modeling risk is discussed in Principle #5. Risk of change is discussed inPrinciple #4. Four other risks are discussed here. Cat bonds are also exposed to these risks, but differ in how theyaddress each one.
Adverse selection is the possibility that the sponsor might pass on the bad parts of its portfolio to investors and keepthe good parts for itself. For sidecars, this may be mitigated by including the sponsor’s full portfolio (e.g., all property
Moody’s Special Comment 3
cat business worldwide) or by establishing specific rules to govern the selection of qualifying business. For cat bondswith parametric or modeled triggers, including the full portfolio may prove tricky if risks are spread out.
Moral hazard is the possibility that the sponsor might have less incentive to limit its losses once it has transferred therisk to investors (e.g., relaxed underwriting policy or relaxed claim settlement practices). For sidecars, this may be mit-igated by using a quota share structure. Profit commissions can provide further incentive for the sponsor to underwritebusiness carefully. But again, the sharing of fortunes isn’t symmetric; it‘s important to check that the ceding and profitcommissions are reasonable (Principle #1). For cat bonds, moral hazard may be mitigated by having the sponsor retaina percentage of losses in the reinsured layer (i.e., coparticipation). For both indemnity cat bonds and sidecars, thewording in the net retention clause (warranty) is critical, especially limitations on what reinsurance the sponsor canbuy on its retained share, to ensure it has enough “skin in the game”.
Extension and commutation risk. It could take years to determine exact losses following an event like Katrina. Ifthere is a delay in repaying investors while losses are determined, an investor’s annual rate of return will be reduced(extension risk). On the other hand, if obligations between the sponsor and investor are settled prematurely based onthe sponsor’s loss estimates, investors face the risk of overestimation (commutation risk). For indemnity contracts,whether sidecars or cat bonds, extension risk may be mitigated by payment/coupon step-ups while losses are deter-mined; commutation risk may be mitigated by using an independent party to verify loss estimates or by providing anavenue for arbitration. Regardless, the commutation process will be subjective (which is why we put a probability dis-tribution around the tail in our rating analysis). For this reason, many cat bonds today employ non-indemnity triggersthat allow parties to determine quickly and objectively whether a payment is triggered and how much.
Deviation from the Expected Portfolio: As the sponsor writes new business, the risk in the portfolio could deviatefrom what was contemplated at inception. Three strategies for controlling this risk are: 1) using rules to define theexact contracts or exposures which can be included in the portfolio, 2) compensating investors for the extra risk theyassume, 3) using trigger resets to “refresh” the deal periodically.
The first strategy has limitations because sponsors cannot always control how many or which contracts they write;it depends on their clients’ needs. But most sidecars and cat bonds do restrict the lines of business or geographies thatcan be included in the portfolio.
The second strategy is inherent in sidecars with quota share structures. If the sponsor grows the risks in the port-folio, and presumably collects more premiums for those risks, then the investor will share in those premiums as well.Of course, if the sponsor charges premiums that are inadequate for the extra risk, then investors will not be sufficientlycompensated for the extra risk (Principle #4).
The third strategy — use of periodic trigger resets — is an important distinction between sidecars and cat bonds.Cat bonds may use them, sidecars generally don’t. Trigger resets keep the probabilities of debt attachment and exhaus-tion constant from year to year, no matter how much more (or less) business the sponsor writes or what losses areincurred. Some sidecar features may partially reset the deal, but the resets are never perfect because of competinginterests. For example, suppose large losses in year 1 reduce equity capital to $1. Clearly, the equity investor will wantto write as much business as possible in year 2 to try to recoup his losses (though rules may prevent him from doing so)rather than keep the probability of debt attachment constant. But lack of trigger resets can also be a credit positive insidecars because retained earnings in one year can be carried over to the next.
Example: How Trigger Resets Affect Rating Math
Exhibit 2 provides further evidence that sidecars do not generally have constant probabilities of attachment. Thegraphs show which year of losses — year 1, year 2, or year 3 — correlate most to the probability of default to debt prin-cipal (ignoring interest and other considerations for the moment). Each graph shows rank sum correlations based on100,000 simulation scenarios. Note that the year 2 loss matters most for the sidecar with no trigger reset. By contrast,all three years of losses matter equally for the cat bond with trigger reset.
Constant probabilities of attachment and exhaustion can make the math simpler. Exhibit 3 shows an ad hoc wayof deriving the probability of default on debt principal, assuming the sidecar has perfect trigger resets and ignoringinterest payments and special features (which we believe are unrealistic assumptions). The approach has significant
4 Moody’s Special Comment
limitations, but it may be remotely useful for those who do not have access to the deal model. Our preferred approachis to run simulations against a financial model (or deal model) to derive the probability of default P(D) and expectedloss E(L) (relative to the promised interest and principal) over a multi-year horizon, allowing structural features to playout in the model. P(D) and E(L) are then mapped to Moody's Idealized Cumulative Default and Expected Loss Rateswith the same weighted average life in order to arrive at a rating. Our default and expected loss rates can come outhigher or lower than those derived using the ad hoc approach, depending on the structure and loss assumptions. (Ourratings also contemplate other risks discussed in these Principles, some of which cannot be easily quantified.)
PRINCIPLE #4: “RISK OF CHANGE” IN PREMIUM LEVELS AFFECTS SIDECARSSidecars with quota share structures are exposed to what underwriters call the “risk of change”, meaning that the side-car would share in any losses stemming from inadequate rates charged by the sponsor. This risk is magnified by recentchanges to the Florida market, which will likely have a knock-on effect on cat reinsurance prices worldwide. Sponsorsmay be forced to charge less for the same risks, and pass on correspondingly lower premiums to their sidecars. Sidecarsmost affected are those that have significant exposure to Florida home policies through underlying quota share con-tracts (rare for sidecars we’ve rated) or XOL contracts that overlap with the Florida Hurricane Cat Fund. XOL rein-surers/sponsors may respond by writing the coparticipation portion of the Cat Fund layer (less volume), reinsuringlayers above the Cat Fund (lower rate on line), or shifting capacity to other regions like the Northeast (lower rate online and change in risk profile).
In our ratings, we commonly dial back the sponsor’s rate (and reinstatement premium) assumptions. In deciding howmuch to dial back, we find it useful to have knowledge about the portfolio’s layer profile (aggregate limits of liability plot-ted against attachment points and against renewal dates by geography), a rough sense for who the underlying clients are,and a breakout of underlying lines (residential/commercial/surplus/marine/retro line split). For a particular territory andperil, rate-on-line should generally be higher for lower attachment points. Furthermore, rate assumptions will be less cer-tain for mid-year 2007 renewals (and beyond) versus Jan ‘07 renewals. Cat programs for several large domestic insurersrenew closer to mid-year, while most pro-rata business, especially Florida, also renew at mid-year.
A pricing squeeze directly impacts sidecars but not cat bonds, but a loosening of terms and conditions impactsboth indemnity cat bonds and sidecars. In a softening market, cedants will not only demand lower prices but also morefavorable contract terms. One enhancement that reinsurers may be willing to offer is coverage for Extra ContractualObligations (ECO). ECO refers to (usually) punitive damages awarded by a court against a (re)insurer above andbeyond the coverage provided by the (re)insurance contract, typically for bad faith, fraud or negligence when dealingwith a claim (we’re including Excess of Policy Limits (XPL) claims here). Sidecar investors usually have to follow alloriginal settlements, meaning they are on the hook for their share of ECOs and, in some cases, compromise and exgratia payments as well. This is important because catastrophe models do not explicitly account for these extra con-tractual claims (see Principle #5).
PRINCIPLE #5: CAT CURVES EMBED ‘RISK ON RISK’: OUR FOUR C’SIndustry catastrophe models estimate insured losses based on estimated damages (vulnerability function) from estimatedhazards (Mother Nature) on estimated exposures (company’s data). This layering of ‘risk on risk’ suggests that modeloutputs are highly uncertain.
Model outputs are often summarized in the form of a curve that shows the probability ‘p’ that a given loss ‘L’ willbe exceeded. ‘L’ could be annual losses from a single catastrophe occurrence (in which case it is called an OccurrenceExceedance Probability (OEP) curve) or annual losses from multiple catastrophe events (in which case it is called anAggregate Exceedance Probability (AEP) curve). We use the AEP curve in our ratings. The point is that both ‘p’ and‘L’ are uncertain.
So how do we reflect this ‘risk on risk’ in the AEP curve? For sidecars, we adopt a “Four C’s” approach — Compo-sition, Calibration, Conservatism, and Comparison.
• Composition (or more accurately decomposition): Exhibit 4 shows a combined (all perils, all regions) AEP curvedecomposed into contributions from each peril-region zone. European Windstorms and U.S. Hurricanes contrib-ute the lion’s share of the risks in this example, and more so as you move into the tail of the curve. One question toask ourselves is whether the moderate extent of diversification justifies the ceding commission paid to the sponsor.This graph provides leads for further inquiry. For example, data quality tends to be better in the U.S. than in other
Moody’s Special Comment 5
parts of the world but if the sponsor uses aggregate level models, which rely on industry average assumptionsabout property characteristics rather than property specific information, then the benefits of better data arenegated. If the portfolio has significant exposure to UK winter storms and flooding, detailed location data shouldbe collected because models can be very sensitive to the location of the risk. Data quality tends to be less detailedin other parts of Europe and problematic in countries like Japan where buildings are numbered by the order inwhich they’re built.
• Calibration: Returning to our example, since U.S. Hurricane is one of the biggest perils, it would make sense tocheck where the historical or pro forma losses from Hurricanes Katrina/Rita/Wilma (“KRW”) fall on the curve.Our sense is that a scenario like KRW could happen as frequently as once in every 15 years. If the sponsor’s AEPcurve suggests something more remote, we would likely calibrate (dial up) the curve so that KRW falls within a 15year return period.
• Conservatism: Exhibit 5 is a series of questions we ask sponsors to evaluate their level of conservatism (or lackof conservatism) in their aggregation management and cat modeling practices. Readers will find the commentaryhelpful, we think, especially the background information on aggregation management, unmodeled elements(Question I.4), and the difference between aggregate level and detailed level models (Question I.5). Here are somerules of thumb we use to decide how much to penalize or give credit to sponsors for (‘+’ means penalize or dial uptheir loss curve, ‘-’ means give credit or dial down their loss curve):
– Use of aggregate level models, not detailed level models, for pricing and/or aggregation management:(+5%-10% for pricing, +5-10% for aggregation management);
– Aggregation methodology: lack of zonal limits (+10-20%), aggregating exposures at a peril-region levelfirst before convoluting those curves to generate the overall curve (-5%);
– Secondary perils that can be modeled but are not (+% varies depending on a comparison of modeledresults with and without these secondary perils turned on);
– Secondary uncertainty, demand surge/loss amplification, near-term climate assumptions: penalized ifthese features are not turned on (+% varies depending on a comparison of modeled results with andwithout these features switched on);
– Unmodeled elements: (a) unmodeled perils and regions for which commercial models are available(+% varies depending on amount of exposure), (b) unmodeled perils and regions for which commercialmodels are not available (+% varies depending on amount of exposure), (c) unmodeled elements ofmodeled contracts (+3% for loss adjustment expenses, +5% for ECOs and ex gratia), (d) unmodeledclasses (+% varies depending on amount of exposure);
– Low resolution data (+5-10%), lack of procedures to check for under-reporting of sums insured (+5-10%), lack of rigorous exposure adjustments to data (+5-10%).
• Comparison: Finally, we compare a sponsor’s AEP curve to that of another company with a similar portfolio. Todo so, we normalize each curve by dividing dollar losses by the sponsor’s projected annual premiums. If CompanyA’s curve lies below Company B’s curve, and assuming they have very similar portfolios, then Company A may beunderstating modeled losses or making overly optimistic rate assumptions.
6 Moody’s Special Comment
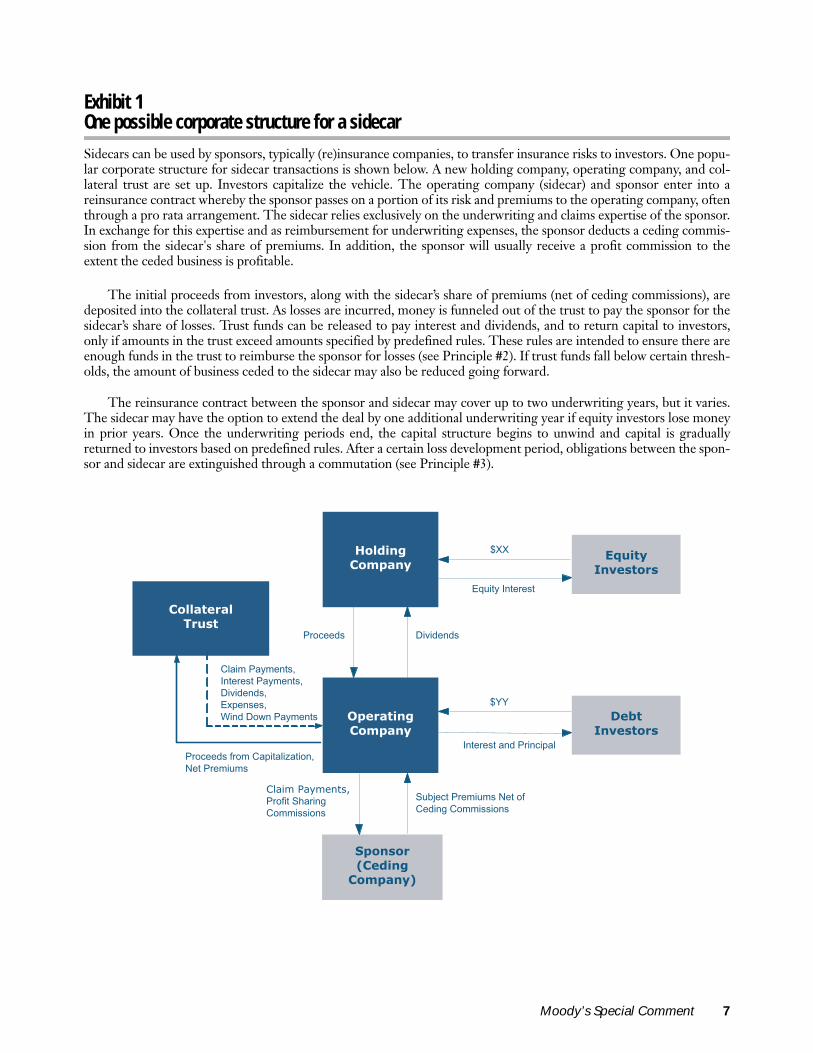
Exhibit 1One possible corporate structure for a sidecar
Sidecars can be used by sponsors, typically (re)insurance companies, to transfer insurance risks to investors. One popu-lar corporate structure for sidecar transactions is shown below. A new holding company, operating company, and col-lateral trust are set up. Investors capitalize the vehicle. The operating company (sidecar) and sponsor enter into areinsurance contract whereby the sponsor passes on a portion of its risk and premiums to the operating company, oftenthrough a pro rata arrangement. The sidecar relies exclusively on the underwriting and claims expertise of the sponsor.In exchange for this expertise and as reimbursement for underwriting expenses, the sponsor deducts a ceding commis-sion from the sidecar's share of premiums. In addition, the sponsor will usually receive a profit commission to theextent the ceded business is profitable.
The initial proceeds from investors, along with the sidecar’s share of premiums (net of ceding commissions), aredeposited into the collateral trust. As losses are incurred, money is funneled out of the trust to pay the sponsor for thesidecar’s share of losses. Trust funds can be released to pay interest and dividends, and to return capital to investors,only if amounts in the trust exceed amounts specified by predefined rules. These rules are intended to ensure there areenough funds in the trust to reimburse the sponsor for losses (see Principle #2). If trust funds fall below certain thresh-olds, the amount of business ceded to the sidecar may also be reduced going forward.
The reinsurance contract between the sponsor and sidecar may cover up to two underwriting years, but it varies.The sidecar may have the option to extend the deal by one additional underwriting year if equity investors lose moneyin prior years. Once the underwriting periods end, the capital structure begins to unwind and capital is graduallyreturned to investors based on predefined rules. After a certain loss development period, obligations between the spon-sor and sidecar are extinguished through a commutation (see Principle #3).
gnidloHnapmoC y
ytiuqEnI srotsev
etalloC lartsurT
XX$
lC aP mia emy n ,stS tiforP gnirah
issimmoC sno
tbeDnI srotsev
rosnopSgnideC(
napmoC )y
Su jb ec smuimerP t eN fo tCedi oC gn simm si sno
uqE ity nI et ser t
epO r gnitanapmoC y
YY$
etnI ser t rP dna cni i ap l
orP c sdee Di div sdne
P mialC ayments,tnI e ser t P a ,stnemy
Di div ,sdnesesnepxE ,
Wi nwoD dn stnemyaP
orP c C morf sdee api at ,noitazileN rP t ime u sm
Moody’s Special Comment 7
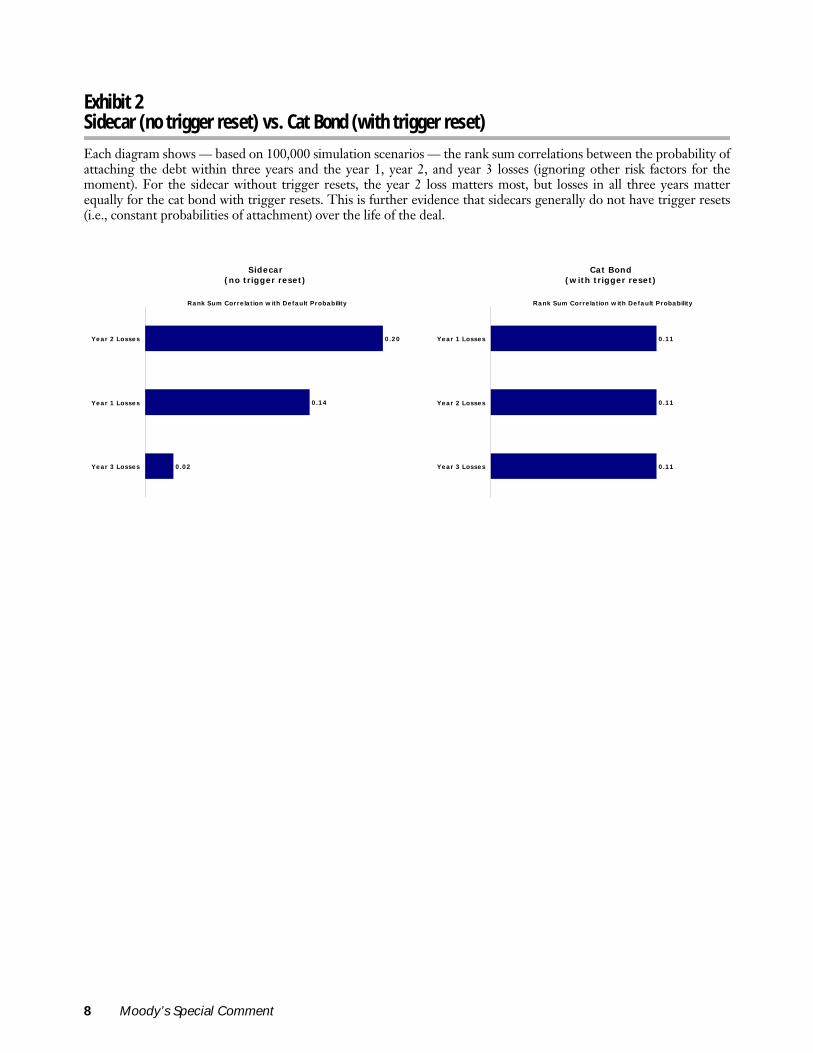
Exhibit 2Sidecar (no trigger reset) vs. Cat Bond (with trigger reset)
Each diagram shows — based on 100,000 simulation scenarios — the rank sum correlations between the probability ofattaching the debt within three years and the year 1, year 2, and year 3 losses (ignoring other risk factors for themoment). For the sidecar without trigger resets, the year 2 loss matters most, but losses in all three years matterequally for the cat bond with trigger resets. This is further evidence that sidecars generally do not have trigger resets(i.e., constant probabilities of attachment) over the life of the deal.
Sidecar (no trigger reset)
0.20
0.14
0.02
Year 2 Losses
Year 1 Losses
Year 3 Losses
Rank Sum Correlation with Default Probability
Cat Bond (with trigger reset)
0.11
0.11
0.11
Year 1 Losses
Year 2 Losses
Year 3 Losses
Rank Sum Correlation with Default Probability
8 Moody’s Special Comment
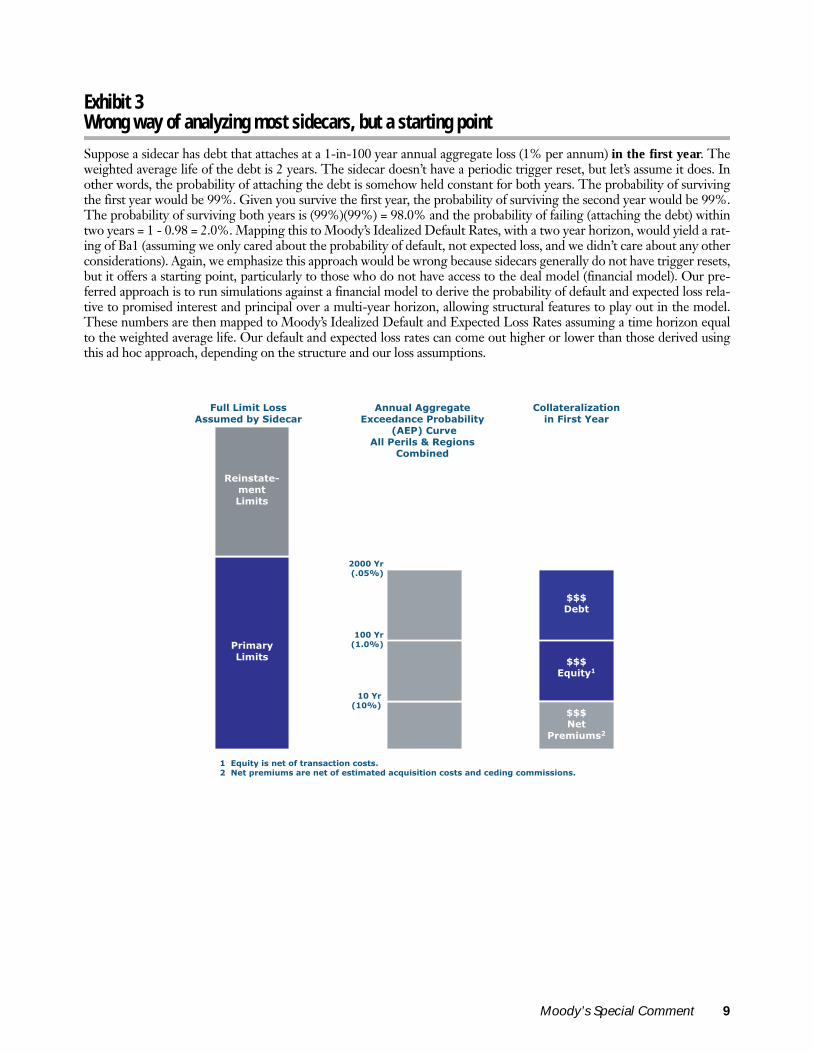
Exhibit 3Wrong way of analyzing most sidecars, but a starting point
Suppose a sidecar has debt that attaches at a 1-in-100 year annual aggregate loss (1% per annum) in the first year. Theweighted average life of the debt is 2 years. The sidecar doesn’t have a periodic trigger reset, but let’s assume it does. Inother words, the probability of attaching the debt is somehow held constant for both years. The probability of survivingthe first year would be 99%. Given you survive the first year, the probability of surviving the second year would be 99%.The probability of surviving both years is (99%)(99%) = 98.0% and the probability of failing (attaching the debt) withintwo years = 1 - 0.98 = 2.0%. Mapping this to Moody’s Idealized Default Rates, with a two year horizon, would yield a rat-ing of Ba1 (assuming we only cared about the probability of default, not expected loss, and we didn’t care about any otherconsiderations). Again, we emphasize this approach would be wrong because sidecars generally do not have trigger resets,but it offers a starting point, particularly to those who do not have access to the deal model (financial model). Our pre-ferred approach is to run simulations against a financial model to derive the probability of default and expected loss rela-tive to promised interest and principal over a multi-year horizon, allowing structural features to play out in the model.These numbers are then mapped to Moody’s Idealized Default and Expected Loss Rates assuming a time horizon equalto the weighted average life. Our default and expected loss rates can come out higher or lower than those derived usingthis ad hoc approach, depending on the structure and our loss assumptions.
yramirPmiL i st
miL lluF i ssoL tracediS yb demussA
rY 0011( 0. )%
A launnA etagerggdeecxE na ec ytilibaborP
C )PEA( u evrreP llA i & sl R e noig s
denibmoC
$$$ytiuqE 1
$$$tbeD
$$$teN
smuimerP 2
etalloC noitazilarsriF ni raeY t
tatsnieR -etnem
miL i st
0002 rY %50.( )
rY 01( %01 )
1 Equ si yti ten o f t r tcasna oi stsoc n .2 teN p r me iu a sm re ten o f mitse eta d uqca itisi on na stsoc d dec i gn oc mm issi ons.
Moody’s Special Comment 9
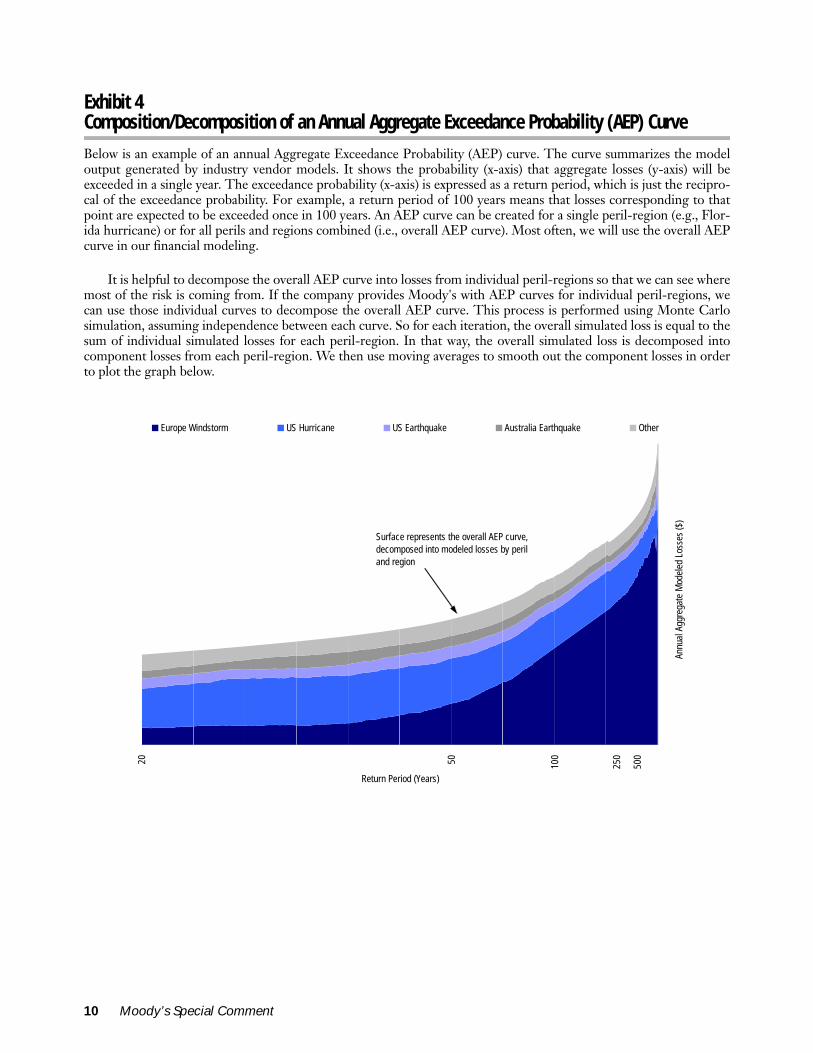
Exhibit 4Composition/Decomposition of an Annual Aggregate Exceedance Probability (AEP) Curve
Below is an example of an annual Aggregate Exceedance Probability (AEP) curve. The curve summarizes the modeloutput generated by industry vendor models. It shows the probability (x-axis) that aggregate losses (y-axis) will beexceeded in a single year. The exceedance probability (x-axis) is expressed as a return period, which is just the recipro-cal of the exceedance probability. For example, a return period of 100 years means that losses corresponding to thatpoint are expected to be exceeded once in 100 years. An AEP curve can be created for a single peril-region (e.g., Flor-ida hurricane) or for all perils and regions combined (i.e., overall AEP curve). Most often, we will use the overall AEPcurve in our financial modeling.
It is helpful to decompose the overall AEP curve into losses from individual peril-regions so that we can see wheremost of the risk is coming from. If the company provides Moody's with AEP curves for individual peril-regions, wecan use those individual curves to decompose the overall AEP curve. This process is performed using Monte Carlosimulation, assuming independence between each curve. So for each iteration, the overall simulated loss is equal to thesum of individual simulated losses for each peril-region. In that way, the overall simulated loss is decomposed intocomponent losses from each peril-region. We then use moving averages to smooth out the component losses in orderto plot the graph below.
20 50 100
250
500
Return Period (Years)
Annu
al A
ggre
gate
Mod
eled
Los
ses
($)
Europe Windstorm US Hurricane US Earthquake Australia Earthquake Other
Surface represents the overall AEP curve, decomposed into modeled losses by peril and region
10 Moody’s Special Comment
Exhibit 5Moody’s questionnaire regarding catastrophe modeling and aggregation management practices
I. AGGREGATION MANAGEMENT[The company (sponsor) will sometimes limit its risk appetite (e.g., self-imposed liability limits) for different territoriesand perils. The aggregation management process accumulates exposures across all business lines to ensure that thecompany hasn’t unknowingly exceeded its predefined risk appetite. In sidecar transactions, the process also addressesproper identification of contracts/treaties falling within the relevant portfolio and the way in which results from differ-ent models, for different perils and territories, are combined to create the overall annual Aggregate Exceedance Prob-ability (AEP) curve. Ideally, the aggregation management process for a sidecar transaction should resemble that usedby the sponsor on a company-wide basis.]
1) What controls are in place to ensure correct identification of contracts that fall within this transaction?[Red flags: legacy IT systems, lack of third party verification.]
2) How do you define your risk appetite? Do you set maximum liability limits for a particular peril, region, orperil/region combination? [Ideally, limits should to be fairly balanced across perils and regions, without any one perilor region dominating the others. Note that the company may set limits for exposures aggregated across all businesslines, some of which may fall outside the sidecar portfolio.]
3) What percent of the exposures, by premiums and liability limits, are NOT modeled using commercially-available models? [A high percentage requires further inquiry. See Question I.4 below.]
4) List exposures, perils, regions, and contract elements that are not modeled. As % of policies/contracts, %premium, % limits? How do you account for them? [Some companies use gross-up factors for different unmod-eled elements; others apply a load to the model output. We cover secondary perils in IV.3]
a) Unmodeled perils/territories for which commercial models are available? [Exposure may be minimal but verify.]
b) Unmodeled perils/territories for which commercial models are not available? [e.g, flood (other than stormsurge due to US Gulf and East Coast hurricanes and UK coastal flooding due to Euro winter storms), freeze inEurope, liquefaction in Japan, landslides from earthquakes in all regions, China earthquake, meteors, volcanoes,riots, etc.]
c) Unmodeled elements of modeled contracts? [e.g., contingent business interruption, multiple locations, LAE, haz-ardous waste cleanup, bylaws, denial of access, debris removal, power outages, ECOs, XPL, ex gratia payments, etc.]
d) Unmodeled classes? [e.g., retro, ILW, marine, offshore energy, aviation, etc.]
5) Do you use detailed level models or aggregate level models for aggregation management? [Aggregate mod-els like AIR CATRADER or RMS ALM run on data that doesn’t contain property specific information. They useindustry average assumptions about construction, occupancy, age, etc., or prorate an industry modeled loss based onthe portfolio’s exposure in a given region. Aggregate models may be appropriate if the exposure profile resembles thatof industry averages, which means that the portfolio should contain a large number of risks and be well diversified.Detailed models like AIR CLASIC/2 or RMS DLM run on property specific information inputted by the user. Thisinformation can include the address, property characteristics, property values, and policy details. A company may usedetailed models for pricing but aggregate models for aggregation management. Tradeoff between the two types ofmodels? Detailed models take 2 days to run, aggregate models take 2 hours. (Speed of underwriting can be an impor-tant differentiator in competitive markets.)]
6) How do you derive the overall annual Aggregate Exceedance Probability (AEP) curve for all perils andregions combined? [Conservative way: Generate AEP curves (i.e., aggregate exposures) for individual peril-regionsfirst, and then convolute those curves (using ReMetrica or some other simulation/DFA tool), assuming independence,to generate the overall AEP curve. Less conservative way: Aggregate all perils and regions simultaneously to derive the
Moody’s Special Comment 11
overall AEP curve. Why is the former path more conservative? Because you are assuming, for example, that a Floridahurricane can wipe out half the limits on a treaty that has no reinstatements and then a subsequent earthquake canwipe out full limits on the same treaty, even though only half the limits would be available to cover the earthquake. Youwould also be assuming that a Florida hurricane can wipe out limits on a treaty in September (possible), a Californiaearthquake can wipe out reinstated limits on the same treaty in October (possible), and a Northeast hurricane can wipeout limits again in November (impossible unless there is a second reinstatement).]
7) Follow-up question: how many simulation draws do you use to create the overall AEP curve? [We wantenough draws to capture extremely infrequent events. Something north of 250,000 draws may be reasonable.]
II. OVERVIEW OF CAT MODELING PROCESS1) How many people make up the cat modeling and aggregation management teams and what’s their level ofexperience? [Majority of contracts may be underwritten during concentrated renewal season(s), which places largedemands on resources during short periods of time.]
2) Quantify the stability of your book, as best you can. [If a (re)insurer has long standing relationships with clients,it may have more clout to impose high data standards, even as the market softens.]
3) Do you remodel all contracts submitted to you, even renewals? [Familiarity with a contract or lack of resourcesmay encourage shortcuts.]
4) Describe the workflow — from submission to modeling to aggregation management to pricing — and anyfeedback loops. [Check for missing links and active communication. Aggregation management team should beinvolved early. If a contract/treaty would cause the company to exceed its risk appetite, there would be no need tounderwrite it. The sooner modelers and actuaries get involved in the submission process, the better the chances of get-ting timely and sufficient data. ]
5) What would cause you to walk away from a submission (other than price)? What % of submissions do youquote and % quoted but lost [Some companies walk away because of poor data, the broker, etc. Quoting 100% ofsubmissions would raise eyebrows.]
6) Do you do all the modeling and data cleansing in-house? [Third parties may use different, perhaps lessinformed assumptions. If the modeling work is outsourced, strict guidelines and procedures must be well docu-mented.]
III. USE OF CATASTROPHE MODELS1) Why did you choose this model for a given territory and peril, and do you blend different results for differ-ent models for certain contracts? [For reinsurers, the answer may be that most of their clients use a particularmodel. Some companies blend results from different models using weighting factors.]
2) When do you use aggregate level models and when do you use detailed level models? [see Question I.5.Detailed level models are preferred in general for pricing and aggregation management but this may not be possiblegiven time constraints or poor data.]
3) Do you assume a near-term or long-term view of landfalling hurricane frequency? [Near-term view is moreconservative.]
4) What internally developed models do you use? [If an internally developed model is used in lieu of a commer-cially available model, differences between the two models must be understood.]
5) What post-model adjustments do you make to model outputs? [Companies may adjust model outputs toaccount for client-modeled retrocession business, deficiencies in clients’ data, and other soft factors.]
12 Moody’s Special Comment
IV. USER ASSUMPTIONS FOR COMMERCIALLY AVAILABLE MODELS1) Do you ‘switch on’ secondary uncertainty? [Secondary uncertainty is the variability around a loss estimate giventhat a particular event has occurred. For example, there is uncertainty associated with converting wind speeds to dam-age levels in the models for hurricanes. This is becoming standard practice.]
2) Do you ‘switch on’ loss amplification (RMS) /demand surge (AIR)? [Claim costs following an extreme event tendto increase because of greater demand for materials and labor to repair damaged property (“occurrence demand surge”).
3) Do you model all secondary perils? If not, what would be the difference in modeled results with all second-ary perils switched on? [Secondary perils are indirect causes of loss triggered by a main peril. Modeling firms alsohave industry modeled loss estimates with and without these secondary perils turned on, which may be helpful indeciding how much to adjust the sponsor’s cat curves.]
a) Storm surge following US Gulf and East Coast hurricanes?
b) Fire following earthquakes in Continental US and Japan?
c) Sprinkler leakage following earthquakes?
d) Coastal flooding in the UK triggered by European winter storms?
4) How do you allow for inuring reinsurance in the modeling process? [Aggregate level models cannot give ben-efit for inuring per risk reinsurance (which may lead to some conservatism). Companies may use ad hoc approaches toreflect the benefit of inuring reinsurance and special contract features.]
V. EXPOSURE DATA1) Describe your data collection procedures and the age of your IT systems. [Legacy IT systems may not be ableto accommodate detailed data needed for modeling. Reinsurers often send out questionnaires to clients/brokers.]
2) When you receive a submission, describe the types of "sanity checks" done to ensure accuracy of the data?[e.g., market share check — industry has $10 billion loss in Florida, client has 4% market share — but the client showsyou a $100 million modeled loss]
3) Data quality and quantity:
a) In what percent of cases are exposures geocoded? [Vendor models produce losses which vary significantly byaddress, even within a zip code, e.g. earthquake losses differ by soil type, coastal flooding in UK.]
b) In what percent of cases are property characteristics (e.g., construction type, occupancy, age, number ofrooms, floor space, shutters) captured in the data? [There’s no universal standard for coding these factors so thecompany may have to spend a lot of time to re-code them.]
c) In what percent of cases are values for buildings, contents, business interruption captured in the data?[Should be a given, but often isn’t.]
d) How do you ensure that the client isn’t under-reporting sums insured? What adjustments do you makefor underestimation? [Under-reporting of sum insured, relative to replacement value, is a frequent problembecause inflation is not estimated accurately.]
Moody’s Special Comment 13

4) How often do you go back to the client/broker/cedant with more questions about the data? [High percent-age may suggest adherence to high data standards or a need to make expectations better known upfront.]
5) What exposure adjustments do you make on clients’ data? On what % of the data? [e.g., to account forexpected exposure growth between the time the data was submitted to the in-force period of the contract; to accountfor expected underwriting changes going forward; to account for under-reporting of sums insured.]
6) Do you model historical events for submissions and compare them with actual loss histories? On what % ofsubmissions? [Purpose: to check that the client’s exposure data reasonably reflects loss potential.]
14 Moody’s Special Comment
Related Research
Special Comment:
Reinsurance Side-Cars: Going Along for the Ride, April 2006 (96863)
Special Report:
Moody’s Approach to Rating New Catastrophe Bond Perils and The Securitization of Mortality Risk,September 2006 (SF81860)
Rating Methodology:
Moody’s Approach to Rating Catastrophe Bonds Updated, January 2004 (SF31101)
Rating Actions:
Kepler Holdings Limited: Moody’s rates Kepler Holdings’ senior secured term loan (P)Ba2, February 26, 2007
Panther Re Bermuda Limited: Moody’s rates Panther Re’s loans — Baa3 Term A, Ba2 Term B, December 1, 2006
Concord Re Limited: Moody’s assigns Ba2 to Concord Re’s term loan facility, September 8, 2006
Flatiron Re Ltd.: Moody’s assigns Ba1 to Flatiron Re’s senior secured term loan facilities, August 24, 2006
Bay Point Re Ltd.: Moody’s assigns (P)Ba2 provisional rating to Bay Point Re Ltd’s senior secured term loan facilitydue 2010; outlook is stable, June 9, 2006
Cyrus Reinsurance Limited: Moody’s assigns Ba1 to Cyrus Re’s term loan facility, November 29, 2006
Cyrus Reinsurance Holdings SPC: Moody’s rates Cyrus Reinsurance Holdings’ senior debt Baa1, January 30, 2006
To access any of these reports, click on the entry above. Note that these references are current as of the date of publication of this reportand that more recent reports may be available. All research may not be available to all clients.
Moody’s Special Comment 15
© Copyright 2007, Moody’s Investors Service, Inc. and/or its licensors and affiliates including Moody’s Assurance Company, Inc. (together, “MOODY’S”). All rights reserved. ALLINFORMATION CONTAINED HEREIN IS PROTECTED BY COPYRIGHT LAW AND NONE OF SUCH INFORMATION MAY BE COPIED OR OTHERWISE REPRODUCED, REPACKAGED,FURTHER TRANSMITTED, TRANSFERRED, DISSEMINATED, REDISTRIBUTED OR RESOLD, OR STORED FOR SUBSEQUENT USE FOR ANY SUCH PURPOSE, IN WHOLE OR IN PART, INANY FORM OR MANNER OR BY ANY MEANS WHATSOEVER, BY ANY PERSON WITHOUT MOODY’S PRIOR WRITTEN CONSENT. All information contained herein is obtained byMOODY’S from sources believed by it to be accurate and reliable. Because of the possibility of human or mechanical error as well as other factors, however, such information is provided “asis” without warranty of any kind and MOODY’S, in particular, makes no representation or warranty, express or implied, as to the accuracy, timeliness, completeness, merchantability or fitnessfor any particular purpose of any such information. Under no circumstances shall MOODY’S have any liability to any person or entity for (a) any loss or damage in whole or in part caused by,resulting from, or relating to, any error (negligent or otherwise) or other circumstance or contingency within or outside the control of MOODY’S or any of its directors, officers, employees oragents in connection with the procurement, collection, compilation, analysis, interpretation, communication, publication or delivery of any such information, or (b) any direct, indirect,special, consequential, compensatory or incidental damages whatsoever (including without limitation, lost profits), even if MOODY’S is advised in advance of the possibility of suchdamages, resulting from the use of or inability to use, any such information. The credit ratings and financial reporting analysis observations, if any, constituting part of the informationcontained herein are, and must be construed solely as, statements of opinion and not statements of fact or recommendations to purchase, sell or hold any securities. NO WARRANTY,EXPRESS OR IMPLIED, AS TO THE ACCURACY, TIMELINESS, COMPLETENESS, MERCHANTABILITY OR FITNESS FOR ANY PARTICULAR PURPOSE OF ANY SUCH RATING OR OTHEROPINION OR INFORMATION IS GIVEN OR MADE BY MOODY’S IN ANY FORM OR MANNER WHATSOEVER. Each rating or other opinion must be weighed solely as one factor in anyinvestment decision made by or on behalf of any user of the information contained herein, and each such user must accordingly make its own study and evaluation of each security and ofeach issuer and guarantor of, and each provider of credit support for, each security that it may consider purchasing, holding or selling.
MOODY’S hereby discloses that most issuers of debt securities (including corporate and municipal bonds, debentures, notes and commercial paper) and preferred stock rated byMOODY’S have, prior to assignment of any rating, agreed to pay to MOODY’S for appraisal and rating services rendered by it fees ranging from $1,500 to approximately $2,400,000.Moody’s Corporation (MCO) and its wholly-owned credit rating agency subsidiary, Moody’s Investors Service (MIS), also maintain policies and procedures to address the independence ofMIS’s ratings and rating processes. Information regarding certain affiliations that may exist between directors of MCO and rated entities, and between entities who hold ratings from MIS andhave also publicly reported to the SEC an ownership interest in MCO of more than 5%, is posted annually on Moody’s website at www.moodys.com under the heading “ShareholderRelations — Corporate Governance — Director and Shareholder Affiliation Policy.”
16 Moody’s Special Comment
To order reprints of this report (100 copies minimum), please call 1.212.553.1658.Report Number: 102136
Author Production Associates
Kevin T. Lee, CFA David AinsworthIda ChanYung Louie