Embed Size (px)
Citation preview

Global and National Trends in Higher
Education
Damtew TEFERRA, Ph. D.
Professor of Higher EducationLeader, Higher Education Training and Development
Founding Director, International Network for Higher Education in Africa
University of Kwazulu-Natal—Boston College
25 July 2014Programme for the University Councils Training Workshop:
Kwazulu-Natal RegionWestville Campus
University of Kwazulu-Natal

Contemporary Trends
• ‘Massification’• Funding• Privatization• Internationalization• Quality• Mobility• Un(der)employment• Policy dimension

‘Massification’
• Since 2000, post-Secondary enrollments have increased from 100 million to well over 150 million (2008)
• Global enrollment expected to increase to 520 million in 2035
• In 2035 North America and Western Europe—52 million
• East Asia and the Pacific enrollment to exceed 100 million by 2020; and 200 million between 2033/34; 42% global enrollments
• Africa: Estimated 10 million currently
• South Africa: Estimated 1.6 million by 2025

ProfileCountry /region
No. Institutions
Population Enrollment (%)
United States 4,800 300 million 50
China 5,000 1.4 billion 22
India 504 [20,000]
1.4 billion 10
South Africa 23 [115] 50 million 17
Brazil 186 190 million 11 [27]
Africa 1,500+ 900 million 6

Higher Education Enrollment: Malawi
2003 2004 2005 2006 2007 20080
1,000
2,000
3,000
4,000
5,000
6,000
7,000
8,000
9,000
10,000
MaleFemaletotal

Higher Education Enrollment: Uganda
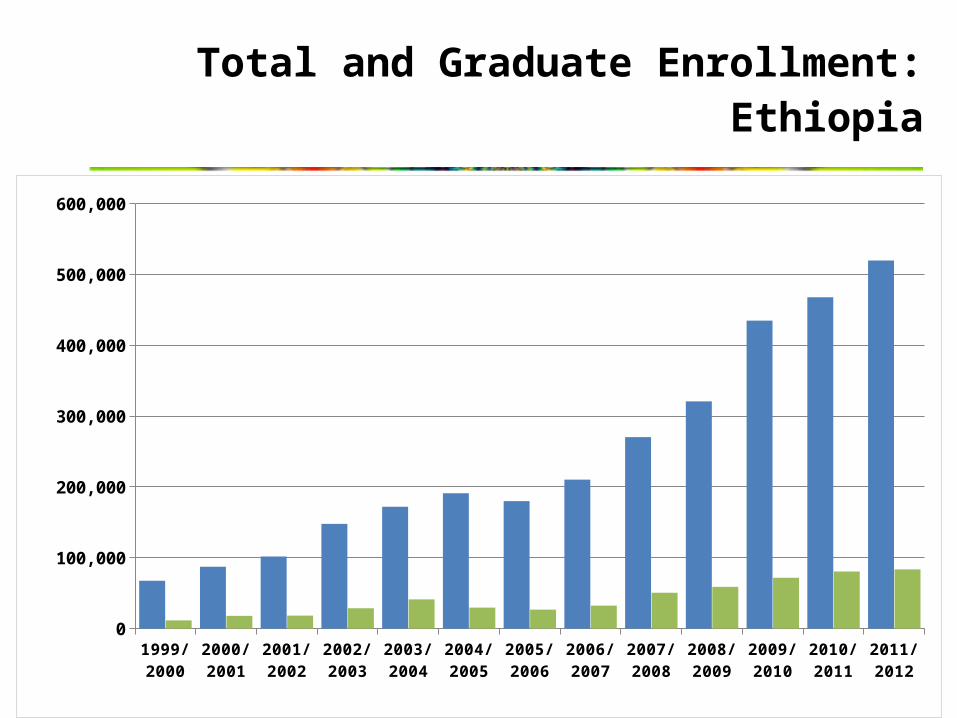
Total and Graduate Enrollment: Ethiopia
1999/2000
2000/2001
2001/2002
2002/2003
2003/2004
2004/2005
2005/2006
2006/2007
2007/2008
2008/2009
2009/2010
2010/2011
2011/2012
0
100,000
200,000
300,000
400,000
500,000
600,000
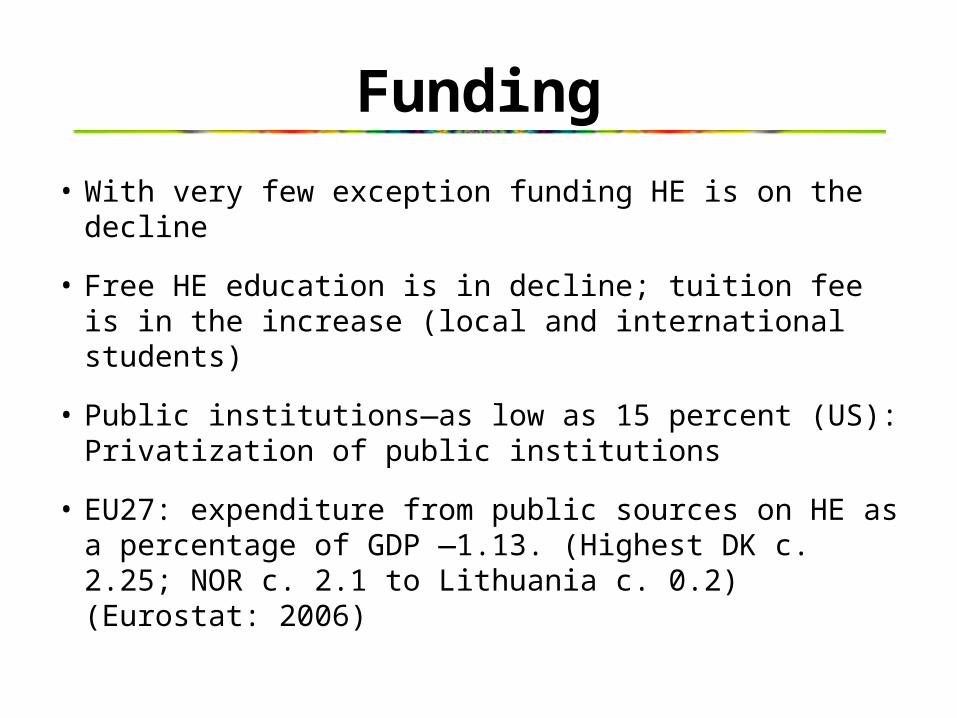
Funding
• With very few exception funding HE is on the decline
• Free HE education is in decline; tuition fee is in the increase (local and international students)
• Public institutions—as low as 15 percent (US): Privatization of public institutions
• EU27: expenditure from public sources on HE as a percentage of GDP —1.13. (Highest DK c. 2.25; NOR c. 2.1 to Lithuania c. 0.2) (Eurostat: 2006)
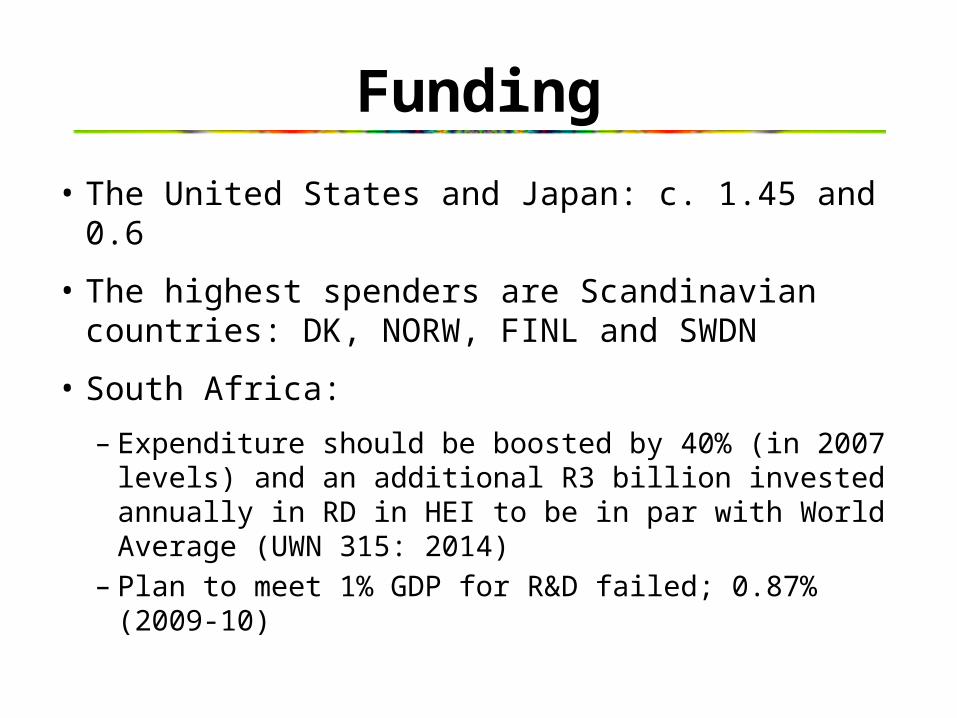
Funding
• The United States and Japan: c. 1.45 and 0.6
• The highest spenders are Scandinavian countries: DK, NORW, FINL and SWDN
• South Africa:
– Expenditure should be boosted by 40% (in 2007 levels) and an additional R3 billion invested annually in RD in HEI to be in par with World Average (UWN 315: 2014)
– Plan to meet 1% GDP for R&D failed; 0.87% (2009-10)

Funding: R and D
UWN: 269, 2013
Country Investment as % of GDP
Year Trend
Brazil 1.17 2009 Increasing
China >1 2008 Increasing
India 0.88 2008 Increasing
Russia 1.25 2009 Increasing
South Africa
0.87 2010 Decreasing

Funding: United States
Percentage change in state spending per student, inflation adjusted, FY08-FY13. cbpp.org

Funding Pattern: Malawi
2006-07 2007-08 2008-09 2009-10 2010-11 2011-120
500,000,000
1,000,000,000
1,500,000,000
2,000,000,000
2,500,000,000
3,000,000,000
3,500,000,000
Estimated Total Budget Expected Government FundingApproved Total Budget Approved Government Funding


Funding Sources: Makerere

Private Higher Education
• 31.3 percent global enrollment in Private HE (Levy, 2012)
• Europe (collectively): 16 percent average
• 60-80 percent of students in Japan, South Korea, Phillipines, Taiwan and China study in private universities
• Asia: 36 percent; highest for East Asia; lower for South Asia
• Latin America: 49 percent in PHE
• US: Between 20 to 25%; just recently 28%
• 25 percent students in Africa—private institutions
• Private-Public: NYU/Abu Dhabi; U Nottingham/U Zheijang
• The Age of cross-border education: MOOCs

Internationalization
• When students and academics travel abroad
• University signs an MOU with foreign (institutional or development) partners
• Satellite campuses or franchise private providers are established in a new locale
• When a curriculum with an eye on international issues is developed
• Institution/country reevaluates the mode of instructional delivery

Internationalization
• Countries work toward a common frame of reference such as harmonizing credentials, or attract foreign faculty
• Evaluate the essence of brain drain, diaspora engagement
• Engage in rankings/center of excellence activities
• Win a international grant• Faculty are engaged in collaborative
research and publishing

Journal Articles in All Fields1981-2009
Source: Thomson Reuters, Global Research Report: United States. November 2010

Science Papers per Year 1995-2009
Source: US National Science Foundation Data, Marginson, 2012

Productivity Measures
Most Prolific African Nations in 21 Main Fields 2004-2008
Top five nations ranked by number of papers /percent of papers in field
Source for the next slide: Jonathan Adams, Christopher King, and Daniel Hook.
Global Research Report—Africa. April 2010

State of Research
• What is the state of research productivity: publication and patenting
Most Prolific African Nations in 21 Main Fields 2004-2008Top five nations ranked by number of papers / percent of papers in field
FIELD 1 2 3 4 5Agricultural Sciences
Nigeria 952 / 0.95
South Africa 692 / 0.69
Egypt 461 / 0.46
Kenya 380 / 0.38
Tunisia 247 / 0.25
Biology & Biochemistry
South Africa 1, 242 / 0.46
Nigeria 1,004 / 0.37
Egypt 521 / 0.19
Tunisia 505 / 0.19
Morocco 200 / 0.07
Chemistry Egypt 3,634 / 0.62
South Africa 2,059 / 0.35
Algeria 1,065 / 0.18
Tunisia 980 / 0.17
Morocco 866 / 0.15
Clinical Medicine
South Africa 4,183 / 0.41
Egypt 2,584 / 0.26
Tunisia 1,587 / 0.16
Nigeria 1,392 / 0.14
Morocco 867 / 0.09
Computer Science
South Africa 359 / 0.24
Egypt 240 / 0.16
Algeria 170 / 0.11
Tunisia 163 / 0.11
Morocco 74 / 0.05
Economics & Business
South Africa 507 / 0.69
Kenya 54 / 0.07
Ethiopia 42 / 0.06
Nigeria 39 / 0.05
Tunisia 29 / 0.04
Engineering
Egypt 2,311 / 0.58
South Africa 1,385 / 0.35
Algeria 800 / 0.20
Tunisia 752 / 0.19
Morocco 459 / 0.12
Environment/Ecology
South Africa 1,707 / 1.29
Kenya 420 / 0.32
Egypt 367 / 0.28
Nigeria 351 / 0.27
Tanzania 206 / 0.16
Geosciences
South Africa 1,534 / 1.13
Egypt 434 / 0.32
Morocco 294 / 0.22
Algeria 148 / 0.11
Tunisia 141 / 0.10
Immunology
South Africa 518 / 0.86
Kenya 269 / 0.45
Uganda 207 / 0.34
Tanzania 110 / 0.18
Egypt 89 / 0.15
Materials Science
Egypt 1,421 / 0.61
Tunisia 575 / 0.23
Algeria 572 / 0.25
South Africa 524 / 0.23
Morocco 294 / 0.13
Mathematics
South Africa 652 / 0.52
Morocco 444 / 0.35
Tunisia 444 / 0.35
Egypt 368 / 0.29
Algeria 297 / 0.24

State of Research
• What is the state of research productivity: publication and patenting
FIELD 1 2 3 4 5
Microbiology
South Africa 534 / 0.66
Egypt 243 / 0.30
Tunisia 213 / 0.26
Kenya 147 / 0.18
Cameroon 76 / 0.09
Molecular Biology & Genetics
South Africa 276 / 0.20
Egypt 139 / 0.10
Tunisia 113 / 0.08
Kenya 58 / 0.04
Morocco 45 / 0.03
Neuroscience & Behaviour
South Africa 310 / 0.21
Egypt 75 / 0.05
Tunisia 58 / 0.04
Morocco 45 / 0.03
Nigeria 37 / 0.03
Pharmacology & Toxicology
Egypt 600 / 0.66
South Africa 375 / 0.41
Nigeria 235 / 0.26
Morocco101 / 0.11
Tunisia 90 / 0.10
Physics Egypt 1,880 / 0.40
South Africa 1,194 / 0.26
Algeria 933 / 0.20
Morocco 646 / 0.14
Tunisia 601 / 0.13
Plant & Animal Science
South Africa 4,179 / 1.55
Egypt 798 / 0.30
Kenya 784 / 0.29
Nigeria 602 / 0.22
Tunisia 527 / 0.19
Psychiatry/Psychology
South Africa 667 / 0.56
Nigeria 102 / 0.09
Egypt 43 / 0.04
Uganda 38 / 0.03
Kenya 30 / 0.03
Social Sciences, General
South Africa 2,107 / 1.06
Nigeria 331 / 0.17
Kenya 222 / 0.11
Tanzania 179 / 0.09
Ghana 140 / 0.07
Space Science
South Africa 556 / 0.93
Egypt 86 / 0.14
Namibia 51 / 0.09
Morocco 31 / 0.05
Algeria 24 / 0.04

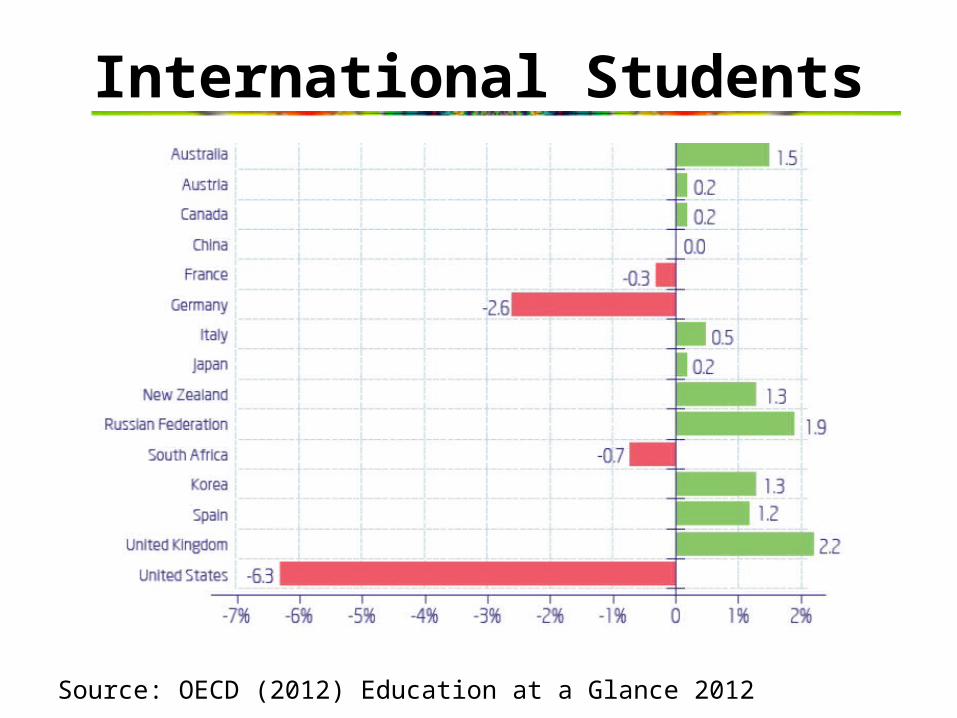
International Students
Source: OECD (2012) Education at a Glance 2012

International Students
Source: OECD (2012) Education at a Glance 2012
International Students
Source: OECD (2012) Education at a Glance 2012

Journal Articles in All Fields:1981-2009
Source: Thomson Reuters, Global Research Report: United States. November 2010

The Era of Rankings
• The Academic Ranking of World Universities/Shanghai Rankings (1,000)• QS World University Rankings• Times Higher Education• Centre for World University Rankings
(top 1,000)• U-Multirank (European Union)• US News and World Report

The Era of Rankings
• Centre for World University Rankings (top 1,000)
• 1. Quality of Education, measured by the number of a university's alumni who have won major international awards, prizes, and medals relative to the university's size [25%]
• 2. Alumni Employment, measured by the number of a university's alumni who currently hold CEO positions at the world's top companies relative to the university's size [25%]
• 3. Quality of Faculty, measured by the number of academics who have won major international awards, prizes, and medals [25%]
• 4. Publications, measured by the number of research papers appearing in reputable journals [5%]
• 5. Influence, measured by the number of research papers appearing in highly-influential journals [5%]
• 6. Citations, measured by the number of highly-cited research papers [5%]
• 7. Broad Impact, measured by the university's h-Index [5%] • 8. Patents, measured by the number of international patent filings [5%]

‘World Class University’: The Quest
• Leading, flagship, premier• 22 of 25 World’s Super research universities
—in the United States (Kearney 2009)• Japan (Global 30 Project), Korea (Brain
Korea 21)• China-211 Project (building 100 univ.) and
985 Project (selected consolidation)• Russia: A Ministerial committee—headed by
the Prime Minister• Centers of Excellence: Africa--PAU

The Quest for ‘World Class University’
‘GRRU’=Globally Relevant Research Universities
Country /region
No. Institutions
‘GRRU’
United States 4,800 150
China 5,000 9
India 504 [20,000] 10
South Africa 23 [115] 1?
Africa 1,500+ 1?+0?

Un(der)employment
• Creating a serious social and political upheaval: The Arab Spring
• “Time Bomb”—Brookings Institute (2011)• Europe: Graduates submit 60 application before
1st job; graduate unemployment in Europe: 6.2 (2012)
• Unemployed graduates US: 8.8 percent• Kenya: 40% (2008); Sudan: 20% (2012); Ghana:
12.9% (2005)• Botswana: 7.5% (2007)• South Africa: 24.9% (2011); 24.4% (2012 ) est;
graduate unemployment: 5.9%• Association of Unemployed Graduates (Ghana)

The Policy Dimension:Ambivalence and Confusion
• “Africa does not need PhDs.”• “Why should the economists need to be
Africans anyway?”• “Africa does not need ‘flagship’
universities.”• “Africa faces an undergraduate gap.”• “Higher education in Africa is a luxury,
that it might be better to close some institutions, or send those needing graduate work abroad.”

The VC: The Voice of the Council
In addition to the requisite personal traits and professional standing, a VC must be well conversant with the formidably complex institutional, national, regional and international higher education terrain of the 21st century.