Embed Size (px)
DESCRIPTION
IC substrate industry may be in a predicament in 2015, rooted in two aspects: first, the maturing of FOWLP; second, the tablet sales decline and sluggish smartphone growth. In addition, the prosperity of IC substrate industry in 2013 stimulated large-scale expansion of enterprises in 2014, thus leading to an insufficient rate of capacity utilization.
Citation preview

Global and China IC Substrate Industry
Report, 2015
Mar. 2015

METHODOLOGY
Both primary and secondary research methodologies were used
in preparing this study. Initially, a comprehensive and exhaustive
search of the literature on this industry was conducted. These
sources included related books and journals, trade literature,
marketing literature, other product/promotional literature, annual
reports, security analyst reports, and other publications.
Subsequently, telephone interviews or email correspondence
was conducted with marketing executives etc. Other sources
included related magazines, academics, and consulting
companies.
INFORMATION SOURCES
The primary information sources include Company Reports,
and National Bureau of Statistics of China etc.
STUDY GOAL AND OBJECTIVES
This report provides the industry executives with strategically significant
competitor information, analysis, insight and projection on the
competitive pattern and key companies in the industry, crucial to the
development and implementation of effective business, marketing and
R&D programs.
REPORT OBJECTIVES
To establish a comprehensive, factual, annually updated and cost-
effective information base on market size, competition patterns,
market segments, goals and strategies of the leading players in the
market, reviews and forecasts.
To assist potential market entrants in evaluating prospective
acquisition and joint venture candidates.
To complement the organizations’ internal competitor information
gathering efforts with strategic analysis, data interpretation and
insight.
To suggest for concerned investors in line with the current
development of this industry as well as the development tendency.
To help company to succeed in a competitive market, and
understand the size and growth rate of any opportunity.
Room 502, Block 3, Tower C, Changyuan Tiandi Building, No. 18, Suzhou Street, Haidian District, Beijing, China 100080 Phone: +86 10 82600828 ● Fax: +86 10 82601570 ● www.researchinchina.com ● [email protected]
Copyright 2012 ResearchInChina
Abstract
Global and China IC Substrate Industry Report, 2015 highlights the
followings:
1. Status quo of semiconductor and IC packaging industry
2. Analysis on downstream market of IC substrate
3. Development trend of IC substrate
4. Analysis on IC substrate industry
5. Research on 12 IC substrate vendors
6. Research on 6 IC substrate peripheral companies
IC substrate industry may be in a predicament in 2015, rooted in two
aspects: first, the maturing of FOWLP; second, the tablet sales
decline and sluggish smartphone growth. In addition, the prosperity
of IC substrate industry in 2013 stimulated large-scale expansion of
enterprises in 2014, thus leading to an insufficient rate of capacity
utilization.
For FC-CSP substrate with mobile phone and tablet PC as the core
market facing strong competition from FOWLP that has
overwhelming superiorities including low profile, higher speed, more
I/O, higher integration, less processing step, especially needing no
substrate which slashes cost as IC substrate accounts for more
than half of the total cost of IC.
Room 502, Block 3, Tower C, Changyuan Tiandi Building, No. 18, Suzhou Street, Haidian District, Beijing, China 100080 Phone: +86 10 82600828 ● Fax: +86 10 82601570 ● www.researchinchina.com ● [email protected]
Copyright 2012ResearchInChina
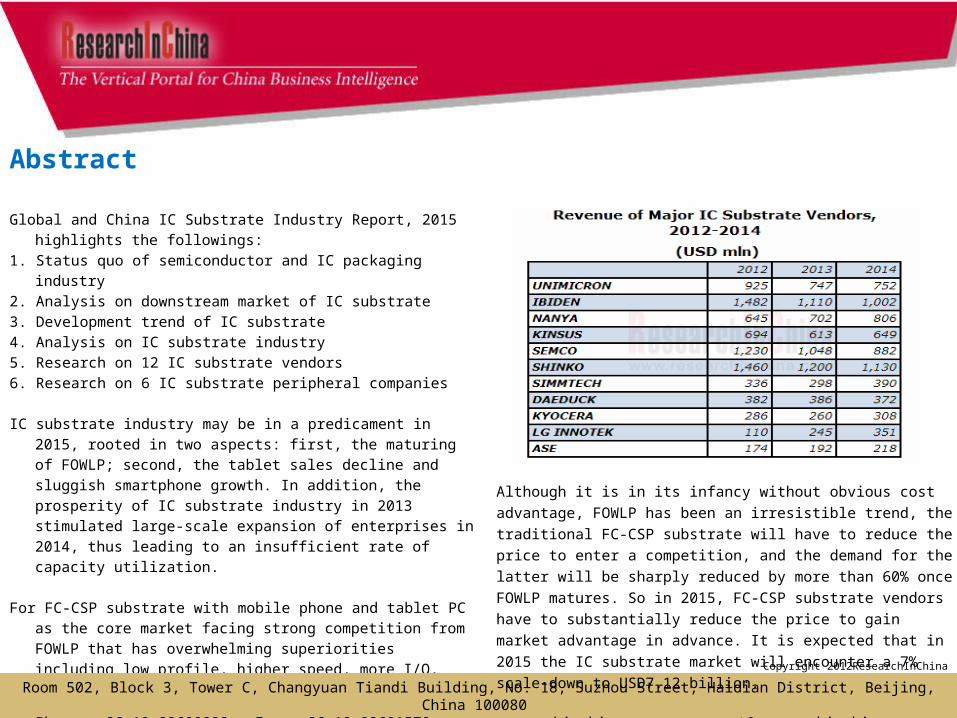
Although it is in its infancy without obvious cost advantage, FOWLP
has been an irresistible trend, the traditional FC-CSP substrate will
have to reduce the price to enter a competition, and the demand for
the latter will be sharply reduced by more than 60% once FOWLP
matures. So in 2015, FC-CSP substrate vendors have to substantially
reduce the price to gain market advantage in advance. It is expected
that in 2015 the IC substrate market will encounter a 7% scale-down to
USD7.12 billion.

In the downstream market, large screen mobile phone squeezed the living space of tablet PC which declined significantly. And the single-
functional tablet PC is mostly used as a toy for children with less demand for replacement. In the field of smartphone, China as the world’s
largest smartphone market declined in 2014.
SiP packaging substrate will be the highlight for IC substrate market in 2015 as core components of high-end smart watches must adopt SiP
packaging. Both the two core processors built in Apple Watch use SiP packaging technology. The most important SiP substrate of Apple
Watch calls for the most difficult production, priced 4-5 times higher than FCCSP applied to general ARM processor. The orders are shared
by Nanya, Kinsus and other Taiwanese vendors. ASE undertakes Apple Watch’s SI chip SiP packaging business.
The PC market is also likely to recover in 2015 for tablet PC slump means the recovery of laptop computer market. Laptop computer market
saw the first growth in 2014 after three consecutive years of decline and is expected to continue the trend in 2015. And laptop discrete
graphics card accounts for a zooming proportion, signifying GPU shipments boost.
Another excellent performer in IC substrate applications is the memory market.
Room 502, Block 3, Tower C, Changyuan Tiandi Building, No. 18, Suzhou Street, Haidian District, Beijing, China 100080 Phone: +86 10 82600828 ● Fax: +86 10 82601570 ● www.researchinchina.com ● [email protected]
Copyright 2012ResearchInChina

1. Global Semiconductor Industry
1.1 Overview
1.2 IC Packaging
1.3 IC Packaging and Testing
2. Downstream Market of IC Substrate
2.1 Introduction to IC Substrate
2.2 Flip Chip IC Substrate
2.3 Global Mobile Phone Market
2.4 Global Smartphone Market
2.5 Chinese Mobile Phone Market
2.6 Laptop Computer Market
2.7 CPU and GPU Market
2.8 Memory Market
3. IC Substrate Market and Industry
3.1 IC Substrate Market
3.2 Wide IO/HMC Memory
3.3 Embedded Component Substrate
3.4 Embedded Trace Substrate
3.5 IC Packaging for Portable Devices
3.5.1 Status Quo
3.5.2 PoP Packaging
3.5.3 FOWLP
3.6 SIP Packaging
Table of contents
Room 502, Block 3, Tower C, Changyuan Tiandi Building, No. 18, Suzhou Street, Haidian District, Beijing, China 100080 Phone: +86 10 82600828 ● Fax: +86 10 82601570 ● www.researchinchina.com ● [email protected]
3.7 2.5D Packaging (SI/Glass/Organic Interposer)
3.7.1 Introduction to 2.5D Packaging
3.7.2 Application of 2.5D Packaging
3.7.3 Market Size of 2.5D Interposer
3.7.4 Suppliers of 2.5D Packaging
3.8 TSV (3D) Packaging
3.8.1 TSV Packaging Equipment
3.9 FC-PoP Packaging
3.10 IC Substrate Industry
4. IC Substrate Vendors
4.1 Unimicron
4.2 IBIDEN
4.3 Daeduck Electronics
4.4 SIMMTECH
4.5 LG INNOTEK
4.6 SEMCO
4.7 Nan Ya PCB
4.8 KINSUS
4.9 SHINKO
4.10 KYOCERA SLC
4.11 AT&S
4.12 ACCESS
4.13 EASTERN
5. IC Substrate Packaging Companies
5.1 ASE
5.2 AMKOR
5.3 SPIL
5.4 STATS ChipPAC
5.5 Mitsubishi Gas Chemical Company
5.6 AJINOMOTO
• Global Semiconductor Market Size, 1994-2019E
• Global Semiconductor Market Growth Rate, 2015
• Downstream Application of Global Semiconductor Market, 1998-2019E
• Geographical Distribution of Global Semiconductor Market, 2009-2019E
• Capital of Global Semiconductor Enterprises, 2000-2019E
• Geographical Distribution of Global Semiconductor Equipment Market, 2012-2016E
• Wafer Process Equipment Sales by Product, 2010-2019E
• Top 30 of Global Semiconductor Industry by Revenue, 2014
• IC Packaging Types Used by Major Electronic Products
• Global IC Packaging and Testing Market Size, 2012-2017E
• Global Outsourcing IC Packaging and Testing Market Size, 2012-2017E
• Global IC Packaging Market Size, 2012-2017E
• Global IC Testing Market Size, 2012-2017E
• Revenue of Taiwan Packaging and Testing Industry, 2009-2013
• Revenue of Top 10 Global Packaging Enterprises, 2013
• Global Mobile Phone Shipments, 2007-2015E
• Geographical Distribution of Global 3G/4G Mobile Phone Shipments, 2011-2014
• Worldwide Mobile Phone Sales to End Users by Vendor in 2013
• Shipments of Top 10 Global Mobile Phone Vendors, Q3 2014
• Worldwide Smartphone Sales to End Users by Vendor in 2013
• Worldwide Smartphone Sales to End Users by Operating System in 2013
• Shipments of Top 13 Global Smartphone Vendors, 2013-2015E
• Shipments of Major Smartphone Vendors, Q3 2014
• Monthly Shipments of China Mobile Phone Market, 2013-2014
• Market Share of Major Vendors in China Smartphone Market, 2014
Selected Charts
Room 502, Block 3, Tower C, Changyuan Tiandi Building, No. 18, Suzhou Street, Haidian District, Beijing, China 100080 Phone: +86 10 82600828 ● Fax: +86 10 82601570 ● www.researchinchina.com ● [email protected]
• Market Share of Major Vendors in China 4G Mobile Phone Market, 2014
• Global Tablet PC Shipments, 2011-2016E
• Top Five Tablet Vendors, Shipments Fourth Quarter 2014
• Top Five Tablet Vendors, Shipments, Market Share, and Growth, Calendar Year 2014
• CPU and GPU Shipments, 2008-2015E
• Laptop Computer Shipments, 2008-2015E
• Shipments of Major Global Laptop ODM Vendors, 2010-2014
• Memory Market Size, 2012-2016E
• IC Substrate Market Size, 2009-2016E
• IC Substrate Market Size by Technology, 2009-2016E
• Specific Application Products of IC Substrate
• Mobile DRAM Trend
• Advantages of WIDE IO
• SK Hynix WIDE IO2 Roadmap
• HMC Architecture
• HMC BENEFITS
• Advantages of Embedded Passive and Active Component Motherboard
• Embedded Component Substrate Process
• Comparison of Embedded Active & Passive Components
• Roadmap of Embedded Passive Substrate
• Structure Roadmap of Embedded Active Substrate
• FOWLP and PLP Process Comparison
• WHY EMBEDDED TRACE?
• EMBEDDED TRACE Package Features
• EMBEDDED TRACE Package Sweet Spot (for Wire Bonding)
Selected Charts
Room 502, Block 3, Tower C, Changyuan Tiandi Building, No. 18, Suzhou Street, Haidian District, Beijing, China 100080 Phone: +86 10 82600828 ● Fax: +86 10 82601570 ● www.researchinchina.com ● [email protected]

• EMBEDDED TRACE Package Sweet Spot (for FLIP CHIP)
• Apple iPad 4 LTE A1459 IC Package Type List
• Development Trend of PoP Packaging
• 2.5D Interposer Manffacturing Revenue
• Breakdown by Interposer Bulk Material, 2010-2017
• Downstream Application of TSV
• TSV Equipment Suppliers
• Distribution of TSV Packaging Equipment, 2012-2017E
• Revenue of Major IC Substrate Vendors, 2010-2014
• Unimicron’s Organizational Structure
• Unimicron’s Revenue and Gross Margin, 2003-2014
• Unimicron’s Revenue and Operating Margin, 2009-2014
• Unimicron’s Revenue and Gross Margin, Q1 2012-Q4 2014
• Unimicron’s Sales Breakdown by Technology, 2010-2014
• Unimicron’s Sales Breakdown by Application, 2010-2014
• Unimicron’s Capacity, 2010-2014
• Unimicron’s CAPEX, 2004-2013
• Unimicron’s M & A
• IBIDEN’s Revenue and Operating Margin, FY2006-FY2015
• IBIDEN’s Revenue Breakdown by Business, FY2006-FY2015
• IBIDEN’s Revenue Breakdown by Business, Q2 2012-Q2 2014
• IBIDEN’s Operating Income by Business, Q2 2012-Q2 2014
• Ibiden Electronics’ Revenue Breakdown by Product, FY2010-FY2015
• IBIDEN’s CAPEX and Depreciation, FY2010-FY2015
• Daeduck Electronics’ Revenue and Operating Margin, 2005-2014
Selected Charts
Room 502, Block 3, Tower C, Changyuan Tiandi Building, No. 18, Suzhou Street, Haidian District, Beijing, China 100080 Phone: +86 10 82600828 ● Fax: +86 10 82601570 ● www.researchinchina.com ● [email protected]
• Daeduck Electronics’ Revenue by Business, 2009-2014
• Daeduck GDS’ Revenue and Operating Margin, 2005-2014
• Daeduck GDS’ Revenue Breakdown by Business, 2010-2014
• SIMMTECH’s Organizational Structure
• SIMMTECH’s Revenue and Operating Margin, 2004-2014
• SIMMTECH’s Revenue, Gross Margin and Net Profit Margin, 2009-2014
• SIMMTECH’s Balance Sheet, 2009-2013
• SIMMTECH’s Revenue Breakdown by Product, 2013-2015
• SIMMTECH’s Gross Margin and Operating Margin, Q1 2013-Q4 2014
• SIMMTECH’s Shipments, Q1 2013-Q4 2014
• SIMMTECH’s Shipments, 2012-2015E
• SIMMTECH’s Capacity Utilization, Q1 2013-Q4 2014
• SIMMTECH’s Capacity Utilization, 2012-2015E
• SIMMTECH’s Revenue by Application, 2008-2014
• SIMMTECH’s Substrate Revenue by Application, 2012-2014
• SIMMTECH’s Plants
• LG INNOTEK’s Revenue and Operating Margin, 2006-2015E
• LG INNOTEK’s Revenue and Operating Margin, Q1 2012-Q4 2014
• LG INNOTEK’s Revenue Breakdown by Business, 2011-2015E
• LG INNOTEK’s Operating Income by Business, 2011-2015E
• SEMCO’s Revenue and Operating Margin, 2009-2014
• SEMCO’s Revenue Breakdown by Department, 2010-2014
• Revenue and Operating Margin of SEMCO’s ACI Segment, Q1 2013-Q4 2014
• SEMCO’s HDI and PKG Revenue, Q1-Q4 2014
• Nan Ya PCB’s Organizational Structure
Selected Charts
Room 502, Block 3, Tower C, Changyuan Tiandi Building, No. 18, Suzhou Street, Haidian District, Beijing, China 100080 Phone: +86 10 82600828 ● Fax: +86 10 82601570 ● www.researchinchina.com ● [email protected]
• Nan Ya PCB’s Revenue and Gross Margin, 2006-2014
• Nan Ya PCB’s Revenue and Operating Margin, 2009-2015E
• Nan Ya PCB’s Revenue and Growth Rate, Jan 2013-Jan 2015
• Nan Ya PCB’s Capacity and Global Distribution
• KINSUS’ Revenue and Gross Margin, 2004-2014
• KINSUS’ Revenue and Operating Margin, 2009-2015E
• KINSUS’ Revenue and Growth Rate, Jan 2013-Jan 2015
• KINSUS’ Revenue Breakdown by Product, 2011-2014
• KINSUS’ Revenue Breakdown by Application, 2011
• KINSUS’ Revenue by Application, Q1 2014
• KINSUS’ Revenue by Application, Q4 2014
• Customer Distribution of KINSUS, 2013\2014
• SHINKO’s Revenue and Net Income, FY2007-FY2015
• SHINKO’s Revenue Breakdown by Business, FY2010-FY2015
• AT&S and EBITDA Margin, FY2005-FY2015
• Chongqing Substrate Plant Ramp of AT&S
• AT&S’ Revenue Breakdown by Business/Region, FY2014
• AT&S’ Revenue Breakdown by Business/Region, FY2015
• Revenue of AT&S’ Mobile Devices & Substrates Business, Q2/13-Q4/14
• Main Customers of AT&S’ Mobile Devices & Substrates Business
• Revenue of AT&S’ Industrial & Automotive Business, Q2/13-Q4/14
• Main Customers of AT&S’ Industrial & Automotive Business
• AT&S’ Employees, 2010-2015
• AT&S’ CAPEX, 2010-2015E
• ASE’s Organizational Structure
Selected Charts
Room 502, Block 3, Tower C, Changyuan Tiandi Building, No. 18, Suzhou Street, Haidian District, Beijing, China 100080 Phone: +86 10 82600828 ● Fax: +86 10 82601570 ● www.researchinchina.com ● [email protected]
• ASE’s Revenue and Gross Margin, 2005-2015E
• ASE’s Revenue and Operating Margin, 2009-2015E
• ASE’s Revenue, Jan 2013-Jan 2015
• ASE’s Revenue Breakdown by Business, 2010-2014
• Revenue and Gross Margin of ASE’s Packaging Division, Q1 2013-Q4 2014
• Revenue Breakdown of ASE’s Packaging Division by Type, Q1 2013-Q4 2014
• Revenue and Gross Margin of ASE’s Materials Division, Q1 2013-Q4 2014
• Revenue Breakdown of ASE’s IC Business by Application, Q1 2013-Q4 2014
• ASE’s EMS Revenue and Gross Margin, Q1 2013-Q4 2014
• ASE’s EMS Revenue Breakdown, Q1 2013-Q4 2014
• Amkor’s Revenue, Gross Margin and Operating Margin, 2005-2014
• Amkor’s Revenue Breakdown by Packaging Type, 2007-2014
• Amkor’s Packaged Units, 2012-2014
• Amkor’s Revenue Breakdown by Application, 2012-2014
• SPIL’s Organizational Structure
• SPIL’s Revenue, Gross Margin and Operating Margin, 2003-2014
• SPIL’s Revenue, Jan 2013-Jan 2015
• SPIL’s Revenue, Gross Margin and Operating Margin, Q4 2012-Q4 2014
• SPIL’s Revenue Breakdown by Region, 2005-2014
• SPIL’s Revenue Breakdown by Application, 2005-2014
• SPIL’s Revenue Breakdown by Business, 2005-2014
• SPIL’s Capacity, 2006-2014
• STATS ChipPAC’s Revenue and Gross Margin, 2004-2014
• STATS ChipPAC’s Balance Sheet, 2014
• STATS ChipPAC’s Revenue Breakdown by Packaging Type, 2006-2013
Selected Charts
Room 502, Block 3, Tower C, Changyuan Tiandi Building, No. 18, Suzhou Street, Haidian District, Beijing, China 100080 Phone: +86 10 82600828 ● Fax: +86 10 82601570 ● www.researchinchina.com ● [email protected]
• STATS ChipPAC’s Revenue Breakdown by Application, 2006-2013
• STATS ChipPAC’s Revenue Breakdown by Region, 2006-2013
• Global Distribution of STATS ChipPAC
• STATS ChipPAC’s Revenue Breakdown by Region/Business, 2014
• Mitsubishi Gas Chemical’s Organization Chart
• MGC’s Revenue and Operating Income, FY2009-FY2015
• MGC’s Revenue by Segment, FY2009-FY2015
• MGC’s Operating Income by Segment, FY2009-FY2015
• CAPEX and Depreciation of MGC’s Information and Advanced Material Division, FY2009-FY2015
• ABF Application
• ABF Manufacturing Process
• ABF Construction
• Outline of Manufacturing Substrate Using ABF
• Next Build-up Material in Demand
Selected Charts
Room 502, Block 3, Tower C, Changyuan Tiandi Building, No. 18, Suzhou Street, Haidian District, Beijing, China 100080 Phone: +86 10 82600828 ● Fax: +86 10 82601570 ● www.researchinchina.com ● [email protected]
You can place your order in the following alternative ways:
1.Order online at www.researchinchina.com
2.Fax order sheet to us at fax number:+86 10 82601570
3. Email your order to: [email protected]
4. Phone us at +86 10 82600828/ 82601561
Party A:Name:Address:Contact Person: TelE-mail: Fax
Party B:Name: Beijing Waterwood Technologies Co., Ltd (ResearchInChina)Address: Room 502, Block 3, Tower C, Changyuan Tiandi Building, No. 18,
Suzhou Street, Haidian District, Beijing, China 100080Contact Person:
Liao Yan Phone:
86-10-82600828
E-mail: [email protected] Fax: 86-10-82601570Bank details:
Beneficial Name: Beijing Waterwood Technologies Co., LtdBank Name: Bank of Communications, Beijing BranchBank Address: NO.1 jinxiyuan shijicheng,Landianchang,Haidian District,BeijingBank Account No #: 110060668012015061217Routing No # : 332906Bank SWIFT Code: COMMCNSHBJG
Title Format Cost
Total
Choose type of format
PDF (Single user license) …………..2,200 USD
Hard copy ………………….……. 2,350 USD
PDF (Enterprisewide license)…....... 3,500 USD
※ Reports will be dispatched immediately
once full payment has been received.
Payment may be made by wire transfer or
credit card via PayPal.
How to Buy
Room 502, Block 3, Tower C, Changyuan Tiandi Building, No. 18, Suzhou Street, Haidian District, Beijing, China 100080 Phone: +86 10 82600828 ● Fax: +86 10 82601570 ● www.researchinchina.com ● [email protected]

About ResearchInChina
ResearchInChina (www.researchinchina.com) is a leading independent provider of China business intelligence. Our research is designed to meet the diverse planning and information needs of businesses, institutions, and professional investors worldwide. Our services are used in a variety of ways, including strategic planning, product and sales forecasting, risk and sensitivity management, and as investment research.
Our Major Activities
Multi-users market reports
Database-RICDB
Custom Research
Company Search
RICDB (http://www.researchinchina.com/data/database.html ), is a visible financial data base presented by map and graph covering global and China macroeconomic data, industry data, and company data. It has included nearly 500,000 indices (based on time series), and is continuing to update and increase. The most significant feature of this base is that the vast majority of indices (about 400,000) can be displayed in map.
After purchase of our report, you will be automatically granted to enjoy 2 weeks trial service of RICDB for free.
After trial, you can decide to become our formal member or not. We will try our best to meet your demand. For more information, please find at www.researchinchina.com
For any problems, please contact our service team at:
Room 502, Block 3, Tower C, Changyuan Tiandi Building, No. 18, Suzhou Street, Haidian District, Beijing, China 100080 Phone: +86 10 82600828 ● Fax: +86 10 82601570 ● www.researchinchina.com ● [email protected]
RICDB service