Embed Size (px)
Citation preview
GLOBAL ADULT TOBACCO SURVEY (GATS) MALAYSIA 2011
MALAYSIA-2012
MINISTRY OF HEALTH MALAYSIA
INSTITUTE FOR PUBLIC
HEALTH
CENTERS FOR DISEASE CONTROL AND PREVENTION
WORLD HEALTH ORGANIZATION
Copyright © Institute for Public Health, National Institute of Health, Ministry of Health, Malaysia, 2012. All right reserved This work is copyright. Institute for Public Health welcomes requests for permission to reproduce this publication in whole or in part. Applications and inquiries should be addressed to the Principal Investigator, Global Adult Tobacco Survey (GATS) Malaysia 2011, Institute for Public Health, Ministry of Health, Malaysia. ISBN: 978-963-3887-72-9 Suggested citation: Institute for Public Health (IPH). Report of the Global Adult Tobacco Survey (GATS) Malaysia, 2011, Ministry of Health Malaysia, 2012. Produced and Distributed by: Global Adult Tobacco Survey (GATS) Malaysia 2011 Institute for Public Health National Institute of Health Ministry of Health Jalan Bangsar 50590 Kuala Lumpur MALAYSIA Tel: +603-22979400 Fax: +603-22823114 Any enquiries about or comments on this report should be directed to: Helen Tee Guat Hiong Principal Investigator Global Adult Tobacco Survey (GATS) Malaysia 2011 Institute for Public Health National Institute of Health Ministry of Health Jalan Bangsar 50590 Kuala Lumpur Malaysia Published by Institute for Public Health, National Institute of Health, Ministry of Health, Malaysia.
This research project was partly sponsored by the World Health Organization. (Project No: HQTFI1003729)
i
Contributors
Helen Tee Guat Hiong
Muhammad Fadhli Mohd Yusoff
Sukhvinder Singh
Zarihah Zain
Lim Kuang Hock
Gurpreet Kaur
Tahir Aris
Teh Chien Huey
Chan Ying Ying
Nabilla Al-Sadat Abdul Mohsein
Zanariah Zaini
Ummi Nadiah Yusoff
Mohd Azahadi Omar
Nor Kamilah Nasrir
Mohamad Haniki Nik Mohamed
Munshi Abdullah
Balkish Mahadir Naidu
ii
CONTENTS Page No.
Contributors ................................................................................................................................................. i
Foreword .................................................................................................................................................... vii
Preface ...................................................................................................................................................... viii
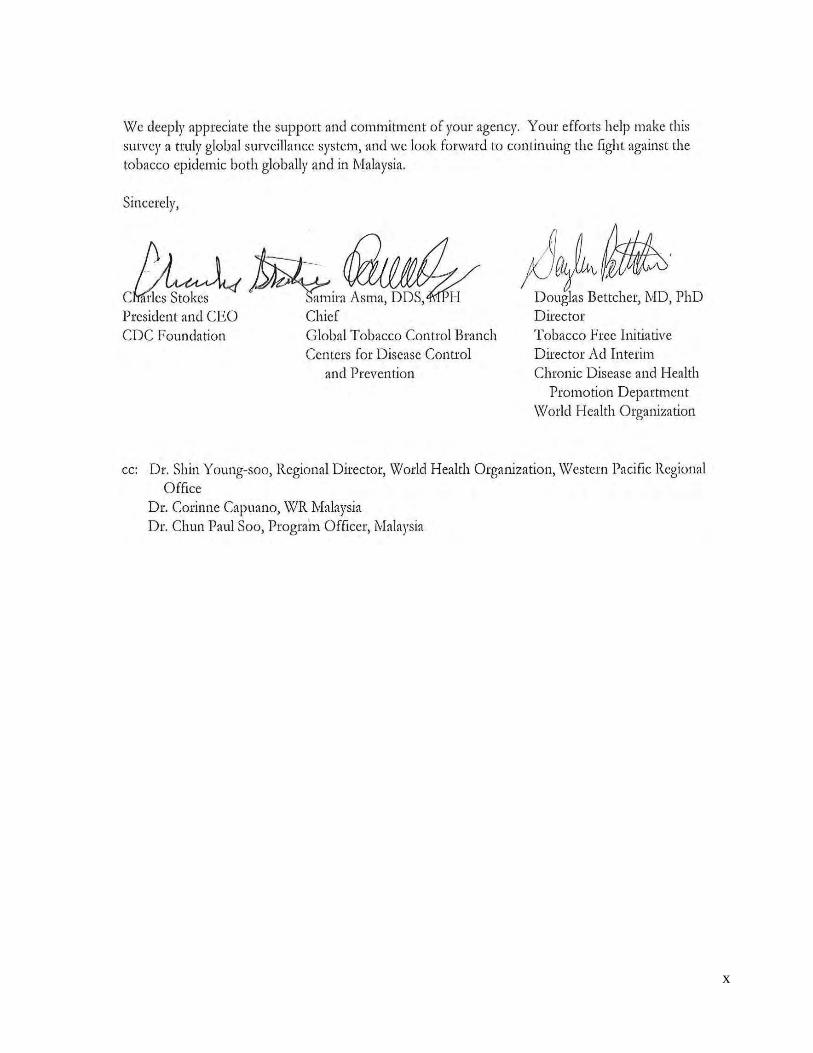
Congratulatory Letter ................................................................................................................................ ix
Acknowledgements ................................................................................................................................... xi
Executive Summary .................................................................................................................................. xii
1. Introduction ......................................................................................................................................... 1
1.1 Tobacco Control in Malaysia ....................................................................................................... 2
1.2 Burden of Tobacco Use in Malaysia ........................................................................................... 6
1.3 Survey Objectives ....................................................................................................................... 7
2. Methodology ........................................................................................................................................ 8
2.1 Study Population ......................................................................................................................... 8
2.2 Sampling Design ......................................................................................................................... 8
2.3 Questionnaire .............................................................................................................................. 8
2.4 Programming of the Questionnaire and the Preparation of Handheld Computers ................... 10
2.5 Data Collection .......................................................................................................................... 10
2.6 Statistical Analysis .................................................................................................................... 12
3. Sample and Population Characteristics ......................................................................................... 14
3.1 Household and Person-Level Response Rate .......................................................................... 14
3.2 Sample and Population Characteristics .................................................................................... 14
4. Tobacco Use ...................................................................................................................................... 17
4.1 Tobacco Smoking ..................................................................................................................... 18
4.2 Smokeless Tobacco .................................................................................................................. 19
4.3 The Prevalence of Various Smoked Tobacco Products ........................................................... 19
4.4 Number of Users of Various Smoked Tobacco Products ......................................................... 24
4.5 Frequency of Smoking .............................................................................................................. 28
4.6 Number of Manufactured Cigarettes Smoked per Day ............................................................. 32
4.7 Average Age at Initiation of Daily Smoking and Distribution of Initial Age ................................ 34
4.8 Prevalence of Former Daily Smoking and the Quit Ratio ......................................................... 36
4.9 Time Since Quitting Smoking .................................................................................................... 38
4.10 Prevalence of Current Tobacco Users by Type of Use ............................................................ 40
4.11 Time to First Smoke After Awakening ....................................................................................... 42
4.12 Shisha Smoking ........................................................................................................................ 44
4.13 Electronic Cigarettes ................................................................................................................. 44
iii
5. Cessation ........................................................................................................................................... 45
5.1 Attempts to Quit Smoking and Receipt of Advice to Quit from Health Care Providers............. 45
5.2 Cessation Methods Used by Those Who Attempted to Quit Smoking ..................................... 47
5.3 Interest in Quitting Smoking ..................................................................................................... 49
6. Secondhand Smoke .......................................................................................................................... 51
6.1 Exposure to Secondhand Smoke in the Workplace ................................................................. 51
6.2 Exposure to Secondhand Smoke at Home ............................................................................... 52
6.3 Exposure to Secondhand Smoke in Public Places ................................................................... 54
7. Economics ......................................................................................................................................... 61
7.1 Brand of Manufactured Cigarettes at Last Purchase ................................................................ 61
7.2 Source of Last Purchase of Cigarettes ..................................................................................... 62
7.3 Expenditures on Cigarettes ....................................................................................................... 65
9. Media .................................................................................................................................................. 67
8.1 Noticing Anti-cigarette Information ............................................................................................ 67
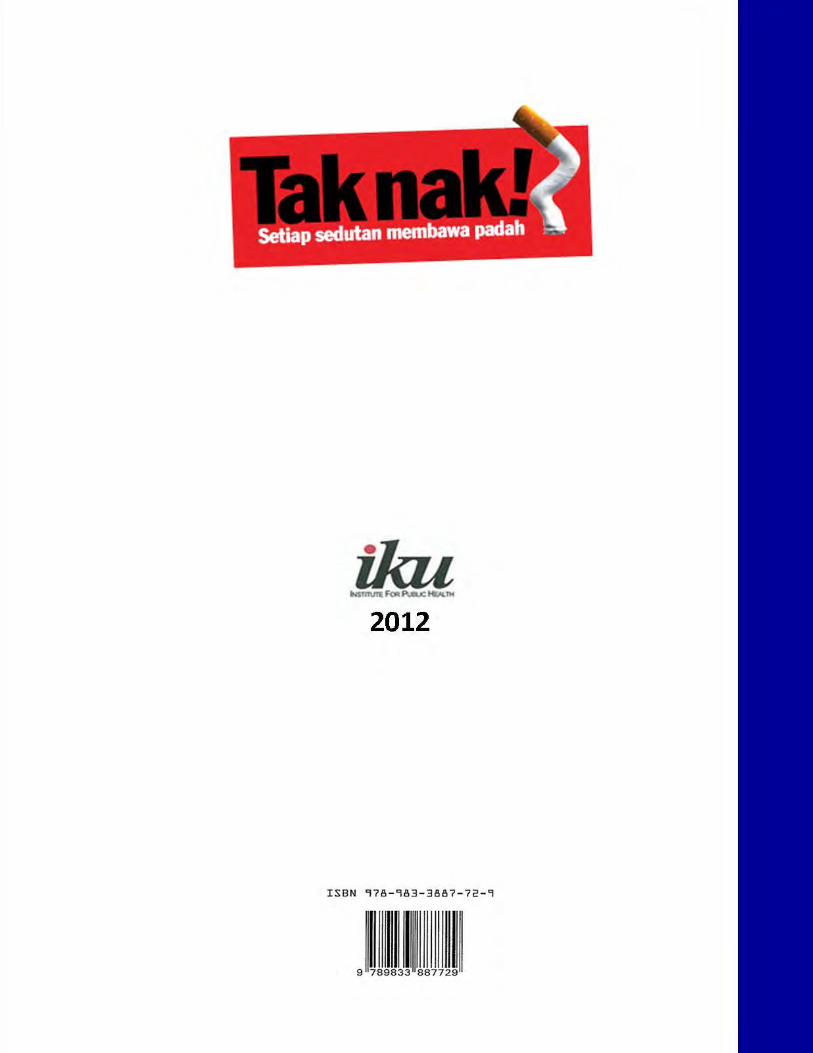
8.2 Awareness of the “Tak Nak” Anti-smoking Campaign .............................................................. 71
8.3 Health Warnings on Cigarette Packages and Thinking About Quitting .................................... 73
8.4 Thinking About the Health Risks of Smoking from Seeing Health Warnings ........................... 75
8.5 Effect of Health Warnings on the Prevention of Smoking ......................................................... 77
8.6 Adults Who Noticed Cigarette Marketing .................................................................................. 79
9. Knowledge, Attitudes, and Perceptions ......................................................................................... 84
9.1 Belief That Smoking Causes Serious Illness and Various Specific Diseases .......................... 84
9.2 Levels of Belief That Breathing Other People's Smoke Causes Serious Illness in Non-Smokers .................................................................................................................................... 91
9.3 Support for Prohibiting Indoor Smoking in Various Places ....................................................... 91
9.4 Support for Tobacco Control Laws ........................................................................................... 91
10. Recommendations and Conclusions .............................................................................................. 99
10.1 Recommendations .................................................................................................................... 99
10.2 Conclusions ............................................................................................................................. 109
References ............................................................................................................................................... 110
Appendix A: Questionnaire .................................................................................................................... 113
Appendix B: Sample Design .................................................................................................................. 153
Appendix C: Estimates of Sampling Errors ......................................................................................... 156
Appendix D: Technical and Survey Staff .............................................................................................. 163
Appendix E: Glossary of Terms ............................................................................................................ 166
Appendix F: MPOWER Summary Indicators ........................................................................................ 174
iv
Table No. Content of the Tables Page
CHAPTER 1 INTRODUCTION
Table 1.1: Major events and studies in the history of tobacco control in Malaysia. ............................... 2
Table 1.2: Malaysian laws related to tobacco control. ......................................................................... 4
CHAPTER 3 SAMPLE AND POPULATION CHARACTERISTICS
Table 3.1: Number and percent of households and persons interviewed and response rates by residence (un-weighted) – GATS Malaysia, 2011. ............................................................ 15
Table 3.2: Distribution of adults aged ≥15 years by selected demographic characteristics – GATS Malaysia, 2011. .............................................................................................................. 16
CHAPTER 4 TOBACCO USE
Table 4.1: Percentage of adults aged ≥15 years, by detailed smoking status and gender – GATS Malaysia, 2011. .............................................................................................................. 18
Table 4.1a: Number of adults aged ≥15 years by detailed smoking status and gender – GATS Malaysia, 2011. .............................................................................................................. 19
Table 4.2: Percentage of adults aged ≥15 years by smokeless tobacco use status and gender – GATS Malaysia, 2011. .............................................................................................................. 19
Table 4.3: Percentage of adults aged ≥15 years who were current smokers of various smoked tobacco products, by gender and selected demographic characteristics – GATS Malaysia, 2011. ............................................................................................................................. 21
Table 4.4: Number of adults aged ≥15 years who were current smokers of various smoked tobacco products, by gender and selected demographic characteristics – GATS Malaysia, 2011. ... 25
Table 4.5: Percentage distribution of adults aged ≥15 years by smoking frequency, gender, and selected demographic characteristics – GATS Malaysia, 2011. ......................................... 29
Table 4.6: Average number and percentage distribution of cigarettes smoked per day among daily cigarette smokers aged ≥15 years by selected demographic characteristics – GATS Malaysia, 2011. .............................................................................................................. 33
Table 4.7: Average age and percentage distribution of ever daily smokers aged 20-34 years by age at initiation of daily smoking, gender, and residence – GATS Malaysia, 2011. ...................... 35
Table 4.8: Percentages of all adults aged ≥15 years and of ever daily smokers who were former daily smokers, by selected demographic characteristics – GATS Malaysia, 2011. ...................... 37
Table 4.9: Percentage distribution of former daily smokers aged ≥15 years by time since quitting and selected demographic characteristics – GATS Malaysia, 2011. ......................................... 39
Table 4.10: Percentage distribution of current tobacco users aged ≥15 years by pattern of tobacco use and selected demographic characteristics – GATS Malaysia, 2011............................. 41
Table 4.11: Percentage distribution of daily smokers aged ≥15 years by time to first smoke after awakening and selected demographic characteristics – GATS Malaysia, 2011. ................. 43
v
CHAPTER 5 CESSATION
Table 5.1: Percentage of smokers aged ≥15 years who made a quit attempt and received advice to quit from a health care provider in the past 12 months, by selected demographic characteristics – GATS Malaysia, 2011. ........................................................................... 46
Table 5.2: Percentage of smokers aged ≥15 years who attempted to quit smoking in the past 12 months, by cessation method used and selected demographic characteristics – GATS Malaysia, 2011. .............................................................................................................. 48
Table 5.3: Percentage distribution of current smokers aged ≥15 years by interest in quitting smoking and selected demographic characteristics – GATS Malaysia, 2011. .................................. 50
CHAPTER 6 SECONDHAND SMOKE
Table 6.1: Percentage and number of adults aged ≥15 years who worked indoors and were exposed to tobacco smoke at work, by smoking status and selected demographic characteristics – GATS Malaysia, 2011. ..................................................................................................... 52
Table 6.2: Percentage and number of adults aged ≥15 years who were exposed to tobacco smoke at home, by smoking status and selected demographic characteristics – GATS Malaysia, 2011. ............................................................................................................................. 54
Table 6.3: Percentage of adults aged ≥15 years who visited various public places in the past 30 days and were exposed to tobacco smoke there, by smoking status and selected demographic characteristics – GATS Malaysia, 2011. ........................................................................... 56
Table 6.4: Percentage of adults aged ≥15 years who were exposed to tobacco smoke in various public places in the past 30 days, by smoking status and selected demographic characteristics – GATS Malaysia, 2011. ........................................................................... 59
CHAPTER 7 ECONOMICS
Table 7.1: Percentage of current smokers of manufactured cigarettes aged ≥15 years by last brand purchased and selected demographic characteristics – GATS Malaysia, 2011. .................. 63
Table 7.2: Percentage distribution of manufactured cigarette smokers aged ≥15 years by the source of last purchase of cigarettes and selected demographic characteristics – GATS Malaysia, 2011. ............................................................................................................................. 64
Table 7.3: Average cost of and monthly expenditure for manufactured cigarettes, and percentage who did not have enough money for food because of purchasing cigarettes, among smokers of manufactured cigarettes aged ≥15 years by selected demographic characteristics – GATS Malaysia, 2011. ........................................................................... 66
CHAPTER 8 MEDIA
Table 8.1: Percentage of adults aged ≥15 years who noticed anti-cigarette information during the last 30 days in various places, by smoking status and selected demographic characteristics – GATS Malaysia, 2011. ........................................................................... 69
vi
Table 8.2: Percentage of adults aged ≥15 years who had seen or heard about the “Tak Nak” anti-smoking campaign in the last 12 months, by smoking status and selected demographic characteristics – GATS Malaysia, 2011. ........................................................................... 72
Table 8.3: Percentage of current smokers aged ≥15 years who noticed health warnings on cigarette packages and considered quitting because of the warning labels during the last 30 days, by selected demographic characteristics – GATS Malaysia, 2011...................................... 74
Table 8.4: Percentage distribution of current smokers aged ≥15 years by level of thinking about the health risks of smoking from seeing health warnings and selected demographic characteristics – GATS Malaysia, 2011. ........................................................................... 76
Table 8.5: Percentage distribution of current smokers aged ≥15 years by how often health warnings prevented them from smoking in the last 30 days according to selected demographic characteristics – GATS Malaysia, 2011. ........................................................................... 78
Table 8.6: Percentage of adults aged ≥15 years who noticed cigarette marketing during the last 30 days in various places, by selected demographic characteristics – GATS Malaysia, 2011. .. 80
Table 8.7: Percentage of current smokers aged ≥15 years who noticed cigarette marketing during the last 30 days in various places, by selected demographic characteristics – GATS Malaysia, 2011. .............................................................................................................. 82
Table 8.8: Percentage of current non-smokers aged ≥15 years who noticed cigarette marketing during the last 30 days in various places, by selected demographic characteristics – GATS Malaysia, 2011. .............................................................................................................. 83
CHAPTER 9 KNOWLEDGE, ATTITUDES, AND PERCEPTIONS
Table 9.1: Percentage of adults aged ≥15 years who believed that smoking causes serious illness and various specific diseases, by smoking status and selected demographic characteristics – GATS Malaysia, 2011. ..................................................................................................... 85
Table 9.1a: Percentage of adults aged ≥15 years who believed that smoking causes various specific diseases, by smoking status and selected demographic characteristics – GATS Malaysia, 2011. ............................................................................................................................. 88
Table 9.2: Percentage of adults aged ≥ 15 years who believed that breathing other people's smoke causes serious illness and various specific diseases in non-smokers, by smoking status and selected demographic characteristics – GATS Malaysia, 2011. .................................. 92
Table 9.3: Percentage of adults aged ≥15 years who thought that indoor smoking should be prohibited in various places, by smoking status and selected demographic characteristics – GATS Malaysia, 2011. .................................................................................................. 95
Table 9.4: Percentage of adults aged ≥15 years who favoured tobacco control laws, by smoking status and selected demographic characteristics – GATS Malaysia, 2011. ........................ 98
vii
FOREWORD
Tobacco kills up to half of those who use it and globally more than 5 million deaths each year are caused
by using this lethal product. Experts predict that if current smoking patterns continue, smoking will kill
about 8 million people every year by 2030 and 7 million of these deaths will occur in developing countries.
It is evident from the results of Global Adult Tobacco Survey (GATS) that tobacco consumption is still a
major public health problem in Malaysia. About a quarter of Malaysians smoked tobacco-- 43.9% of men
and 1.0% of women. In addition, a daily cigarette smoker smokes an average of 14 cigarettes per day.
I am proud that for the first time GATS was conducted in Malaysia. GATS as part of the Global Tobacco
Surveillance System used international standardized methods. GATS was also the first survey in Malaysia
conducted at a national level using electronic data collection devices. The decision to participate in GATS is
very useful for Malaysia; the results will be useful for further strengthening the tobacco control planning
and evaluation strategies.
The efficient design for data collection and management, and the standardized analysis of data have made
the survey report a nationally representative account of the existing situation. The report has been able to
capture important data on different aspects of tobacco use and tobacco control program in Malaysia.
I would like to congratulate the Institute for Public Health for leading the GATS Malaysia and a work well
done! I would like to extend my gratitude and appreciation to all others who contributed to the Global
Adult Tobacco Survey in Malaysia.
I am also sincerely grateful to the World Health Organization, the U.S. Centers for Disease Control and
Prevention, Atlanta, Georgia USA, and the Bloomberg Philanthropies for their collaboration, financial and
technical assistances in successfully conducting GATS Malaysia.
Dato’ Sri Dr Hasan Bin Abdul Rahman
Director General of Health Malaysia
viii
PREFACE
Tobacco consumption is the leading preventable cause of death and disease worldwide, causing more
than 5 million deaths each year. In Malaysia, tobacco use accounts for a massive 35% of in-hospital deaths,
with three (cancer, heart disease, stroke) out of the country’s five leading killers accounting for a large
share of these deaths. More than 10,000 Malaysians die from smoking-related illnesses every year. Given
these alarming facts, the implementation and enforcement of evidence-based tobacco control measures
and policies is urgently needed to stop the growing risk of smoking in Malaysia.
The Global Adult Tobacco Survey (GATS) was developed in 2007 by the World Health Organization (WHO)
and the U.S. Centers for Disease Control and Prevention (CDC) with the main objective of estimating the
prevalence of tobacco use in the general adult population at the national level and an important
secondary objective of estimating the prevalence of exposure to secondhand smoke. Having this
information allows the indirect estimation of the impact of national policies on tobacco control. GATS has
an internationally standardized methodology, which facilitates comparisons between countries and the
different regions where the survey has been implemented.
GATS Malaysia was implemented by the Institute for Public Health (IPH) in collaboration with the Disease
Control and Health Education Divisions, Ministry of Health; Department of Statistics; University of Malaya
and International Islamic University. It was a nationally representative household survey conducted via
face-to-face interviews. Employing handheld devices, data was collected from randomly selected,
noninstitutionalized men and women aged 15 years or older in 426 enumeration blocks throughout
Malaysia. The first-ever use of handheld machines in this survey will equip the IPH to undertake future
national surveys using digital technology.
This report comprises an introduction to the burden of tobacco use, the tobacco control policies and
programs implemented in Malaysia, the GATS objectives and methodology, results from different sections,
policy recommendations, and conclusions. In addition to the standardized core and optional questions,
two country-specific sections were included to obtain relevant information for Malaysia: shisha/hookah
and electronic cigarettes.
The report includes the most up-to-date statistics concerning tobacco use among Malaysian adults,
information that can serve as an evidence base to strengthen tobacco control initiatives in the country. It
will also serve as an authoritative reference source for policy makers, stakeholders, public health
professionals, and others concerned with tobacco control in Malaysia. The reliable and updated
information on tobacco use from this report will also help the country in fulfilling its obligations to the
WHO Framework Convention on Tobacco Control (FCTC). Among others, these include supporting
protection measures to prevent the exposure of the general population to the unhealthy effects of
tobacco smoking, providing effective warnings about secondhand smoke, and promoting better strategies
to motivate smokers to quit and overcome their nicotine addiction.
GATS Malaysia 2011
Research Team Members
ix
x

xi
ACKNOWLEDGEMENTS
The 2010-2011 Global Adult Tobacco Survey (GATS) in Malaysia was successfully completed, thanks to the
committed efforts and support of numerous organizations and individuals at different stages of the
survey. We would like to thank everyone who helped to make the survey a success.
The authors wish to thank the Director General of Health and the Deputy Director General of Health
(Research and Technical Support) and the Deputy Director General of Health (Public Health) for their
enduring support and confidence during the conduct of this survey. We would like to express our
gratitude to the Director of the Institute for Public Health for his guidance and support throughout the
survey.
GATS Malaysia would like to thank the Bloomberg Philanthropies for initiating this project to strengthen
tobacco surveillance in high‐prevalence countries. We extend our appreciation to all collaborative partner
organizations, World Health Organization (WHO), U.S Centers for Disease Control and Prevention (CDC),
the CDC Foundation, RTI International, and Johns Hopkins Bloomberg School of Public Health (JHSPH) for
providing financial and technical support toward the successful conduct of the GATS in Malaysia.
Gratitude is extended to all the members of the GATS questionnaire review committee, the sample review
committee, and the analysis review committee for their technical reviews to ensure that the results for
GATS in Malaysia are internationally acceptable and comparable to other countries implementing GATS.
We sincerely acknowledge the collaborative exchange and technical support from the CDC in Atlanta. We
acknowledge the outstanding partnership and support extended by Dr. Samira Asma, Chief of the Global
Tobacco Control Branch at CDC. We would like to express our special thanks to Mr. Jeremy Morton, CDC
Focal Point for Malaysia, for his continuous technical guidance and valuable support throughout all the
stages of the survey. We would also like to thank statisticians Mr. Luhua Zhao and Dr. Linda Andes for
their invaluable help in analyzing the GATS Malaysia 2011 data.
We would also like to acknowledge the contributions of Mr. Sameer Pujari and Ms Lubna Bhatti from
WHO, Geneva, who provided technical support and coordination, especially questionnaire programming,
staff training, and data aggregation. Gratitude is extended as well to Mr. James Rarick of WPRO (WHO
Western Pacific Region), and Dr. Corrine Capuano and Dr. Paul Soo from the WHO Malaysia Country Office
for providing technical and management assistance.
Many thanks are due to the CDC Foundation. Special mentions are due to Mr. William Parra for his
coordination and involvement in the survey and Mr. Brandon Talley for his guidance with respect to
administrative and budget issues.
This acknowledgement cannot be concluded without expressing appreciation for the hard work of field
supervisors and field interviewers in collecting data for the GATS in Malaysia.
Last but not least, sincere appreciation is extended to all respondents who contributed their time and
information to the survey, without them, the Global Adult Tobacco Survey in Malaysia would not have
been possible.
xii
EXECUTIVE SUMMARY
The 2011 Malaysian Global Adult Tobacco Survey (GATS) was a nationally representative household survey
of noninstitutionalized men and women aged 15 years or older. The survey was designed to produce
internationally comparable data on tobacco use and indicators of tobacco control by using a standardized
questionnaire, sample design, data collection, and management procedures.
GATS Malaysia was conducted by the Institute for Public Health (IPH) in collaboration with the Disease
Control and Health Education Divisions, Ministry of Health; Department of Statistics; University of Malaya
and International Islamic University. Technical assistance was provided by the World Health Organization
(WHO) and the U.S. Centers for Disease Control and Prevention (CDC). Financial support for the survey
was provided by the WHO and the Ministry of Health Malaysia.
GATS Malaysia used a three-stage stratified cluster sampling design to produce key indicators for the
country as a whole as well as by residence (urban or rural) and gender. GATS Malaysia was the first
nationwide survey in this country in which electronic handheld devices were used for data collection and
management. A total of 5112 households were sampled; 4389 households completed screening and 4250
individuals were successfully interviewed (one individual was randomly chosen from each selected
household to participate in the survey). The overall response rate for GATS Malaysia was 85.3%. The
household response rate was 88.1% (83.2% urban, 93.4% rural), while the individual response rate was
96.9% (95.6% urban, 98.1% rural). The survey provided information on tobacco use (smoking and
smokeless), cessation, exposure to secondhand smoke, economics, media, and knowledge, attitudes, and
perceptions.
WHO has developed MPOWER, a technical package to assist countries to implement selected demand
reduction measures contained in the WHO FCTC. The major objectives of the survey were to
systematically monitor adult use of tobacco (smoking and smokeless) by using a nationally representative
sample of Malaysian adults to track these MPOWER indicators. Policy recommendations in this document
are based on the MPOWER model and consistent with the FCTC.
Key Findings Tobacco use
In 2011, 23.1% or 4.75 million Malaysian adults aged 15 years or older were current smokers of tobacco:
43.9% (4.64 million) of men and 1.0% (0.10 million) of women. Overall, 22.9% of adults (43.6% of men and
1.0% of women) were current smokers of cigarettes, including manufactured, hand-rolled, or kreteks. The
25-44 age group had the highest percentages of smokers of any smoked tobacco products (29.0%), any
type of cigarette (28.9%), and manufactured cigarettes (26.2%).
Out of all the current tobacco smokers, 20.9% (4.28 million) were daily smokers (39.9% of men, 0.7% of
women) while 2.3% (0.46 million) were occasional smokers (4.1% of men and 0.4% of women). Smokeless
tobacco products were used by just 0.7% of adults (0.9% of men and 0.6% of women).
On average, a daily Malaysian adult smoker smoked 14 cigarettes per day. More than half (51.8%) of those
aged 20-34 years who had ever smoked on a daily basis had started smoking daily before the age of 18.
Amongst those who had ever smoked on a daily basis, only 9.5% (9.4% of men, 10.0% of women) had quit
xiii
smoking. Overall, 47.6% of current daily smokers had their first cigarette of the day within 30 minutes of
waking up. Men (48.1%) were more likely than women (16.8%) to have their first cigarette within 30
minutes of waking up.
Smoking Cessation
Almost half (48.6%) of adult smokers (current smokers plus former smokers who had been abstinent for
less than 12 months) had tried to quit smoking in the past 12 months. Four out of five smokers who had
attempted to quit smoking in the past 12 months had tried to do so without any assistance.
Overall, only 1 in 7 (14.3%) current smokers planned to or were thinking about quitting smoking in the
next 12 months.
More than half (52.6%) of adult smokers (current smokers plus former smokers abstaining less than 12
months) had been advised by their health care provider to quit smoking in the past 12 months.
Exposure to Secondhand Smoke
An estimated 39.8% (2.3 million) of adults who worked indoors had been exposed to secondhand smoke
in their workplace in the past 30 days; for non-smokers the estimate was 33.9% (1.4 million).
An estimated 38.4% (7.6 million) of adults in Malaysia were exposed to secondhand smoke at home.
Among non-smokers, the estimated prevalence of such exposure was 27.9% (4.2 million): 19.5% for men
(1.1 million) and 32.8% for women (3.1 million).
Among adults who had visited different public places in the past 30 days, 84.9% (84.1% of non-smokers)
were exposed to secondhand smoke in cafes / coffee shops / bistros; 78.7% (70.3%, non-smokers) in bars
/ nightclubs; 71.0% (68.3%, non-smokers) in restaurants; 28.2% (27.9%, non-smokers) in public
transportation, 20.0% (19.0%, non-smokers) in government buildings; 13.6% (14.6%, non-smokers) in
indoor shopping complexes; and 8.7% ( 8.6%, non-smokers) in health-care facilities.
Economics of Tobacco Smoking
The five most purchased brands by current smokers of manufactured cigarettes (not including kreteks)
were Dunhill (42.7%), Winston (11.2%), Marlboro (5.0%), Mild Seven (3.8%), and Salem (2.8%).
Almost 80% of current smokers of manufactured cigarettes (not including kreteks) purchased their
cigarettes from grocery stores. On average, current smokers of manufactured cigarettes spent RM
(Malaysian Ringgit) 10.1 for a pack of 20 cigarettes and RM 178.8 per month on manufactured cigarettes.
For an estimated 7% of current smokers of manufactured cigarettes, spending money on cigarettes had
resulted in their not having enough money for food sometime in the last 6 months.
Media
In the previous 30 days prior to the interview, 94% of Malaysian adults had noticed anti-cigarette
information, mostly on television (85.2%), billboards (72.0%), posters (70.4%), and in newspapers or
magazines (68.9%).
An estimated 88% of current smokers and non-smokers had seen or heard about the “Tak Nak” anti-
smoking campaign in the last 12 months.
xiv
Among current smokers, 92.8% (93.2% of men, 74.7% of women) had noticed health warnings on cigarette
packages, but only 45.8% of current smokers (45.7% of men, 51.7% of women) thought about quitting
smoking because of these messages. A quarter of current smokers had not thought at all in the past 30
days about the health risks of smoking as a result of seeing health warnings on cigarette packages.
Similarly, 59.9% of current smokers who had noticed health warnings on cigarette packages in the past 30
days had not stopped smoking even once because of these warnings. Overall, 35.6% of Malaysian adults
had noticed cigarette marketing through advertisements or promotions.
Knowledge, Attitudes, and Perceptions
More than 90% of Malaysian adults (88.1% of current smokers, 93.5% of non-smokers) believed that
smoking causes serious illness. A lower proportion of Malaysian adults believed that breathing other
people’s smoke cause serious illness in non-smokers (79.8% of current smokers, 87.7% of non-smokers).
The level of support for the prohibition of smoking in different public places varied by the type of place:
shopping center (94.4%), workplaces (90.4%), public transportation (85.2%), restaurants (83.5%), hotels
(78.7%), karaoke centers (50.3%), bars (43.9%), casinos (40.0%), and discos (37.8%).
More than 70% of Malaysian adults were in favor of increasing taxes on tobacco products, but this
attitude varied significantly by smoking status (current smokers, 32.0%; non-smokers, 82.0%). Similarly,
variations were observed by smoking status in attitudes towards prohibiting the display of tobacco
products at points-of-sale (approved by 47.9% of current smokers but disapproved by 83.8% of non-
smokers).
Policy Implications and Recommendations
As the most detailed survey on tobacco and tobacco control ever conducted by the Ministry of Health, the
Global Adult Tobacco Survey Malaysia (GATS Malaysia) provides special insights into the scale of tobacco
problems in the country. Correspondingly, the results of GATS Malaysia offer indications for appropriate
actions to be taken in response to the problems revealed. Recommendations are based on the WHO’s
MPOWER framework and based on the FCTC. GATS Malaysia has shown that the magnitude of tobacco
consumption and burden in this country is fairly high (23.1%, or 4.75 million, adults are smokers) and thus
signals an urgency for continuous effective efforts to be carried out to curb and significantly reduce that
burden. Given the importance of measuring tobacco consumption and trends, it is important that GATS be
carried out on a regular basis, suggested every 4 years. Making cessation services and treatments available
to all smokers is important given that almost half of all smokers had tried to quit smoking. Exposure to
secondhand smoke in public places, especially eating outlets, is very high (70%-85%), and the level of
support for a ban on smoking in restaurants is also very high (83.5%). These findings indicate that the
move towards 100% smoke-free eating outlets, especially restaurants, can be successful. From GATS, it is
known that the penetration of the Tak Nak media campaign as well as pictorial health warnings on
cigarette packs is very high (about 90%), but the impact on levels of awareness, attitudes, and behavior
change is not as high. More in-depth analyses are needed, followed by identifying and implanting the most
effective tobacco control strategies.

1
1. INTRODUCTION
Tobacco use, a major preventable cause of premature death and disease, presently causes more than 5
million deaths globally each year and is expected to cause over 8 million deaths annually by 2030. Unless
current trends are changed, the vast majority of these deaths will occur in the developing world. Clearly,
an efficient and systematic surveillance mechanism to monitor the epidemic is an essential component
of a comprehensive tobacco control program.
The World Health Organization (WHO) aims to reduce the global burden of disease and death caused by
tobacco thereby protect both present and future generations from the devastating health, social,
environmental, and economic consequences of tobacco consumption and exposure to tobacco smoke.
These objectives can be reached by providing global policy leadership – including the promotion of the
WHO Framework Convention on Tobacco Control (FCTC) and the MPOWER package1 of tobacco policies
as a key entry point to the FCTC. The FCTC encourages countries to adhere to its principles, and WHO
supports countries in their efforts to implement provisions of the FCTC and MPOWER.
In August 2006, WHO and the United States Centers for Disease Control and Prevention (CDC) convened
an expert consultation to discuss adult tobacco surveillance and to make recommendations for the
development of a standard survey protocol. The expert consultation recognized the challenges of
limited funding and methodological complexities when conducting systematic adult tobacco surveys and
identified a lack of comparability in ongoing national surveys.
The Bloomberg Initiative to Reduce Tobacco Use offers resources to fill the data gap for measuring adult
tobacco use globally and to optimize the reach and results of the ongoing Global Tobacco Surveillance
System (GTSS), which is comprised of three school-based surveys, the Global Youth Tobacco Survey
(GYTS), the Global School Personnel Survey (GSPS), and the Global Health Professions Students Survey
(GHPSS), and a household-based survey, the Global Adult Tobacco Survey (GATS).
GATS, which was launched in February 2007, enables countries to collect data on key tobacco control
indicators in the adult population. Results from GATS will assist countries in formulating, tracking, and
implementing effective tobacco control interventions, and participating countries will be able to
compare the results of their survey with the results from other participating countries.
The CDC, CDC Foundation, Johns Hopkins Bloomberg School of Public Health, RTI International (a
research institute in North Carolina, USA), WHO, and countries throughout the world are working
together to implement GATS.
1 The MPOWER package is a series of six proven policies aimed at reversing the global tobacco epidemic that include: Monitor
tobacco use and prevention policies; Protect people from tobacco smoke; Offer help to quit tobacco use; Warn about the dangers of tobacco; Enforce bans on tobacco advertising, promotion, and sponsorship; and Raise taxes on tobacco.
2
1.1 Tobacco Control in Malaysia
1.1.1 History of Tobacco Control in Malaysia
Tobacco control initiatives in Malaysia began in the 1970s with several small studies on the prevalence
of smoking among certain groups of the general population. In 1983, the Ministry of Health (MOH)
Malaysia, in collaboration with the Malaysian Medical Association, carried out the country’s first major
anti-tobacco effort2. A workshop on smoking and health was followed by the launch of the nationwide
‘No Smoking Day’ campaign.
The first national-level ‘World No Tobacco Day’ in Malaysia was celebrated in 1993 when the Prime
Minister’s wife launched the theme ‘Health Service: Our Window to A Tobacco Free World’.2 That year
also saw Malaysia’s leading tobacco control legislation, the Control of Tobacco Product Regulations
(CTPR) 1993 enacted under section 36 of the Food Act 1983.3 This law came into force in 1994. Earlier,
there was no specific legislation in the country except for the prohibition of smoking in cinemas and the
requirement for a health warning label on cigarette packs and in advertisements, both mandated by the
Trade Description Act 1972. Another significant development was observed in 1996 when Malaysia’s
national carrier, the Malaysian Airlines System (MAS) banned smoking on all its domestic flights. Four
years later, in October 2000, all MAS flights, both domestic and international, became smoke-free.
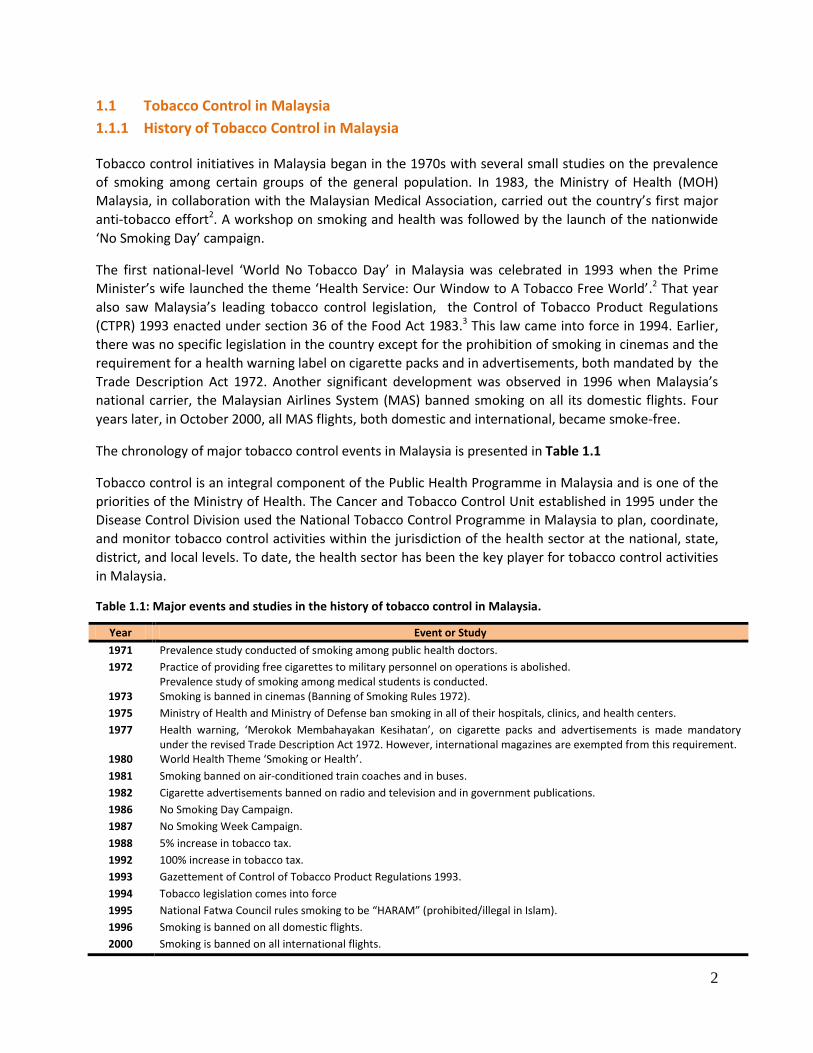
The chronology of major tobacco control events in Malaysia is presented in Table 1.1
Tobacco control is an integral component of the Public Health Programme in Malaysia and is one of the
priorities of the Ministry of Health. The Cancer and Tobacco Control Unit established in 1995 under the
Disease Control Division used the National Tobacco Control Programme in Malaysia to plan, coordinate,
and monitor tobacco control activities within the jurisdiction of the health sector at the national, state,
district, and local levels. To date, the health sector has been the key player for tobacco control activities
in Malaysia.
Table 1.1: Major events and studies in the history of tobacco control in Malaysia.
Year Event or Study
1971 Prevalence study conducted of smoking among public health doctors.
1972 Practice of providing free cigarettes to military personnel on operations is abolished. Prevalence study of smoking among medical students is conducted.
1973 Smoking is banned in cinemas (Banning of Smoking Rules 1972).
1975 Ministry of Health and Ministry of Defense ban smoking in all of their hospitals, clinics, and health centers.
1977 Health warning, ‘Merokok Membahayakan Kesihatan’, on cigarette packs and advertisements is made mandatory under the revised Trade Description Act 1972. However, international magazines are exempted from this requirement.
1980 World Health Theme ‘Smoking or Health’.
1981 Smoking banned on air-conditioned train coaches and in buses.
1982 Cigarette advertisements banned on radio and television and in government publications.
1986 No Smoking Day Campaign.
1987 No Smoking Week Campaign.
1988 5% increase in tobacco tax.
1992 100% increase in tobacco tax.
1993 Gazettement of Control of Tobacco Product Regulations 1993.
1994 Tobacco legislation comes into force
1995 National Fatwa Council rules smoking to be “HARAM” (prohibited/illegal in Islam).
1996 Smoking is banned on all domestic flights.
2000 Smoking is banned on all international flights.
3
1.1.2 WHO Framework Convention on Tobacco Control (WHO FCTC)
The WHO Framework Convention on Tobacco Control, the world’s first and only health convention, is an
evidence-based treaty that reaffirms the right of all people to the highest optimum standards of health.
The FCTC was adopted by the World Health Assembly on 21 May 2003 and entered into force on 27
February 2005. It provides legal dimensions for international health cooperation and sets high standards
for compliance.4
Malaysia became a signatory on 23 September 2003, ratified the WHO FCTC on 16 September 2005, and
officially became a party to the convention 90 days later on 15 December 2005. This momentous step
led to the formation of Malaysia’s national FCTC Secretariat, as approved by the Cabinet. Thus, the
Tobacco Control & FCTC Unit was established in Malaysia in 2006 within the Non-communicable Disease
Section of the Disease Control Division, Ministry of Health. Among the main functions of this unit is to
oversee proper WHO FCTC implementation and progress.
Another important objective of this unit is to reduce the impact of tobacco use so that it will no longer
remain a major public health burden. The key approaches are to prevent smoking uptake, particularly
among youth, promote tobacco cessation, and protect the public from the threats of secondhand
smoke. The unit facilitates progress in tobacco control so as to ensure compliance with the WHO FCTC
provisions by relevant agencies. The national FCTC Secretariat collaborates with and participates in WHO
FCTC-related activities that are bilaterally and/or multilaterally carried out at regional and international
levels.
The Tobacco Control & FCTC Unit, which serves as a focal point for WHO FCTC and all issues related to
tobacco control, coordinates the submission of periodic reports to the Convention Secretariat as
determined by the Conference of Parties. The unit also provides feedback and reports on FCTC
implementation to tobacco control stakeholders in Malaysia.
1.1.3 Current Initiatives in Tobacco Control
a. Legislation
Multipronged strategies are required to curb the tobacco crisis; by themselves, health promotion and
public education may not be successful. Establishing laws and enforcing them constitute one of the
important components of tobacco control. Beginning in 1991, efforts to establish specific legislation to
regulate the production and consumption of tobacco started to take off, and the issue then became an
interest of the public. The CTPR 1993 prohibits all direct advertising and sponsorship and requires fixed
health warnings and fixed maximum levels of tar (20 mg) and nicotine (1.5 mg). Numerous public places
and other designated areas have been gazetted as ‘no smoking zones’, while tobacco sales, possession,
and smoking by any person under the age of 18 years are prohibited.
In 2004, a major amendment was made to the CTPR 1993 to tighten most of its provisions. CTPR 2004
became the basis for Malaysia’s readiness to ratify the WHO FCTC, as many of its provisions were then
consistent with the Articles in the Convention.
4
Among the elements in the CTPR 2004 are:
Prohibition of the advertising and sponsorship of tobacco products
Control of the sale of tobacco products, and
Prohibition of smoking in certain areas through the designation of smoke-free areas
Under the CTPR 2004, direct and indirect advertising of tobacco products, as well as the use of brand
names and associated sponsorships are prohibited. The placement or display of a tobacco brand name
on any object for the purpose of advertising is also prohibited under the regulations5. The sale of
cigarettes in loose form (i.e., individual sticks, not in packs) and the use of vending machines for tobacco
products were made illegal. Designation of smoke-free areas was expanded to include more public
places like institutions for worship, libraries, and Internet cafes5. In June 2010, the prohibition of
smoking in certain areas was expanded to include a total of 21 places, e.g. any air-conditioned
workplace with a centralized air-conditioning system.
The CTPR amendment of 20086 successfully enacted legal provisions for placing pictorial health warnings
on cigarette packs and packets that became enforceable in phases beginning in December 2009. In
addition to pictorial health warnings, the CTPR 20086 included provisions for expansion of designated
smoke-free areas to include the National Service Training Centre (PLKN) and pedestrian walkways in
shopping complexes.
Recognizing the need to develop legislation specific to tobacco control, realizing that there are
constraints involved in enforcing the regulations under the Food Act 1983, and understanding the
commitment to fully comply with the FCTC provisions, efforts are now being made, following approval
by the Cabinet, to enact a stand-alone Control of Tobacco Products Act. With this Act, it can be expected
that the MOH will carry out legislation activities more effectively and will be able to comply with all FCTC
provisions for protecting people from exposure to tobacco smoke, regulating the content of tobacco
products, and regulating of tobacco product disclosures, the packaging and labeling of tobacco products,
tobacco advertising, promotion and sponsorship, and sales to and by minors.
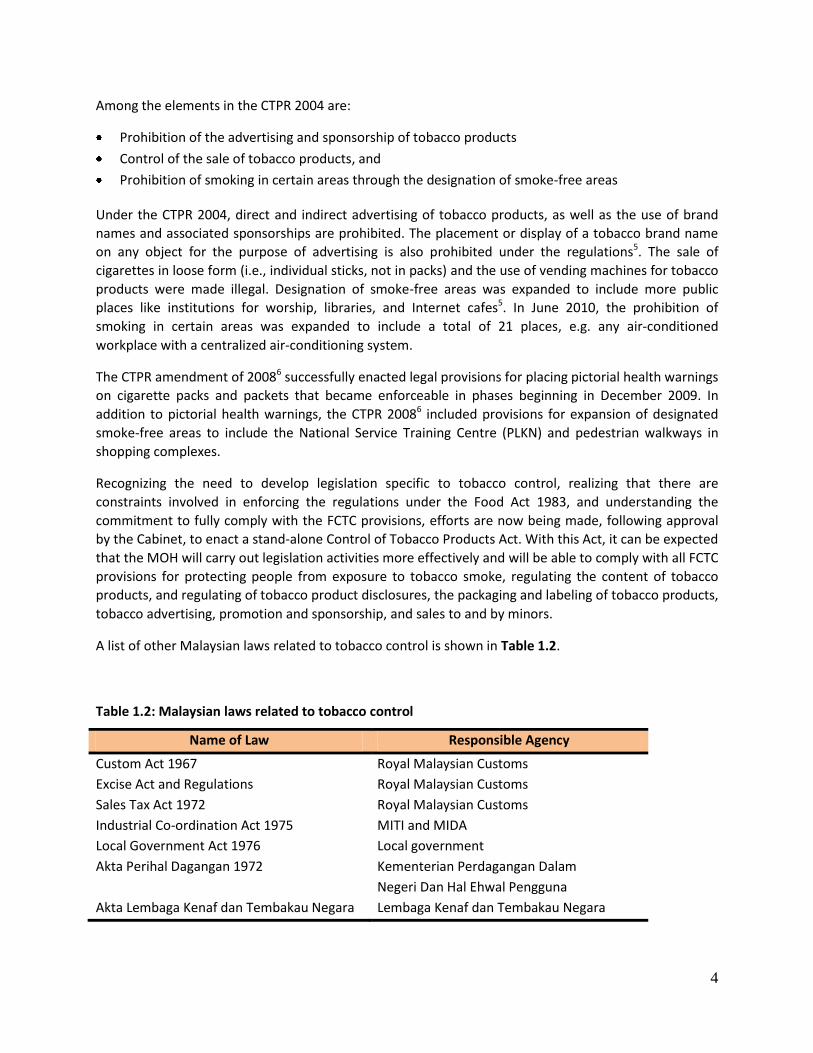
A list of other Malaysian laws related to tobacco control is shown in Table 1.2.
Table 1.2: Malaysian laws related to tobacco control
Name of Law Responsible Agency
Custom Act 1967 Royal Malaysian Customs
Excise Act and Regulations Royal Malaysian Customs
Sales Tax Act 1972 Royal Malaysian Customs
Industrial Co-ordination Act 1975 MITI and MIDA
Local Government Act 1976 Local government
Akta Perihal Dagangan 1972 Kementerian Perdagangan Dalam
Negeri Dan Hal Ehwal Pengguna
Akta Lembaga Kenaf dan Tembakau Negara Lembaga Kenaf dan Tembakau Negara
5
b. Enforcement Activities
Law enforcement is crucial for effective tobacco control. Implementation of the CTPR 2004 throughout
the country is being carried out by over 2000 enforcement officers posted at the State and District
Health Offices within all 14 states in Malaysia. These local enforcement activities are conducted
routinely and continuously. However, about once every 1–2 months, thematic enforcement activities
are being carried out simultaneously nationwide. In 2010, five Enforcement Information Blast (E-Info
Blast), were successfully carried out.
c. Anti-tobacco Promotion
Many tobacco control measures have been undertaken in concert with the anti-tobacco media approach
to promote awareness among the public about the harmful effects of tobacco. In Malaysia, the national
anti-smoking media campaign is known as the “Tak Nak Merokok” (Say No) Campaign7, and the icon
created for it was made highly visible through various mass media channels to both the rural and urban
populations. There is documented evidence that this “Tak Nak” campaign has raised concerns about
smoking and has influenced the thoughts of smokers about quitting. This campaign has reduced the
likelihood of smoking uptake among non-smokers, particularly in the adolescent age groups, and
encourages quitting among adult smokers.
d. Smoking Cessation Services
As of December 2010, there were 326 quit-smoking clinics and 32 hospitals within the MOH facilities
throughout the country that provided smoking cessation services, which include the counseling and
pharmacotherapy for quitting smoking. These heavily subsidized cessation services use an algorithm set
included in the Clinical Practice Guidelines (2003)8, which are in the process of being reviewed and
updated with the inclusion of varenicline (Champix) for use as pharmacotherapy .
Varenicline (Champix) was registered within the Pharmaceutical Division, MOH, in late 2011. The
establishment of the tobacco ‘Infoline’ and ‘Quitline’ by the Minister of Health and the National Poison
Centre respectively, has provided further accessibility to cessation assistance for smokers who intend to
stop the habit of smoking.
e. Tobacco Taxation
Raising the price of tobacco products is one of the most effective methods of combating the
consumption of tobacco consumption9. Until 2004 in Malaysia, taxes were levied according to the
weight of the tobacco, but in 2005 that changed to a specific excise tax per stick. There has been a fairly
steady increase in the tobacco tax from 1990. At the same time, the tobacco industry has raised
cigarette prices, which in turn caused sales volumes to drop initially10.
According to Article 6 of the WHO Framework Convention on Tobacco Control – Price and tax measures
to reduce the demand for tobacco, member countries are required to implement effective price and tax
measures in order to reduce tobacco consumption among various segments of the population, in
particular to focus on the young, vibrant teenagers.
With an emphasis on these commitments, the Malaysian government had been increasing the cigarette
tax almost every year in the past few years (but is not doing so in 2012). The tobacco industry has
6
claimed that the rate of smuggling would significantly increase and that the government would lose
revenue if tobacco taxes were raised 11.
1.2 Burden of Tobacco Use in Malaysia
1.2.1 Prevalence of Tobacco Smoking
The second National Health and Morbidity Survey (NHMS I) estimated an overall adult smoking
prevalence of 24.8%12 in Malaysia in 1996; 10 years later, the third National Health and Morbidity Survey
(NHMSIII) estimated a prevalence of 22.8%13 in 2006.
By gender during this 10-year period, the male smoking prevalence decreased just 0.8%, from 49.2% to
48.8%, while for women the prevalence decreased from 3.5% to 1.9%, a 46% reduction. Current
smoking decreased across all levels of education, with the greatest declines among the non-educated
(from 21.7% to 16.7%) and primary-educated (28.0% to 23.1%) groups. Prevalence increased among the
non-married (26.5% to 28.9%) but declined among the married (25.1% to 22.3%) and divorced (20.5% to
17.2%). A decrease in smoking prevalence of 7% was observed in urban areas (21.7% to 20.2%) and of
3.5% in rural areas (28.6% to 27.6%) areas. A decline in smoking prevalence was observed in every state
in Malaysia except for Perlis, which showed an increase of 4.9%. The declining trend was most notable in
the Federal Territory of Kuala Lumpur and in Selangor, Malacca, and Kelantan12,13.
1.2.2 Smoking among Youth
The GYTS was conducted in both 2003 and 2009 on boys and girls aged 13 to 15 years in the school
setting. Over the 6-year interval the overall prevalence of ever being a tobacco user dropped from
33.1% to 30.0%, while the prevalence of current smokers decreased from 20.2% to 18.2%14,15.
1.2.3 Patterns and Trends in Tobacco Consumption
A comparison of the NHMS II (1996) and NHMS III (2006) surveys shows a lowering in the mean age of
smoking initiation for both men and women over a 10-year period. The overall mean age of initiation
dropped from 19.9 to 18.6 years; among men from 19.5 to 18.3 years and among women from 24.7 to
22.6 years12,13.
Current smokers in Malaysia smoked an average of 12.1 cigarettes per day in 2006, 1.2 sticks fewer than
the 13.3 cigarettes per day reported in 1996, with men consuming 12.3 sticks per day in 2006, versus 8.7
sticks per day among women. Urban smokers (12.4 sticks per day) smoked slightly more than rural
smokers (11.9). By ethnicity, Chinese consumed the highest number of cigarettes per day (14.3),
followed by Malays (12.2) and Indians (11.2) 12,13.
Most current smokers in 2006 were light smokers (fewer than 10 cigarettes daily): 56.3%, 95%
confidence interval [CI] 55.1-57.5%); 20.1% (95% CI 19.1-21.0%) were moderate smokers (10-20 sticks
per day), and 23.6% (95% CI 22.6-24.7%) were heavy smokers (more than 20 cigarettes per day). The
proportion of light smokers in 2006 was 81% higher than in 1996 (31.1%, 95% CI 29.8%-32.2%), while
the 2006 percentages for moderate and heavy smokers were 45% (1996: 36.3%, 95% CI 35.0-37.5) and
28% lower (1996: 32.7%, 95% CI 31.5-33.9%), respectively, than those reported 10 years earlier12,13.
7
1.2.4 Health Effects of Smoking
Statistics from the MOH in 2006 revealed that diseases related to smoking remained the top causes of
death in MOH hospitals, accounting for more than 15% of hospitalizations and 35% of in-hospital deaths.
Heart diseases and diseases of pulmonary circulation ranked first, accounting for 15.7% of these deaths,
followed by malignant neoplasms, 10.6%, and cerebrovascular diseases, 8.5%.16
Cardiovascular diseases were identified as the leading cause of years of life lost and disability-adjusted
life years (DALYs) in Malaysia17 accounting for one-third of total years of life lost and one-fifth of DALYs.
That study also found that half of the total burden of top cancers among men - cancers of the trachea,
bronchus and lung, and mouth and oropharynx was attributable to smoking17.
1.2.5 Economic Impact of Tobacco Use
Studies on the economic burden of cigarette smoking have been conducted in the United States and
other high-income countries; it was reported that annual smoking-attributable health-care costs
accounted for 6-15% of national health-care expenditures in the United States and other high-income
countries.18,19 Malaysia, for its part, has undertaken a study to estimate the cost of health care incurred
for treating three selected smoking-related diseases: cancer of the lung, ischemic heart disease (IHD),
and chronic obstructive pulmonary disease (COPD). The cost analysis was undertaken by combining all
available information on various components of the health-care costs of smoking in Malaysia. The study
relied on inpatient surveys to estimate the costs incurred on each visit and included loss of productivity,
the cost of traveling to primary care, the costs of specialist clinics, including admission, follow-up and
palliative care20.
Economic analyses of hospitals were conducted and an expert group discussion held to impute the cost
of the whole spectrum of health care in managing the three diseases of interest, including the cost of
personnel, investigations, drugs, and procedures in specialist clinics, admission, and follow-up. The
annual cost per patient for each disease (borne by the patient) was RM 7,758 for lung cancer, RM 1,362
for IHD, and RM 12,757 for COPD. The annual cost to the provider per patient for each disease was RM
34,529 for lung cancer, RM 20,314 for IHD, and RM 19, 415 for COPD. The total cost (taking into account
the number of patients) for each disease was RM 132.7 million for lung cancer, RM 544.5 million for IHD,
and RM 2247.6 million for COPD to make a grand total of RM 2.92 billion. This amount is equivalent to
0.7% of the Malaysia’s gross domestic product (GDP) and 26.1% of the MOH budget20.
1.3 Survey Objectives
The objectives of GATS Malaysia were:
To systematically monitor tobacco use (smoking and smokeless) among adults and track key
indicators of tobacco control using a nationally representative sample of adults.
To track the implementation of FCTC-recommended policies outlined in the MPOWER package.
1
8
2. METHODOLOGY
2.1 Study Population
The target population for GATS 2011 in Malaysia included all men and women aged 15 years or above
who, per the GATS protocol, considered Malaysia to be their usual place of residence. A ‘usual’ member
of a sampled household is any otherwise-eligible resident who has no other residence, or who has
multiple residences but has been living in the selected household for at least half of the time during the
past 12 months. The sampling did not include those who were visitors (e.g. tourists), institutionalized in
hospitals, or residing in an assisted living facility / nursing home, on a military base, or in group quarters
or a prison.
2.2 Sampling Design
The sampling strategy of the survey was designed to generate precise cross-sectional estimates at the
national level and by gender and geographical (urban/rural) localities and to allow for comparison of the
estimates between the different countries conducting the survey. A multistage stratified cluster
sampling was adopted for GATS in Malaysia (see Appendix B for details).
According to the GATS sampling protocol, a sample of at least 4000 respondents is required (2000 males
and 2000 females, with 2000 adults each from urban and rural areas). The GATS sample size of
households was then adjusted upward to allow for potential ineligibility and non-response in order to
get the required number of respondents. After the adjustment, the final sample size was 5112
respondents, of whom 2664 were from urban areas and 2448 from rural areas. Based on our
experience, in Malaysia the response rate is usually lower in urban than in rural areas. By gender, the
sample was allocated equally between men and women.
Sample weights were calculated according to standard procedures in the GATS Sample Design and
Sample Weight manuals21. Calculation involved three steps: (1) the determination of a base weight,
which was calculated from the probability of selection at all steps in the sample design; (2) an
adjustment for non-response for household and individual samples; and (3) a post-stratification
calibration for the population size aged 15 years or above by residence, gender, and age groups (see
Appendix B for details).
2.3 Questionnaire
GATS Malaysia included a household questionnaire and an individual questionnaire, both based on the
GATS Core Questionnaire with Optional Questions22, which was designed for use in countries
implementing GATS. The GATS Malaysia 2011 questionnaire was finalized on August 2011 based on the
results of a small pretest in July 2011. A request for informed consent was included separately. The
GATS Malaysia 2011 questionnaire is as shown in Appendix A.
Household Questionnaire
The household questionnaire, which solicited information on household members who considered the
selected household as their usual place of residence, was used to randomly select an eligible household
member (aged 15 years or above) to complete the individual questionnaire. The head of the household
was the preferred respondent, but any adult who had sufficient knowledge of all the members of the
9
household could be chosen in the absence of the head of the household. The household questionnaire
included basic information on age, gender, current smoking status, and the respondent’s relationship
with the head of the household (if not the same person).
Individual Questionnaire
The individual questionnaire, which was administered to the randomly selected adult through handheld
machines, had 10 sections:
Background Characteristics: Questions on gender, age, education, employment status, possession of household items, type of house, ethnicity, marital status, religion, and literacy.
Tobacco Smoking: Questions covered patterns of use (daily consumption, less than daily consumption, not at all), former/past tobacco consumption, age at initiation of daily smoking, consumption of different tobacco products (cigarettes, kreteks, pipes, cigars, shisha/hookah, and other smoked tobacco), nicotine dependence, frequency of quit attempts, and visits to a doctor or other health care provider.
Shisha/Hookah: Questions on pattern of use (daily consumption, less than daily consumption, not at all), age at initiation of smoking as well as smoking behavior relative to shisha/hookah.
Smokeless Tobacco: Questions on patterns of use (daily consumption, less than daily consumption, not at all), former/past use of smokeless tobacco and consumption of different smokeless tobacco products (snuff, chewing tobacco, betel quid, etc.).
Electronic Cigarettes: Questions on pattern of use (daily consumption, less than daily consumption, not at all), motive for using, and perceived health effects of using electronic cigarettes
Cessation: Questions related to advice to quit smoking by health care provider and method used to try to stop smoking.
Secondhand Smoke: Questions about rules of smoking in the home; exposure to secondhand smoke at home, indoor smoking policy at the workplace, exposure to secondhand smoke in the last 30 days in public places (workplace, government buildings/offices, health care facilities, restaurants, bars / nightclubs, cafes / coffee shops / bistro, indoor shopping complex, and public transportation), and knowledge about the harms of secondhand smoke. Questions assessing opinion on smoking bans in public places were also included.
Economics: Questions covering the most recent purchase of manufactured cigarettes, including quantity bought, cost, brand, and source of purchase.
Media: Questions on exposure to information on smoking through various media: newspapers/magazines, television, radio, billboards, posters, cinema and Internet; reaction to health warning labels on cigarette packages; exposure to anti-tobacco advertising and information. The reference period for questions on media was 30 days.
Knowledge, Attitudes, and Perceptions: Questions regarding knowledge about the health
effects of both smoking and smokeless tobacco; questions regarding increasing the tax on
tobacco products, restrictions of sales of tobacco products, and anti-smoking actions.
10
2.4 Programming of the Questionnaire and the Preparation of Handheld Computers
GATS was the first national community survey conducted by the Institute for Public Health in Malaysia to
use electronic data collection for both the household and individual questionnaires. General Survey
System (GSS) software, developed by RTI International was used: GSS software includes a variety of
software tools developed to facilitate the design, administration, collection, and management of survey
data on handheld computers, specifically a Microsoft Windows-based platform running Windows Mobile
5.0 or Mobile 6.0, often called Pocket PC systems. The software system is designed to support the
collection of data in the field where interviewers collect data using handheld computers. The systems
were developed and tested using Hewlett-Packard iPAQ 210 handheld devices and subsequently
employed for data collection. Collecting data electronically facilitated the complex skip patterns used in
the GATS Malaysia questionnaire as well as the use of some built-in validity checks during the process of
data collection.
The programming was supported mainly by RTI International and WHO. The programming of the
questionnaire using GSS was carried out in collaboration with information technology personnel
associated with GATS Malaysia. Repeated quality control mechanisms were employed to test the quality
of questionnaire programming, in accordance with the GATS Programmer’s Guide to General Survey
System manual23.
The main steps involved in checking quality control were version control/verification for the household
and individual questionnaires, date and time verification, verification of skip patterns, and validation
checks. The entire process, including administration of the questionnaires, data collection using
handheld machines, and data management and aggregation (preparing raw data for analysis), was
pretested before the actual survey process began.
Handheld programming was finalized and the final questionnaire for data collection was uploaded to the
handheld devices in July 2011. The electronic case file (used to identify the selected household
addresses) was finalized in October 2011 and uploaded to the handheld devices during the training
program for the field staff held in the same month.
2.5 Data Collection
2.5.1 Implementing Agency for GATS Malaysia
The Institute for Public Health was nominated by MOH Malaysia as the implementing agency for GATS
Malaysia. The Institute was responsible for overall coordination and management of the survey and
collaborated with the MOH Disease Control Division and Health Education Division; the Department of
Statistics, University Malaya and International Islamic University in conducting GATS in Malaysia.
The Institute for Public Health outsourced the process of data collection to a local company specializing
in research. The Institute worked closely with this company throughout the data collection period, which
included the implementation of joint quality control checks in the field.
Financial assistance was provided by WHO, Geneva, through Project HQTFI1003729. WHO also provided
technical support and in-country coordination. The U.S. CDC and CDC Foundation provided technical
11
assistance for the implementation of the survey. (Refer to Appendix D for details on the technical
committee and all personnel involved in survey implementation.)
2.5.2 Pretest
GATS Malaysia carried out a pretest in both urban and rural settings on 19−20 July 2011 using a sample
of 120 respondents who were equally distributed by gender and smoking status and with individuals
from all relevant age groups. The pretest was conducted with close cooperation from CDC and WHO
experts, especially in terms of wording and comprehensibility, inconsistencies in skip patterns, the
sequencing of questions, completeness of response categories, workload, interview time, availability
and callbacks, and other issues. Other important objectives of the pretest were to test procedures for
handheld data collection, assess problems in the process of data transfer and aggregation, and develop
a data management system for implementation of the GATS Malaysia.
Pretest training took place on 15−18 July 2011, and the training of trainers, especially for the IT/data
management staff, was conducted on 15–16 July 2011. The training of field interviewers and field
supervisors was conducted concurrently from 16-18 July 2011. In all, 17 field staff were trained (13
interviewers and 4 supervisors). Training was based on standard GATS manuals and procedures and
included class sessions, paired mock interviews, and role-playing. Field interviewers had the opportunity
to practice various scenarios in multiple combinations.
2.5.3 Training
To standardize the survey procedures and minimize non-sampling errors, three manuals and a picture
book were prepared. All the manuals were developed first in English and then translated into the Malay
language.
1. Field Interviewer’s Manual24
The field interviewer’s manual provided instructions to interviewers regarding interviewing techniques,
procedures in the field, methods of asking questions, and the use of handheld devices. The manual was
adapted from GTSS-GATS: Field Interviewer Manual.
2. Field Supervisor’s Manual25
The field supervisor’s manual, which was intended to help field supervisors in supervising the collection
of data contained a detailed description of supervisors’ roles and responsibilities as well as information
on data aggregation and transfer procedures. The manual was adapted from GTSS-GATS: Field
Supervisor Manual.
3. Question-by-Question Specification26
A third manual provided question-specific instructions to the field interviewers for administering the
GATS household and individual questionnaires using the handheld devices. This manual also provided
information on range checks, response options, purpose, and instructions for each survey question. The
manual was adapted from GTSS-GATS: Question-by-Question Specifications.
12
4. Picture Book
The picture book provided visual depictions of types of tobacco products, both smoking and smokeless,
methods used to quit smoking, and pictorial health warnings.
The Institute for Public Health subcontracted the Info Survey Group, a local market research company,
to conduct the data collection. A total of 8 field managers, 23 field supervisors (field supervisors also
interviewed respondents) and 41 field interviewers were selected to participate in the training. A
centralized training workshop held in Kuala Lumpur from 17 to 21 October 2011 included lectures on
the contents of the questionnaire, how to complete the questionnaires on paper as well as by using
handheld devices, paired mock interviews between participants, and role-plays. After the training
workshops, all field interviewers and supervisors were provided with iPAQs loaded with lists of assigned
household addresses.
2.5.4 Fieldwork
Fieldwork took place from 24 October to 18 December 2011. All field interviewers and field supervisors
who had participated in the training workshop were posted throughout the country as stated in
Appendix D to carry out data collection.
The field interviewers were responsible for collecting survey information using the handheld devices and
submitting the data saved on a secured digital card (SD card) to their respective field supervisor on a
daily basis. Field supervisors were responsible for the overall operation of the field team and for
maintaining the time schedule of data collection in the field; they were also responsible for transferring
data to the national data coordinating center via the Internet at least twice a week. The IT/data
management team at the Institute for Public Health was responsible for providing technical support with
respect to concerns raised during fieldwork and for troubleshooting any issues with the handheld
devices. Field-level data were aggregated on a daily basis and analyzed twice a week to identify data
collection errors, problems with skip patterns, and conduct consistency checks. Field-level feedback
forms were analyzed, and the information was provided to interviewers and supervisors to improve
their performance.
The GATS Malaysia protocols were approved by the Medical Research and Ethics Committee, MOH
Malaysia. During data collection, field interviewers were required to obtain the written consent of the
respondents. For persons aged less than 17 years, written consents from their parents or a guardian
were required in addition to a written consent from the interviewee. Interviewers were required to
respect the confidentiality of the data they had collected and had to sign the GATS statement on
confidentiality.
The two quality control techniques implemented were (a) direct observation and assessment of
interview process in the field by Institute for Public Health supervisors and (b) short telephone
interviews for verification with 10% of the completed households.
2.6 Statistical Analysis
Complex survey analysis was used to obtain prevalence and population estimates with 95% confidence
intervals. To improve the representativeness of the sample in terms of the size, distribution, and
characteristics of the study population, sample weights were calculated for each respondent prior to the

13
analysis. The analysis was carried out using SPSS version 19 and SUDAAN version 10.1 software;
standard errors were calculated using Taylor series linearization (see Appendix C for details). Statistical
tests were performed by comparing the 95% confidence intervals of two estimates to determine
whether they were differently statistically. This report states two estimates are different, either higher
or lower, only if their confidence intervals are non-overlapping.
14
3. SAMPLE AND POPULATION CHARACTERISTICS
This chapter presents characteristics of the selected samples and population. The population estimates
were based on the population census taken in 2010 by the Department of Statistics in Malaysia.
3.1 Household and Person-Level Response Rate
Table 3.1 presents the number of households and persons interviewed and the response rate by
residence. Of the 5112 sampled households, 4389 completed the screening, and the calculated total
household response rate was 88.1% (see footnotes to Table 3.1 for methods of calculating response
rates). In urban areas, 2160 of 2676 sampled households (calculated response rate: 83.2%) completed
the screening. In rural areas, the response rate was much better: 2229 of 2436 sampled households
completed the screening, and the calculated response rate was 93.4%.
There were 4389 persons who completed household screening, and 4250 completed the interview
(calculated total response rate was 96.9%). From 2160 completed household screenings in urban areas,
there were 2065 completed interviews (calculated person-level response rate of 95.6%). Again, the
response rate was higher in rural areas, where 2185 persons completed the individual questionnaire
after 2229 had completed the household questionnaire (calculated response rate of 98.1%).
The overall response rate was computed as the product of the household response rate and the person-
level response rate. This rate was 85.3%, where the response rate was 79.6% and 91.7% for urban and
rural areas respectively.
3.2 Sample and Population Characteristics
Table 3.2 presents the unweighted sample size and the weighted population estimates by selected
demographic characteristics. The total unweighted sample was 4250. Based on the population census in
2010, the weighted number of adults aged 15 years or above was 20.53 million. By gender, 2104 men
and 2146 women completed the survey, but the weighted proportions by gender were 51.5% male and
48.5% female. The weighted samples yielded estimates of 10.57 million men and 9.96 million women
respectively. By residence, the number of unweighted respondents was 2065 for urban areas and 2185
for rural areas, but the weighted population was much higher in urban areas than in rural areas with
14.81 million and 5.72 million, respectively. By age group, the number of unweighted respondents was
742 for ages 15-24 years, 1768 for 25-44 years, 1326 for 45-64 years, and 414 for ≥65 years, but the
weighted percentages for these age groups were 27.7%, 41.5%, 23.7%, and 7.1%, respectively. The
weighted percentage completing primary school was 30.1%; completing secondary/high school, 44.2%.
Categorized by race/ethnicity, the majority of the population (weighted) was Malay (58.9%), followed by
Chinese (18.6%) and Indian (9.4%). The remaining 13.2% were from other ethnicities. Two-thirds (66.9%)
of the population was Muslim.
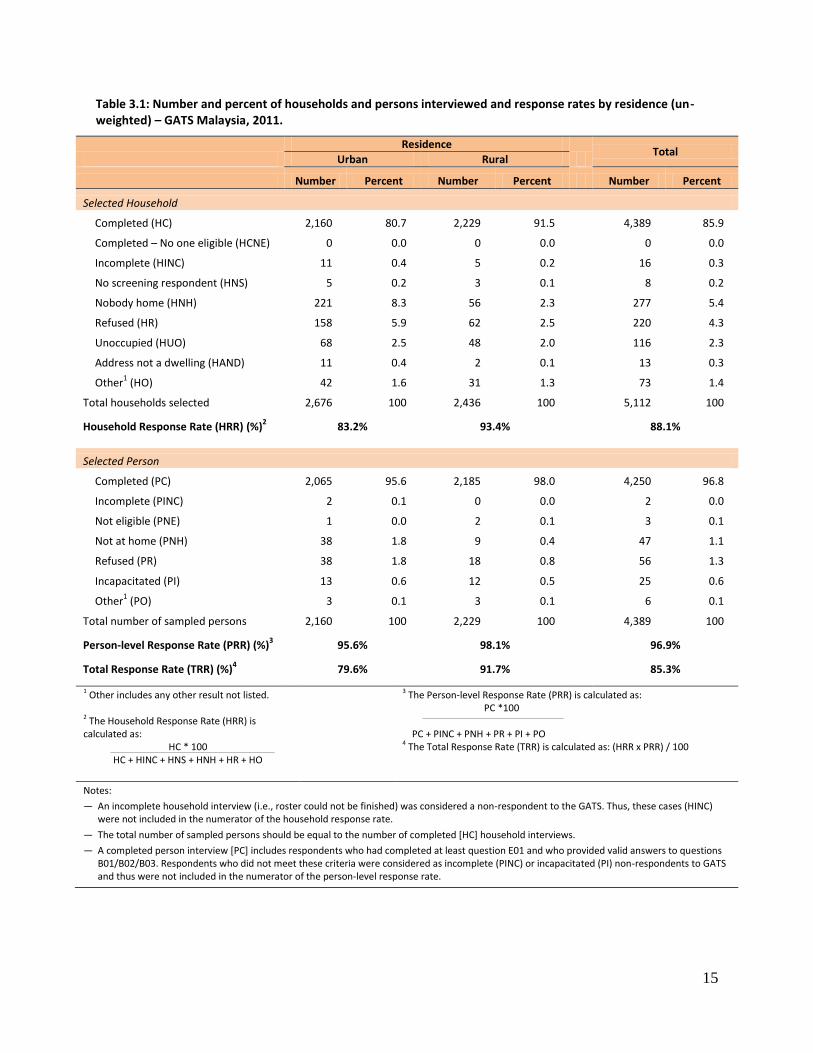
15
Table 3.1: Number and percent of households and persons interviewed and response rates by residence (un-weighted) – GATS Malaysia, 2011.
Residence
Total
Urban Rural
Number Percent Number Percent Number Percent
Selected Household
Completed (HC) 2,160 80.7 2,229 91.5 4,389 85.9
Completed – No one eligible (HCNE) 0 0.0 0 0.0 0 0.0
Incomplete (HINC) 11 0.4 5 0.2 16 0.3
No screening respondent (HNS) 5 0.2 3 0.1 8 0.2
Nobody home (HNH) 221 8.3 56 2.3 277 5.4
Refused (HR) 158 5.9 62 2.5 220 4.3
Unoccupied (HUO) 68 2.5 48 2.0 116 2.3
Address not a dwelling (HAND) 11 0.4 2 0.1 13 0.3
Other1 (HO) 42 1.6 31 1.3 73 1.4
Total households selected 2,676 100 2,436 100 5,112 100
Household Response Rate (HRR) (%)2 83.2% 93.4% 88.1%
Selected Person
Completed (PC) 2,065 95.6 2,185 98.0 4,250 96.8
Incomplete (PINC) 2 0.1 0 0.0 2 0.0
Not eligible (PNE) 1 0.0 2 0.1 3 0.1
Not at home (PNH) 38 1.8 9 0.4 47 1.1
Refused (PR) 38 1.8 18 0.8 56 1.3
Incapacitated (PI) 13 0.6 12 0.5 25 0.6
Other1 (PO) 3 0.1 3 0.1 6 0.1
Total number of sampled persons 2,160 100 2,229 100 4,389 100
Person-level Response Rate (PRR) (%)3 95.6% 98.1% 96.9%
Total Response Rate (TRR) (%)4 79.6% 91.7% 85.3%
1 Other includes any other result not listed.
2 The Household Response Rate (HRR) is calculated as:
HC * 100 HC + HINC + HNS + HNH + HR + HO
3 The Person-level Response Rate (PRR) is calculated as: PC *100 PC + PINC + PNH + PR + PI + PO 4 The Total Response Rate (TRR) is calculated as: (HRR x PRR) / 100
Notes:
— An incomplete household interview (i.e., roster could not be finished) was considered a non-respondent to the GATS. Thus, these cases (HINC) were not included in the numerator of the household response rate.
— The total number of sampled persons should be equal to the number of completed [HC] household interviews.
— A completed person interview [PC] includes respondents who had completed at least question E01 and who provided valid answers to questions B01/B02/B03. Respondents who did not meet these criteria were considered as incomplete (PINC) or incapacitated (PI) non-respondents to GATS and thus were not included in the numerator of the person-level response rate.
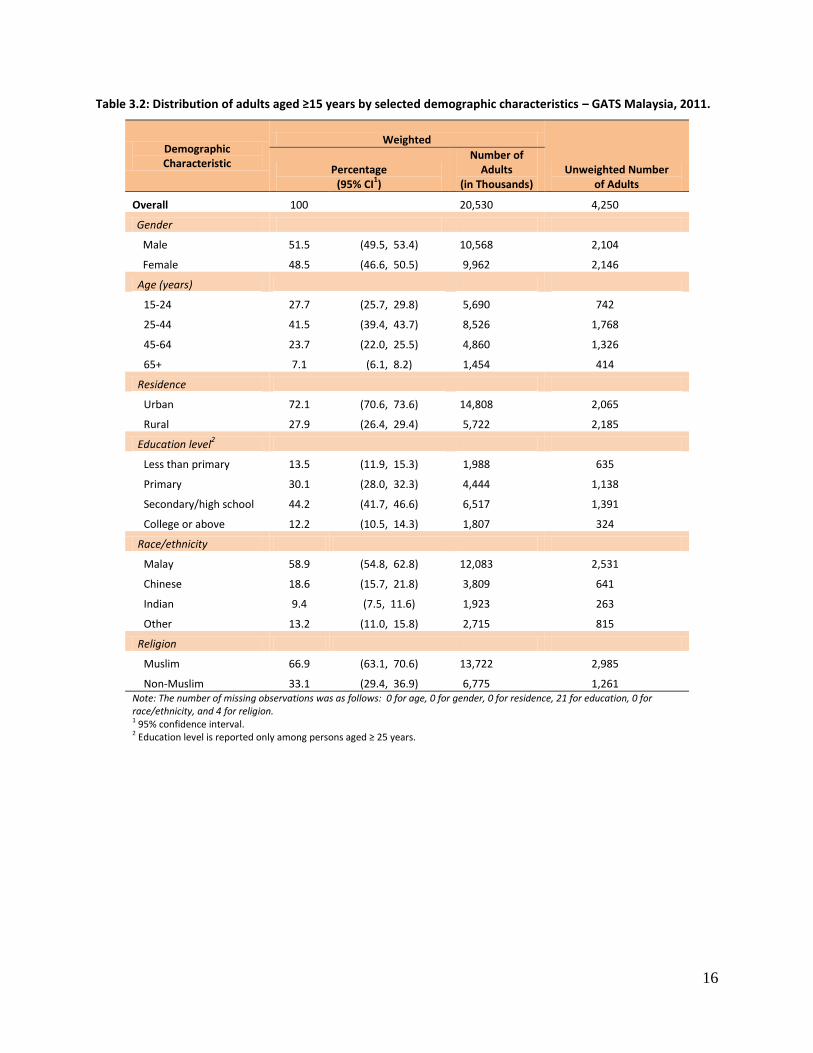
16
Table 3.2: Distribution of adults aged ≥15 years by selected demographic characteristics – GATS Malaysia, 2011.
Demographic Characteristic
Weighted
Unweighted Number of Adults
Percentage (95% CI
1)
Number of Adults
(in Thousands)
Overall 100 20,530 4,250
Gender
Male 51.5 (49.5, 53.4) 10,568 2,104
Female 48.5 (46.6, 50.5) 9,962 2,146
Age (years)
15-24 27.7 (25.7, 29.8) 5,690 742
25-44 41.5 (39.4, 43.7) 8,526 1,768
45-64 23.7 (22.0, 25.5) 4,860 1,326
65+ 7.1 (6.1, 8.2) 1,454 414
Residence
Urban 72.1 (70.6, 73.6) 14,808 2,065
Rural 27.9 (26.4, 29.4) 5,722 2,185
Education level2
Less than primary 13.5 (11.9, 15.3) 1,988 635
Primary 30.1 (28.0, 32.3) 4,444 1,138
Secondary/high school 44.2 (41.7, 46.6) 6,517 1,391
College or above 12.2 (10.5, 14.3) 1,807 324
Race/ethnicity
Malay 58.9 (54.8, 62.8) 12,083 2,531
Chinese 18.6 (15.7, 21.8) 3,809 641
Indian 9.4 (7.5, 11.6) 1,923 263
Other 13.2 (11.0, 15.8) 2,715 815
Religion
Muslim 66.9 (63.1, 70.6) 13,722 2,985
Non-Muslim 33.1 (29.4, 36.9) 6,775 1,261 Note: The number of missing observations was as follows: 0 for age, 0 for gender, 0 for residence, 21 for education, 0 for race/ethnicity, and 4 for religion. 1 95% confidence interval. 2 Education level is reported only among persons aged ≥ 25 years.
17
4. TOBACCO USE
National estimates of tobacco use in the general population are essential for monitoring the tobacco
epidemic in a country and provide the evidence-based, concrete analysis needed to develop policies for
the effective implementation of a comprehensive program in tobacco control. As the provisions of the
Malaysia Control of Tobacco Products Regulations 2004 cover tobacco products in general, it is
necessary to have reliable estimates of the prevalence of both smoking and the use of smokeless
tobacco.
The use of smoking tobacco is prevalent in Malaysia. Here, smokers use various types of tobacco
products, including manufactured cigarettes (not including kreteks), hand-rolled cigarettes, kreteks,
tobacco-filled pipes, curut, cigars or cigarillos, shisha/hookah and bidis.
There is minimal use of smokeless tobacco among Malaysian adult smokers. Smokeless tobacco is used
by either chewing or applying it to the teeth and gums or by sniffing it. Smokeless tobacco products in
Malaysia include chewing tobacco products, such as betel quid with tobacco, gutkha, paan masala, and
other products such as snuff.
This chapter presents the prevalence of smoking and smokeless tobacco use in Malaysia. It also
describes smoking behaviors in the Malaysian adult population: 1) the status of tobacco use, 2) the use
of various tobacco products, and 3) demographic and behavioral patterns of smoking, including number
of cigarettes smoked daily, average age and distribution by age of initiation of daily smoking, the
prevalence of quitting tobacco use, and indicators of tobacco dependence.
Key Findings
43.9% of men, 1.0% of women, and 23.1% of adults overall (4.7 million) currently smoked tobacco.
43.6% of men, 1.0% of women, and 22.9% of adults overall (4.7 million) currently smoked cigarettes, including manufactured, hand-rolled, and kreteks.
39.9% of men, 0.7% of women, and 20.9% of adults overall (4.3 million) currently smoked tobacco on a daily basis.
Daily cigarette smokers smoked an average of 14 cigarettes per day.
More than half of those aged 20-34 years who had ever smoked on a daily basis started smoking daily before the age of 18.
Among those who had ever smoked on a daily basis, only 9.5% had quit smoking.
Almost half of all current daily smokers had their first smoke of the day within 30 minutes of waking up.
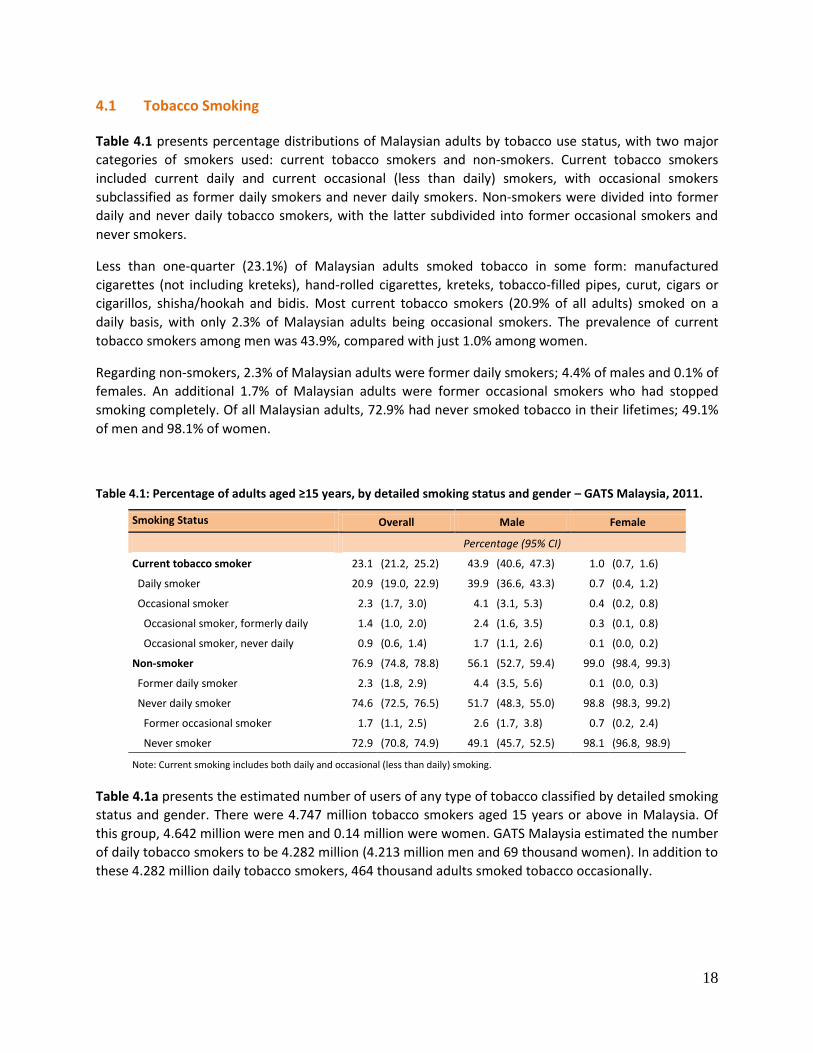
18
4.1 Tobacco Smoking
Table 4.1 presents percentage distributions of Malaysian adults by tobacco use status, with two major
categories of smokers used: current tobacco smokers and non-smokers. Current tobacco smokers
included current daily and current occasional (less than daily) smokers, with occasional smokers
subclassified as former daily smokers and never daily smokers. Non-smokers were divided into former
daily and never daily tobacco smokers, with the latter subdivided into former occasional smokers and
never smokers.
Less than one-quarter (23.1%) of Malaysian adults smoked tobacco in some form: manufactured
cigarettes (not including kreteks), hand-rolled cigarettes, kreteks, tobacco-filled pipes, curut, cigars or
cigarillos, shisha/hookah and bidis. Most current tobacco smokers (20.9% of all adults) smoked on a
daily basis, with only 2.3% of Malaysian adults being occasional smokers. The prevalence of current
tobacco smokers among men was 43.9%, compared with just 1.0% among women.
Regarding non-smokers, 2.3% of Malaysian adults were former daily smokers; 4.4% of males and 0.1% of
females. An additional 1.7% of Malaysian adults were former occasional smokers who had stopped
smoking completely. Of all Malaysian adults, 72.9% had never smoked tobacco in their lifetimes; 49.1%
of men and 98.1% of women.
Table 4.1: Percentage of adults aged ≥15 years, by detailed smoking status and gender – GATS Malaysia, 2011.
Smoking Status Overall Male Female
Percentage (95% CI)
Current tobacco smoker 23.1 (21.2, 25.2) 43.9 (40.6, 47.3) 1.0 (0.7, 1.6)
Daily smoker 20.9 (19.0, 22.9) 39.9 (36.6, 43.3) 0.7 (0.4, 1.2)
Occasional smoker 2.3 (1.7, 3.0) 4.1 (3.1, 5.3) 0.4 (0.2, 0.8)
Occasional smoker, formerly daily 1.4 (1.0, 2.0) 2.4 (1.6, 3.5) 0.3 (0.1, 0.8)
Occasional smoker, never daily 0.9 (0.6, 1.4) 1.7 (1.1, 2.6) 0.1 (0.0, 0.2)
Non-smoker 76.9 (74.8, 78.8) 56.1 (52.7, 59.4) 99.0 (98.4, 99.3)
Former daily smoker 2.3 (1.8, 2.9) 4.4 (3.5, 5.6) 0.1 (0.0, 0.3)
Never daily smoker 74.6 (72.5, 76.5) 51.7 (48.3, 55.0) 98.8 (98.3, 99.2)
Former occasional smoker 1.7 (1.1, 2.5) 2.6 (1.7, 3.8) 0.7 (0.2, 2.4)
Never smoker 72.9 (70.8, 74.9) 49.1 (45.7, 52.5) 98.1 (96.8, 98.9)
Note: Current smoking includes both daily and occasional (less than daily) smoking.
Table 4.1a presents the estimated number of users of any type of tobacco classified by detailed smoking
status and gender. There were 4.747 million tobacco smokers aged 15 years or above in Malaysia. Of
this group, 4.642 million were men and 0.14 million were women. GATS Malaysia estimated the number
of daily tobacco smokers to be 4.282 million (4.213 million men and 69 thousand women). In addition to
these 4.282 million daily tobacco smokers, 464 thousand adults smoked tobacco occasionally.
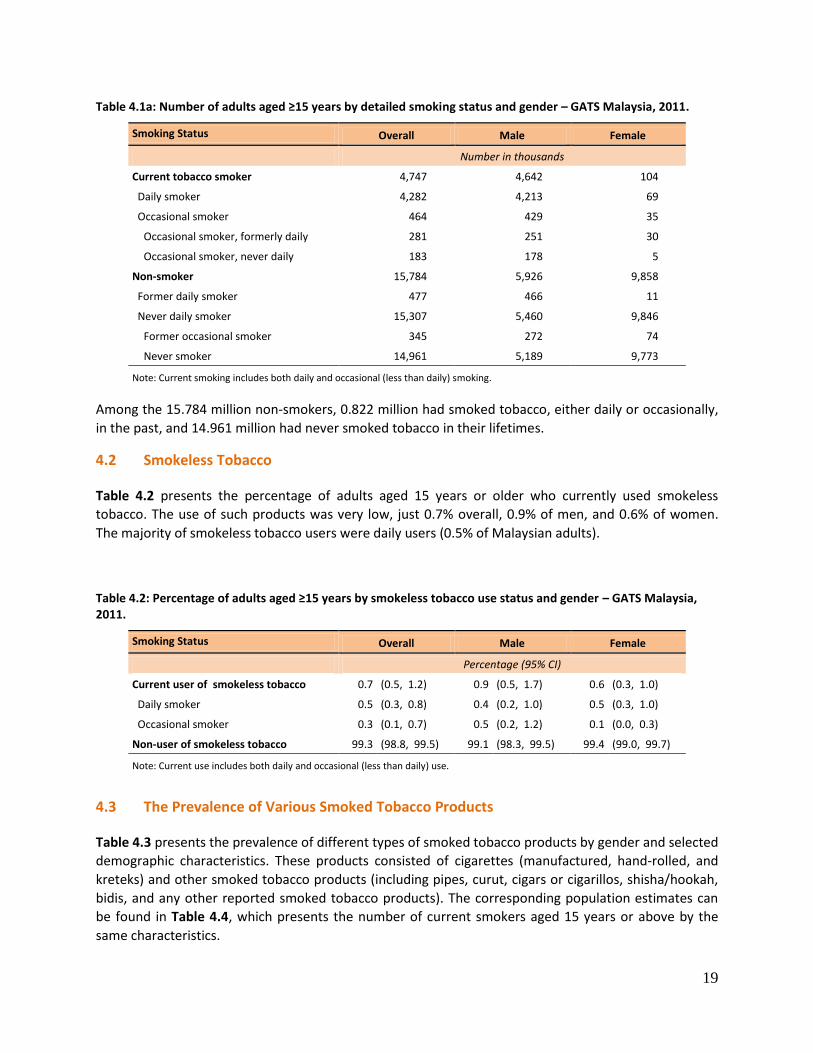
19
Table 4.1a: Number of adults aged ≥15 years by detailed smoking status and gender – GATS Malaysia, 2011.
Smoking Status Overall Male Female
Number in thousands
Current tobacco smoker 4,747 4,642 104
Daily smoker 4,282 4,213 69
Occasional smoker 464 429 35
Occasional smoker, formerly daily 281 251 30
Occasional smoker, never daily 183 178 5
Non-smoker 15,784 5,926 9,858
Former daily smoker 477 466 11
Never daily smoker 15,307 5,460 9,846
Former occasional smoker 345 272 74
Never smoker 14,961 5,189 9,773
Note: Current smoking includes both daily and occasional (less than daily) smoking.
Among the 15.784 million non-smokers, 0.822 million had smoked tobacco, either daily or occasionally,
in the past, and 14.961 million had never smoked tobacco in their lifetimes.
4.2 Smokeless Tobacco
Table 4.2 presents the percentage of adults aged 15 years or older who currently used smokeless
tobacco. The use of such products was very low, just 0.7% overall, 0.9% of men, and 0.6% of women.
The majority of smokeless tobacco users were daily users (0.5% of Malaysian adults).
Table 4.2: Percentage of adults aged ≥15 years by smokeless tobacco use status and gender – GATS Malaysia, 2011.
Smoking Status Overall Male Female
Percentage (95% CI)
Current user of smokeless tobacco 0.7 (0.5, 1.2) 0.9 (0.5, 1.7) 0.6 (0.3, 1.0)
Daily smoker 0.5 (0.3, 0.8) 0.4 (0.2, 1.0) 0.5 (0.3, 1.0)
Occasional smoker 0.3 (0.1, 0.7) 0.5 (0.2, 1.2) 0.1 (0.0, 0.3)
Non-user of smokeless tobacco 99.3 (98.8, 99.5) 99.1 (98.3, 99.5) 99.4 (99.0, 99.7)
Note: Current use includes both daily and occasional (less than daily) use.
4.3 The Prevalence of Various Smoked Tobacco Products
Table 4.3 presents the prevalence of different types of smoked tobacco products by gender and selected
demographic characteristics. These products consisted of cigarettes (manufactured, hand-rolled, and
kreteks) and other smoked tobacco products (including pipes, curut, cigars or cigarillos, shisha/hookah,
bidis, and any other reported smoked tobacco products). The corresponding population estimates can
be found in Table 4.4, which presents the number of current smokers aged 15 years or above by the
same characteristics.
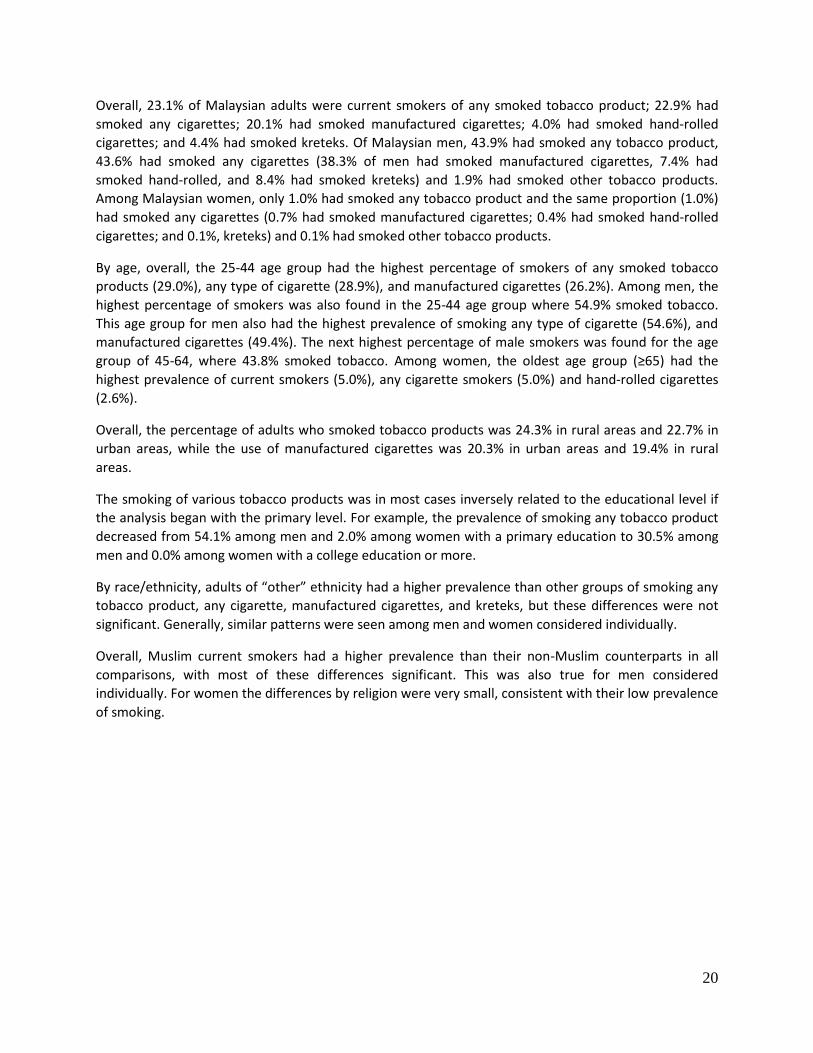
20
Overall, 23.1% of Malaysian adults were current smokers of any smoked tobacco product; 22.9% had
smoked any cigarettes; 20.1% had smoked manufactured cigarettes; 4.0% had smoked hand-rolled
cigarettes; and 4.4% had smoked kreteks. Of Malaysian men, 43.9% had smoked any tobacco product,
43.6% had smoked any cigarettes (38.3% of men had smoked manufactured cigarettes, 7.4% had
smoked hand-rolled, and 8.4% had smoked kreteks) and 1.9% had smoked other tobacco products.
Among Malaysian women, only 1.0% had smoked any tobacco product and the same proportion (1.0%)
had smoked any cigarettes (0.7% had smoked manufactured cigarettes; 0.4% had smoked hand-rolled
cigarettes; and 0.1%, kreteks) and 0.1% had smoked other tobacco products.
By age, overall, the 25-44 age group had the highest percentage of smokers of any smoked tobacco
products (29.0%), any type of cigarette (28.9%), and manufactured cigarettes (26.2%). Among men, the
highest percentage of smokers was also found in the 25-44 age group where 54.9% smoked tobacco.
This age group for men also had the highest prevalence of smoking any type of cigarette (54.6%), and
manufactured cigarettes (49.4%). The next highest percentage of male smokers was found for the age
group of 45-64, where 43.8% smoked tobacco. Among women, the oldest age group (≥65) had the
highest prevalence of current smokers (5.0%), any cigarette smokers (5.0%) and hand-rolled cigarettes
(2.6%).
Overall, the percentage of adults who smoked tobacco products was 24.3% in rural areas and 22.7% in
urban areas, while the use of manufactured cigarettes was 20.3% in urban areas and 19.4% in rural
areas.
The smoking of various tobacco products was in most cases inversely related to the educational level if
the analysis began with the primary level. For example, the prevalence of smoking any tobacco product
decreased from 54.1% among men and 2.0% among women with a primary education to 30.5% among
men and 0.0% among women with a college education or more.
By race/ethnicity, adults of “other” ethnicity had a higher prevalence than other groups of smoking any
tobacco product, any cigarette, manufactured cigarettes, and kreteks, but these differences were not
significant. Generally, similar patterns were seen among men and women considered individually.
Overall, Muslim current smokers had a higher prevalence than their non-Muslim counterparts in all
comparisons, with most of these differences significant. This was also true for men considered
individually. For women the differences by religion were very small, consistent with their low prevalence
of smoking.
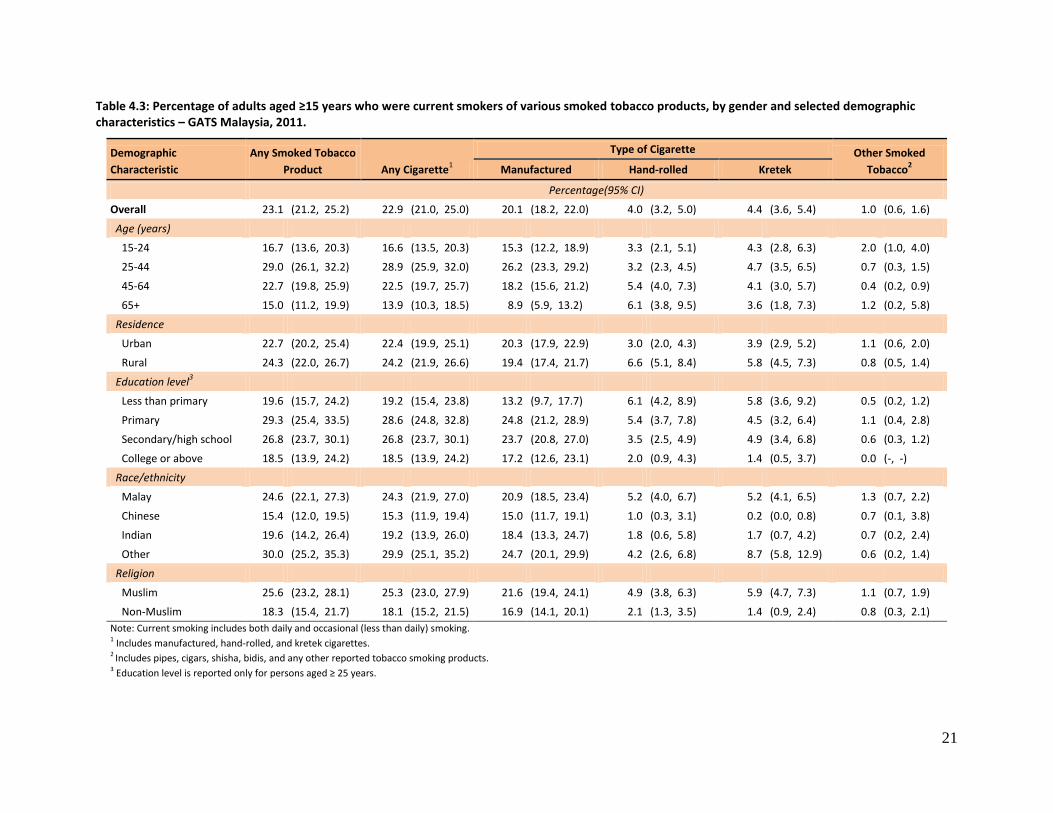
21
Table 4.3: Percentage of adults aged ≥15 years who were current smokers of various smoked tobacco products, by gender and selected demographic characteristics – GATS Malaysia, 2011.
Demographic
Characteristic
Any Smoked Tobacco
Product Any Cigarette1
Type of Cigarette Other Smoked
Tobacco2 Manufactured Hand-rolled Kretek
Percentage(95% CI)
Overall 23.1 (21.2, 25.2) 22.9 (21.0, 25.0) 20.1 (18.2, 22.0) 4.0 (3.2, 5.0) 4.4 (3.6, 5.4) 1.0 (0.6, 1.6)
Age (years)
15-24 16.7 (13.6, 20.3) 16.6 (13.5, 20.3) 15.3 (12.2, 18.9) 3.3 (2.1, 5.1) 4.3 (2.8, 6.3) 2.0 (1.0, 4.0)
25-44 29.0 (26.1, 32.2) 28.9 (25.9, 32.0) 26.2 (23.3, 29.2) 3.2 (2.3, 4.5) 4.7 (3.5, 6.5) 0.7 (0.3, 1.5)
45-64 22.7 (19.8, 25.9) 22.5 (19.7, 25.7) 18.2 (15.6, 21.2) 5.4 (4.0, 7.3) 4.1 (3.0, 5.7) 0.4 (0.2, 0.9)
65+ 15.0 (11.2, 19.9) 13.9 (10.3, 18.5) 8.9 (5.9, 13.2) 6.1 (3.8, 9.5) 3.6 (1.8, 7.3) 1.2 (0.2, 5.8)
Residence
Urban 22.7 (20.2, 25.4) 22.4 (19.9, 25.1) 20.3 (17.9, 22.9) 3.0 (2.0, 4.3) 3.9 (2.9, 5.2) 1.1 (0.6, 2.0)
Rural 24.3 (22.0, 26.7) 24.2 (21.9, 26.6) 19.4 (17.4, 21.7) 6.6 (5.1, 8.4) 5.8 (4.5, 7.3) 0.8 (0.5, 1.4)
Education level3
Less than primary 19.6 (15.7, 24.2) 19.2 (15.4, 23.8) 13.2 (9.7, 17.7) 6.1 (4.2, 8.9) 5.8 (3.6, 9.2) 0.5 (0.2, 1.2)
Primary 29.3 (25.4, 33.5) 28.6 (24.8, 32.8) 24.8 (21.2, 28.9) 5.4 (3.7, 7.8) 4.5 (3.2, 6.4) 1.1 (0.4, 2.8)
Secondary/high school 26.8 (23.7, 30.1) 26.8 (23.7, 30.1) 23.7 (20.8, 27.0) 3.5 (2.5, 4.9) 4.9 (3.4, 6.8) 0.6 (0.3, 1.2)
College or above 18.5 (13.9, 24.2) 18.5 (13.9, 24.2) 17.2 (12.6, 23.1) 2.0 (0.9, 4.3) 1.4 (0.5, 3.7) 0.0 (-, -)
Race/ethnicity
Malay 24.6 (22.1, 27.3) 24.3 (21.9, 27.0) 20.9 (18.5, 23.4) 5.2 (4.0, 6.7) 5.2 (4.1, 6.5) 1.3 (0.7, 2.2)
Chinese 15.4 (12.0, 19.5) 15.3 (11.9, 19.4) 15.0 (11.7, 19.1) 1.0 (0.3, 3.1) 0.2 (0.0, 0.8) 0.7 (0.1, 3.8)
Indian 19.6 (14.2, 26.4) 19.2 (13.9, 26.0) 18.4 (13.3, 24.7) 1.8 (0.6, 5.8) 1.7 (0.7, 4.2) 0.7 (0.2, 2.4)
Other 30.0 (25.2, 35.3) 29.9 (25.1, 35.2) 24.7 (20.1, 29.9) 4.2 (2.6, 6.8) 8.7 (5.8, 12.9) 0.6 (0.2, 1.4)
Religion
Muslim 25.6 (23.2, 28.1) 25.3 (23.0, 27.9) 21.6 (19.4, 24.1) 4.9 (3.8, 6.3) 5.9 (4.7, 7.3) 1.1 (0.7, 1.9)
Non-Muslim 18.3 (15.4, 21.7) 18.1 (15.2, 21.5) 16.9 (14.1, 20.1) 2.1 (1.3, 3.5) 1.4 (0.9, 2.4) 0.8 (0.3, 2.1)
Note: Current smoking includes both daily and occasional (less than daily) smoking. 1 Includes manufactured, hand-rolled, and kretek cigarettes. 2 Includes pipes, cigars, shisha, bidis, and any other reported tobacco smoking products. 3 Education level is reported only for persons aged ≥ 25 years.
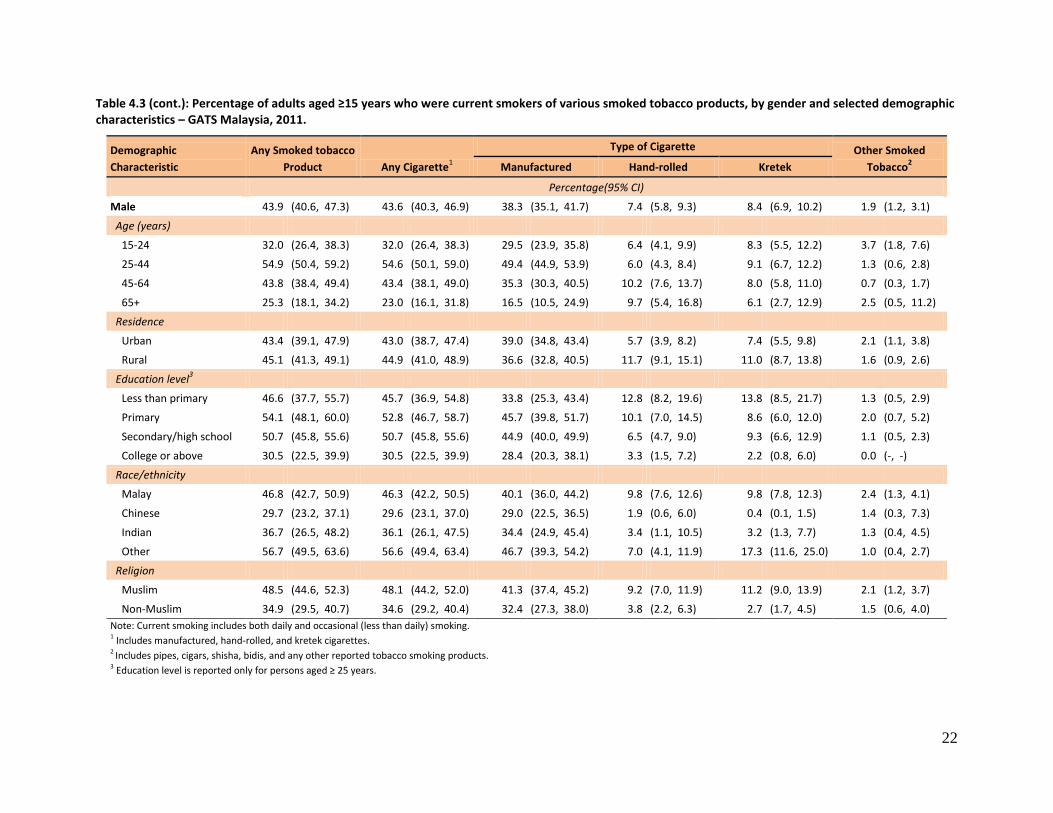
22
Table 4.3 (cont.): Percentage of adults aged ≥15 years who were current smokers of various smoked tobacco products, by gender and selected demographic characteristics – GATS Malaysia, 2011.
Demographic
Characteristic
Any Smoked tobacco
Product Any Cigarette1
Type of Cigarette Other Smoked
Tobacco2 Manufactured Hand-rolled Kretek
Percentage(95% CI)
Male 43.9 (40.6, 47.3) 43.6 (40.3, 46.9) 38.3 (35.1, 41.7) 7.4 (5.8, 9.3) 8.4 (6.9, 10.2) 1.9 (1.2, 3.1)
Age (years)
15-24 32.0 (26.4, 38.3) 32.0 (26.4, 38.3) 29.5 (23.9, 35.8) 6.4 (4.1, 9.9) 8.3 (5.5, 12.2) 3.7 (1.8, 7.6)
25-44 54.9 (50.4, 59.2) 54.6 (50.1, 59.0) 49.4 (44.9, 53.9) 6.0 (4.3, 8.4) 9.1 (6.7, 12.2) 1.3 (0.6, 2.8)
45-64 43.8 (38.4, 49.4) 43.4 (38.1, 49.0) 35.3 (30.3, 40.5) 10.2 (7.6, 13.7) 8.0 (5.8, 11.0) 0.7 (0.3, 1.7)
65+ 25.3 (18.1, 34.2) 23.0 (16.1, 31.8) 16.5 (10.5, 24.9) 9.7 (5.4, 16.8) 6.1 (2.7, 12.9) 2.5 (0.5, 11.2)
Residence
Urban 43.4 (39.1, 47.9) 43.0 (38.7, 47.4) 39.0 (34.8, 43.4) 5.7 (3.9, 8.2) 7.4 (5.5, 9.8) 2.1 (1.1, 3.8)
Rural 45.1 (41.3, 49.1) 44.9 (41.0, 48.9) 36.6 (32.8, 40.5) 11.7 (9.1, 15.1) 11.0 (8.7, 13.8) 1.6 (0.9, 2.6)
Education level3
Less than primary 46.6 (37.7, 55.7) 45.7 (36.9, 54.8) 33.8 (25.3, 43.4) 12.8 (8.2, 19.6) 13.8 (8.5, 21.7) 1.3 (0.5, 2.9)
Primary 54.1 (48.1, 60.0) 52.8 (46.7, 58.7) 45.7 (39.8, 51.7) 10.1 (7.0, 14.5) 8.6 (6.0, 12.0) 2.0 (0.7, 5.2)
Secondary/high school 50.7 (45.8, 55.6) 50.7 (45.8, 55.6) 44.9 (40.0, 49.9) 6.5 (4.7, 9.0) 9.3 (6.6, 12.9) 1.1 (0.5, 2.3)
College or above 30.5 (22.5, 39.9) 30.5 (22.5, 39.9) 28.4 (20.3, 38.1) 3.3 (1.5, 7.2) 2.2 (0.8, 6.0) 0.0 (-, -)
Race/ethnicity
Malay 46.8 (42.7, 50.9) 46.3 (42.2, 50.5) 40.1 (36.0, 44.2) 9.8 (7.6, 12.6) 9.8 (7.8, 12.3) 2.4 (1.3, 4.1)
Chinese 29.7 (23.2, 37.1) 29.6 (23.1, 37.0) 29.0 (22.5, 36.5) 1.9 (0.6, 6.0) 0.4 (0.1, 1.5) 1.4 (0.3, 7.3)
Indian 36.7 (26.5, 48.2) 36.1 (26.1, 47.5) 34.4 (24.9, 45.4) 3.4 (1.1, 10.5) 3.2 (1.3, 7.7) 1.3 (0.4, 4.5)
Other 56.7 (49.5, 63.6) 56.6 (49.4, 63.4) 46.7 (39.3, 54.2) 7.0 (4.1, 11.9) 17.3 (11.6, 25.0) 1.0 (0.4, 2.7)
Religion
Muslim 48.5 (44.6, 52.3) 48.1 (44.2, 52.0) 41.3 (37.4, 45.2) 9.2 (7.0, 11.9) 11.2 (9.0, 13.9) 2.1 (1.2, 3.7)
Non-Muslim 34.9 (29.5, 40.7) 34.6 (29.2, 40.4) 32.4 (27.3, 38.0) 3.8 (2.2, 6.3) 2.7 (1.7, 4.5) 1.5 (0.6, 4.0)
Note: Current smoking includes both daily and occasional (less than daily) smoking. 1 Includes manufactured, hand-rolled, and kretek cigarettes. 2 Includes pipes, cigars, shisha, bidis, and any other reported tobacco smoking products. 3 Education level is reported only for persons aged ≥ 25 years.
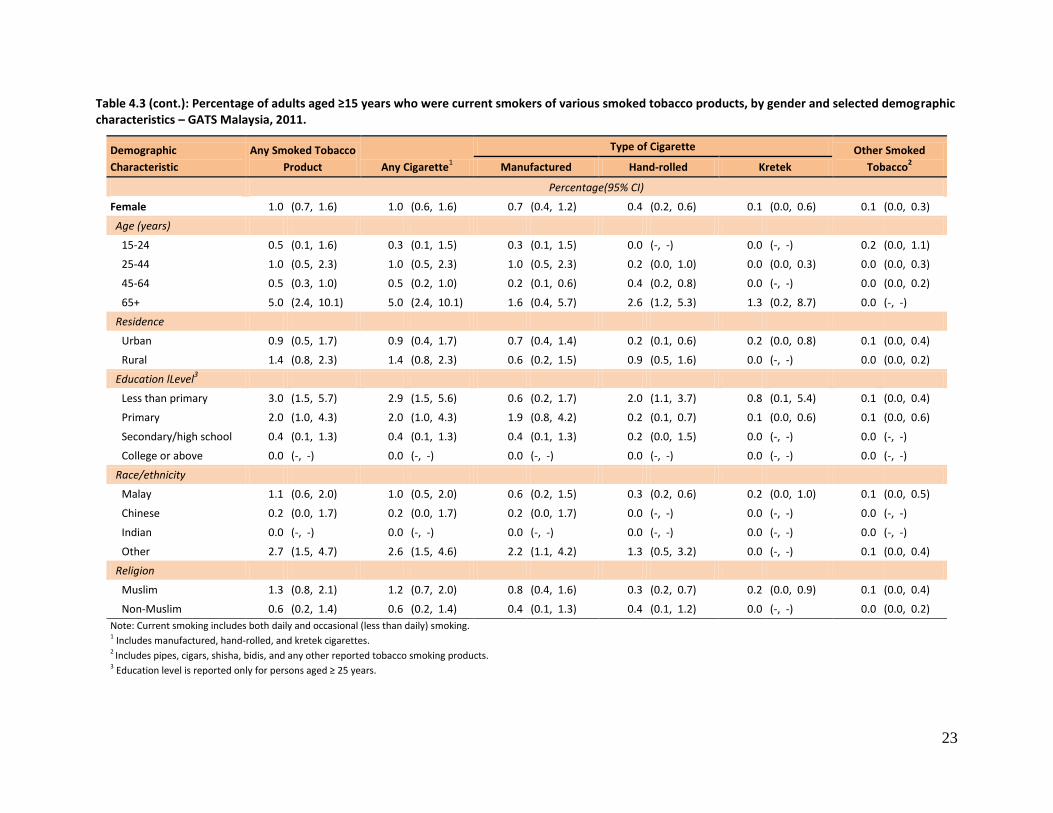
23
Table 4.3 (cont.): Percentage of adults aged ≥15 years who were current smokers of various smoked tobacco products, by gender and selected demographic characteristics – GATS Malaysia, 2011.
Demographic
Characteristic
Any Smoked Tobacco
Product Any Cigarette1
Type of Cigarette Other Smoked
Tobacco2 Manufactured Hand-rolled Kretek
Percentage(95% CI)
Female 1.0 (0.7, 1.6) 1.0 (0.6, 1.6) 0.7 (0.4, 1.2) 0.4 (0.2, 0.6) 0.1 (0.0, 0.6) 0.1 (0.0, 0.3)
Age (years)
15-24 0.5 (0.1, 1.6) 0.3 (0.1, 1.5) 0.3 (0.1, 1.5) 0.0 (-, -) 0.0 (-, -) 0.2 (0.0, 1.1)
25-44 1.0 (0.5, 2.3) 1.0 (0.5, 2.3) 1.0 (0.5, 2.3) 0.2 (0.0, 1.0) 0.0 (0.0, 0.3) 0.0 (0.0, 0.3)
45-64 0.5 (0.3, 1.0) 0.5 (0.2, 1.0) 0.2 (0.1, 0.6) 0.4 (0.2, 0.8) 0.0 (-, -) 0.0 (0.0, 0.2)
65+ 5.0 (2.4, 10.1) 5.0 (2.4, 10.1) 1.6 (0.4, 5.7) 2.6 (1.2, 5.3) 1.3 (0.2, 8.7) 0.0 (-, -)
Residence
Urban 0.9 (0.5, 1.7) 0.9 (0.4, 1.7) 0.7 (0.4, 1.4) 0.2 (0.1, 0.6) 0.2 (0.0, 0.8) 0.1 (0.0, 0.4)
Rural 1.4 (0.8, 2.3) 1.4 (0.8, 2.3) 0.6 (0.2, 1.5) 0.9 (0.5, 1.6) 0.0 (-, -) 0.0 (0.0, 0.2)
Education lLevel3
Less than primary 3.0 (1.5, 5.7) 2.9 (1.5, 5.6) 0.6 (0.2, 1.7) 2.0 (1.1, 3.7) 0.8 (0.1, 5.4) 0.1 (0.0, 0.4)
Primary 2.0 (1.0, 4.3) 2.0 (1.0, 4.3) 1.9 (0.8, 4.2) 0.2 (0.1, 0.7) 0.1 (0.0, 0.6) 0.1 (0.0, 0.6)
Secondary/high school 0.4 (0.1, 1.3) 0.4 (0.1, 1.3) 0.4 (0.1, 1.3) 0.2 (0.0, 1.5) 0.0 (-, -) 0.0 (-, -)
College or above 0.0 (-, -) 0.0 (-, -) 0.0 (-, -) 0.0 (-, -) 0.0 (-, -) 0.0 (-, -)
Race/ethnicity
Malay 1.1 (0.6, 2.0) 1.0 (0.5, 2.0) 0.6 (0.2, 1.5) 0.3 (0.2, 0.6) 0.2 (0.0, 1.0) 0.1 (0.0, 0.5)
Chinese 0.2 (0.0, 1.7) 0.2 (0.0, 1.7) 0.2 (0.0, 1.7) 0.0 (-, -) 0.0 (-, -) 0.0 (-, -)
Indian 0.0 (-, -) 0.0 (-, -) 0.0 (-, -) 0.0 (-, -) 0.0 (-, -) 0.0 (-, -)
Other 2.7 (1.5, 4.7) 2.6 (1.5, 4.6) 2.2 (1.1, 4.2) 1.3 (0.5, 3.2) 0.0 (-, -) 0.1 (0.0, 0.4)
Religion
Muslim 1.3 (0.8, 2.1) 1.2 (0.7, 2.0) 0.8 (0.4, 1.6) 0.3 (0.2, 0.7) 0.2 (0.0, 0.9) 0.1 (0.0, 0.4)
Non-Muslim 0.6 (0.2, 1.4) 0.6 (0.2, 1.4) 0.4 (0.1, 1.3) 0.4 (0.1, 1.2) 0.0 (-, -) 0.0 (0.0, 0.2)
Note: Current smoking includes both daily and occasional (less than daily) smoking. 1 Includes manufactured, hand-rolled, and kretek cigarettes. 2 Includes pipes, cigars, shisha, bidis, and any other reported tobacco smoking products. 3 Education level is reported only for persons aged ≥ 25 years.
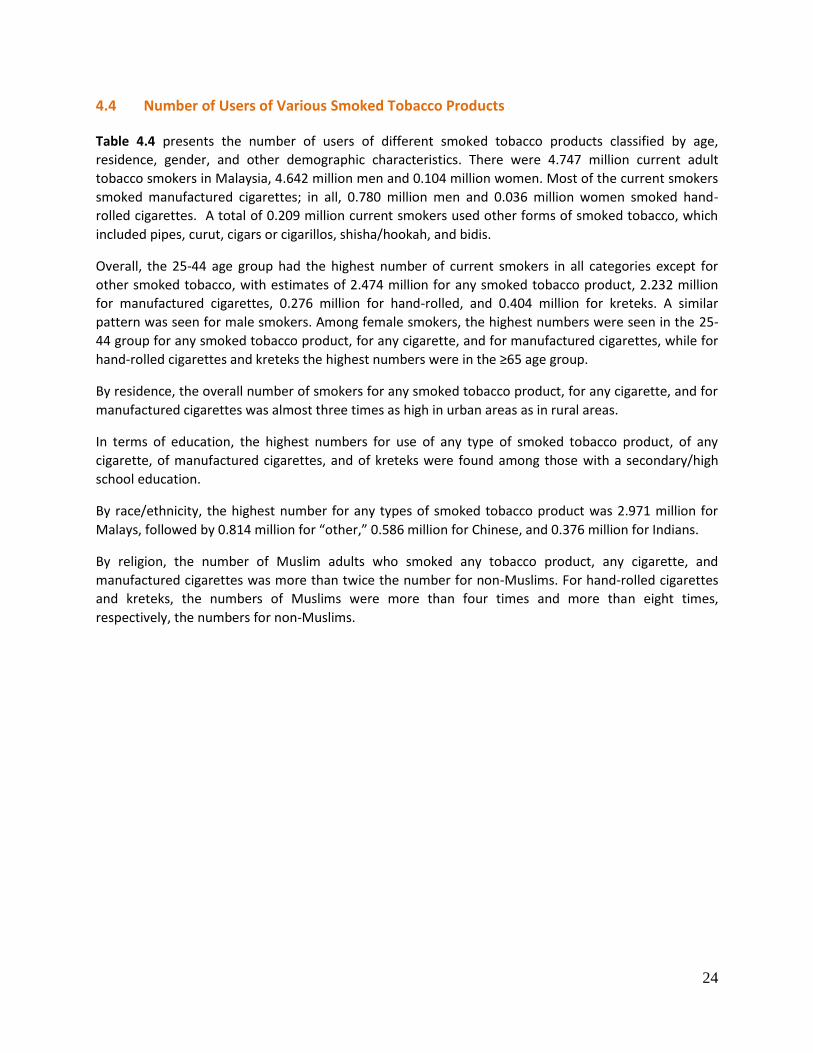
24
4.4 Number of Users of Various Smoked Tobacco Products
Table 4.4 presents the number of users of different smoked tobacco products classified by age,
residence, gender, and other demographic characteristics. There were 4.747 million current adult
tobacco smokers in Malaysia, 4.642 million men and 0.104 million women. Most of the current smokers
smoked manufactured cigarettes; in all, 0.780 million men and 0.036 million women smoked hand-
rolled cigarettes. A total of 0.209 million current smokers used other forms of smoked tobacco, which
included pipes, curut, cigars or cigarillos, shisha/hookah, and bidis.
Overall, the 25-44 age group had the highest number of current smokers in all categories except for
other smoked tobacco, with estimates of 2.474 million for any smoked tobacco product, 2.232 million
for manufactured cigarettes, 0.276 million for hand-rolled, and 0.404 million for kreteks. A similar
pattern was seen for male smokers. Among female smokers, the highest numbers were seen in the 25-
44 group for any smoked tobacco product, for any cigarette, and for manufactured cigarettes, while for
hand-rolled cigarettes and kreteks the highest numbers were in the ≥65 age group.
By residence, the overall number of smokers for any smoked tobacco product, for any cigarette, and for
manufactured cigarettes was almost three times as high in urban areas as in rural areas.
In terms of education, the highest numbers for use of any type of smoked tobacco product, of any
cigarette, of manufactured cigarettes, and of kreteks were found among those with a secondary/high
school education.
By race/ethnicity, the highest number for any types of smoked tobacco product was 2.971 million for
Malays, followed by 0.814 million for “other,” 0.586 million for Chinese, and 0.376 million for Indians.
By religion, the number of Muslim adults who smoked any tobacco product, any cigarette, and
manufactured cigarettes was more than twice the number for non-Muslims. For hand-rolled cigarettes
and kreteks, the numbers of Muslims were more than four times and more than eight times,
respectively, the numbers for non-Muslims.
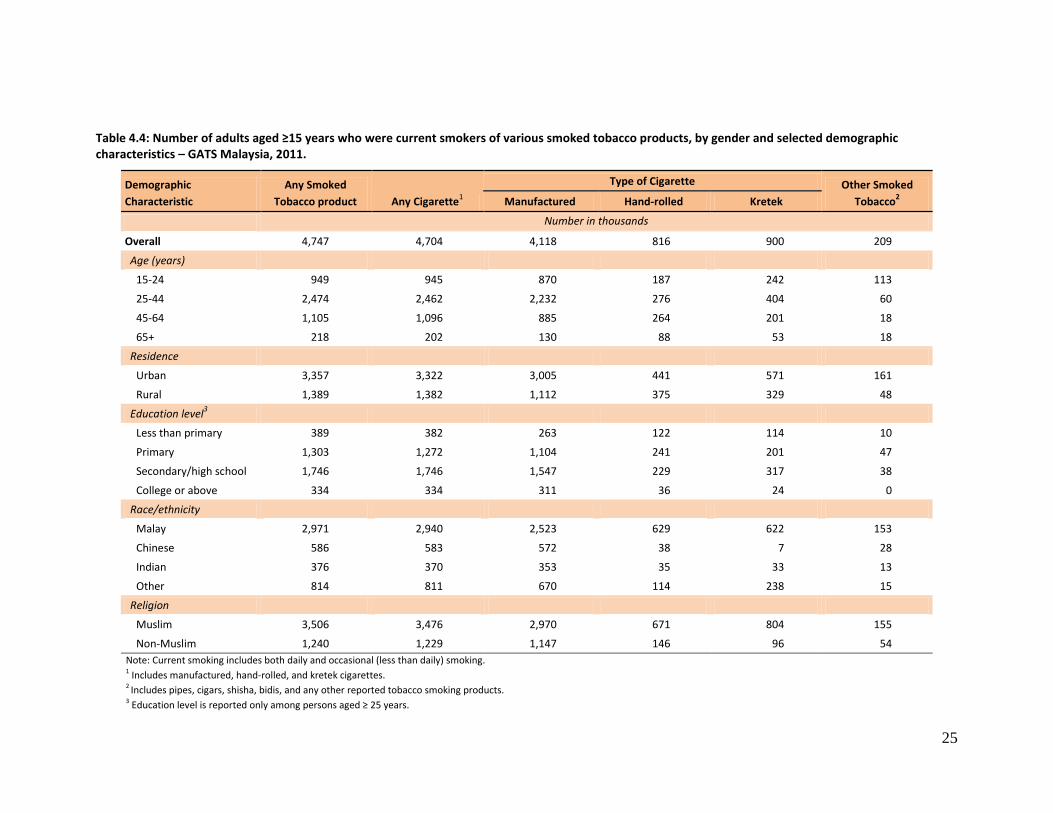
25
Table 4.4: Number of adults aged ≥15 years who were current smokers of various smoked tobacco products, by gender and selected demographic characteristics – GATS Malaysia, 2011.
Demographic
Characteristic
Any Smoked
Tobacco product Any Cigarette1
Type of Cigarette Other Smoked
Tobacco2 Manufactured Hand-rolled Kretek
Number in thousands
Overall 4,747 4,704 4,118 816 900 209
Age (years)
15-24 949 945 870 187 242 113
25-44 2,474 2,462 2,232 276 404 60
45-64 1,105 1,096 885 264 201 18
65+ 218 202 130 88 53 18
Residence
Urban 3,357 3,322 3,005 441 571 161
Rural 1,389 1,382 1,112 375 329 48
Education level3
Less than primary 389 382 263 122 114 10
Primary 1,303 1,272 1,104 241 201 47
Secondary/high school 1,746 1,746 1,547 229 317 38
College or above 334 334 311 36 24 0
Race/ethnicity
Malay 2,971 2,940 2,523 629 622 153
Chinese 586 583 572 38 7 28
Indian 376 370 353 35 33 13
Other 814 811 670 114 238 15
Religion
Muslim 3,506 3,476 2,970 671 804 155
Non-Muslim 1,240 1,229 1,147 146 96 54
Note: Current smoking includes both daily and occasional (less than daily) smoking. 1 Includes manufactured, hand-rolled, and kretek cigarettes. 2 Includes pipes, cigars, shisha, bidis, and any other reported tobacco smoking products. 3 Education level is reported only among persons aged ≥ 25 years.
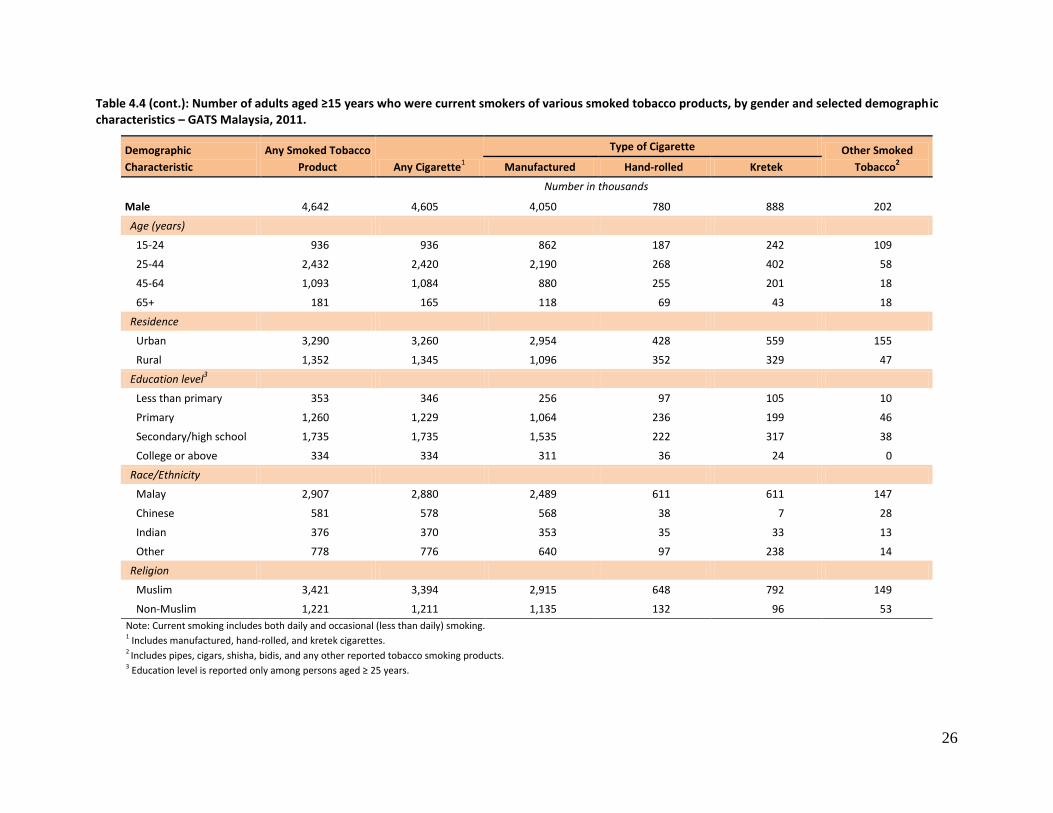
26
Table 4.4 (cont.): Number of adults aged ≥15 years who were current smokers of various smoked tobacco products, by gender and selected demograph ic characteristics – GATS Malaysia, 2011.
Demographic
Characteristic
Any Smoked Tobacco
Product Any Cigarette1
Type of Cigarette Other Smoked
Tobacco2 Manufactured Hand-rolled Kretek
Number in thousands
Male 4,642 4,605 4,050 780 888 202
Age (years)
15-24 936 936 862 187 242 109
25-44 2,432 2,420 2,190 268 402 58
45-64 1,093 1,084 880 255 201 18
65+ 181 165 118 69 43 18
Residence
Urban 3,290 3,260 2,954 428 559 155
Rural 1,352 1,345 1,096 352 329 47
Education level3
Less than primary 353 346 256 97 105 10
Primary 1,260 1,229 1,064 236 199 46
Secondary/high school 1,735 1,735 1,535 222 317 38
College or above 334 334 311 36 24 0
Race/Ethnicity
Malay 2,907 2,880 2,489 611 611 147
Chinese 581 578 568 38 7 28
Indian 376 370 353 35 33 13
Other 778 776 640 97 238 14
Religion
Muslim 3,421 3,394 2,915 648 792 149
Non-Muslim 1,221 1,211 1,135 132 96 53
Note: Current smoking includes both daily and occasional (less than daily) smoking. 1 Includes manufactured, hand-rolled, and kretek cigarettes. 2 Includes pipes, cigars, shisha, bidis, and any other reported tobacco smoking products. 3 Education level is reported only among persons aged ≥ 25 years.
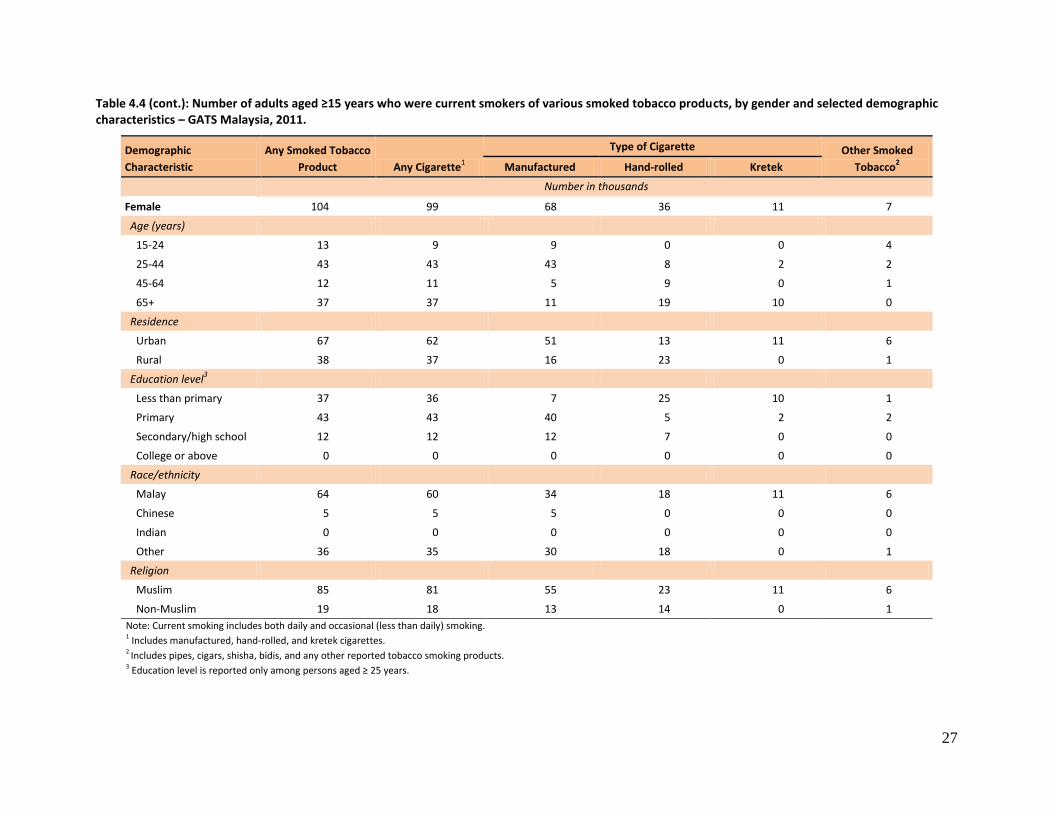
27
Table 4.4 (cont.): Number of adults aged ≥15 years who were current smokers of various smoked tobacco products, by gender and selected demographic characteristics – GATS Malaysia, 2011.
Demographic
Characteristic
Any Smoked Tobacco
Product Any Cigarette1
Type of Cigarette Other Smoked
Tobacco2 Manufactured Hand-rolled Kretek
Number in thousands
Female 104 99 68 36 11 7
Age (years)
15-24 13 9 9 0 0 4
25-44 43 43 43 8 2 2
45-64 12 11 5 9 0 1
65+ 37 37 11 19 10 0
Residence
Urban 67 62 51 13 11 6
Rural 38 37 16 23 0 1
Education level3
Less than primary 37 36 7 25 10 1
Primary 43 43 40 5 2 2
Secondary/high school 12 12 12 7 0 0
College or above 0 0 0 0 0 0
Race/ethnicity
Malay 64 60 34 18 11 6
Chinese 5 5 5 0 0 0
Indian 0 0 0 0 0 0
Other 36 35 30 18 0 1
Religion
Muslim 85 81 55 23 11 6
Non-Muslim 19 18 13 14 0 1
Note: Current smoking includes both daily and occasional (less than daily) smoking. 1 Includes manufactured, hand-rolled, and kretek cigarettes. 2 Includes pipes, cigars, shisha, bidis, and any other reported tobacco smoking products. 3 Education level is reported only among persons aged ≥ 25 years.
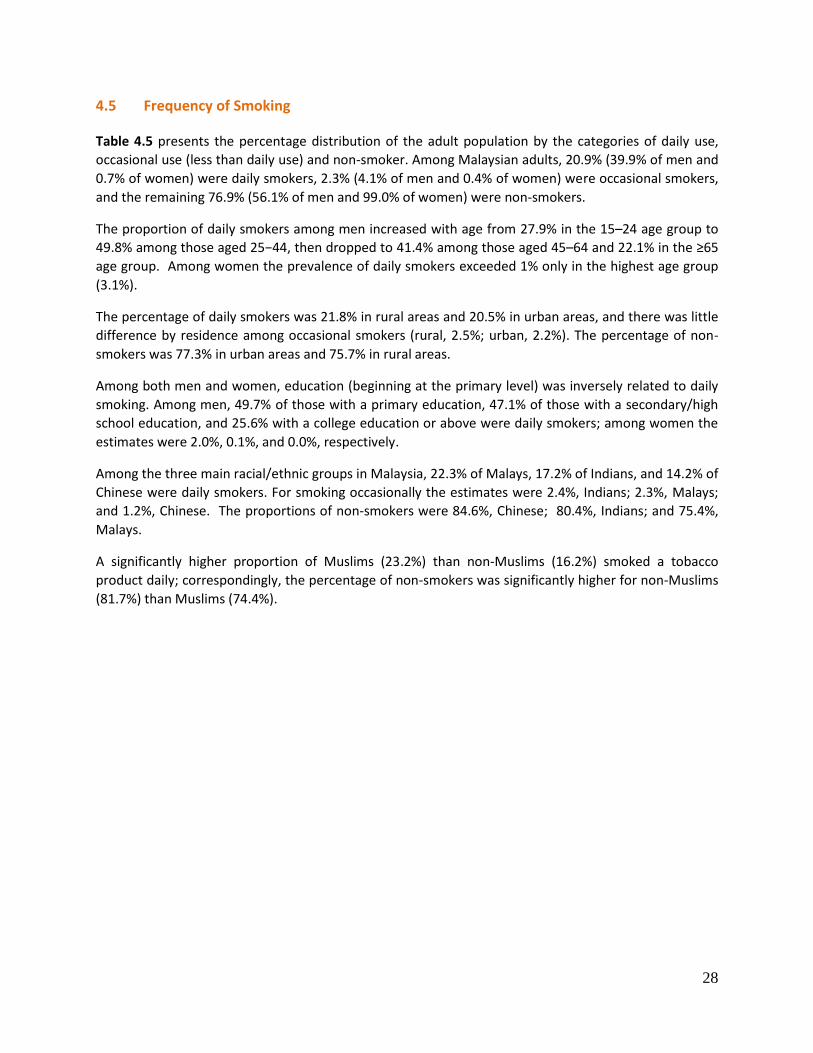
28
4.5 Frequency of Smoking
Table 4.5 presents the percentage distribution of the adult population by the categories of daily use,
occasional use (less than daily use) and non-smoker. Among Malaysian adults, 20.9% (39.9% of men and
0.7% of women) were daily smokers, 2.3% (4.1% of men and 0.4% of women) were occasional smokers,
and the remaining 76.9% (56.1% of men and 99.0% of women) were non-smokers.
The proportion of daily smokers among men increased with age from 27.9% in the 15–24 age group to
49.8% among those aged 25−44, then dropped to 41.4% among those aged 45–64 and 22.1% in the ≥65
age group. Among women the prevalence of daily smokers exceeded 1% only in the highest age group
(3.1%).
The percentage of daily smokers was 21.8% in rural areas and 20.5% in urban areas, and there was little
difference by residence among occasional smokers (rural, 2.5%; urban, 2.2%). The percentage of non-
smokers was 77.3% in urban areas and 75.7% in rural areas.
Among both men and women, education (beginning at the primary level) was inversely related to daily
smoking. Among men, 49.7% of those with a primary education, 47.1% of those with a secondary/high
school education, and 25.6% with a college education or above were daily smokers; among women the
estimates were 2.0%, 0.1%, and 0.0%, respectively.
Among the three main racial/ethnic groups in Malaysia, 22.3% of Malays, 17.2% of Indians, and 14.2% of
Chinese were daily smokers. For smoking occasionally the estimates were 2.4%, Indians; 2.3%, Malays;
and 1.2%, Chinese. The proportions of non-smokers were 84.6%, Chinese; 80.4%, Indians; and 75.4%,
Malays.
A significantly higher proportion of Muslims (23.2%) than non-Muslims (16.2%) smoked a tobacco
product daily; correspondingly, the percentage of non-smokers was significantly higher for non-Muslims
(81.7%) than Muslims (74.4%).
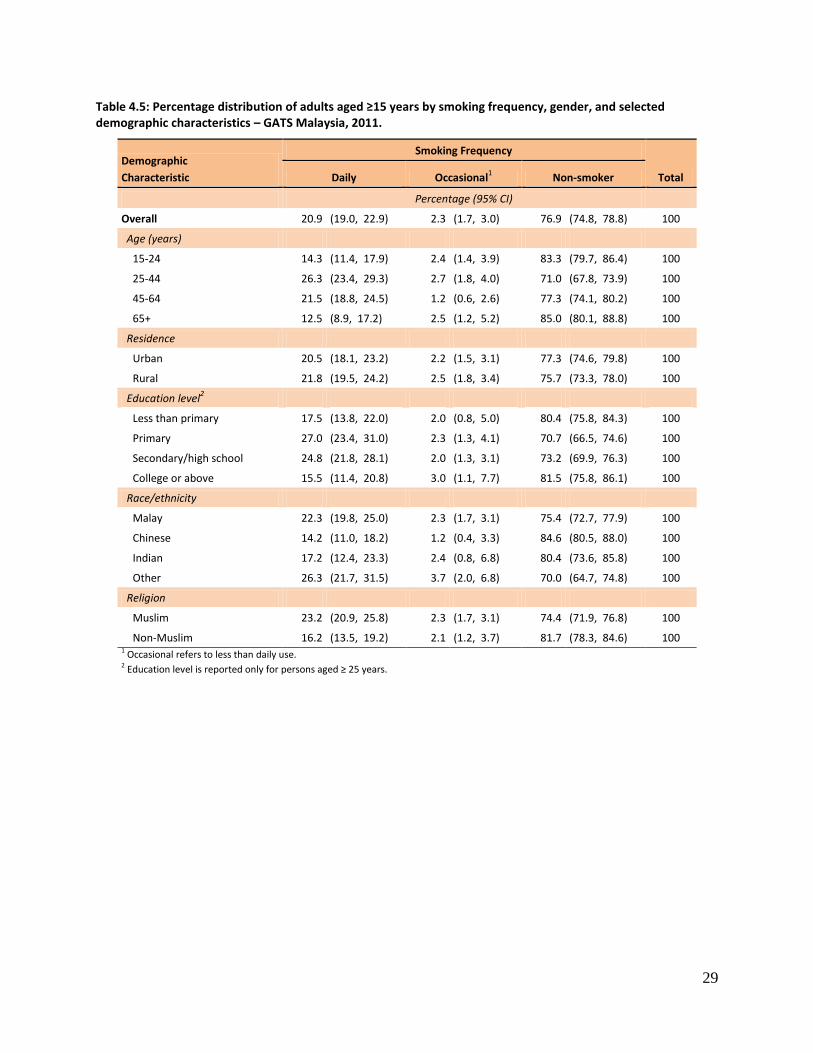
29
Table 4.5: Percentage distribution of adults aged ≥15 years by smoking frequency, gender, and selected demographic characteristics – GATS Malaysia, 2011.
Demographic
Characteristic
Smoking Frequency
Total Daily Occasional1 Non-smoker
Percentage (95% CI)
Overall 20.9 (19.0, 22.9) 2.3 (1.7, 3.0) 76.9 (74.8, 78.8) 100
Age (years)
15-24 14.3 (11.4, 17.9) 2.4 (1.4, 3.9) 83.3 (79.7, 86.4) 100
25-44 26.3 (23.4, 29.3) 2.7 (1.8, 4.0) 71.0 (67.8, 73.9) 100
45-64 21.5 (18.8, 24.5) 1.2 (0.6, 2.6) 77.3 (74.1, 80.2) 100
65+ 12.5 (8.9, 17.2) 2.5 (1.2, 5.2) 85.0 (80.1, 88.8) 100
Residence
Urban 20.5 (18.1, 23.2) 2.2 (1.5, 3.1) 77.3 (74.6, 79.8) 100
Rural 21.8 (19.5, 24.2) 2.5 (1.8, 3.4) 75.7 (73.3, 78.0) 100
Education level2
Less than primary 17.5 (13.8, 22.0) 2.0 (0.8, 5.0) 80.4 (75.8, 84.3) 100
Primary 27.0 (23.4, 31.0) 2.3 (1.3, 4.1) 70.7 (66.5, 74.6) 100
Secondary/high school 24.8 (21.8, 28.1) 2.0 (1.3, 3.1) 73.2 (69.9, 76.3) 100
College or above 15.5 (11.4, 20.8) 3.0 (1.1, 7.7) 81.5 (75.8, 86.1) 100
Race/ethnicity
Malay 22.3 (19.8, 25.0) 2.3 (1.7, 3.1) 75.4 (72.7, 77.9) 100
Chinese 14.2 (11.0, 18.2) 1.2 (0.4, 3.3) 84.6 (80.5, 88.0) 100
Indian 17.2 (12.4, 23.3) 2.4 (0.8, 6.8) 80.4 (73.6, 85.8) 100
Other 26.3 (21.7, 31.5) 3.7 (2.0, 6.8) 70.0 (64.7, 74.8) 100
Religion
Muslim 23.2 (20.9, 25.8) 2.3 (1.7, 3.1) 74.4 (71.9, 76.8) 100
Non-Muslim 16.2 (13.5, 19.2) 2.1 (1.2, 3.7) 81.7 (78.3, 84.6) 100 1 Occasional refers to less than daily use. 2 Education level is reported only for persons aged ≥ 25 years.
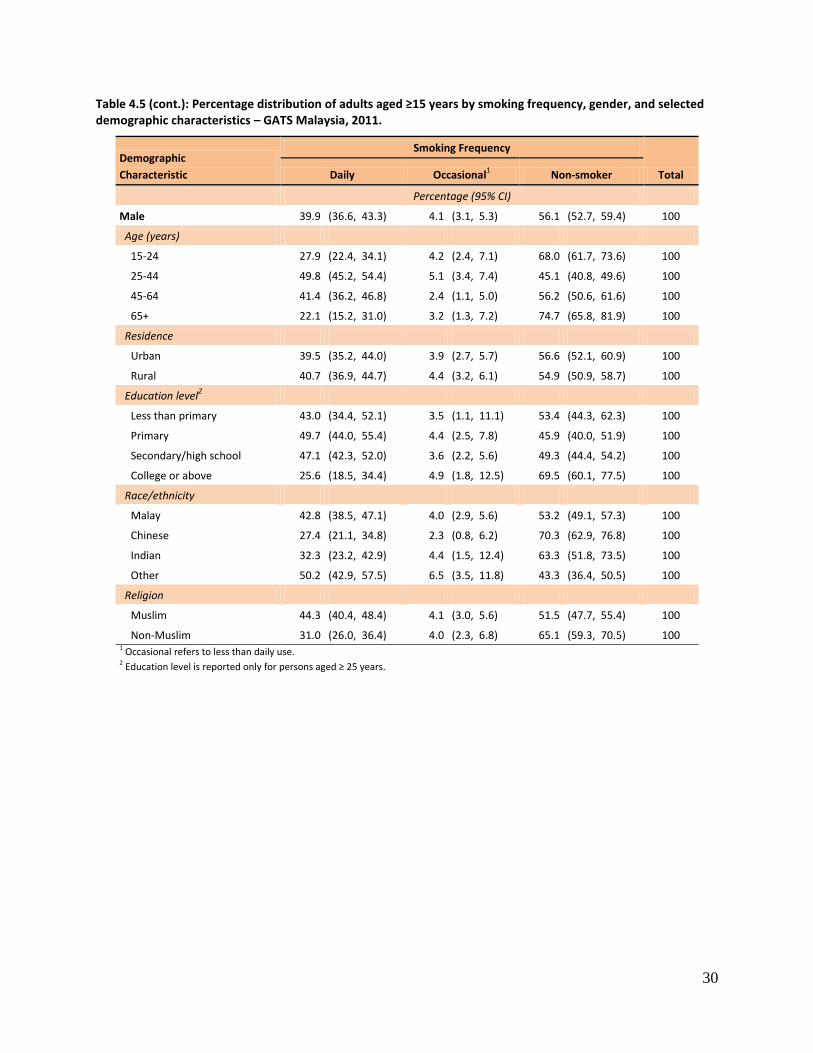
30
Table 4.5 (cont.): Percentage distribution of adults aged ≥15 years by smoking frequency, gender, and selected demographic characteristics – GATS Malaysia, 2011.
Demographic
Characteristic
Smoking Frequency
Total Daily Occasional1 Non-smoker
Percentage (95% CI)
Male 39.9 (36.6, 43.3) 4.1 (3.1, 5.3) 56.1 (52.7, 59.4) 100
Age (years)
15-24 27.9 (22.4, 34.1) 4.2 (2.4, 7.1) 68.0 (61.7, 73.6) 100
25-44 49.8 (45.2, 54.4) 5.1 (3.4, 7.4) 45.1 (40.8, 49.6) 100
45-64 41.4 (36.2, 46.8) 2.4 (1.1, 5.0) 56.2 (50.6, 61.6) 100
65+ 22.1 (15.2, 31.0) 3.2 (1.3, 7.2) 74.7 (65.8, 81.9) 100
Residence
Urban 39.5 (35.2, 44.0) 3.9 (2.7, 5.7) 56.6 (52.1, 60.9) 100
Rural 40.7 (36.9, 44.7) 4.4 (3.2, 6.1) 54.9 (50.9, 58.7) 100
Education level2
Less than primary 43.0 (34.4, 52.1) 3.5 (1.1, 11.1) 53.4 (44.3, 62.3) 100
Primary 49.7 (44.0, 55.4) 4.4 (2.5, 7.8) 45.9 (40.0, 51.9) 100
Secondary/high school 47.1 (42.3, 52.0) 3.6 (2.2, 5.6) 49.3 (44.4, 54.2) 100
College or above 25.6 (18.5, 34.4) 4.9 (1.8, 12.5) 69.5 (60.1, 77.5) 100
Race/ethnicity
Malay 42.8 (38.5, 47.1) 4.0 (2.9, 5.6) 53.2 (49.1, 57.3) 100
Chinese 27.4 (21.1, 34.8) 2.3 (0.8, 6.2) 70.3 (62.9, 76.8) 100
Indian 32.3 (23.2, 42.9) 4.4 (1.5, 12.4) 63.3 (51.8, 73.5) 100
Other 50.2 (42.9, 57.5) 6.5 (3.5, 11.8) 43.3 (36.4, 50.5) 100
Religion
Muslim 44.3 (40.4, 48.4) 4.1 (3.0, 5.6) 51.5 (47.7, 55.4) 100
Non-Muslim 31.0 (26.0, 36.4) 4.0 (2.3, 6.8) 65.1 (59.3, 70.5) 100 1 Occasional refers to less than daily use. 2 Education level is reported only for persons aged ≥ 25 years.
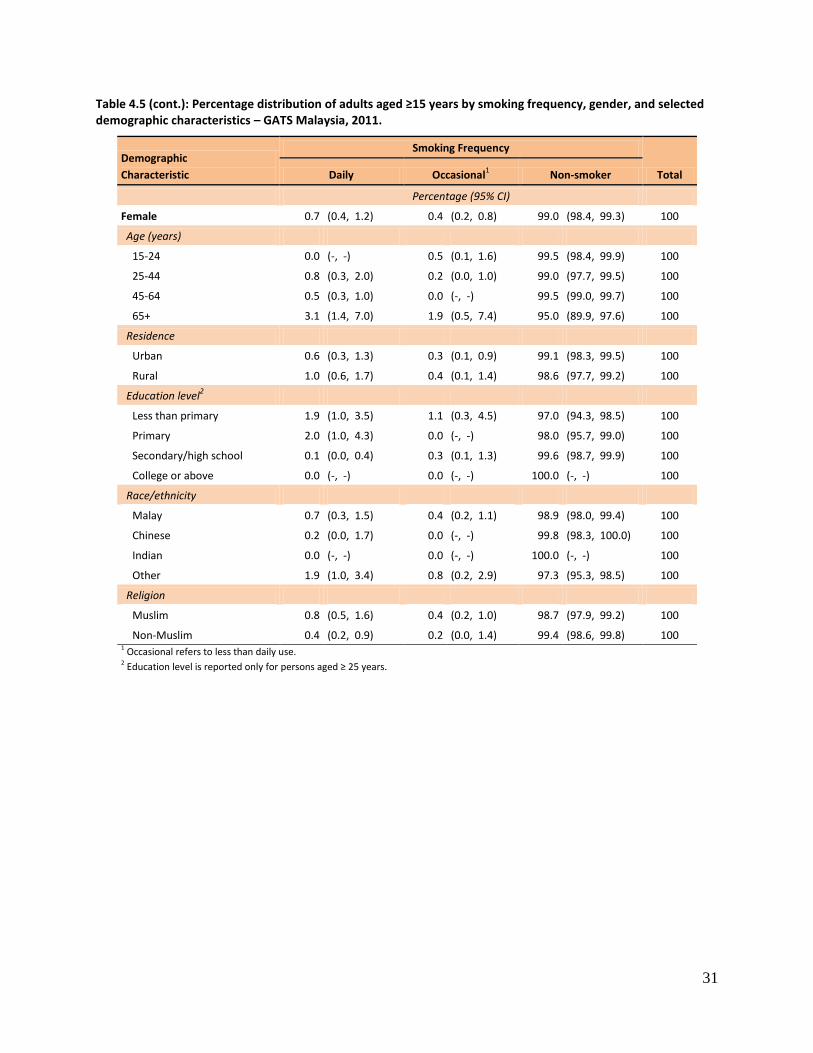
31
Table 4.5 (cont.): Percentage distribution of adults aged ≥15 years by smoking frequency, gender, and selected demographic characteristics – GATS Malaysia, 2011.
Demographic
Characteristic
Smoking Frequency
Total Daily Occasional1 Non-smoker
Percentage (95% CI)
Female 0.7 (0.4, 1.2) 0.4 (0.2, 0.8) 99.0 (98.4, 99.3) 100
Age (years)
15-24 0.0 (-, -) 0.5 (0.1, 1.6) 99.5 (98.4, 99.9) 100
25-44 0.8 (0.3, 2.0) 0.2 (0.0, 1.0) 99.0 (97.7, 99.5) 100
45-64 0.5 (0.3, 1.0) 0.0 (-, -) 99.5 (99.0, 99.7) 100
65+ 3.1 (1.4, 7.0) 1.9 (0.5, 7.4) 95.0 (89.9, 97.6) 100
Residence
Urban 0.6 (0.3, 1.3) 0.3 (0.1, 0.9) 99.1 (98.3, 99.5) 100
Rural 1.0 (0.6, 1.7) 0.4 (0.1, 1.4) 98.6 (97.7, 99.2) 100
Education level2
Less than primary 1.9 (1.0, 3.5) 1.1 (0.3, 4.5) 97.0 (94.3, 98.5) 100
Primary 2.0 (1.0, 4.3) 0.0 (-, -) 98.0 (95.7, 99.0) 100
Secondary/high school 0.1 (0.0, 0.4) 0.3 (0.1, 1.3) 99.6 (98.7, 99.9) 100
College or above 0.0 (-, -) 0.0 (-, -) 100.0 (-, -) 100
Race/ethnicity
Malay 0.7 (0.3, 1.5) 0.4 (0.2, 1.1) 98.9 (98.0, 99.4) 100
Chinese 0.2 (0.0, 1.7) 0.0 (-, -) 99.8 (98.3, 100.0) 100
Indian 0.0 (-, -) 0.0 (-, -) 100.0 (-, -) 100
Other 1.9 (1.0, 3.4) 0.8 (0.2, 2.9) 97.3 (95.3, 98.5) 100
Religion
Muslim 0.8 (0.5, 1.6) 0.4 (0.2, 1.0) 98.7 (97.9, 99.2) 100
Non-Muslim 0.4 (0.2, 0.9) 0.2 (0.0, 1.4) 99.4 (98.6, 99.8) 100 1 Occasional refers to less than daily use. 2 Education level is reported only for persons aged ≥ 25 years.
32
4.6 Number of Manufactured Cigarettes Smoked per Day
The daily frequency of cigarette smoking (includes manufactured and hand-rolled cigarettes plus
kreteks) is an important variable because the number of cigarettes smoked per day is an indicator of the
degree of dependence on nicotine. Per Table 4.6, a typical daily cigarette smoker in Malaysia smoked 14
cigarettes per day. In all, 11.1% of daily cigarette smokers smoked fewer than 5 cigarettes a day, 16.2%
smoked 5-9, 27.9% smoked 10-14, 36.7% smoked 15-24, and 8.1% smoked 25 or more cigarettes per
day.
By residence, the average number of smoked cigarettes per day was 14.1 in urban areas and 13.5 in
rural areas.
The average number of cigarettes smoked per day generally rose by age group, from 11.7 among
smokers aged 15-24 years to 15.5 among those 45-64 years and then 15.4 in the oldest age group. By
education, the average dropped from 16.0 cigarettes for those with less than a primary education to
14.0 for those with secondary/high school education, then increased to 15.5 among those who had a
college education or above.
By race / ethnicity, averages were tightly clustered for daily smokers: 14.4 for Chinese, 14.1 for Malays,
and 13.1 for Indians. Finally, Muslims smoked 14.0 cigarettes per day and non-Muslims smoked 13.5
cigarettes per day.
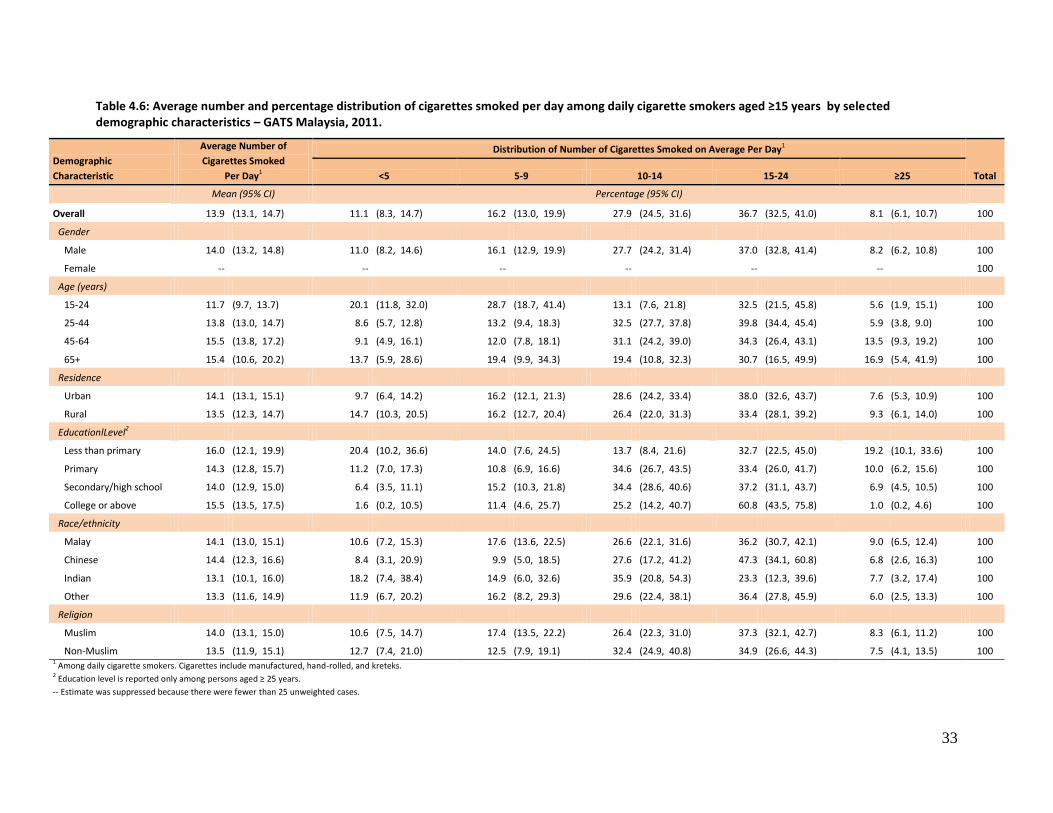
33
Table 4.6: Average number and percentage distribution of cigarettes smoked per day among daily cigarette smokers aged ≥15 years by selected demographic characteristics – GATS Malaysia, 2011.
Demographic
Characteristic
Average Number of
Cigarettes Smoked
Per Day1
Distribution of Number of Cigarettes Smoked on Average Per Day1
Total <5 5-9 10-14 15-24 ≥25
Mean (95% CI) Percentage (95% CI)
Overall 13.9 (13.1, 14.7) 11.1 (8.3, 14.7) 16.2 (13.0, 19.9) 27.9 (24.5, 31.6) 36.7 (32.5, 41.0) 8.1 (6.1, 10.7) 100
Gender
Male 14.0 (13.2, 14.8) 11.0 (8.2, 14.6) 16.1 (12.9, 19.9) 27.7 (24.2, 31.4) 37.0 (32.8, 41.4) 8.2 (6.2, 10.8) 100
Female -- -- -- -- -- -- 100
Age (years)
15-24 11.7 (9.7, 13.7) 20.1 (11.8, 32.0) 28.7 (18.7, 41.4) 13.1 (7.6, 21.8) 32.5 (21.5, 45.8) 5.6 (1.9, 15.1) 100
25-44 13.8 (13.0, 14.7) 8.6 (5.7, 12.8) 13.2 (9.4, 18.3) 32.5 (27.7, 37.8) 39.8 (34.4, 45.4) 5.9 (3.8, 9.0) 100
45-64 15.5 (13.8, 17.2) 9.1 (4.9, 16.1) 12.0 (7.8, 18.1) 31.1 (24.2, 39.0) 34.3 (26.4, 43.1) 13.5 (9.3, 19.2) 100
65+ 15.4 (10.6, 20.2) 13.7 (5.9, 28.6) 19.4 (9.9, 34.3) 19.4 (10.8, 32.3) 30.7 (16.5, 49.9) 16.9 (5.4, 41.9) 100
Residence
Urban 14.1 (13.1, 15.1) 9.7 (6.4, 14.2) 16.2 (12.1, 21.3) 28.6 (24.2, 33.4) 38.0 (32.6, 43.7) 7.6 (5.3, 10.9) 100
Rural 13.5 (12.3, 14.7) 14.7 (10.3, 20.5) 16.2 (12.7, 20.4) 26.4 (22.0, 31.3) 33.4 (28.1, 39.2) 9.3 (6.1, 14.0) 100
EducationlLevel2
Less than primary 16.0 (12.1, 19.9) 20.4 (10.2, 36.6) 14.0 (7.6, 24.5) 13.7 (8.4, 21.6) 32.7 (22.5, 45.0) 19.2 (10.1, 33.6) 100
Primary 14.3 (12.8, 15.7) 11.2 (7.0, 17.3) 10.8 (6.9, 16.6) 34.6 (26.7, 43.5) 33.4 (26.0, 41.7) 10.0 (6.2, 15.6) 100
Secondary/high school 14.0 (12.9, 15.0) 6.4 (3.5, 11.1) 15.2 (10.3, 21.8) 34.4 (28.6, 40.6) 37.2 (31.1, 43.7) 6.9 (4.5, 10.5) 100
College or above 15.5 (13.5, 17.5) 1.6 (0.2, 10.5) 11.4 (4.6, 25.7) 25.2 (14.2, 40.7) 60.8 (43.5, 75.8) 1.0 (0.2, 4.6) 100
Race/ethnicity
Malay 14.1 (13.0, 15.1) 10.6 (7.2, 15.3) 17.6 (13.6, 22.5) 26.6 (22.1, 31.6) 36.2 (30.7, 42.1) 9.0 (6.5, 12.4) 100
Chinese 14.4 (12.3, 16.6) 8.4 (3.1, 20.9) 9.9 (5.0, 18.5) 27.6 (17.2, 41.2) 47.3 (34.1, 60.8) 6.8 (2.6, 16.3) 100
Indian 13.1 (10.1, 16.0) 18.2 (7.4, 38.4) 14.9 (6.0, 32.6) 35.9 (20.8, 54.3) 23.3 (12.3, 39.6) 7.7 (3.2, 17.4) 100
Other 13.3 (11.6, 14.9) 11.9 (6.7, 20.2) 16.2 (8.2, 29.3) 29.6 (22.4, 38.1) 36.4 (27.8, 45.9) 6.0 (2.5, 13.3) 100
Religion
Muslim 14.0 (13.1, 15.0) 10.6 (7.5, 14.7) 17.4 (13.5, 22.2) 26.4 (22.3, 31.0) 37.3 (32.1, 42.7) 8.3 (6.1, 11.2) 100
Non-Muslim 13.5 (11.9, 15.1) 12.7 (7.4, 21.0) 12.5 (7.9, 19.1) 32.4 (24.9, 40.8) 34.9 (26.6, 44.3) 7.5 (4.1, 13.5) 100 1 Among daily cigarette smokers. Cigarettes include manufactured, hand-rolled, and kreteks. 2 Education level is reported only among persons aged ≥ 25 years.
-- Estimate was suppressed because there were fewer than 25 unweighted cases.
34
4.7 Average Age at Initiation of Daily Smoking and Distribution of Initial Age
Table 4.7 presents for ever daily smokers aged 20−34 years their average age at initiation of daily
smoking and the distribution of initial age, both by selected demographic characteristics. Overall, the
mean age at initiation was 17.2 years. Of the group of interest, 12.7% started smoking daily before the
age of 15, 39.1% at age 15–17, 28.6% at age 18−19, and 19.6% at 20 or older. In short, over half of all
ever daily smokers started smoking tobacco on a daily basis before the age of 18, i.e., as minors.
For men, the mean age at initiation was 17.2 years. For men and women combined, those from urban
areas started on average 1.0 years before those from rural areas. More than one-third (36.9%) of
smokers in rural areas started daily smoking before the age of 18, versus 56.2% of urban smokers.
Average age at initiation was 18.3 years for Chinese, 17.2 years for Malays, and 16.1 years for those of
another race / ethnicity. Finally, the average age at initiation was significantly higher among non-
Muslims (18.3 years) than Muslims (16.9 years).
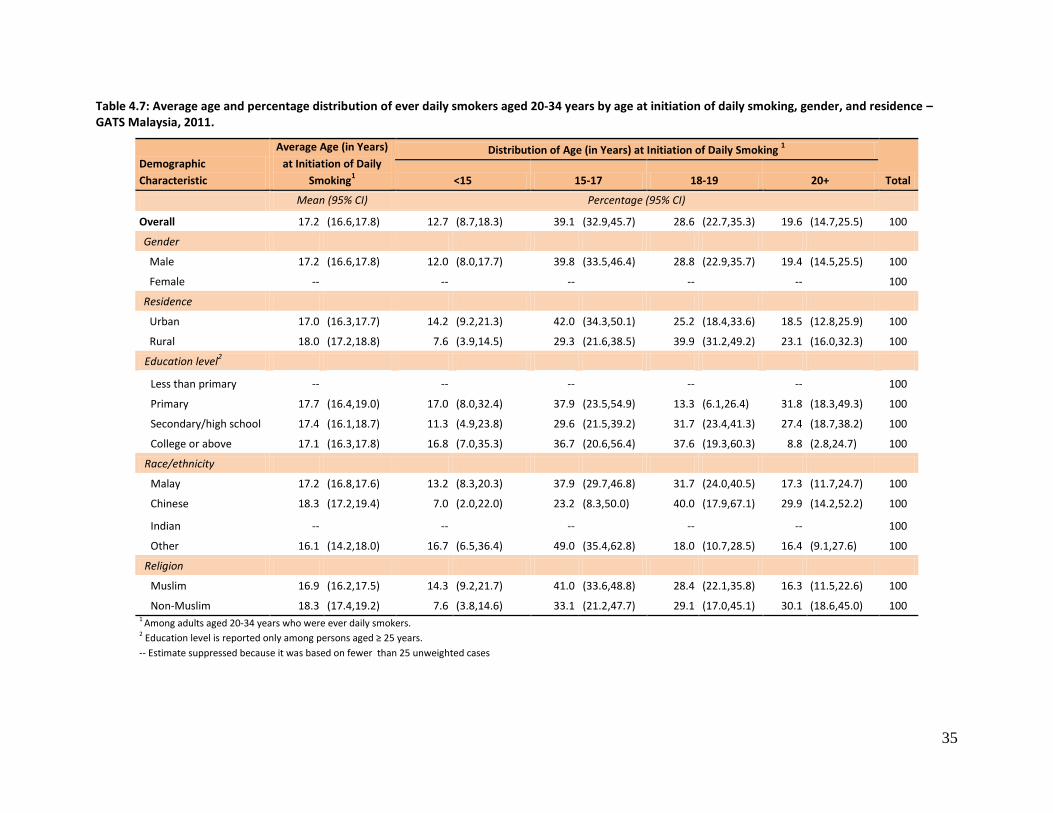
35
Table 4.7: Average age and percentage distribution of ever daily smokers aged 20-34 years by age at initiation of daily smoking, gender, and residence – GATS Malaysia, 2011.
Demographic
Characteristic
Average Age (in Years)
at Initiation of Daily
Smoking1
Distribution of Age (in Years) at Initiation of Daily Smoking 1
Total <15 15-17 18-19 20+
Mean (95% CI) Percentage (95% CI)
Overall 17.2 (16.6,17.8) 12.7 (8.7,18.3) 39.1 (32.9,45.7) 28.6 (22.7,35.3) 19.6 (14.7,25.5) 100
Gender
Male 17.2 (16.6,17.8) 12.0 (8.0,17.7) 39.8 (33.5,46.4) 28.8 (22.9,35.7) 19.4 (14.5,25.5) 100
Female -- -- -- -- -- 100
Residence
Urban 17.0 (16.3,17.7) 14.2 (9.2,21.3) 42.0 (34.3,50.1) 25.2 (18.4,33.6) 18.5 (12.8,25.9) 100
Rural 18.0 (17.2,18.8) 7.6 (3.9,14.5) 29.3 (21.6,38.5) 39.9 (31.2,49.2) 23.1 (16.0,32.3) 100
Education level2
Less than primary -- -- -- -- -- 100
Primary 17.7 (16.4,19.0) 17.0 (8.0,32.4) 37.9 (23.5,54.9) 13.3 (6.1,26.4) 31.8 (18.3,49.3) 100
Secondary/high school 17.4 (16.1,18.7) 11.3 (4.9,23.8) 29.6 (21.5,39.2) 31.7 (23.4,41.3) 27.4 (18.7,38.2) 100
College or above 17.1 (16.3,17.8) 16.8 (7.0,35.3) 36.7 (20.6,56.4) 37.6 (19.3,60.3) 8.8 (2.8,24.7) 100
Race/ethnicity
Malay 17.2 (16.8,17.6) 13.2 (8.3,20.3) 37.9 (29.7,46.8) 31.7 (24.0,40.5) 17.3 (11.7,24.7) 100
Chinese 18.3 (17.2,19.4) 7.0 (2.0,22.0) 23.2 (8.3,50.0) 40.0 (17.9,67.1) 29.9 (14.2,52.2) 100
Indian -- -- -- -- -- 100
Other 16.1 (14.2,18.0) 16.7 (6.5,36.4) 49.0 (35.4,62.8) 18.0 (10.7,28.5) 16.4 (9.1,27.6) 100
Religion
Muslim 16.9 (16.2,17.5) 14.3 (9.2,21.7) 41.0 (33.6,48.8) 28.4 (22.1,35.8) 16.3 (11.5,22.6) 100
Non-Muslim 18.3 (17.4,19.2) 7.6 (3.8,14.6) 33.1 (21.2,47.7) 29.1 (17.0,45.1) 30.1 (18.6,45.0) 100 1 Among adults aged 20-34 years who were ever daily smokers. 2 Education level is reported only among persons aged ≥ 25 years.
-- Estimate suppressed because it was based on fewer than 25 unweighted cases
36
4.8 Prevalence of Former Daily Smoking and the Quit Ratio
Table 4.8 presents the prevalence of former daily smokers among all adults aged 15 years or above and
the quit ratios1, or the magnitude of success achieved by former daily smokers in quitting tobacco
smoking, by selected demographic characteristics.
In Malaysia, 2.3% of adults formerly smoked tobacco daily but per the 2011 GATS had stopped smoking
completely. Because the majority of the Malaysian population does not smoke, the quit ratio – the
percentage of former daily smokers among ever daily smokers ─ is more relevant than the percentage of
former daily smokers for understanding the extent of success achieved by daily smokers in quitting.
Among Malaysian adults, the quit ratio was 9.5%, i.e., 1 in 10 / 11 ever daily smokers had completely
stopped smoking.
Not surprisingly, the prevalence of former daily smokers increased by age groups, from 0.5% in the
15−24 age group to 7.4% in those aged ≥65 years. The youngest and oldest groups also had the lowest
and highest quit rates: 3.4% and 34.0%, respectively.
By residence, the prevalence of former daily smokers was 2.7% in rural areas and 2.2% in urban areas
and the quit ratio was 10.5% in rural areas and 9.0% in urban areas.
The prevalence of former daily smokers decreased as education level increased, from 4.4% in those with
less than a primary education to 2.3% among those with a college education or more, a pattern that
corresponded with that for the quit ratio through the secondary / high school level.
The prevalence of former daily smokers was 2.8% for Malays and 2.7% for Indians. The quit ratio was
13.6% for Indians.
The prevalence of former daily smokers was 2.6% for Muslims and 1.7% for non-Muslims. The quit ratio
was 9.5% for Muslims and 9.2% for non-Muslims.
1 Quit ratio is the percentage of ever daily tobacco smokers who currently do not smoke tobacco. The indicator
indicates the success of efforts to encourage cessation among established tobacco smokers.
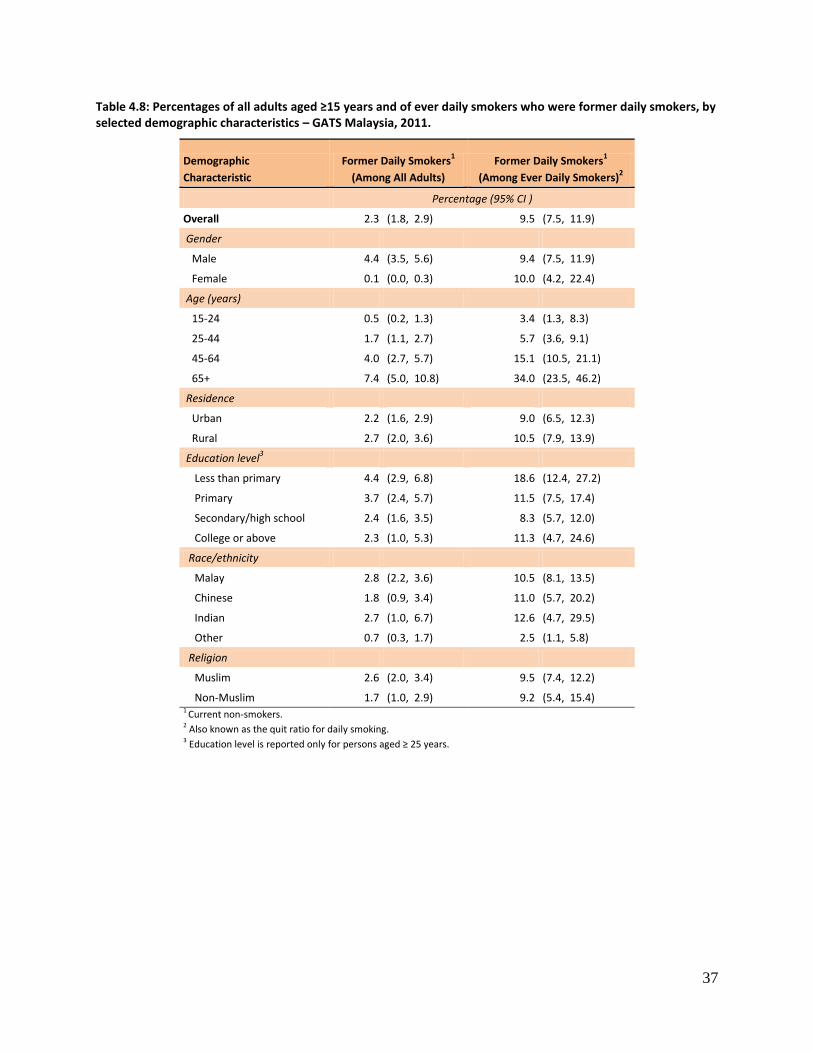
37
Table 4.8: Percentages of all adults aged ≥15 years and of ever daily smokers who were former daily smokers, by selected demographic characteristics – GATS Malaysia, 2011.
Demographic
Characteristic
Former Daily Smokers1
(Among All Adults)
Former Daily Smokers1
(Among Ever Daily Smokers)2
Percentage (95% CI )
Overall 2.3 (1.8, 2.9) 9.5 (7.5, 11.9)
Gender
Male 4.4 (3.5, 5.6) 9.4 (7.5, 11.9)
Female 0.1 (0.0, 0.3) 10.0 (4.2, 22.4)
Age (years)
15-24 0.5 (0.2, 1.3) 3.4 (1.3, 8.3)
25-44 1.7 (1.1, 2.7) 5.7 (3.6, 9.1)
45-64 4.0 (2.7, 5.7) 15.1 (10.5, 21.1)
65+ 7.4 (5.0, 10.8) 34.0 (23.5, 46.2)
Residence
Urban 2.2 (1.6, 2.9) 9.0 (6.5, 12.3)
Rural 2.7 (2.0, 3.6) 10.5 (7.9, 13.9)
Education level3
Less than primary 4.4 (2.9, 6.8) 18.6 (12.4, 27.2)
Primary 3.7 (2.4, 5.7) 11.5 (7.5, 17.4)
Secondary/high school 2.4 (1.6, 3.5) 8.3 (5.7, 12.0)
College or above 2.3 (1.0, 5.3) 11.3 (4.7, 24.6)
Race/ethnicity
Malay 2.8 (2.2, 3.6) 10.5 (8.1, 13.5)
Chinese 1.8 (0.9, 3.4) 11.0 (5.7, 20.2)
Indian 2.7 (1.0, 6.7) 12.6 (4.7, 29.5)
Other 0.7 (0.3, 1.7) 2.5 (1.1, 5.8)
Religion
Muslim 2.6 (2.0, 3.4) 9.5 (7.4, 12.2)
Non-Muslim 1.7 (1.0, 2.9) 9.2 (5.4, 15.4) 1 Current non-smokers. 2 Also known as the quit ratio for daily smoking. 3 Education level is reported only for persons aged ≥ 25 years.
38
4.9 Time Since Quitting Smoking
One important dimension of the quitting phenomenon is how long smokers can refrain from smoking, as
there is always a chance they will return to this practice after some period of time. Table 4.9 presents
the percentage distribution of former daily smokers (current non-smokers) by duration (in years) since
quitting. Almost half (47.1%) of the former daily smokers had stopped smoking for 10 years or longer,
just under one-fourth (23.5%) had quit for 1 to <5 years, 15.4% had stopped for less than 1 year, and
14.0% had stayed away from smoking for 5 to <10 years.
In both the 45-64 (60.1%) and ≥65 (78.4%) age groups, most former daily smokers (now non-smokers)
had quit for at least 10 years, but not surprisingly, in the 25-44 age group only 15.2% had done so. The
proportion of former daily smokers who had quit smoking for 10 years or longer was 55.7% among
residents of rural areas and 42.8% among those living in urban areas. By education, the proportion of
former daily smokers who had quit for 10 years or longer was 58.2% among those with less than a
primary education.
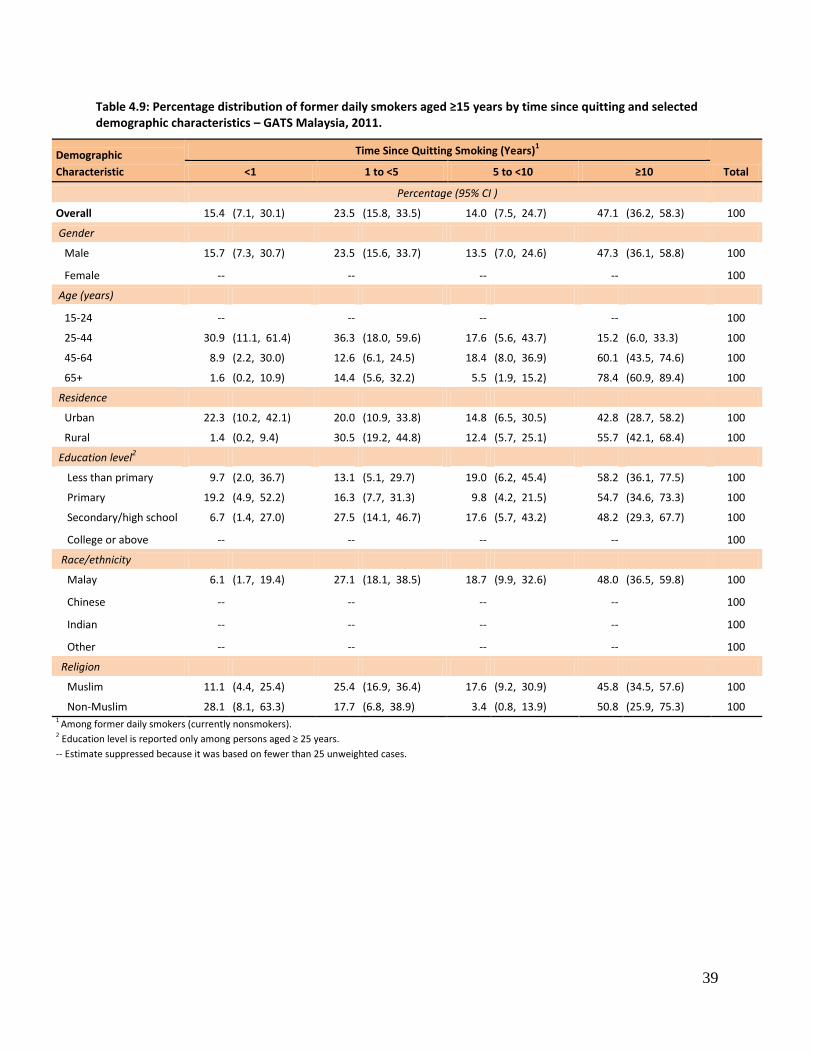
39
Table 4.9: Percentage distribution of former daily smokers aged ≥15 years by time since quitting and selected demographic characteristics – GATS Malaysia, 2011.
Demographic
Characteristic
Time Since Quitting Smoking (Years)1
Total <1 1 to <5 5 to <10 ≥10
Percentage (95% CI )
Overall 15.4 (7.1, 30.1) 23.5 (15.8, 33.5) 14.0 (7.5, 24.7) 47.1 (36.2, 58.3) 100
Gender
Male 15.7 (7.3, 30.7) 23.5 (15.6, 33.7) 13.5 (7.0, 24.6) 47.3 (36.1, 58.8) 100
Female -- -- -- -- 100
Age (years)
15-24 -- -- -- -- 100
25-44 30.9 (11.1, 61.4) 36.3 (18.0, 59.6) 17.6 (5.6, 43.7) 15.2 (6.0, 33.3) 100
45-64 8.9 (2.2, 30.0) 12.6 (6.1, 24.5) 18.4 (8.0, 36.9) 60.1 (43.5, 74.6) 100
65+ 1.6 (0.2, 10.9) 14.4 (5.6, 32.2) 5.5 (1.9, 15.2) 78.4 (60.9, 89.4) 100
Residence
Urban 22.3 (10.2, 42.1) 20.0 (10.9, 33.8) 14.8 (6.5, 30.5) 42.8 (28.7, 58.2) 100
Rural 1.4 (0.2, 9.4) 30.5 (19.2, 44.8) 12.4 (5.7, 25.1) 55.7 (42.1, 68.4) 100
Education level2
Less than primary 9.7 (2.0, 36.7) 13.1 (5.1, 29.7) 19.0 (6.2, 45.4) 58.2 (36.1, 77.5) 100
Primary 19.2 (4.9, 52.2) 16.3 (7.7, 31.3) 9.8 (4.2, 21.5) 54.7 (34.6, 73.3) 100
Secondary/high school 6.7 (1.4, 27.0) 27.5 (14.1, 46.7) 17.6 (5.7, 43.2) 48.2 (29.3, 67.7) 100
College or above -- -- -- -- 100
Race/ethnicity
Malay 6.1 (1.7, 19.4) 27.1 (18.1, 38.5) 18.7 (9.9, 32.6) 48.0 (36.5, 59.8) 100
Chinese -- -- -- -- 100
Indian -- -- -- -- 100
Other -- -- -- -- 100
Religion
Muslim 11.1 (4.4, 25.4) 25.4 (16.9, 36.4) 17.6 (9.2, 30.9) 45.8 (34.5, 57.6) 100
Non-Muslim 28.1 (8.1, 63.3) 17.7 (6.8, 38.9) 3.4 (0.8, 13.9) 50.8 (25.9, 75.3) 100 1 Among former daily smokers (currently nonsmokers). 2 Education level is reported only among persons aged ≥ 25 years.
-- Estimate suppressed because it was based on fewer than 25 unweighted cases.
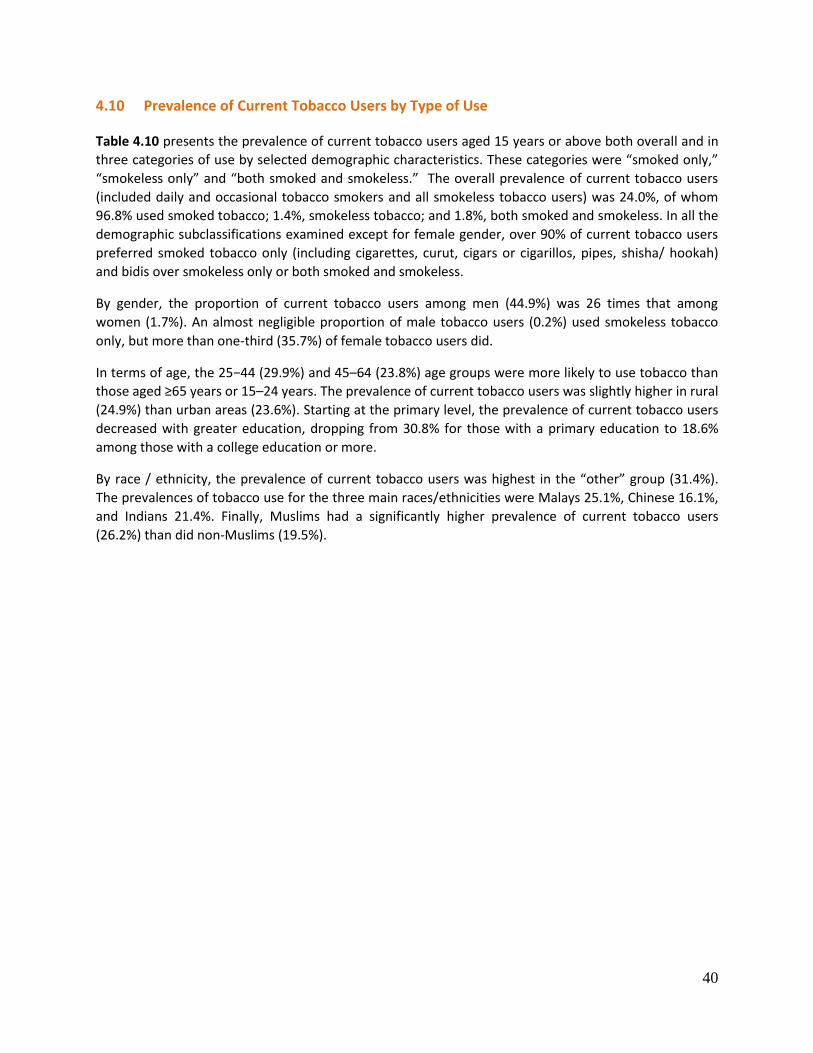
40
4.10 Prevalence of Current Tobacco Users by Type of Use
Table 4.10 presents the prevalence of current tobacco users aged 15 years or above both overall and in
three categories of use by selected demographic characteristics. These categories were “smoked only,”
“smokeless only” and “both smoked and smokeless.” The overall prevalence of current tobacco users
(included daily and occasional tobacco smokers and all smokeless tobacco users) was 24.0%, of whom
96.8% used smoked tobacco; 1.4%, smokeless tobacco; and 1.8%, both smoked and smokeless. In all the
demographic subclassifications examined except for female gender, over 90% of current tobacco users
preferred smoked tobacco only (including cigarettes, curut, cigars or cigarillos, pipes, shisha/ hookah)
and bidis over smokeless only or both smoked and smokeless.
By gender, the proportion of current tobacco users among men (44.9%) was 26 times that among
women (1.7%). An almost negligible proportion of male tobacco users (0.2%) used smokeless tobacco
only, but more than one-third (35.7%) of female tobacco users did.
In terms of age, the 25−44 (29.9%) and 45–64 (23.8%) age groups were more likely to use tobacco than
those aged ≥65 years or 15–24 years. The prevalence of current tobacco users was slightly higher in rural
(24.9%) than urban areas (23.6%). Starting at the primary level, the prevalence of current tobacco users
decreased with greater education, dropping from 30.8% for those with a primary education to 18.6%
among those with a college education or more.
By race / ethnicity, the prevalence of current tobacco users was highest in the “other” group (31.4%).
The prevalences of tobacco use for the three main races/ethnicities were Malays 25.1%, Chinese 16.1%,
and Indians 21.4%. Finally, Muslims had a significantly higher prevalence of current tobacco users
(26.2%) than did non-Muslims (19.5%).
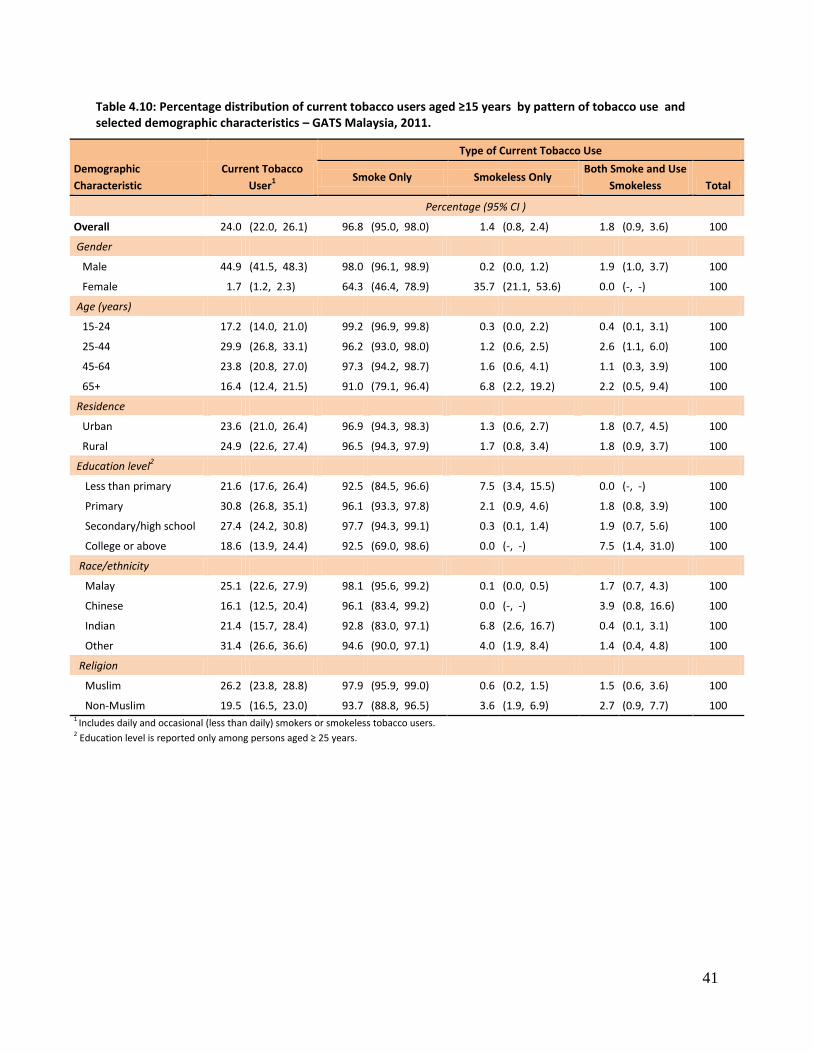
41
Table 4.10: Percentage distribution of current tobacco users aged ≥15 years by pattern of tobacco use and selected demographic characteristics – GATS Malaysia, 2011.
Demographic
Characteristic
Current Tobacco
User1
Type of Current Tobacco Use
Smoke Only Smokeless Only Both Smoke and Use
Smokeless Total
Percentage (95% CI )
Overall 24.0 (22.0, 26.1) 96.8 (95.0, 98.0) 1.4 (0.8, 2.4) 1.8 (0.9, 3.6) 100
Gender
Male 44.9 (41.5, 48.3) 98.0 (96.1, 98.9) 0.2 (0.0, 1.2) 1.9 (1.0, 3.7) 100
Female 1.7 (1.2, 2.3) 64.3 (46.4, 78.9) 35.7 (21.1, 53.6) 0.0 (-, -) 100
Age (years)
15-24 17.2 (14.0, 21.0) 99.2 (96.9, 99.8) 0.3 (0.0, 2.2) 0.4 (0.1, 3.1) 100
25-44 29.9 (26.8, 33.1) 96.2 (93.0, 98.0) 1.2 (0.6, 2.5) 2.6 (1.1, 6.0) 100
45-64 23.8 (20.8, 27.0) 97.3 (94.2, 98.7) 1.6 (0.6, 4.1) 1.1 (0.3, 3.9) 100
65+ 16.4 (12.4, 21.5) 91.0 (79.1, 96.4) 6.8 (2.2, 19.2) 2.2 (0.5, 9.4) 100
Residence
Urban 23.6 (21.0, 26.4) 96.9 (94.3, 98.3) 1.3 (0.6, 2.7) 1.8 (0.7, 4.5) 100
Rural 24.9 (22.6, 27.4) 96.5 (94.3, 97.9) 1.7 (0.8, 3.4) 1.8 (0.9, 3.7) 100
Education level2
Less than primary 21.6 (17.6, 26.4) 92.5 (84.5, 96.6) 7.5 (3.4, 15.5) 0.0 (-, -) 100
Primary 30.8 (26.8, 35.1) 96.1 (93.3, 97.8) 2.1 (0.9, 4.6) 1.8 (0.8, 3.9) 100
Secondary/high school 27.4 (24.2, 30.8) 97.7 (94.3, 99.1) 0.3 (0.1, 1.4) 1.9 (0.7, 5.6) 100
College or above 18.6 (13.9, 24.4) 92.5 (69.0, 98.6) 0.0 (-, -) 7.5 (1.4, 31.0) 100
Race/ethnicity
Malay 25.1 (22.6, 27.9) 98.1 (95.6, 99.2) 0.1 (0.0, 0.5) 1.7 (0.7, 4.3) 100
Chinese 16.1 (12.5, 20.4) 96.1 (83.4, 99.2) 0.0 (-, -) 3.9 (0.8, 16.6) 100
Indian 21.4 (15.7, 28.4) 92.8 (83.0, 97.1) 6.8 (2.6, 16.7) 0.4 (0.1, 3.1) 100
Other 31.4 (26.6, 36.6) 94.6 (90.0, 97.1) 4.0 (1.9, 8.4) 1.4 (0.4, 4.8) 100
Religion
Muslim 26.2 (23.8, 28.8) 97.9 (95.9, 99.0) 0.6 (0.2, 1.5) 1.5 (0.6, 3.6) 100
Non-Muslim 19.5 (16.5, 23.0) 93.7 (88.8, 96.5) 3.6 (1.9, 6.9) 2.7 (0.9, 7.7) 100 1 Includes daily and occasional (less than daily) smokers or smokeless tobacco users. 2 Education level is reported only among persons aged ≥ 25 years.
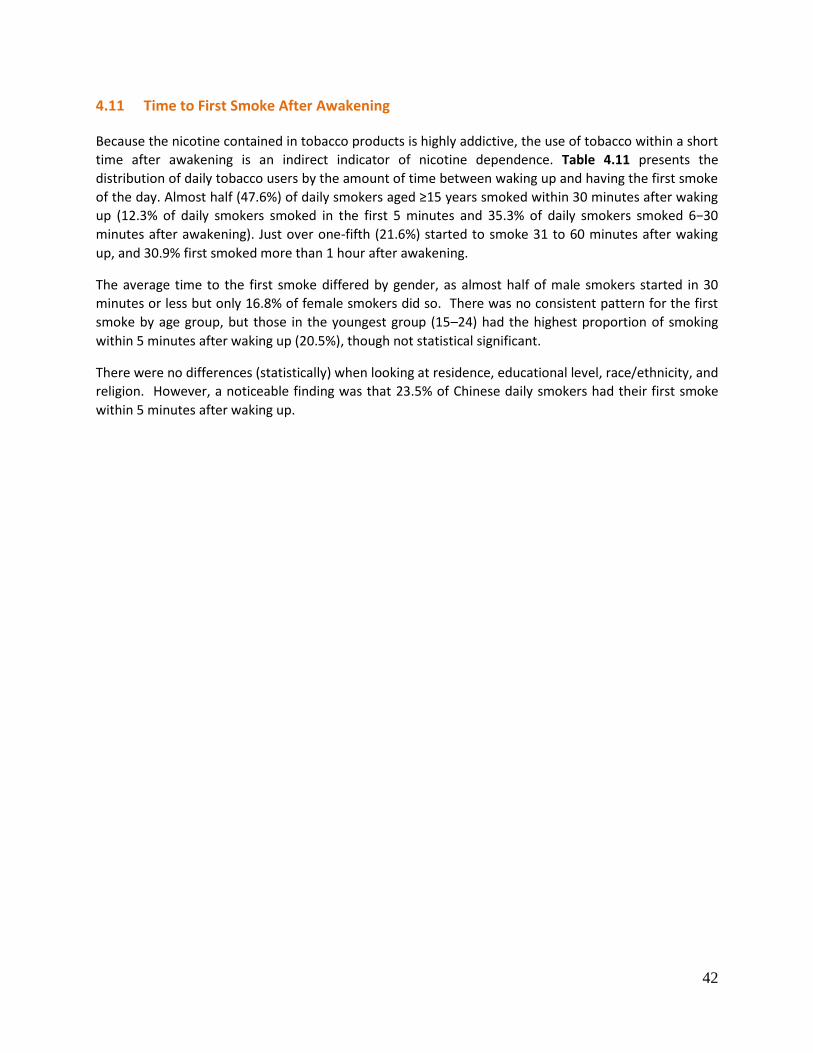
42
4.11 Time to First Smoke After Awakening
Because the nicotine contained in tobacco products is highly addictive, the use of tobacco within a short
time after awakening is an indirect indicator of nicotine dependence. Table 4.11 presents the
distribution of daily tobacco users by the amount of time between waking up and having the first smoke
of the day. Almost half (47.6%) of daily smokers aged ≥15 years smoked within 30 minutes after waking
up (12.3% of daily smokers smoked in the first 5 minutes and 35.3% of daily smokers smoked 6−30
minutes after awakening). Just over one-fifth (21.6%) started to smoke 31 to 60 minutes after waking
up, and 30.9% first smoked more than 1 hour after awakening.
The average time to the first smoke differed by gender, as almost half of male smokers started in 30
minutes or less but only 16.8% of female smokers did so. There was no consistent pattern for the first
smoke by age group, but those in the youngest group (15–24) had the highest proportion of smoking
within 5 minutes after waking up (20.5%), though not statistical significant.
There were no differences (statistically) when looking at residence, educational level, race/ethnicity, and
religion. However, a noticeable finding was that 23.5% of Chinese daily smokers had their first smoke
within 5 minutes after waking up.
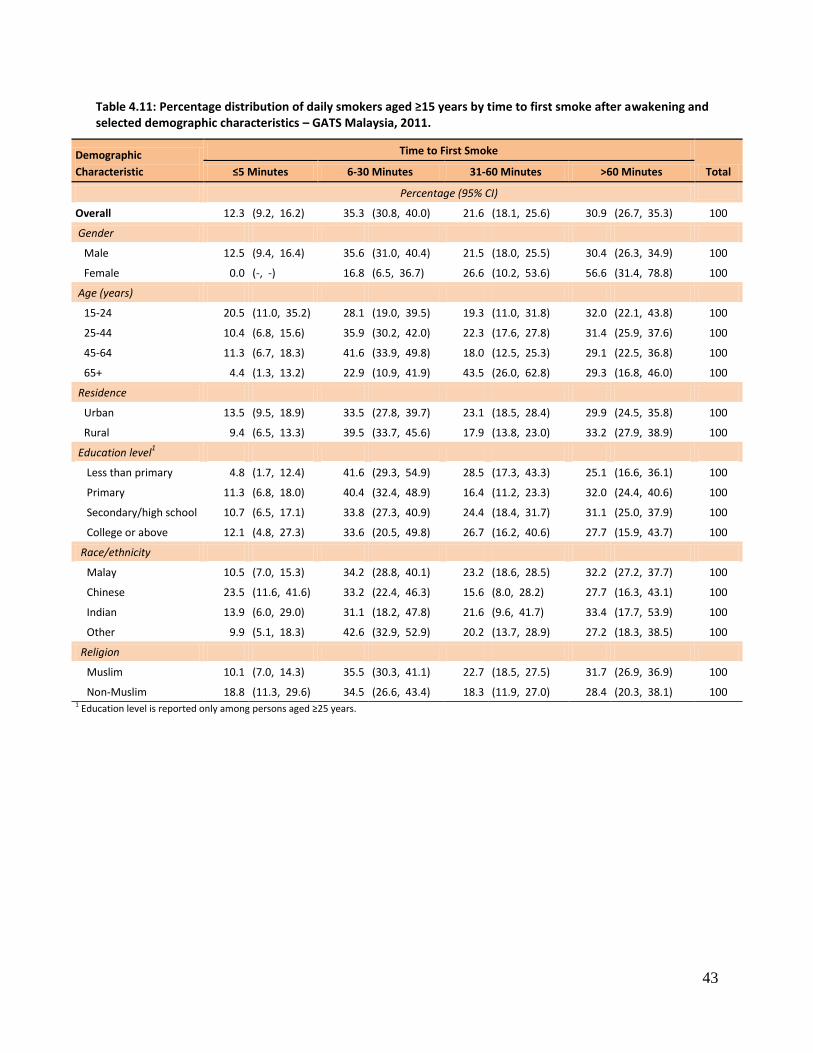
43
Table 4.11: Percentage distribution of daily smokers aged ≥15 years by time to first smoke after awakening and selected demographic characteristics – GATS Malaysia, 2011.
Demographic
Characteristic
Time to First Smoke
Total ≤5 Minutes 6-30 Minutes 31-60 Minutes >60 Minutes
Percentage (95% CI)
Overall 12.3 (9.2, 16.2) 35.3 (30.8, 40.0) 21.6 (18.1, 25.6) 30.9 (26.7, 35.3) 100
Gender
Male 12.5 (9.4, 16.4) 35.6 (31.0, 40.4) 21.5 (18.0, 25.5) 30.4 (26.3, 34.9) 100
Female 0.0 (-, -) 16.8 (6.5, 36.7) 26.6 (10.2, 53.6) 56.6 (31.4, 78.8) 100
Age (years)
15-24 20.5 (11.0, 35.2) 28.1 (19.0, 39.5) 19.3 (11.0, 31.8) 32.0 (22.1, 43.8) 100
25-44 10.4 (6.8, 15.6) 35.9 (30.2, 42.0) 22.3 (17.6, 27.8) 31.4 (25.9, 37.6) 100
45-64 11.3 (6.7, 18.3) 41.6 (33.9, 49.8) 18.0 (12.5, 25.3) 29.1 (22.5, 36.8) 100
65+ 4.4 (1.3, 13.2) 22.9 (10.9, 41.9) 43.5 (26.0, 62.8) 29.3 (16.8, 46.0) 100
Residence
Urban 13.5 (9.5, 18.9) 33.5 (27.8, 39.7) 23.1 (18.5, 28.4) 29.9 (24.5, 35.8) 100
Rural 9.4 (6.5, 13.3) 39.5 (33.7, 45.6) 17.9 (13.8, 23.0) 33.2 (27.9, 38.9) 100
Education level1
Less than primary 4.8 (1.7, 12.4) 41.6 (29.3, 54.9) 28.5 (17.3, 43.3) 25.1 (16.6, 36.1) 100
Primary 11.3 (6.8, 18.0) 40.4 (32.4, 48.9) 16.4 (11.2, 23.3) 32.0 (24.4, 40.6) 100
Secondary/high school 10.7 (6.5, 17.1) 33.8 (27.3, 40.9) 24.4 (18.4, 31.7) 31.1 (25.0, 37.9) 100
College or above 12.1 (4.8, 27.3) 33.6 (20.5, 49.8) 26.7 (16.2, 40.6) 27.7 (15.9, 43.7) 100
Race/ethnicity
Malay 10.5 (7.0, 15.3) 34.2 (28.8, 40.1) 23.2 (18.6, 28.5) 32.2 (27.2, 37.7) 100
Chinese 23.5 (11.6, 41.6) 33.2 (22.4, 46.3) 15.6 (8.0, 28.2) 27.7 (16.3, 43.1) 100
Indian 13.9 (6.0, 29.0) 31.1 (18.2, 47.8) 21.6 (9.6, 41.7) 33.4 (17.7, 53.9) 100
Other 9.9 (5.1, 18.3) 42.6 (32.9, 52.9) 20.2 (13.7, 28.9) 27.2 (18.3, 38.5) 100
Religion
Muslim 10.1 (7.0, 14.3) 35.5 (30.3, 41.1) 22.7 (18.5, 27.5) 31.7 (26.9, 36.9) 100
Non-Muslim 18.8 (11.3, 29.6) 34.5 (26.6, 43.4) 18.3 (11.9, 27.0) 28.4 (20.3, 38.1) 100 1 Education level is reported only among persons aged ≥25 years.
44
4.12 Shisha Smoking
Water pipe or shisha smoking, which uses flavored tobacco, is a traditional method of smoking tobacco
in which family and friends interact socially within the shisha cafes located in some shopping malls. The
word water pipe defines the feature in which smoke passes through water before the smoker inhales it.
Different cultures and countries use different shapes of the pipe and variously define this practice of
smoking as hookah, huqqa, arghile, narghile, hubble bubble, goza, and boori.
Water pipe or shisha smoking is very popular in the Middle East and is believed to be a part of the
cultural identity of countries in that region. Elsewhere, this activity is fast gaining popularity in the
United States of America, Canada, United Kingdom, Australia, and Malaysia, facilitated by the influx of
Middle Eastern people into these countries. Regardless, shisha smoking is predominantly a social
phenomenon that allows people to spend pleasurable time in the company of friends and family at
homes or in cafes or bars.
Shisha come in different shapes, sizes, and colors. The apparatus consists of a bowl, windscreen
(optional), hose, body and gaskets, a purge valve (optional), water jar, plate, and grommets. The
sweetened and flavored tobacco, which is called moassel, is mixed with molasses and gives the aroma of
burned sugar.
In Malaysia, the prevalence of shisha smoking among adults was only 0.6%.
4.13 Electronic Cigarettes
Electronic cigarettes (E-cigarettes) are essentially electronic systems designed to deliver nicotine. One
end of a plastic or metal cylinder, resembling a cigarette or cigar, is placed in the user’s mouth, and
he/she inhales to draw a mixture of air and vapors from the device into the respiratory system.
The E-cigarette consists of an electronic vaporization system, a rechargeable battery and charger,
electronic controls, and replaceable cartridges that may contain nicotine and other chemicals. E-
cigarettes usually include various flavorants that deliver nicotine and other impurities in various
proportions and quantities. Essentially, e-cigarettes are drug devices combined with tobacco products
and should be classified as nicotine vaporizers that ought to meet the definition of both cigarette and
smokeless tobacco products and adhere to strict regulations.
About 21% (20.9%, 95% CI: 19.1-22.9%) of adults in Malaysia had heard about E-cigarettes, and the
prevalence of using these devices was just 0.8% (95% CI: 0.4-1.6%).

45
5. CESSATION
This chapter discusses three components of smoking cessation: attempts to quit smoking and the
receipt of advice to quit from health care providers, cessation methods used by those who attempted to
quit smoking, and the interest of smokers in quitting. The chapter also highlights the discrepancy
between Malaysian smokers’ desire to quit and the level of their awareness of or ability to access
cessation services. Indirectly, the chapter reflects upon the smoking cessation services implemented to
date in Malaysia. Findings from this study provide evidence to support and further advocate for specific
policies on smoking cessation to help smokers quit using tobacco. In addition, it adds to the growing
body of our knowledge regarding the components of a comprehensive tobacco control programme.
Comprehensive programs are needed because a single intervention is unlikely to be suitable for every
smoker in the population.
Key Findings
Nearly one-half of smokers aged 15 years or above had made an attempt to quit smoking in the past 12 months.
Four out of five smokers who attempted to quit smoking in the past 12 months tried to quit without any assistance.
Only half of current smokers who had visited a health care provider in the past 12 months received advice to quit smoking from the provider.
5.1 Attempts to Quit Smoking and Receipt of Advice to Quit from Health Care Providers
Among current smokers plus former smokers who had abstained from smoking for less than 12 months,
nearly half (48.6%) had made at least one attempt to quit smoking in the past 12 months (48.7% of men
and 45.7% of women). The youngest group, those aged 15−24 years, had a high percentage (60.8%) of
making at least one quit attempt in the past 12 months. The percentages for the other age groups were
as follows: 46.6% of those aged 25-44 years, 46.0% of those aged 45-64 years, and 30.4% of those aged
≥65 years.
Almost one-third (32.4%) of the population of current smokers plus former smokers who had been
abstinent for less than 12 months had visited a health care provider (HCP) in the previous 12 months. Of
this group, 67.6% had been asked by their HCP if they smoked. Overall, slightly more than half (52.6%)
had been advised to quit by their HCP.
The percentages of those who were asked about their smoking status by their HCP were 72.8% for rural
residents and 65.5% for urban residents. The percentages of those who were advised to quit smoking by
their HCP was 60.2% for rural residents and 49.6% for urban residents.
Just 37.2% of those below the primary level had tried to quit versus 47.4% of those at both the
secondary/high school and college or above levels. The percentages of smokers who were asked by their
HCP if they smoked were 71.3% with less than a primary education; 66.2% for those with a primary
education and 68.0% for those with a secondary / high school education.
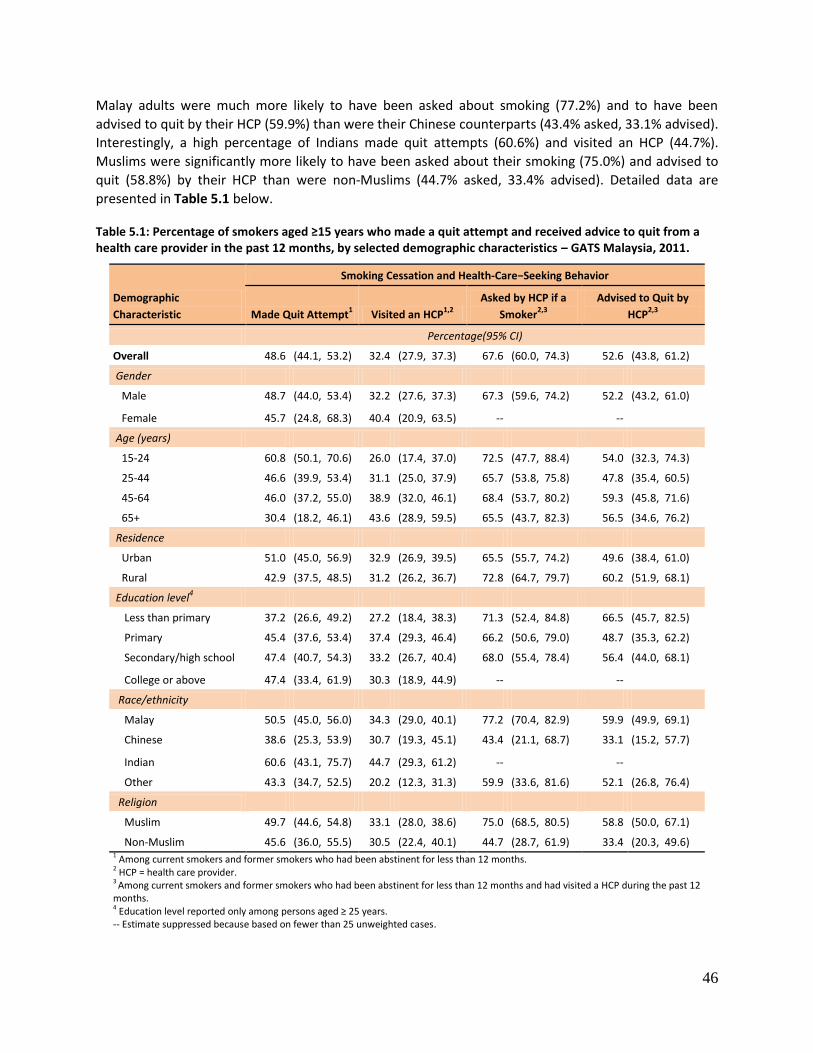
46
Malay adults were much more likely to have been asked about smoking (77.2%) and to have been
advised to quit by their HCP (59.9%) than were their Chinese counterparts (43.4% asked, 33.1% advised).
Interestingly, a high percentage of Indians made quit attempts (60.6%) and visited an HCP (44.7%).
Muslims were significantly more likely to have been asked about their smoking (75.0%) and advised to
quit (58.8%) by their HCP than were non-Muslims (44.7% asked, 33.4% advised). Detailed data are
presented in Table 5.1 below.
Table 5.1: Percentage of smokers aged ≥15 years who made a quit attempt and received advice to quit from a health care provider in the past 12 months, by selected demographic characteristics – GATS Malaysia, 2011.
Demographic
Characteristic
Smoking Cessation and Health-Care−Seeking Behavior
Made Quit Attempt1 Visited an HCP
1,2
Asked by HCP if a
Smoker2,3
Advised to Quit by
HCP2,3
Percentage(95% CI)
Overall 48.6 (44.1, 53.2) 32.4 (27.9, 37.3) 67.6 (60.0, 74.3) 52.6 (43.8, 61.2)
Gender
Male 48.7 (44.0, 53.4) 32.2 (27.6, 37.3) 67.3 (59.6, 74.2) 52.2 (43.2, 61.0)
Female 45.7 (24.8, 68.3) 40.4 (20.9, 63.5) -- --
Age (years)
15-24 60.8 (50.1, 70.6) 26.0 (17.4, 37.0) 72.5 (47.7, 88.4) 54.0 (32.3, 74.3)
25-44 46.6 (39.9, 53.4) 31.1 (25.0, 37.9) 65.7 (53.8, 75.8) 47.8 (35.4, 60.5)
45-64 46.0 (37.2, 55.0) 38.9 (32.0, 46.1) 68.4 (53.7, 80.2) 59.3 (45.8, 71.6)
65+ 30.4 (18.2, 46.1) 43.6 (28.9, 59.5) 65.5 (43.7, 82.3) 56.5 (34.6, 76.2)
Residence
Urban 51.0 (45.0, 56.9) 32.9 (26.9, 39.5) 65.5 (55.7, 74.2) 49.6 (38.4, 61.0)
Rural 42.9 (37.5, 48.5) 31.2 (26.2, 36.7) 72.8 (64.7, 79.7) 60.2 (51.9, 68.1)
Education level4
Less than primary 37.2 (26.6, 49.2) 27.2 (18.4, 38.3) 71.3 (52.4, 84.8) 66.5 (45.7, 82.5)
Primary 45.4 (37.6, 53.4) 37.4 (29.3, 46.4) 66.2 (50.6, 79.0) 48.7 (35.3, 62.2)
Secondary/high school 47.4 (40.7, 54.3) 33.2 (26.7, 40.4) 68.0 (55.4, 78.4) 56.4 (44.0, 68.1)
College or above 47.4 (33.4, 61.9) 30.3 (18.9, 44.9) -- --
Race/ethnicity Malay 50.5 (45.0, 56.0) 34.3 (29.0, 40.1) 77.2 (70.4, 82.9) 59.9 (49.9, 69.1)
Chinese 38.6 (25.3, 53.9) 30.7 (19.3, 45.1) 43.4 (21.1, 68.7) 33.1 (15.2, 57.7)
Indian 60.6 (43.1, 75.7) 44.7 (29.3, 61.2) -- --
Other 43.3 (34.7, 52.5) 20.2 (12.3, 31.3) 59.9 (33.6, 81.6) 52.1 (26.8, 76.4)
Religion Muslim 49.7 (44.6, 54.8) 33.1 (28.0, 38.6) 75.0 (68.5, 80.5) 58.8 (50.0, 67.1)
Non-Muslim 45.6 (36.0, 55.5) 30.5 (22.4, 40.1) 44.7 (28.7, 61.9) 33.4 (20.3, 49.6) 1 Among current smokers and former smokers who had been abstinent for less than 12 months. 2 HCP = health care provider. 3 Among current smokers and former smokers who had been abstinent for less than 12 months and had visited a HCP during the past 12 months. 4 Education level reported only among persons aged ≥ 25 years. -- Estimate suppressed because based on fewer than 25 unweighted cases.
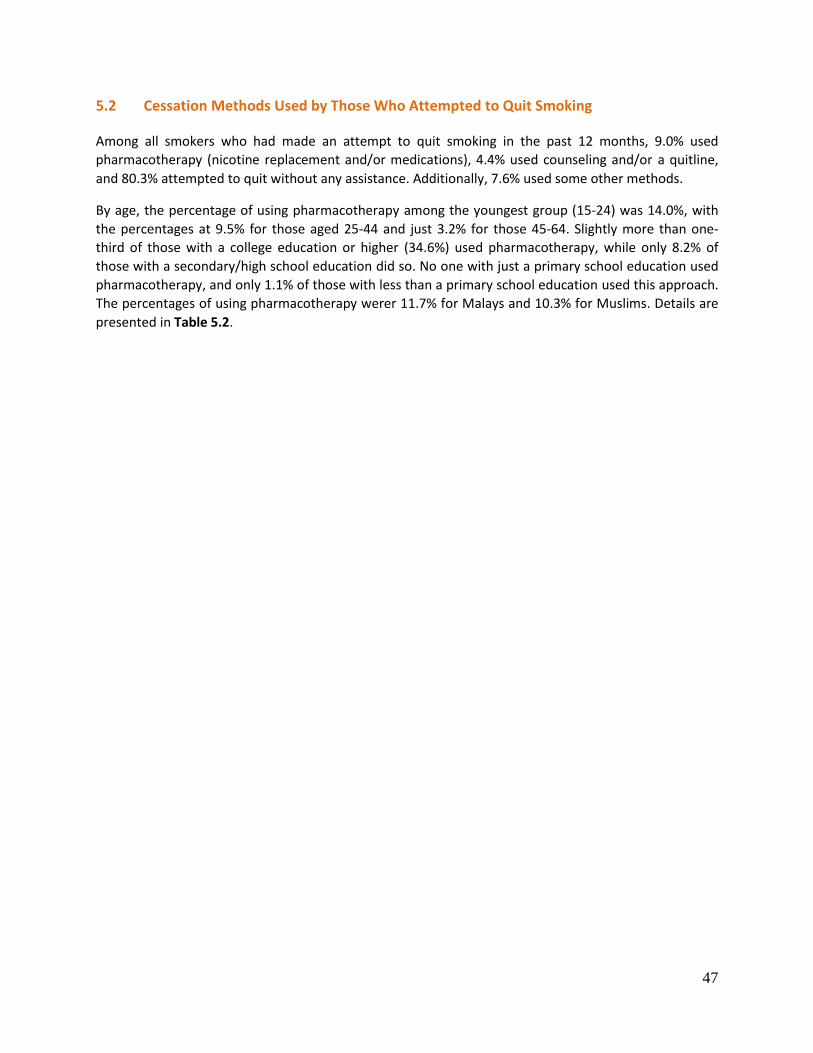
47
5.2 Cessation Methods Used by Those Who Attempted to Quit Smoking
Among all smokers who had made an attempt to quit smoking in the past 12 months, 9.0% used
pharmacotherapy (nicotine replacement and/or medications), 4.4% used counseling and/or a quitline,
and 80.3% attempted to quit without any assistance. Additionally, 7.6% used some other methods.
By age, the percentage of using pharmacotherapy among the youngest group (15-24) was 14.0%, with
the percentages at 9.5% for those aged 25-44 and just 3.2% for those 45-64. Slightly more than one-
third of those with a college education or higher (34.6%) used pharmacotherapy, while only 8.2% of
those with a secondary/high school education did so. No one with just a primary school education used
pharmacotherapy, and only 1.1% of those with less than a primary school education used this approach.
The percentages of using pharmacotherapy werer 11.7% for Malays and 10.3% for Muslims. Details are
presented in Table 5.2.
48
Table 5.2: Percentage of smokers aged ≥15 years who attempted to quit smoking in the past 12 months, by cessation method used and selected demographic characteristics – GATS Malaysia, 2011.
Demographic
Characteristic
Cessation Method1
Pharmacotherapy2 Counseling/Quitline
3
Tried to Quit Without
Assistance4 Other
5
Percentage(95% CI)
Overall 9.0 (5.7, 13.8) 4.4 (2.8, 7.0) 80.3 (73.8, 85.5) 7.6 (4.8, 11.7)
Gender
Male 9.2 (5.9, 14.1) 4.4 (2.7, 6.9) 80.6 (74.2, 85.7) 7.6 (4.8, 11.8)
Female -- -- -- -- Age (years)
15-24 14.0 (6.3, 28.4) 3.6 (1.2, 10.5) 83.5 (69.9, 91.7) 1.2 (0.3, 4.9)
25-44 9.5 (5.5, 15.9) 3.2 (1.5, 6.6) 77.2 (66.7, 85.2) 8.9 (4.9, 15.7)
45-64 3.2 (1.4, 7.5) 7.4 (3.5, 14.9) 83.0 (72.4, 90.1) 11.1 (5.4, 21.5)
65+ -- -- -- -- Residence
Urban 9.3 (5.4, 15.8) 3.7 (1.9, 7.1) 78.7 (70.1, 85.3) 6.9 (3.8, 12.4)
Rural 8.0 (4.4, 14.1) 6.5 (3.8, 10.8) 85.2 (78.6, 90.0) 9.6 (5.6, 16.0)
Education level6
Less than primary 1.1 (0.1, 7.3) 6.2 (2.0, 17.8) 78.9 (60.0, 90.4) 7.0 (2.1, 20.5)
Primary 0.0 (-, -) 2.8 (1.2, 6.6) 84.0 (70.1, 92.2) 10.1 (4.3, 22.0)
Secondary/High school 8.2 (4.6, 14.1) 6.0 (3.0, 11.5) 72.5 (60.6, 81.9) 7.2 (4.1, 12.4)
College or above 34.6 (15.8, 60.0) 4.0 (0.9, 15.8) 96.4 (77.9, 99.5) 24.2 (7.8, 54.5)
Race/ethnicity
Malay 11.7 (7.1, 18.6) 5.0 (3.0, 8.3) 78.4 (70.2, 84.9) 5.9 (3.2, 10.9)
Chinese 0.9 (0.1, 6.5) 2.4 (0.7, 7.9) 96.1 (86.0, 99.0) 5.4 (1.0, 23.6)
Indian 4.7 (0.6, 27.7) 0.0 (-, -) 91.0 (59.7, 98.6) 17.2 (5.5, 42.3)
Other 5.4 (1.5, 18.2) 6.2 (2.1, 17.1) 71.0 (51.3, 85.1) 10.1 (4.7, 20.3)
Religion
Muslim 10.3 (6.3, 16.4) 5.3 (3.3, 8.4) 78.1 (70.2, 84.4) 6.6 (3.9, 11.0)
Non-Muslim 4.8 (1.5, 14.6) 1.8 (0.7, 4.5) 87.4 (76.2, 93.8) 10.7 (4.6, 23.0) 1 Among current smokers who made a quit attempt in the past 12 months and former smokers who had been abstinent for less than 12 months. 2 Pharmacotherapy includes nicotine replacement therapy and prescription medications. 3 Including counseling at a cessation clinic and a telephone quitline/helpline. 4 Tried to stop smoking without aid.
5 Other includes traditional medicines, switching to smokeless tobacco, and any other reported methods. 6 Education level is reported only among persons aged ≥ 25 years.
-- Estimate suppressed because it was based on fewer than 25 unweighted cases.
49
5.3 Interest in Quitting Smoking
In GATS, interest in quitting smoking in GATS was defined as a response by current tobacco smokers that
they were planning to quit or were thinking about quitting smoking within the next month, within 12
months, or someday. Table 5.3 shows levels of interest in quitting among current smokers aged 15 years
or older. Over half of current smokers (56.4%) planned to quit someday, but not in the next 12 months,
while a smaller percentage were planning to quit within the next month (6.3%) or within the next 12
months (8.0%). These findings contrast with Table 5.1, which showed that nearly half of smokers made
at least one attempt to quit in the past 12 months.
For the demographic characteristics, there were no significant differences seen in intention to quit by
subgroup (Table 5.3).
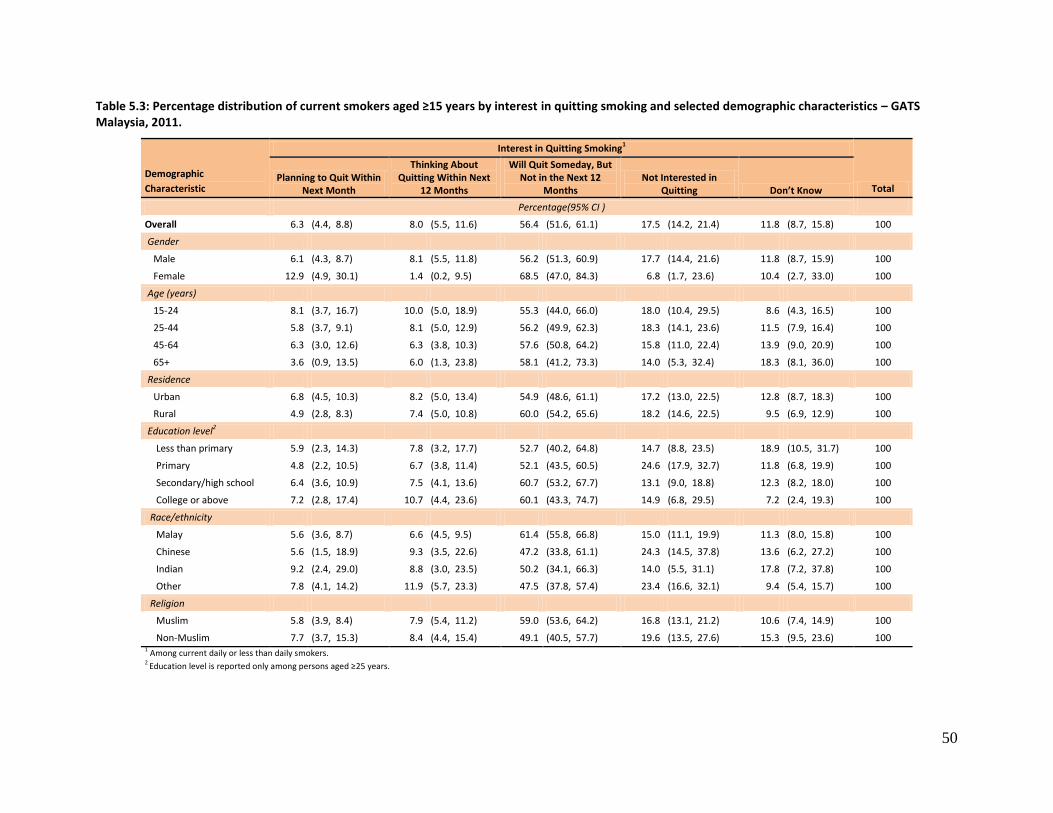
50
Table 5.3: Percentage distribution of current smokers aged ≥15 years by interest in quitting smoking and selected demographic characteristics – GATS Malaysia, 2011.
Demographic
Characteristic
Interest in Quitting Smoking1
Total Planning to Quit Within
Next Month
Thinking About Quitting Within Next
12 Months
Will Quit Someday, But Not in the Next 12
Months Not Interested in
Quitting Don’t Know
Percentage(95% CI )
Overall 6.3 (4.4, 8.8) 8.0 (5.5, 11.6) 56.4 (51.6, 61.1) 17.5 (14.2, 21.4) 11.8 (8.7, 15.8) 100
Gender
Male 6.1 (4.3, 8.7) 8.1 (5.5, 11.8) 56.2 (51.3, 60.9) 17.7 (14.4, 21.6) 11.8 (8.7, 15.9) 100
Female 12.9 (4.9, 30.1) 1.4 (0.2, 9.5) 68.5 (47.0, 84.3) 6.8 (1.7, 23.6) 10.4 (2.7, 33.0) 100
Age (years)
15-24 8.1 (3.7, 16.7) 10.0 (5.0, 18.9) 55.3 (44.0, 66.0) 18.0 (10.4, 29.5) 8.6 (4.3, 16.5) 100
25-44 5.8 (3.7, 9.1) 8.1 (5.0, 12.9) 56.2 (49.9, 62.3) 18.3 (14.1, 23.6) 11.5 (7.9, 16.4) 100
45-64 6.3 (3.0, 12.6) 6.3 (3.8, 10.3) 57.6 (50.8, 64.2) 15.8 (11.0, 22.4) 13.9 (9.0, 20.9) 100
65+ 3.6 (0.9, 13.5) 6.0 (1.3, 23.8) 58.1 (41.2, 73.3) 14.0 (5.3, 32.4) 18.3 (8.1, 36.0) 100
Residence
Urban 6.8 (4.5, 10.3) 8.2 (5.0, 13.4) 54.9 (48.6, 61.1) 17.2 (13.0, 22.5) 12.8 (8.7, 18.3) 100
Rural 4.9 (2.8, 8.3) 7.4 (5.0, 10.8) 60.0 (54.2, 65.6) 18.2 (14.6, 22.5) 9.5 (6.9, 12.9) 100
Education level2
Less than primary 5.9 (2.3, 14.3) 7.8 (3.2, 17.7) 52.7 (40.2, 64.8) 14.7 (8.8, 23.5) 18.9 (10.5, 31.7) 100
Primary 4.8 (2.2, 10.5) 6.7 (3.8, 11.4) 52.1 (43.5, 60.5) 24.6 (17.9, 32.7) 11.8 (6.8, 19.9) 100
Secondary/high school 6.4 (3.6, 10.9) 7.5 (4.1, 13.6) 60.7 (53.2, 67.7) 13.1 (9.0, 18.8) 12.3 (8.2, 18.0) 100
College or above 7.2 (2.8, 17.4) 10.7 (4.4, 23.6) 60.1 (43.3, 74.7) 14.9 (6.8, 29.5) 7.2 (2.4, 19.3) 100
Race/ethnicity
Malay 5.6 (3.6, 8.7) 6.6 (4.5, 9.5) 61.4 (55.8, 66.8) 15.0 (11.1, 19.9) 11.3 (8.0, 15.8) 100
Chinese 5.6 (1.5, 18.9) 9.3 (3.5, 22.6) 47.2 (33.8, 61.1) 24.3 (14.5, 37.8) 13.6 (6.2, 27.2) 100
Indian 9.2 (2.4, 29.0) 8.8 (3.0, 23.5) 50.2 (34.1, 66.3) 14.0 (5.5, 31.1) 17.8 (7.2, 37.8) 100
Other 7.8 (4.1, 14.2) 11.9 (5.7, 23.3) 47.5 (37.8, 57.4) 23.4 (16.6, 32.1) 9.4 (5.4, 15.7) 100
Religion
Muslim 5.8 (3.9, 8.4) 7.9 (5.4, 11.2) 59.0 (53.6, 64.2) 16.8 (13.1, 21.2) 10.6 (7.4, 14.9) 100
Non-Muslim 7.7 (3.7, 15.3) 8.4 (4.4, 15.4) 49.1 (40.5, 57.7) 19.6 (13.5, 27.6) 15.3 (9.5, 23.6) 100 1 Among current daily or less than daily smokers. 2 Education level is reported only among persons aged ≥25 years.
51
6. SECONDHAND SMOKE
Secondhand smoke (SHS) is tobacco smoke that is inhaled involuntarily or passively by someone who is
not smoking. It is generated from the sidestream (the smoke that is coming from the smoldering end) of
a cigarette, pipe or cigar or from the exhaled mainstream (the smoke puffed out by smokers) of
cigarettes, pipes and cigars. The U.S. government has long classified SHS as a known human
carcinogen27-30. Non-smokers exposed to SHS have a 25%-30% higher risk of coronary heart disease than
do non-smokers who are not exposed to SHS31. Exposure to SHS occurs mainly in workplaces, homes,
public places and private cars.
Malaysia does not have comprehensive national legislation that protects all people from SHS, although
subnational jurisdictions have the authority to implement laws that ban smoking in public places. This
chapter measures exposure to SHS at home, at the workplace, and in various public places, including
government buildings, health-care facilities, restaurants, bars / nightclubs, cafes / coffee shops / bistros,
indoor shopping complexes, and public transportation, among adults aged 15 years or above.
Key Findings
Among those who worked indoors, 4 in 10 were exposed to SHS in the workplace.
Almost 4 in 10 adults were exposed to tobacco smoke at home.
More than 8 in 10 adults were exposed to SHS when visiting cafes/coffee shops/bistros, and almost 8 in 10 adults were exposed when visiting bars/nightclubs.
7 in 10 adults were exposed to SHS when visiting restaurants, which equates to 42% of the entire adult population.
20% of adults were exposed to SHS when visiting government buildings and 28% of adults were exposed to SHS when using public transportation.
Almost 9% of adults were exposed to SHS when visiting health-care facilities.
6.1 Exposure to Secondhand Smoke in the Workplace
The prevalence and estimated numbers of adults exposed to SHS at the workplace (among those
working exclusively indoors or both indoors and outdoors) over the past 30 days by smoking status are
shown in Table 6.1. Exposure to SHS in the workplace was measured only among adults who worked
outside of their home. Table 6.1 shows that in Malaysia, 39.8% of adults had been exposed to SHS in the
workplace in the past 30 days; among non-smokers only, 33.9% had been exposed.
Men (46.2% overall, 39.1% of non-smokers) were more likely than women (30.1% overall, 29.8% of non-
smokers) to be exposed to SHS in the workplace. The prevalence of SHS exposure in the workplace for
residents of urban areas (41.6% overall, 35.6% of non-smokers) was higher than those residing in rural
areas (33.1% overall, 27.4% of non-smokers). Chinese workers had the highest exposure at work among
all the racial/ ethnic groups (44.7% overall, 41.2% among non-smokers), but neither finding was
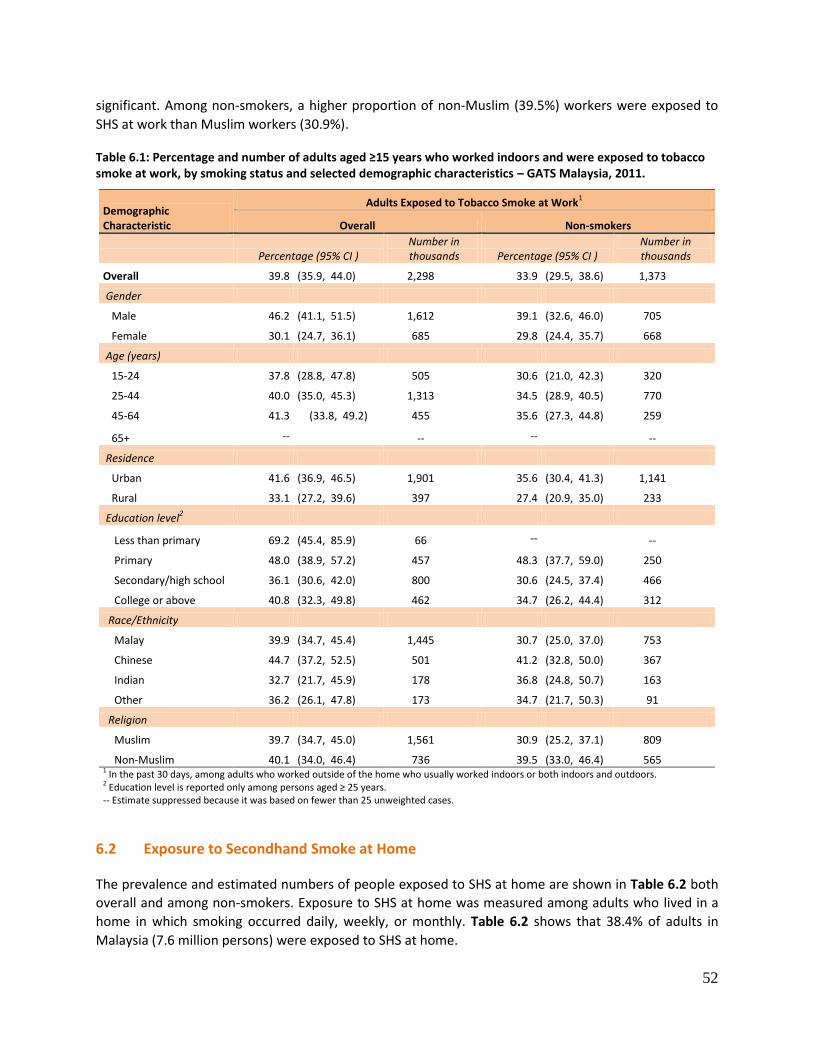
52
significant. Among non-smokers, a higher proportion of non-Muslim (39.5%) workers were exposed to
SHS at work than Muslim workers (30.9%).
Table 6.1: Percentage and number of adults aged ≥15 years who worked indoors and were exposed to tobacco smoke at work, by smoking status and selected demographic characteristics – GATS Malaysia, 2011.
Demographic Characteristic
Adults Exposed to Tobacco Smoke at Work1
Overall Non-smokers
Percentage (95% CI ) Number in thousands Percentage (95% CI )
Number in thousands
Overall 39.8 (35.9, 44.0) 2,298 33.9 (29.5, 38.6) 1,373
Gender
Male 46.2 (41.1, 51.5) 1,612 39.1 (32.6, 46.0) 705
Female 30.1 (24.7, 36.1) 685 29.8 (24.4, 35.7) 668
Age (years)
15-24 37.8 (28.8, 47.8) 505 30.6 (21.0, 42.3) 320
25-44 40.0 (35.0, 45.3) 1,313 34.5 (28.9, 40.5) 770
45-64 41.3 (33.8, 49.2) 455 35.6 (27.3, 44.8) 259
65+ -- -- -- --
Residence
Urban 41.6 (36.9, 46.5) 1,901 35.6 (30.4, 41.3) 1,141
Rural 33.1 (27.2, 39.6) 397 27.4 (20.9, 35.0) 233
Education level2
Less than primary 69.2 (45.4, 85.9) 66 -- --
Primary 48.0 (38.9, 57.2) 457 48.3 (37.7, 59.0) 250
Secondary/high school 36.1 (30.6, 42.0) 800 30.6 (24.5, 37.4) 466
College or above 40.8 (32.3, 49.8) 462 34.7 (26.2, 44.4) 312
Race/Ethnicity
Malay 39.9 (34.7, 45.4) 1,445 30.7 (25.0, 37.0) 753
Chinese 44.7 (37.2, 52.5) 501 41.2 (32.8, 50.0) 367
Indian 32.7 (21.7, 45.9) 178 36.8 (24.8, 50.7) 163
Other 36.2 (26.1, 47.8) 173 34.7 (21.7, 50.3) 91
Religion
Muslim 39.7 (34.7, 45.0) 1,561 30.9 (25.2, 37.1) 809
Non-Muslim 40.1 (34.0, 46.4) 736 39.5 (33.0, 46.4) 565 1 In the past 30 days, among adults who worked outside of the home who usually worked indoors or both indoors and outdoors. 2 Education level is reported only among persons aged ≥ 25 years. -- Estimate suppressed because it was based on fewer than 25 unweighted cases.
6.2 Exposure to Secondhand Smoke at Home
The prevalence and estimated numbers of people exposed to SHS at home are shown in Table 6.2 both
overall and among non-smokers. Exposure to SHS at home was measured among adults who lived in a
home in which smoking occurred daily, weekly, or monthly. Table 6.2 shows that 38.4% of adults in
Malaysia (7.6 million persons) were exposed to SHS at home.
53
Men (43.3%, 4.5 million) had a higher prevalence of exposure to SHS at home than women (33.3%, 3.2
million). Adults living in rural areas (45.4%, 2.5 million) were more likely to be exposed to SHS at home
than those living in urban areas (35.7%, 5.1 million).
By educational attainment, adults with a college education or above had the lowest estimate of SHS
exposure at home (24.8%, 0.4 million); the findings for other groups were 42.7%, 0.8 million for less
than primary; 41.3%, 1.8 million for primary; and 38.4%, 2.4 million for secondary / high school.
Chinese (22.5%, 0.8 million) and Indians (23.1%, 0.4 million) were less likely to be exposed to SHS at
home than were Malays (43.9%, 5.1 million) or the “other” group (47.8%, 1.3 million). The prevalence of
SHS exposure at home for Muslims (45.5%, 6.0 million) was much higher than for non-Muslims (24.5%,
1.6 million).
Among current non-smokers, 27.9% (4.2 million persons) were exposed to SHS at home. The pattern of
SHS exposure in non-smokers was similar to that among all adults across various demographic variables
except for gender. Female non-smokers (32.8%, 3.1 million) were more likely to be exposed to SHS at
home than were male non-smokers (19.5%, 1.1 million). Non-smokers living in rural areas (35.0%, 1.5
million) were more likely to be exposed to SHS at home than were non-smokers residing in urban areas
(25.1%, 2.7 million). By education, (16.0%, 0.2 million) of non-smokers with a college education or more
were exposed to SHS at home; other findings for non-smokers were 32.2%, 0.5 million for less than
primary education; 29.0%, 0.9 million for primary; and 25.3%, 1.2 million for secondary / high school.
Non-smoking Chinese (14.5%, 0.5 million) and Indians (14.4%, 0.2 million) were less likely to be exposed
to SHS at home than were non-smoking Malays (33.8%, 2.9 million) or the “other” group (33.5%, 0.6
million). Non-smoking Muslims (34.9%, 3.4 million) were more likely to be exposed than were non-
smoking non-Muslims (15.2%, 0.8 million).
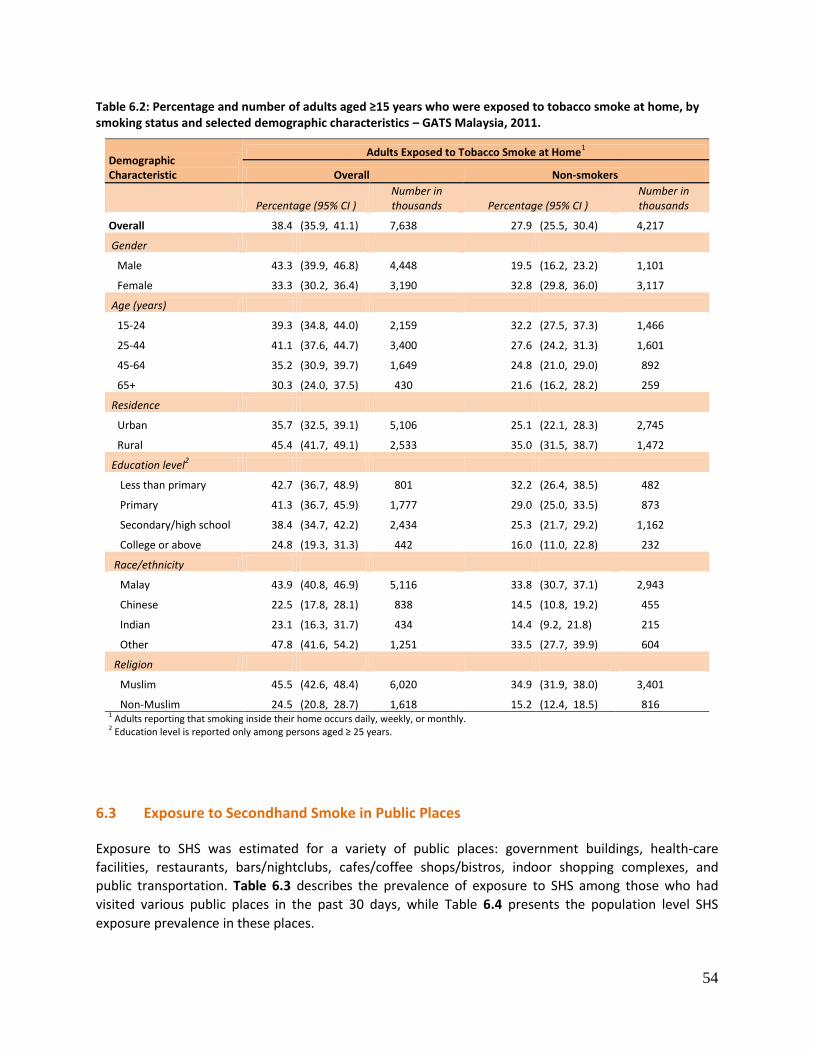
54
Table 6.2: Percentage and number of adults aged ≥15 years who were exposed to tobacco smoke at home, by smoking status and selected demographic characteristics – GATS Malaysia, 2011.
Demographic Characteristic
Adults Exposed to Tobacco Smoke at Home1
Overall Non-smokers
Percentage (95% CI ) Number in thousands Percentage (95% CI )
Number in thousands
Overall 38.4 (35.9, 41.1) 7,638 27.9 (25.5, 30.4) 4,217
Gender
Male 43.3 (39.9, 46.8) 4,448 19.5 (16.2, 23.2) 1,101
Female 33.3 (30.2, 36.4) 3,190 32.8 (29.8, 36.0) 3,117
Age (years)
15-24 39.3 (34.8, 44.0) 2,159 32.2 (27.5, 37.3) 1,466
25-44 41.1 (37.6, 44.7) 3,400 27.6 (24.2, 31.3) 1,601
45-64 35.2 (30.9, 39.7) 1,649 24.8 (21.0, 29.0) 892
65+ 30.3 (24.0, 37.5) 430 21.6 (16.2, 28.2) 259
Residence
Urban 35.7 (32.5, 39.1) 5,106 25.1 (22.1, 28.3) 2,745
Rural 45.4 (41.7, 49.1) 2,533 35.0 (31.5, 38.7) 1,472
Education level2
Less than primary 42.7 (36.7, 48.9) 801 32.2 (26.4, 38.5) 482
Primary 41.3 (36.7, 45.9) 1,777 29.0 (25.0, 33.5) 873
Secondary/high school 38.4 (34.7, 42.2) 2,434 25.3 (21.7, 29.2) 1,162
College or above 24.8 (19.3, 31.3) 442 16.0 (11.0, 22.8) 232
Race/ethnicity
Malay 43.9 (40.8, 46.9) 5,116 33.8 (30.7, 37.1) 2,943
Chinese 22.5 (17.8, 28.1) 838 14.5 (10.8, 19.2) 455
Indian 23.1 (16.3, 31.7) 434 14.4 (9.2, 21.8) 215
Other 47.8 (41.6, 54.2) 1,251 33.5 (27.7, 39.9) 604
Religion
Muslim 45.5 (42.6, 48.4) 6,020 34.9 (31.9, 38.0) 3,401
Non-Muslim 24.5 (20.8, 28.7) 1,618 15.2 (12.4, 18.5) 816 1 Adults reporting that smoking inside their home occurs daily, weekly, or monthly. 2 Education level is reported only among persons aged ≥ 25 years.
6.3 Exposure to Secondhand Smoke in Public Places
Exposure to SHS was estimated for a variety of public places: government buildings, health-care
facilities, restaurants, bars/nightclubs, cafes/coffee shops/bistros, indoor shopping complexes, and
public transportation. Table 6.3 describes the prevalence of exposure to SHS among those who had
visited various public places in the past 30 days, while Table 6.4 presents the population level SHS
exposure prevalence in these places.
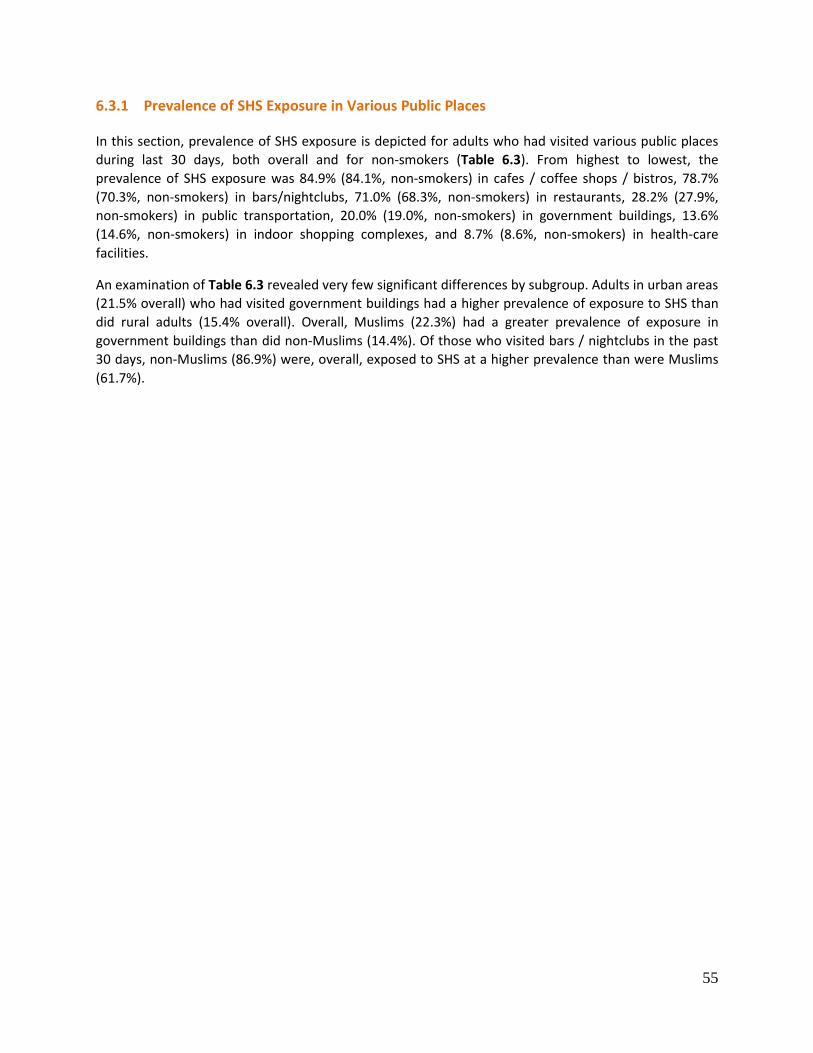
55
6.3.1 Prevalence of SHS Exposure in Various Public Places
In this section, prevalence of SHS exposure is depicted for adults who had visited various public places
during last 30 days, both overall and for non-smokers (Table 6.3). From highest to lowest, the
prevalence of SHS exposure was 84.9% (84.1%, non-smokers) in cafes / coffee shops / bistros, 78.7%
(70.3%, non-smokers) in bars/nightclubs, 71.0% (68.3%, non-smokers) in restaurants, 28.2% (27.9%,
non-smokers) in public transportation, 20.0% (19.0%, non-smokers) in government buildings, 13.6%
(14.6%, non-smokers) in indoor shopping complexes, and 8.7% (8.6%, non-smokers) in health-care
facilities.
An examination of Table 6.3 revealed very few significant differences by subgroup. Adults in urban areas
(21.5% overall) who had visited government buildings had a higher prevalence of exposure to SHS than
did rural adults (15.4% overall). Overall, Muslims (22.3%) had a greater prevalence of exposure in
government buildings than did non-Muslims (14.4%). Of those who visited bars / nightclubs in the past
30 days, non-Muslims (86.9%) were, overall, exposed to SHS at a higher prevalence than were Muslims
(61.7%).
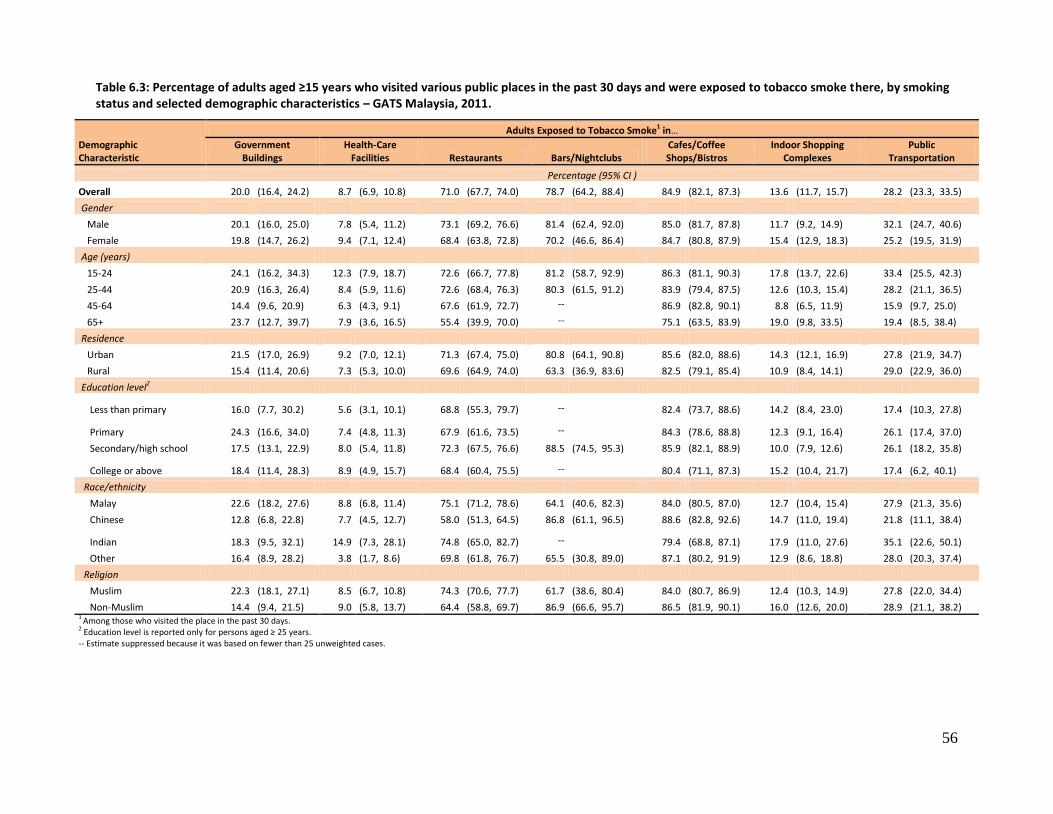
56
Table 6.3: Percentage of adults aged ≥15 years who visited various public places in the past 30 days and were exposed to tobacco smoke there, by smoking status and selected demographic characteristics – GATS Malaysia, 2011.
Demographic Characteristic
Adults Exposed to Tobacco Smoke1 in…
Government Buildings
Health-Care Facilities Restaurants Bars/Nightclubs
Cafes/Coffee Shops/Bistros
Indoor Shopping Complexes
Public Transportation
Percentage (95% CI )
Overall 20.0 (16.4, 24.2) 8.7 (6.9, 10.8) 71.0 (67.7, 74.0) 78.7 (64.2, 88.4) 84.9 (82.1, 87.3) 13.6 (11.7, 15.7) 28.2 (23.3, 33.5)
Gender
Male 20.1 (16.0, 25.0) 7.8 (5.4, 11.2) 73.1 (69.2, 76.6) 81.4 (62.4, 92.0) 85.0 (81.7, 87.8) 11.7 (9.2, 14.9) 32.1 (24.7, 40.6)
Female 19.8 (14.7, 26.2) 9.4 (7.1, 12.4) 68.4 (63.8, 72.8) 70.2 (46.6, 86.4) 84.7 (80.8, 87.9) 15.4 (12.9, 18.3) 25.2 (19.5, 31.9)
Age (years)
15-24 24.1 (16.2, 34.3) 12.3 (7.9, 18.7) 72.6 (66.7, 77.8) 81.2 (58.7, 92.9) 86.3 (81.1, 90.3) 17.8 (13.7, 22.6) 33.4 (25.5, 42.3)
25-44 20.9 (16.3, 26.4) 8.4 (5.9, 11.6) 72.6 (68.4, 76.3) 80.3 (61.5, 91.2) 83.9 (79.4, 87.5) 12.6 (10.3, 15.4) 28.2 (21.1, 36.5)
45-64 14.4 (9.6, 20.9) 6.3 (4.3, 9.1) 67.6 (61.9, 72.7) -- 86.9 (82.8, 90.1) 8.8 (6.5, 11.9) 15.9 (9.7, 25.0)
65+ 23.7 (12.7, 39.7) 7.9 (3.6, 16.5) 55.4 (39.9, 70.0) -- 75.1 (63.5, 83.9) 19.0 (9.8, 33.5) 19.4 (8.5, 38.4)
Residence
Urban 21.5 (17.0, 26.9) 9.2 (7.0, 12.1) 71.3 (67.4, 75.0) 80.8 (64.1, 90.8) 85.6 (82.0, 88.6) 14.3 (12.1, 16.9) 27.8 (21.9, 34.7)
Rural 15.4 (11.4, 20.6) 7.3 (5.3, 10.0) 69.6 (64.9, 74.0) 63.3 (36.9, 83.6) 82.5 (79.1, 85.4) 10.9 (8.4, 14.1) 29.0 (22.9, 36.0)
Education level2
Less than primary 16.0 (7.7, 30.2) 5.6 (3.1, 10.1) 68.8 (55.3, 79.7) -- 82.4 (73.7, 88.6) 14.2 (8.4, 23.0) 17.4 (10.3, 27.8)
Primary 24.3 (16.6, 34.0) 7.4 (4.8, 11.3) 67.9 (61.6, 73.5) -- 84.3 (78.6, 88.8) 12.3 (9.1, 16.4) 26.1 (17.4, 37.0)
Secondary/high school 17.5 (13.1, 22.9) 8.0 (5.4, 11.8) 72.3 (67.5, 76.6) 88.5 (74.5, 95.3) 85.9 (82.1, 88.9) 10.0 (7.9, 12.6) 26.1 (18.2, 35.8)
College or above 18.4 (11.4, 28.3) 8.9 (4.9, 15.7) 68.4 (60.4, 75.5) -- 80.4 (71.1, 87.3) 15.2 (10.4, 21.7) 17.4 (6.2, 40.1)
Race/ethnicity
Malay 22.6 (18.2, 27.6) 8.8 (6.8, 11.4) 75.1 (71.2, 78.6) 64.1 (40.6, 82.3) 84.0 (80.5, 87.0) 12.7 (10.4, 15.4) 27.9 (21.3, 35.6)
Chinese 12.8 (6.8, 22.8) 7.7 (4.5, 12.7) 58.0 (51.3, 64.5) 86.8 (61.1, 96.5) 88.6 (82.8, 92.6) 14.7 (11.0, 19.4) 21.8 (11.1, 38.4)
Indian 18.3 (9.5, 32.1) 14.9 (7.3, 28.1) 74.8 (65.0, 82.7) -- 79.4 (68.8, 87.1) 17.9 (11.0, 27.6) 35.1 (22.6, 50.1)
Other 16.4 (8.9, 28.2) 3.8 (1.7, 8.6) 69.8 (61.8, 76.7) 65.5 (30.8, 89.0) 87.1 (80.2, 91.9) 12.9 (8.6, 18.8) 28.0 (20.3, 37.4)
Religion
Muslim 22.3 (18.1, 27.1) 8.5 (6.7, 10.8) 74.3 (70.6, 77.7) 61.7 (38.6, 80.4) 84.0 (80.7, 86.9) 12.4 (10.3, 14.9) 27.8 (22.0, 34.4)
Non-Muslim 14.4 (9.4, 21.5) 9.0 (5.8, 13.7) 64.4 (58.8, 69.7) 86.9 (66.6, 95.7) 86.5 (81.9, 90.1) 16.0 (12.6, 20.0) 28.9 (21.1, 38.2) 1 Among those who visited the place in the past 30 days. 2 Education level is reported only for persons aged ≥ 25 years. -- Estimate suppressed because it was based on fewer than 25 unweighted cases.
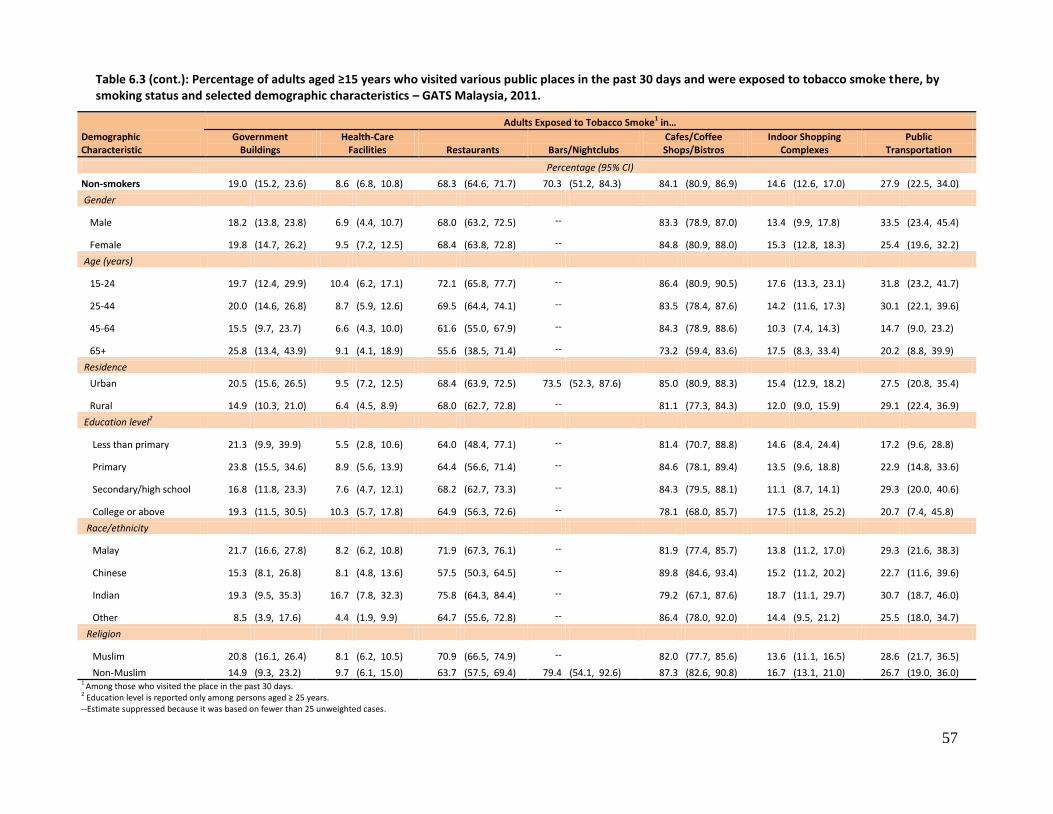
57
Table 6.3 (cont.): Percentage of adults aged ≥15 years who visited various public places in the past 30 days and were exposed to tobacco smoke there, by smoking status and selected demographic characteristics – GATS Malaysia, 2011.
Demographic Characteristic
Adults Exposed to Tobacco Smoke1 in…
Government Buildings
Health-Care Facilities Restaurants Bars/Nightclubs
Cafes/Coffee Shops/Bistros
Indoor Shopping Complexes
Public Transportation
Percentage (95% CI)
Non-smokers 19.0 (15.2, 23.6) 8.6 (6.8, 10.8) 68.3 (64.6, 71.7) 70.3 (51.2, 84.3) 84.1 (80.9, 86.9) 14.6 (12.6, 17.0) 27.9 (22.5, 34.0)
Gender
Male 18.2 (13.8, 23.8) 6.9 (4.4, 10.7) 68.0 (63.2, 72.5) -- 83.3 (78.9, 87.0) 13.4 (9.9, 17.8) 33.5 (23.4, 45.4)
Female 19.8 (14.7, 26.2) 9.5 (7.2, 12.5) 68.4 (63.8, 72.8) -- 84.8 (80.9, 88.0) 15.3 (12.8, 18.3) 25.4 (19.6, 32.2)
Age (years)
15-24 19.7 (12.4, 29.9) 10.4 (6.2, 17.1) 72.1 (65.8, 77.7) -- 86.4 (80.9, 90.5) 17.6 (13.3, 23.1) 31.8 (23.2, 41.7)
25-44 20.0 (14.6, 26.8) 8.7 (5.9, 12.6) 69.5 (64.4, 74.1) -- 83.5 (78.4, 87.6) 14.2 (11.6, 17.3) 30.1 (22.1, 39.6)
45-64 15.5 (9.7, 23.7) 6.6 (4.3, 10.0) 61.6 (55.0, 67.9) -- 84.3 (78.9, 88.6) 10.3 (7.4, 14.3) 14.7 (9.0, 23.2)
65+ 25.8 (13.4, 43.9) 9.1 (4.1, 18.9) 55.6 (38.5, 71.4) -- 73.2 (59.4, 83.6) 17.5 (8.3, 33.4) 20.2 (8.8, 39.9)
Residence
Urban 20.5 (15.6, 26.5) 9.5 (7.2, 12.5) 68.4 (63.9, 72.5) 73.5 (52.3, 87.6) 85.0 (80.9, 88.3) 15.4 (12.9, 18.2) 27.5 (20.8, 35.4)
Rural 14.9 (10.3, 21.0) 6.4 (4.5, 8.9) 68.0 (62.7, 72.8) -- 81.1 (77.3, 84.3) 12.0 (9.0, 15.9) 29.1 (22.4, 36.9)
Education level2
Less than primary 21.3 (9.9, 39.9) 5.5 (2.8, 10.6) 64.0 (48.4, 77.1) -- 81.4 (70.7, 88.8) 14.6 (8.4, 24.4) 17.2 (9.6, 28.8)
Primary 23.8 (15.5, 34.6) 8.9 (5.6, 13.9) 64.4 (56.6, 71.4) -- 84.6 (78.1, 89.4) 13.5 (9.6, 18.8) 22.9 (14.8, 33.6)
Secondary/high school 16.8 (11.8, 23.3) 7.6 (4.7, 12.1) 68.2 (62.7, 73.3) -- 84.3 (79.5, 88.1) 11.1 (8.7, 14.1) 29.3 (20.0, 40.6)
College or above 19.3 (11.5, 30.5) 10.3 (5.7, 17.8) 64.9 (56.3, 72.6) -- 78.1 (68.0, 85.7) 17.5 (11.8, 25.2) 20.7 (7.4, 45.8)
Race/ethnicity
Malay 21.7 (16.6, 27.8) 8.2 (6.2, 10.8) 71.9 (67.3, 76.1) -- 81.9 (77.4, 85.7) 13.8 (11.2, 17.0) 29.3 (21.6, 38.3)
Chinese 15.3 (8.1, 26.8) 8.1 (4.8, 13.6) 57.5 (50.3, 64.5) -- 89.8 (84.6, 93.4) 15.2 (11.2, 20.2) 22.7 (11.6, 39.6)
Indian 19.3 (9.5, 35.3) 16.7 (7.8, 32.3) 75.8 (64.3, 84.4) -- 79.2 (67.1, 87.6) 18.7 (11.1, 29.7) 30.7 (18.7, 46.0)
Other 8.5 (3.9, 17.6) 4.4 (1.9, 9.9) 64.7 (55.6, 72.8) -- 86.4 (78.0, 92.0) 14.4 (9.5, 21.2) 25.5 (18.0, 34.7)
Religion
Muslim 20.8 (16.1, 26.4) 8.1 (6.2, 10.5) 70.9 (66.5, 74.9) -- 82.0 (77.7, 85.6) 13.6 (11.1, 16.5) 28.6 (21.7, 36.5)
Non-Muslim 14.9 (9.3, 23.2) 9.7 (6.1, 15.0) 63.7 (57.5, 69.4) 79.4 (54.1, 92.6) 87.3 (82.6, 90.8) 16.7 (13.1, 21.0) 26.7 (19.0, 36.0) 1
Among those who visited the place in the past 30 days. 2 Education level is reported only among persons aged ≥ 25 years. --Estimate suppressed because it was based on fewer than 25 unweighted cases.
58
6.3.2 Population Exposure to SHS in Various Public Places
Table 6.4 provides the prevalence of SHS exposure for the various public places described in Table 6.3,
but at the population level rather than for those persons who had visited these places.
From highest to lowest, the prevalence of population SHS exposure was 42.9% (38.1% for non-smokers)
in cafes / coffee shops / bistros, 42.1% (39.8%, non-smokers) in restaurants, 8.8% (9.7%, non-smokers)
in indoor shopping complexes, 5.6% (5.9%, non-smokers) in public transportation, 4.9% (4.3%, non-
smokers) in government buildings, 3.4% (3.5%, non-smokers) in health-care facilities, and 2.4% (1.3%,
non-smokers) in bars/nightclubs. The population exposure rates are much lower than the rates shown in
Table 6.3 because many people did not visit the specific places of interest. For example, the prevalence
of SHS exposure for people visiting bars/nightclubs was very high, but because many adults did not go
to bars / nightclubs the prevalence of population SHS exposure was very low. Regardless, the noticeable
finding is that over 40% of the entire adult population was exposed to SHS in restaurants and cafes /
coffee shops / bistros.
An examination by subgroups within the demographic characteristics revealed a few differences, but
they can probably be explained by differences in the frequencies with which the different subgroups
visited various places. Appreciable differences were seen overall between men and women in the
prevalence of population exposure to SHS for each of the public places studied except for public
transportation (5.8% for men, 5.9% for women). Overall, urban adults had higher a population
prevalence of exposure than rural adults in restaurants (46.5% vs. 30.6%), bars / nightclubs (3.0% vs.
0.8%), cafes/coffee shops/bistros (45.6% vs. 35.8%), and indoor shopping complexes (10.1% vs. 5.6%) -
all places that are typically more common in urban areas. An examination of exposure in restaurants by
education levels found a positive relationship with that variable overall (less than primary, 16.3%;
primary, 33.0%; secondary / high school, 45.7%; college or above, 60.2%). Those with higher educational
attainment may be more likely to go to restaurants.
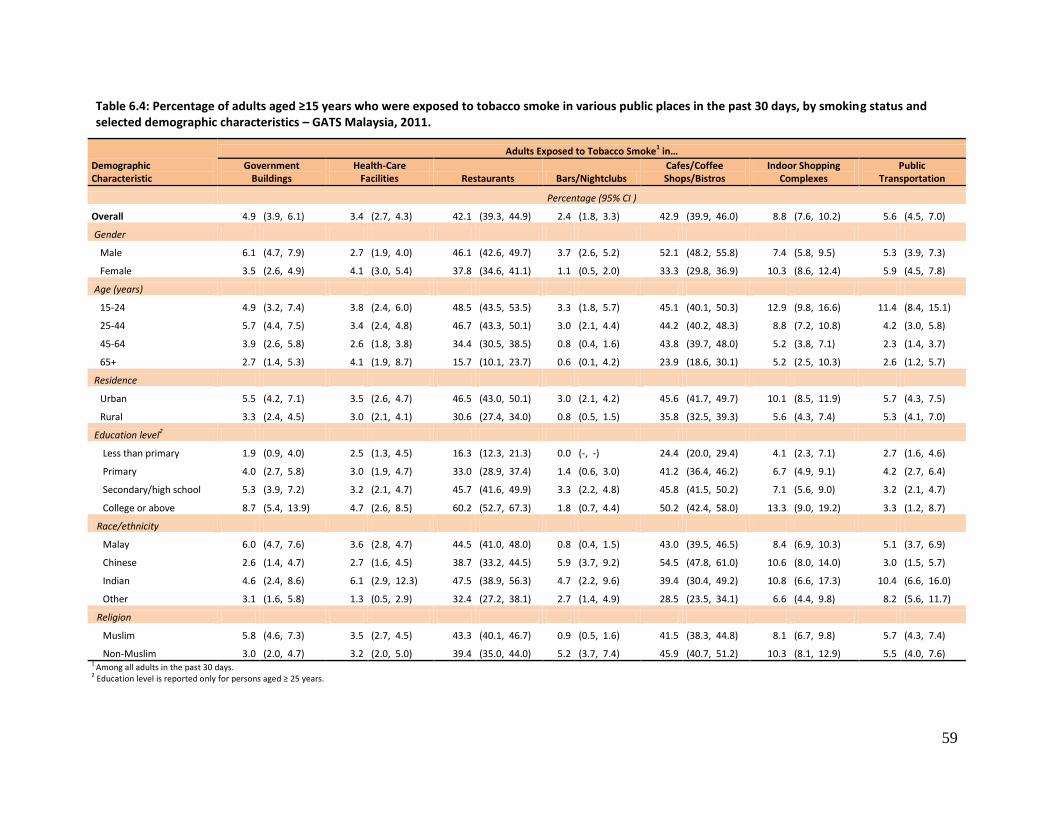
59
Table 6.4: Percentage of adults aged ≥15 years who were exposed to tobacco smoke in various public places in the past 30 days, by smoking status and selected demographic characteristics – GATS Malaysia, 2011.
Demographic Characteristic
Adults Exposed to Tobacco Smoke1 in…
Government Buildings
Health-Care Facilities Restaurants Bars/Nightclubs
Cafes/Coffee Shops/Bistros
Indoor Shopping Complexes
Public Transportation
Percentage (95% CI )
Overall 4.9 (3.9, 6.1) 3.4 (2.7, 4.3) 42.1 (39.3, 44.9) 2.4 (1.8, 3.3) 42.9 (39.9, 46.0) 8.8 (7.6, 10.2) 5.6 (4.5, 7.0)
Gender
Male 6.1 (4.7, 7.9) 2.7 (1.9, 4.0) 46.1 (42.6, 49.7) 3.7 (2.6, 5.2) 52.1 (48.2, 55.8) 7.4 (5.8, 9.5) 5.3 (3.9, 7.3)
Female 3.5 (2.6, 4.9) 4.1 (3.0, 5.4) 37.8 (34.6, 41.1) 1.1 (0.5, 2.0) 33.3 (29.8, 36.9) 10.3 (8.6, 12.4) 5.9 (4.5, 7.8)
Age (years)
15-24 4.9 (3.2, 7.4) 3.8 (2.4, 6.0) 48.5 (43.5, 53.5) 3.3 (1.8, 5.7) 45.1 (40.1, 50.3) 12.9 (9.8, 16.6) 11.4 (8.4, 15.1)
25-44 5.7 (4.4, 7.5) 3.4 (2.4, 4.8) 46.7 (43.3, 50.1) 3.0 (2.1, 4.4) 44.2 (40.2, 48.3) 8.8 (7.2, 10.8) 4.2 (3.0, 5.8)
45-64 3.9 (2.6, 5.8) 2.6 (1.8, 3.8) 34.4 (30.5, 38.5) 0.8 (0.4, 1.6) 43.8 (39.7, 48.0) 5.2 (3.8, 7.1) 2.3 (1.4, 3.7)
65+ 2.7 (1.4, 5.3) 4.1 (1.9, 8.7) 15.7 (10.1, 23.7) 0.6 (0.1, 4.2) 23.9 (18.6, 30.1) 5.2 (2.5, 10.3) 2.6 (1.2, 5.7)
Residence
Urban 5.5 (4.2, 7.1) 3.5 (2.6, 4.7) 46.5 (43.0, 50.1) 3.0 (2.1, 4.2) 45.6 (41.7, 49.7) 10.1 (8.5, 11.9) 5.7 (4.3, 7.5)
Rural 3.3 (2.4, 4.5) 3.0 (2.1, 4.1) 30.6 (27.4, 34.0) 0.8 (0.5, 1.5) 35.8 (32.5, 39.3) 5.6 (4.3, 7.4) 5.3 (4.1, 7.0)
Education level2
Less than primary 1.9 (0.9, 4.0) 2.5 (1.3, 4.5) 16.3 (12.3, 21.3) 0.0 (-, -) 24.4 (20.0, 29.4) 4.1 (2.3, 7.1) 2.7 (1.6, 4.6)
Primary 4.0 (2.7, 5.8) 3.0 (1.9, 4.7) 33.0 (28.9, 37.4) 1.4 (0.6, 3.0) 41.2 (36.4, 46.2) 6.7 (4.9, 9.1) 4.2 (2.7, 6.4)
Secondary/high school 5.3 (3.9, 7.2) 3.2 (2.1, 4.7) 45.7 (41.6, 49.9) 3.3 (2.2, 4.8) 45.8 (41.5, 50.2) 7.1 (5.6, 9.0) 3.2 (2.1, 4.7)
College or above 8.7 (5.4, 13.9) 4.7 (2.6, 8.5) 60.2 (52.7, 67.3) 1.8 (0.7, 4.4) 50.2 (42.4, 58.0) 13.3 (9.0, 19.2) 3.3 (1.2, 8.7)
Race/ethnicity
Malay 6.0 (4.7, 7.6) 3.6 (2.8, 4.7) 44.5 (41.0, 48.0) 0.8 (0.4, 1.5) 43.0 (39.5, 46.5) 8.4 (6.9, 10.3) 5.1 (3.7, 6.9)
Chinese 2.6 (1.4, 4.7) 2.7 (1.6, 4.5) 38.7 (33.2, 44.5) 5.9 (3.7, 9.2) 54.5 (47.8, 61.0) 10.6 (8.0, 14.0) 3.0 (1.5, 5.7)
Indian 4.6 (2.4, 8.6) 6.1 (2.9, 12.3) 47.5 (38.9, 56.3) 4.7 (2.2, 9.6) 39.4 (30.4, 49.2) 10.8 (6.6, 17.3) 10.4 (6.6, 16.0)
Other 3.1 (1.6, 5.8) 1.3 (0.5, 2.9) 32.4 (27.2, 38.1) 2.7 (1.4, 4.9) 28.5 (23.5, 34.1) 6.6 (4.4, 9.8) 8.2 (5.6, 11.7)
Religion
Muslim 5.8 (4.6, 7.3) 3.5 (2.7, 4.5) 43.3 (40.1, 46.7) 0.9 (0.5, 1.6) 41.5 (38.3, 44.8) 8.1 (6.7, 9.8) 5.7 (4.3, 7.4)
Non-Muslim 3.0 (2.0, 4.7) 3.2 (2.0, 5.0) 39.4 (35.0, 44.0) 5.2 (3.7, 7.4) 45.9 (40.7, 51.2) 10.3 (8.1, 12.9) 5.5 (4.0, 7.6) 1 Among all adults in the past 30 days. 2 Education level is reported only for persons aged ≥ 25 years.
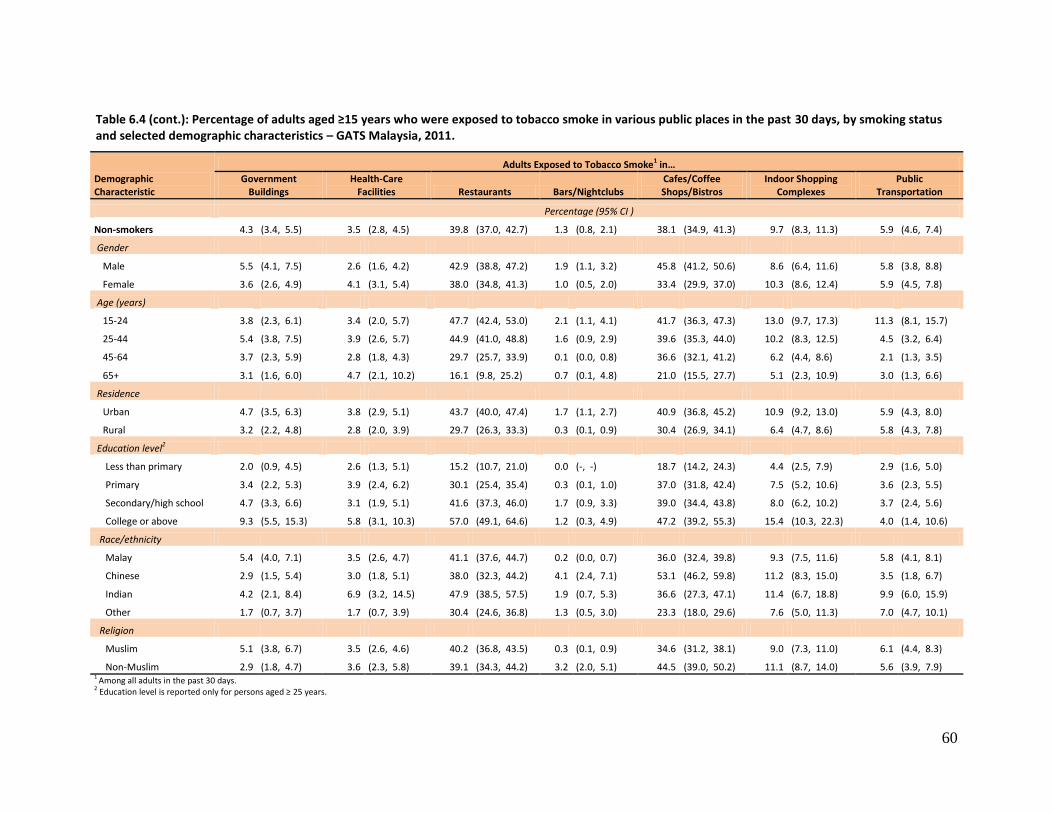
60
Table 6.4 (cont.): Percentage of adults aged ≥15 years who were exposed to tobacco smoke in various public places in the past 30 days, by smoking status and selected demographic characteristics – GATS Malaysia, 2011.
Demographic Characteristic
Adults Exposed to Tobacco Smoke1 in…
Government Buildings
Health-Care Facilities Restaurants Bars/Nightclubs
Cafes/Coffee Shops/Bistros
Indoor Shopping Complexes
Public Transportation
Percentage (95% CI )
Non-smokers 4.3 (3.4, 5.5) 3.5 (2.8, 4.5) 39.8 (37.0, 42.7) 1.3 (0.8, 2.1) 38.1 (34.9, 41.3) 9.7 (8.3, 11.3) 5.9 (4.6, 7.4)
Gender
Male 5.5 (4.1, 7.5) 2.6 (1.6, 4.2) 42.9 (38.8, 47.2) 1.9 (1.1, 3.2) 45.8 (41.2, 50.6) 8.6 (6.4, 11.6) 5.8 (3.8, 8.8)
Female 3.6 (2.6, 4.9) 4.1 (3.1, 5.4) 38.0 (34.8, 41.3) 1.0 (0.5, 2.0) 33.4 (29.9, 37.0) 10.3 (8.6, 12.4) 5.9 (4.5, 7.8)
Age (years)
15-24 3.8 (2.3, 6.1) 3.4 (2.0, 5.7) 47.7 (42.4, 53.0) 2.1 (1.1, 4.1) 41.7 (36.3, 47.3) 13.0 (9.7, 17.3) 11.3 (8.1, 15.7)
25-44 5.4 (3.8, 7.5) 3.9 (2.6, 5.7) 44.9 (41.0, 48.8) 1.6 (0.9, 2.9) 39.6 (35.3, 44.0) 10.2 (8.3, 12.5) 4.5 (3.2, 6.4)
45-64 3.7 (2.3, 5.9) 2.8 (1.8, 4.3) 29.7 (25.7, 33.9) 0.1 (0.0, 0.8) 36.6 (32.1, 41.2) 6.2 (4.4, 8.6) 2.1 (1.3, 3.5)
65+ 3.1 (1.6, 6.0) 4.7 (2.1, 10.2) 16.1 (9.8, 25.2) 0.7 (0.1, 4.8) 21.0 (15.5, 27.7) 5.1 (2.3, 10.9) 3.0 (1.3, 6.6)
Residence
Urban 4.7 (3.5, 6.3) 3.8 (2.9, 5.1) 43.7 (40.0, 47.4) 1.7 (1.1, 2.7) 40.9 (36.8, 45.2) 10.9 (9.2, 13.0) 5.9 (4.3, 8.0)
Rural 3.2 (2.2, 4.8) 2.8 (2.0, 3.9) 29.7 (26.3, 33.3) 0.3 (0.1, 0.9) 30.4 (26.9, 34.1) 6.4 (4.7, 8.6) 5.8 (4.3, 7.8)
Education level2
Less than primary 2.0 (0.9, 4.5) 2.6 (1.3, 5.1) 15.2 (10.7, 21.0) 0.0 (-, -) 18.7 (14.2, 24.3) 4.4 (2.5, 7.9) 2.9 (1.6, 5.0)
Primary 3.4 (2.2, 5.3) 3.9 (2.4, 6.2) 30.1 (25.4, 35.4) 0.3 (0.1, 1.0) 37.0 (31.8, 42.4) 7.5 (5.2, 10.6) 3.6 (2.3, 5.5)
Secondary/high school 4.7 (3.3, 6.6) 3.1 (1.9, 5.1) 41.6 (37.3, 46.0) 1.7 (0.9, 3.3) 39.0 (34.4, 43.8) 8.0 (6.2, 10.2) 3.7 (2.4, 5.6)
College or above 9.3 (5.5, 15.3) 5.8 (3.1, 10.3) 57.0 (49.1, 64.6) 1.2 (0.3, 4.9) 47.2 (39.2, 55.3) 15.4 (10.3, 22.3) 4.0 (1.4, 10.6)
Race/ethnicity
Malay 5.4 (4.0, 7.1) 3.5 (2.6, 4.7) 41.1 (37.6, 44.7) 0.2 (0.0, 0.7) 36.0 (32.4, 39.8) 9.3 (7.5, 11.6) 5.8 (4.1, 8.1)
Chinese 2.9 (1.5, 5.4) 3.0 (1.8, 5.1) 38.0 (32.3, 44.2) 4.1 (2.4, 7.1) 53.1 (46.2, 59.8) 11.2 (8.3, 15.0) 3.5 (1.8, 6.7)
Indian 4.2 (2.1, 8.4) 6.9 (3.2, 14.5) 47.9 (38.5, 57.5) 1.9 (0.7, 5.3) 36.6 (27.3, 47.1) 11.4 (6.7, 18.8) 9.9 (6.0, 15.9)
Other 1.7 (0.7, 3.7) 1.7 (0.7, 3.9) 30.4 (24.6, 36.8) 1.3 (0.5, 3.0) 23.3 (18.0, 29.6) 7.6 (5.0, 11.3) 7.0 (4.7, 10.1)
Religion
Muslim 5.1 (3.8, 6.7) 3.5 (2.6, 4.6) 40.2 (36.8, 43.5) 0.3 (0.1, 0.9) 34.6 (31.2, 38.1) 9.0 (7.3, 11.0) 6.1 (4.4, 8.3)
Non-Muslim 2.9 (1.8, 4.7) 3.6 (2.3, 5.8) 39.1 (34.3, 44.2) 3.2 (2.0, 5.1) 44.5 (39.0, 50.2) 11.1 (8.7, 14.0) 5.6 (3.9, 7.9) 1 Among all adults in the past 30 days. 2 Education level is reported only for persons aged ≥ 25 years.
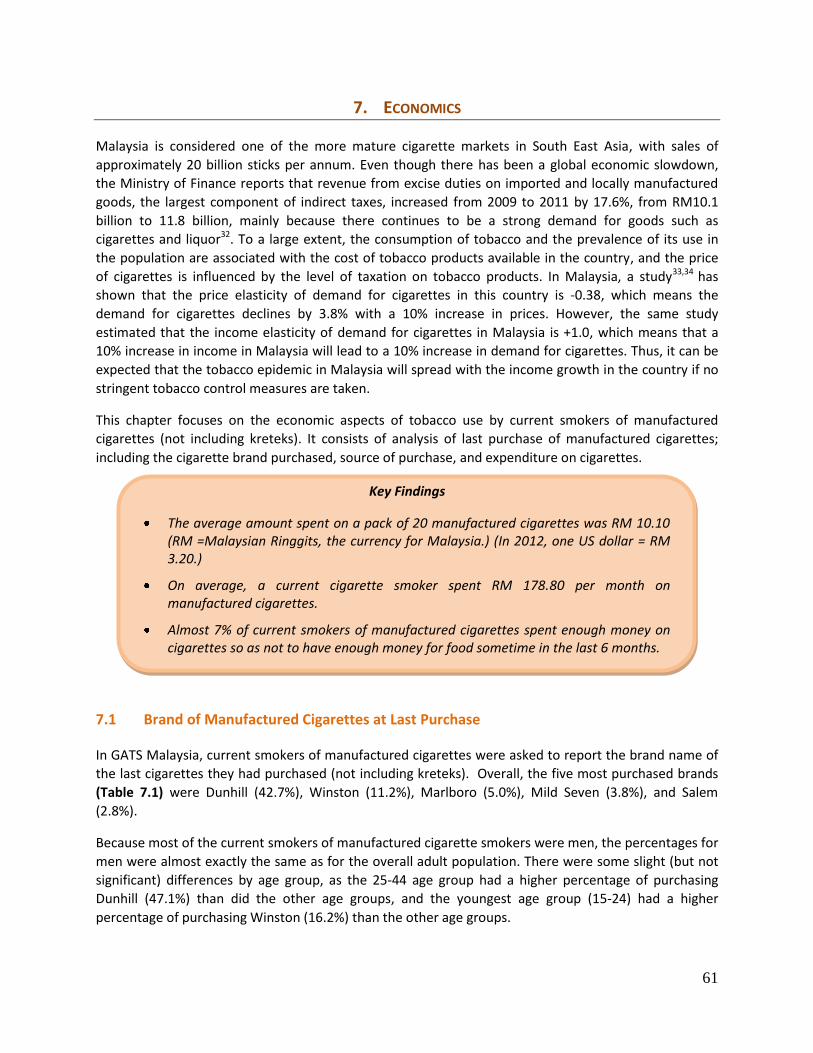
61
7. ECONOMICS
Malaysia is considered one of the more mature cigarette markets in South East Asia, with sales of
approximately 20 billion sticks per annum. Even though there has been a global economic slowdown,
the Ministry of Finance reports that revenue from excise duties on imported and locally manufactured
goods, the largest component of indirect taxes, increased from 2009 to 2011 by 17.6%, from RM10.1
billion to 11.8 billion, mainly because there continues to be a strong demand for goods such as
cigarettes and liquor32. To a large extent, the consumption of tobacco and the prevalence of its use in
the population are associated with the cost of tobacco products available in the country, and the price
of cigarettes is influenced by the level of taxation on tobacco products. In Malaysia, a study33,34 has
shown that the price elasticity of demand for cigarettes in this country is -0.38, which means the
demand for cigarettes declines by 3.8% with a 10% increase in prices. However, the same study
estimated that the income elasticity of demand for cigarettes in Malaysia is +1.0, which means that a
10% increase in income in Malaysia will lead to a 10% increase in demand for cigarettes. Thus, it can be
expected that the tobacco epidemic in Malaysia will spread with the income growth in the country if no
stringent tobacco control measures are taken.
This chapter focuses on the economic aspects of tobacco use by current smokers of manufactured
cigarettes (not including kreteks). It consists of analysis of last purchase of manufactured cigarettes;
including the cigarette brand purchased, source of purchase, and expenditure on cigarettes.
Key Findings
The average amount spent on a pack of 20 manufactured cigarettes was RM 10.10 (RM =Malaysian Ringgits, the currency for Malaysia.) (In 2012, one US dollar = RM 3.20.)
On average, a current cigarette smoker spent RM 178.80 per month on manufactured cigarettes.
Almost 7% of current smokers of manufactured cigarettes spent enough money on cigarettes so as not to have enough money for food sometime in the last 6 months.
7.1 Brand of Manufactured Cigarettes at Last Purchase
In GATS Malaysia, current smokers of manufactured cigarettes were asked to report the brand name of
the last cigarettes they had purchased (not including kreteks). Overall, the five most purchased brands
(Table 7.1) were Dunhill (42.7%), Winston (11.2%), Marlboro (5.0%), Mild Seven (3.8%), and Salem
(2.8%).
Because most of the current smokers of manufactured cigarette smokers were men, the percentages for
men were almost exactly the same as for the overall adult population. There were some slight (but not
significant) differences by age group, as the 25-44 age group had a higher percentage of purchasing
Dunhill (47.1%) than did the other age groups, and the youngest age group (15-24) had a higher
percentage of purchasing Winston (16.2%) than the other age groups.
62
The patterns of purchasing brands were different between urban and rural residents, as rural cigarette
smokers bought various other brands. A higher percentage of those with a higher level of education
generally bought Dunhill, Winston, and Marlboro than did those with lower levels of education,
although the differences were not statistically significant.
7.2 Source of Last Purchase of Cigarettes
The most common source of the last purchase of manufactured cigarettes (not including kreteks) (Table
7.2) was grocery stores (79.6%), followed by convenience stores/kiosks (6.5%), petrol stations (5.9%),
and roadside shops (3.5%). Within demographic subgroups, the only noticeable difference was by
residence, as rural residents (88.7%) were more likely to buy manufactured cigarettes from grocery
stores than were urban residents (76.3%), while the percent of urban residents buying from
convenience stores/kiosks was higher than for rural residents (7.9% vs. 2.7%).
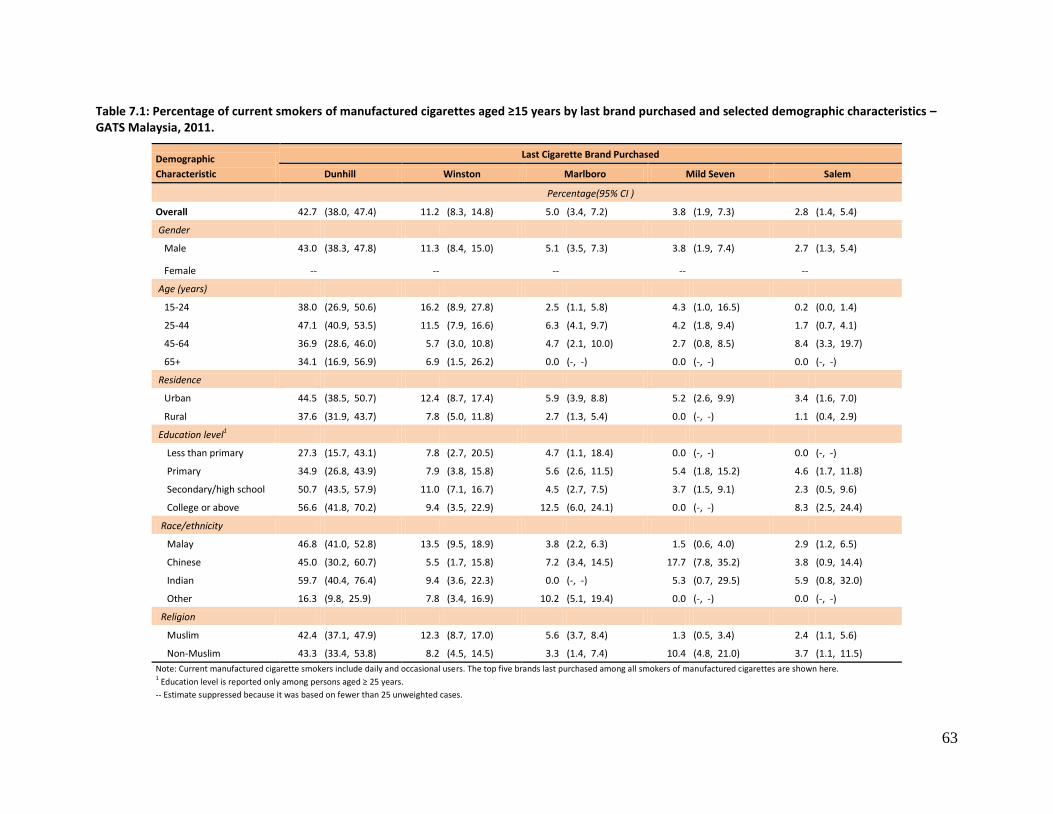
63
Table 7.1: Percentage of current smokers of manufactured cigarettes aged ≥15 years by last brand purchased and selected demographic characteristics – GATS Malaysia, 2011.
Demographic
Characteristic
Last Cigarette Brand Purchased
Dunhill Winston Marlboro Mild Seven Salem
Percentage(95% CI )
Overall 42.7 (38.0, 47.4) 11.2 (8.3, 14.8) 5.0 (3.4, 7.2) 3.8 (1.9, 7.3) 2.8 (1.4, 5.4)
Gender
Male 43.0 (38.3, 47.8) 11.3 (8.4, 15.0) 5.1 (3.5, 7.3) 3.8 (1.9, 7.4) 2.7 (1.3, 5.4)
Female -- -- -- -- --
Age (years)
15-24 38.0 (26.9, 50.6) 16.2 (8.9, 27.8) 2.5 (1.1, 5.8) 4.3 (1.0, 16.5) 0.2 (0.0, 1.4)
25-44 47.1 (40.9, 53.5) 11.5 (7.9, 16.6) 6.3 (4.1, 9.7) 4.2 (1.8, 9.4) 1.7 (0.7, 4.1)
45-64 36.9 (28.6, 46.0) 5.7 (3.0, 10.8) 4.7 (2.1, 10.0) 2.7 (0.8, 8.5) 8.4 (3.3, 19.7)
65+ 34.1 (16.9, 56.9) 6.9 (1.5, 26.2) 0.0 (-, -) 0.0 (-, -) 0.0 (-, -)
Residence
Urban 44.5 (38.5, 50.7) 12.4 (8.7, 17.4) 5.9 (3.9, 8.8) 5.2 (2.6, 9.9) 3.4 (1.6, 7.0)
Rural 37.6 (31.9, 43.7) 7.8 (5.0, 11.8) 2.7 (1.3, 5.4) 0.0 (-, -) 1.1 (0.4, 2.9)
Education level1
Less than primary 27.3 (15.7, 43.1) 7.8 (2.7, 20.5) 4.7 (1.1, 18.4) 0.0 (-, -) 0.0 (-, -)
Primary 34.9 (26.8, 43.9) 7.9 (3.8, 15.8) 5.6 (2.6, 11.5) 5.4 (1.8, 15.2) 4.6 (1.7, 11.8)
Secondary/high school 50.7 (43.5, 57.9) 11.0 (7.1, 16.7) 4.5 (2.7, 7.5) 3.7 (1.5, 9.1) 2.3 (0.5, 9.6)
College or above 56.6 (41.8, 70.2) 9.4 (3.5, 22.9) 12.5 (6.0, 24.1) 0.0 (-, -) 8.3 (2.5, 24.4)
Race/ethnicity
Malay 46.8 (41.0, 52.8) 13.5 (9.5, 18.9) 3.8 (2.2, 6.3) 1.5 (0.6, 4.0) 2.9 (1.2, 6.5)
Chinese 45.0 (30.2, 60.7) 5.5 (1.7, 15.8) 7.2 (3.4, 14.5) 17.7 (7.8, 35.2) 3.8 (0.9, 14.4)
Indian 59.7 (40.4, 76.4) 9.4 (3.6, 22.3) 0.0 (-, -) 5.3 (0.7, 29.5) 5.9 (0.8, 32.0)
Other 16.3 (9.8, 25.9) 7.8 (3.4, 16.9) 10.2 (5.1, 19.4) 0.0 (-, -) 0.0 (-, -)
Religion
Muslim 42.4 (37.1, 47.9) 12.3 (8.7, 17.0) 5.6 (3.7, 8.4) 1.3 (0.5, 3.4) 2.4 (1.1, 5.6)
Non-Muslim 43.3 (33.4, 53.8) 8.2 (4.5, 14.5) 3.3 (1.4, 7.4) 10.4 (4.8, 21.0) 3.7 (1.1, 11.5)
Note: Current manufactured cigarette smokers include daily and occasional users. The top five brands last purchased among all smokers of manufactured cigarettes are shown here. 1 Education level is reported only among persons aged ≥ 25 years.
-- Estimate suppressed because it was based on fewer than 25 unweighted cases.
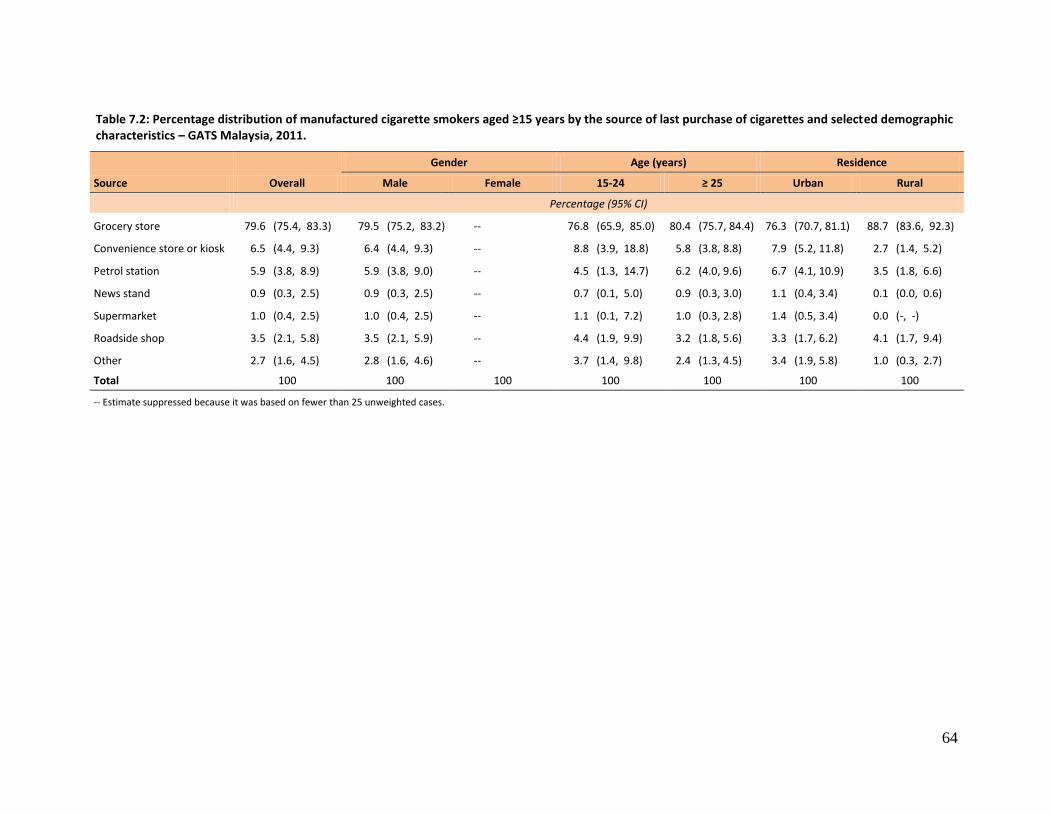
64
Table 7.2: Percentage distribution of manufactured cigarette smokers aged ≥15 years by the source of last purchase of cigarettes and selected demographic characteristics – GATS Malaysia, 2011.
Source Overall
Gender Age (years) Residence
Male Female 15-24 ≥ 25 Urban Rural
Percentage (95% CI)
Grocery store 79.6 (75.4, 83.3) 79.5 (75.2, 83.2) -- 76.8 (65.9, 85.0) 80.4 (75.7, 84.4) 76.3 (70.7, 81.1) 88.7 (83.6, 92.3)
Convenience store or kiosk 6.5 (4.4, 9.3) 6.4 (4.4, 9.3) -- 8.8 (3.9, 18.8) 5.8 (3.8, 8.8) 7.9 (5.2, 11.8) 2.7 (1.4, 5.2)
Petrol station 5.9 (3.8, 8.9) 5.9 (3.8, 9.0) -- 4.5 (1.3, 14.7) 6.2 (4.0, 9.6) 6.7 (4.1, 10.9) 3.5 (1.8, 6.6)
News stand 0.9 (0.3, 2.5) 0.9 (0.3, 2.5) -- 0.7 (0.1, 5.0) 0.9 (0.3, 3.0) 1.1 (0.4, 3.4) 0.1 (0.0, 0.6)
Supermarket 1.0 (0.4, 2.5) 1.0 (0.4, 2.5) -- 1.1 (0.1, 7.2) 1.0 (0.3, 2.8) 1.4 (0.5, 3.4) 0.0 (-, -)
Roadside shop 3.5 (2.1, 5.8) 3.5 (2.1, 5.9) -- 4.4 (1.9, 9.9) 3.2 (1.8, 5.6) 3.3 (1.7, 6.2) 4.1 (1.7, 9.4)
Other 2.7 (1.6, 4.5) 2.8 (1.6, 4.6) -- 3.7 (1.4, 9.8) 2.4 (1.3, 4.5) 3.4 (1.9, 5.8) 1.0 (0.3, 2.7)
Total 100 100 100 100 100 100 100
-- Estimate suppressed because it was based on fewer than 25 unweighted cases.
65
7.3 Expenditures on Cigarettes
Information was collected from current smokers of manufactured cigarettes on the amount of
money they had spent on their last purchase of manufactured cigarettes (not including kreteks). Two
indicators were calculated from this information: 1) average cost (amount spent) of 20
manufactured cigarettes (one pack), and 2) average expenditure for manufactured cigarettes per
month. Average expenditure was calculated using both cost and consumption data (i.e., cigarettes
smoked per day) previously presented. In addition, current smokers of manufactured cigarettes
were asked whether there was any time during the last 6 months where spending money on
cigarettes resulted in their not having enough money to buy food. Table 7.3 presents the results for
these three indicators.
Overall, the mean amount spent per pack of 20 manufactured cigarettes was RM 10.10. The findings
were not statistically different by age, residence, education, race/ethnicity, or religion.
Another economic indicator (not provided in the tables) that was calculated for Malaysia was the
cost of 100 packs of manufactured cigarettes as a percentage of per capita Gross Domestic Product
(GDP) in 2011. This indicator provides a relative sense of how affordable cigarettes are in the
country. Calculating the average cost of 100 packs of manufactured cigarettes and factoring in the
per capita GDP as of September 2011 (RM 28,866)32 suggests that 3.5% of the GDP was spent on the
purchase of manufactured cigarettes in 2011.
On average, a current smoker of manufactured cigarettes spent RM 178.80 per month on
manufactured cigarettes. The average amounts spent per month by age groups are as follows: 15−24
(RM130.50), 25-44 (RM 192.50), 45-64 (RM 202.30), and ≥65 (RM 100.30). Those in urban areas (RM
202.00) spent more than those in rural areas (RM 116.10).
Finally, the results showed that for 6.8% of current smokers of manufactured cigarettes, spending
money on cigarettes resulted in their not having enough money for food sometime in the last 6
months. The highest percentages of not having enough money for food sometime in the last 6
months because of spending money to purchase manufactured cigarettes were found among the
15-24 age group (13.1%), urban residents (6.8%), those with less than primary education (7.6%),
Malays (7.8%), and Muslims (7.6%), though these findings were not statistically significant in each of
the demographic characteristics.
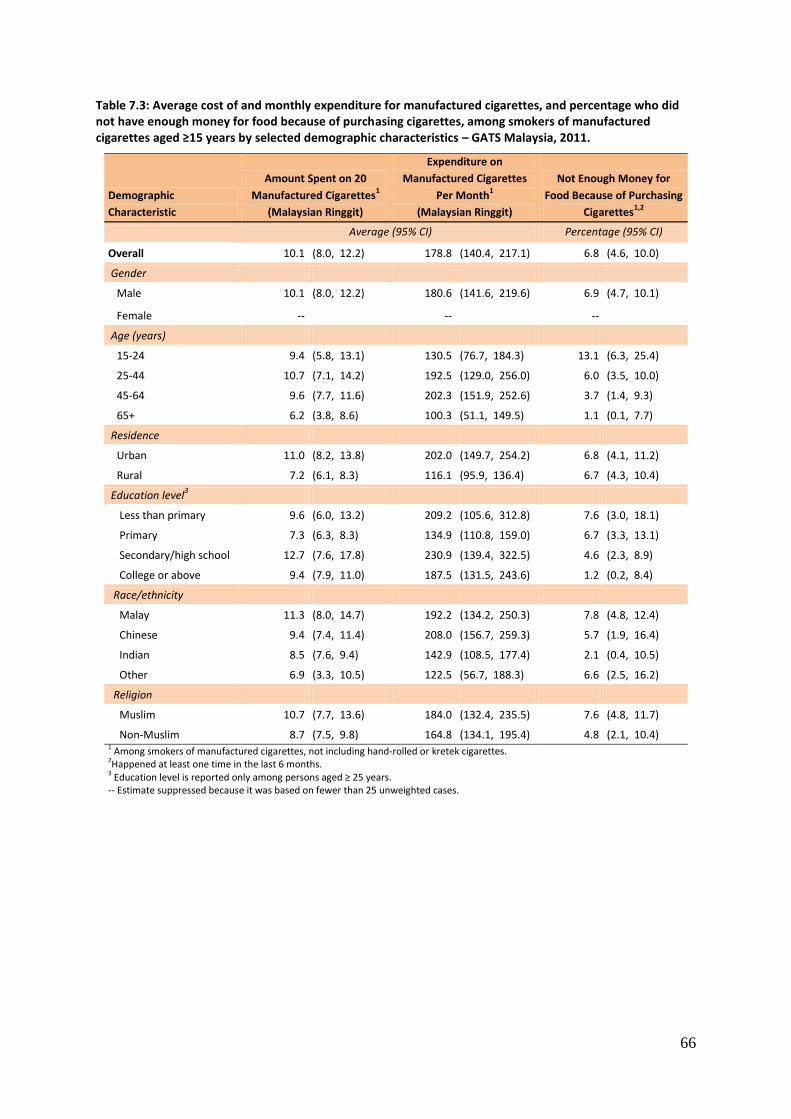
66
Table 7.3: Average cost of and monthly expenditure for manufactured cigarettes, and percentage who did not have enough money for food because of purchasing cigarettes, among smokers of manufactured cigarettes aged ≥15 years by selected demographic characteristics – GATS Malaysia, 2011.
Demographic
Characteristic
Amount Spent on 20
Manufactured Cigarettes1
(Malaysian Ringgit)
Expenditure on
Manufactured Cigarettes
Per Month1
(Malaysian Ringgit)
Not Enough Money for
Food Because of Purchasing
Cigarettes1,2
Average (95% CI) Percentage (95% CI)
Overall 10.1 (8.0, 12.2) 178.8 (140.4, 217.1) 6.8 (4.6, 10.0)
Gender
Male 10.1 (8.0, 12.2) 180.6 (141.6, 219.6) 6.9 (4.7, 10.1)
Female -- -- --
Age (years)
15-24 9.4 (5.8, 13.1) 130.5 (76.7, 184.3) 13.1 (6.3, 25.4)
25-44 10.7 (7.1, 14.2) 192.5 (129.0, 256.0) 6.0 (3.5, 10.0)
45-64 9.6 (7.7, 11.6) 202.3 (151.9, 252.6) 3.7 (1.4, 9.3)
65+ 6.2 (3.8, 8.6) 100.3 (51.1, 149.5) 1.1 (0.1, 7.7)
Residence
Urban 11.0 (8.2, 13.8) 202.0 (149.7, 254.2) 6.8 (4.1, 11.2)
Rural 7.2 (6.1, 8.3) 116.1 (95.9, 136.4) 6.7 (4.3, 10.4)
Education level3
Less than primary 9.6 (6.0, 13.2) 209.2 (105.6, 312.8) 7.6 (3.0, 18.1)
Primary 7.3 (6.3, 8.3) 134.9 (110.8, 159.0) 6.7 (3.3, 13.1)
Secondary/high school 12.7 (7.6, 17.8) 230.9 (139.4, 322.5) 4.6 (2.3, 8.9)
College or above 9.4 (7.9, 11.0) 187.5 (131.5, 243.6) 1.2 (0.2, 8.4)
Race/ethnicity
Malay 11.3 (8.0, 14.7) 192.2 (134.2, 250.3) 7.8 (4.8, 12.4)
Chinese 9.4 (7.4, 11.4) 208.0 (156.7, 259.3) 5.7 (1.9, 16.4)
Indian 8.5 (7.6, 9.4) 142.9 (108.5, 177.4) 2.1 (0.4, 10.5)
Other 6.9 (3.3, 10.5) 122.5 (56.7, 188.3) 6.6 (2.5, 16.2)
Religion
Muslim 10.7 (7.7, 13.6) 184.0 (132.4, 235.5) 7.6 (4.8, 11.7)
Non-Muslim 8.7 (7.5, 9.8) 164.8 (134.1, 195.4) 4.8 (2.1, 10.4) 1 Among smokers of manufactured cigarettes, not including hand-rolled or kretek cigarettes. 2Happened at least one time in the last 6 months.
3 Education level is reported only among persons aged ≥ 25 years. -- Estimate suppressed because it was based on fewer than 25 unweighted cases.

8.
67
8. MEDIA
The mass media play an extremely important role in the advertising, sponsorship, and promotion of
tobacco products. Correspondingly, mass media campaigns are an effective means of disseminating
information on the ill effects of tobacco and discouraging the use of tobacco products. The Malaysia
Control of Tobacco Product Regulations (CTPR) 2004 provides for a ban on direct and indirect
advertising (with the exception of at point-of-sale) of tobacco products and the mandatory display of
‘pictorial health warnings’ on all tobacco products that covers 40% and 60% of the principal display
area of the front and back panels, respectively of each package of tobacco products.5 The mass
media campaign carried out under Malaysia’s National Tobacco Control Programme focuses on the
dissemination of information regarding the ill effects of tobacco use (smoking) as well as of exposure
to secondhand smoke35.
This chapter, which presents information on the exposure of adults in Malaysia to anti-cigarette
information, is organized into six sections: The first section deals with the levels of adults who
noticed anti-cigarette information disseminated through various mass media channels, while the
second section concerns awareness of the “TAK NAK” anti-smoking campaign. The third section
deals with the extent of awareness of health warnings on cigarette packages and of considering
quitting because of the warning labels, while the fourth section concerns levels of thinking about the
health risks of smoking from seeing the health warnings. The fifth section concerns the effect of
health warnings on preventing smoking, and the sixth and final section deals with noticing cigarette
marketing.
Key Findings
94.0% of adults (93.6% current smokers) noticed anti-cigarette information in the last 30 days.
45.8% of current smokers thought about quitting because they noticed a warning label on a cigarette package.
25.3% of current smokers did not think at all about the health risks of smoking after seeing health warnings.
35.6% of adults (33.8% of non-smokers) noticed cigarette advertisements or promotions in the last 30 days.
8.1 Noticing Anti-cigarette Information
In GATS Malaysia, all respondents were asked whether they had noticed any anti-cigarette smoking
information in various places during the last 30 days before the survey in various places. The
question was asked separately for each form of media, such as newspapers or in magazines,
television or radio, on billboards, posters, at cinemas, on windows or inside shops/stalls where
cigarettes were bought, on the Internet, somewhere else, and at any other location. This section
presents exposure to anti-cigarette information in different forms of mass media among men and
women in urban and rural residences in Malaysia. In interpreting these tables it is important to
consider that exposure to anti-cigarette information or messages depends upon two factors: the
exposure of individuals to different mass media as well as the extent of display of anti-tobacco or
anti-cigarette information or messages in each of the mass media.
68
As Table 8.1 indicates, well over 90% (94.0%) of Malaysian adults had noticed anti-cigarette
information at any location in the last 30 days prior to the survey. The proportion of adults who
noticed such information was essentially the same (94.1%) among non-smokers (includes former
and never smokers) and current smokers (93.6%) (includes daily and occasional [less than daily]
smokers).
The proportion of adults who noticed anti-cigarette information differed very little overall between
urban (93.7%) and rural (94.8%) residents. In addition, there was little difference by residence
between current smokers (92.8% of urban, 95.5% of rural) and non-smokers (93.9% of urban, 94.6%
of rural) in noticing this information.
Just under half (47.8%) of adults noticed anti-cigarette information on the radio, but 85.2% noticed it
on television. Men (47.2%, 84.0%) and women (48.5%, 86.5%) were quite similar in the percentages
who noticed anti-cigarette information on the radio and television, respectively.
The highest proportion of adults noticing anti-cigarette information was found for television or the
radio (87.1%), followed by billboards (72.0%), posters (70.4%), on windows or inside shops/stalls
where cigarettes are bought (53.3%), at cinemas (20.3%), and on the Internet (17.7%).
Men (93.5%) and women (94.5%) were similar in noticing anti-cigarette information, while younger
people (15−24) had a slightly higher prevalence than those 25+ (96.2% vs. 93.1%). Among current
smokers, the prevalence was slightly higher for men than women (93.7% vs. 90.2%), but among non-
smokers there was no difference (94.5% women vs. 93.3% men). The percent of both current
smokers and non-smokers noticing anti-cigarette information was above 90.0% overall for both
genders, both age groups, and both residential categories.
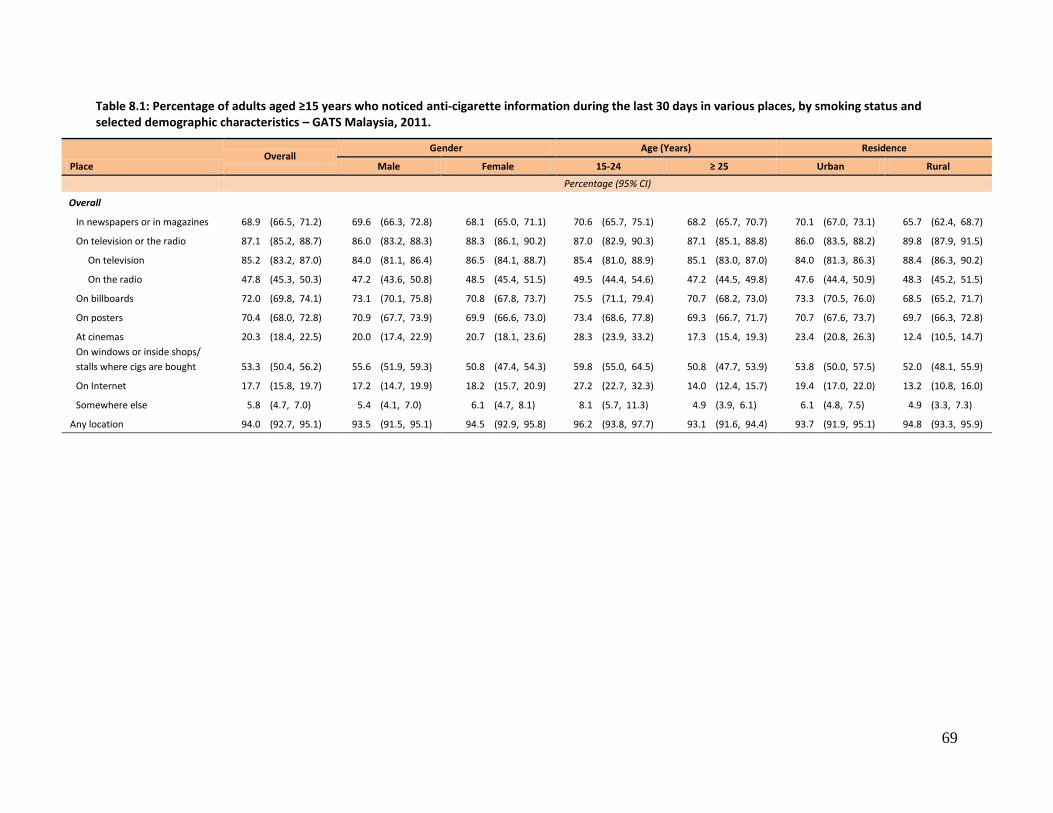
69
Table 8.1: Percentage of adults aged ≥15 years who noticed anti-cigarette information during the last 30 days in various places, by smoking status and selected demographic characteristics – GATS Malaysia, 2011.
Place Overall
Gender Age (Years) Residence
Male Female 15-24 ≥ 25 Urban Rural
Percentage (95% CI)
Overall
In newspapers or in magazines 68.9 (66.5, 71.2) 69.6 (66.3, 72.8) 68.1 (65.0, 71.1) 70.6 (65.7, 75.1) 68.2 (65.7, 70.7) 70.1 (67.0, 73.1) 65.7 (62.4, 68.7)
On television or the radio 87.1 (85.2, 88.7) 86.0 (83.2, 88.3) 88.3 (86.1, 90.2) 87.0 (82.9, 90.3) 87.1 (85.1, 88.8) 86.0 (83.5, 88.2) 89.8 (87.9, 91.5)
On television 85.2 (83.2, 87.0) 84.0 (81.1, 86.4) 86.5 (84.1, 88.7) 85.4 (81.0, 88.9) 85.1 (83.0, 87.0) 84.0 (81.3, 86.3) 88.4 (86.3, 90.2)
On the radio 47.8 (45.3, 50.3) 47.2 (43.6, 50.8) 48.5 (45.4, 51.5) 49.5 (44.4, 54.6) 47.2 (44.5, 49.8) 47.6 (44.4, 50.9) 48.3 (45.2, 51.5)
On billboards 72.0 (69.8, 74.1) 73.1 (70.1, 75.8) 70.8 (67.8, 73.7) 75.5 (71.1, 79.4) 70.7 (68.2, 73.0) 73.3 (70.5, 76.0) 68.5 (65.2, 71.7)
On posters 70.4 (68.0, 72.8) 70.9 (67.7, 73.9) 69.9 (66.6, 73.0) 73.4 (68.6, 77.8) 69.3 (66.7, 71.7) 70.7 (67.6, 73.7) 69.7 (66.3, 72.8)
At cinemas 20.3 (18.4, 22.5) 20.0 (17.4, 22.9) 20.7 (18.1, 23.6) 28.3 (23.9, 33.2) 17.3 (15.4, 19.3) 23.4 (20.8, 26.3) 12.4 (10.5, 14.7)
On windows or inside shops/
stalls where cigs are bought 53.3 (50.4, 56.2) 55.6 (51.9, 59.3) 50.8 (47.4, 54.3) 59.8 (55.0, 64.5) 50.8 (47.7, 53.9) 53.8 (50.0, 57.5) 52.0 (48.1, 55.9)
On Internet 17.7 (15.8, 19.7) 17.2 (14.7, 19.9) 18.2 (15.7, 20.9) 27.2 (22.7, 32.3) 14.0 (12.4, 15.7) 19.4 (17.0, 22.0) 13.2 (10.8, 16.0)
Somewhere else 5.8 (4.7, 7.0) 5.4 (4.1, 7.0) 6.1 (4.7, 8.1) 8.1 (5.7, 11.3) 4.9 (3.9, 6.1) 6.1 (4.8, 7.5) 4.9 (3.3, 7.3)
Any location 94.0 (92.7, 95.1) 93.5 (91.5, 95.1) 94.5 (92.9, 95.8) 96.2 (93.8, 97.7) 93.1 (91.6, 94.4) 93.7 (91.9, 95.1) 94.8 (93.3, 95.9)
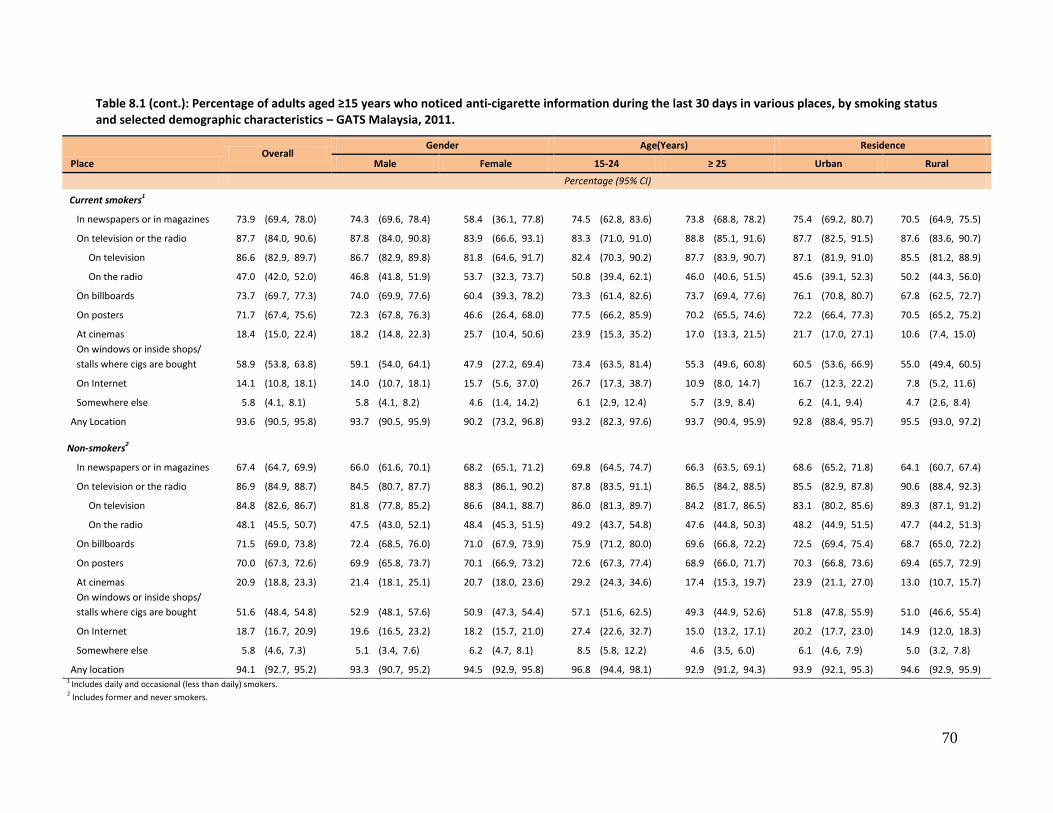
70
Table 8.1 (cont.): Percentage of adults aged ≥15 years who noticed anti-cigarette information during the last 30 days in various places, by smoking status and selected demographic characteristics – GATS Malaysia, 2011.
Place Overall
Gender Age(Years) Residence
Male Female 15-24 ≥ 25 Urban Rural
Percentage (95% CI)
Current smokers1
In newspapers or in magazines 73.9 (69.4, 78.0) 74.3 (69.6, 78.4) 58.4 (36.1, 77.8) 74.5 (62.8, 83.6) 73.8 (68.8, 78.2) 75.4 (69.2, 80.7) 70.5 (64.9, 75.5)
On television or the radio 87.7 (84.0, 90.6) 87.8 (84.0, 90.8) 83.9 (66.6, 93.1) 83.3 (71.0, 91.0) 88.8 (85.1, 91.6) 87.7 (82.5, 91.5) 87.6 (83.6, 90.7)
On television 86.6 (82.9, 89.7) 86.7 (82.9, 89.8) 81.8 (64.6, 91.7) 82.4 (70.3, 90.2) 87.7 (83.9, 90.7) 87.1 (81.9, 91.0) 85.5 (81.2, 88.9)
On the radio 47.0 (42.0, 52.0) 46.8 (41.8, 51.9) 53.7 (32.3, 73.7) 50.8 (39.4, 62.1) 46.0 (40.6, 51.5) 45.6 (39.1, 52.3) 50.2 (44.3, 56.0)
On billboards 73.7 (69.7, 77.3) 74.0 (69.9, 77.6) 60.4 (39.3, 78.2) 73.3 (61.4, 82.6) 73.7 (69.4, 77.6) 76.1 (70.8, 80.7) 67.8 (62.5, 72.7)
On posters 71.7 (67.4, 75.6) 72.3 (67.8, 76.3) 46.6 (26.4, 68.0) 77.5 (66.2, 85.9) 70.2 (65.5, 74.6) 72.2 (66.4, 77.3) 70.5 (65.2, 75.2)
At cinemas 18.4 (15.0, 22.4) 18.2 (14.8, 22.3) 25.7 (10.4, 50.6) 23.9 (15.3, 35.2) 17.0 (13.3, 21.5) 21.7 (17.0, 27.1) 10.6 (7.4, 15.0)
On windows or inside shops/
stalls where cigs are bought 58.9 (53.8, 63.8) 59.1 (54.0, 64.1) 47.9 (27.2, 69.4) 73.4 (63.5, 81.4) 55.3 (49.6, 60.8) 60.5 (53.6, 66.9) 55.0 (49.4, 60.5)
On Internet 14.1 (10.8, 18.1) 14.0 (10.7, 18.1) 15.7 (5.6, 37.0) 26.7 (17.3, 38.7) 10.9 (8.0, 14.7) 16.7 (12.3, 22.2) 7.8 (5.2, 11.6)
Somewhere else 5.8 (4.1, 8.1) 5.8 (4.1, 8.2) 4.6 (1.4, 14.2) 6.1 (2.9, 12.4) 5.7 (3.9, 8.4) 6.2 (4.1, 9.4) 4.7 (2.6, 8.4)
Any Location 93.6 (90.5, 95.8) 93.7 (90.5, 95.9) 90.2 (73.2, 96.8) 93.2 (82.3, 97.6) 93.7 (90.4, 95.9) 92.8 (88.4, 95.7) 95.5 (93.0, 97.2)
Non-smokers2
In newspapers or in magazines 67.4 (64.7, 69.9) 66.0 (61.6, 70.1) 68.2 (65.1, 71.2) 69.8 (64.5, 74.7) 66.3 (63.5, 69.1) 68.6 (65.2, 71.8) 64.1 (60.7, 67.4)
On television or the radio 86.9 (84.9, 88.7) 84.5 (80.7, 87.7) 88.3 (86.1, 90.2) 87.8 (83.5, 91.1) 86.5 (84.2, 88.5) 85.5 (82.9, 87.8) 90.6 (88.4, 92.3)
On television 84.8 (82.6, 86.7) 81.8 (77.8, 85.2) 86.6 (84.1, 88.7) 86.0 (81.3, 89.7) 84.2 (81.7, 86.5) 83.1 (80.2, 85.6) 89.3 (87.1, 91.2)
On the radio 48.1 (45.5, 50.7) 47.5 (43.0, 52.1) 48.4 (45.3, 51.5) 49.2 (43.7, 54.8) 47.6 (44.8, 50.3) 48.2 (44.9, 51.5) 47.7 (44.2, 51.3)
On billboards 71.5 (69.0, 73.8) 72.4 (68.5, 76.0) 71.0 (67.9, 73.9) 75.9 (71.2, 80.0) 69.6 (66.8, 72.2) 72.5 (69.4, 75.4) 68.7 (65.0, 72.2)
On posters 70.0 (67.3, 72.6) 69.9 (65.8, 73.7) 70.1 (66.9, 73.2) 72.6 (67.3, 77.4) 68.9 (66.0, 71.7) 70.3 (66.8, 73.6) 69.4 (65.7, 72.9)
At cinemas 20.9 (18.8, 23.3) 21.4 (18.1, 25.1) 20.7 (18.0, 23.6) 29.2 (24.3, 34.6) 17.4 (15.3, 19.7) 23.9 (21.1, 27.0) 13.0 (10.7, 15.7)
On windows or inside shops/
stalls where cigs are bought 51.6 (48.4, 54.8) 52.9 (48.1, 57.6) 50.9 (47.3, 54.4) 57.1 (51.6, 62.5) 49.3 (44.9, 52.6) 51.8 (47.8, 55.9) 51.0 (46.6, 55.4)
On Internet 18.7 (16.7, 20.9) 19.6 (16.5, 23.2) 18.2 (15.7, 21.0) 27.4 (22.6, 32.7) 15.0 (13.2, 17.1) 20.2 (17.7, 23.0) 14.9 (12.0, 18.3)
Somewhere else 5.8 (4.6, 7.3) 5.1 (3.4, 7.6) 6.2 (4.7, 8.1) 8.5 (5.8, 12.2) 4.6 (3.5, 6.0) 6.1 (4.6, 7.9) 5.0 (3.2, 7.8)
Any location 94.1 (92.7, 95.2) 93.3 (90.7, 95.2) 94.5 (92.9, 95.8) 96.8 (94.4, 98.1) 92.9 (91.2, 94.3) 93.9 (92.1, 95.3) 94.6 (92.9, 95.9) 1
Includes daily and occasional (less than daily) smokers. 2 Includes former and never smokers.
71
8.2 Awareness of the “Tak Nak” Anti-smoking Campaign
This section discusses awareness among Malaysian adults of the country’s “Tak-Nak” anti-smoking
campaign. The WHO Framework Convention On Tobacco Control, Article12: Education, Communication,
Training and Public Awareness recommends using media to shape tobacco-related knowledge, opinions,
attitudes, and behaviors, and these media can be extremely powerful in influencing both individuals and
policy makers regarding tobacco use and tobacco control issues.1 Anti-smoking campaigns discourage
tobacco users from consumption of tobacco and motivate them to quit.36 Global evidence supports the
fact that strong and effective anti-smoking campaigns comprise an essential component of any anti-
tobacco strategy and have ultimately motivated tobacco users in many countries to quit.
Table 8.2 shows that 85.2% of Malaysian adults (85.9% of current smokers and 85.0% of non-smokers)
had seen or heard about the “Tak Nak” anti-smoking campaign in the last 12 months. A similar
proportion of men (88.2%) than women (87.3%) had seen or heard about the campaign. The estimate
for young persons (15−24, 89.1%) was well above the estimate for the ≥65 age group (70.3%), but
similar to the estimates of 86.9% for the 25−44 age group and 82.2% for the 45−64 age group. Rural
residents (86.4%) had a similar percentage than urban residents (84.8%) on this question.
Among current smokers, 98.5% of those with a college education or above had seen or heard about the
“Tak Nak” campaign, versus rates of 88.1% to 72.8% for persons with less education.
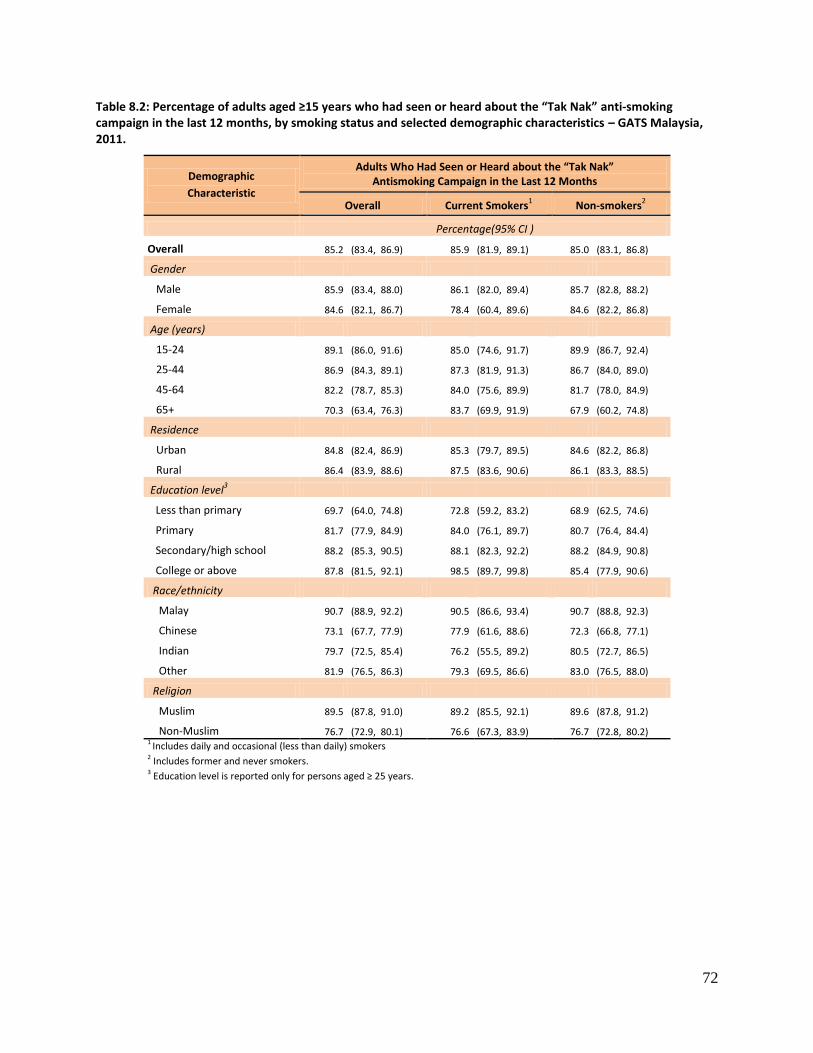
72
Table 8.2: Percentage of adults aged ≥15 years who had seen or heard about the “Tak Nak” anti-smoking campaign in the last 12 months, by smoking status and selected demographic characteristics – GATS Malaysia, 2011.
Demographic
Characteristic
Adults Who Had Seen or Heard about the “Tak Nak” Antismoking Campaign in the Last 12 Months
Overall Current Smokers1 Non-smokers
2
Percentage(95% CI )
Overall 85.2 (83.4, 86.9) 85.9 (81.9, 89.1) 85.0 (83.1, 86.8)
Gender
Male 85.9 (83.4, 88.0) 86.1 (82.0, 89.4) 85.7 (82.8, 88.2)
Female 84.6 (82.1, 86.7) 78.4 (60.4, 89.6) 84.6 (82.2, 86.8)
Age (years)
15-24 89.1 (86.0, 91.6) 85.0 (74.6, 91.7) 89.9 (86.7, 92.4)
25-44 86.9 (84.3, 89.1) 87.3 (81.9, 91.3) 86.7 (84.0, 89.0)
45-64 82.2 (78.7, 85.3) 84.0 (75.6, 89.9) 81.7 (78.0, 84.9)
65+ 70.3 (63.4, 76.3) 83.7 (69.9, 91.9) 67.9 (60.2, 74.8)
Residence
Urban 84.8 (82.4, 86.9) 85.3 (79.7, 89.5) 84.6 (82.2, 86.8)
Rural 86.4 (83.9, 88.6) 87.5 (83.6, 90.6) 86.1 (83.3, 88.5)
Education level3
Less than primary 69.7 (64.0, 74.8) 72.8 (59.2, 83.2) 68.9 (62.5, 74.6)
Primary 81.7 (77.9, 84.9) 84.0 (76.1, 89.7) 80.7 (76.4, 84.4)
Secondary/high school 88.2 (85.3, 90.5) 88.1 (82.3, 92.2) 88.2 (84.9, 90.8)
College or above 87.8 (81.5, 92.1) 98.5 (89.7, 99.8) 85.4 (77.9, 90.6)
Race/ethnicity
Malay 90.7 (88.9, 92.2) 90.5 (86.6, 93.4) 90.7 (88.8, 92.3)
Chinese 73.1 (67.7, 77.9) 77.9 (61.6, 88.6) 72.3 (66.8, 77.1)
Indian 79.7 (72.5, 85.4) 76.2 (55.5, 89.2) 80.5 (72.7, 86.5)
Other 81.9 (76.5, 86.3) 79.3 (69.5, 86.6) 83.0 (76.5, 88.0)
Religion
Muslim 89.5 (87.8, 91.0) 89.2 (85.5, 92.1) 89.6 (87.8, 91.2)
Non-Muslim 76.7 (72.9, 80.1) 76.6 (67.3, 83.9) 76.7 (72.8, 80.2) 1 Includes daily and occasional (less than daily) smokers 2 Includes former and never smokers. 3 Education level is reported only for persons aged ≥ 25 years.
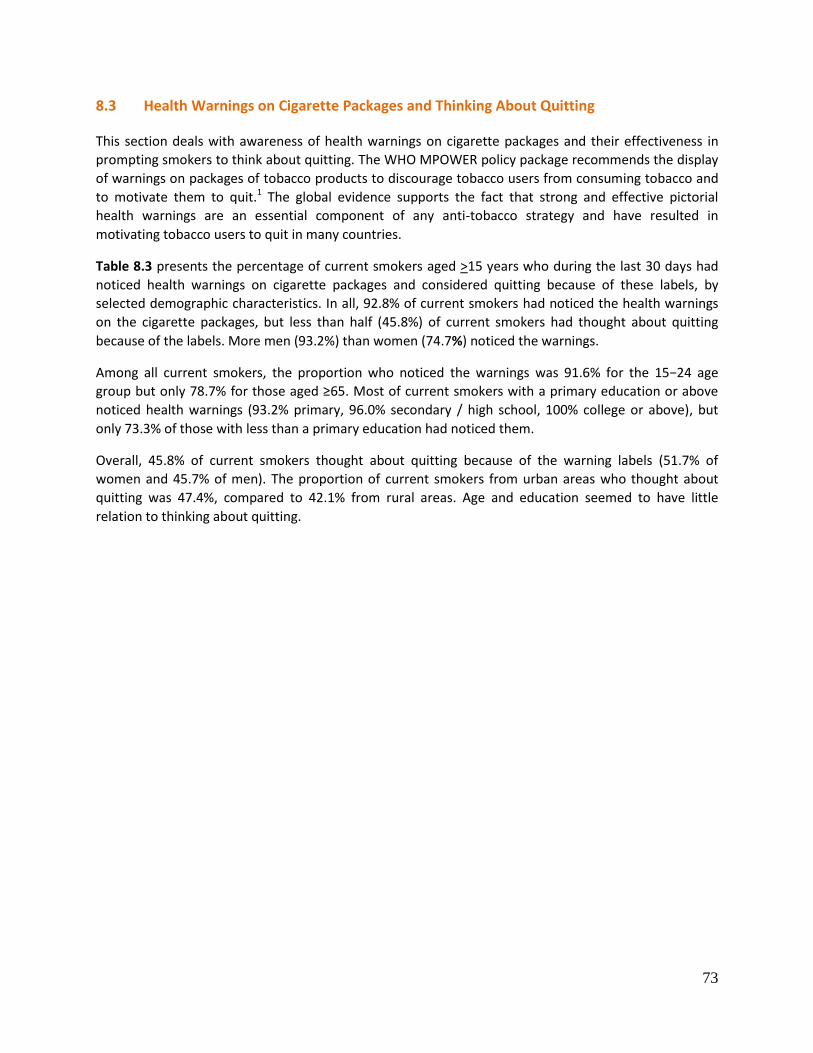
73
8.3 Health Warnings on Cigarette Packages and Thinking About Quitting
This section deals with awareness of health warnings on cigarette packages and their effectiveness in
prompting smokers to think about quitting. The WHO MPOWER policy package recommends the display
of warnings on packages of tobacco products to discourage tobacco users from consuming tobacco and
to motivate them to quit.1 The global evidence supports the fact that strong and effective pictorial
health warnings are an essential component of any anti-tobacco strategy and have resulted in
motivating tobacco users to quit in many countries.
Table 8.3 presents the percentage of current smokers aged >15 years who during the last 30 days had
noticed health warnings on cigarette packages and considered quitting because of these labels, by
selected demographic characteristics. In all, 92.8% of current smokers had noticed the health warnings
on the cigarette packages, but less than half (45.8%) of current smokers had thought about quitting
because of the labels. More men (93.2%) than women (74.7%) noticed the warnings.
Among all current smokers, the proportion who noticed the warnings was 91.6% for the 15−24 age
group but only 78.7% for those aged ≥65. Most of current smokers with a primary education or above
noticed health warnings (93.2% primary, 96.0% secondary / high school, 100% college or above), but
only 73.3% of those with less than a primary education had noticed them.
Overall, 45.8% of current smokers thought about quitting because of the warning labels (51.7% of
women and 45.7% of men). The proportion of current smokers from urban areas who thought about
quitting was 47.4%, compared to 42.1% from rural areas. Age and education seemed to have little
relation to thinking about quitting.
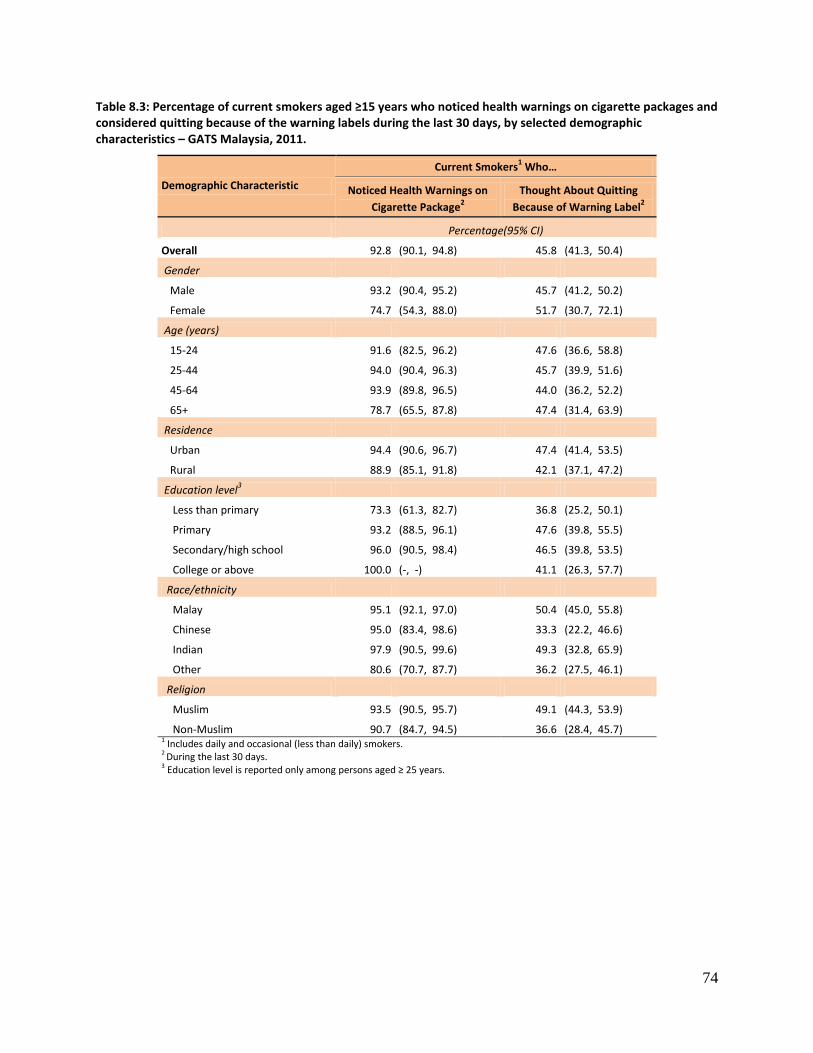
74
Table 8.3: Percentage of current smokers aged ≥15 years who noticed health warnings on cigarette packages and considered quitting because of the warning labels during the last 30 days, by selected demographic characteristics – GATS Malaysia, 2011.
Demographic Characteristic
Current Smokers1 Who…
Noticed Health Warnings on
Cigarette Package2
Thought About Quitting
Because of Warning Label2
Percentage(95% CI)
Overall 92.8 (90.1, 94.8) 45.8 (41.3, 50.4)
Gender
Male 93.2 (90.4, 95.2) 45.7 (41.2, 50.2)
Female 74.7 (54.3, 88.0) 51.7 (30.7, 72.1)
Age (years)
15-24 91.6 (82.5, 96.2) 47.6 (36.6, 58.8)
25-44 94.0 (90.4, 96.3) 45.7 (39.9, 51.6)
45-64 93.9 (89.8, 96.5) 44.0 (36.2, 52.2)
65+ 78.7 (65.5, 87.8) 47.4 (31.4, 63.9)
Residence
Urban 94.4 (90.6, 96.7) 47.4 (41.4, 53.5)
Rural 88.9 (85.1, 91.8) 42.1 (37.1, 47.2)
Education level3
Less than primary 73.3 (61.3, 82.7) 36.8 (25.2, 50.1)
Primary 93.2 (88.5, 96.1) 47.6 (39.8, 55.5)
Secondary/high school 96.0 (90.5, 98.4) 46.5 (39.8, 53.5)
College or above 100.0 (-, -) 41.1 (26.3, 57.7)
Race/ethnicity
Malay 95.1 (92.1, 97.0) 50.4 (45.0, 55.8)
Chinese 95.0 (83.4, 98.6) 33.3 (22.2, 46.6)
Indian 97.9 (90.5, 99.6) 49.3 (32.8, 65.9)
Other 80.6 (70.7, 87.7) 36.2 (27.5, 46.1)
Religion
Muslim 93.5 (90.5, 95.7) 49.1 (44.3, 53.9)
Non-Muslim 90.7 (84.7, 94.5) 36.6 (28.4, 45.7) 1 Includes daily and occasional (less than daily) smokers. 2 During the last 30 days. 3 Education level is reported only among persons aged ≥ 25 years.
75
8.4 Thinking About the Health Risks of Smoking from Seeing Health Warnings
This section deals with the effectiveness of health warnings on cigarette packages as measured by levels
among current smokers of thinking about health risks from seeing health warnings in the last 30 days on
packages of cigarettes.
Table 8.4 shows that 25.3% of current smokers had thought not at all about health risks from seeing the
warnings; 43.9% had thought a little; 17.4% had thought “somewhat”; and 13.3% had thought a lot
about the risks.
There were very few differences between the age groups and when comparing urban vs. rural residents.
About half (50.3%) of current smokers with less than a primary education thought a little about the risks,
versus just 31.0% of those with a college education or more.
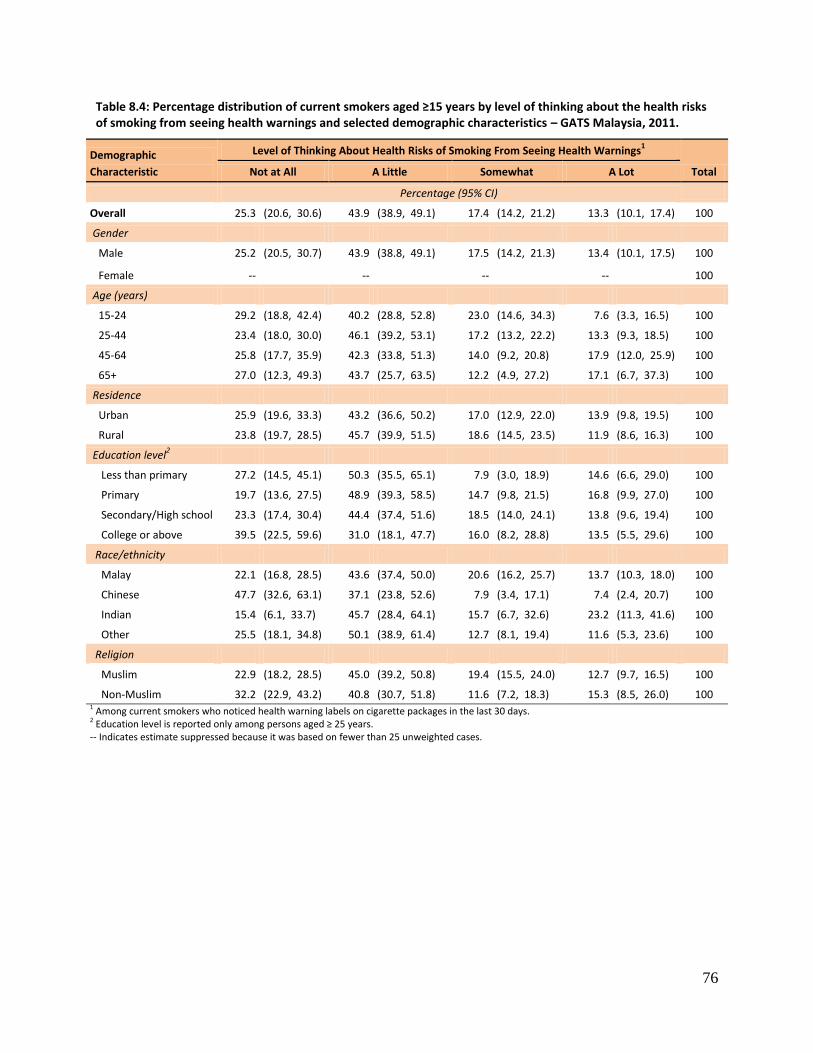
76
Table 8.4: Percentage distribution of current smokers aged ≥15 years by level of thinking about the health risks of smoking from seeing health warnings and selected demographic characteristics – GATS Malaysia, 2011.
Demographic
Characteristic
Level of Thinking About Health Risks of Smoking From Seeing Health Warnings1
Total Not at All A Little Somewhat A Lot
Percentage (95% CI)
Overall 25.3 (20.6, 30.6) 43.9 (38.9, 49.1) 17.4 (14.2, 21.2) 13.3 (10.1, 17.4) 100
Gender
Male 25.2 (20.5, 30.7) 43.9 (38.8, 49.1) 17.5 (14.2, 21.3) 13.4 (10.1, 17.5) 100
Female -- -- -- -- 100
Age (years)
15-24 29.2 (18.8, 42.4) 40.2 (28.8, 52.8) 23.0 (14.6, 34.3) 7.6 (3.3, 16.5) 100
25-44 23.4 (18.0, 30.0) 46.1 (39.2, 53.1) 17.2 (13.2, 22.2) 13.3 (9.3, 18.5) 100
45-64 25.8 (17.7, 35.9) 42.3 (33.8, 51.3) 14.0 (9.2, 20.8) 17.9 (12.0, 25.9) 100
65+ 27.0 (12.3, 49.3) 43.7 (25.7, 63.5) 12.2 (4.9, 27.2) 17.1 (6.7, 37.3) 100
Residence
Urban 25.9 (19.6, 33.3) 43.2 (36.6, 50.2) 17.0 (12.9, 22.0) 13.9 (9.8, 19.5) 100
Rural 23.8 (19.7, 28.5) 45.7 (39.9, 51.5) 18.6 (14.5, 23.5) 11.9 (8.6, 16.3) 100
Education level2
Less than primary 27.2 (14.5, 45.1) 50.3 (35.5, 65.1) 7.9 (3.0, 18.9) 14.6 (6.6, 29.0) 100
Primary 19.7 (13.6, 27.5) 48.9 (39.3, 58.5) 14.7 (9.8, 21.5) 16.8 (9.9, 27.0) 100
Secondary/High school 23.3 (17.4, 30.4) 44.4 (37.4, 51.6) 18.5 (14.0, 24.1) 13.8 (9.6, 19.4) 100
College or above 39.5 (22.5, 59.6) 31.0 (18.1, 47.7) 16.0 (8.2, 28.8) 13.5 (5.5, 29.6) 100
Race/ethnicity
Malay 22.1 (16.8, 28.5) 43.6 (37.4, 50.0) 20.6 (16.2, 25.7) 13.7 (10.3, 18.0) 100
Chinese 47.7 (32.6, 63.1) 37.1 (23.8, 52.6) 7.9 (3.4, 17.1) 7.4 (2.4, 20.7) 100
Indian 15.4 (6.1, 33.7) 45.7 (28.4, 64.1) 15.7 (6.7, 32.6) 23.2 (11.3, 41.6) 100
Other 25.5 (18.1, 34.8) 50.1 (38.9, 61.4) 12.7 (8.1, 19.4) 11.6 (5.3, 23.6) 100
Religion
Muslim 22.9 (18.2, 28.5) 45.0 (39.2, 50.8) 19.4 (15.5, 24.0) 12.7 (9.7, 16.5) 100
Non-Muslim 32.2 (22.9, 43.2) 40.8 (30.7, 51.8) 11.6 (7.2, 18.3) 15.3 (8.5, 26.0) 100 1 Among current smokers who noticed health warning labels on cigarette packages in the last 30 days. 2 Education level is reported only among persons aged ≥ 25 years. -- Indicates estimate suppressed because it was based on fewer than 25 unweighted cases.
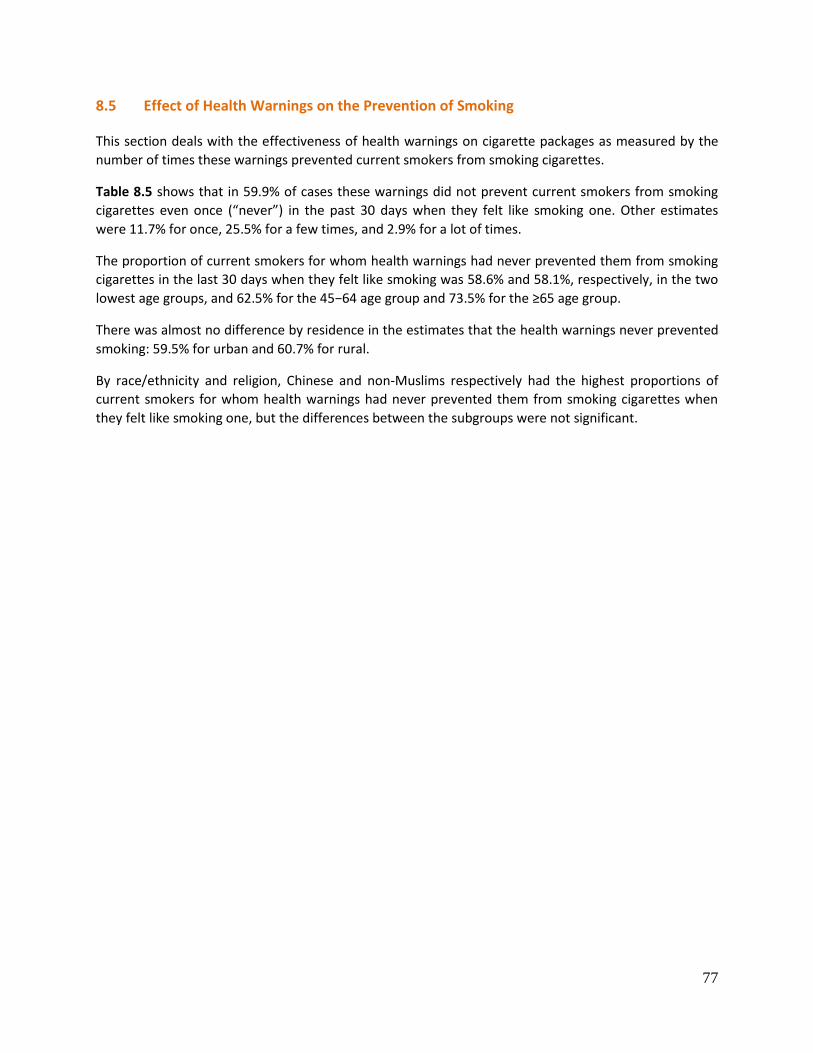
77
8.5 Effect of Health Warnings on the Prevention of Smoking
This section deals with the effectiveness of health warnings on cigarette packages as measured by the
number of times these warnings prevented current smokers from smoking cigarettes.
Table 8.5 shows that in 59.9% of cases these warnings did not prevent current smokers from smoking
cigarettes even once (“never”) in the past 30 days when they felt like smoking one. Other estimates
were 11.7% for once, 25.5% for a few times, and 2.9% for a lot of times.
The proportion of current smokers for whom health warnings had never prevented them from smoking
cigarettes in the last 30 days when they felt like smoking was 58.6% and 58.1%, respectively, in the two
lowest age groups, and 62.5% for the 45−64 age group and 73.5% for the ≥65 age group.
There was almost no difference by residence in the estimates that the health warnings never prevented
smoking: 59.5% for urban and 60.7% for rural.
By race/ethnicity and religion, Chinese and non-Muslims respectively had the highest proportions of
current smokers for whom health warnings had never prevented them from smoking cigarettes when
they felt like smoking one, but the differences between the subgroups were not significant.
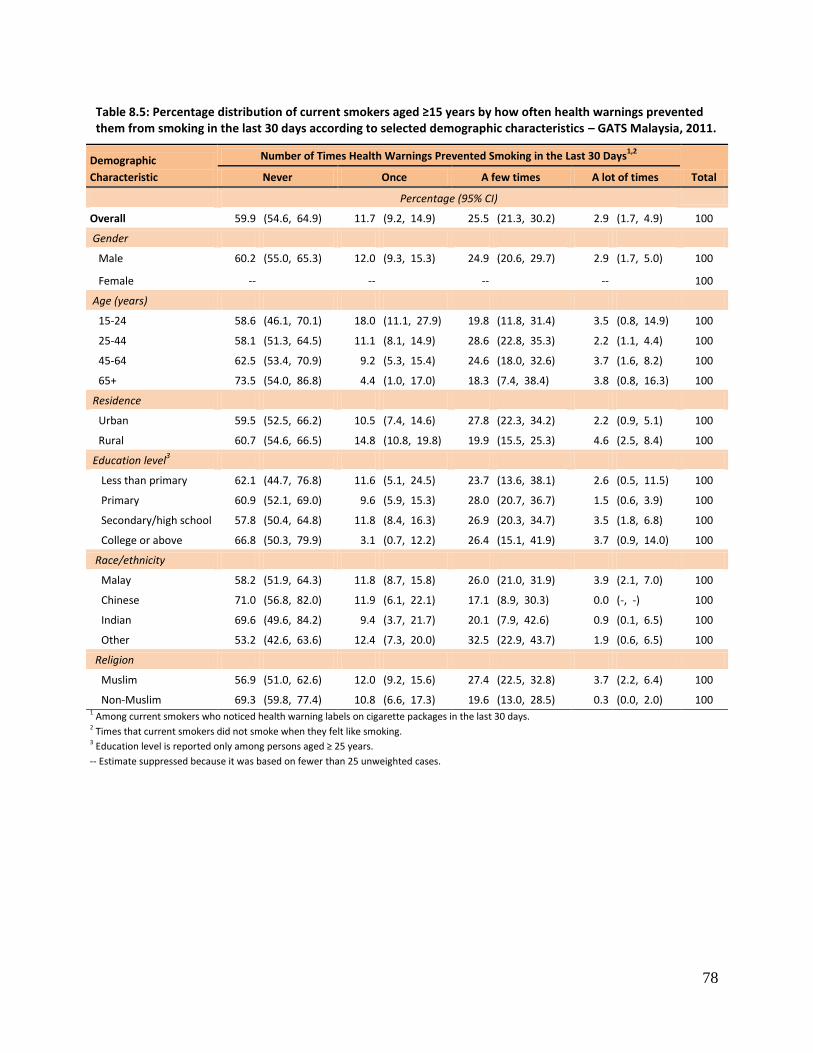
78
Table 8.5: Percentage distribution of current smokers aged ≥15 years by how often health warnings prevented them from smoking in the last 30 days according to selected demographic characteristics – GATS Malaysia, 2011.
Demographic
Characteristic
Number of Times Health Warnings Prevented Smoking in the Last 30 Days1,2
Total Never Once A few times A lot of times
Percentage (95% CI)
Overall 59.9 (54.6, 64.9) 11.7 (9.2, 14.9) 25.5 (21.3, 30.2) 2.9 (1.7, 4.9) 100
Gender
Male 60.2 (55.0, 65.3) 12.0 (9.3, 15.3) 24.9 (20.6, 29.7) 2.9 (1.7, 5.0) 100
Female -- -- -- -- 100
Age (years)
15-24 58.6 (46.1, 70.1) 18.0 (11.1, 27.9) 19.8 (11.8, 31.4) 3.5 (0.8, 14.9) 100
25-44 58.1 (51.3, 64.5) 11.1 (8.1, 14.9) 28.6 (22.8, 35.3) 2.2 (1.1, 4.4) 100
45-64 62.5 (53.4, 70.9) 9.2 (5.3, 15.4) 24.6 (18.0, 32.6) 3.7 (1.6, 8.2) 100
65+ 73.5 (54.0, 86.8) 4.4 (1.0, 17.0) 18.3 (7.4, 38.4) 3.8 (0.8, 16.3) 100
Residence
Urban 59.5 (52.5, 66.2) 10.5 (7.4, 14.6) 27.8 (22.3, 34.2) 2.2 (0.9, 5.1) 100
Rural 60.7 (54.6, 66.5) 14.8 (10.8, 19.8) 19.9 (15.5, 25.3) 4.6 (2.5, 8.4) 100
Education level3
Less than primary 62.1 (44.7, 76.8) 11.6 (5.1, 24.5) 23.7 (13.6, 38.1) 2.6 (0.5, 11.5) 100
Primary 60.9 (52.1, 69.0) 9.6 (5.9, 15.3) 28.0 (20.7, 36.7) 1.5 (0.6, 3.9) 100
Secondary/high school 57.8 (50.4, 64.8) 11.8 (8.4, 16.3) 26.9 (20.3, 34.7) 3.5 (1.8, 6.8) 100
College or above 66.8 (50.3, 79.9) 3.1 (0.7, 12.2) 26.4 (15.1, 41.9) 3.7 (0.9, 14.0) 100
Race/ethnicity
Malay 58.2 (51.9, 64.3) 11.8 (8.7, 15.8) 26.0 (21.0, 31.9) 3.9 (2.1, 7.0) 100
Chinese 71.0 (56.8, 82.0) 11.9 (6.1, 22.1) 17.1 (8.9, 30.3) 0.0 (-, -) 100
Indian 69.6 (49.6, 84.2) 9.4 (3.7, 21.7) 20.1 (7.9, 42.6) 0.9 (0.1, 6.5) 100
Other 53.2 (42.6, 63.6) 12.4 (7.3, 20.0) 32.5 (22.9, 43.7) 1.9 (0.6, 6.5) 100
Religion
Muslim 56.9 (51.0, 62.6) 12.0 (9.2, 15.6) 27.4 (22.5, 32.8) 3.7 (2.2, 6.4) 100
Non-Muslim 69.3 (59.8, 77.4) 10.8 (6.6, 17.3) 19.6 (13.0, 28.5) 0.3 (0.0, 2.0) 100 1 Among current smokers who noticed health warning labels on cigarette packages in the last 30 days. 2 Times that current smokers did not smoke when they felt like smoking. 3 Education level is reported only among persons aged ≥ 25 years.
-- Estimate suppressed because it was based on fewer than 25 unweighted cases.
79
8.6 Adults Who Noticed Cigarette Marketing
This section discusses how often adults aged ≥15 years had noticed advertisements or promotions about
cigarettes in different places and in different media in the last 30 days.
Table 8.6 indicates that 35.6% of Malaysian adults (39.0% of men and 32.0% of women) had noticed at
least one advertisement or promotion of cigarettes in the last 30 days. The estimate for urban residents
(38.1%) was significantly higher than the estimate for rural (29.2%) residents.
In order, estimates for the places where advertisements were noticed were 18.9% for stores; 15.5%,
posters; 14.5%, television; 14.4%, billboards; 13.4%, newspapers or magazines; 9.6%, on public walls;
8.1%, on public transportation; 7.6%, on the radio; 4.4%, on the Internet; and 3.6% in cinemas.
The most common places for noticing advertisements for cigarettes were, for men, stores (21.0%),
posters (17.3%), and billboards (15.1%), but women had a somewhat different order for the top three:
stores (16.6%), television (15.3%), and billboards (13.6%). For both rural and urban residents overall,
stores ranked first.
For every selected demographic characteristic, clothing / item with brand name or logo and one-to-one
sales promotion ranked first and second respectively among the cigarette promotions noticed.
80
Table 8.6: Percentage of adults aged ≥15 years who noticed cigarette marketing during the last 30 days in various places, by selected demographic characteristics – GATS Malaysia, 2011.
Place Overall
Gender Age (Years) Residence
Male Female 15-24 ≥ 25 Urban Rural
Percentage (95% CI)
Noticed advertisements
In stores 18.9 (16.7, 21.2) 21.0 (18.1, 24.3) 16.6 (14.1, 19.4) 20.2 (16.5, 24.6) 18.3 (16.1, 20.7) 20.5 (17.7, 23.5) 14.7 (12.4, 17.3)
On television 14.5 (12.5, 16.7) 13.7 (11.2, 16.5) 15.3 (13.0, 18.0) 17.6 (13.9, 21.9) 13.3 (11.4, 15.4) 15.1 (12.6, 18.0) 12.8 (10.5, 15.6)
On the radio 7.6 (6.2, 9.2) 7.2 (5.3, 9.5) 8.0 (6.4, 10.0) 9.3 (6.7, 12.9) 6.9 (5.6, 8.5) 8.4 (6.6, 10.5) 5.6 (4.3, 7.2)
On billboards 14.4 (12.4, 16.5) 15.1 (12.5, 18.2) 13.6 (11.3, 16.2) 16.3 (12.8, 20.5) 13.6 (11.7, 15.8) 16.2 (13.7, 19.2) 9.5 (7.7, 11.6)
On posters 15.5 (13.5, 17.7) 17.3 (14.5, 20.5) 13.5 (11.5, 15.9) 18.3 (14.7, 22.6) 14.4 (12.4, 16.6) 17.5 (14.9, 20.4) 10.2 (8.3, 12.6)
In newspapers or
magazines 13.4 (11.6, 15.5) 14.3 (11.8, 17.2) 12.5 (10.4, 14.8) 14.7 (11.4, 18.7) 12.9 (11.1, 15.0) 14.8 (12.5, 17.5) 9.7 (7.7, 12.3)
In cinemas 3.6 (2.6, 5.0) 4.2 (2.7, 6.7) 2.9 (1.9, 4.2) 5.5 (3.3, 9.2) 2.8 (2.0, 4.0) 4.5 (3.1, 6.4) 1.2 (0.7, 2.0)
On the Internet 4.4 (3.3, 5.8) 4.9 (3.3, 7.2) 3.8 (2.7, 5.3) 6.6 (4.3, 10.1) 3.5 (2.5, 4.9) 5.4 (4.0, 7.3) 1.6 (1.0, 2.8)
On public transportation 8.1 (6.6, 9.8) 8.1 (6.1, 10.7) 8.0 (6.3, 10.2) 10.3 (7.3, 14.1) 7.2 (5.9, 8.8) 9.7 (7.8, 12.1) 3.8 (2.7, 5.3)
On public walls 9.6 (8.0, 11.4) 9.4 (7.3, 12.0) 9.7 (7.9, 11.9) 11.2 (8.3, 15.0) 9.0 (7.5, 10.7) 10.5 (8.5, 13.0) 7.1 (5.5, 9.1)
Somewhere else 0.8 (0.5, 1.2) 1.0 (0.6, 1.6) 0.7 (0.3, 1.3) 0.6 (0.2, 1.8) 0.9 (0.6, 1.4) 0.8 (0.5, 1.4) 0.7 (0.3, 1.7)
Noticed cigarette
promotions
Free samples 2.7 (2.0, 3.8) 4.4 (3.2, 6.2) 0.9 (0.5, 1.7) 3.3 (1.8, 5.9) 2.6 (1.9, 3.5) 3.3 (2.3, 4.7) 1.4 (0.9, 2.2)
Sale prices 3.2 (2.5, 4.1) 5.0 (3.8, 6.7) 1.2 (0.8, 1.9) 4.5 (2.9, 7.1) 2.7 (2.0, 3.5) 3.5 (2.5, 4.7) 2.4 (1.6, 3.7)
Coupons 0.4 (0.2, 0.8) 0.8 (0.4, 1.5) 0.1 (0.0, 0.3) 0.5 (0.2, 1.6) 0.4 (0.2, 0.8) 0.4 (0.2, 1.0) 0.4 (0.2, 0.9)
Free gifts/discounts on
other products 4.0 (2.9, 5.5) 5.4 (3.9, 7.5) 2.6 (1.6, 4.0) 4.9 (3.0, 7.8) 3.7 (2.6, 5.3) 4.9 (3.4, 7.0) 1.7 (1.1, 2.8)
Clothing/item with brand
name or logo 7.8 (6.3, 9.7) 10.5 (8.4, 13.2) 4.9 (3.7, 6.5) 9.0 (6.5, 12.2) 7.3 (5.6, 9.5) 9.1 (7.0, 11.6) 4.6 (3.4, 6.0)
Mail promoting cigarettes 0.0 (0.0, 0.1) 0.0 (-, -) 0.1 (0.0, 0.2) 0.0 (-, -) 0.1 (0.0, 0.1) 0.0 (-, -) 0.1 (0.0, 0.4)
One-to-one sales
promotion 5.3 (4.1, 6.8) 7.4 (5.7, 9.7) 3.0 (2.0, 4.3) 5.1 (3.3, 7.6) 5.3 (4.0, 7.0) 6.3 (4.7, 8.3) 2.6 (1.7, 4.0)
Noticed any advertisement
or promotion 35.6 (32.9, 38.5) 39.0 (35.4, 42.7) 32.0 (28.7, 35.5) 40.9 (36.3, 45.7) 33.6 (30.7, 36.6) 38.1 (34.5, 41.8) 29.2 (25.9, 32.7)
81
8.6.1 Current Adult Smokers Who Noticed Cigarette Marketing
As shown in Table 8.7, 41.6% (41.7% of men, 39.6% of women) of current smokers aged >15 years had
noticed any advertisement or promotion of cigarettes in the last 30 days. The estimate was lower
(39.1%) for current smokers aged >25 years than it was for the 15−24 group (51.7%), and this pattern
held true for all specific locations. A higher proportion of urban (45.3%) than rural (32.7%) current
smokers had noticed some advertisement or promotion of cigarettes in the last 30 days.
The three most common places overall for the noticing by current smokers of advertisements were the
same as for male smokers: stores (22.4%), posters (17.7%), and billboards (15.5%). For women,
however, the top three were posters (16.2%), billboards (13.4%), and public transportation (10.0%).
Overall, stores ranked first for both rural and urban current smokers.
As was the case for the overall population (Table 8.6), the two most commonly noticed sources of
cigarette promotion for current smokers (Table 8.7) overall were clothing/item with brand name or logo
(10.9%) and one-to-one sales promotion (10.8%). For male smokers the order was the same, but for
female smokers the top two were reversed. For younger adults (15-24), the top two were clothing/item
with brand name or logo and sale prices, while for those 25+ and for urban residents the order was one-
to-one sales promotion and then clothing/item with brand name or logo. For rural residents the order
was clothing / item with brand name or logo followed by sale prices.
8.6.2 Non-smokers Who Noticed Cigarette Marketing
As shown in Table 8.8, 33.8% of current non-smokers had noticed any advertisement or promotion of
cigarettes during the last 30 days. Patterns of noticing any advertisement or promotion for age groups
and residence were similar to those observed for the overall population and current smokers.
The two sources of cigarette promotion seen most commonly were clothing/item with brand name or
logo and one-to-one sales promotion, the same order as for the overall population and for smokers.
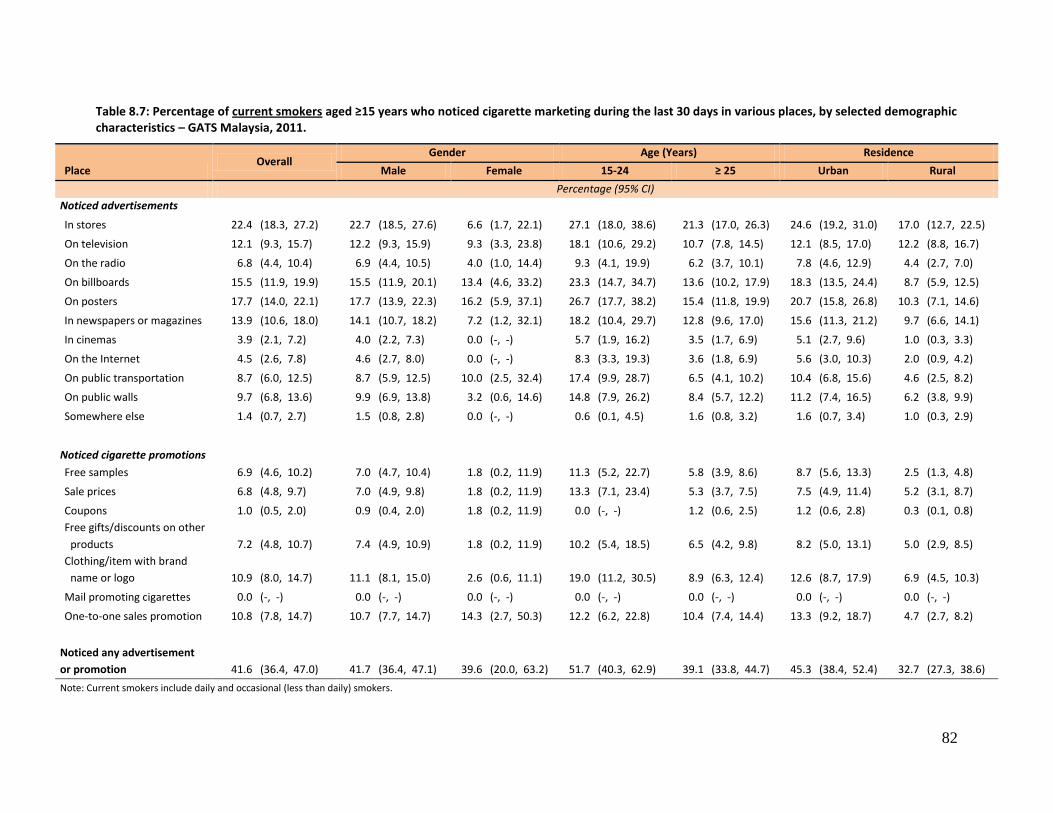
82
Table 8.7: Percentage of current smokers aged ≥15 years who noticed cigarette marketing during the last 30 days in various places, by selected demographic characteristics – GATS Malaysia, 2011.
Place Overall
Gender Age (Years) Residence
Male Female 15-24 ≥ 25 Urban Rural
Percentage (95% CI)
Noticed advertisements
In stores 22.4 (18.3, 27.2) 22.7 (18.5, 27.6) 6.6 (1.7, 22.1) 27.1 (18.0, 38.6) 21.3 (17.0, 26.3) 24.6 (19.2, 31.0) 17.0 (12.7, 22.5)
On television 12.1 (9.3, 15.7) 12.2 (9.3, 15.9) 9.3 (3.3, 23.8) 18.1 (10.6, 29.2) 10.7 (7.8, 14.5) 12.1 (8.5, 17.0) 12.2 (8.8, 16.7)
On the radio 6.8 (4.4, 10.4) 6.9 (4.4, 10.5) 4.0 (1.0, 14.4) 9.3 (4.1, 19.9) 6.2 (3.7, 10.1) 7.8 (4.6, 12.9) 4.4 (2.7, 7.0)
On billboards 15.5 (11.9, 19.9) 15.5 (11.9, 20.1) 13.4 (4.6, 33.2) 23.3 (14.7, 34.7) 13.6 (10.2, 17.9) 18.3 (13.5, 24.4) 8.7 (5.9, 12.5)
On posters 17.7 (14.0, 22.1) 17.7 (13.9, 22.3) 16.2 (5.9, 37.1) 26.7 (17.7, 38.2) 15.4 (11.8, 19.9) 20.7 (15.8, 26.8) 10.3 (7.1, 14.6)
In newspapers or magazines 13.9 (10.6, 18.0) 14.1 (10.7, 18.2) 7.2 (1.2, 32.1) 18.2 (10.4, 29.7) 12.8 (9.6, 17.0) 15.6 (11.3, 21.2) 9.7 (6.6, 14.1)
In cinemas 3.9 (2.1, 7.2) 4.0 (2.2, 7.3) 0.0 (-, -) 5.7 (1.9, 16.2) 3.5 (1.7, 6.9) 5.1 (2.7, 9.6) 1.0 (0.3, 3.3)
On the Internet 4.5 (2.6, 7.8) 4.6 (2.7, 8.0) 0.0 (-, -) 8.3 (3.3, 19.3) 3.6 (1.8, 6.9) 5.6 (3.0, 10.3) 2.0 (0.9, 4.2)
On public transportation 8.7 (6.0, 12.5) 8.7 (5.9, 12.5) 10.0 (2.5, 32.4) 17.4 (9.9, 28.7) 6.5 (4.1, 10.2) 10.4 (6.8, 15.6) 4.6 (2.5, 8.2)
On public walls 9.7 (6.8, 13.6) 9.9 (6.9, 13.8) 3.2 (0.6, 14.6) 14.8 (7.9, 26.2) 8.4 (5.7, 12.2) 11.2 (7.4, 16.5) 6.2 (3.8, 9.9)
Somewhere else 1.4 (0.7, 2.7) 1.5 (0.8, 2.8) 0.0 (-, -) 0.6 (0.1, 4.5) 1.6 (0.8, 3.2) 1.6 (0.7, 3.4) 1.0 (0.3, 2.9)
Noticed cigarette promotions
Free samples 6.9 (4.6, 10.2) 7.0 (4.7, 10.4) 1.8 (0.2, 11.9) 11.3 (5.2, 22.7) 5.8 (3.9, 8.6) 8.7 (5.6, 13.3) 2.5 (1.3, 4.8)
Sale prices 6.8 (4.8, 9.7) 7.0 (4.9, 9.8) 1.8 (0.2, 11.9) 13.3 (7.1, 23.4) 5.3 (3.7, 7.5) 7.5 (4.9, 11.4) 5.2 (3.1, 8.7)
Coupons 1.0 (0.5, 2.0) 0.9 (0.4, 2.0) 1.8 (0.2, 11.9) 0.0 (-, -) 1.2 (0.6, 2.5) 1.2 (0.6, 2.8) 0.3 (0.1, 0.8)
Free gifts/discounts on other
products 7.2 (4.8, 10.7) 7.4 (4.9, 10.9) 1.8 (0.2, 11.9) 10.2 (5.4, 18.5) 6.5 (4.2, 9.8) 8.2 (5.0, 13.1) 5.0 (2.9, 8.5)
Clothing/item with brand
name or logo 10.9 (8.0, 14.7) 11.1 (8.1, 15.0) 2.6 (0.6, 11.1) 19.0 (11.2, 30.5) 8.9 (6.3, 12.4) 12.6 (8.7, 17.9) 6.9 (4.5, 10.3)
Mail promoting cigarettes 0.0 (-, -) 0.0 (-, -) 0.0 (-, -) 0.0 (-, -) 0.0 (-, -) 0.0 (-, -) 0.0 (-, -)
One-to-one sales promotion 10.8 (7.8, 14.7) 10.7 (7.7, 14.7) 14.3 (2.7, 50.3) 12.2 (6.2, 22.8) 10.4 (7.4, 14.4) 13.3 (9.2, 18.7) 4.7 (2.7, 8.2)
Noticed any advertisement
or promotion 41.6 (36.4, 47.0) 41.7 (36.4, 47.1) 39.6 (20.0, 63.2) 51.7 (40.3, 62.9) 39.1 (33.8, 44.7) 45.3 (38.4, 52.4) 32.7 (27.3, 38.6)
Note: Current smokers include daily and occasional (less than daily) smokers.
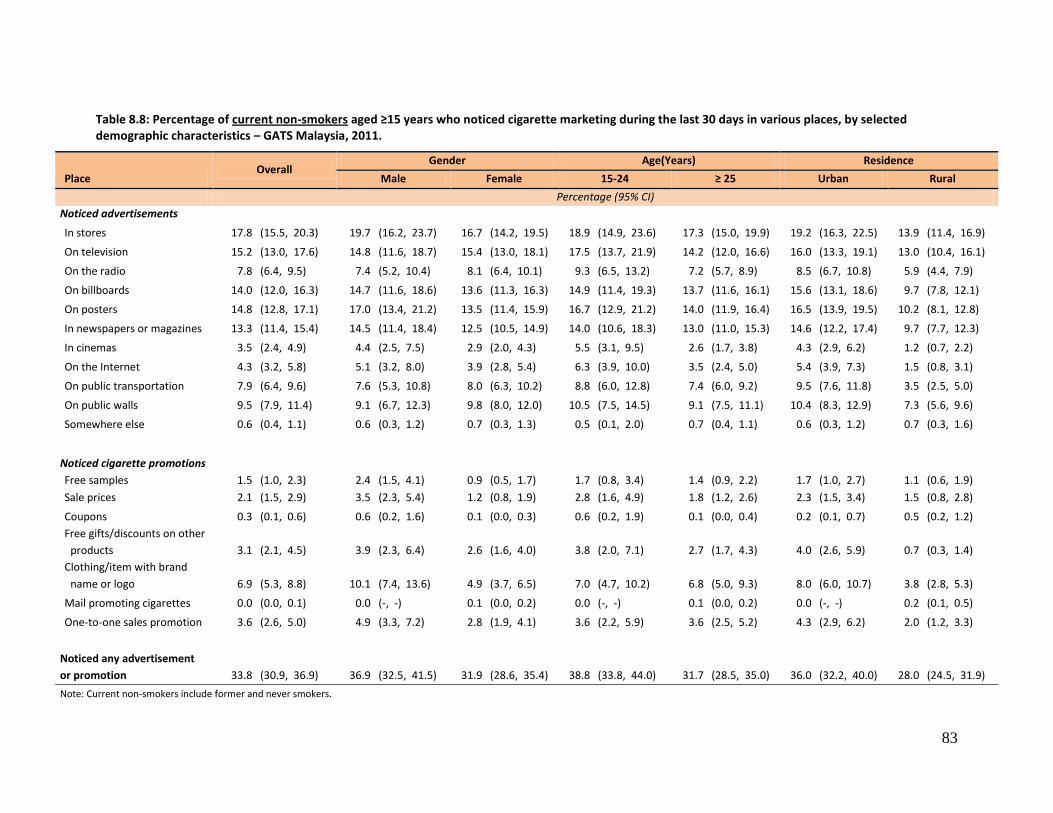
83
Table 8.8: Percentage of current non-smokers aged ≥15 years who noticed cigarette marketing during the last 30 days in various places, by selected demographic characteristics – GATS Malaysia, 2011.
Place Overall
Gender Age(Years) Residence
Male Female 15-24 ≥ 25 Urban Rural
Percentage (95% CI)
Noticed advertisements
In stores 17.8 (15.5, 20.3) 19.7 (16.2, 23.7) 16.7 (14.2, 19.5) 18.9 (14.9, 23.6) 17.3 (15.0, 19.9) 19.2 (16.3, 22.5) 13.9 (11.4, 16.9)
On television 15.2 (13.0, 17.6) 14.8 (11.6, 18.7) 15.4 (13.0, 18.1) 17.5 (13.7, 21.9) 14.2 (12.0, 16.6) 16.0 (13.3, 19.1) 13.0 (10.4, 16.1)
On the radio 7.8 (6.4, 9.5) 7.4 (5.2, 10.4) 8.1 (6.4, 10.1) 9.3 (6.5, 13.2) 7.2 (5.7, 8.9) 8.5 (6.7, 10.8) 5.9 (4.4, 7.9)
On billboards 14.0 (12.0, 16.3) 14.7 (11.6, 18.6) 13.6 (11.3, 16.3) 14.9 (11.4, 19.3) 13.7 (11.6, 16.1) 15.6 (13.1, 18.6) 9.7 (7.8, 12.1)
On posters 14.8 (12.8, 17.1) 17.0 (13.4, 21.2) 13.5 (11.4, 15.9) 16.7 (12.9, 21.2) 14.0 (11.9, 16.4) 16.5 (13.9, 19.5) 10.2 (8.1, 12.8)
In newspapers or magazines 13.3 (11.4, 15.4) 14.5 (11.4, 18.4) 12.5 (10.5, 14.9) 14.0 (10.6, 18.3) 13.0 (11.0, 15.3) 14.6 (12.2, 17.4) 9.7 (7.7, 12.3)
In cinemas 3.5 (2.4, 4.9) 4.4 (2.5, 7.5) 2.9 (2.0, 4.3) 5.5 (3.1, 9.5) 2.6 (1.7, 3.8) 4.3 (2.9, 6.2) 1.2 (0.7, 2.2)
On the Internet 4.3 (3.2, 5.8) 5.1 (3.2, 8.0) 3.9 (2.8, 5.4) 6.3 (3.9, 10.0) 3.5 (2.4, 5.0) 5.4 (3.9, 7.3) 1.5 (0.8, 3.1)
On public transportation 7.9 (6.4, 9.6) 7.6 (5.3, 10.8) 8.0 (6.3, 10.2) 8.8 (6.0, 12.8) 7.4 (6.0, 9.2) 9.5 (7.6, 11.8) 3.5 (2.5, 5.0)
On public walls 9.5 (7.9, 11.4) 9.1 (6.7, 12.3) 9.8 (8.0, 12.0) 10.5 (7.5, 14.5) 9.1 (7.5, 11.1) 10.4 (8.3, 12.9) 7.3 (5.6, 9.6)
Somewhere else 0.6 (0.4, 1.1) 0.6 (0.3, 1.2) 0.7 (0.3, 1.3) 0.5 (0.1, 2.0) 0.7 (0.4, 1.1) 0.6 (0.3, 1.2) 0.7 (0.3, 1.6)
Noticed cigarette promotions
Free samples 1.5 (1.0, 2.3) 2.4 (1.5, 4.1) 0.9 (0.5, 1.7) 1.7 (0.8, 3.4) 1.4 (0.9, 2.2) 1.7 (1.0, 2.7) 1.1 (0.6, 1.9)
Sale prices 2.1 (1.5, 2.9) 3.5 (2.3, 5.4) 1.2 (0.8, 1.9) 2.8 (1.6, 4.9) 1.8 (1.2, 2.6) 2.3 (1.5, 3.4) 1.5 (0.8, 2.8)
Coupons 0.3 (0.1, 0.6) 0.6 (0.2, 1.6) 0.1 (0.0, 0.3) 0.6 (0.2, 1.9) 0.1 (0.0, 0.4) 0.2 (0.1, 0.7) 0.5 (0.2, 1.2)
Free gifts/discounts on other
products 3.1 (2.1, 4.5) 3.9 (2.3, 6.4) 2.6 (1.6, 4.0) 3.8 (2.0, 7.1) 2.7 (1.7, 4.3) 4.0 (2.6, 5.9) 0.7 (0.3, 1.4)
Clothing/item with brand
name or logo 6.9 (5.3, 8.8) 10.1 (7.4, 13.6) 4.9 (3.7, 6.5) 7.0 (4.7, 10.2) 6.8 (5.0, 9.3) 8.0 (6.0, 10.7) 3.8 (2.8, 5.3)
Mail promoting cigarettes 0.0 (0.0, 0.1) 0.0 (-, -) 0.1 (0.0, 0.2) 0.0 (-, -) 0.1 (0.0, 0.2) 0.0 (-, -) 0.2 (0.1, 0.5)
One-to-one sales promotion 3.6 (2.6, 5.0) 4.9 (3.3, 7.2) 2.8 (1.9, 4.1) 3.6 (2.2, 5.9) 3.6 (2.5, 5.2) 4.3 (2.9, 6.2) 2.0 (1.2, 3.3)
Noticed any advertisement
or promotion 33.8 (30.9, 36.9) 36.9 (32.5, 41.5) 31.9 (28.6, 35.4) 38.8 (33.8, 44.0) 31.7 (28.5, 35.0) 36.0 (32.2, 40.0) 28.0 (24.5, 31.9)
Note: Current non-smokers include former and never smokers.
84
9. KNOWLEDGE, ATTITUDES, AND PERCEPTIONS
This chapter presents GATS results on knowledge, attitudes, and perceptions about tobacco among
Malaysians aged 15 years or older, including their beliefs about illnesses caused from tobacco use (both
smoked and smokeless), exposure to secondhand smoke (SHS), and public opinion regarding the
prohibition of indoor smoking in various places and other potential tobacco control laws. The GATS has
revealed a high level of awareness about the dangers of exposure to SHS, including serious illness, as
well as strong evidence of public support for tobacco control laws.
Key Findings
92.2% of adults in Malaysia (93.5% of non-smokers), believed that smoking causes serious illness.
85.8% of adults in Malaysia (87.7% of non-smokers) believed that breathing other people's smoke causes serious illness and disease in non-smokers.
90.4% of adults in Malaysia (92.4% of non-smokers) believed that indoor smoking should be prohibited in workplaces.
70.6% of adults in Malaysia (82.0% of non-smokers) favored increasing taxes on tobacco products.
9.1 Belief That Smoking Causes Serious Illness and Various Specific Diseases
Overall, 92.2% of adults aged 15 years or older (93.5% of non-smokers and 88.1% of current smokers)
believed that smoking causes serious illness. Most adults also believed that smoking causes stroke
(80.7%), heart attack (88.8%), lung cancer (93.7%), oral cancer (86.0%), premature birth (79.4%), throat
cancer (82.9%), miscarriage (71.9%) and gangrene (66.0%). Overall, only about half of Malaysian adults
believed that smoking causes bladder cancer (51.7%), stomach cancer (53.2%), or bone loss /
osteoporosis (47.2%). In most cases, the ≥65 age group had lower levels of belief. For example, only
85.0% of this group, believed that smoking causes serious illness. In all, 81.0% of this group believed that
smoking causes heart attack and 84.0% thought it causes lung cancer, while 70.8% believed that
smoking causes stroke; 73.0% oral cancer; and 62.3% premature birth. Details for these and other
findings are shown in Table 9.1 and 9.1a.
85
Table 9.1: Percentage of adults aged ≥15 years who believed that smoking causes serious illness and various specific diseases, by smoking status and selected demographic characteristics – GATS Malaysia, 2011.
Demographic
Characteristic
Adults who believe that smoking causes…
Serious Illness Stroke Heart Attack Lung Cancer Oral Cancer Premature birth
Percentage(95% CI)
Overall 92.2 (90.9, 93.4) 80.7 (78.5, 82.7) 88.8 (87.1, 90.2) 93.7 (92.6, 94.6) 86.0 (84.3, 87.6) 79.4 (77.6, 81.2)
Gender
Male 90.7 (88.5, 92.4) 79.2 (76.3, 81.7) 86.9 (84.4, 89.0) 92.7 (91.0, 94.1) 84.2 (81.8, 86.3) 77.3 (74.9, 79.6)
Female 93.9 (92.5, 95.1) 82.3 (79.8, 84.6) 90.8 (88.9, 92.3) 94.8 (93.4, 95.9) 88.0 (85.9, 89.8) 81.7 (79.3, 83.8)
Age (years)
15-24 93.6 (90.9, 95.6) 84.1 (80.3, 87.2) 89.8 (86.7, 92.2) 96.2 (93.9, 97.6) 90.0 (86.8, 92.5) 85.1 (81.4, 88.1)
25-44 93.7 (91.8, 95.1) 81.1 (78.0, 83.8) 89.7 (87.3, 91.7) 95.1 (93.5, 96.3) 88.6 (86.4, 90.4) 81.5 (78.8, 83.9)
45-64 90.3 (87.9, 92.3) 79.0 (75.4, 82.2) 88.2 (85.6, 90.4) 91.3 (88.9, 93.1) 80.8 (77.6, 83.8) 74.3 (70.5, 77.8)
65+ 85.0 (79.7, 89.1) 70.8 (64.4, 76.4) 81.0 (75.0, 85.8) 84.0 (77.5, 88.9) 73.0 (66.4, 78.7) 62.3 (55.1, 69.0)
Residence
Urban 92.8 (91.1, 94.2) 81.7 (78.9, 84.2) 89.3 (87.1, 91.2) 94.0 (92.5, 95.1) 87.2 (85.0, 89.1) 81.6 (79.2, 83.7)
Rural 90.8 (88.8, 92.5) 78.1 (75.2, 80.8) 87.3 (84.9, 89.4) 93.0 (91.4, 94.3) 83.1 (80.7, 85.2) 73.9 (71.0, 76.6)
Education level1
Less than primary 80.1 (74.5, 84.8) 68.2 (62.8, 73.1) 77.7 (72.5, 82.2) 81.0 (75.9, 85.2) 67.1 (61.2, 72.6) 54.4 (48.4, 60.3)
Primary 90.1 (87.2, 92.4) 78.4 (74.4, 81.9) 87.1 (83.7, 89.9) 91.9 (89.1, 94.0) 83.0 (79.6, 86.0) 72.6 (68.5, 76.4)
Secondary/high school 95.6 (94.0, 96.8) 83.7 (80.7, 86.4) 92.7 (90.4, 94.4) 96.6 (95.2, 97.6) 89.5 (87.1, 91.5) 85.2 (82.5, 87.6)
College or above 94.2 (88.1, 97.3) 78.2 (71.2, 83.9) 87.8 (80.9, 92.4) 94.4 (89.6, 97.0) 89.0 (83.2, 93.0) 85.2 (79.0, 89.8)
Race/ethnicity
Malay 93.5 (91.9, 94.8) 84.2 (81.9, 86.3) 91.7 (90.0, 93.1) 95.3 (94.1, 96.3) 88.7 (86.9, 90.3) 84.3 (82.3, 86.0)
Chinese 89.6 (85.9, 92.4) 75.0 (69.4, 79.9) 83.8 (79.5, 87.4) 92.0 (88.9, 94.3) 80.4 (75.9, 84.2) 71.0 (65.5, 75.9)
Indian 92.3 (87.0, 95.6) 81.0 (74.4, 86.2) 85.1 (78.8, 89.8) 90.0 (84.0, 93.9) 83.1 (76.6, 88.1) 77.6 (69.9, 83.8)
Other 90.2 (86.4, 93.0) 72.9 (67.3, 77.8) 85.2 (80.5, 88.9) 91.4 (88.1, 93.8) 84.0 (80.2, 87.2) 71.1 (66.3, 75.5)
Religion
Muslim 93.2 (91.8, 94.4) 83.7 (81.6, 85.7) 91.5 (89.9, 92.8) 95.1 (94.0, 96.1) 88.5 (86.8, 89.9) 82.7 (80.7, 84.5)
Non-Muslim 90.4 (87.7, 92.5) 74.9 (70.7, 78.8) 83.4 (80.0, 86.3) 90.9 (88.5, 92.8) 81.2 (77.5, 84.3) 72.9 (68.8, 76.6) 1 Education level is reported only among persons aged ≥25 years.
86
Table 9.1 (cont.): Percentage of adults aged ≥15 years who believed that smoking causes serious illness and various specific diseases, by smoking status and selected demographic characteristics – GATS Malaysia, 2011.
Demographic
Characteristic
Adults Who Believed That Smoking Causes…
Serious Illness Stroke Heart Attack Lung Cancer Oral Cancer Premature birth
Percentage(95% CI)
Current Smokers1 88.1 (84.7, 90.9) 74.6 (70.2, 78.6) 84.6 (80.7, 87.8) 90.0 (86.8, 92.4) 79.0 (75.2, 82.4) 72.0 (67.9, 75.7)
Gender
Male 88.1 (84.6, 90.8) 74.5 (70.0, 78.6) 84.4 (80.5, 87.7) 90.0 (86.8, 92.5) 79.1 (75.1, 82.5) 72.0 (67.9, 75.8)
Female 91.8 (74.8, 97.7) 76.7 (58.6, 88.4) 89.5 (73.9, 96.2) 88.8 (73.2, 95.9) 78.3 (59.5, 89.8) 72.3 (52.6, 86.0)
Age (years)
15-24 86.9 (75.9, 93.3) 76.2 (65.6, 84.3) 84.2 (74.4, 90.7) 87.7 (77.1, 93.8) 84.1 (73.9, 90.8) 80.1 (69.4, 87.7)
25-44 90.0 (85.3, 93.4) 77.0 (71.2, 81.9) 86.5 (80.7, 90.8) 93.1 (89.0, 95.7) 81.7 (76.3, 86.1) 73.1 (67.4, 78.2)
45-64 88.6 (83.2, 92.4) 71.5 (62.7, 79.0) 82.5 (75.9, 87.6) 87.8 (82.1, 91.8) 73.1 (65.6, 79.4) 68.2 (60.9, 74.6)
65+ 70.1 (51.6, 83.8) 56.1 (39.3, 71.5) 74.1 (54.5, 87.2) 75.5 (55.4, 88.4) 56.9 (40.1, 72.3) 43.6 (28.6, 59.9)
Residence
Urban 88.8 (84.1, 92.2) 77.5 (71.4, 82.6) 85.7 (80.3, 89.8) 90.2 (85.9, 93.3) 80.7 (75.4, 85.0) 73.4 (68.1, 78.2)
Rural 86.6 (82.6, 89.9) 67.5 (62.3, 72.4) 81.8 (76.9, 85.9) 89.4 (85.4, 92.4) 75.1 (70.5, 79.2) 68.6 (63.2, 73.5)
Education level2
Less than primary 81.0 (67.6, 89.7) 67.0 (54.1, 77.7) 74.2 (60.5, 84.3) 76.9 (64.4, 85.9) 59.1 (45.4, 71.5) 43.7 (32.1, 56.0)
Primary 84.7 (77.0, 90.1) 70.2 (61.8, 77.4) 80.8 (72.3, 87.2) 90.3 (82.8, 94.8) 78.3 (70.3, 84.6) 65.3 (56.9, 72.8)
Secondary/high school 93.5 (89.3, 96.2) 79.1 (72.6, 84.4) 90.5 (85.0, 94.1) 93.7 (89.4, 96.3) 82.0 (76.3, 86.7) 78.9 (72.7, 84.0)
College or above 84.6 (71.1, 92.5) 70.8 (56.9, 81.6) 80.4 (67.3, 89.1) 90.4 (77.6, 96.3) 73.8 (60.7, 83.7) 72.1 (58.5, 82.6)
Race/ethnicity
Malay 89.2 (85.1, 92.2) 76.9 (72.0, 81.2) 87.6 (83.5, 90.8) 91.2 (87.4, 93.9) 81.0 (76.7, 84.6) 77.1 (72.4, 81.2)
Chinese 87.2 (72.0, 94.7) 67.9 (51.0, 81.1) 82.7 (67.0, 91.8) 89.0 (73.3, 95.9) 71.6 (56.3, 83.2) 59.0 (43.7, 72.7)
Indian 90.6 (76.9, 96.5) 72.2 (55.5, 84.4) 73.6 (54.7, 86.5) 87.1 (72.6, 94.5) 77.8 (60.0, 89.1) 66.7 (49.2, 80.6)
Other 83.8 (73.2, 90.7) 72.0 (63.2, 79.3) 79.7 (70.0, 86.9) 87.4 (78.6, 92.9) 77.9 (69.2, 84.6) 65.4 (56.8, 73.1)
Religion
Muslim 88.6 (84.7, 91.6) 77.0 (72.6, 80.9) 86.8 (82.9, 90.0) 91.1 (87.6, 93.6) 81.0 (77.1, 84.4) 75.4 (71.0, 79.3)
Non-Muslim 86.9 (78.9, 92.1) 67.7 (58.1, 76.1) 78.1 (68.3, 85.5) 86.8 (79.0, 91.9) 73.5 (63.8, 81.3) 62.4 (52.9, 71.1) 1 Includes daily and occasional (less than daily) smokers. 2 Education level is reported only among adults aged ≥25 years.
87
Table 9.1 (cont.): Percentage of adults aged ≥15 years who believed that smoking causes serious illness and various specific diseases, by smoking status and selected demographic characteristics – GATS Malaysia, 2011.
Demographic
Characteristic
Adults who believe that smoking causes…
Serious Illness Stroke Heart Attack Lung Cancer Oral Cancer Premature birth
Percentage(95% CI)
Non-smokers1 93.5 (92.1, 94.6) 82.5 (80.2, 84.6) 90.0 (88.2, 91.6) 94.8 (93.7, 95.7) 88.1 (86.3, 89.7) 81.7 (79.6, 83.6)
Gender
Male 92.7 (89.8, 94.7) 82.8 (79.2, 85.9) 88.8 (85.6, 91.3) 94.8 (92.8, 96.2) 88.2 (85.2, 90.7) 81.5 (78.3, 84.3)
Female 93.9 (92.5, 95.1) 82.4 (79.8, 84.7) 90.8 (88.9, 92.3) 94.8 (93.5, 95.9) 88.1 (86.0, 89.9) 81.8 (79.4, 83.9)
Age (years)
15-24 95.0 (92.3, 96.8) 85.7 (81.6, 88.9) 90.9 (87.5, 93.5) 97.8 (96.2, 98.8) 91.2 (87.7, 93.7) 86.1 (82.4, 89.1)
25-44 95.1 (93.2, 96.5) 82.8 (79.2, 85.8) 91.0 (88.5, 93.0) 95.9 (94.1, 97.1) 91.4 (89.3, 93.1) 84.9 (82.1, 87.4)
45-64 90.8 (87.9, 93.0) 81.2 (77.3, 84.5) 89.9 (87.0, 92.3) 92.3 (89.5, 94.4) 83.1 (79.6, 86.2) 76.1 (72.1, 79.8)
65+ 87.6 (82.2, 91.5) 73.4 (66.3, 79.5) 82.2 (75.7, 87.3) 85.5 (78.6, 90.5) 75.8 (68.6, 81.8) 65.6 (57.6, 72.8)
Residence
Urban 94.0 (92.2, 95.4) 82.9 (79.9, 85.6) 90.4 (88.0, 92.3) 95.1 (93.6, 96.2) 89.1 (86.7, 91.0) 83.9 (81.3, 86.3)
Rural 92.1 (90.0, 93.9) 81.5 (78.3, 84.4) 89.1 (86.7, 91.1) 94.1 (92.6, 95.3) 85.6 (83.1, 87.8) 75.6 (72.4, 78.6)
Education level2
Less than primary 79.9 (73.9, 84.8) 68.5 (62.6, 73.8) 78.6 (73.1, 83.2) 82.0 (76.6, 86.3) 69.1 (63.0, 74.6) 57.1 (50.5, 63.4)
Primary 92.3 (89.6, 94.3) 81.8 (77.4, 85.5) 89.7 (86.6, 92.2) 92.6 (89.5, 94.8) 85.0 (81.5, 88.0) 75.6 (71.2, 79.6)
Secondary/high school 96.4 (94.5, 97.6) 85.4 (82.1, 88.2) 93.5 (90.9, 95.3) 97.7 (96.4, 98.5) 92.2 (89.8, 94.1) 87.5 (84.5, 90.0)
College or above 96.3 (89.9, 98.7) 79.9 (72.0, 86.0) 89.5 (82.6, 93.8) 95.3 (89.2, 98.0) 92.5 (86.1, 96.1) 87.9 (80.3, 92.9)
Race/ethnicity
Malay 94.9 (93.4, 96.1) 86.6 (84.1, 88.7) 93.0 (91.4, 94.4) 96.6 (95.6, 97.5) 91.3 (89.4, 92.8) 86.6 (84.5, 88.4)
Chinese 90.0 (86.3, 92.8) 76.3 (70.7, 81.1) 84.0 (79.6, 87.6) 92.6 (89.7, 94.8) 82.0 (77.2, 85.9) 73.2 (67.2, 78.5)
Indian 92.7 (86.4, 96.2) 83.1 (75.3, 88.9) 87.9 (80.8, 92.7) 90.7 (83.5, 94.9) 84.4 (77.5, 89.5) 80.2 (71.9, 86.5)
Other 92.9 (89.7, 95.1) 73.3 (66.2, 79.4) 87.5 (82.2, 91.3) 93.1 (89.9, 95.3) 86.6 (82.6, 89.8) 73.5 (67.9, 78.5)
Religion
Muslim 94.8 (93.4, 95.9) 86.0 (83.8, 88.0) 93.0 (91.5, 94.3) 96.5 (95.5, 97.3) 91.0 (89.3, 92.5) 85.2 (83.1, 87.0)
Non-Muslim 91.2 (88.3, 93.3) 76.6 (71.8, 80.7) 84.6 (80.9, 87.7) 91.8 (89.3, 93.8) 82.9 (79.2, 86.1) 75.2 (70.7, 79.3) 1 Includes former and never smokers. 2 Education level is reported only among adults aged ≥25 years.
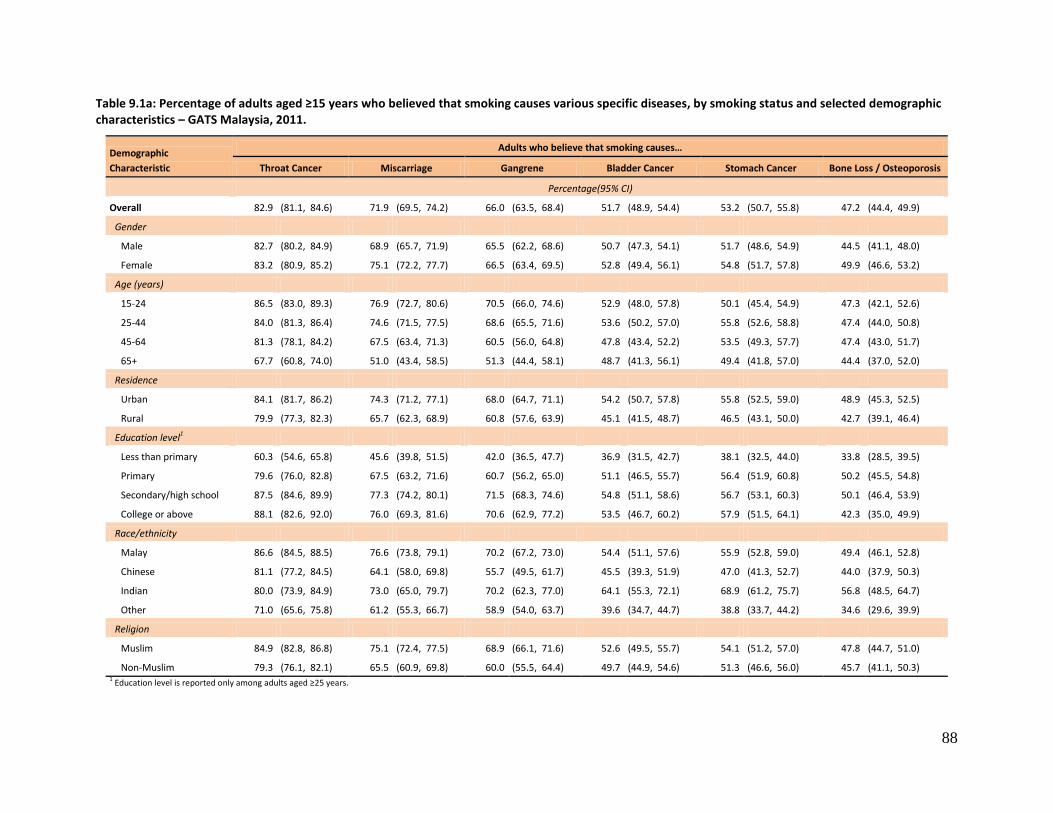
88
Table 9.1a: Percentage of adults aged ≥15 years who believed that smoking causes various specific diseases, by smoking status and selected demographic characteristics – GATS Malaysia, 2011.
Demographic
Characteristic
Adults who believe that smoking causes…
Throat Cancer Miscarriage Gangrene Bladder Cancer Stomach Cancer Bone Loss / Osteoporosis
Percentage(95% CI)
Overall 82.9 (81.1, 84.6) 71.9 (69.5, 74.2) 66.0 (63.5, 68.4) 51.7 (48.9, 54.4) 53.2 (50.7, 55.8) 47.2 (44.4, 49.9)
Gender
Male 82.7 (80.2, 84.9) 68.9 (65.7, 71.9) 65.5 (62.2, 68.6) 50.7 (47.3, 54.1) 51.7 (48.6, 54.9) 44.5 (41.1, 48.0)
Female 83.2 (80.9, 85.2) 75.1 (72.2, 77.7) 66.5 (63.4, 69.5) 52.8 (49.4, 56.1) 54.8 (51.7, 57.8) 49.9 (46.6, 53.2)
Age (years)
15-24 86.5 (83.0, 89.3) 76.9 (72.7, 80.6) 70.5 (66.0, 74.6) 52.9 (48.0, 57.8) 50.1 (45.4, 54.9) 47.3 (42.1, 52.6)
25-44 84.0 (81.3, 86.4) 74.6 (71.5, 77.5) 68.6 (65.5, 71.6) 53.6 (50.2, 57.0) 55.8 (52.6, 58.8) 47.4 (44.0, 50.8)
45-64 81.3 (78.1, 84.2) 67.5 (63.4, 71.3) 60.5 (56.0, 64.8) 47.8 (43.4, 52.2) 53.5 (49.3, 57.7) 47.4 (43.0, 51.7)
65+ 67.7 (60.8, 74.0) 51.0 (43.4, 58.5) 51.3 (44.4, 58.1) 48.7 (41.3, 56.1) 49.4 (41.8, 57.0) 44.4 (37.0, 52.0)
Residence
Urban 84.1 (81.7, 86.2) 74.3 (71.2, 77.1) 68.0 (64.7, 71.1) 54.2 (50.7, 57.8) 55.8 (52.5, 59.0) 48.9 (45.3, 52.5)
Rural 79.9 (77.3, 82.3) 65.7 (62.3, 68.9) 60.8 (57.6, 63.9) 45.1 (41.5, 48.7) 46.5 (43.1, 50.0) 42.7 (39.1, 46.4)
Education level1
Less than primary 60.3 (54.6, 65.8) 45.6 (39.8, 51.5) 42.0 (36.5, 47.7) 36.9 (31.5, 42.7) 38.1 (32.5, 44.0) 33.8 (28.5, 39.5)
Primary 79.6 (76.0, 82.8) 67.5 (63.2, 71.6) 60.7 (56.2, 65.0) 51.1 (46.5, 55.7) 56.4 (51.9, 60.8) 50.2 (45.5, 54.8)
Secondary/high school 87.5 (84.6, 89.9) 77.3 (74.2, 80.1) 71.5 (68.3, 74.6) 54.8 (51.1, 58.6) 56.7 (53.1, 60.3) 50.1 (46.4, 53.9)
College or above 88.1 (82.6, 92.0) 76.0 (69.3, 81.6) 70.6 (62.9, 77.2) 53.5 (46.7, 60.2) 57.9 (51.5, 64.1) 42.3 (35.0, 49.9)
Race/ethnicity
Malay 86.6 (84.5, 88.5) 76.6 (73.8, 79.1) 70.2 (67.2, 73.0) 54.4 (51.1, 57.6) 55.9 (52.8, 59.0) 49.4 (46.1, 52.8)
Chinese 81.1 (77.2, 84.5) 64.1 (58.0, 69.8) 55.7 (49.5, 61.7) 45.5 (39.3, 51.9) 47.0 (41.3, 52.7) 44.0 (37.9, 50.3)
Indian 80.0 (73.9, 84.9) 73.0 (65.0, 79.7) 70.2 (62.3, 77.0) 64.1 (55.3, 72.1) 68.9 (61.2, 75.7) 56.8 (48.5, 64.7)
Other 71.0 (65.6, 75.8) 61.2 (55.3, 66.7) 58.9 (54.0, 63.7) 39.6 (34.7, 44.7) 38.8 (33.7, 44.2) 34.6 (29.6, 39.9)
Religion
Muslim 84.9 (82.8, 86.8) 75.1 (72.4, 77.5) 68.9 (66.1, 71.6) 52.6 (49.5, 55.7) 54.1 (51.2, 57.0) 47.8 (44.7, 51.0)
Non-Muslim 79.3 (76.1, 82.1) 65.5 (60.9, 69.8) 60.0 (55.5, 64.4) 49.7 (44.9, 54.6) 51.3 (46.6, 56.0) 45.7 (41.1, 50.3) 1 Education level is reported only among adults aged ≥25 years.
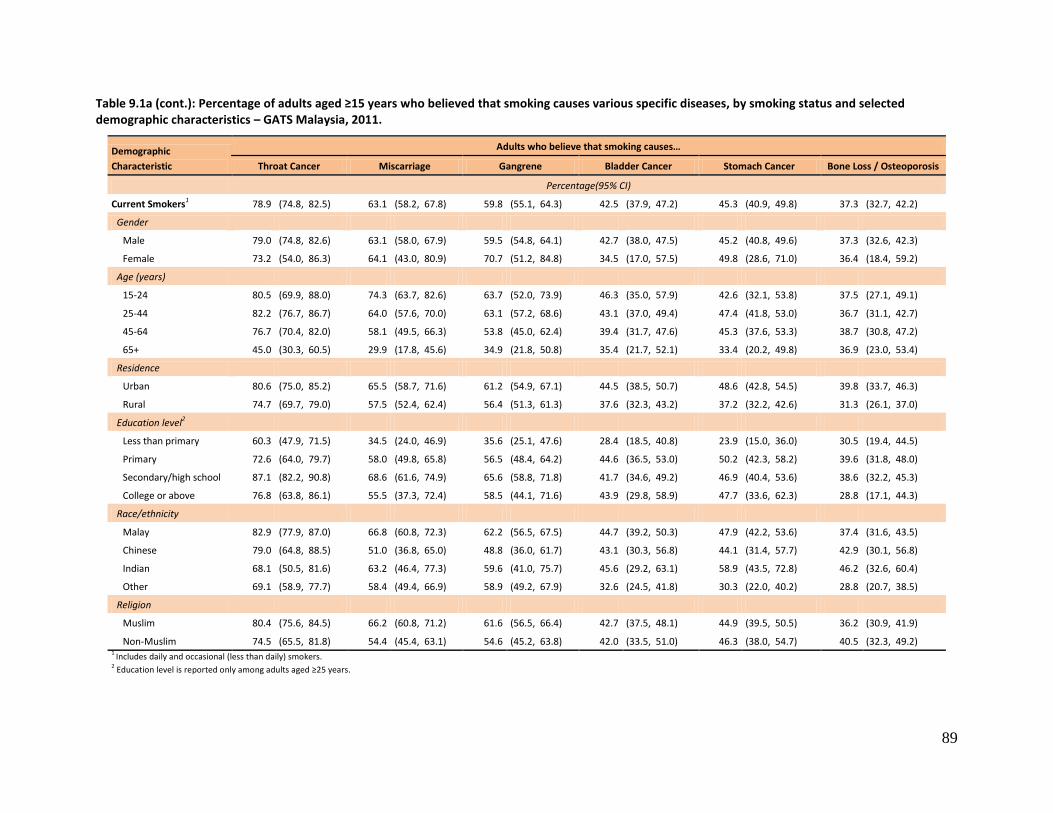
89
Table 9.1a (cont.): Percentage of adults aged ≥15 years who believed that smoking causes various specific diseases, by smoking status and selected demographic characteristics – GATS Malaysia, 2011.
Demographic
Characteristic
Adults who believe that smoking causes…
Throat Cancer Miscarriage Gangrene Bladder Cancer Stomach Cancer Bone Loss / Osteoporosis
Percentage(95% CI)
Current Smokers1 78.9 (74.8, 82.5) 63.1 (58.2, 67.8) 59.8 (55.1, 64.3) 42.5 (37.9, 47.2) 45.3 (40.9, 49.8) 37.3 (32.7, 42.2)
Gender
Male 79.0 (74.8, 82.6) 63.1 (58.0, 67.9) 59.5 (54.8, 64.1) 42.7 (38.0, 47.5) 45.2 (40.8, 49.6) 37.3 (32.6, 42.3)
Female 73.2 (54.0, 86.3) 64.1 (43.0, 80.9) 70.7 (51.2, 84.8) 34.5 (17.0, 57.5) 49.8 (28.6, 71.0) 36.4 (18.4, 59.2)
Age (years)
15-24 80.5 (69.9, 88.0) 74.3 (63.7, 82.6) 63.7 (52.0, 73.9) 46.3 (35.0, 57.9) 42.6 (32.1, 53.8) 37.5 (27.1, 49.1)
25-44 82.2 (76.7, 86.7) 64.0 (57.6, 70.0) 63.1 (57.2, 68.6) 43.1 (37.0, 49.4) 47.4 (41.8, 53.0) 36.7 (31.1, 42.7)
45-64 76.7 (70.4, 82.0) 58.1 (49.5, 66.3) 53.8 (45.0, 62.4) 39.4 (31.7, 47.6) 45.3 (37.6, 53.3) 38.7 (30.8, 47.2)
65+ 45.0 (30.3, 60.5) 29.9 (17.8, 45.6) 34.9 (21.8, 50.8) 35.4 (21.7, 52.1) 33.4 (20.2, 49.8) 36.9 (23.0, 53.4)
Residence
Urban 80.6 (75.0, 85.2) 65.5 (58.7, 71.6) 61.2 (54.9, 67.1) 44.5 (38.5, 50.7) 48.6 (42.8, 54.5) 39.8 (33.7, 46.3)
Rural 74.7 (69.7, 79.0) 57.5 (52.4, 62.4) 56.4 (51.3, 61.3) 37.6 (32.3, 43.2) 37.2 (32.2, 42.6) 31.3 (26.1, 37.0)
Education level2
Less than primary 60.3 (47.9, 71.5) 34.5 (24.0, 46.9) 35.6 (25.1, 47.6) 28.4 (18.5, 40.8) 23.9 (15.0, 36.0) 30.5 (19.4, 44.5)
Primary 72.6 (64.0, 79.7) 58.0 (49.8, 65.8) 56.5 (48.4, 64.2) 44.6 (36.5, 53.0) 50.2 (42.3, 58.2) 39.6 (31.8, 48.0)
Secondary/high school 87.1 (82.2, 90.8) 68.6 (61.6, 74.9) 65.6 (58.8, 71.8) 41.7 (34.6, 49.2) 46.9 (40.4, 53.6) 38.6 (32.2, 45.3)
College or above 76.8 (63.8, 86.1) 55.5 (37.3, 72.4) 58.5 (44.1, 71.6) 43.9 (29.8, 58.9) 47.7 (33.6, 62.3) 28.8 (17.1, 44.3)
Race/ethnicity
Malay 82.9 (77.9, 87.0) 66.8 (60.8, 72.3) 62.2 (56.5, 67.5) 44.7 (39.2, 50.3) 47.9 (42.2, 53.6) 37.4 (31.6, 43.5)
Chinese 79.0 (64.8, 88.5) 51.0 (36.8, 65.0) 48.8 (36.0, 61.7) 43.1 (30.3, 56.8) 44.1 (31.4, 57.7) 42.9 (30.1, 56.8)
Indian 68.1 (50.5, 81.6) 63.2 (46.4, 77.3) 59.6 (41.0, 75.7) 45.6 (29.2, 63.1) 58.9 (43.5, 72.8) 46.2 (32.6, 60.4)
Other 69.1 (58.9, 77.7) 58.4 (49.4, 66.9) 58.9 (49.2, 67.9) 32.6 (24.5, 41.8) 30.3 (22.0, 40.2) 28.8 (20.7, 38.5)
Religion
Muslim 80.4 (75.6, 84.5) 66.2 (60.8, 71.2) 61.6 (56.5, 66.4) 42.7 (37.5, 48.1) 44.9 (39.5, 50.5) 36.2 (30.9, 41.9)
Non-Muslim 74.5 (65.5, 81.8) 54.4 (45.4, 63.1) 54.6 (45.2, 63.8) 42.0 (33.5, 51.0) 46.3 (38.0, 54.7) 40.5 (32.3, 49.2) 1 Includes daily and occasional (less than daily) smokers. 2 Education level is reported only among adults aged ≥25 years.
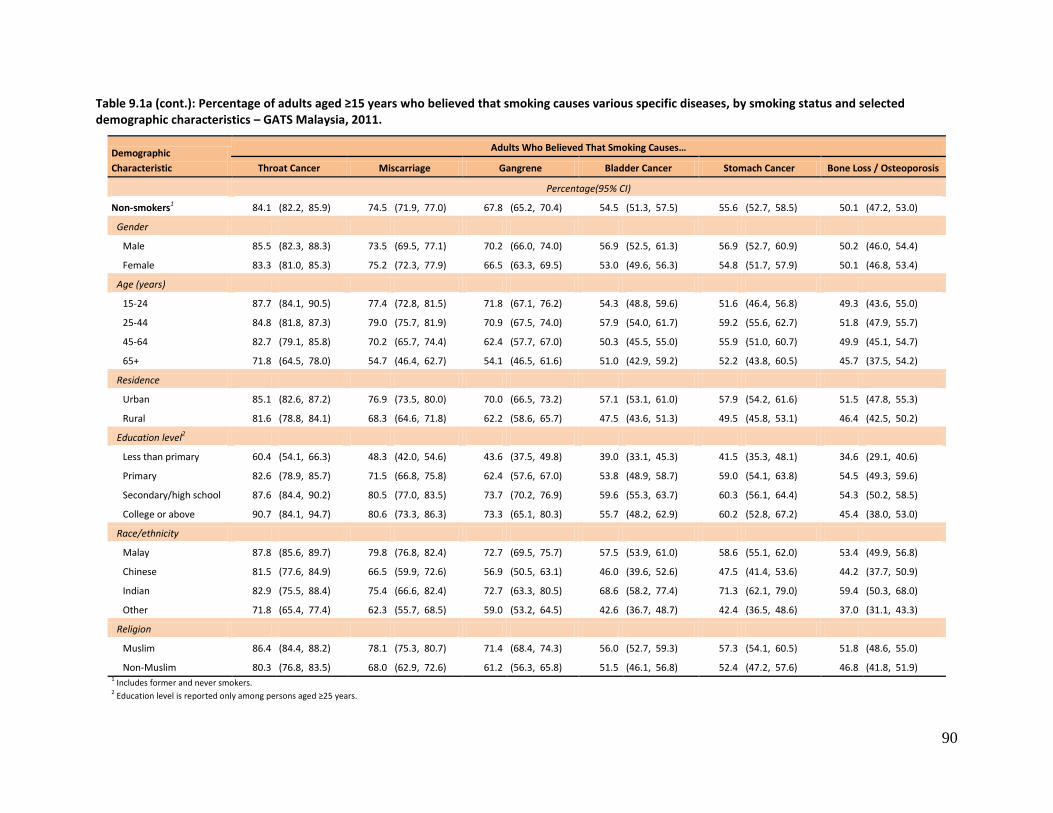
90
Table 9.1a (cont.): Percentage of adults aged ≥15 years who believed that smoking causes various specific diseases, by smoking status and selected demographic characteristics – GATS Malaysia, 2011.
Demographic
Characteristic
Adults Who Believed That Smoking Causes…
Throat Cancer Miscarriage Gangrene Bladder Cancer Stomach Cancer Bone Loss / Osteoporosis
Percentage(95% CI)
Non-smokers1 84.1 (82.2, 85.9) 74.5 (71.9, 77.0) 67.8 (65.2, 70.4) 54.5 (51.3, 57.5) 55.6 (52.7, 58.5) 50.1 (47.2, 53.0)
Gender
Male 85.5 (82.3, 88.3) 73.5 (69.5, 77.1) 70.2 (66.0, 74.0) 56.9 (52.5, 61.3) 56.9 (52.7, 60.9) 50.2 (46.0, 54.4)
Female 83.3 (81.0, 85.3) 75.2 (72.3, 77.9) 66.5 (63.3, 69.5) 53.0 (49.6, 56.3) 54.8 (51.7, 57.9) 50.1 (46.8, 53.4)
Age (years)
15-24 87.7 (84.1, 90.5) 77.4 (72.8, 81.5) 71.8 (67.1, 76.2) 54.3 (48.8, 59.6) 51.6 (46.4, 56.8) 49.3 (43.6, 55.0)
25-44 84.8 (81.8, 87.3) 79.0 (75.7, 81.9) 70.9 (67.5, 74.0) 57.9 (54.0, 61.7) 59.2 (55.6, 62.7) 51.8 (47.9, 55.7)
45-64 82.7 (79.1, 85.8) 70.2 (65.7, 74.4) 62.4 (57.7, 67.0) 50.3 (45.5, 55.0) 55.9 (51.0, 60.7) 49.9 (45.1, 54.7)
65+ 71.8 (64.5, 78.0) 54.7 (46.4, 62.7) 54.1 (46.5, 61.6) 51.0 (42.9, 59.2) 52.2 (43.8, 60.5) 45.7 (37.5, 54.2)
Residence
Urban 85.1 (82.6, 87.2) 76.9 (73.5, 80.0) 70.0 (66.5, 73.2) 57.1 (53.1, 61.0) 57.9 (54.2, 61.6) 51.5 (47.8, 55.3)
Rural 81.6 (78.8, 84.1) 68.3 (64.6, 71.8) 62.2 (58.6, 65.7) 47.5 (43.6, 51.3) 49.5 (45.8, 53.1) 46.4 (42.5, 50.2)
Education level2
Less than primary 60.4 (54.1, 66.3) 48.3 (42.0, 54.6) 43.6 (37.5, 49.8) 39.0 (33.1, 45.3) 41.5 (35.3, 48.1) 34.6 (29.1, 40.6)
Primary 82.6 (78.9, 85.7) 71.5 (66.8, 75.8) 62.4 (57.6, 67.0) 53.8 (48.9, 58.7) 59.0 (54.1, 63.8) 54.5 (49.3, 59.6)
Secondary/high school 87.6 (84.4, 90.2) 80.5 (77.0, 83.5) 73.7 (70.2, 76.9) 59.6 (55.3, 63.7) 60.3 (56.1, 64.4) 54.3 (50.2, 58.5)
College or above 90.7 (84.1, 94.7) 80.6 (73.3, 86.3) 73.3 (65.1, 80.3) 55.7 (48.2, 62.9) 60.2 (52.8, 67.2) 45.4 (38.0, 53.0)
Race/ethnicity
Malay 87.8 (85.6, 89.7) 79.8 (76.8, 82.4) 72.7 (69.5, 75.7) 57.5 (53.9, 61.0) 58.6 (55.1, 62.0) 53.4 (49.9, 56.8)
Chinese 81.5 (77.6, 84.9) 66.5 (59.9, 72.6) 56.9 (50.5, 63.1) 46.0 (39.6, 52.6) 47.5 (41.4, 53.6) 44.2 (37.7, 50.9)
Indian 82.9 (75.5, 88.4) 75.4 (66.6, 82.4) 72.7 (63.3, 80.5) 68.6 (58.2, 77.4) 71.3 (62.1, 79.0) 59.4 (50.3, 68.0)
Other 71.8 (65.4, 77.4) 62.3 (55.7, 68.5) 59.0 (53.2, 64.5) 42.6 (36.7, 48.7) 42.4 (36.5, 48.6) 37.0 (31.1, 43.3)
Religion
Muslim 86.4 (84.4, 88.2) 78.1 (75.3, 80.7) 71.4 (68.4, 74.3) 56.0 (52.7, 59.3) 57.3 (54.1, 60.5) 51.8 (48.6, 55.0)
Non-Muslim 80.3 (76.8, 83.5) 68.0 (62.9, 72.6) 61.2 (56.3, 65.8) 51.5 (46.1, 56.8) 52.4 (47.2, 57.6) 46.8 (41.8, 51.9) 1 Includes former and never smokers. 2 Education level is reported only among persons aged ≥25 years.
91
9.2 Levels of Belief That Breathing Other People's Smoke Causes Serious Illness in Non-
Smokers
Non-smokers were significantly more likely than smokers to believe that breathing other people’s smoke
causes serious illness (Table 9.2, 87.7% vs. 79.8%). There were also significant differences between the
two groups in believing that breathing other people's smoke causes lung illnesses in children (87.5% of
non-smokers, 79.7% of smokers) and lung cancer in adults (87.6% vs. 81.4%). For believing that smoking
causes serious heart disease in adults the estimates were 81.2% and 76.2% for non-smokers and
smokers, respectively, but here the difference was not significant. Among Malaysians aged 65 or over,
only 73.3% believed that breathing other people's smoke causes serious illness, just 68.7% believed it
causes heart disease in adults, 69.5% believed it causes lung illnesses in children, and 71.7% believed it
causes lung cancer in adults.
9.3 Support for Prohibiting Indoor Smoking in Various Places
Overall, among adults aged ≥15 years the percentages in favour of prohibiting indoor smoking (Table
9.3) at various places were 90.4% for workplaces; 83.5% restaurants; 78.7% hotels; 85.2% public
transportation terminals; and 94.4% shopping centers. There was generally little difference overall in the
levels of these beliefs across demographic characteristics, but a significant difference by smoking status
was seen for banning smoking in restaurants: 72.7% of smokers vs. 86.7% of non-smokers. There were
also significant differences between current smokers and non-smokers relative to banning smoking in
bars (34.1% of smokers vs. 46.9% of non-smokers), casinos (29.1% vs. 43.2%), discos (26.7% vs. 41.2%),
and karaoke centers (38.0% vs. 54.2%).
9.4 Support for Tobacco Control Laws
Overall, 70.6% of Malaysian adults aged ≥15 years were in favor of increasing taxes on tobacco products,
and 75.6% were in favor of prohibiting the display of tobacco products at points-of-sale (Table 9.4).
However, just 32.0% of current smokers favoured the tax increase, versus 82.0% of non-smokers. There
was also a schism between the two groups for prohibiting the display of tobacco products at points-of-
sale, which was favoured by 83.8% of non-smokers but only 47.9% of current smokers.
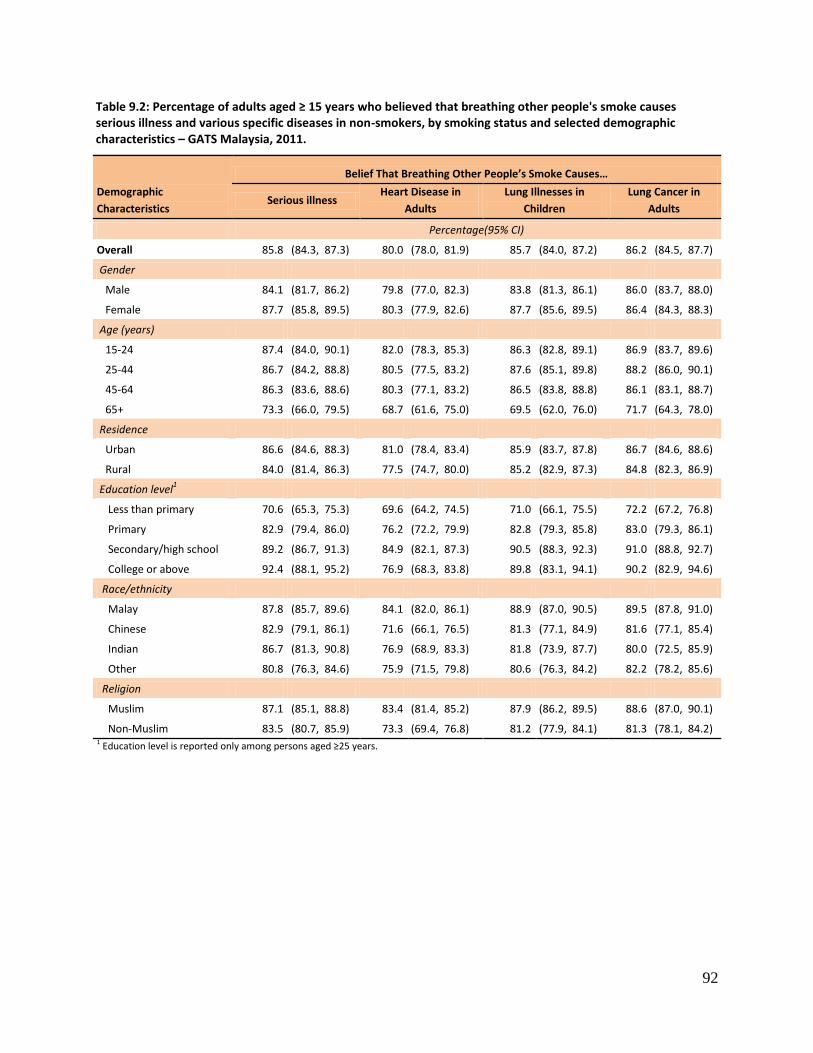
92
Table 9.2: Percentage of adults aged ≥ 15 years who believed that breathing other people's smoke causes serious illness and various specific diseases in non-smokers, by smoking status and selected demographic characteristics – GATS Malaysia, 2011.
Demographic
Characteristics
Belief That Breathing Other People’s Smoke Causes…
Serious illness Heart Disease in
Adults
Lung Illnesses in
Children
Lung Cancer in
Adults
Percentage(95% CI)
Overall 85.8 (84.3, 87.3) 80.0 (78.0, 81.9) 85.7 (84.0, 87.2) 86.2 (84.5, 87.7)
Gender
Male 84.1 (81.7, 86.2) 79.8 (77.0, 82.3) 83.8 (81.3, 86.1) 86.0 (83.7, 88.0)
Female 87.7 (85.8, 89.5) 80.3 (77.9, 82.6) 87.7 (85.6, 89.5) 86.4 (84.3, 88.3)
Age (years)
15-24 87.4 (84.0, 90.1) 82.0 (78.3, 85.3) 86.3 (82.8, 89.1) 86.9 (83.7, 89.6)
25-44 86.7 (84.2, 88.8) 80.5 (77.5, 83.2) 87.6 (85.1, 89.8) 88.2 (86.0, 90.1)
45-64 86.3 (83.6, 88.6) 80.3 (77.1, 83.2) 86.5 (83.8, 88.8) 86.1 (83.1, 88.7)
65+ 73.3 (66.0, 79.5) 68.7 (61.6, 75.0) 69.5 (62.0, 76.0) 71.7 (64.3, 78.0)
Residence
Urban 86.6 (84.6, 88.3) 81.0 (78.4, 83.4) 85.9 (83.7, 87.8) 86.7 (84.6, 88.6)
Rural 84.0 (81.4, 86.3) 77.5 (74.7, 80.0) 85.2 (82.9, 87.3) 84.8 (82.3, 86.9)
Education level1
Less than primary 70.6 (65.3, 75.3) 69.6 (64.2, 74.5) 71.0 (66.1, 75.5) 72.2 (67.2, 76.8)
Primary 82.9 (79.4, 86.0) 76.2 (72.2, 79.9) 82.8 (79.3, 85.8) 83.0 (79.3, 86.1)
Secondary/high school 89.2 (86.7, 91.3) 84.9 (82.1, 87.3) 90.5 (88.3, 92.3) 91.0 (88.8, 92.7)
College or above 92.4 (88.1, 95.2) 76.9 (68.3, 83.8) 89.8 (83.1, 94.1) 90.2 (82.9, 94.6)
Race/ethnicity
Malay 87.8 (85.7, 89.6) 84.1 (82.0, 86.1) 88.9 (87.0, 90.5) 89.5 (87.8, 91.0)
Chinese 82.9 (79.1, 86.1) 71.6 (66.1, 76.5) 81.3 (77.1, 84.9) 81.6 (77.1, 85.4)
Indian 86.7 (81.3, 90.8) 76.9 (68.9, 83.3) 81.8 (73.9, 87.7) 80.0 (72.5, 85.9)
Other 80.8 (76.3, 84.6) 75.9 (71.5, 79.8) 80.6 (76.3, 84.2) 82.2 (78.2, 85.6)
Religion
Muslim 87.1 (85.1, 88.8) 83.4 (81.4, 85.2) 87.9 (86.2, 89.5) 88.6 (87.0, 90.1)
Non-Muslim 83.5 (80.7, 85.9) 73.3 (69.4, 76.8) 81.2 (77.9, 84.1) 81.3 (78.1, 84.2) 1 Education level is reported only among persons aged ≥25 years.
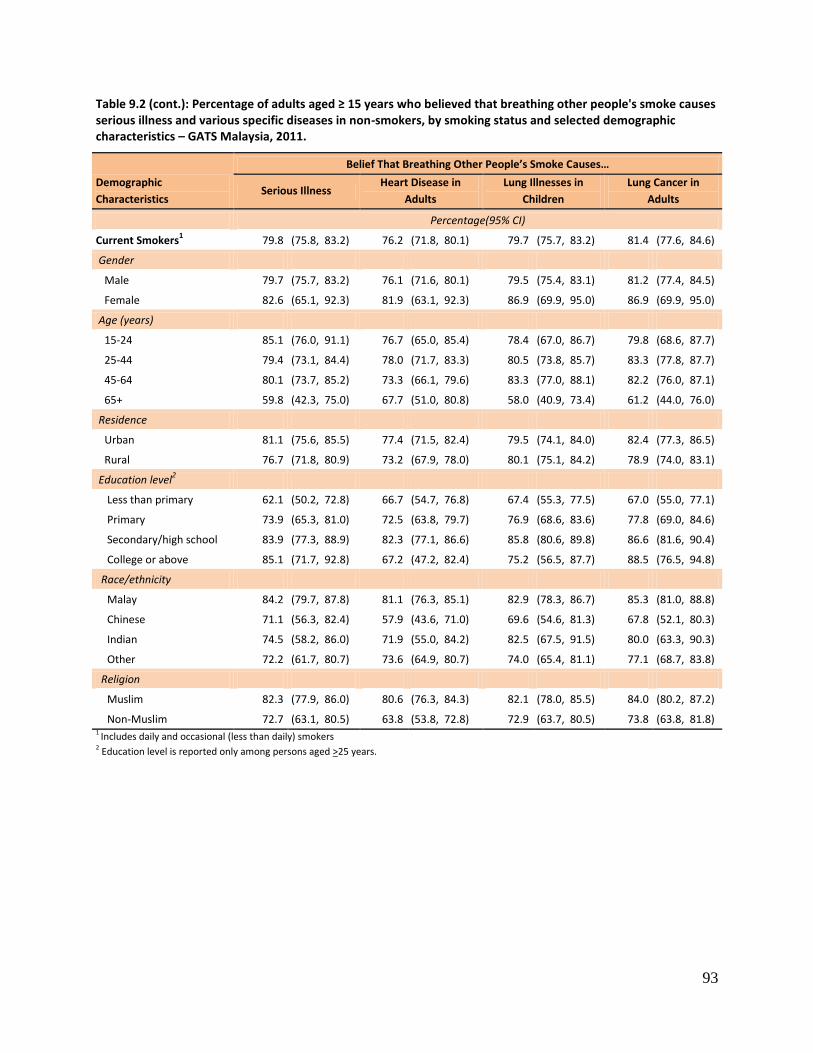
93
Table 9.2 (cont.): Percentage of adults aged ≥ 15 years who believed that breathing other people's smoke causes serious illness and various specific diseases in non-smokers, by smoking status and selected demographic characteristics – GATS Malaysia, 2011.
Demographic
Characteristics
Belief That Breathing Other People’s Smoke Causes…
Serious Illness Heart Disease in
Adults
Lung Illnesses in
Children
Lung Cancer in
Adults
Percentage(95% CI)
Current Smokers1 79.8 (75.8, 83.2) 76.2 (71.8, 80.1) 79.7 (75.7, 83.2) 81.4 (77.6, 84.6)
Gender
Male 79.7 (75.7, 83.2) 76.1 (71.6, 80.1) 79.5 (75.4, 83.1) 81.2 (77.4, 84.5)
Female 82.6 (65.1, 92.3) 81.9 (63.1, 92.3) 86.9 (69.9, 95.0) 86.9 (69.9, 95.0)
Age (years)
15-24 85.1 (76.0, 91.1) 76.7 (65.0, 85.4) 78.4 (67.0, 86.7) 79.8 (68.6, 87.7)
25-44 79.4 (73.1, 84.4) 78.0 (71.7, 83.3) 80.5 (73.8, 85.7) 83.3 (77.8, 87.7)
45-64 80.1 (73.7, 85.2) 73.3 (66.1, 79.6) 83.3 (77.0, 88.1) 82.2 (76.0, 87.1)
65+ 59.8 (42.3, 75.0) 67.7 (51.0, 80.8) 58.0 (40.9, 73.4) 61.2 (44.0, 76.0)
Residence
Urban 81.1 (75.6, 85.5) 77.4 (71.5, 82.4) 79.5 (74.1, 84.0) 82.4 (77.3, 86.5)
Rural 76.7 (71.8, 80.9) 73.2 (67.9, 78.0) 80.1 (75.1, 84.2) 78.9 (74.0, 83.1)
Education level2
Less than primary 62.1 (50.2, 72.8) 66.7 (54.7, 76.8) 67.4 (55.3, 77.5) 67.0 (55.0, 77.1)
Primary 73.9 (65.3, 81.0) 72.5 (63.8, 79.7) 76.9 (68.6, 83.6) 77.8 (69.0, 84.6)
Secondary/high school 83.9 (77.3, 88.9) 82.3 (77.1, 86.6) 85.8 (80.6, 89.8) 86.6 (81.6, 90.4)
College or above 85.1 (71.7, 92.8) 67.2 (47.2, 82.4) 75.2 (56.5, 87.7) 88.5 (76.5, 94.8)
Race/ethnicity
Malay 84.2 (79.7, 87.8) 81.1 (76.3, 85.1) 82.9 (78.3, 86.7) 85.3 (81.0, 88.8)
Chinese 71.1 (56.3, 82.4) 57.9 (43.6, 71.0) 69.6 (54.6, 81.3) 67.8 (52.1, 80.3)
Indian 74.5 (58.2, 86.0) 71.9 (55.0, 84.2) 82.5 (67.5, 91.5) 80.0 (63.3, 90.3)
Other 72.2 (61.7, 80.7) 73.6 (64.9, 80.7) 74.0 (65.4, 81.1) 77.1 (68.7, 83.8)
Religion
Muslim 82.3 (77.9, 86.0) 80.6 (76.3, 84.3) 82.1 (78.0, 85.5) 84.0 (80.2, 87.2)
Non-Muslim 72.7 (63.1, 80.5) 63.8 (53.8, 72.8) 72.9 (63.7, 80.5) 73.8 (63.8, 81.8) 1 Includes daily and occasional (less than daily) smokers 2 Education level is reported only among persons aged >25 years.
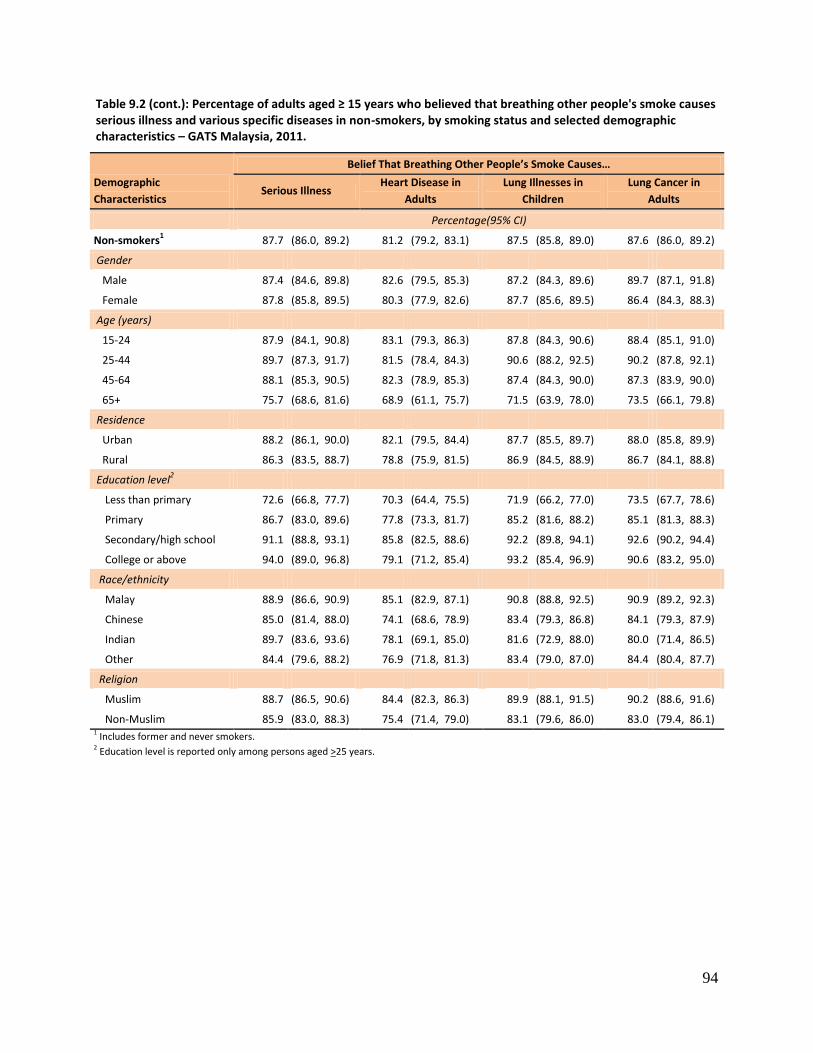
94
Table 9.2 (cont.): Percentage of adults aged ≥ 15 years who believed that breathing other people's smoke causes serious illness and various specific diseases in non-smokers, by smoking status and selected demographic characteristics – GATS Malaysia, 2011.
Demographic
Characteristics
Belief That Breathing Other People’s Smoke Causes…
Serious Illness Heart Disease in
Adults
Lung Illnesses in
Children
Lung Cancer in
Adults
Percentage(95% CI)
Non-smokers1 87.7 (86.0, 89.2) 81.2 (79.2, 83.1) 87.5 (85.8, 89.0) 87.6 (86.0, 89.2)
Gender
Male 87.4 (84.6, 89.8) 82.6 (79.5, 85.3) 87.2 (84.3, 89.6) 89.7 (87.1, 91.8)
Female 87.8 (85.8, 89.5) 80.3 (77.9, 82.6) 87.7 (85.6, 89.5) 86.4 (84.3, 88.3)
Age (years)
15-24 87.9 (84.1, 90.8) 83.1 (79.3, 86.3) 87.8 (84.3, 90.6) 88.4 (85.1, 91.0)
25-44 89.7 (87.3, 91.7) 81.5 (78.4, 84.3) 90.6 (88.2, 92.5) 90.2 (87.8, 92.1)
45-64 88.1 (85.3, 90.5) 82.3 (78.9, 85.3) 87.4 (84.3, 90.0) 87.3 (83.9, 90.0)
65+ 75.7 (68.6, 81.6) 68.9 (61.1, 75.7) 71.5 (63.9, 78.0) 73.5 (66.1, 79.8)
Residence
Urban 88.2 (86.1, 90.0) 82.1 (79.5, 84.4) 87.7 (85.5, 89.7) 88.0 (85.8, 89.9)
Rural 86.3 (83.5, 88.7) 78.8 (75.9, 81.5) 86.9 (84.5, 88.9) 86.7 (84.1, 88.8)
Education level2
Less than primary 72.6 (66.8, 77.7) 70.3 (64.4, 75.5) 71.9 (66.2, 77.0) 73.5 (67.7, 78.6)
Primary 86.7 (83.0, 89.6) 77.8 (73.3, 81.7) 85.2 (81.6, 88.2) 85.1 (81.3, 88.3)
Secondary/high school 91.1 (88.8, 93.1) 85.8 (82.5, 88.6) 92.2 (89.8, 94.1) 92.6 (90.2, 94.4)
College or above 94.0 (89.0, 96.8) 79.1 (71.2, 85.4) 93.2 (85.4, 96.9) 90.6 (83.2, 95.0)
Race/ethnicity
Malay 88.9 (86.6, 90.9) 85.1 (82.9, 87.1) 90.8 (88.8, 92.5) 90.9 (89.2, 92.3)
Chinese 85.0 (81.4, 88.0) 74.1 (68.6, 78.9) 83.4 (79.3, 86.8) 84.1 (79.3, 87.9)
Indian 89.7 (83.6, 93.6) 78.1 (69.1, 85.0) 81.6 (72.9, 88.0) 80.0 (71.4, 86.5)
Other 84.4 (79.6, 88.2) 76.9 (71.8, 81.3) 83.4 (79.0, 87.0) 84.4 (80.4, 87.7)
Religion
Muslim 88.7 (86.5, 90.6) 84.4 (82.3, 86.3) 89.9 (88.1, 91.5) 90.2 (88.6, 91.6)
Non-Muslim 85.9 (83.0, 88.3) 75.4 (71.4, 79.0) 83.1 (79.6, 86.0) 83.0 (79.4, 86.1) 1 Includes former and never smokers. 2 Education level is reported only among persons aged >25 years.
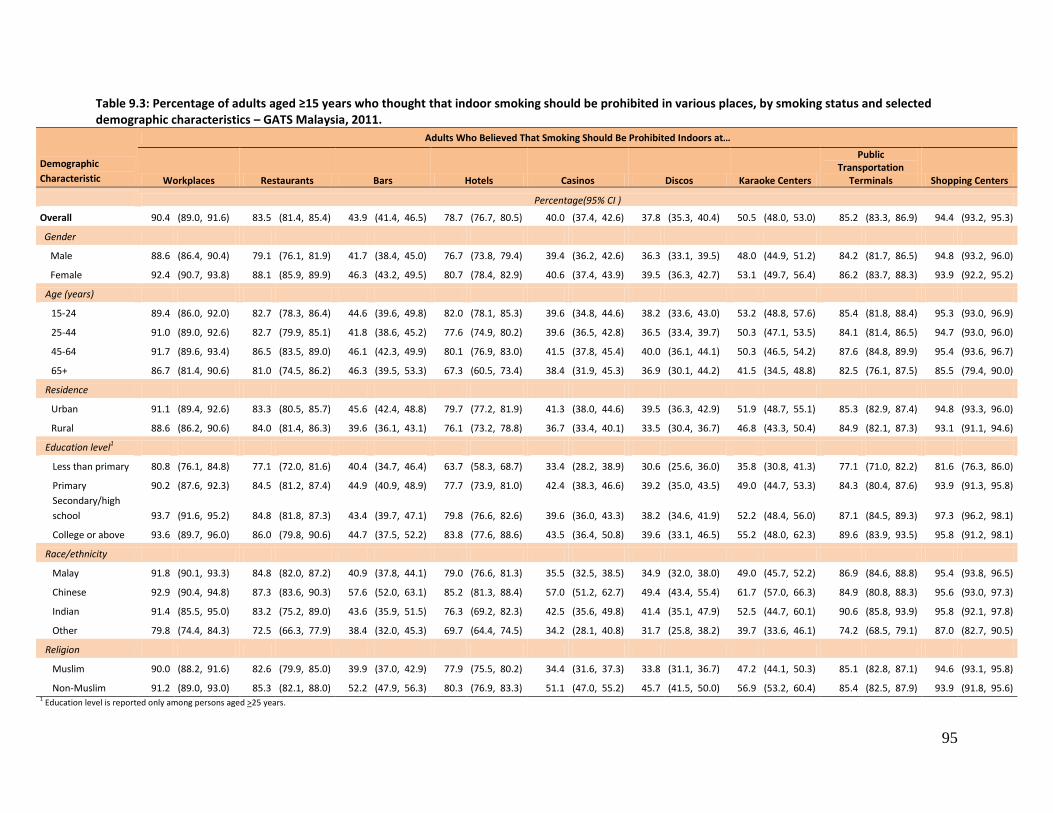
95
Table 9.3: Percentage of adults aged ≥15 years who thought that indoor smoking should be prohibited in various places, by smoking status and selected demographic characteristics – GATS Malaysia, 2011.
Demographic
Characteristic
Adults Who Believed That Smoking Should Be Prohibited Indoors at…
Workplaces Restaurants Bars Hotels Casinos Discos Karaoke Centers
Public Transportation
Terminals Shopping Centers
Percentage(95% CI )
Overall 90.4 (89.0, 91.6) 83.5 (81.4, 85.4) 43.9 (41.4, 46.5) 78.7 (76.7, 80.5) 40.0 (37.4, 42.6) 37.8 (35.3, 40.4) 50.5 (48.0, 53.0) 85.2 (83.3, 86.9) 94.4 (93.2, 95.3)
Gender
Male 88.6 (86.4, 90.4) 79.1 (76.1, 81.9) 41.7 (38.4, 45.0) 76.7 (73.8, 79.4) 39.4 (36.2, 42.6) 36.3 (33.1, 39.5) 48.0 (44.9, 51.2) 84.2 (81.7, 86.5) 94.8 (93.2, 96.0)
Female 92.4 (90.7, 93.8) 88.1 (85.9, 89.9) 46.3 (43.2, 49.5) 80.7 (78.4, 82.9) 40.6 (37.4, 43.9) 39.5 (36.3, 42.7) 53.1 (49.7, 56.4) 86.2 (83.7, 88.3) 93.9 (92.2, 95.2)
Age (years)
15-24 89.4 (86.0, 92.0) 82.7 (78.3, 86.4) 44.6 (39.6, 49.8) 82.0 (78.1, 85.3) 39.6 (34.8, 44.6) 38.2 (33.6, 43.0) 53.2 (48.8, 57.6) 85.4 (81.8, 88.4) 95.3 (93.0, 96.9)
25-44 91.0 (89.0, 92.6) 82.7 (79.9, 85.1) 41.8 (38.6, 45.2) 77.6 (74.9, 80.2) 39.6 (36.5, 42.8) 36.5 (33.4, 39.7) 50.3 (47.1, 53.5) 84.1 (81.4, 86.5) 94.7 (93.0, 96.0)
45-64 91.7 (89.6, 93.4) 86.5 (83.5, 89.0) 46.1 (42.3, 49.9) 80.1 (76.9, 83.0) 41.5 (37.8, 45.4) 40.0 (36.1, 44.1) 50.3 (46.5, 54.2) 87.6 (84.8, 89.9) 95.4 (93.6, 96.7)
65+ 86.7 (81.4, 90.6) 81.0 (74.5, 86.2) 46.3 (39.5, 53.3) 67.3 (60.5, 73.4) 38.4 (31.9, 45.3) 36.9 (30.1, 44.2) 41.5 (34.5, 48.8) 82.5 (76.1, 87.5) 85.5 (79.4, 90.0)
Residence
Urban 91.1 (89.4, 92.6) 83.3 (80.5, 85.7) 45.6 (42.4, 48.8) 79.7 (77.2, 81.9) 41.3 (38.0, 44.6) 39.5 (36.3, 42.9) 51.9 (48.7, 55.1) 85.3 (82.9, 87.4) 94.8 (93.3, 96.0)
Rural 88.6 (86.2, 90.6) 84.0 (81.4, 86.3) 39.6 (36.1, 43.1) 76.1 (73.2, 78.8) 36.7 (33.4, 40.1) 33.5 (30.4, 36.7) 46.8 (43.3, 50.4) 84.9 (82.1, 87.3) 93.1 (91.1, 94.6)
Education level1
Less than primary 80.8 (76.1, 84.8) 77.1 (72.0, 81.6) 40.4 (34.7, 46.4) 63.7 (58.3, 68.7) 33.4 (28.2, 38.9) 30.6 (25.6, 36.0) 35.8 (30.8, 41.3) 77.1 (71.0, 82.2) 81.6 (76.3, 86.0)
Primary 90.2 (87.6, 92.3) 84.5 (81.2, 87.4) 44.9 (40.9, 48.9) 77.7 (73.9, 81.0) 42.4 (38.3, 46.6) 39.2 (35.0, 43.5) 49.0 (44.7, 53.3) 84.3 (80.4, 87.6) 93.9 (91.3, 95.8)
Secondary/high
school 93.7 (91.6, 95.2) 84.8 (81.8, 87.3) 43.4 (39.7, 47.1) 79.8 (76.6, 82.6) 39.6 (36.0, 43.3) 38.2 (34.6, 41.9) 52.2 (48.4, 56.0) 87.1 (84.5, 89.3) 97.3 (96.2, 98.1)
College or above 93.6 (89.7, 96.0) 86.0 (79.8, 90.6) 44.7 (37.5, 52.2) 83.8 (77.6, 88.6) 43.5 (36.4, 50.8) 39.6 (33.1, 46.5) 55.2 (48.0, 62.3) 89.6 (83.9, 93.5) 95.8 (91.2, 98.1)
Race/ethnicity
Malay 91.8 (90.1, 93.3) 84.8 (82.0, 87.2) 40.9 (37.8, 44.1) 79.0 (76.6, 81.3) 35.5 (32.5, 38.5) 34.9 (32.0, 38.0) 49.0 (45.7, 52.2) 86.9 (84.6, 88.8) 95.4 (93.8, 96.5)
Chinese 92.9 (90.4, 94.8) 87.3 (83.6, 90.3) 57.6 (52.0, 63.1) 85.2 (81.3, 88.4) 57.0 (51.2, 62.7) 49.4 (43.4, 55.4) 61.7 (57.0, 66.3) 84.9 (80.8, 88.3) 95.6 (93.0, 97.3)
Indian 91.4 (85.5, 95.0) 83.2 (75.2, 89.0) 43.6 (35.9, 51.5) 76.3 (69.2, 82.3) 42.5 (35.6, 49.8) 41.4 (35.1, 47.9) 52.5 (44.7, 60.1) 90.6 (85.8, 93.9) 95.8 (92.1, 97.8)
Other 79.8 (74.4, 84.3) 72.5 (66.3, 77.9) 38.4 (32.0, 45.3) 69.7 (64.4, 74.5) 34.2 (28.1, 40.8) 31.7 (25.8, 38.2) 39.7 (33.6, 46.1) 74.2 (68.5, 79.1) 87.0 (82.7, 90.5)
Religion
Muslim 90.0 (88.2, 91.6) 82.6 (79.9, 85.0) 39.9 (37.0, 42.9) 77.9 (75.5, 80.2) 34.4 (31.6, 37.3) 33.8 (31.1, 36.7) 47.2 (44.1, 50.3) 85.1 (82.8, 87.1) 94.6 (93.1, 95.8)
Non-Muslim 91.2 (89.0, 93.0) 85.3 (82.1, 88.0) 52.2 (47.9, 56.3) 80.3 (76.9, 83.3) 51.1 (47.0, 55.2) 45.7 (41.5, 50.0) 56.9 (53.2, 60.4) 85.4 (82.5, 87.9) 93.9 (91.8, 95.6) 1 Education level is reported only among persons aged >25 years.
96
Table 9.3 (cont.): Percentage of adults aged ≥15 years who thought that indoor smoking should be prohibited in various places, by smoking status and selected demographic characteristics – GATS Malaysia, 2011.
Demographic
Characteristic
Adults Who Believe That Smoking Should Be Prohibited Indoors at…
Workplaces Restaurants Bars Hotels Casinos Discos Karaoke Centers
Public Transportation
Terminals Shopping Centers
Percentage(95% CI )
Current Smokers1 83.6 (80.1, 86.6) 72.7 (68.3, 76.7) 34.1 (30.2, 38.1) 70.8 (66.6, 74.7) 29.1 (25.3, 33.4) 26.7 (23.2, 30.5) 38.0 (33.8, 42.4) 77.7 (73.3, 81.5) 92.3 (89.3, 94.5)
Gender
Male 83.4 (79.9, 86.5) 72.9 (68.4, 76.9) 34.6 (30.7, 38.7) 71.2 (66.9, 75.2) 29.3 (25.3, 33.6) 27.1 (23.5, 31.0) 38.6 (34.3, 43.1) 77.9 (73.4, 81.8) 92.3 (89.3, 94.6)
Female 91.0 (79.0, 96.5) 65.9 (44.6, 82.3) 10.5 (4.2, 23.9) 52.6 (30.5, 73.6) 22.5 (10.0, 43.4) 6.9 (2.3, 18.6) 13.8 (5.5, 30.8) 66.9 (42.2, 84.8) 90.4 (74.2, 96.9)
Age (years)
15-24 78.9 (68.2, 86.8) 70.8 (59.8, 79.8) 36.3 (26.2, 47.8) 75.1 (64.1, 83.6) 27.4 (18.6, 38.4) 26.5 (17.7, 37.7) 35.8 (25.8, 47.2) 70.5 (58.4, 80.3) 91.4 (80.9, 96.4)
25-44 84.4 (79.5, 88.3) 73.1 (67.0, 78.3) 34.1 (28.8, 39.9) 69.2 (63.1, 74.7) 29.1 (23.4, 35.4) 25.7 (20.9, 31.2) 39.1 (33.6, 45.0) 77.4 (71.9, 82.2) 93.3 (89.0, 96.0)
45-64 88.5 (83.4, 92.1) 74.2 (65.6, 81.2) 34.2 (27.3, 41.8) 74.9 (68.0, 80.8) 34.2 (27.7, 41.3) 31.7 (24.9, 39.4) 41.1 (33.7, 48.9) 86.3 (80.1, 90.8) 93.8 (89.1, 96.6)
65+ 70.3 (50.7, 84.5) 69.6 (52.0, 82.9) 23.2 (12.7, 38.6) 49.6 (34.1, 65.2) 12.2 (5.5, 24.9) 12.7 (5.7, 25.9) 19.9 (10.8, 33.8) 68.0 (49.4, 82.2) 76.5 (57.2, 88.8)
Residence
Urban 84.5 (79.8, 88.3) 71.0 (65.2, 76.2) 33.8 (28.8, 39.1) 70.8 (65.2, 75.9) 27.9 (22.9, 33.5) 26.0 (21.5, 31.0) 37.2 (31.8, 43.0) 75.9 (69.9, 81.0) 92.4 (88.2, 95.2)
Rural 81.5 (76.8, 85.3) 76.8 (71.6, 81.3) 34.8 (29.8, 40.1) 70.8 (65.9, 75.2) 32.2 (27.3, 37.6) 28.4 (23.5, 33.9) 39.9 (34.5, 45.6) 81.9 (77.5, 85.7) 91.9 (88.8, 94.3)
Education level2
Less than primary 68.8 (56.4, 79.0) 63.2 (49.5, 75.0) 28.6 (19.0, 40.6) 57.9 (45.4, 69.5) 20.8 (12.9, 31.7) 21.1 (13.2, 32.0) 25.5 (16.7, 36.9) 70.4 (56.1, 81.6) 77.2 (63.4, 86.9)
Primary 86.2 (80.7, 90.4) 78.1 (70.8, 84.0) 34.0 (27.0, 41.8) 72.6 (64.9, 79.1) 32.4 (25.9, 39.7) 26.7 (20.7, 33.8) 38.9 (31.6, 46.7) 80.8 (73.0, 86.8) 90.9 (83.1, 95.3)
Secondary/high
school 88.5 (82.8, 92.5) 72.5 (65.7, 78.5) 34.9 (28.8, 41.5) 71.4 (64.7, 77.4) 29.6 (23.8, 36.2) 29.0 (23.3, 35.5) 42.1 (35.4, 49.1) 82.4 (77.2, 86.7) 97.0 (94.4, 98.4)
College or above 81.3 (66.5, 90.4) 70.7 (53.0, 83.8) 31.8 (19.9, 46.6) 65.2 (47.2, 79.7) 29.8 (15.0, 50.4) 22.6 (12.1, 38.2) 35.1 (22.4, 50.2) 72.3 (54.4, 85.1) 93.3 (80.2, 98.0)
Race/ethnicity
Malay 85.8 (81.6, 89.2) 75.4 (69.9, 80.1) 33.0 (28.3, 38.1) 72.0 (66.9, 76.6) 28.8 (24.5, 33.4) 27.4 (23.3, 31.9) 39.3 (34.0, 44.9) 79.6 (74.2, 84.1) 93.3 (89.4, 95.9)
Chinese 90.4 (77.2, 96.3) 76.7 (63.4, 86.2) 46.0 (31.9, 60.7) 77.1 (65.5, 85.6) 32.5 (20.3, 47.6) 25.3 (14.5, 40.2) 41.1 (28.4, 55.1) 76.2 (61.3, 86.7) 96.5 (88.8, 99.0)
Indian 83.6 (68.2, 92.4) 77.7 (57.7, 89.9) 32.9 (18.7, 51.2) 82.8 (68.9, 91.3) 34.3 (20.5, 51.4) 31.9 (17.9, 50.3) 46.2 (29.7, 63.6) 87.7 (74.1, 94.7) 95.7 (86.9, 98.7)
Other 70.5 (60.1, 79.2) 57.8 (47.1, 67.9) 29.9 (21.6, 39.7) 56.4 (46.1, 66.3) 25.7 (17.7, 35.8) 22.5 (14.9, 32.6) 27.0 (18.6, 37.5) 66.9 (57.0, 75.4) 83.8 (73.7, 90.5)
Religion
Muslim 83.0 (78.7, 86.6) 71.7 (66.4, 76.4) 32.4 (28.1, 37.1) 69.8 (65.0, 74.3) 27.7 (23.8, 32.0) 26.5 (22.6, 30.8) 37.4 (32.4, 42.6) 76.9 (71.9, 81.2) 92.7 (89.1, 95.1)
Non-Muslim 85.2 (78.1, 90.2) 75.6 (67.1, 82.6) 38.8 (30.1, 48.2) 73.6 (65.5, 80.3) 33.2 (25.4, 42.0) 27.3 (19.9, 36.1) 39.9 (31.8, 48.6) 79.8 (71.2, 86.4) 91.2 (84.8, 95.1) 1 Includes daily and occasional (less than daily) smokers. 2 Education level is reported only among persons aged >25 years.
97
Table 9.3 (cont.): Percentage of adults aged ≥15 years who thought that indoor smoking should be prohibited in various places, by smoking status and selected demographic characteristics – GATS Malaysia, 2011.
Demographic
Characteristic
Adults Who Believe That Smoking Should Be Prohibited Indoors at…
Workplaces Restaurants Bars Hotels Casinos Discos Karaoke Centers
Public Transportation
Terminals Shopping Centers
Percentage(95% CI )
Non-smokers1 92.4 (91.1, 93.6) 86.7 (84.6, 88.6) 46.9 (44.1, 49.7) 81.0 (79.0, 83.0) 43.2 (40.4, 46.1) 41.2 (38.4, 43.9) 54.2 (51.6, 56.8) 87.4 (85.6, 89.1) 95.0 (93.8, 96.0)
Gender
Male 92.5 (90.1, 94.4) 84.0 (80.3, 87.2) 47.2 (42.6, 51.8) 81.0 (77.3, 84.3) 47.3 (42.9, 51.6) 43.4 (39.2, 47.7) 55.4 (51.5, 59.3) 89.2 (86.6, 91.3) 96.7 (95.1, 97.8)
Female 92.4 (90.7, 93.8) 88.3 (86.2, 90.2) 46.7 (43.5, 49.9) 81.0 (78.7, 83.2) 40.8 (37.6, 44.1) 39.8 (36.7, 43.1) 53.5 (50.2, 56.8) 86.4 (83.9, 88.5) 93.9 (92.3, 95.2)
Age (years)
15-24 91.5 (88.2, 93.9) 85.1 (80.4, 88.9) 46.3 (40.8, 51.9) 83.3 (79.3, 86.7) 42.1 (36.8, 47.5) 40.5 (35.4, 45.8) 56.7 (52.1, 61.2) 88.4 (85.1, 91.1) 96.1 (93.8, 97.6)
25-44 93.6 (91.7, 95.1) 86.6 (83.7, 89.1) 45.0 (41.4, 48.7) 81.1 (78.2, 83.6) 43.9 (40.2, 47.7) 40.9 (37.0, 44.8) 54.8 (51.1, 58.5) 86.8 (83.8, 89.4) 95.2 (93.4, 96.6)
45-64 92.7 (90.3, 94.5) 90.1 (87.4, 92.2) 49.6 (45.1, 54.0) 81.6 (78.0, 84.7) 43.7 (39.4, 48.0) 42.5 (38.2, 46.9) 53.0 (48.8, 57.2) 87.9 (84.8, 90.4) 95.8 (94.0, 97.1)
65+ 89.6 (84.4, 93.2) 83.0 (75.4, 88.6) 50.4 (42.9, 57.9) 70.4 (63.1, 76.8) 43.1 (35.9, 50.5) 41.2 (33.8, 49.1) 45.3 (37.8, 53.0) 85.1 (78.9, 89.6) 87.0 (81.6, 91.1)
Residence
Urban 93.0 (91.3, 94.4) 86.9 (84.1, 89.2) 49.1 (45.5, 52.6) 82.3 (79.7, 84.6) 45.2 (41.6, 48.9) 43.5 (39.9, 47.1) 56.2 (52.8, 59.5) 88.0 (85.7, 90.0) 95.5 (94.0, 96.7)
Rural 90.9 (88.5, 92.8) 86.3 (83.5, 88.7) 41.1 (37.3, 44.9) 77.8 (74.5, 80.8) 38.1 (34.6, 41.7) 35.1 (31.8, 38.5) 49.1 (45.3, 52.8) 85.8 (82.6, 88.5) 93.5 (91.3, 95.1)
Education level2
Less than primary 83.8 (78.4, 88.0) 80.5 (75.3, 84.9) 43.3 (37.1, 49.8) 65.1 (59.4, 70.3) 36.4 (30.8, 42.5) 32.9 (27.5, 38.8) 38.4 (32.6, 44.5) 78.7 (72.8, 83.7) 82.7 (77.7, 86.8)
Primary 91.8 (89.0, 94.0) 87.2 (83.6, 90.2) 49.4 (44.9, 53.8) 79.8 (75.8, 83.3) 46.5 (41.6, 51.6) 44.4 (39.5, 49.3) 53.1 (48.3, 57.9) 85.8 (81.2, 89.3) 95.2 (93.0, 96.7)
Secondary/high
school 95.5 (93.7, 96.8) 89.2 (86.2, 91.6) 46.4 (42.2, 50.8) 82.8 (79.4, 85.7) 43.3 (39.1, 47.6) 41.5 (37.4, 45.7) 55.9 (51.8, 60.0) 88.8 (85.8, 91.2) 97.4 (96.0, 98.4)
College or above 96.3 (92.7, 98.2) 89.5 (83.9, 93.3) 47.7 (39.7, 55.8) 88.1 (82.3, 92.1) 46.6 (38.9, 54.4) 43.5 (35.7, 51.6) 59.9 (51.8, 67.4) 93.6 (89.5, 96.1) 96.4 (90.6, 98.7)
Race/ethnicity
Malay 93.8 (92.1, 95.2) 87.8 (85.1, 90.1) 43.4 (39.9, 47.0) 81.3 (78.7, 83.7) 37.7 (34.3, 41.1) 37.4 (34.1, 40.8) 52.1 (48.6, 55.6) 89.2 (87.1, 91.1) 96.0 (94.5, 97.1)
Chinese 93.4 (91.0, 95.1) 89.3 (86.0, 91.9) 59.7 (53.8, 65.4) 86.7 (82.6, 89.9) 61.5 (55.1, 67.5) 53.8 (47.4, 60.0) 65.5 (60.5, 70.1) 86.5 (82.7, 89.5) 95.5 (92.4, 97.3)
Indian 93.3 (87.6, 96.4) 84.6 (75.2, 90.8) 46.2 (38.2, 54.3) 74.8 (66.7, 81.5) 44.5 (36.5, 52.9) 43.6 (36.3, 51.3) 54.0 (45.1, 62.6) 91.3 (86.0, 94.7) 95.8 (91.3, 98.1)
Other 83.7 (78.1, 88.1) 78.8 (72.5, 83.9) 42.1 (34.7, 49.8) 75.3 (69.4, 80.4) 37.8 (30.9, 45.1) 35.5 (28.7, 43.0) 45.0 (38.1, 52.1) 77.2 (71.1, 82.4) 88.4 (83.5, 92.0)
Religion
Muslim 92.4 (90.6, 93.9) 86.3 (83.6, 88.6) 42.5 (39.3, 45.8) 80.7 (78.1, 83.0) 36.7 (33.6, 40.0) 36.4 (33.2, 39.6) 50.6 (47.3, 53.9) 87.9 (85.5, 89.9) 95.3 (93.8, 96.4)
Non-Muslim 92.5 (90.3, 94.3) 87.4 (84.0, 90.2) 55.1 (50.6, 59.5) 81.8 (78.1, 84.9) 55.1 (50.4, 59.6) 49.8 (45.2, 54.4) 60.7 (56.8, 64.4) 86.7 (83.8, 89.1) 94.6 (92.3, 96.2) 1 Includes former and never smokers.
2 Education level is reported only among persons aged >25 years.
98
Table 9.4: Percentage of adults aged ≥15 years who favoured tobacco control laws, by smoking status and selected demographic characteristics – GATS Malaysia, 2011.
Demographic
Characteristic
Adults Who Favoured Increasing Taxes on Tobacco Products
Adults Who Favoured Prohibiting the Display of Tobacco Products at Points-of-Sale
Overall Current Smokers1 Non-smokers2 Overall Current Smokers1 Non-smokers2
Percentage(95% CI )
Overall 70.6 (68.5, 72.7) 32.0 (28.1, 36.3) 82.0 (79.9, 84.0) 75.6 (73.6, 77.4) 47.9 (43.5, 52.2) 83.8 (81.8, 85.6)
Gender
Male 59.8 (56.7, 62.9) 32.1 (28.0, 36.5) 81.2 (77.7, 84.2) 68.3 (65.5, 71.0) 48.0 (43.5, 52.5) 83.9 (80.8, 86.6)
Female 82.0 (79.4, 84.4) 29.4 (14.4, 50.7) 82.6 (80.0, 84.9) 83.2 (80.9, 85.4) 41.3 (22.6, 62.8) 83.7 (81.3, 85.8)
Age (years)
15-24 72.9 (68.6, 76.8) 28.4 (19.2, 39.8) 81.8 (77.7, 85.3) 77.9 (73.5, 81.7) 44.0 (32.8, 55.9) 84.7 (80.2, 88.3)
25-44 69.8 (66.8, 72.6) 32.8 (27.8, 38.3) 84.5 (81.3, 87.2) 74.7 (71.8, 77.3) 47.2 (41.3, 53.3) 85.7 (83.1, 87.9)
45-64 69.5 (65.9, 73.0) 32.0 (24.9, 40.0) 80.4 (76.6, 83.7) 75.7 (72.2, 78.9) 52.1 (43.7, 60.4) 82.5 (78.8, 85.7)
65+ 70.5 (63.8, 76.4) 39.5 (24.5, 56.8) 75.9 (68.9, 81.8) 71.1 (64.7, 76.8) 50.4 (34.3, 66.4) 74.8 (67.7, 80.7)
Residence
Urban 71.1 (68.4, 73.6) 30.0 (24.9, 35.7) 82.8 (80.0, 85.3) 76.0 (73.5, 78.3) 47.6 (41.9, 53.4) 84.1 (81.5, 86.4)
Rural 69.5 (66.4, 72.5) 36.7 (31.7, 42.1) 80.0 (76.9, 82.8) 74.5 (71.9, 77.0) 48.5 (43.0, 54.1) 82.8 (80.1, 85.3)
Education level
Less than primary 62.7 (57.5, 67.6) 36.3 (25.0, 49.3) 69.0 (63.2, 74.3) 65.2 (59.9, 70.1) 41.3 (29.8, 53.8) 70.8 (65.1, 76.0)
Primary 65.9 (61.7, 69.9) 28.1 (22.4, 34.5) 80.8 (76.9, 84.2) 71.6 (67.6, 75.3) 44.2 (36.1, 52.6) 82.6 (78.7, 85.9)
Secondary/high school 72.5 (69.3, 75.5) 36.3 (29.8, 43.4) 85.7 (82.5, 88.3) 77.8 (74.7, 80.7) 54.5 (47.7, 61.2) 86.3 (83.1, 88.9)
College or above 77.0 (69.2, 83.4) 32.1 (19.3, 48.2) 87.2 (78.4, 92.8) 81.3 (75.4, 86.0) 48.6 (34.7, 62.8) 88.8 (81.9, 93.2)
Race/ethnicity
Malay 73.2 (70.4, 75.8) 34.7 (29.7, 40.0) 85.6 (83.1, 87.7) 78.2 (75.9, 80.4) 51.7 (46.7, 56.7) 86.7 (84.3, 88.9)
Chinese 70.3 (65.3, 74.9) 26.5 (15.6, 41.1) 78.0 (73.2, 82.1) 73.3 (68.2, 77.9) 36.4 (24.3, 50.6) 80.1 (75.1, 84.3)
Indian 61.8 (54.5, 68.6) 16.8 (6.7, 36.1) 72.5 (65.5, 78.5) 73.6 (66.6, 79.6) 50.1 (33.7, 66.6) 79.1 (72.4, 84.6)
Other 66.0 (60.4, 71.2) 33.3 (25.0, 42.7) 79.7 (72.7, 85.2) 68.3 (62.9, 73.2) 40.9 (31.3, 51.1) 79.5 (73.9, 84.1)
Religion
Muslim 72.3 (69.7, 74.7) 34.3 (29.8, 39.0) 85.1 (82.6, 87.2) 76.8 (74.6, 78.9) 49.7 (45.0, 54.4) 86.0 (83.6, 88.0)
Non-Muslim 67.7 (63.9, 71.2) 25.7 (18.8, 34.0) 76.8 (73.1, 80.2) 73.0 (69.4, 76.3) 42.6 (34.3, 51.5) 79.7 (76.1, 82.9) 1 Includes daily and occasional (less than daily) smokers. 2 Includes former and never smokers.
99
10. RECOMMENDATIONS AND CONCLUSIONS
Ultimately, the single item that can eliminate future tobacco-related deaths and illnesses is significant
continuous reduction in the prevalence of tobacco use. This can be attained by preventing tobacco
uptake especially by youths and tobacco cessation by current users.
Malaysia became a party to the WHO Framework Convention on Tobacco Control (WHO FCTC) in
December 2005. This international legal tool, together with its guidelines, provides the foundation for
Parties to implement and manage tobacco control measures in their respective nations. The
Government of Malaysia, as a Party to this international treaty, is obliged to adhere and fulfill all the
provisions contained in this treaty.
However, the provisions in this Convention are widely diverse and each requires various degrees of
commitment and resources. Therefore, as lead agency for health that assists countries to realise the
objectives of the WHO FCTC, the World Health Organisation had developed and introduced the
MPOWER Package; this is a fundamental component of the WHO Action Plan for the Prevention and
Control of Non-communicable Diseases.
This Package consists of six prioritised tobacco control measures of proven cost-effectiveness and has
the ability to reduce the demand for tobacco and hence subsequently save lives. These are:
1. Monitor tobacco use
2. Protect people from tobacco smoke
3. Offer help to quit tobacco use
4. Warn about the dangers of tobacco
5. Enforce bans on tobacco advertising and promotion
6. Raise taxes on tobacco products.
MPOWER Package is meant to help in the planning, building and evaluation of national and international
partnerships and encourages policy-makers as well as other stakeholders to envision a world free of
tobacco use.
10.1 Recommendations1
In this chapter, focus will be primarily given to all the six elements of the MPOWER Package whereby,
based on the relevant findings from GATS Malaysia, appropriate recommendations relating to each of
these elements will be put forward.
1 The policy recommendations in this chapter are consistent with the recommendations from the WHO FCTC and
MPOWER. These recommendations are views expressed by the Malaysian government and are not necessarily
those of the U.S. Centers for Disease Control and Prevention (CDC).
100
The process from which these recommendations were drawn involved a series of discussions held with
tobacco control stakeholders especially officers from the Tobacco Control and FCTC Unit, Disease
Control Division, Ministry of Health. These officers are also investigators in the Global Adult Tobacco
Survey (GATS).
10.1.1 Monitor Tobacco Use (WHO FCTC Article 20 & 21)
In order to implement and appraise effective tobacco control policies, good reliable data is crucial. Only
through accurate measurement of the tobacco epidemic and fair evaluation of the control actions, can
interventions be effectively managed and improved.
Prior to GATS Malaysia 2011, prevalence data on tobacco use amongst adults and other tobacco control
related statistics were derived from the first, second and third National Health and Morbidity Surveys
(NHMS-I, NHMS-II and NHMS-III) that were respectively carried out in 1986, 1996 and 2006. In these
studies, smoking is one of over 18 modules being researched. As for statistics on youth tobacco
consumption data were gathered from two prior Global Youth Tobacco Surveys (i.e. GYTS 1 & 2)
conducted in 2003 and 200913,14.
Contrary to NHMS, the Global Adult Tobacco Survey (GATS) is solely focused on the tobacco issue and
thus giving it the desired depth to the study. Another superior feature of GATS is the standardisation of
its tools that allows for the potentials of results to be compared across countries. Findings of GATS
Malaysia will be shared with international community through the WHO and CDC.
Under Article 20 & 21 of the WHO FCTC, Malaysia is obligated to provide regular reports of the country’s
progress on implementing this treaty. Each report is very detail and has to be submitted to the WHO
FCTC Secretariat every 2 years.
Therefore, it is recommended that:
i. GATS Malaysia is repeated every 4 years so as to effectively tract the course of the epidemic
against the tobacco control actions being carried out either independently or incorporated with
other surveys. Although some tobacco control interventions may take more time to bring about
impact, but most intervention like the impact of tobacco tax and price increase/outcome for
implementation of pictorial health warning on population’s attitude and behavior can be
detected within a short period, some even in weeks or days. This frequency of repeating GATS is
to synchronize with the cycle for Tobacco Control & FCTC Unit, Disease Control Division to
submit country reports to the international FCTC Secretariat in Geneva every 2 to 3 years, whilst
the content of the reporting instrument is very detailed that can only be provided from GATS.
Hence, it is important that adequate funding to repeat GATS be allocated by the MOH;
101
ii. The capacity of the Ministry of Health as the key agency responsible for tobacco control and the
national Secretariat for WHO FCTC implementation be strengthened. Current status of the
Tobacco Control & FCTC Unit could be elevated and reorganised so as to allocate officers with
defined roles and responsibilities to efficiently maintain a proposed tobacco control surveillance
system. This is in line with Cabinet’s decision when that Malaysia was about to ratify the WHO
FCTC, whereby it was approved that MOH become the national secretariat where a dedicated
organized team was to be established. A proposal paper for posts submitted as part of Dasar
Baru then was approved by Public Service Department (JPA) but not all designated posts were
given upfront. The idea was for the organization to be strengthened and built up with time. It is
appropriate that the Malaysian Government, particularly MOH, could put a high priority on this
matter since the toll for tobacco especially smoking and the consequences of its use in our
society is very huge in terms of health (especially non-communicable diseases), economic and
social burden;
iii. Collaboration between MOH tobacco control and research experts with those from other
institutions especially the academia be heightened, and a functional network of these experts
be established by National Institutes of Health (NIH) within MOH;
iv. The Tobacco Control Research Committee be activated and spearheaded by the MOH in order
to update members concerning tobacco related researches nationwide and internationally. This
Committee could also determine the future direction and coordination of tobacco related
researches in Malaysia. There is much research on tobacco and tobacco control in Malaysia
carried out by numerous parties within and outside the health sector. This research includes
health, social economic (study on smuggling), and other impacts and can provide valuable input
for tobacco control policy development and evaluation for the Government of Malaysia. Hence
these studies could be centrally collated for relevant use;
v. Relevant research findings and information derived from the proposed tobacco control
surveillance system be more effectively communicated through available channels to the
appropriate agencies and/or populations. Formal and informal platforms could be used
including the mass media. Friendly leaflets for commune updates and policy briefs for decision
makers could be pursued.
10.1.2 Protection from Tobacco Smoke (WHO FCTC Article 8)
Tobacco smoke is highly toxic and there is no safe level for exposure to secondhand smoke (SHS). More
than 4000 compounds have been identified in tobacco smoke and over 50 of these are carcinogenic. Air
pollution from SHS is increasingly becoming an important human rights concern. The GATS findings
show that every month over 30% – 45% of people are forced to breathe SHS at home and/or the
workplace.
102
Apart from protecting non-smokers from the hazards of SHS, smoke-free policies also push smokers to
quit and de-normalise the smoking habit within a society. According to the WHO FCTC Article 8
Guidelines, Party countries are encouraged to enact 100% smoke-free laws that would extensively cover
public places. Exemptions given for ‘smoking rooms’ within designated ‘no smoking’ areas or use of
mechanical systems like ventilation or extraction fans do not eliminate the real threats of SHS to public
health.
Therefore, it is recommended that:
i. All public eating places both air-conditioned and non-air conditioned be made 100% smoke-free.
At present, only air-conditioned restaurants are smoke-free, however, the current law allows
premise owners to allocate smoking area;
ii. Effective and efficient enforcement of smoke-free areas be implemented throughout the
country. Dedicated teams located at every district health offices could be strengthened to carry
out enforcement activities and their performance regularly monitored;
iii. A channel be set up (complaint-line) to encourage the public to inform the authorities of any
violations to the smoke-free law;
iv. At the national level, a 100% smoke-free law be enacted which is a national obligation under
Article 8 of the WHO FCTC. To be 100% smoke-free, the law should not include any legal
enabling clause that provides exemption for smoke-free localities;
v. Designation of 100% smoke-free areas be expanded to pubs, bars, nightclubs, discos and
casinos. More public places including open spaces frequented by families like parks could be
designated ‘no-smoking’ areas as well;
vi. Legislative provisions be considered for protection from SHS beyond public places example, at
all workplaces and also the home settings, where passive smoking seem to be very prevalent;
vii. Nationwide health promotional campaigns carried out to disseminate truths about SHS and
empower the general public especially non-smokers to exercise their rights to breath clean
unpolluted air be continued and intensified;
viii. Train young people to understand the smoke-free issue and encourage them to support 100%
smoke-free policies.
103
10.1.3 Offer Help to Quit (WHO FCTC Article 14)
Nicotine in tobacco is an extremely addictive substance that has hooked 4.75 million or an overall 23.1%
of all Malaysian adults, and they are indeed the people most at risk to succumb to the tobacco hazards.
If tobacco related diseases and deaths in this country are to be averted, these nicotine addicts must quit
using tobacco as soon as possible.
Management of non-communicable diseases (NCD) attributed to tobacco like treatment for cancer,
cardiovascular diseases, respiratory diseases and stroke incurs heavy financial burden, while premature
deaths from these conditions lead to loss of productivity as well as insurance and damages costs to the
Government, employers and families. Thus provision of tobacco cessation services is a highly cost-
effective investment that brings about huge social and economic returns in the middle and long term.
From the GATS analysis, about half of adults who used tobacco in the 12 months preceding the survey
attempted to quit their bad habit, and almost 15% of current smokers were interested to quit in the
next 12 months.
Guidelines for WHO FCTC Article 14 provide detailed advice to strengthen or create a sustainable
infrastructure that motivates attempts to quit, ensures wide access to support for tobacco users who
wish to quit and provides sustainable resources to ensure that such support is available. The guideline
also identify the key effective measures needed to promote tobacco cessation and incorporate tobacco
dependence treatment into national tobacco control programmes and health-care systems
Therefore, it is recommended that:
i. Extensive promotion about quitting tobacco and availability of MOH smoking cessation services
be carried out via numerous channels including posters, leaflets, newspapers, TV, radio,
websites and ‘Tak Nak Merokok’ campaign materials so as to increase awareness and
subsequently utilisation of services;
ii. The revised version of the Clinical Practice Guidelines on Treatment of Tobacco Dependence
2003 be updated with findings from GATS Malaysia 2011 and be published as soon as possible;
iii. Strengthen the Tobacco Control & FCTC Unit in MOH to establish a comprehensive National
Tobacco Cessation Programme using the WHO FCTC Article 14 Guidelines as its basis;
iv. Thorough training sessions on tobacco control and smoking cessation as well as capacity
building programmes be planned and initiated for broad groups of medical and health providers
including doctors, dentist, pharmacist, nurses and other allied health personnel. All health-care
workers could be encouraged to become supporters for comprehensive tobacco control
interventions;
104
v. Provision of smoking cessation services be made more extensively available in both government
and private health facilities. It could be integrated into the primary health care services with
operational targets set and regularly monitored;
a. For MOH owned health centres, smoking cessation services in the form of brief and
intensive intervention be widely provided. However, these clinics need adequate
equipment and adequately trained staff in order to expand its coverage for as many
clinic attendees as possible;
b. For MOH hospitals, smoking cessation services be provided for relevant disciplines for
the in-patient and out-patient settings. These disciplines include but not limited to
cardiovascular, cancer, respiratory, tuberculosis, stroke, psychiatry and others;
c. For private health facilities like private hospitals, specialist clinics and general practice
(GP), the medical and health practitioners be given adequate knowledge and ‘incentives’
that will encourage them to deliver effective smoking cessation services;
vi. Following the inclusion of nicotine replacement therapy (NRT) and varenicline into the MOH
drug list over a year ago, adequate financial allocations be given to the State Health
Departments to ensure continuous availability of these drugs;
vii. The current MOH ‘Info-line’ be upgraded to a professional, toll-free ‘Quit-line’ service with well
trained staff and appropriate infrastructure;
viii. Efforts be made to encourage big corporate organisations (both local and transnational) to
facilitate tobacco cessation amongst their staff through special programmes by the ‘Human
Resource Department’ and/or cessation services to be provided by resident doctors or panel
clinics / hospitals;
ix. Initiate efforts to include the subject of ‘treatment of tobacco dependence’ as an integral part of
the basic undergraduate curriculum for medical, dental, pharmacy schools, and all relevant
allied health graduate education and/or training institutions. Knowledge and skills in smoking
cessation is essential in medicine, for this condition is now categorized as a mental and
behavioural disease under the International Classification of Disease (ICD-10). Almost all medical
students (and most doctors) do not know how to treat nicotine dependence although 5 million
of the population have this risk factor with a potential of fatal NCD.
x. Following approval by the Drug Control Authority (DCA) that NRT is now allowed to be
advertised, perhaps the next consideration is to have a policy change to make NRT easily
accessible over the counter (OTC).
105
10.1.4 Warn About the Dangers of Tobacco (WHO FCTC Articles 11 & 12)
In Malaysia, not many tobacco users understand the full extent of their health risk. Most are unaware of
the degree of harm that tobacco causes and they tend to underestimate the risks to themselves and
others. In addition, most people are also oblivious of the powerfully addictive properties of nicotine.
Hence, there is critical necessity for clear, simple, direct and truthful information that must be
disseminated to the messes especially tobacco consumers.
Health warnings on tobacco packaging reach all smokers and more. As laid in Article 11 of the WHO
FCTC, warnings should appear on both the front and back of the packaging, preferably with images and
texts that are large, evident and describe specific illnesses caused by tobacco. Pictorial health warnings
have been shown to be particularly effective in communicating risks and motivating behavioural change.
They detract the attractiveness of tobacco packaging and thus act as a deterrent to new users.
Strong body of evidence has demonstrated that product packaging serves as one of tobacco industry’s
central vehicles in initiating and maintaining addiction to its lethal products among consumers. WHO
FCTC Articles 11 and 13 Guidelines recommend that Parties consider the introduction of plain
packaging, which would eliminate the tobacco industry’s ability to place targeted messages and designs
on the packages of its products, increase the impact of health warnings, reduce false and misleading
messages that deceive customers into believing that some tobacco products are safer than others and
reduce the attractiveness of products to segments of the population targeted by tobacco companies
Over 90% of GATS respondents noticed anti-tobacco messages in the media. The ‘Tak Nak Merokok’
Campaign launched in 2004 has been a mainstay for health promotion and tobacco control in Malaysia
and is an effective public medium for dissemination of information on tobacco hazard.
Therefore, it is recommended that:
i. The ‘Tak Nak Merokok’ Campaign be continued, improved and intensified with adequate
funding allocated at national, state and district levels annually. Regular monitoring of the
campaign performance be maintained to ensure constant improvement and relevance of the
campaign content;
ii. Apart from the MOH, other entities within the Government, private sector and non-government
organisation (NGO) be encouraged to participate and/or organize activities to raise awareness
on tobacco hazards and cessation;
a. More local health and consumer NGOs could partake actively in anti-tobacco education
and advocacy. The role played by the Malaysian Health Promotion Board (MySihat) in
providing financial assistance to NGOs be continued and heightened;
106
b. The encouraging initiative taken by the Public Service Department (PSD) to promote
healthy lifestyles such as requiring body mass index (BMI) measurements be extended
to also include smoking cessation for personnel evaluation of government employees;
c. Corporate organisations could also be incentivised to embark on healthy lifestyle
campaigns and tobacco cessation drive for their employees and the public;
iii. A second round of pictorial health warnings (PHW) be introduced soon for cigarettes. Since the
effectiveness of the first six pictures are declining, new images could replace the present ones.
These new warning labels could be larger while the image and text messages remain as, if not
more, effective than the current ones. Evaluation of these PHW could be conducted;
iv. All tobacco products (not only cigarettes) in all types of packaging include standardised pictorial
health warnings;
v. A collection of good images and effective health warnings from within and outside the country
be maintained so as to facilitate future rotation of these messages;
vi. Consider introducing plain packaging for all tobacco products and enacting related legislation to
ensure compliance by tobacco industry. This is in adherence with item 46 in the “Guidelines for
Implementation of Article 11 of the WHO Framework Convention on Tobacco Control (Packing
and Labeling of Tobacco Products)”.
10.1.5 Enforce Bans on Tobacco Advertising & Promotion (WHO FCTC Article 13)
A total ban on direct and indirect advertising, promotion and sponsorship as provided in guidelines to
Article 13 of the WHO FCTC can substantially reduce tobacco consumption and protect people
particularly youths from industry marketing tactics. In order to be effective, bans on tobacco advertising,
promotion and sponsorship (TAPS) must be complete and apply to all marketing channels. The tobacco
industry strongly opposes such comprehensive bans because they are effective in reducing tobacco use.
TAPS create an illusion that tobacco is just an ordinary consumer product rather than a deadly item that
kills up to half of its regular users when consumed exactly as the manufacturer intends.
It is important that enforceable measures be out into place to ban not only the traditional forms of
direct advertising through media such as television, radio, print publications and billboards. There is also
a need to ensure that indirect forms of TAPS such as brand stretching, points of sale display and tobacco
industry-sponsored ‘corporate social responsibility’ (CSR) programmes are also addressed.
107
Therefore, it is recommended that:
i. Bans on TAPS be strictly enforced as provided in the Control of Tobacco Product Regulations
2004 (CTPR 2004) and rigorous monitoring of the situation be carried out regularly;
ii. A more comprehensive ban on TAPS for all forms of tobacco products be endorsed through an
amendment of the current CTPR that includes:
a. Ban on all direct and indirect TAPS that use tobacco product name or imagery as well as
any indication or link to tobacco industry name or imagery. This includes any form of
paraphernalia and industry-sponsored CSR activities;
b. Ban on tobacco product display at points of sale;
c. Restrictions on cross-border TAPS via cyberspace like the internet and/or social media;
iii. Plain packaging for all forms of tobacco products be introduced with strict pack specifications
like size, shape, colours and labels;
iv. A channel be set up (complaint-line) to encourage the public to inform the authorities of any
violations to the law for bans on TAPS.
10.1.6 Raise Tobacco Taxes (WHO FCTC Article 6)
The evidence has shown increasing the price of tobacco through higher taxes is the single most effective
way to encourage tobacco users to quit and prevent children from starting to smoke. Taxes on
inexpensive tobacco products should be equivalent to higher-priced products, such as premium-brand
cigarettes, to prevent substitution in consumption. Increasing taxes regularly to correct for inflation and
consumer purchasing power is important. Tobacco taxes are generally well accepted by the public and
raise government revenues.
Despite worldwide recognition of the importance of tax and price increase to curb tobacco use, in
Malaysia, tobacco product especially cigarettes are very affordable to the majority of consumers,
especially right now when the Government has just announced salary increase for civil servants.
Unfortunately in many countries including Malaysia, tobacco taxes and prices have not increased
enough mainly because of inefficiency of existing tax systems / tax structure and perhaps also weak tax
administration. Addressing those will help use the tobacco taxation measure to its full strength, leading
to effective increases in prices, reduction in consumption and reduction in tobacco-related burden of
disease and death.
108
Influence of the tobacco industry upon Malaysian policy makers poses a huge challenge on the strategy
for continuous tobacco tax hike. The usual argument from the tobacco industry is that raising tobacco
tax will lead to increase in smuggling and big losses to Government revenue. The industry propagates
the biased results of their self-sponsored cigarette ‘litter survey’ to estimate the load of tobacco
smuggling in the country. Thus unlike past few years, in 2012, there is zero tobacco tax increase.
Therefore, it is recommended that:
i. The price of tobacco products be significantly increased in 2013 and thereafter followed by
consistent annual raises in tobacco taxes, since a tax increase is proven to be a very effective
tool in tobacco control;
ii. Prices for all tobacco productz in 2013 be increased by a pre-determined quantum, in order to
prevent tobacco industry from absorbing the impact and maintaining current retail prices;
iii. Serious discussions be held between MOH and Ministry of Finance, Tax Division and other
relevant ministries to study and apply extensive evidence-base tobacco taxation structure,
identified globally as best practices. This includes the adoption of a relatively simple tax system
that applies equivalent taxes to all tobacco products, with:
a. At least 70% excise tax share in final consumer price, consistent with recommendations
of the WHO and the World Bank1,9;
b. Raise in tax that exceeds increases in consumer prices and incomes, to reduce the
affordability of tobacco products;
c. Minimisation of incentives for tobacco users to switch to cheaper brands or products in
response to tax increases;
d. Improvement of tobacco tax administration to reduce opportunities for tax avoidance
and tax evasion (including implementing effective monitoring systems for production
and transport of traded tobacco products);
iv. Results of independent researches concerning the burden of tobacco smuggling in Malaysia be
promoted to replace TI studies. It is important for relevant government agencies to understand
the findings from these alternate researches as the basis for policy decisions on tobacco
taxation. Adequate finances be allocated so that unbiased independent studies can be carried
out regularly;
v. As an active Party during the negotiation of the WHO FCTC Protocol on Article 15 (Illicit Trade),
the Malaysian Government ratifies the Protocol soonest when it is adopted.
109
Most of the above recommendations may be achieved through a comprehensive stand-alone Control of
Tobacco Products Act (CTPA). It is thus critical that the CTPA process be fast-tracked and enacted as
soon as possible.
A strong commitment is necessary in order for tobacco control to be made one of the top national
priorities to achieve positive health of the nation. With the global community movement for prevention
and control of non-communicable diseases (NCD), tobacco control takes on a centre stage. Therefore,
with that objective in mind, it is important to strengthen the current Tobacco Control & FCTC structure
so that all the essential action to achieve effective control can be delivered, using the WHO FCTC and
the WHO MPOWER Package.
10.2 Conclusion
Tobacco exacts an enormous toll on the public health, and effective efforts to alleviate this burden
require strong commitment from the country as a whole.
The 2011 Malaysian Global Adult Tobacco Survey or GATS Malaysia 2011 is the first comprehensive
nationwide cross-sectional survey that uses the internationally standardised research tool provided by
the WHO and CDC under the Global Tobacco Surveillance System (GTSS). Besides GATS, Malaysia had
also participated twice in another GTSS survey, i.e., the Global Youth Tobacco Survey 2003 and 2009
(GYTS 2003 & GYTS 2009).
Malaysia has conducted three National Health and Morbidity Surveys (NHMS) every 10 years since 1986,
where tobacco use has always been an integral module in each of the NHMS. Results on tobacco
consumption patterns obtained from these surveys have been used for formulating prior tobacco
control initiatives in Malaysia.
GATS Malaysia provides national estimates for tobacco use, classified by residence, gender and other
soci-demographic characteristics. Apart for that, GATS Malaysia also provides reliable data on various
dimensions of tobacco control, such as exposure to secondhand smoke, exposure to anti-tobacco
information through media and campaign, expenditures related to tobacco use, knowledge on diseases
caused by smoking, impact of pictorial health warning and extent of willingness to quit smoking.
It is important that GATS Malaysia results be widely disseminated and used as a national resource for
monitoring and implementing the WHO FCTC.
110
References
1 World Health Organization: WHO Report on the Global Tobacco Epidemic, 2008: The MPOWER package. Geneva: World Health Organization; 2008.
2 MOH’s Roadmap towards Achieving FCTC Compliance. Available from: www.mctc.org.my/conferences/.../9_plenary1_rosnah_mod_full.pdf.
3 His Majesty’s Government Gazette P.U. (A) 383. Food Act 1983. Control of Tobacco Product Regulations 1993, 18 November 1993.
4 World Health Organization. WHO Framework Convention on Tobacco Control. Geneva: World Health Organization, 2010.
5 His Majesty’s Government Gazette P.U. (A) 324. Food Act 1983. Control of Tobacco Product Regulations 2004, 23 September 2004.
6 Ministry of Health Malaysia. Food Act 1983, Control of Tobacco Product (Amendment) Regulations, 2008.
7 Foong K, Omar M, Lajis R, Awang R, Tan YL, Yong CY. Report Evaluation of the National Anti-Smoking Campaign in Malaysia. Tak Nak Media Campaign 2004. ClearingHouse and Research Network for Tobacco Control, National Poison Centre of Malaysia, Penang, Malaysia; 2005.
8 Disease Control Division, Ministry of Health. Clinical Practice Guidelines, Treatment of Tobacco Smoking and Dependence, 2003. Kuala Lumpur, Malaysia; Ministry of Health Malaysia; 2003.
9 Jha P, Chaloupka FJ. Curbing the Epidemic: Governments and the Economics of Tobacco Control. Washington, DC: World Bank; 1999. Available from: http://www1.worldbank.org/tobacco/reports.htm.
10
AC Nielsen, 2001 market research. Reported in The Star, 19 July 2002.
Available from: http://biz.thestar.com.my/news/story.asp?file=/2002/7/19/business/hftop100&sec=business.
11 Malaysian smoke nine billion sticks of illegal cigarettes every year. Reported in The Star, 26 April 2011.
Available from: http://thestar.com.my/news/story.asp?file=/2011/4/26/nation/20110426082729&sec=nation 12 Institute of Public Health, Ministry of Health Malaysia. National Health and Morbidity Survey (NHMS II).
Volume 15: Smoking. Kuala Lumpur, Malaysia: Ministry of Health Malaysia; 1997. 13 Institute for Public Health (IPH), 2008. The Third National Health and Morbidity Survey (NHMS III). Smoking.,
Kuala Lumpur, Malaysia: Ministry of Health Malaysia; 2007. 14 Manimaran K. Report of the Global Youth Tobacco Survey, Malaysia. Kuala Lumpur, Malaysia: Ministry of
Health Malaysia; 2003. 15 Ministry Of Health Malaysia. Report of the Global Youth Tobacco Survey, Malaysia. Kuala Lumpur, Malaysia;
Ministry of Health Malaysia; 2009. 16 Information and Documentation System (IDS), Annual Report. Kuala Lumpur, Malaysia: Ministry of Health
Malaysia; 2006.
111
17 Institute of Public Health, Ministry of Health Malaysia. Malaysian Burden of Disease and Injury Study, Health Prioritization: Burden of Disease Approach. Kuala Lumpur, Malaysia: Ministry of Health Malaysia; 2004.
18 Warner KE, Hodgson TA, Carroll CE. Medical costs of smoking in the United States: Estimates, their validity,
and their implications. Tobacco Control 1999; 8:290-300. 19 World Bank. Curbing the Epidemic: Governments and the Economics of Tobacco Control. New York: World
Bank; 1999. 20 Aljunid SM et al. Health Care Cost of Smoking in Malaysia, SEATCA Report, 2007. 21 Global Adult Tobacco Survey Collaborative Group. Global Adult Tobacco Survey (GATS): Sample Design and
Sample Weight manuals, Version 2.0. Atlanta, GA: Centers for Disease Control and Prevention, 2010.
22 Global Adult Tobacco Survey Collaborative Group. Global Adult Tobacco Survey (GATS): Core Questionnaire with Optional Questions, Version 2.0. Atlanta, GA: Centers for Disease Control and Prevention, 2010.
23 Global Adult Tobacco Survey Collaborative Group. Global Adult Tobacco Survey (GATS): Programmer’s Guide
to General Survey System Manual, Version 2.0. Atlanta, GA: Centers for Disease Control and Prevention, 2010.
24 Global Adult Tobacco Survey Collaborative Group. Global Adult Tobacco Survey (GATS): Field Interviewer Manual, Version 2.0. Atlanta, GA: Centers for Disease Control and Prevention, 2010.
25 Global Adult Tobacco Survey Collaborative Group. Global Adult Tobacco Survey (GATS): Field Supervisor
Manual, Version 2.0. Atlanta, GA: Centers for Disease Control and Prevention, 2010. 26 Global Adult Tobacco Survey Collaborative Group. Global Adult Tobacco Survey (GATS): Question-by-Question
Specifications, Version 2.0. Atlanta, GA: Centers for Disease Control and Prevention, 2010. 27 National Toxicology Program. Report on Carcinogens, 11th Edition. North Carolina, United States: U.S.
Department of Health and Human Services, Public Health Service, National Toxicology Program; 2005.
28 International Agency for Research on Cancer. Tobacco Smoke and Involuntary Smoking. Lyon, France: IARC;
2002. IARC Monographs on the Evaluation of Carcinogenic Risks to Humans, Vol. 83.
29 U.S. Department of Health and Human Services. How Tobacco Smoke Causes Disease: The Biology and
Behavioral Basis for Smoking-Attributable Disease: A Report of the Surgeon General. Atlanta, GA: U.S.
Department of Health and Human Services, Centers for Disease Control and Prevention, National Center for
Chronic Disease Prevention and Health Promotion, Office on Smoking and Health; 2010.
30 U.S. Environmental Protection Agency. Respiratory Health Effects of Passive Smoking (Also Known as Exposure to Secondhand Smoke or Environmental Tobacco Smoke—ETS). Washington, DC, United States: U.S. Environmental Protection Agency; 1992.
31 Institute of Medicine. Secondhand Smoke Exposure and Cardiovascular Effects: Making Sense of the Evidence.
Washington, DC: The National Academies Press; 2010. 32 Economic Report 2010/2011, Ministry of Finance Malaysia.
33 Ross H, Al-Sadat N. Demand Analysis of Tobacco Consumption. Nicotine & Tobacco Research 2007; 9:1163-1169.
112
34 Al-Sadat N, et al. Tobacco Use in Southeast Asia: Key Evidences for Policy Development. SEATCA Regional Summary Evidence paper: tax section. SEATCA Report; 2007.
35 Wisotzky M, Albuquerque M, Pechacek TF, Park BZ. The National Tobacco Control Program: Focusing on policy to broaden impact. Public Health Reports. 2004; 119:303-310.
36 WHO Report on the Global Tobacco Epidemic: Warning About the Dangers of Tobacco. Geneva: World Health Organization; 2011.
113
Appendix A: Questionnaire
GLOBAL ADULT TOBACCO SURVEY (GATS), MALAYSIA 2011
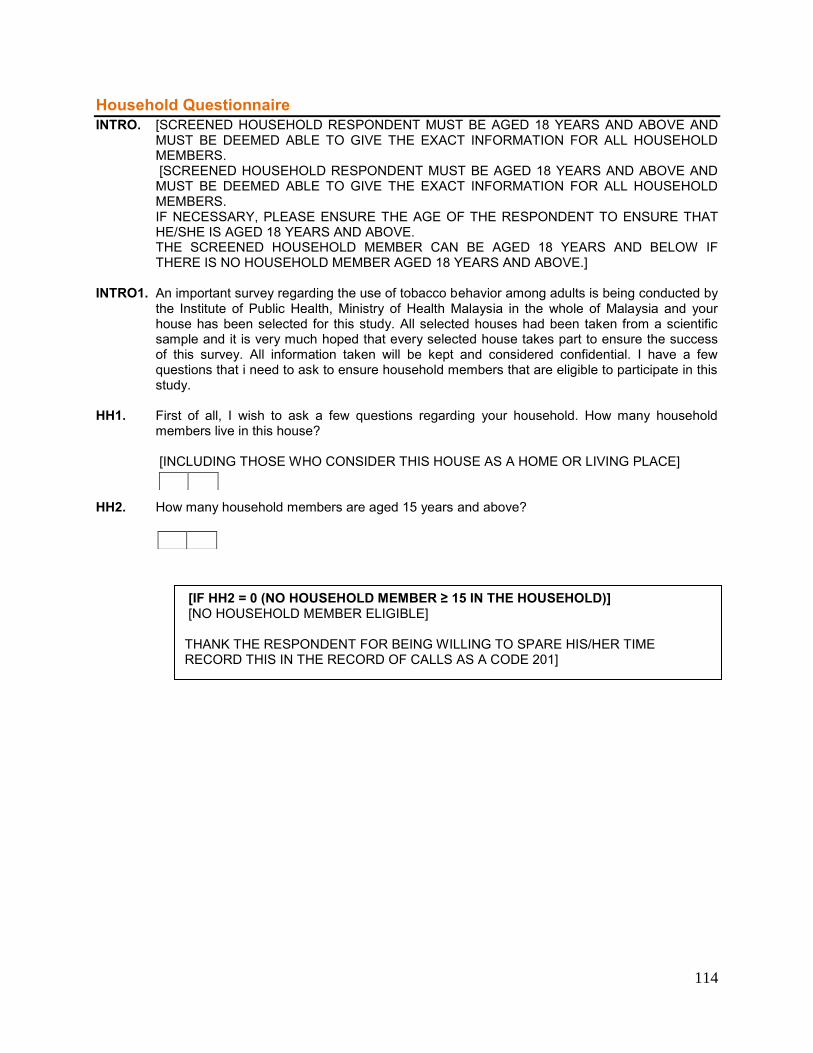
114
Household Questionnaire INTRO. [SCREENED HOUSEHOLD RESPONDENT MUST BE AGED 18 YEARS AND ABOVE AND
MUST BE DEEMED ABLE TO GIVE THE EXACT INFORMATION FOR ALL HOUSEHOLD MEMBERS. [SCREENED HOUSEHOLD RESPONDENT MUST BE AGED 18 YEARS AND ABOVE AND MUST BE DEEMED ABLE TO GIVE THE EXACT INFORMATION FOR ALL HOUSEHOLD MEMBERS. IF NECESSARY, PLEASE ENSURE THE AGE OF THE RESPONDENT TO ENSURE THAT HE/SHE IS AGED 18 YEARS AND ABOVE. THE SCREENED HOUSEHOLD MEMBER CAN BE AGED 18 YEARS AND BELOW IF THERE IS NO HOUSEHOLD MEMBER AGED 18 YEARS AND ABOVE.]
INTRO1. An important survey regarding the use of tobacco behavior among adults is being conducted by the Institute of Public Health, Ministry of Health Malaysia in the whole of Malaysia and your house has been selected for this study. All selected houses had been taken from a scientific sample and it is very much hoped that every selected house takes part to ensure the success of this survey. All information taken will be kept and considered confidential. I have a few questions that i need to ask to ensure household members that are eligible to participate in this study.
HH1. First of all, I wish to ask a few questions regarding your household. How many household members live in this house? [INCLUDING THOSE WHO CONSIDER THIS HOUSE AS A HOME OR LIVING PLACE]
HH2. How many household members are aged 15 years and above?
[IF HH2 = 0 (NO HOUSEHOLD MEMBER ≥ 15 IN THE HOUSEHOLD)] [NO HOUSEHOLD MEMBER ELIGIBLE] THANK THE RESPONDENT FOR BEING WILLING TO SPARE HIS/HER TIME RECORD THIS IN THE RECORD OF CALLS AS A CODE 201]
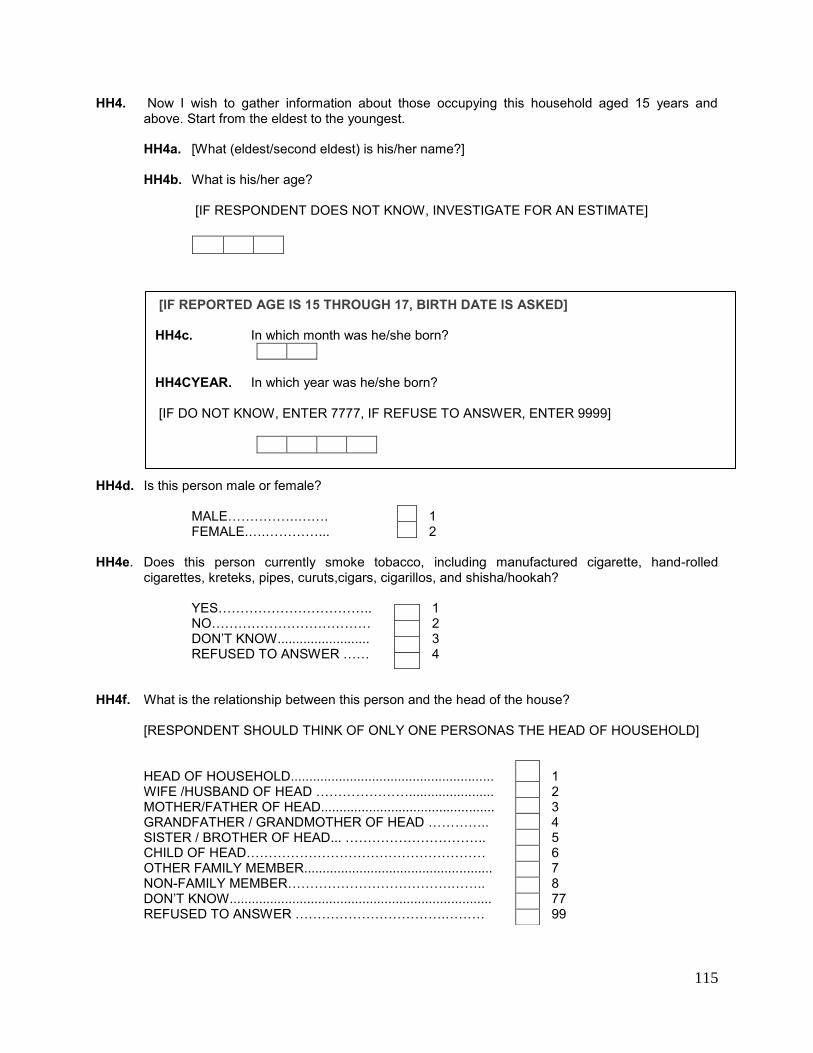
115
HH4. Now I wish to gather information about those occupying this household aged 15 years and above. Start from the eldest to the youngest. HH4a. [What (eldest/second eldest) is his/her name?]
HH4b. What is his/her age?
[IF RESPONDENT DOES NOT KNOW, INVESTIGATE FOR AN ESTIMATE]
HH4d. Is this person male or female? MALE…………….……. 1 FEMALE.….…………... 2 HH4e. Does this person currently smoke tobacco, including manufactured cigarette, hand-rolled
cigarettes, kreteks, pipes, curuts,cigars, cigarillos, and shisha/hookah? YES…………………………….. 1
NO……………………………… 2 DON’T KNOW......................... 3 REFUSED TO ANSWER …… 4 HH4f. What is the relationship between this person and the head of the house?
[RESPONDENT SHOULD THINK OF ONLY ONE PERSONAS THE HEAD OF HOUSEHOLD]
HEAD OF HOUSEHOLD....................................................... 1 WIFE /HUSBAND OF HEAD …………………....................... 2 MOTHER/FATHER OF HEAD............................................... 3 GRANDFATHER / GRANDMOTHER OF HEAD ………….. 4 SISTER / BROTHER OF HEAD... ………………………….. 5 CHILD OF HEAD……………………………………………… 6 OTHER FAMILY MEMBER................................................... 7 NON-FAMILY MEMBER……………………………….…….. 8 DON’T KNOW....................................................................... 77 REFUSED TO ANSWER …………………………….……… 99
[IF REPORTED AGE IS 15 THROUGH 17, BIRTH DATE IS ASKED] HH4c. In which month was he/she born?
HH4CYEAR. In which year was he/she born? [IF DO NOT KNOW, ENTER 7777, IF REFUSE TO ANSWER, ENTER 9999]
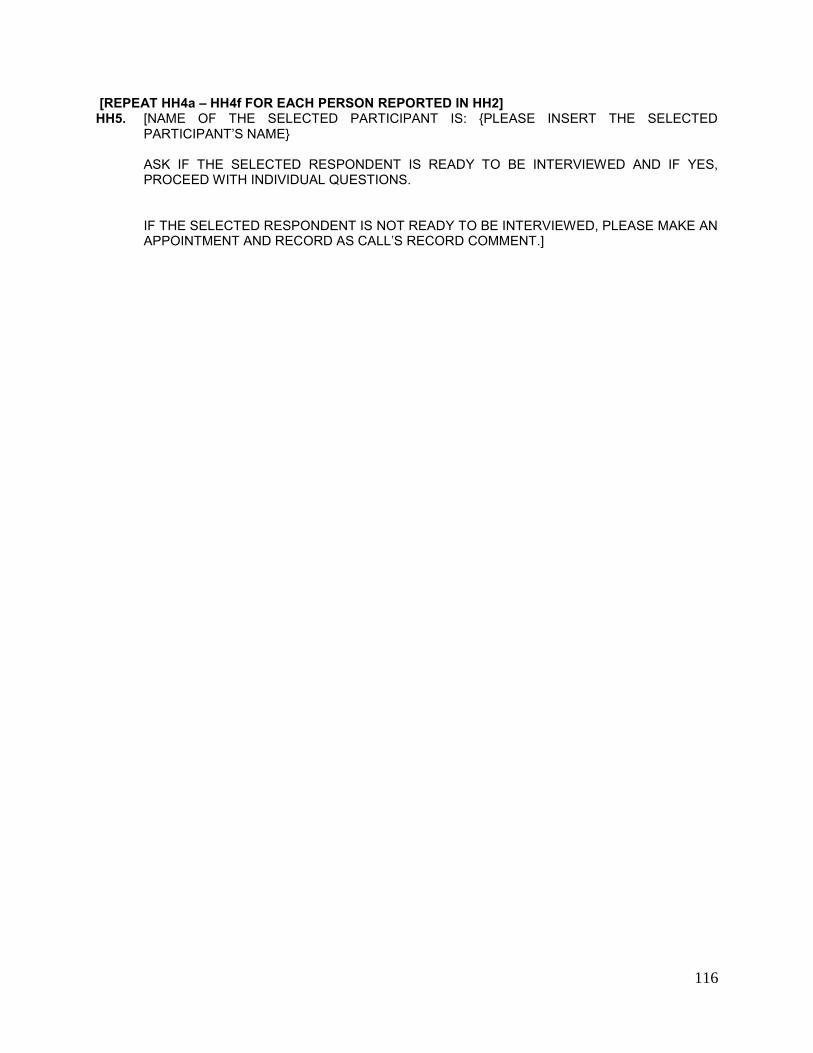
116
[REPEAT HH4a – HH4f FOR EACH PERSON REPORTED IN HH2] HH5. [NAME OF THE SELECTED PARTICIPANT IS: {PLEASE INSERT THE SELECTED
PARTICIPANT’S NAME}
ASK IF THE SELECTED RESPONDENT IS READY TO BE INTERVIEWED AND IF YES, PROCEED WITH INDIVIDUAL QUESTIONS.
IF THE SELECTED RESPONDENT IS NOT READY TO BE INTERVIEWED, PLEASE MAKE AN APPOINTMENT AND RECORD AS CALL’S RECORD COMMENT.]
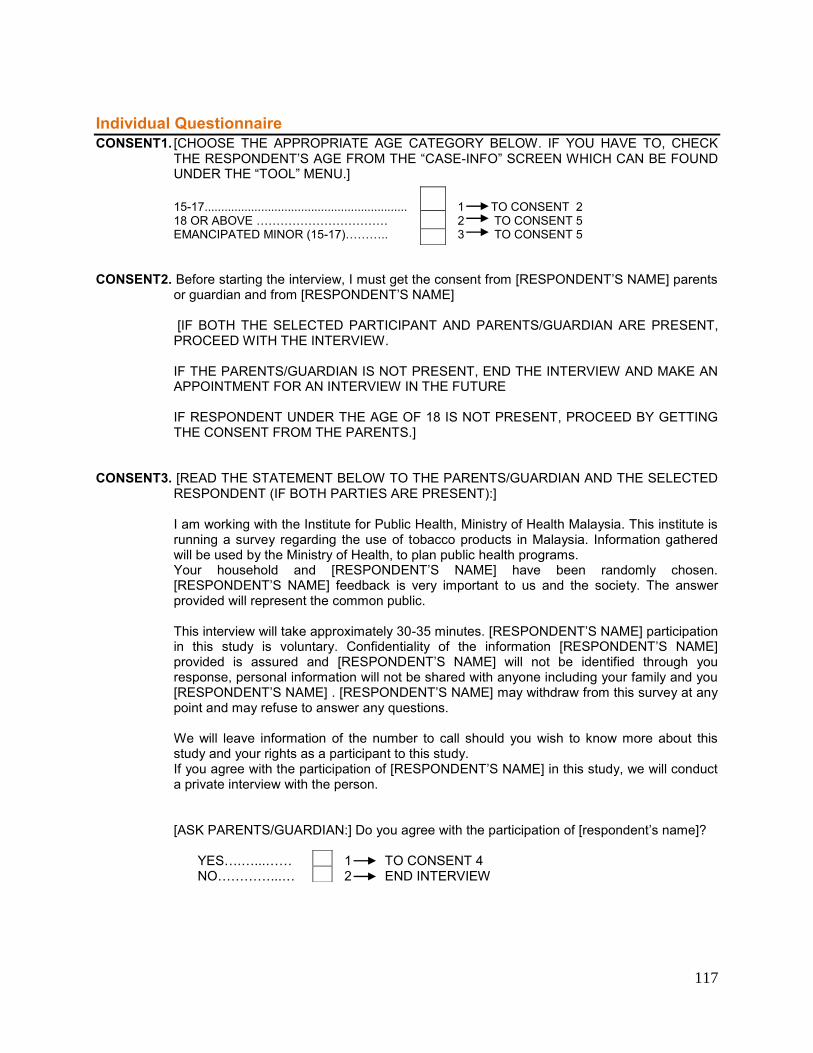
117
Individual Questionnaire CONSENT1. [CHOOSE THE APPROPRIATE AGE CATEGORY BELOW. IF YOU HAVE TO, CHECK
THE RESPONDENT’S AGE FROM THE “CASE-INFO” SCREEN WHICH CAN BE FOUND UNDER THE “TOOL” MENU.]
15-17............................................................. 1 TO CONSENT 2 18 OR ABOVE …………………………… 2 TO CONSENT 5
EMANCIPATED MINOR (15-17)……….. 3 TO CONSENT 5 CONSENT2. Before starting the interview, I must get the consent from [RESPONDENT’S NAME] parents
or guardian and from [RESPONDENT’S NAME] [IF BOTH THE SELECTED PARTICIPANT AND PARENTS/GUARDIAN ARE PRESENT, PROCEED WITH THE INTERVIEW.
IF THE PARENTS/GUARDIAN IS NOT PRESENT, END THE INTERVIEW AND MAKE AN APPOINTMENT FOR AN INTERVIEW IN THE FUTURE IF RESPONDENT UNDER THE AGE OF 18 IS NOT PRESENT, PROCEED BY GETTING THE CONSENT FROM THE PARENTS.]
CONSENT3. [READ THE STATEMENT BELOW TO THE PARENTS/GUARDIAN AND THE SELECTED
RESPONDENT (IF BOTH PARTIES ARE PRESENT):] I am working with the Institute for Public Health, Ministry of Health Malaysia. This institute is
running a survey regarding the use of tobacco products in Malaysia. Information gathered will be used by the Ministry of Health, to plan public health programs. Your household and [RESPONDENT’S NAME] have been randomly chosen. [RESPONDENT’S NAME] feedback is very important to us and the society. The answer provided will represent the common public.
This interview will take approximately 30-35 minutes. [RESPONDENT’S NAME] participation in this study is voluntary. Confidentiality of the information [RESPONDENT’S NAME] provided is assured and [RESPONDENT’S NAME] will not be identified through you response, personal information will not be shared with anyone including your family and you [RESPONDENT’S NAME] . [RESPONDENT’S NAME] may withdraw from this survey at any point and may refuse to answer any questions.
We will leave information of the number to call should you wish to know more about this
study and your rights as a participant to this study. If you agree with the participation of [RESPONDENT’S NAME] in this study, we will conduct
a private interview with the person.
[ASK PARENTS/GUARDIAN:] Do you agree with the participation of [respondent’s name]? YES….…...…… 1 TO CONSENT 4 NO…………...… 2 END INTERVIEW
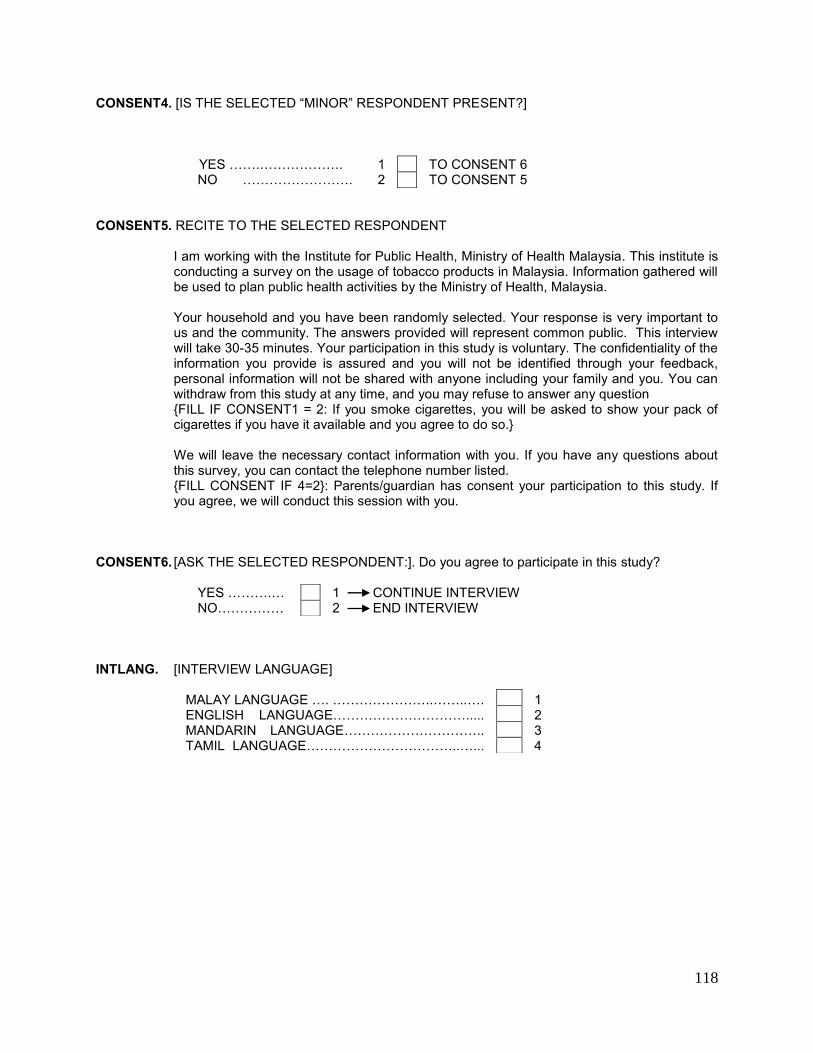
118
CONSENT4. [IS THE SELECTED “MINOR” RESPONDENT PRESENT?]
YES …….………………. 1 TO CONSENT 6 NO ……………………. 2 TO CONSENT 5 CONSENT5. RECITE TO THE SELECTED RESPONDENT I am working with the Institute for Public Health, Ministry of Health Malaysia. This institute is
conducting a survey on the usage of tobacco products in Malaysia. Information gathered will be used to plan public health activities by the Ministry of Health, Malaysia. Your household and you have been randomly selected. Your response is very important to us and the community. The answers provided will represent common public. This interview will take 30-35 minutes. Your participation in this study is voluntary. The confidentiality of the information you provide is assured and you will not be identified through your feedback, personal information will not be shared with anyone including your family and you. You can withdraw from this study at any time, and you may refuse to answer any question {FILL IF CONSENT1 = 2: If you smoke cigarettes, you will be asked to show your pack of cigarettes if you have it available and you agree to do so.}
We will leave the necessary contact information with you. If you have any questions about
this survey, you can contact the telephone number listed. {FILL CONSENT IF 4=2}: Parents/guardian has consent your participation to this study. If
you agree, we will conduct this session with you.
CONSENT6. [ASK THE SELECTED RESPONDENT:]. Do you agree to participate in this study?
YES ……….… 1 CONTINUE INTERVIEW NO…………… 2 END INTERVIEW INTLANG. [INTERVIEW LANGUAGE] MALAY LANGUAGE …. …………………..……..…. 1 ENGLISH LANGUAGE…………………………..... 2 MANDARIN LANGUAGE………………………….. 3
TAMIL LANGUAGE……………………………..…... 4
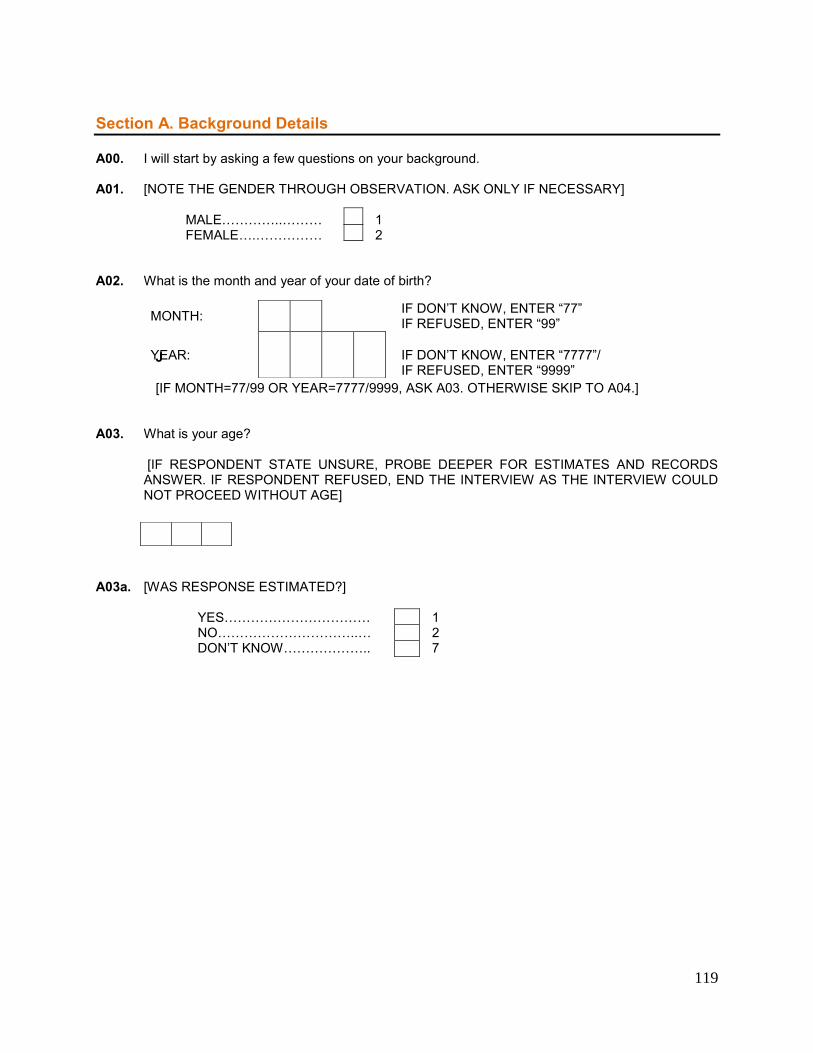
119
Section A. Background Details A00. I will start by asking a few questions on your background. A01. [NOTE THE GENDER THROUGH OBSERVATION. ASK ONLY IF NECESSARY] MALE…………..……… 1 FEMALE….…………… 2 A02. What is the month and year of your date of birth?
J
[IF MONTH=77/99 OR YEAR=7777/9999, ASK A03. OTHERWISE SKIP TO A04.] A03. What is your age?
[IF RESPONDENT STATE UNSURE, PROBE DEEPER FOR ESTIMATES AND RECORDS ANSWER. IF RESPONDENT REFUSED, END THE INTERVIEW AS THE INTERVIEW COULD NOT PROCEED WITHOUT AGE]
A03a. [WAS RESPONSE ESTIMATED?] YES…………………………… 1 NO…………………………..… 2 DON’T KNOW……………….. 7
MONTH: IF DON’T KNOW, ENTER “77”
IF REFUSED, ENTER “99”
YEAR: IF DON’T KNOW, ENTER “7777”/ IF REFUSED, ENTER “9999”
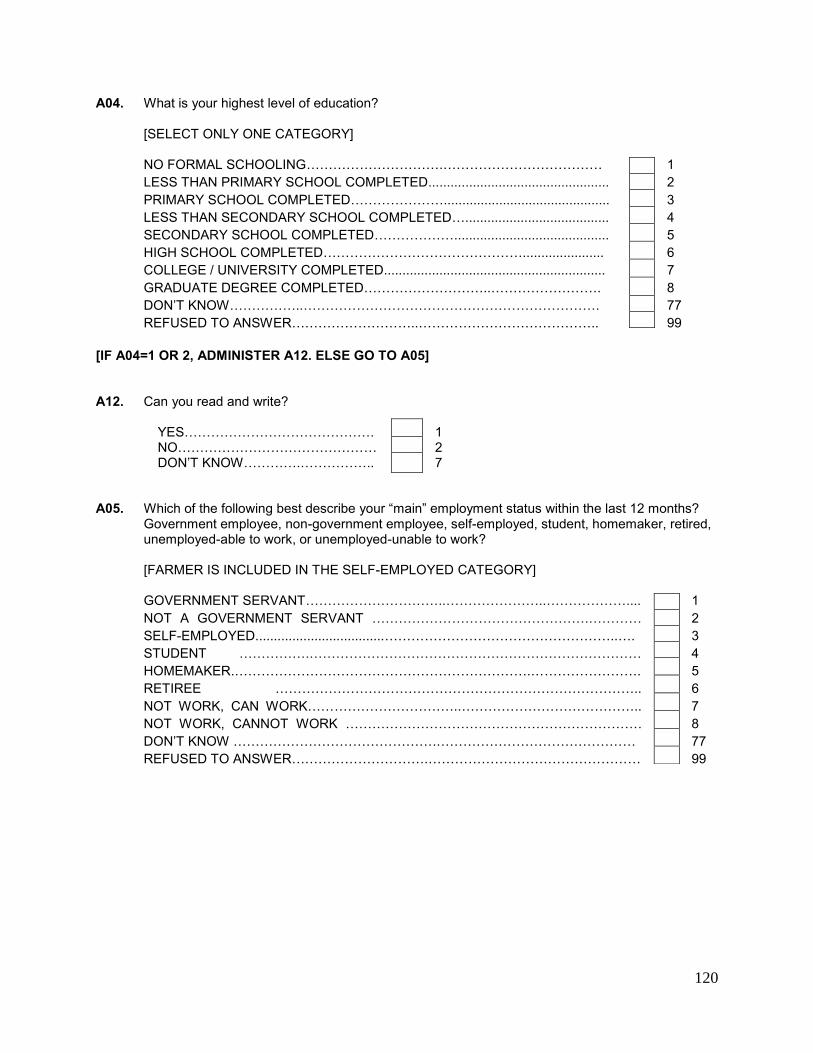
120
A04. What is your highest level of education? [SELECT ONLY ONE CATEGORY]
NO FORMAL SCHOOLING………………………….……………………………… 1 LESS THAN PRIMARY SCHOOL COMPLETED................................................. 2 PRIMARY SCHOOL COMPLETED…………………............................................. 3 LESS THAN SECONDARY SCHOOL COMPLETED…....................................... 4 SECONDARY SCHOOL COMPLETED……………….......................................... 5 HIGH SCHOOL COMPLETED………………………………………...................... 6 COLLEGE / UNIVERSITY COMPLETED............................................................ 7 GRADUATE DEGREE COMPLETED………………………..……………………. 8 DON’T KNOW……………..…………………………………………………………. 77 REFUSED TO ANSWER………………………..………………………………….. 99
[IF A04=1 OR 2, ADMINISTER A12. ELSE GO TO A05] A12. Can you read and write? YES……………………………………. 1 NO……………………………………… 2 DON’T KNOW………….…………….. 7 A05. Which of the following best describe your “main” employment status within the last 12 months?
Government employee, non-government employee, self-employed, student, homemaker, retired, unemployed-able to work, or unemployed-unable to work?
[FARMER IS INCLUDED IN THE SELF-EMPLOYED CATEGORY] GOVERNMENT SERVANT…………………………..…………………..……………….... 1 NOT A GOVERNMENT SERVANT ………………………………………….………… 2 SELF-EMPLOYED...................................……………………………………………..…. 3 STUDENT …………….………………………………………………………………… 4 HOMEMAKER.………………………………………………………….……………………. 5 RETIREE ……………………………………………………………………….. 6 NOT WORK, CAN WORK……………………………..………………………………….. 7 NOT WORK, CANNOT WORK …………………………………………………………. 8
DON’T KNOW ……………………………………….……………………………………… 77 REFUSED TO ANSWER………………………….………………………………………… 99
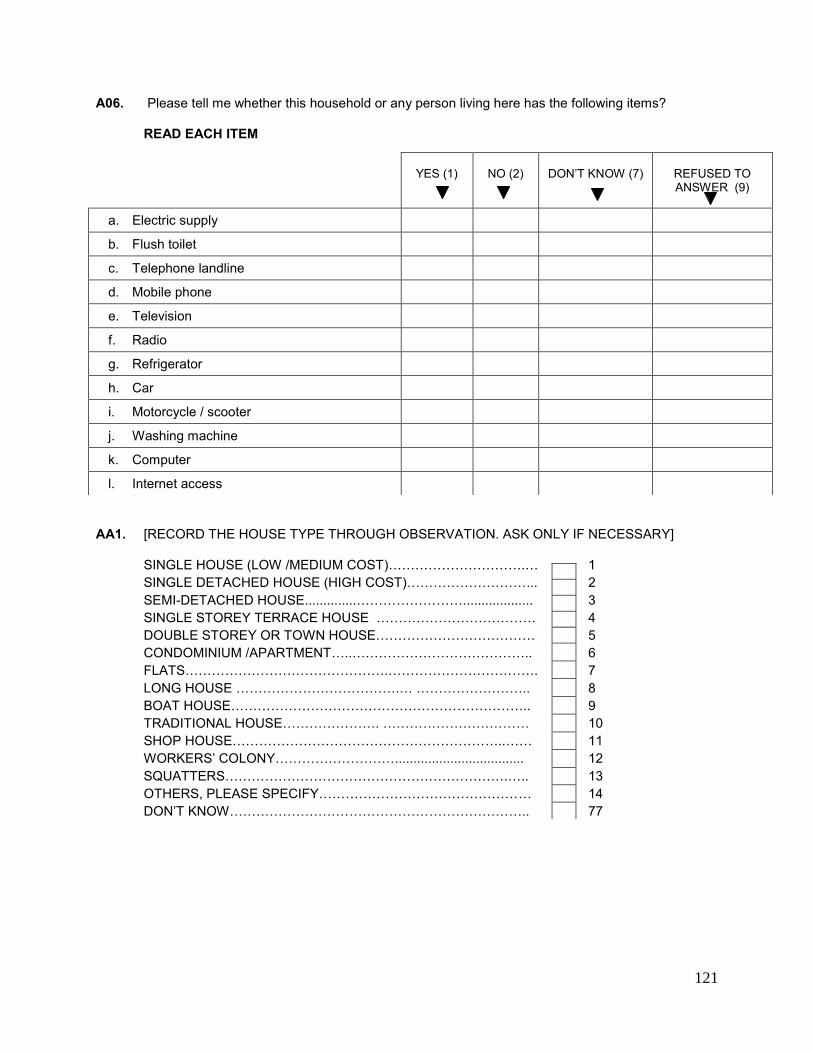
121
A06. Please tell me whether this household or any person living here has the following items? READ EACH ITEM
AA1. [RECORD THE HOUSE TYPE THROUGH OBSERVATION. ASK ONLY IF NECESSARY]
SINGLE HOUSE (LOW /MEDIUM COST)………………………….… 1 SINGLE DETACHED HOUSE (HIGH COST)………………………... 2 SEMI-DETACHED HOUSE..............……………………................... 3 SINGLE STOREY TERRACE HOUSE ……………………………… 4 DOUBLE STOREY OR TOWN HOUSE……………………………… 5 CONDOMINIUM /APARTMENT…..………………………………….. 6 FLATS……………………………………….……………………………. 7 LONG HOUSE ……………………………….… …………………….. 8 BOAT HOUSE………………………………………………………….. 9 TRADITIONAL HOUSE…………………. …………………………… 10 SHOP HOUSE……………………………………………………..…… 11 WORKERS’ COLONY………………………................................... 12 SQUATTERS……………………………………………………….….. 13 OTHERS, PLEASE SPECIFY………………………………………… 14 DON’T KNOW………………………………………………………….. 77
YES (1)
NO (2)
DON’T KNOW (7)
REFUSED TO ANSWER (9)
a. Electric supply
b. Flush toilet
c. Telephone landline
d. Mobile phone
e. Television
f. Radio
g. Refrigerator
h. Car
i. Motorcycle / scooter
j. Washing machine
k. Computer
l. Internet access
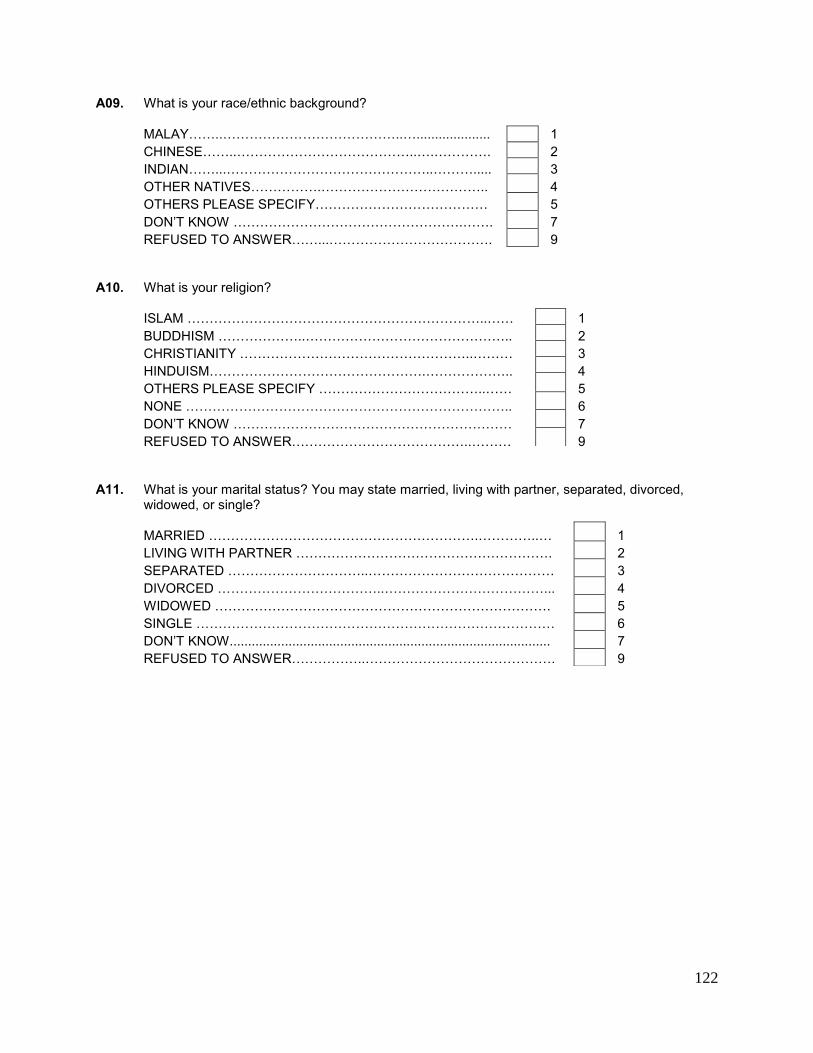
122
A09. What is your race/ethnic background?
MALAY……..…………………………………..….................... 1 CHINESE……..…………………………………..….…………. 2 INDIAN……...………………………………………..………..... 3 OTHER NATIVES…………….……………………………….. 4 OTHERS PLEASE SPECIFY………………………………… 5 DON’T KNOW …………………………………………….……. 7 REFUSED TO ANSWER……...………………………………. 9
A10. What is your religion?
ISLAM …………………………………………………………..…… 1 BUDDHISM ………………..……………………………………….. 2 CHRISTIANITY ……………………………………………..……… 3 HINDUISM………………………………………….……………….. 4 OTHERS PLEASE SPECIFY ………………………………..…… 5 NONE ……………………………………………………………….. 6 DON’T KNOW ……………………………………………………… 7 REFUSED TO ANSWER…………………………………..……… 9
A11. What is your marital status? You may state married, living with partner, separated, divorced,
widowed, or single?
MARRIED …………………………………………………….…………..… 1 LIVING WITH PARTNER …………………………………………………. 2 SEPARATED …………………………..…………………………………… 3 DIVORCED ………………………………..………………………………... 4 WIDOWED …………………………………………………………………. 5 SINGLE ……………………………………………………………………… 6 DON’T KNOW....................................................................................... 7 REFUSED TO ANSWER……………..……………………………………. 9
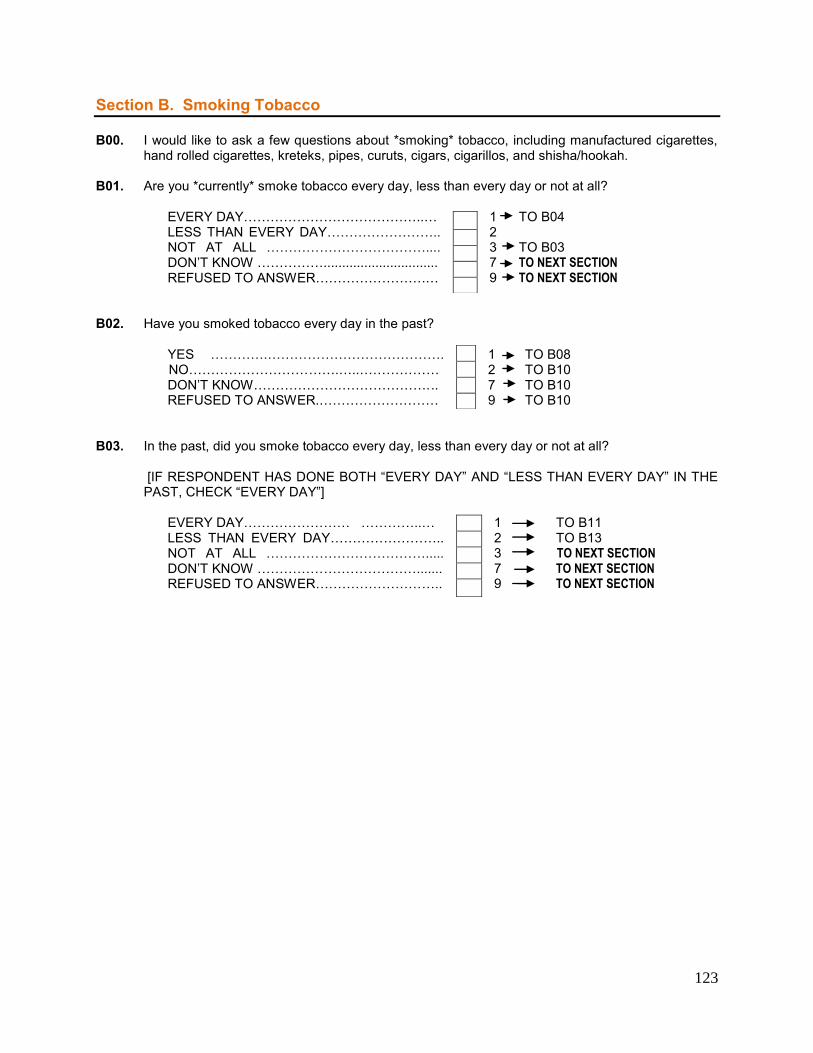
123
Section B. Smoking Tobacco B00. I would like to ask a few questions about *smoking* tobacco, including manufactured cigarettes,
hand rolled cigarettes, kreteks, pipes, curuts, cigars, cigarillos, and shisha/hookah. B01. Are you *currently* smoke tobacco every day, less than every day or not at all? EVERY DAY…………………………………..… 1 TO B04 LESS THAN EVERY DAY…………………….. 2 NOT AT ALL ……………………………….... 3 TO B03
DON’T KNOW ……………............................... 7 TO NEXT SECTION REFUSED TO ANSWER…………………….… 9 TO NEXT SECTION B02. Have you smoked tobacco every day in the past? YES ………….…………………………………. 1 TO B08 NO…………………………….…..……………… 2 TO B10 DON’T KNOW…………………………………. .. 7 TO B10 REFUSED TO ANSWER.……………………… 9 TO B10 B03. In the past, did you smoke tobacco every day, less than every day or not at all?
[IF RESPONDENT HAS DONE BOTH “EVERY DAY” AND “LESS THAN EVERY DAY” IN THE PAST, CHECK “EVERY DAY”]
EVERY DAY…………………… …………..… 1 TO B11 LESS THAN EVERY DAY…………………….. 2 TO B13 NOT AT ALL ………………………………..... 3 TO NEXT SECTION
DON’T KNOW ………………………………....... 7 TO NEXT SECTION REFUSED TO ANSWER……………………….. 9 TO NEXT SECTION
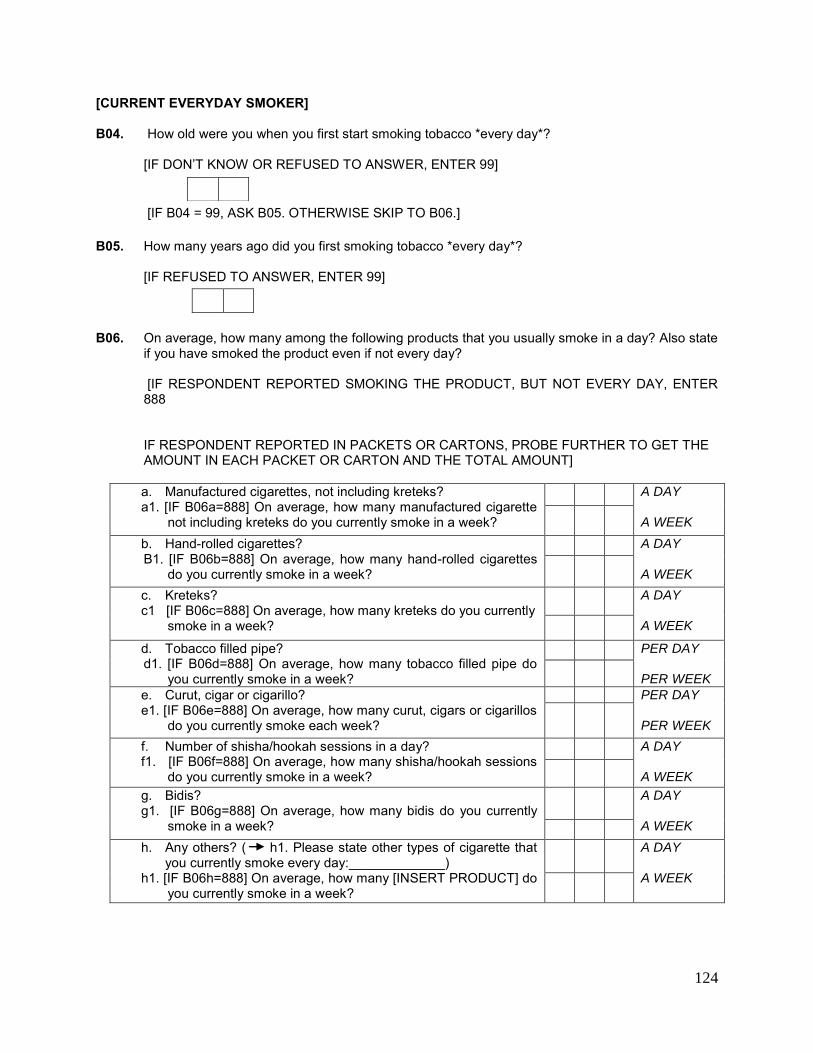
124
[CURRENT EVERYDAY SMOKER] B04. How old were you when you first start smoking tobacco *every day*?
[IF DON’T KNOW OR REFUSED TO ANSWER, ENTER 99]
[IF B04 = 99, ASK B05. OTHERWISE SKIP TO B06.]
B05. How many years ago did you first smoking tobacco *every day*?
[IF REFUSED TO ANSWER, ENTER 99]
B06. On average, how many among the following products that you usually smoke in a day? Also state
if you have smoked the product even if not every day?
[IF RESPONDENT REPORTED SMOKING THE PRODUCT, BUT NOT EVERY DAY, ENTER 888 IF RESPONDENT REPORTED IN PACKETS OR CARTONS, PROBE FURTHER TO GET THE AMOUNT IN EACH PACKET OR CARTON AND THE TOTAL AMOUNT] a. Manufactured cigarettes, not including kreteks? a1. [IF B06a=888] On average, how many manufactured cigarette
not including kreteks do you currently smoke in a week?
A DAY A WEEK
b. Hand-rolled cigarettes? B1. [IF B06b=888] On average, how many hand-rolled cigarettes
do you currently smoke in a week?
A DAY A WEEK
c. Kreteks? c1 [IF B06c=888] On average, how many kreteks do you currently
smoke in a week?
A DAY A WEEK
d. Tobacco filled pipe? d1. [IF B06d=888] On average, how many tobacco filled pipe do
you currently smoke in a week?
PER DAY PER WEEK
e. Curut, cigar or cigarillo? e1. [IF B06e=888] On average, how many curut, cigars or cigarillos
do you currently smoke each week?
PER DAY PER WEEK
f. Number of shisha/hookah sessions in a day? f1. [IF B06f=888] On average, how many shisha/hookah sessions
do you currently smoke in a week?
A DAY A WEEK
g. Bidis? g1. [IF B06g=888] On average, how many bidis do you currently
smoke in a week?
A DAY A WEEK
h. Any others? ( h1. Please state other types of cigarette that you currently smoke every day:_____________)
h1. [IF B06h=888] On average, how many [INSERT PRODUCT] do you currently smoke in a week?
A DAY A WEEK
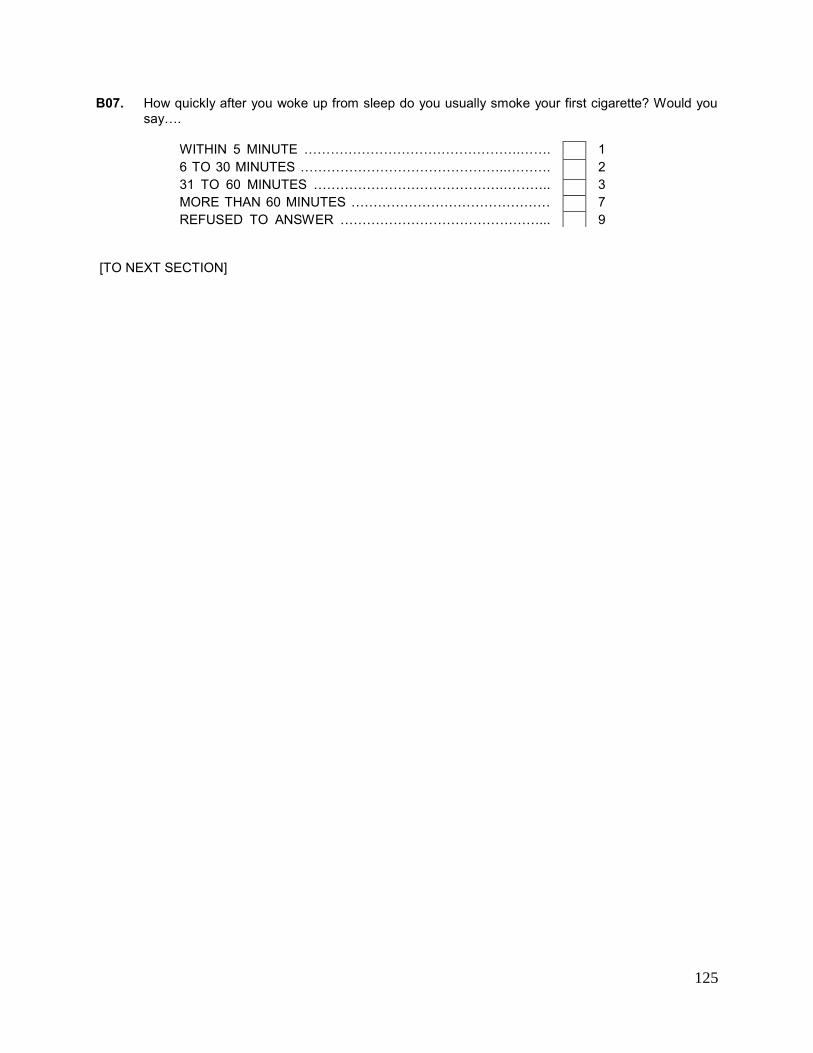
125
B07. How quickly after you woke up from sleep do you usually smoke your first cigarette? Would you say….
WITHIN 5 MINUTE ………………………………………….……. 1 6 TO 30 MINUTES ………………………………………..………. 2 31 TO 60 MINUTES …………………………………….……….. 3 MORE THAN 60 MINUTES ……………………………………… 7
REFUSED TO ANSWER ………………………………………... 9 [TO NEXT SECTION]
126
[SMOKE LESS THAN EVERY DAY] B08. What is your age when you first smoked tobacco *every day*?
[IF DON’T KNOW OR REFUSED TO ANSWER, ENTER 99]
[IF B08 = 99, ASK B09. OTHERWISE, SKIP TO B10.]
B09. How many years ago did you first start smoking tobacco *every day* [IF REFUSED TO ANSWER, ENTER 99]
B10. How many of the following do you currently smoke in a usual week?
[IF RESPONDENT REPORTED DOING SAID ACTIVITY IN THE PAST 30 DAYS, BUT LESS THAN ONCE A WEEK, ENTER 888 IF RESPONDENT REPORTED IN PACKETS OR CARTONS, PROBE FURTHER TO GET THE AMOUNT OF CIGARETTE IN A PACKET OR CARTON AND THE TOTAL AMOUNT]
a. Manufactured cigarettes, not including kreteks?
PER WEEK
b. Hand-rolled cigarettes?
PER WEEK
c. Kreteks?
PER WEEK
d. Tobacco filled pipe?
PER WEEK
e. Curut, cigar or cigarillo?
PER WEEK
f. Number of shisha/hookah sessions per week?
PER WEEK
g. Bidis?
h. Any others? g1. Please state other types of cigarette that you currently smoke during a usual week:_____________
PER WEEK
[TO THE NEXT SECTION]
127
[FORMER TOBACCO USER] B11. What is your age when you first smoke tobacco *every day*?
[IF DON’T KNOW OR REFUSED TO ANSWER, ENTER 99]
[IF B11 = 99, ASK B12. OTHERS PROCEED TO B13]
B12. How many years ago did you first start smoking tobacco *every day*
[IF REFUSED TO ANSWER, ENTER 99]
B13. How long have you stopped smoking?
[ONLY INTERESTED IN RESPONDENT WHO HAS STOPPED SMOKING REGULARLY -- DOES NOT INCLUDE RESPONDENTS WHO USED TOBACCO IN RARE INSTANCES]
INSERT UNIT AND NUMBER YEARS ………………………………. 1 MONTHS ……………………..…… . 2 WEEKS ………………………..…….. 3
DAYS………………………………… 4 LESS THAN A DAY………………… 5 TO B14 DON’T KNOW……………..………… 7 TO NEXT SECTION
REFUSED TO ANSWER………….. 9 TO NEXT SECTION
[IF B13 < 1 YEAR (< 12 MONTH), CONTINUE WITH B14. OTHER THAN THAT, PROCEED TO THE NEXT SECTION].
B14. Did you visit a doctor or other health care provider in the last 12 months? YES……………………………….… 1 NO………………………………….. 2 TO B18 REFUSED TO ANSWER……….. 9 TO B18
128
B15. How many times did you visit a doctor or health care provider in the last 12 months? Was it…. 1 OR 2 TIMES…………………………………………... 1 3 TO 5 TIMES……………….….………………………... 2 6 OR MORE TIMES.................................................... 3 REFUSED TO ANSWER ………………………………. 9 B16. When you visit a doctor or heath care provider in the last 12 months, were you asked whether
you smoke tobacco or not? YES…………………………………………….. 1
NO……………………………………………… 2 TO B18 REFUSED TO ANSWER 9 TO B18 B17. When you visit the doctor or health care provider in the last 12 months, were you advised to quit
smoking tobacco? YES…………………………………….… 1 NO…………………………………......... 2 TO B18 REFUSED TO ANSWER 9 TO B18 B18. In the last 12 months, have you used the following methods to quit smoking?
a. Counseling, including at the quit- smoking clinic………………
b. Nicotine replacement therapy e.g. patch gum?......................
c. other prescription drugs, e.g. varenicline, bupropion…………
d. Traditional methods, e.g herbal therapy, hypnotherapy,
accupunture and aromatherapy.............................................
e. A quit line or a smoking telephone info line……………………
e1 [IF YES] Did you get the quit line or smoking telephone
info line number from the cigarette packet?....................
f. change to smokeless tobacco use……………………………..
g. Quit without assistance…………………………………………..
h. others? …………………………………………………………..…
h1. Please state the method used in the attempt to quit smoking
____________________________________________
[TO THE NEXT SECTION]
YES (1) NO (2) REFUSED TO ANSWER (9)
129
Section: Shisha/ hookah
WP1. I would like to ask a few questions about shisha/hookah smoking.
Have you smoked shisha/hookah every day in the past?
YES…………………………………………..… 1 TO WP3 NO…………………………………………….... 2 TO WP3 REFUSED TO ANSWER ……………………. 9 TO WP3
WP2. I would like to ask a few questions about shisha/hookah smoking.
In the *past*, have you smoked shisha/hookah every day, less than every day or not at all? [IF RESPONDENT HAS DONE BOTH “EVERY DAY” AND “LESS THAN EVERY DAY” IN THE PAST, MARK “EVERY DAY”]
EVERY DAY……………………………….... 1 LESS THAN EVERY DAY ………………… 2
NOT AT ALL……………….………………… 3 TO NEXT SECTION REFUSED TO ANSWER………………….. 9
WP3. (I would like to ask a few questions about shisha/hookah smoking.)
What age did you first start smoking shisha/hookah? [IF DON’T KNOW OR REFUSED TO ANSWER, ENTER 99]
[IF WP3=99, ASK WP4. OTHER THAN THAT PROCEED TO THE NEXT INSTRUCTION]
ROUTING: B06F/B10F ASK TOTAL AMOUNT OF SHISHA/HOOKAH SESSIONS IN A DAY/WEEK ─ IF B01=3 AND B03=3 (NEVER SMOKER), TO NEXT SECTION ─ IF B01=3 AND B03=1 OR 2 (FORMER SMOKER), PROCEED TO WP2 ─ IF B01=1 AND B06F>0 AND <888 (CURRENT EVERY DAY SHISHA/HOOKAH SMOKERS), PROCEED TO WP3 ─ IF B01=1 AND B06F=888 (CURRENT LESS THAN EVERY DAY SHISHA/HOOKAH SMOKER), PROCEED TO WP1 ─ IF B01=2 AND B10F>0 AND <=888 (CURRENT LESS THAN EVERY DAY SHISHA/HOOKAHSMOKER), PROCEED TO WP1 ─ IF (B01=1 OR 2) AND (B06F=0 OR B10F=0), PROCEED TO WP2 ─ ELSE, GO TO NEXT SECTION
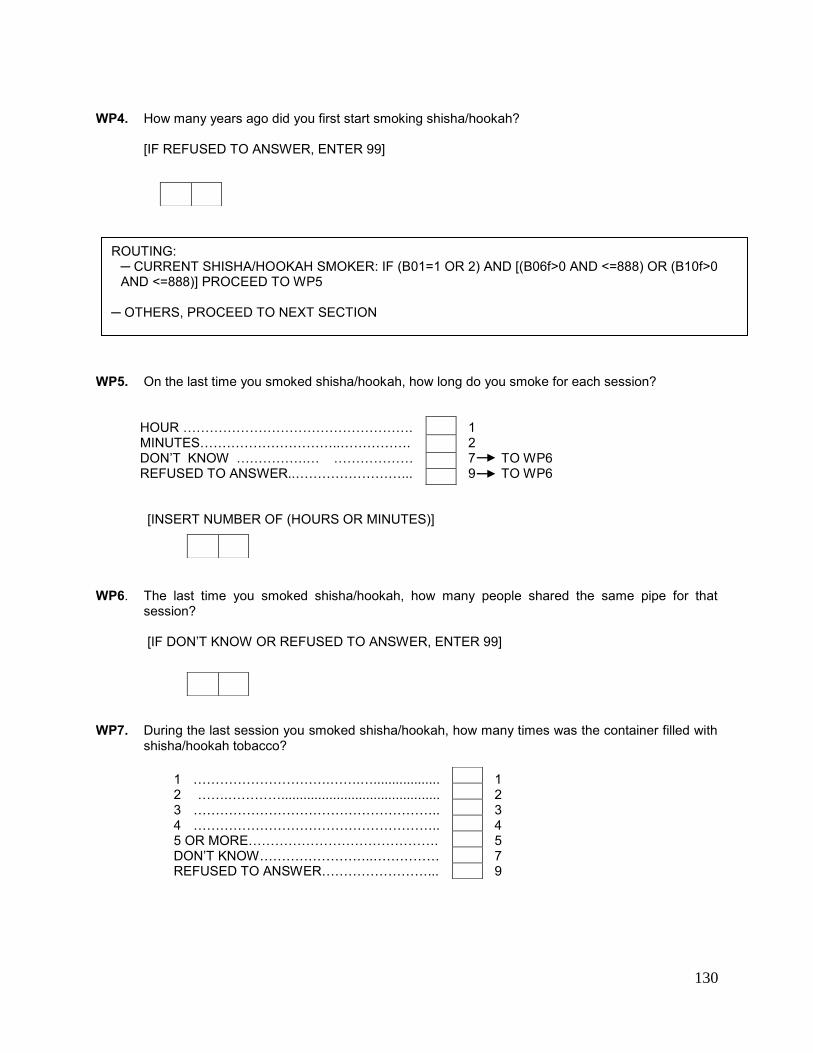
130
WP4. How many years ago did you first start smoking shisha/hookah?
[IF REFUSED TO ANSWER, ENTER 99]
WP5. On the last time you smoked shisha/hookah, how long do you smoke for each session?
HOUR ……………………………………………. 1 MINUTES…………………………..……………. 2 DON’T KNOW …………….… ……………… 7 TO WP6 REFUSED TO ANSWER..……………………... 9 TO WP6
[INSERT NUMBER OF (HOURS OR MINUTES)]
WP6. The last time you smoked shisha/hookah, how many people shared the same pipe for that
session? [IF DON’T KNOW OR REFUSED TO ANSWER, ENTER 99]
WP7. During the last session you smoked shisha/hookah, how many times was the container filled with
shisha/hookah tobacco? 1 ………………………….…….….................. 1 2 …….…………........................................... 2 3 ……………………………………………….. 3 4 ……………………………………………….. 4 5 OR MORE……………………………………. 5 DON’T KNOW……………………..…………… 7 REFUSED TO ANSWER……………………... 9
ROUTING: ─ CURRENT SHISHA/HOOKAH SMOKER: IF (B01=1 OR 2) AND [(B06f>0 AND <=888) OR (B10f>0 AND <=888)] PROCEED TO WP5
─ OTHERS, PROCEED TO NEXT SECTION
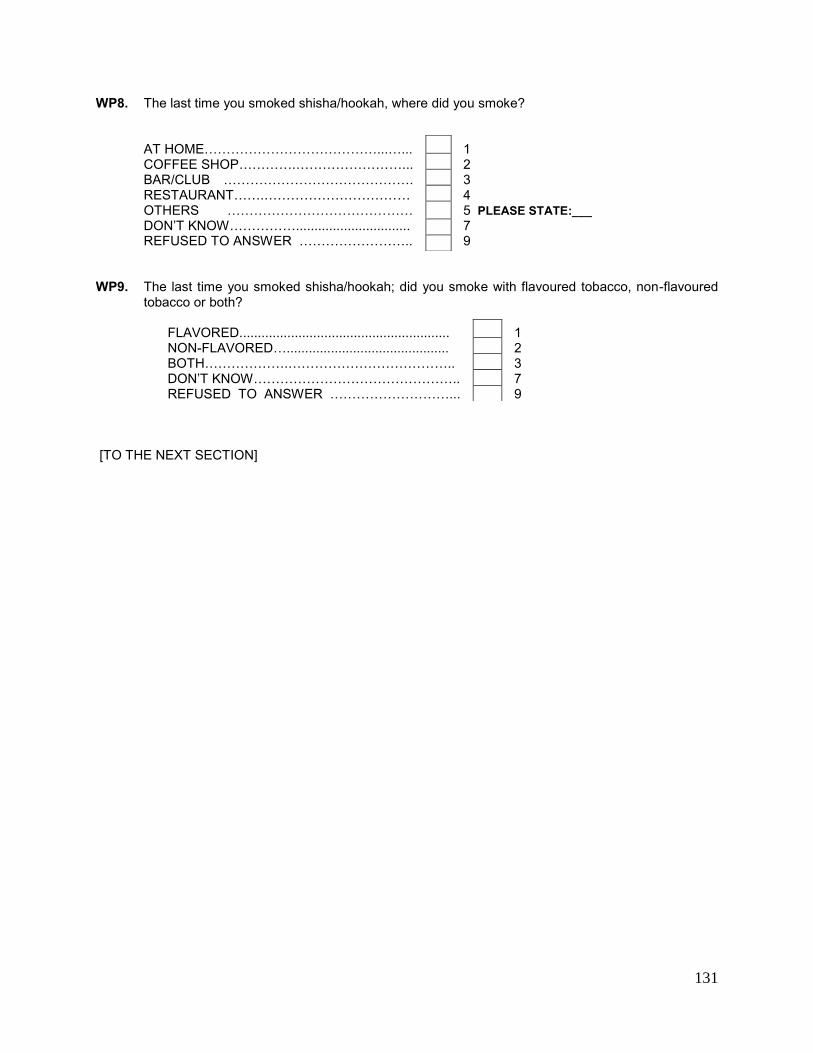
131
WP8. The last time you smoked shisha/hookah, where did you smoke?
AT HOME…………………………………...…... 1 COFFEE SHOP………….……………………... 2 BAR/CLUB ……………………………………. 3 RESTAURANT…….…………………………… 4 OTHERS …………………………………… 5 PLEASE STATE:___ DON’T KNOW……………............................... 7
REFUSED TO ANSWER …………………….. 9 WP9. The last time you smoked shisha/hookah; did you smoke with flavoured tobacco, non-flavoured
tobacco or both? FLAVORED......................................................... 1 NON-FLAVORED…............................................ 2 BOTH……………….……………………………….. 3 DON’T KNOW……………………………………….. 7 REFUSED TO ANSWER ………………………... 9 [TO THE NEXT SECTION]
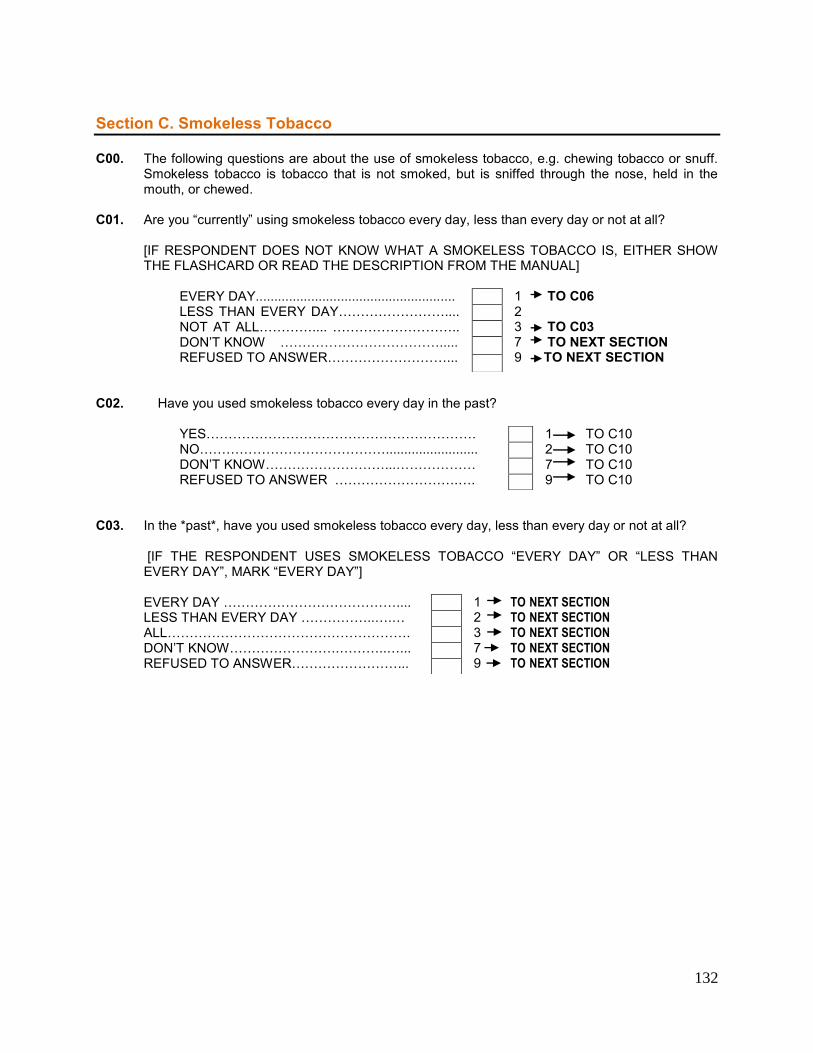
132
Section C. Smokeless Tobacco C00. The following questions are about the use of smokeless tobacco, e.g. chewing tobacco or snuff.
Smokeless tobacco is tobacco that is not smoked, but is sniffed through the nose, held in the mouth, or chewed.
C01. Are you “currently” using smokeless tobacco every day, less than every day or not at all?
[IF RESPONDENT DOES NOT KNOW WHAT A SMOKELESS TOBACCO IS, EITHER SHOW THE FLASHCARD OR READ THE DESCRIPTION FROM THE MANUAL]
EVERY DAY...................................................... 1 TO C06
LESS THAN EVERY DAY…………………….... 2 NOT AT ALL………….... ……………………….. 3 TO C03
DON’T KNOW ………………………………..... 7 TO NEXT SECTION REFUSED TO ANSWER………………………... 9 TO NEXT SECTION
C02. Have you used smokeless tobacco every day in the past? YES……………………………………………………. 1 TO C10 NO……………………………………......................... 2 TO C10 DON’T KNOW………………………...……………… 7 TO C10 REFUSED TO ANSWER ……………………….…. 9 TO C10 C03. In the *past*, have you used smokeless tobacco every day, less than every day or not at all?
[IF THE RESPONDENT USES SMOKELESS TOBACCO “EVERY DAY” OR “LESS THAN EVERY DAY”, MARK “EVERY DAY”]
EVERY DAY ………………………………….... 1 TO NEXT SECTION
LESS THAN EVERY DAY ……………..….… 2 TO NEXT SECTION ALL………………………………………………. 3 TO NEXT SECTION
DON’T KNOW…………………….………..…... 7 TO NEXT SECTION REFUSED TO ANSWER……………………... 9 TO NEXT SECTION
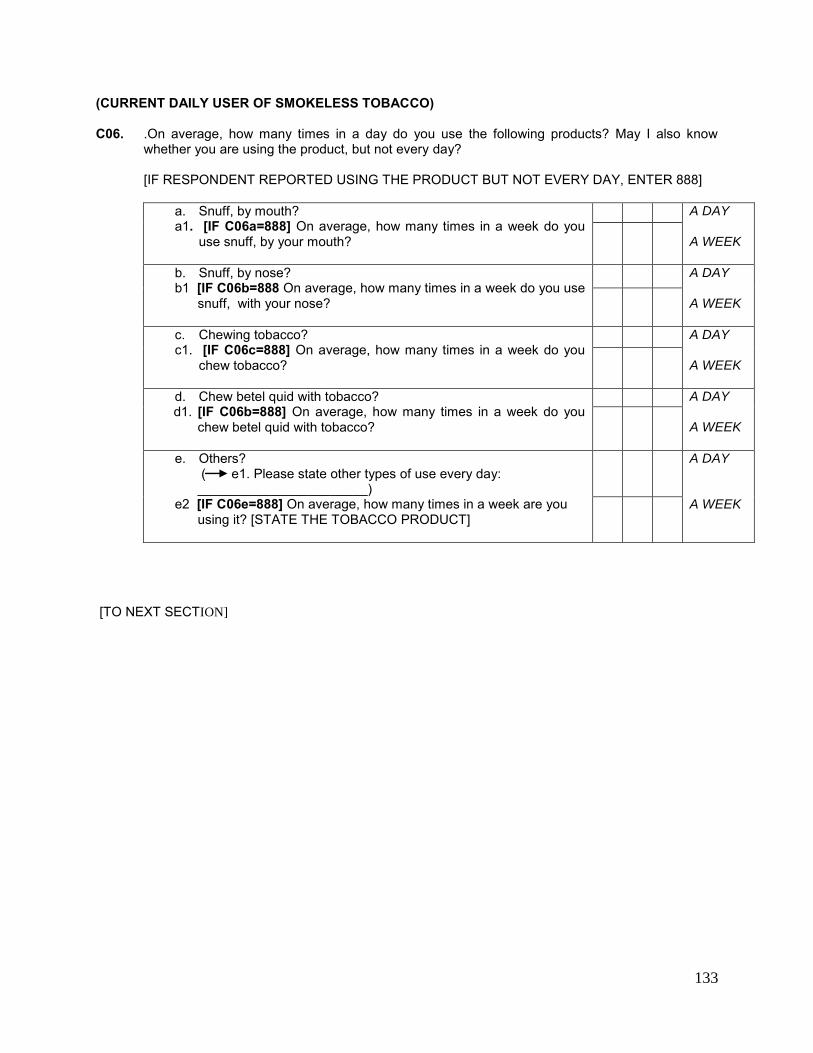
133
(CURRENT DAILY USER OF SMOKELESS TOBACCO) C06. .On average, how many times in a day do you use the following products? May I also know
whether you are using the product, but not every day?
[IF RESPONDENT REPORTED USING THE PRODUCT BUT NOT EVERY DAY, ENTER 888]
a. Snuff, by mouth? a1. [IF C06a=888] On average, how many times in a week do you
use snuff, by your mouth?
A DAY A WEEK
b. Snuff, by nose? b1 [IF C06b=888 On average, how many times in a week do you use
snuff, with your nose?
A DAY A WEEK
c. Chewing tobacco? c1. [IF C06c=888] On average, how many times in a week do you
chew tobacco?
A DAY A WEEK
d. Chew betel quid with tobacco? d1. [IF C06b=888] On average, how many times in a week do you
chew betel quid with tobacco?
A DAY A WEEK
e. Others? ( e1. Please state other types of use every day: _______________________)
e2 [IF C06e=888] On average, how many times in a week are you using it? [STATE THE TOBACCO PRODUCT]
A DAY A WEEK
[TO NEXT SECTION]
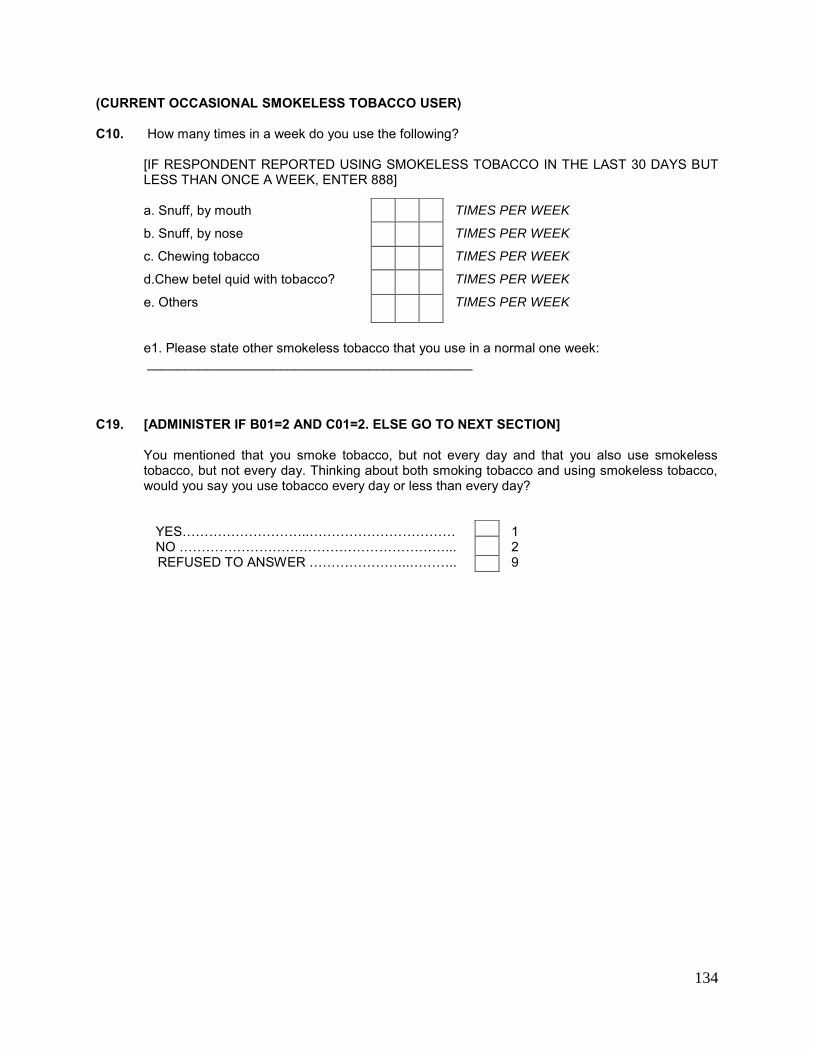
134
(CURRENT OCCASIONAL SMOKELESS TOBACCO USER) C10. How many times in a week do you use the following?
[IF RESPONDENT REPORTED USING SMOKELESS TOBACCO IN THE LAST 30 DAYS BUT LESS THAN ONCE A WEEK, ENTER 888]
a. Snuff, by mouth TIMES PER WEEK
b. Snuff, by nose TIMES PER WEEK
c. Chewing tobacco TIMES PER WEEK
d.Chew betel quid with tobacco? TIMES PER WEEK
e. Others TIMES PER WEEK
e1. Please state other smokeless tobacco that you use in a normal one week: ____________________________________________
C19. [ADMINISTER IF B01=2 AND C01=2. ELSE GO TO NEXT SECTION]
You mentioned that you smoke tobacco, but not every day and that you also use smokeless tobacco, but not every day. Thinking about both smoking tobacco and using smokeless tobacco, would you say you use tobacco every day or less than every day?
YES………………………..…………………………… 1 NO ……………………………………………………... 2 REFUSED TO ANSWER …………………..……….. 9
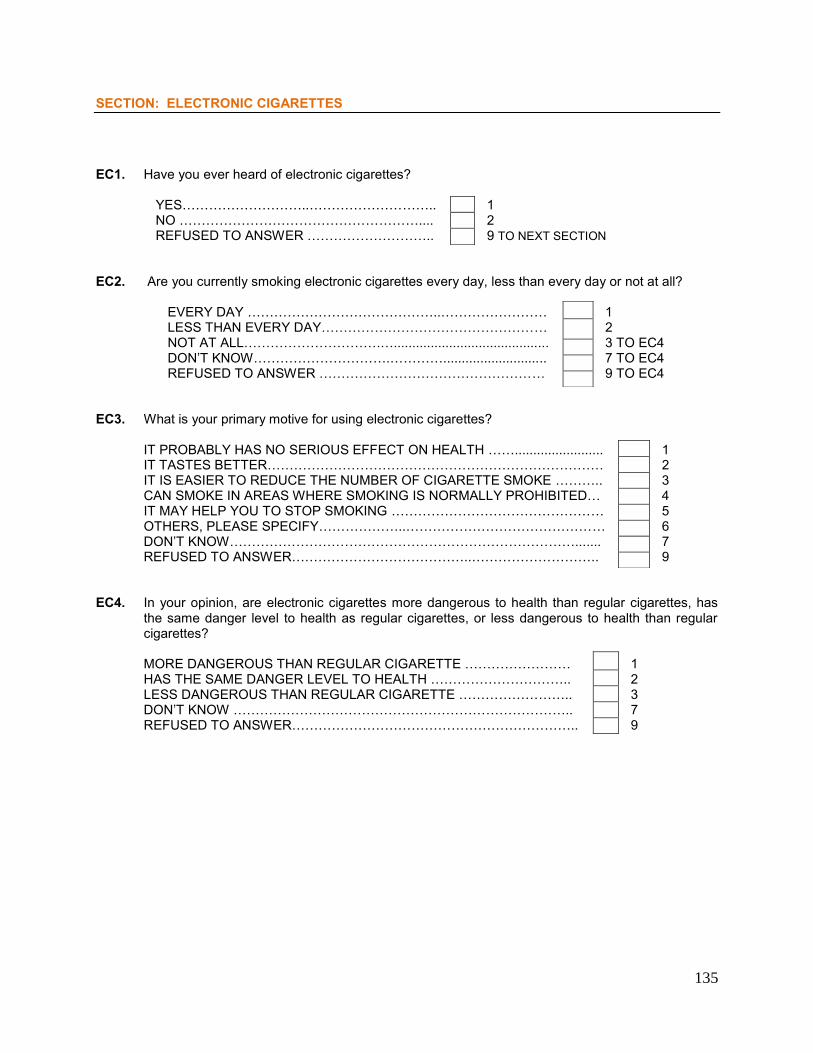
135
SECTION: ELECTRONIC CIGARETTES
EC1. Have you ever heard of electronic cigarettes? YES………………………..……………………….. 1 NO ……………………………………………….... 2 REFUSED TO ANSWER ……………………….. 9 TO NEXT SECTION EC2. Are you currently smoking electronic cigarettes every day, less than every day or not at all?
EVERY DAY ……………………………………..…………………… 1 LESS THAN EVERY DAY…………………………………………… 2 NOT AT ALL………………………….….......................................... 3 TO EC4 DON’T KNOW………………………….…………............................ 7 TO EC4 REFUSED TO ANSWER …………………………………………… 9 TO EC4 EC3. What is your primary motive for using electronic cigarettes?
IT PROBABLY HAS NO SERIOUS EFFECT ON HEALTH ……........................ 1 IT TASTES BETTER…………………………………………………………………. 2 IT IS EASIER TO REDUCE THE NUMBER OF CIGARETTE SMOKE ……….. 3 CAN SMOKE IN AREAS WHERE SMOKING IS NORMALLY PROHIBITED… 4 IT MAY HELP YOU TO STOP SMOKING ………………………………………… 5 OTHERS, PLEASE SPECIFY………………..……………………………………… 6 DON’T KNOW……………………………………………………………………....... 7 REFUSED TO ANSWER…………………………………..……………………….. 9
EC4. In your opinion, are electronic cigarettes more dangerous to health than regular cigarettes, has
the same danger level to health as regular cigarettes, or less dangerous to health than regular cigarettes?
MORE DANGEROUS THAN REGULAR CIGARETTE …………………… 1 HAS THE SAME DANGER LEVEL TO HEALTH ………………………….. 2 LESS DANGEROUS THAN REGULAR CIGARETTE …………………….. 3
DON’T KNOW ………………………………………………………………….. 7 REFUSED TO ANSWER……………………………………………………….. 9
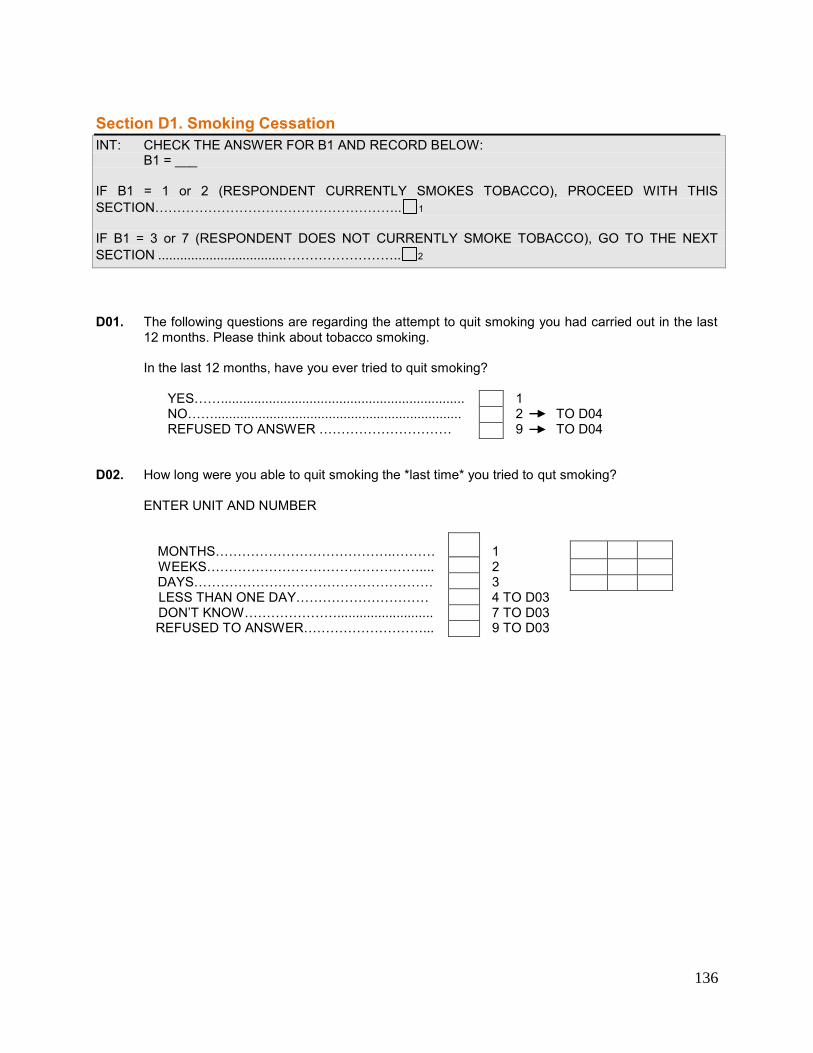
136
Section D1. Smoking Cessation INT: CHECK THE ANSWER FOR B1 AND RECORD BELOW: B1 = ___ IF B1 = 1 or 2 (RESPONDENT CURRENTLY SMOKES TOBACCO), PROCEED WITH THIS SECTION……………………………………………….. 1 IF B1 = 3 or 7 (RESPONDENT DOES NOT CURRENTLY SMOKE TOBACCO), GO TO THE NEXT SECTION ................................... …………………….. 2 D01. The following questions are regarding the attempt to quit smoking you had carried out in the last
12 months. Please think about tobacco smoking. In the last 12 months, have you ever tried to quit smoking? YES…….................................................................. 1
NO……................................................................... 2 TO D04 REFUSED TO ANSWER ………………………… 9 TO D04 D02. How long were you able to quit smoking the *last time* you tried to qut smoking?
ENTER UNIT AND NUMBER MONTHS…………………………………..……… 1 WEEKS………………………………………….... 2 DAYS……………………………………………… 3 LESS THAN ONE DAY………………………… 4 TO D03
DON’T KNOW………………….......................... 7 TO D03 REFUSED TO ANSWER………………………... 9 TO D03
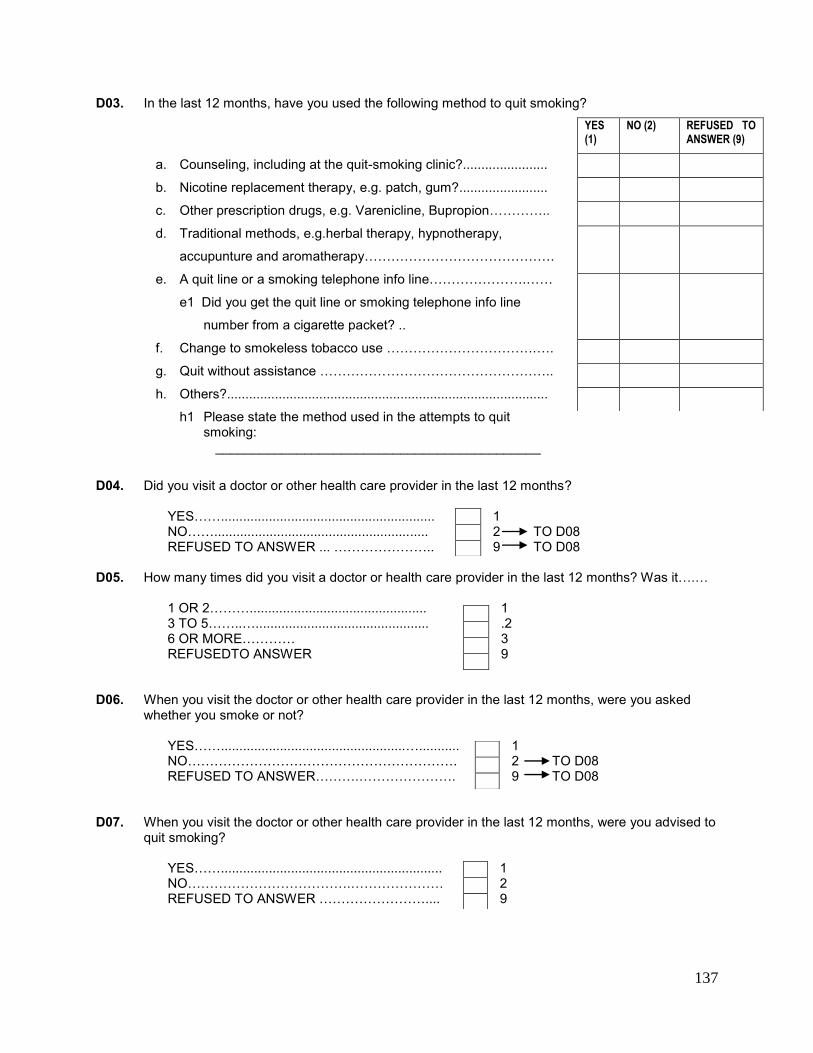
137
D03. In the last 12 months, have you used the following method to quit smoking?
a. Counseling, including at the quit-smoking clinic?.......................
b. Nicotine replacement therapy, e.g. patch, gum?........................
c. Other prescription drugs, e.g. Varenicline, Bupropion…………..
d. Traditional methods, e.g.herbal therapy, hypnotherapy,
accupunture and aromatherapy…………………………………….
e. A quit line or a smoking telephone info line………………….……
e1 Did you get the quit line or smoking telephone info line
number from a cigarette packet? ..
f. Change to smokeless tobacco use …………………………….….
g. Quit without assistance ……………………………………………..
h. Others?.......................................................................................
h1 Please state the method used in the attempts to quit smoking:
____________________________________________
D04. Did you visit a doctor or other health care provider in the last 12 months? YES…….......................................................... 1 NO…….......................................................... 2 TO D08 REFUSED TO ANSWER ... ………………….. 9 TO D08 D05. How many times did you visit a doctor or health care provider in the last 12 months? Was it….… 1 OR 2………................................................ 1 3 TO 5……..…............................................... .2 6 OR MORE………… 3 REFUSEDTO ANSWER 9 D06. When you visit the doctor or other health care provider in the last 12 months, were you asked
whether you smoke or not?
YES……..................................................…........... 1 NO……………………………………………………. 2 TO D08 REFUSED TO ANSWER……….…………………. 9 TO D08 D07. When you visit the doctor or other health care provider in the last 12 months, were you advised to
quit smoking?
YES……............................................................ 1 NO……………………………….………………… 2 REFUSED TO ANSWER …………………….... 9
YES (1)
NO (2) REFUSED TO ANSWER (9)
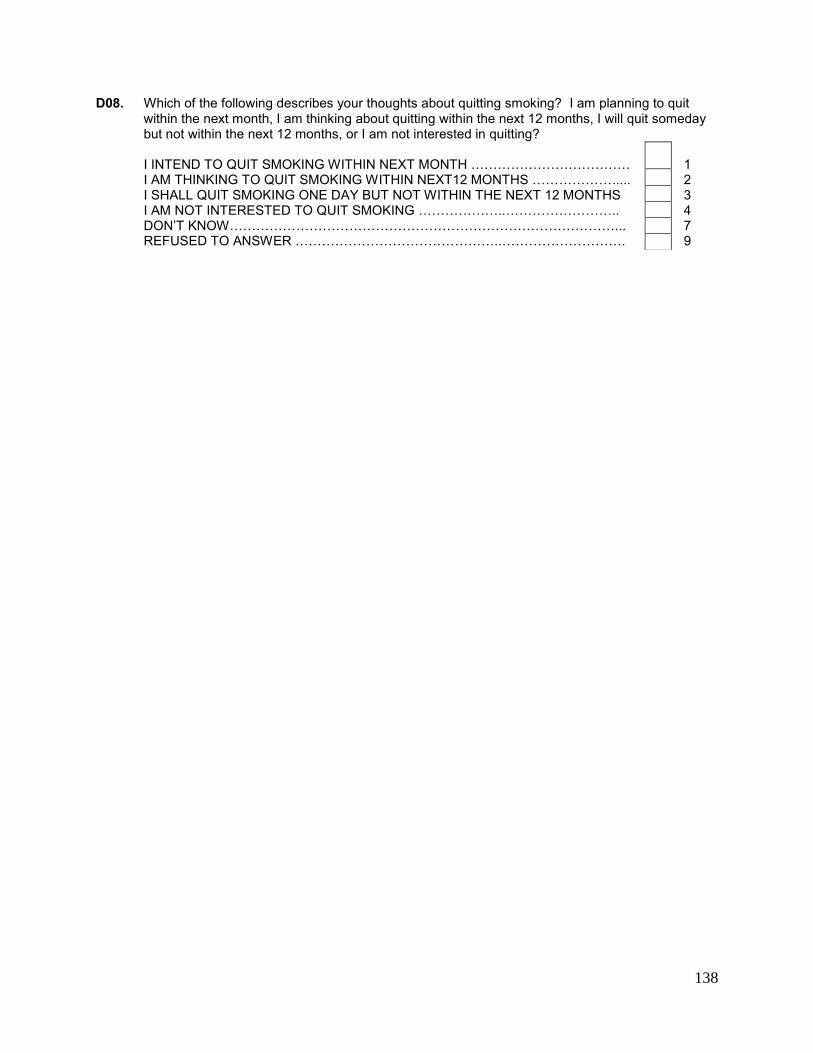
138
D08. Which of the following describes your thoughts about quitting smoking? I am planning to quit within the next month, I am thinking about quitting within the next 12 months, I will quit someday but not within the next 12 months, or I am not interested in quitting?
I INTEND TO QUIT SMOKING WITHIN NEXT MONTH ……………………………… 1 I AM THINKING TO QUIT SMOKING WITHIN NEXT12 MONTHS ………………..... 2 I SHALL QUIT SMOKING ONE DAY BUT NOT WITHIN THE NEXT 12 MONTHS 3 I AM NOT INTERESTED TO QUIT SMOKING ………………..…………………….. 4
DON’T KNOW……………………………………………………………………………... 7 REFUSED TO ANSWER ………………………………………..………………………. 9
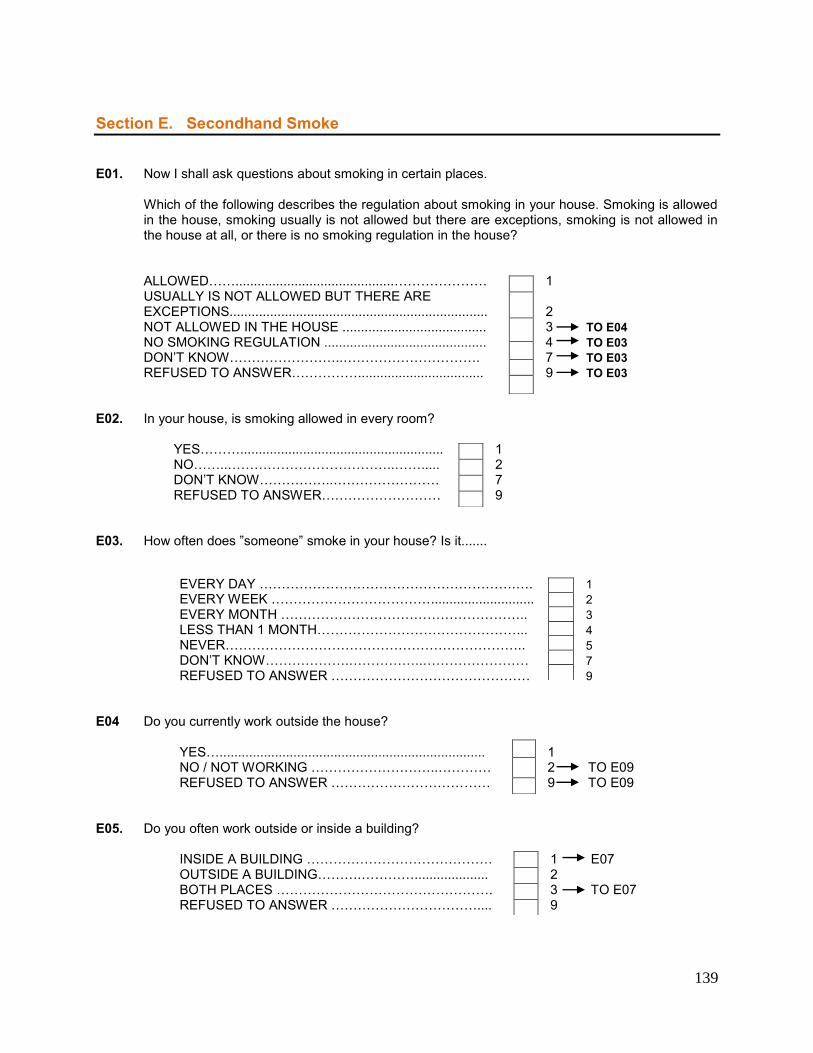
139
Section E. Secondhand Smoke E01. Now I shall ask questions about smoking in certain places.
Which of the following describes the regulation about smoking in your house. Smoking is allowed in the house, smoking usually is not allowed but there are exceptions, smoking is not allowed in the house at all, or there is no smoking regulation in the house?
ALLOWED……...........................................………………… 1 USUALLY IS NOT ALLOWED BUT THERE ARE
EXCEPTIONS...................................................................... 2 NOT ALLOWED IN THE HOUSE ....................................... 3 TO E04 NO SMOKING REGULATION ............................................ 4 TO E03 DON’T KNOW……………………..…………………………. 7 TO E03 REFUSED TO ANSWER…………….................................. 9 TO E03 E02. In your house, is smoking allowed in every room? YES………....................................................... 1 NO……..………………………………..……..... 2 DON’T KNOW……………..…………………… 7 REFUSED TO ANSWER……………………… 9 E03. How often does ”someone” smoke in your house? Is it.......
EVERY DAY ………………………………………………….…. 1 EVERY WEEK ………………………………............................ 2 EVERY MONTH ……………………………………………….. 3 LESS THAN 1 MONTH………………………………………... 4 NEVER………………………………………………………….. 5 DON’T KNOW……………….……………..…………………… 7 REFUSED TO ANSWER ……………………………………… 9 E04 Do you currently work outside the house?
YES…........................................................................ 1 NO / NOT WORKING ………………………..………… 2 TO E09 REFUSED TO ANSWER ……………………………… 9 TO E09
E05. Do you often work outside or inside a building? INSIDE A BUILDING …………………………………… 1 E07 OUTSIDE A BUILDING……….………….................... 2 BOTH PLACES …………………………………………. 3 TO E07 REFUSED TO ANSWER …………………………….... 9
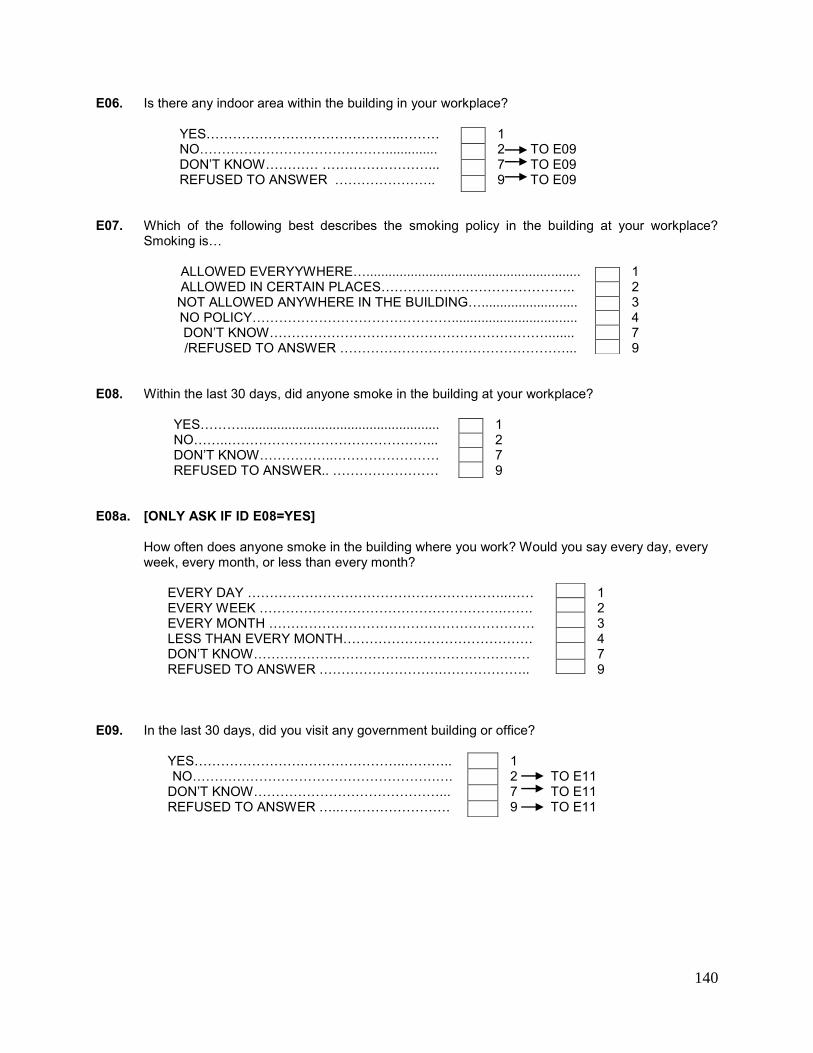
140
E06. Is there any indoor area within the building in your workplace? YES……………………………………..……… 1 NO…………………………………….............. 2 TO E09 DON’T KNOW………… ……………………... 7 TO E09 REFUSED TO ANSWER ………………….. 9 TO E09 E07. Which of the following best describes the smoking policy in the building at your workplace?
Smoking is… ALLOWED EVERYYWHERE….......................................................... 1 ALLOWED IN CERTAIN PLACES…………………………………….. 2 NOT ALLOWED ANYWHERE IN THE BUILDING….......................... 3 NO POLICY……………………………………….................................. 4 DON’T KNOW………………………………………………………....... 7 /REFUSED TO ANSWER ……………………………………………... 9 E08. Within the last 30 days, did anyone smoke in the building at your workplace? YES………...................................................... 1 NO……..………………………………………... 2 DON’T KNOW……………..…………………… 7
REFUSED TO ANSWER.. …………………… 9 E08a. [ONLY ASK IF ID E08=YES]
How often does anyone smoke in the building where you work? Would you say every day, every week, every month, or less than every month?
EVERY DAY …………………………………………………..…… 1 EVERY WEEK ……………………………………………….……. 2 EVERY MONTH …………………………………………………… 3
LESS THAN EVERY MONTH……………………………………. 4 DON’T KNOW……………….……………..……………………… 7 REFUSED TO ANSWER ……………………….……………….. 9
E09. In the last 30 days, did you visit any government building or office? YES…………………….…………………..……….. 1 NO……………………………………………….…. 2 TO E11 DON’T KNOW……………………………………... 7 TO E11 REFUSED TO ANSWER …..……………………. 9 TO E11
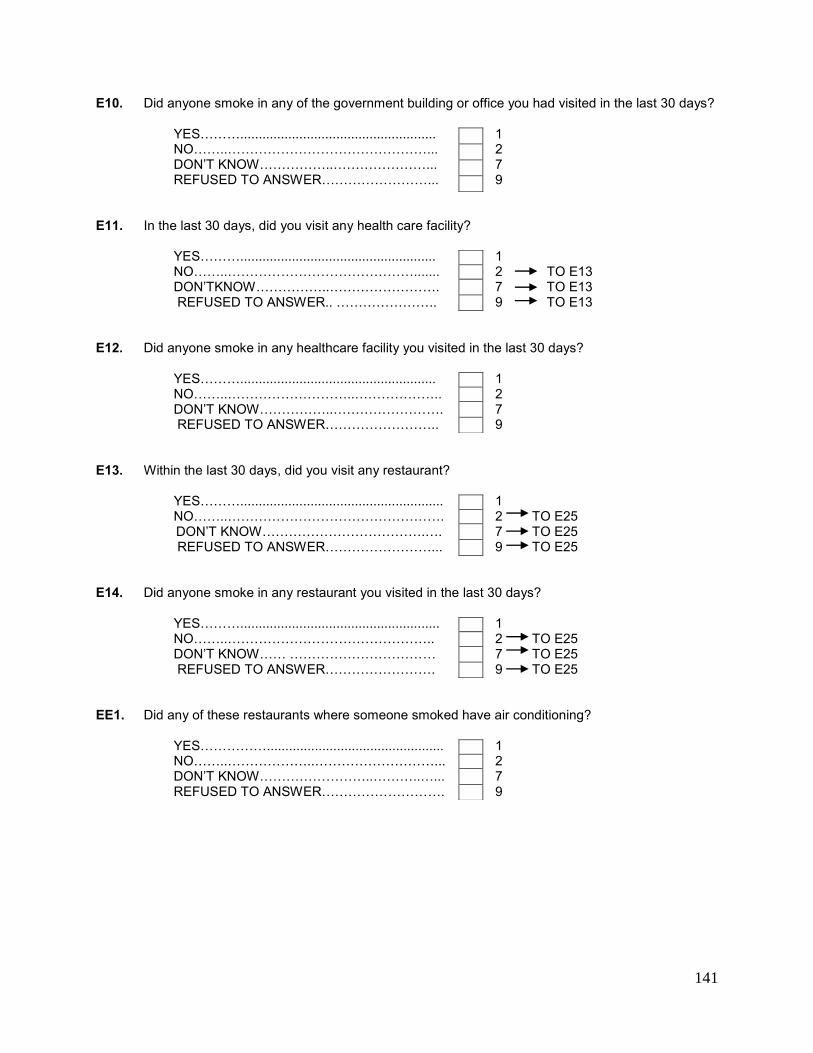
141
E10. Did anyone smoke in any of the government building or office you had visited in the last 30 days? YES………..................................................... 1 NO……..………………………………………... 2 DON’T KNOW……………..…………………... 7 REFUSED TO ANSWER……………………... 9 E11. In the last 30 days, did you visit any health care facility? YES………..................................................... 1
NO……..……………………………………....... 2 TO E13 DON’TKNOW……………..……………………. 7 TO E13
REFUSED TO ANSWER.. ………………….. 9 TO E13 E12. Did anyone smoke in any healthcare facility you visited in the last 30 days? YES………..................................................... 1 NO……..………………………..……………….. 2 DON’T KNOW……………..……………………. 7 REFUSED TO ANSWER…………………….. 9 E13. Within the last 30 days, did you visit any restaurant? YES………....................................................... 1 NO……..…………………………………………. 2 TO E25 DON’T KNOW……………………………….…. 7 TO E25 REFUSED TO ANSWER……………………... 9 TO E25 E14. Did anyone smoke in any restaurant you visited in the last 30 days? YES………...................................................... 1 NO……..……………………………………….. 2 TO E25 DON’T KNOW…… …………………………… 7 TO E25 REFUSED TO ANSWER……………………. 9 TO E25 EE1. Did any of these restaurants where someone smoked have air conditioning? YES……………................................................ 1 NO……..………………..………………………... 2
DON’T KNOW……………………..………..…... 7 REFUSED TO ANSWER………………………. 9
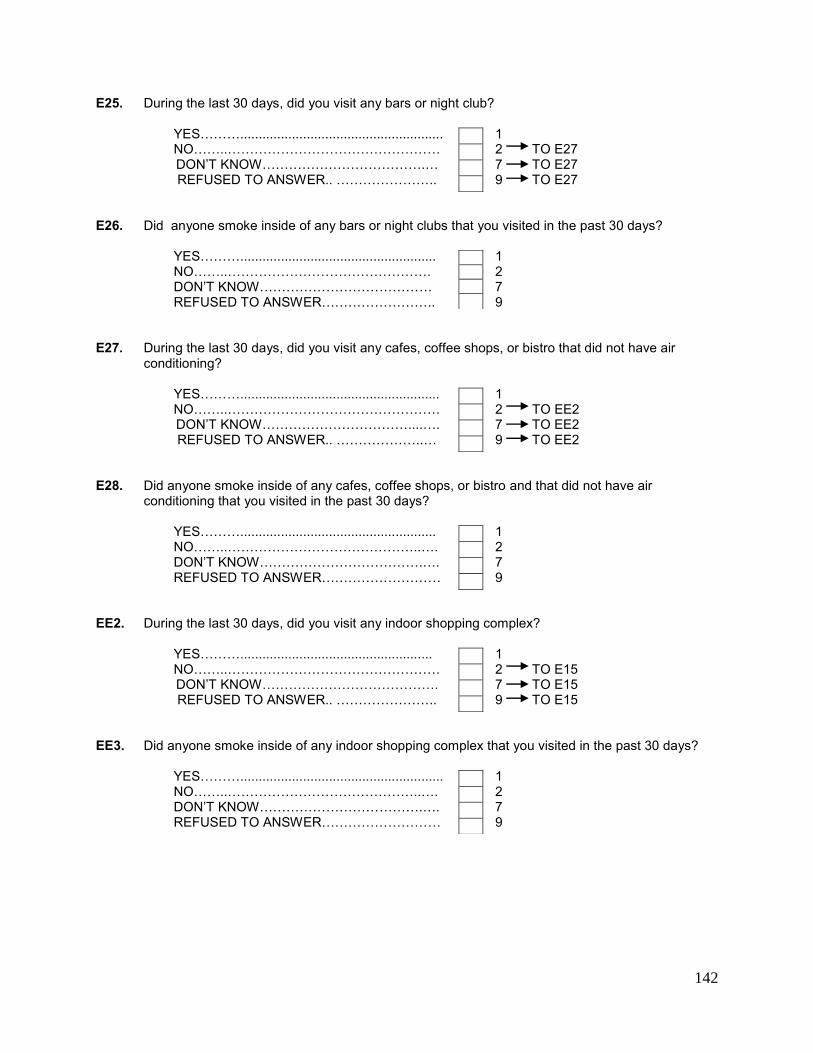
142
E25. During the last 30 days, did you visit any bars or night club? YES………....................................................... 1 NO……..………………………………………… 2 TO E27 DON’T KNOW……………………………….… 7 TO E27 REFUSED TO ANSWER.. ………………….. 9 TO E27 E26. Did anyone smoke inside of any bars or night clubs that you visited in the past 30 days? YES………..................................................... 1 NO……..………………………………………. 2 DON’T KNOW………………………………… 7 REFUSED TO ANSWER…………………….. 9 E27. During the last 30 days, did you visit any cafes, coffee shops, or bistro that did not have air
conditioning? YES………...................................................... 1 NO……..………………………………………… 2 TO EE2 DON’T KNOW……………………………....…. 7 TO EE2 REFUSED TO ANSWER.. ………………..… 9 TO EE2 E28. Did anyone smoke inside of any cafes, coffee shops, or bistro and that did not have air
conditioning that you visited in the past 30 days? YES………..................................................... 1 NO……..……………………………………..…. 2 DON’T KNOW……………………………….…. 7 REFUSED TO ANSWER……………………… 9 EE2. During the last 30 days, did you visit any indoor shopping complex? YES……….................................................... 1 NO……..………………………………………… 2 TO E15 DON’T KNOW…………………………………. 7 TO E15 REFUSED TO ANSWER.. ………………….. 9 TO E15 EE3. Did anyone smoke inside of any indoor shopping complex that you visited in the past 30 days? YES………....................................................... 1 NO……..……………………………………..…. 2 DON’T KNOW……………………………….…. 7 REFUSED TO ANSWER……………………… 9
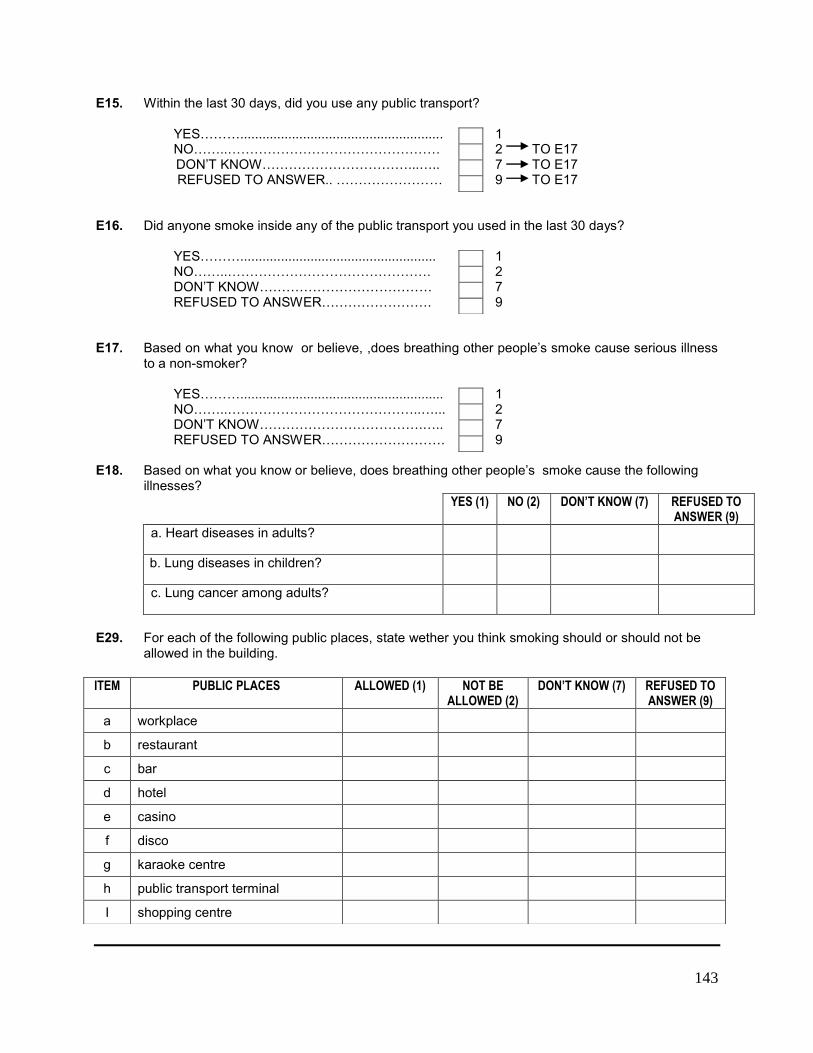
143
E15. Within the last 30 days, did you use any public transport? YES………....................................................... 1 NO……..………………………………………… 2 TO E17 DON’T KNOW……………………………...….. 7 TO E17 REFUSED TO ANSWER.. …………………… 9 TO E17 E16. Did anyone smoke inside any of the public transport you used in the last 30 days? YES………..................................................... 1 NO……..………………………………………. 2 DON’T KNOW………………………………… 7 REFUSED TO ANSWER……………………. 9 E17. Based on what you know or believe, ,does breathing other people’s smoke cause serious illness
to a non-smoker?
YES………....................................................... 1 NO……..……………………………………..…... 2 DON’T KNOW……………………………….….. 7 REFUSED TO ANSWER………………………. 9 E18. Based on what you know or believe, does breathing other people’s smoke cause the following
illnesses? YES (1) NO (2) DON’T KNOW (7) REFUSED TO
ANSWER (9)
a. Heart diseases in adults?
b. Lung diseases in children?
c. Lung cancer among adults?
E29. For each of the following public places, state wether you think smoking should or should not be
allowed in the building.
ITEM PUBLIC PLACES ALLOWED (1) NOT BE ALLOWED (2)
DON’T KNOW (7) REFUSED TO ANSWER (9)
a workplace
b restaurant
c bar
d hotel
e casino
f disco
g karaoke centre
h public transport terminal
I shopping centre
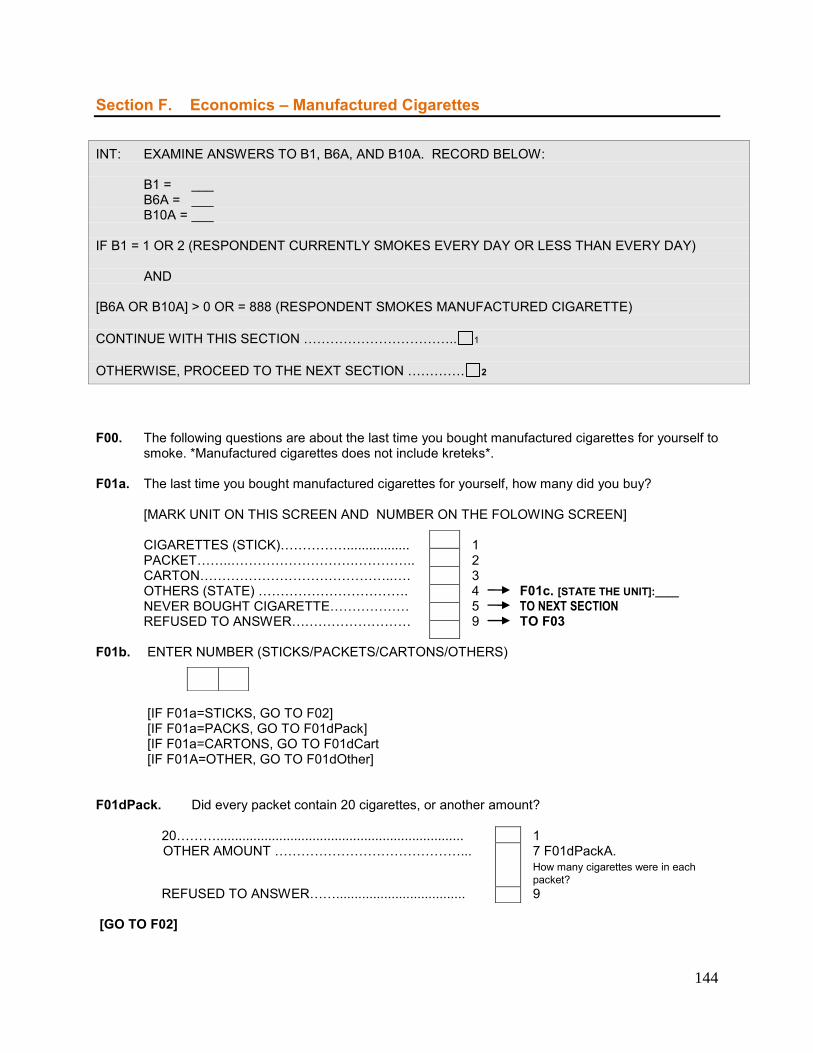
144
Section F. Economics – Manufactured Cigarettes INT: EXAMINE ANSWERS TO B1, B6A, AND B10A. RECORD BELOW: B1 = ___ B6A = ___ B10A = ___ IF B1 = 1 OR 2 (RESPONDENT CURRENTLY SMOKES EVERY DAY OR LESS THAN EVERY DAY) AND [B6A OR B10A] > 0 OR = 888 (RESPONDENT SMOKES MANUFACTURED CIGARETTE) CONTINUE WITH THIS SECTION …………………………….. 1 OTHERWISE, PROCEED TO THE NEXT SECTION …………. 2 F00. The following questions are about the last time you bought manufactured cigarettes for yourself to
smoke. *Manufactured cigarettes does not include kreteks*.
F01a. The last time you bought manufactured cigarettes for yourself, how many did you buy? [MARK UNIT ON THIS SCREEN AND NUMBER ON THE FOLOWING SCREEN] CIGARETTES (STICK)……………................. 1 PACKET……..……………………….………….. 2
CARTON……………………………………..…. 3 OTHERS (STATE) ……………………………. 4 F01c. [STATE THE UNIT]:____ NEVER BOUGHT CIGARETTE……………… 5 TO NEXT SECTION
REFUSED TO ANSWER……………………… 9 TO F03
F01b. ENTER NUMBER (STICKS/PACKETS/CARTONS/OTHERS)
[IF F01a=STICKS, GO TO F02] [IF F01a=PACKS, GO TO F01dPack] [IF F01a=CARTONS, GO TO F01dCart [IF F01A=OTHER, GO TO F01dOther]
F01dPack. Did every packet contain 20 cigarettes, or another amount? 20………................................................................... 1
OTHER AMOUNT ……………………………………... 7 F01dPackA. How many cigarettes were in each
packet? REFUSED TO ANSWER……................................... 9
[GO TO F02]
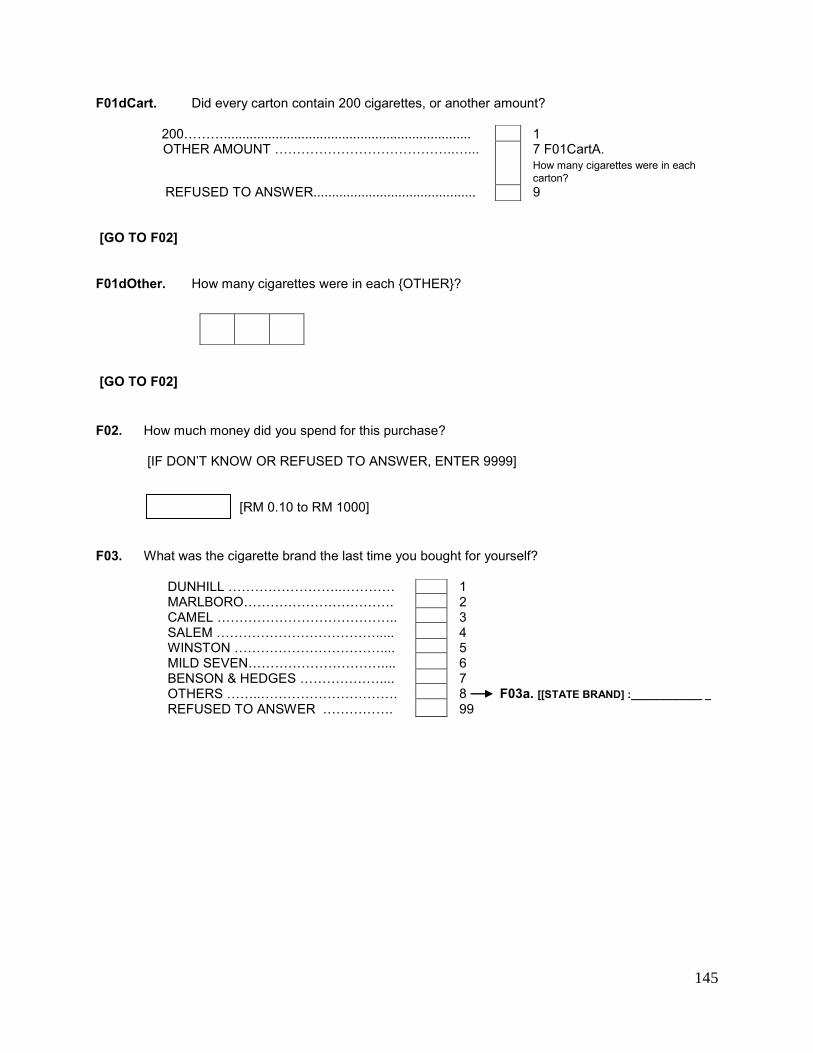
145
F01dCart. Did every carton contain 200 cigarettes, or another amount? 200………................................................................... 1
OTHER AMOUNT …………………………………..…... 7 F01CartA. How many cigarettes were in each
carton? REFUSED TO ANSWER............................................ 9
[GO TO F02] F01dOther. How many cigarettes were in each {OTHER}? [GO TO F02] F02. How much money did you spend for this purchase?
[IF DON’T KNOW OR REFUSED TO ANSWER, ENTER 9999]
[RM 0.10 to RM 1000] F03. What was the cigarette brand the last time you bought for yourself? DUNHILL ……………………..………… 1 MARLBORO……………………………. 2 CAMEL ………………………………….. 3 SALEM ………………………………..... 4 WINSTON …………………………….... 5 MILD SEVEN………………………….... 6 BENSON & HEDGES ……………….... 7 OTHERS ……..…………………………. 8 F03a. [[STATE BRAND] :____________ _ REFUSED TO ANSWER ……………. 99
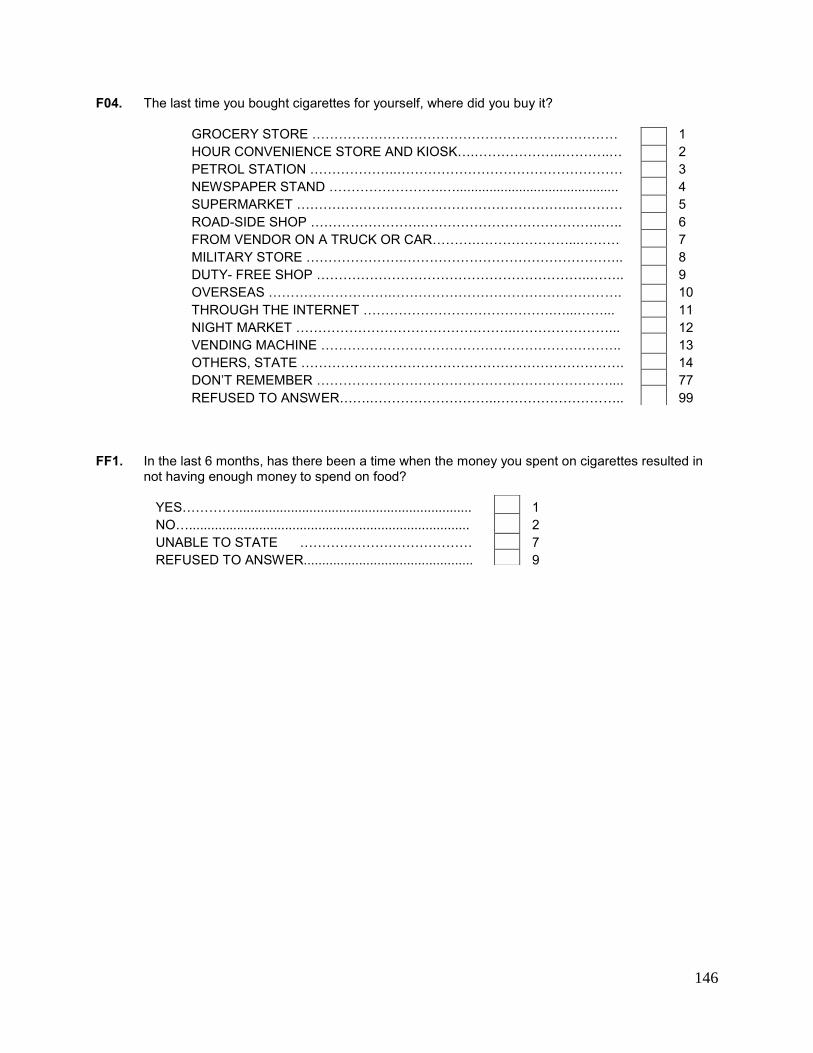
146
F04. The last time you bought cigarettes for yourself, where did you buy it?
GROCERY STORE …………………………………………………………… 1 HOUR CONVENIENCE STORE AND KIOSK….………………..………..… 2
PETROL STATION ………………..…………………………………………… 3 NEWSPAPER STAND ……………………..…............................................ 4 SUPERMARKET ……………………………………………………..………… 5 ROAD-SIDE SHOP …………………….…………………………………..….. 6
FROM VENDOR ON A TRUCK OR CAR……….…………………...……… 7 MILITARY STORE ………………….………………………………………….. 8 DUTY- FREE SHOP ……………………………………………………..…….. 9 OVERSEAS ……………………….……………………………………………. 10 THROUGH THE INTERNET …………………………………….…...……... 11 NIGHT MARKET …………………………………………..…………………... 12 VENDING MACHINE ………………………………………………………….. 13 OTHERS, STATE ………………………………………………………………. 14 DON’T REMEMBER ………………………………………………………….... 77 REFUSED TO ANSWER…….………………………..……………………….. 99 FF1. In the last 6 months, has there been a time when the money you spent on cigarettes resulted in
not having enough money to spend on food?
YES…………................................................................ 1
NO…............................................................................ 2 UNABLE TO STATE ………………………………… 7
REFUSED TO ANSWER.............................................. 9
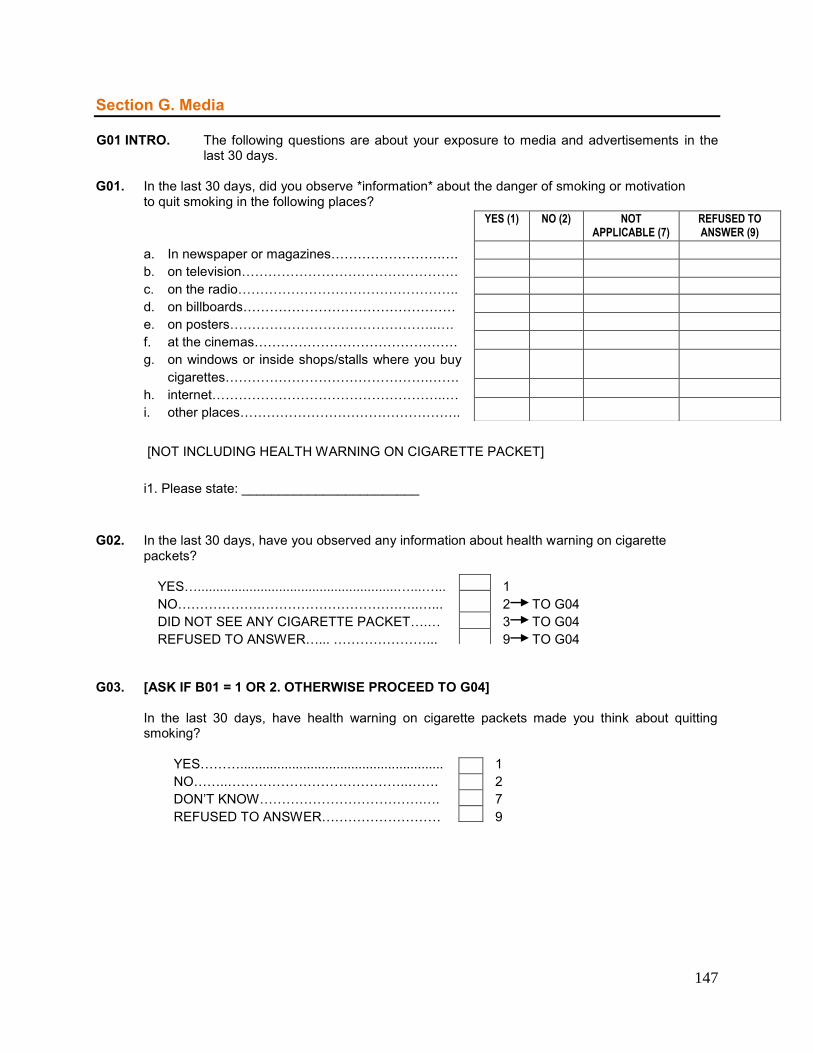
147
Section G. Media G01 INTRO. The following questions are about your exposure to media and advertisements in the
last 30 days. G01. In the last 30 days, did you observe *information* about the danger of smoking or motivation
to quit smoking in the following places?
a. In newspaper or magazines…………………….…. b. on television…………………………………………. c. on the radio………………………………………….. d. on billboards………………………………………… e. on posters………………………………………..…. f. at the cinemas………………………………………. g. on windows or inside shops/stalls where you buy
cigarettes……………………………………….……. h. internet……………………………………………..… i. other places…………………………………………..
[NOT INCLUDING HEALTH WARNING ON CIGARETTE PACKET]
i1. Please state: ________________________
G02. In the last 30 days, have you observed any information about health warning on cigarette
packets? YES…......................................................…...…... 1 NO……………….………………………….…..…... 2 TO G04 DID NOT SEE ANY CIGARETTE PACKET….… 3 TO G04 REFUSED TO ANSWER…... …………………... 9 TO G04 G03. [ASK IF B01 = 1 OR 2. OTHERWISE PROCEED TO G04]
In the last 30 days, have health warning on cigarette packets made you think about quitting smoking?
YES………....................................................... 1
NO……..…………………………………..……. 2 DON’T KNOW……………………………….…. 7 REFUSED TO ANSWER……………………… 9
YES (1) NO (2) NOT APPLICABLE (7)
REFUSED TO ANSWER (9)
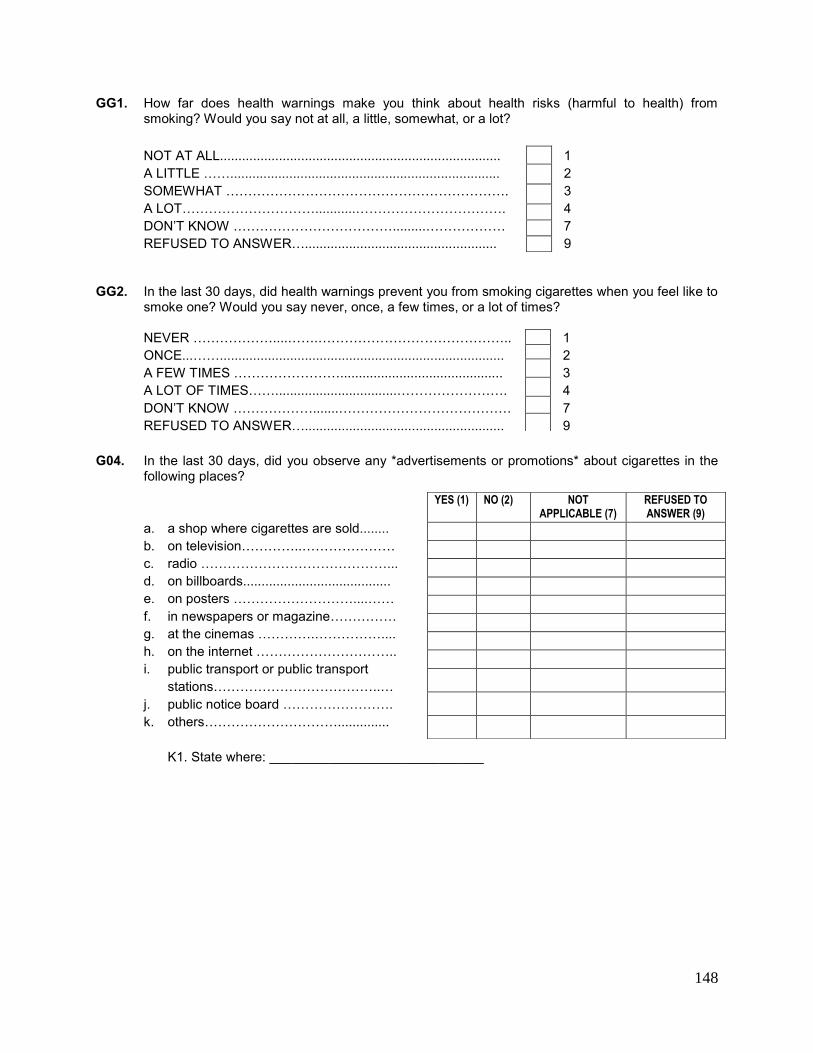
148
GG1. How far does health warnings make you think about health risks (harmful to health) from smoking? Would you say not at all, a little, somewhat, or a lot?
NOT AT ALL............................................................................ 1
A LITTLE ……......................................................................... 2 SOMEWHAT ………………………………………………………. 3 A LOT…………………………...........……………………………. 4 DON’T KNOW ……………………………….........……………… 7 REFUSED TO ANSWER….................................................... 9
GG2. In the last 30 days, did health warnings prevent you from smoking cigarettes when you feel like to
smoke one? Would you say never, once, a few times, or a lot of times?
NEVER ………………....…….…………………………………….. 1
ONCE...……............................................................................. 2 A FEW TIMES ……………………............................................ 3 A LOT OF TIMES…….................................……………………. 4 DON’T KNOW ……………….......………………………………… 7 REFUSED TO ANSWER…...................................................... 9
G04. In the last 30 days, did you observe any *advertisements or promotions* about cigarettes in the following places?
a. a shop where cigarettes are sold........ b. on television…………..………………… c. radio ……………………………………... d. on billboards........................................ e. on posters ………………………....…… f. in newspapers or magazine…………… g. at the cinemas ………….…………….... h. on the internet ………………………….. i. public transport or public transport
stations………………………………..… j. public notice board ……………………. k. others…………………………..............
K1. State where: _____________________________
YES (1) NO (2) NOT APPLICABLE (7)
REFUSED TO ANSWER (9)
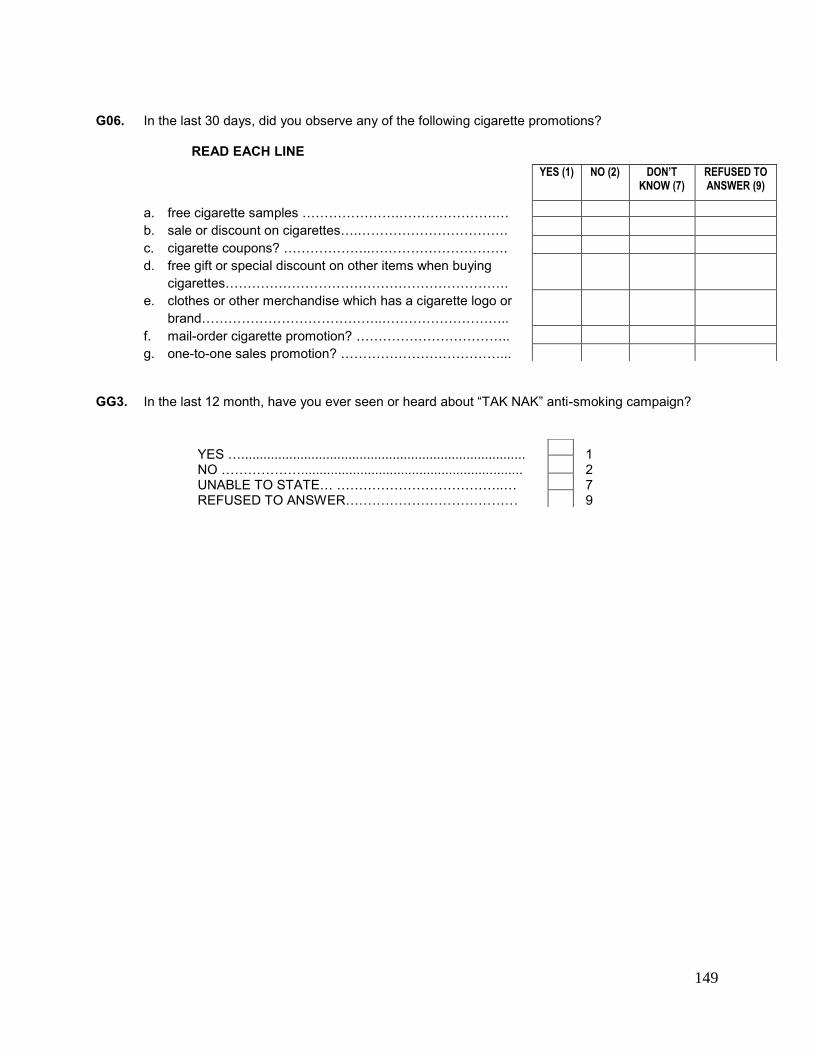
149
G06. In the last 30 days, did you observe any of the following cigarette promotions? READ EACH LINE
a. free cigarette samples ………………….………………….… b. sale or discount on cigarettes….……………………………. c. cigarette coupons? ………………..…………………………. d. free gift or special discount on other items when buying
cigarettes………………………………………………………. e. clothes or other merchandise which has a cigarette logo or
brand…………………………………..……………………….. f. mail-order cigarette promotion? …………………………….. g. one-to-one sales promotion? ………………………………...
GG3. In the last 12 month, have you ever seen or heard about “TAK NAK” anti-smoking campaign? YES …............................................................................. 1 NO ………………............................................................ 2 UNABLE TO STATE… ………………………………..… 7 REFUSED TO ANSWER………………………………… 9
YES (1) NO (2) DON’T KNOW (7)
REFUSED TO ANSWER (9)
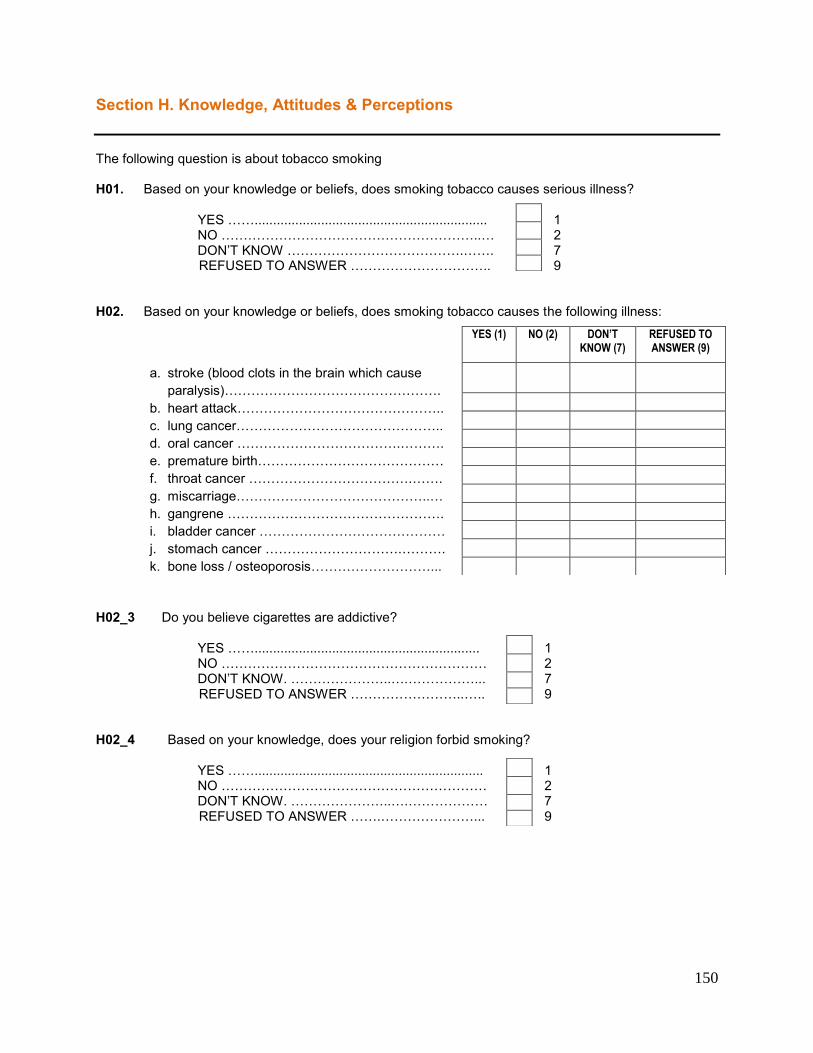
150
Section H. Knowledge, Attitudes & Perceptions The following question is about tobacco smoking H01. Based on your knowledge or beliefs, does smoking tobacco causes serious illness? YES ……............................................................... 1 NO …………………………………………………..… 2 DON’T KNOW ………………………………….……. 7 REFUSED TO ANSWER ………………………….. 9 H02. Based on your knowledge or beliefs, does smoking tobacco causes the following illness:
a. stroke (blood clots in the brain which cause paralysis)………………………………………….
b. heart attack……………………………………….. c. lung cancer……………………………………….. d. oral cancer ……………………………….………. e. premature birth…………………………………… f. throat cancer ……………………………….……. g. miscarriage……………………………………..… h. gangrene …………………………………………. i. bladder cancer …………………………………… j. stomach cancer ………………………….………. k. bone loss / osteoporosis………………………...
H02_3 Do you believe cigarettes are addictive? YES ……............................................................. 1
NO …………………………………………………… 2 DON’T KNOW. …………………..….……………... 7 REFUSED TO ANSWER ……………………..….. 9 H02_4 Based on your knowledge, does your religion forbid smoking? YES …….............................................................. 1
NO …………………………………………………… 2 DON’T KNOW. …………………..….……………… 7 REFUSED TO ANSWER …….…………………... 9
YES (1) NO (2) DON’T KNOW (7)
REFUSED TO ANSWER (9)
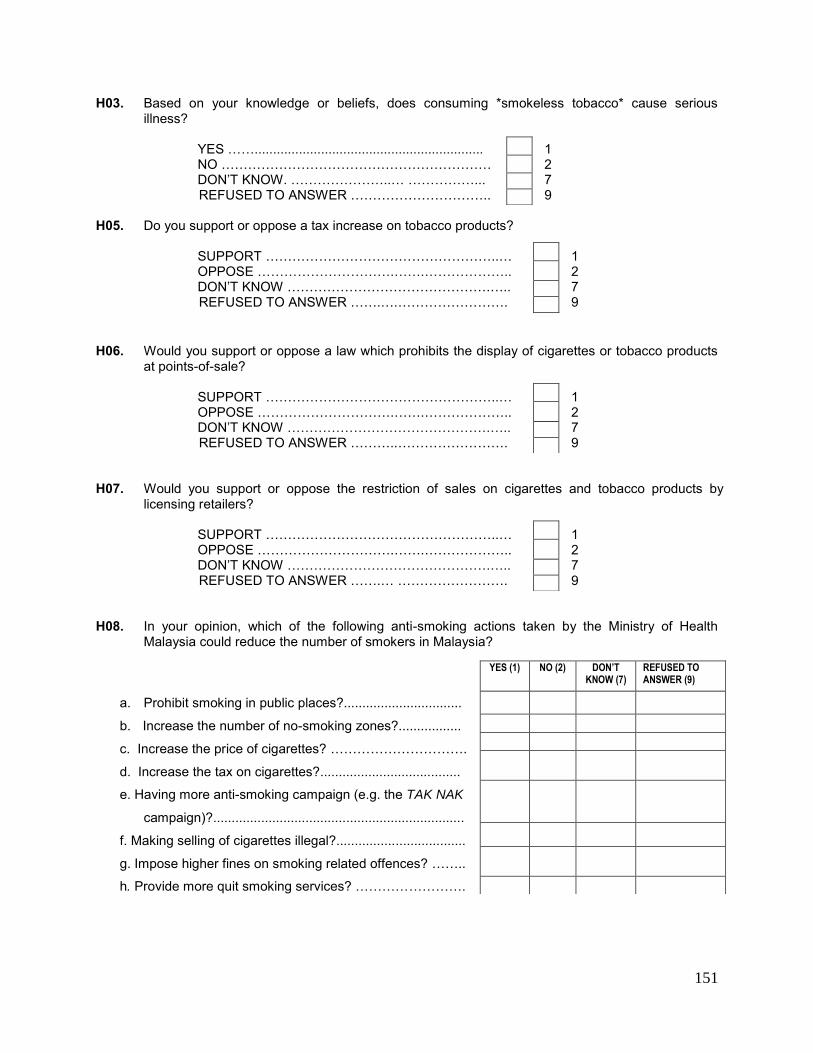
151
H03. Based on your knowledge or beliefs, does consuming *smokeless tobacco* cause serious illness?
YES …….............................................................. 1
NO ……………………………………………………. 2 DON’T KNOW. …………………..… ……………... 7 REFUSED TO ANSWER ………………………….. 9 H05. Do you support or oppose a tax increase on tobacco products? SUPPORT ……………………………………………..… 1 OPPOSE ………………………….…….……………….. 2 DON’T KNOW ……………………………………….….. 7 REFUSED TO ANSWER …….….……………………. 9 H06. Would you support or oppose a law which prohibits the display of cigarettes or tobacco products
at points-of-sale? SUPPORT ……………………………………………..… 1 OPPOSE ………………………….…….……………….. 2 DON’T KNOW ……………………………………….….. 7 REFUSED TO ANSWER ………..……………………. 9 H07. Would you support or oppose the restriction of sales on cigarettes and tobacco products by
licensing retailers? SUPPORT ……………………………………………..… 1 OPPOSE ………………………….…….……………….. 2 DON’T KNOW ……………………………………….….. 7 REFUSED TO ANSWER …….… ……………………. 9 H08. In your opinion, which of the following anti-smoking actions taken by the Ministry of Health
Malaysia could reduce the number of smokers in Malaysia?
a. Prohibit smoking in public places?................................
b. Increase the number of no-smoking zones?.................
c. Increase the price of cigarettes? ………………………….
d. Increase the tax on cigarettes?......................................
e. Having more anti-smoking campaign (e.g. the TAK NAK
campaign)?....................................................................
f. Making selling of cigarettes illegal?...................................
g. Impose higher fines on smoking related offences? ……..
h. Provide more quit smoking services? …………………….
YES (1) NO (2) DON’T KNOW (7)
REFUSED TO ANSWER (9)
152
END INDIVIDUAL QUESTIONNAIRE I00.
Those are all the questions that I need to ask. Thank you for participating in this important survey. II1. The quality of data in this survey is very importance to us, could you please give us your
telephone number. This number might be used only to monitor my work.
INTERVIEWER: PLEASE RECORD THE RESPONDENT’S TELEPHONE NUMBER
I02. WRITE ANY NOTES REGARDING INTERVIEW:
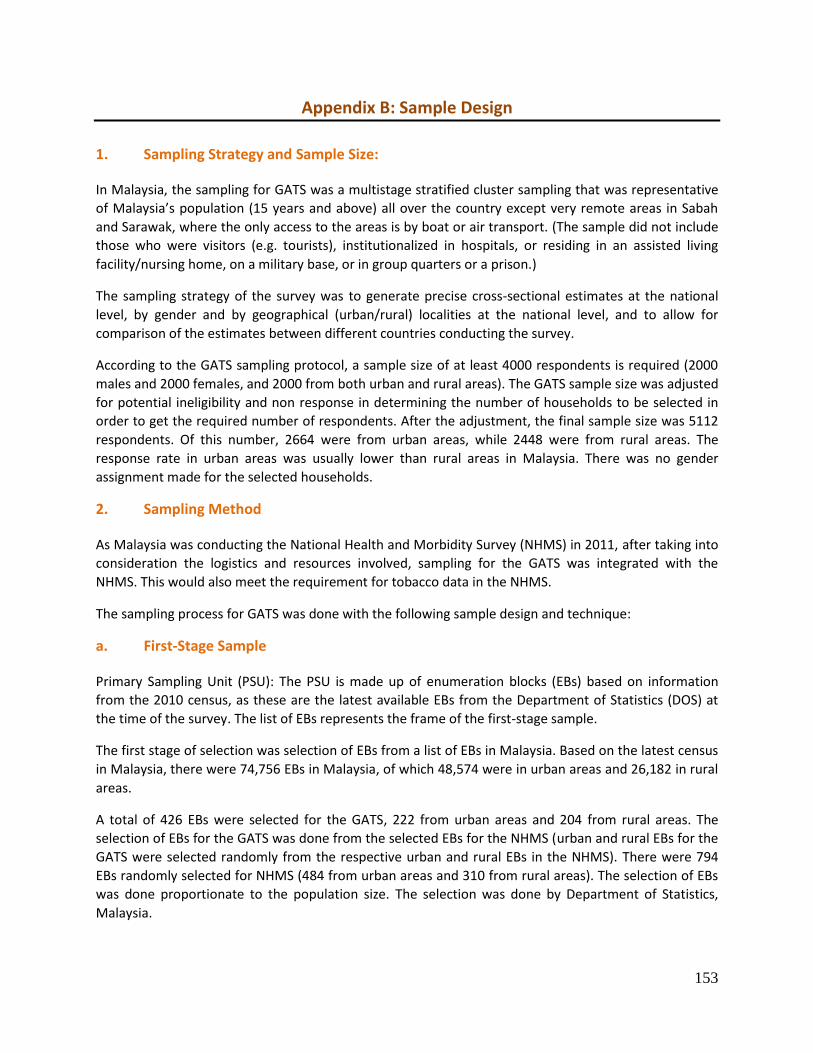
153
Appendix B: Sample Design
1. Sampling Strategy and Sample Size:
In Malaysia, the sampling for GATS was a multistage stratified cluster sampling that was representative
of Malaysia’s population (15 years and above) all over the country except very remote areas in Sabah
and Sarawak, where the only access to the areas is by boat or air transport. (The sample did not include
those who were visitors (e.g. tourists), institutionalized in hospitals, or residing in an assisted living
facility/nursing home, on a military base, or in group quarters or a prison.)
The sampling strategy of the survey was to generate precise cross-sectional estimates at the national
level, by gender and by geographical (urban/rural) localities at the national level, and to allow for
comparison of the estimates between different countries conducting the survey.
According to the GATS sampling protocol, a sample size of at least 4000 respondents is required (2000
males and 2000 females, and 2000 from both urban and rural areas). The GATS sample size was adjusted
for potential ineligibility and non response in determining the number of households to be selected in
order to get the required number of respondents. After the adjustment, the final sample size was 5112
respondents. Of this number, 2664 were from urban areas, while 2448 were from rural areas. The
response rate in urban areas was usually lower than rural areas in Malaysia. There was no gender
assignment made for the selected households.
2. Sampling Method
As Malaysia was conducting the National Health and Morbidity Survey (NHMS) in 2011, after taking into
consideration the logistics and resources involved, sampling for the GATS was integrated with the
NHMS. This would also meet the requirement for tobacco data in the NHMS.
The sampling process for GATS was done with the following sample design and technique:
a. First-Stage Sample
Primary Sampling Unit (PSU): The PSU is made up of enumeration blocks (EBs) based on information
from the 2010 census, as these are the latest available EBs from the Department of Statistics (DOS) at
the time of the survey. The list of EBs represents the frame of the first-stage sample.
The first stage of selection was selection of EBs from a list of EBs in Malaysia. Based on the latest census
in Malaysia, there were 74,756 EBs in Malaysia, of which 48,574 were in urban areas and 26,182 in rural
areas.
A total of 426 EBs were selected for the GATS, 222 from urban areas and 204 from rural areas. The
selection of EBs for the GATS was done from the selected EBs for the NHMS (urban and rural EBs for the
GATS were selected randomly from the respective urban and rural EBs in the NHMS). There were 794
EBs randomly selected for NHMS (484 from urban areas and 310 from rural areas). The selection of EBs
was done proportionate to the population size. The selection was done by Department of Statistics,
Malaysia.
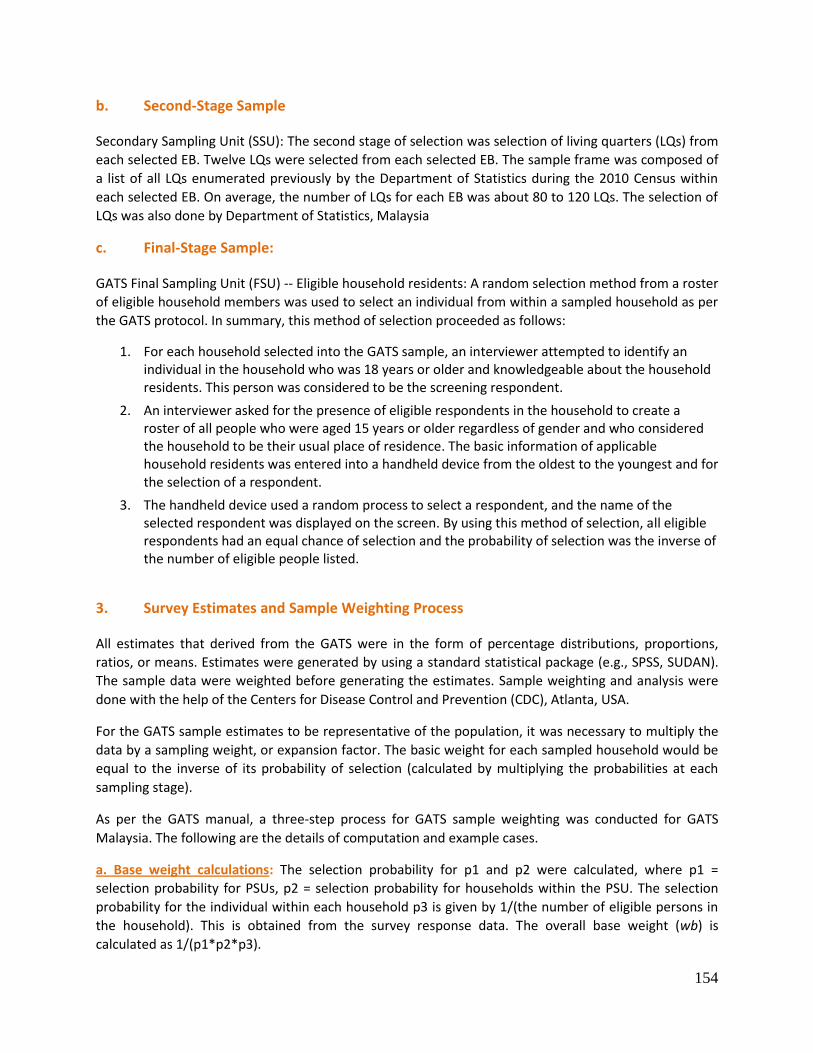
154
b. Second-Stage Sample
Secondary Sampling Unit (SSU): The second stage of selection was selection of living quarters (LQs) from
each selected EB. Twelve LQs were selected from each selected EB. The sample frame was composed of
a list of all LQs enumerated previously by the Department of Statistics during the 2010 Census within
each selected EB. On average, the number of LQs for each EB was about 80 to 120 LQs. The selection of
LQs was also done by Department of Statistics, Malaysia
c. Final-Stage Sample:
GATS Final Sampling Unit (FSU) -- Eligible household residents: A random selection method from a roster
of eligible household members was used to select an individual from within a sampled household as per
the GATS protocol. In summary, this method of selection proceeded as follows:
1. For each household selected into the GATS sample, an interviewer attempted to identify an individual in the household who was 18 years or older and knowledgeable about the household residents. This person was considered to be the screening respondent.
2. An interviewer asked for the presence of eligible respondents in the household to create a roster of all people who were aged 15 years or older regardless of gender and who considered the household to be their usual place of residence. The basic information of applicable household residents was entered into a handheld device from the oldest to the youngest and for the selection of a respondent.
3. The handheld device used a random process to select a respondent, and the name of the selected respondent was displayed on the screen. By using this method of selection, all eligible respondents had an equal chance of selection and the probability of selection was the inverse of the number of eligible people listed.
3. Survey Estimates and Sample Weighting Process
All estimates that derived from the GATS were in the form of percentage distributions, proportions,
ratios, or means. Estimates were generated by using a standard statistical package (e.g., SPSS, SUDAN).
The sample data were weighted before generating the estimates. Sample weighting and analysis were
done with the help of the Centers for Disease Control and Prevention (CDC), Atlanta, USA.
For the GATS sample estimates to be representative of the population, it was necessary to multiply the
data by a sampling weight, or expansion factor. The basic weight for each sampled household would be
equal to the inverse of its probability of selection (calculated by multiplying the probabilities at each
sampling stage).
As per the GATS manual, a three-step process for GATS sample weighting was conducted for GATS
Malaysia. The following are the details of computation and example cases.
a. Base weight calculations: The selection probability for p1 and p2 were calculated, where p1 =
selection probability for PSUs, p2 = selection probability for households within the PSU. The selection
probability for the individual within each household p3 is given by 1/(the number of eligible persons in
the household). This is obtained from the survey response data. The overall base weight (wb) is
calculated as 1/(p1*p2*p3).
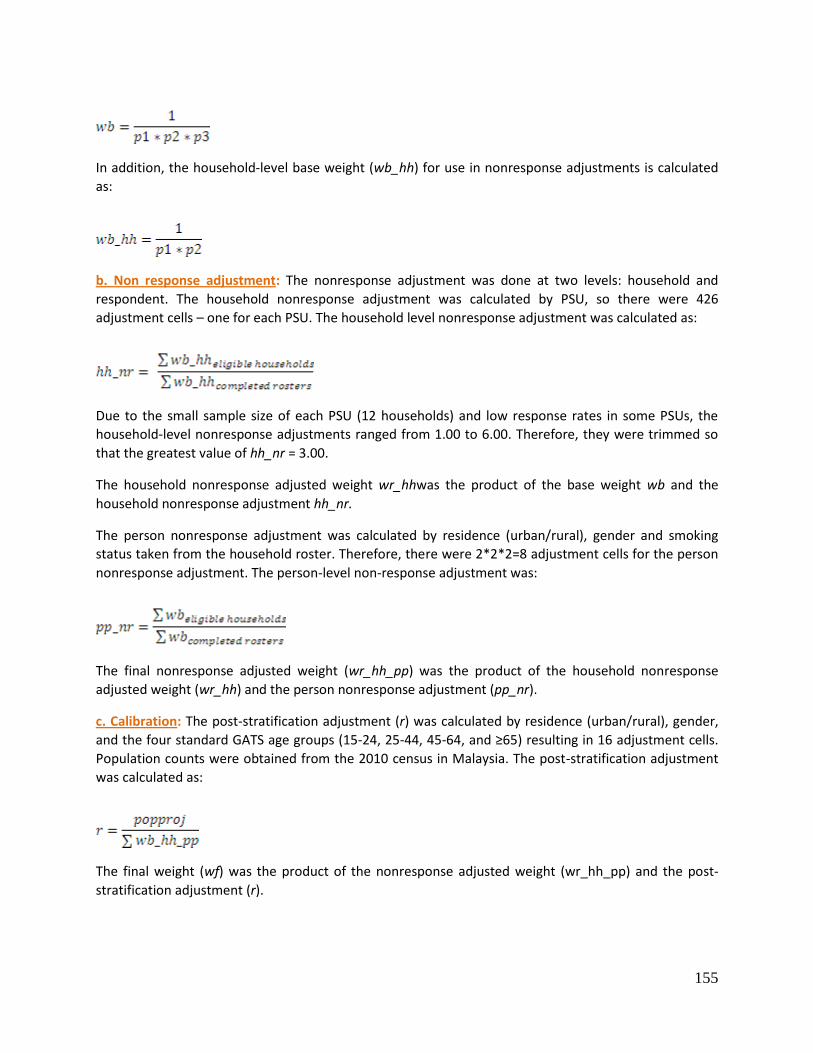
155
In addition, the household-level base weight (wb_hh) for use in nonresponse adjustments is calculated
as:
b. Non response adjustment: The nonresponse adjustment was done at two levels: household and
respondent. The household nonresponse adjustment was calculated by PSU, so there were 426
adjustment cells – one for each PSU. The household level nonresponse adjustment was calculated as:
Due to the small sample size of each PSU (12 households) and low response rates in some PSUs, the
household-level nonresponse adjustments ranged from 1.00 to 6.00. Therefore, they were trimmed so
that the greatest value of hh_nr = 3.00.
The household nonresponse adjusted weight wr_hhwas the product of the base weight wb and the
household nonresponse adjustment hh_nr.
The person nonresponse adjustment was calculated by residence (urban/rural), gender and smoking
status taken from the household roster. Therefore, there were 2*2*2=8 adjustment cells for the person
nonresponse adjustment. The person-level non-response adjustment was:
The final nonresponse adjusted weight (wr_hh_pp) was the product of the household nonresponse
adjusted weight (wr_hh) and the person nonresponse adjustment (pp_nr).
c. Calibration: The post-stratification adjustment (r) was calculated by residence (urban/rural), gender,
and the four standard GATS age groups (15-24, 25-44, 45-64, and ≥65) resulting in 16 adjustment cells.
Population counts were obtained from the 2010 census in Malaysia. The post-stratification adjustment
was calculated as:
The final weight (wf) was the product of the nonresponse adjusted weight (wr_hh_pp) and the post-
stratification adjustment (r).
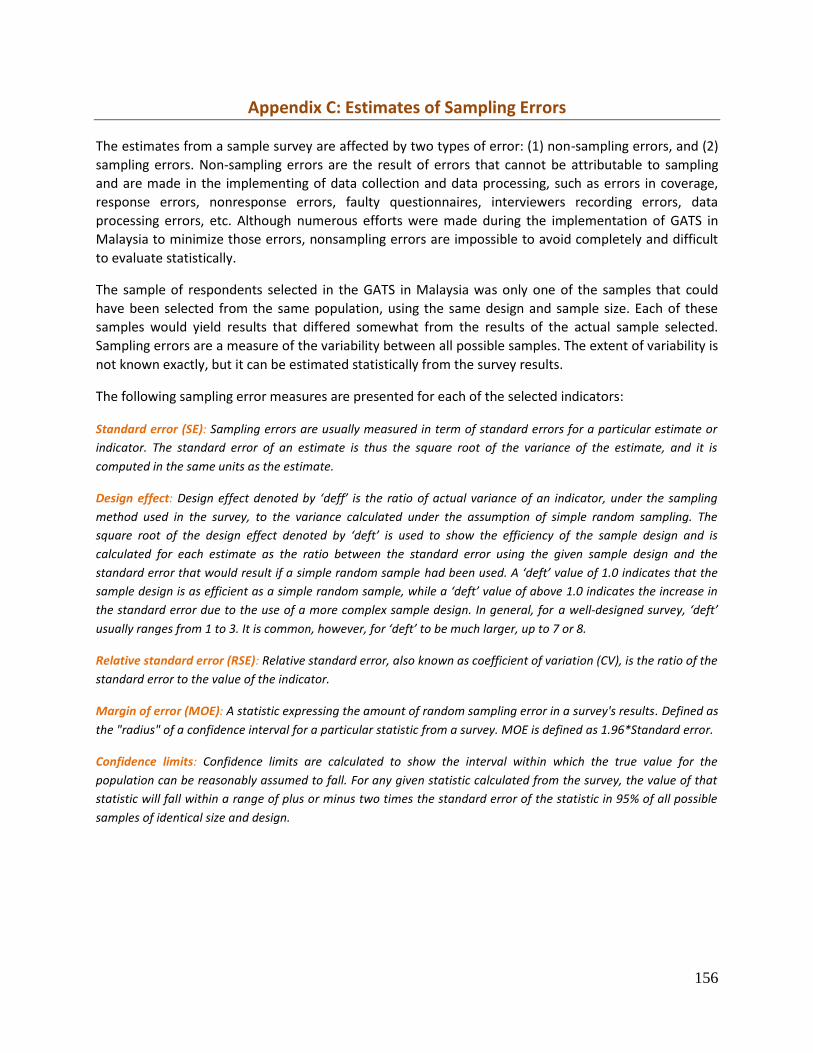
156
Appendix C: Estimates of Sampling Errors
The estimates from a sample survey are affected by two types of error: (1) non-sampling errors, and (2)
sampling errors. Non-sampling errors are the result of errors that cannot be attributable to sampling
and are made in the implementing of data collection and data processing, such as errors in coverage,
response errors, nonresponse errors, faulty questionnaires, interviewers recording errors, data
processing errors, etc. Although numerous efforts were made during the implementation of GATS in
Malaysia to minimize those errors, nonsampling errors are impossible to avoid completely and difficult
to evaluate statistically.
The sample of respondents selected in the GATS in Malaysia was only one of the samples that could
have been selected from the same population, using the same design and sample size. Each of these
samples would yield results that differed somewhat from the results of the actual sample selected.
Sampling errors are a measure of the variability between all possible samples. The extent of variability is
not known exactly, but it can be estimated statistically from the survey results.
The following sampling error measures are presented for each of the selected indicators:
Standard error (SE): Sampling errors are usually measured in term of standard errors for a particular estimate or
indicator. The standard error of an estimate is thus the square root of the variance of the estimate, and it is
computed in the same units as the estimate.
Design effect: Design effect denoted by ‘deff’ is the ratio of actual variance of an indicator, under the sampling
method used in the survey, to the variance calculated under the assumption of simple random sampling. The
square root of the design effect denoted by ‘deft’ is used to show the efficiency of the sample design and is
calculated for each estimate as the ratio between the standard error using the given sample design and the
standard error that would result if a simple random sample had been used. A ‘deft’ value of 1.0 indicates that the
sample design is as efficient as a simple random sample, while a ‘deft’ value of above 1.0 indicates the increase in
the standard error due to the use of a more complex sample design. In general, for a well-designed survey, ‘deft’
usually ranges from 1 to 3. It is common, however, for ‘deft’ to be much larger, up to 7 or 8.
Relative standard error (RSE): Relative standard error, also known as coefficient of variation (CV), is the ratio of the
standard error to the value of the indicator.
Margin of error (MOE): A statistic expressing the amount of random sampling error in a survey's results. Defined as
the "radius" of a confidence interval for a particular statistic from a survey. MOE is defined as 1.96*Standard error.
Confidence limits: Confidence limits are calculated to show the interval within which the true value for the
population can be reasonably assumed to fall. For any given statistic calculated from the survey, the value of that
statistic will fall within a range of plus or minus two times the standard error of the statistic in 95% of all possible
samples of identical size and design.
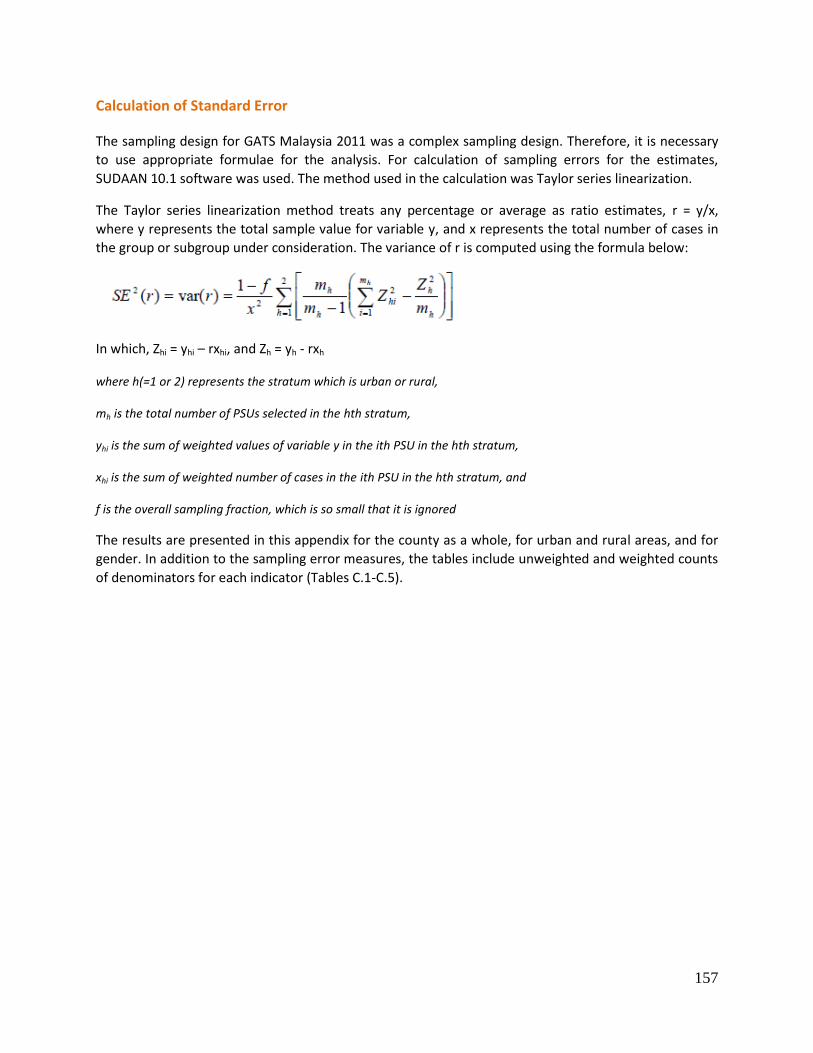
157
Calculation of Standard Error
The sampling design for GATS Malaysia 2011 was a complex sampling design. Therefore, it is necessary
to use appropriate formulae for the analysis. For calculation of sampling errors for the estimates,
SUDAAN 10.1 software was used. The method used in the calculation was Taylor series linearization.
The Taylor series linearization method treats any percentage or average as ratio estimates, r = y/x,
where y represents the total sample value for variable y, and x represents the total number of cases in
the group or subgroup under consideration. The variance of r is computed using the formula below:
In which, Zhi = yhi – rxhi, and Zh = yh - rxh
where h(=1 or 2) represents the stratum which is urban or rural,
mh is the total number of PSUs selected in the hth stratum,
yhi is the sum of weighted values of variable y in the ith PSU in the hth stratum,
xhi is the sum of weighted number of cases in the ith PSU in the hth stratum, and
f is the overall sampling fraction, which is so small that it is ignored
The results are presented in this appendix for the county as a whole, for urban and rural areas, and for
gender. In addition to the sampling error measures, the tables include unweighted and weighted counts
of denominators for each indicator (Tables C.1-C.5).

158
Table C.1: Sampling errors of key indicators for overall adults aged 15 years or older, GATS Malaysia 2011.
Confidence limits
Indicator Estimate (R)
Standard Error (SE)
Sample size (n)
Design Effect (DEFF)
Relative Error (SE/R)
Margin of Error (MOE)
Lower Limit (R-1.96SE)
Upper Limit (R+1.96SE)
Current Tobacco Smokers 23.1 1.01 4,250 2.46 0.04 1.99 21.13 25.11
Current Cigarette Smokers 22.9 1.01 4,250 2.45 0.04 1.98 20.94 24.89
Current Users of Smokeless Tobacco 0.7 0.17 4,133 1.69 0.23 0.34 0.40 1.09
Daily Tobacco Smoker 20.9 0.99 4,250 2.53 0.05 1.94 18.91 22.80
Daily Cigarette Smokers 20.6 0.98 4,250 2.50 0.05 1.92 18.69 22.54
Former Daily Tobacco Smokers Among All Adults 2.3 0.27 4,250 1.37 0.12 0.53 1.79 2.85
Former Tobacco Smokers Among Ever Daily Smokers 9.5 1.11 1,079 1.56 0.12 2.19 7.28 11.65
Time to First Tobacco use within 5 minutes of waking
12.3 1.76 891 2.57 0.14 3.45 8.82 15.73
Time to First Tobacco use within 6-30 minutes of waking
35.3 2.35 891 2.16 0.07 4.61 30.65 39.87
Smoking Quit Attempt in the Past 12 Months 48.6 2.33 989 2.15 0.05 4.57 44.05 53.19
Health Care Provider Asked about Smoking 67.6 3.66 308 1.87 0.05 7.17 60.39 74.73
Health Care Provider Advised Quitting Smoking 52.6 4.48 308 2.47 0.09 8.77 43.82 61.36
Use of Pharmacotherapy for Smoking Cessation 9.0 2.02 414 2.05 0.22 3.96 5.05 12.96
Use of Counseling/Advice or Quit Lines for Smoking Cessation
4.4 1.03 416 1.04 0.23 2.02 2.42 6.46
Planning to quit, thinking about quitting, or will quit smoking
70.7 2.13 985 2.15 0.03 4.17 66.53 74.87
Exposure to SHS at Home 38.4 1.32 4,110 3.03 0.03 2.59 35.86 41.03
Exposure to SHS at Workplace 39.8 2.06 1,018 1.80 0.05 4.03 35.81 43.88
Exposure to SHS in Government Buildings/Offices 20.0 1.99 988 2.43 0.10 3.89 16.13 23.92
Exposure to SHS in Health Care Facilities 8.7 0.98 1,720 2.08 0.11 1.92 6.75 10.58
Exposure to SHS in Restaurants 71.0 1.61 2,125 2.67 0.02 3.15 67.83 74.13
Exposure to SHS on Public Transportation 28.2 2.59 705 2.34 0.09 5.08 23.07 33.23
Last cigarette purchase in grocery store 79.6 2.02 798 2.00 0.03 3.96 75.69 83.61
Last cigarette purchase in convenience store or kiosk
6.5 1.22 798 1.97 0.19 2.39 4.06 8.84
Noticed Anti-tobacco Information on radio or television
87.1 0.89 4,244 2.97 0.01 1.74 85.34 88.82
Noticed Health Warning Labels on Cigarette Packages
92.8 1.19 985 2.10 0.01 2.34 90.46 95.14
Thinking of Quitting Because of Health Warning Labels on Cigarette Package
45.8 2.31 969 2.08 0.05 4.53 41.27 50.33
Noticed Any Cigarette Advertisement or Promotion 35.6 1.43 4,208 3.76 0.04 2.81 32.81 38.42
Believes that Tobacco Smoking Causes Serious Illness
92.2 0.63 4,236 2.34 0.01 1.23 91.01 93.47
Believes that Tobacco Smoking Causes Strokes 80.7 1.05 4,240 3.02 0.01 2.06 78.63 82.76
Believes that Tobacco Smoking Causes Heart Attacks 88.8 0.80 4,242 2.75 0.01 1.58 87.19 90.34
Believes that Tobacco Smoking Causes Lung Cancer 93.7 0.52 4,244 1.95 0.01 1.02 92.66 94.71
Believes that SHS Causes Serious Illness in Non-Smokers
85.8 0.76 4,244 2.04 0.01 1.50 84.34 87.34
Number of Cigarettes Smoked per Day (by daily smokers)
13.9 0.40 889 1.88 0.03 0.79 13.11 14.69
Age at Daily Smoking Initiation 17.2 0.31 351 2.82 0.02 0.60 16.62 17.82
Monthly Expenditure on Manufactured Cigarettes 178.8 19.53 782 1.34 0.11 38.27 140.5 217.0

159
Table C.2: Sampling errors of key indicators for men aged 15 years or older, GATS Malaysia 2011.
Confidence limits
Indicator Estimate (R)
Standard Error (SE)
Sample size (n)
Design Effect (DEFF)
Relative Error (SE/R)
Margin of Error (MOE)
Lower Limit (R-1.96SE)
Upper Limit (R+1.96SE)
Current Tobacco Smokers 43.9 1.69 2,104 2.44 0.04 3.32 40.61 47.24
Current Cigarette Smokers 43.6 1.69 2,104 2.43 0.04 3.31 40.27 46.88
Current Users of Smokeless Tobacco 0.9 0.30 2,034 2.04 0.33 0.59 0.31 1.48
Daily Tobacco Smoker 39.9 1.71 2,104 2.56 0.04 3.35 36.52 43.22
Daily Cigarette Smokers 39.4 1.69 2,104 2.52 0.04 3.32 36.09 42.72
Former Daily Tobacco Smokers Among All Adults 4.4 0.53 2,104 1.38 0.12 1.03 3.38 5.44
Former Tobacco Smokers Among Ever Daily Smokers 9.4 1.13 1,042 1.55 0.12 2.21 7.24 11.66
Time to First Tobacco use within 5 minutes of waking
12.5 1.79 866 2.53 0.14 3.50 8.98 15.99
Time to First Tobacco use within 6-30 minutes of waking
35.6 2.38 866 2.14 0.07 4.66 30.90 40.23
Smoking Quit Attempt in the Past 12 Months 48.7 2.38 956 2.16 0.05 4.66 44.02 53.34
Health Care Provider Asked about Smoking 67.3 3.73 294 1.85 0.06 7.31 60.04 74.65
Health Care Provider Advised Quitting Smoking 52.2 4.56 294 2.44 0.09 8.94 43.24 61.11
Use of Pharmacotherapy for Smoking Cessation 9.2 2.05 399 2.01 0.22 4.03 5.16 13.21
Use of Counseling/Advice or Quit Lines for Smoking Cessation
4.4 1.04 401 1.03 0.24 2.03 2.33 6.40
Planning to quit, thinking about quitting, or will quit smoking
70.4 2.17 952 2.14 0.03 4.25 66.20 74.69
Exposure to SHS at Home 43.3 1.75 2,043 2.54 0.04 3.43 39.87 46.72
Exposure to SHS at Workplace 46.2 2.65 603 1.71 0.06 5.20 41.03 51.44
Exposure to SHS in Government Buildings/Offices 20.1 2.30 595 1.96 0.11 4.51 15.61 24.64
Exposure to SHS in Health Care Facilities 7.8 1.45 756 2.20 0.19 2.84 4.95 10.62
Exposure to SHS in Restaurants 73.1 1.89 1,156 2.09 0.03 3.70 69.38 76.78
Exposure to SHS on Public Transportation 32.1 4.09 283 2.16 0.13 8.01 24.11 40.13
Last cigarette purchase in grocery store 79.5 2.04 780 1.99 0.03 4.00 75.46 83.47
Last cigarette purchase in convenience store or kiosk
6.4 1.24 780 1.98 0.19 2.43 4.02 8.87
Noticed Anti-tobacco Information on radio or television
86.0 1.29 2,102 2.89 0.01 2.52 83.44 88.49
Noticed Health Warning Labels on Cigarette Packages
93.2 1.20 951 2.15 0.01 2.35 90.86 95.55
Thinking of Quitting Because of Health Warning Labels on Cigarette Package
45.7 2.32 935 2.02 0.05 4.54 41.12 50.21
Noticed Any Cigarette Advertisement or Promotion 39.0 1.86 2,088 3.02 0.05 3.64 35.36 42.64
Believes that Tobacco Smoking Causes Serious Illness
90.7 1.00 2,096 2.48 0.01 1.96 88.69 92.61
Believes that Tobacco Smoking Causes Strokes 79.2 1.38 2,102 2.43 0.02 2.71 76.45 81.87
Believes that Tobacco Smoking Causes Heart Attacks 86.9 1.16 2,101 2.46 0.01 2.26 84.61 89.14
Believes that Tobacco Smoking Causes Lung Cancer 92.7 0.79 2,103 1.91 0.01 1.54 91.12 94.21
Believes that SHS Causes Serious Illness in Non-Smokers
84.1 1.13 2,100 2.01 0.01 2.22 81.83 86.28
Number of Cigarettes Smoked per Day (by daily smokers)
14.0 0.40 865 1.83 0.03 0.79 13.18 14.76
Age at Daily Smoking Initiation 17.2 0.31 343 2.91 0.02 0.61 16.62 17.84
Monthly Expenditure on Manufactured Cigarettes 180.6 19.86 764 1.34 0.11 38.92 141.7 219.5
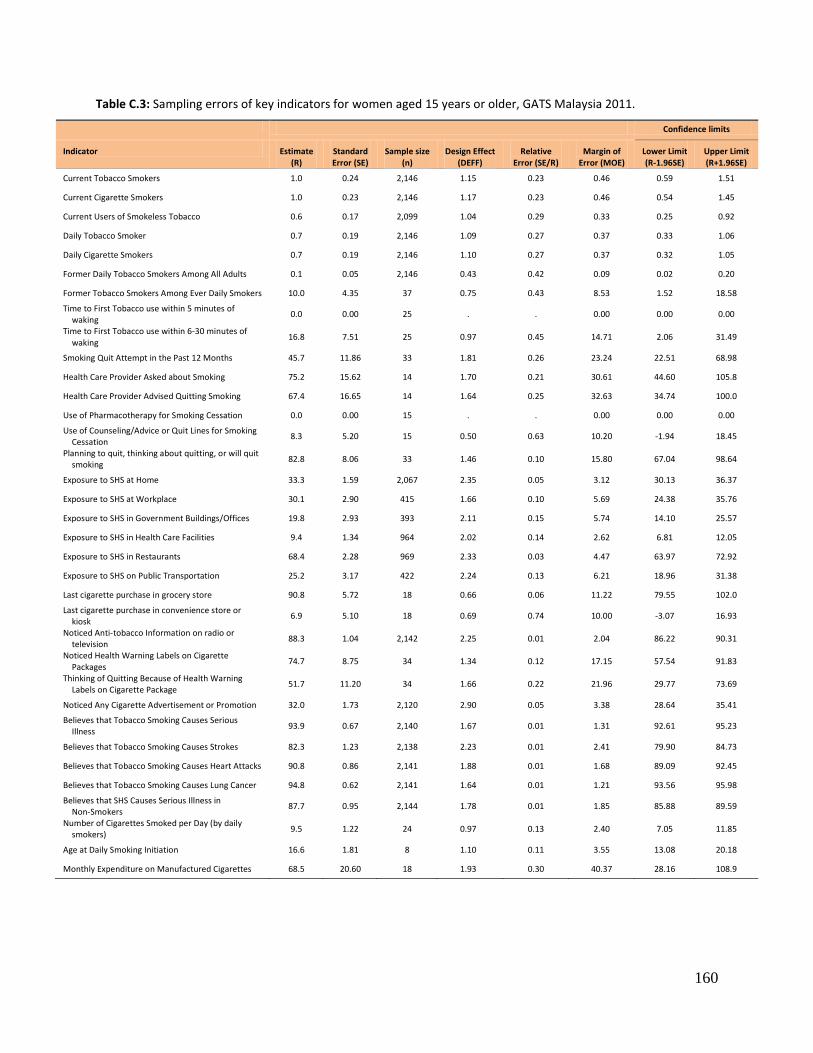
160
Table C.3: Sampling errors of key indicators for women aged 15 years or older, GATS Malaysia 2011.
Confidence limits
Indicator Estimate (R)
Standard Error (SE)
Sample size (n)
Design Effect (DEFF)
Relative Error (SE/R)
Margin of Error (MOE)
Lower Limit (R-1.96SE)
Upper Limit (R+1.96SE)
Current Tobacco Smokers 1.0 0.24 2,146 1.15 0.23 0.46 0.59 1.51
Current Cigarette Smokers 1.0 0.23 2,146 1.17 0.23 0.46 0.54 1.45
Current Users of Smokeless Tobacco 0.6 0.17 2,099 1.04 0.29 0.33 0.25 0.92
Daily Tobacco Smoker 0.7 0.19 2,146 1.09 0.27 0.37 0.33 1.06
Daily Cigarette Smokers 0.7 0.19 2,146 1.10 0.27 0.37 0.32 1.05
Former Daily Tobacco Smokers Among All Adults 0.1 0.05 2,146 0.43 0.42 0.09 0.02 0.20
Former Tobacco Smokers Among Ever Daily Smokers 10.0 4.35 37 0.75 0.43 8.53 1.52 18.58
Time to First Tobacco use within 5 minutes of waking
0.0 0.00 25 . . 0.00 0.00 0.00
Time to First Tobacco use within 6-30 minutes of waking
16.8 7.51 25 0.97 0.45 14.71 2.06 31.49
Smoking Quit Attempt in the Past 12 Months 45.7 11.86 33 1.81 0.26 23.24 22.51 68.98
Health Care Provider Asked about Smoking 75.2 15.62 14 1.70 0.21 30.61 44.60 105.8
Health Care Provider Advised Quitting Smoking 67.4 16.65 14 1.64 0.25 32.63 34.74 100.0
Use of Pharmacotherapy for Smoking Cessation 0.0 0.00 15 . . 0.00 0.00 0.00
Use of Counseling/Advice or Quit Lines for Smoking Cessation
8.3 5.20 15 0.50 0.63 10.20 -1.94 18.45
Planning to quit, thinking about quitting, or will quit smoking
82.8 8.06 33 1.46 0.10 15.80 67.04 98.64
Exposure to SHS at Home 33.3 1.59 2,067 2.35 0.05 3.12 30.13 36.37
Exposure to SHS at Workplace 30.1 2.90 415 1.66 0.10 5.69 24.38 35.76
Exposure to SHS in Government Buildings/Offices 19.8 2.93 393 2.11 0.15 5.74 14.10 25.57
Exposure to SHS in Health Care Facilities 9.4 1.34 964 2.02 0.14 2.62 6.81 12.05
Exposure to SHS in Restaurants 68.4 2.28 969 2.33 0.03 4.47 63.97 72.92
Exposure to SHS on Public Transportation 25.2 3.17 422 2.24 0.13 6.21 18.96 31.38
Last cigarette purchase in grocery store 90.8 5.72 18 0.66 0.06 11.22 79.55 102.0
Last cigarette purchase in convenience store or kiosk
6.9 5.10 18 0.69 0.74 10.00 -3.07 16.93
Noticed Anti-tobacco Information on radio or television
88.3 1.04 2,142 2.25 0.01 2.04 86.22 90.31
Noticed Health Warning Labels on Cigarette Packages
74.7 8.75 34 1.34 0.12 17.15 57.54 91.83
Thinking of Quitting Because of Health Warning Labels on Cigarette Package
51.7 11.20 34 1.66 0.22 21.96 29.77 73.69
Noticed Any Cigarette Advertisement or Promotion 32.0 1.73 2,120 2.90 0.05 3.38 28.64 35.41
Believes that Tobacco Smoking Causes Serious Illness
93.9 0.67 2,140 1.67 0.01 1.31 92.61 95.23
Believes that Tobacco Smoking Causes Strokes 82.3 1.23 2,138 2.23 0.01 2.41 79.90 84.73
Believes that Tobacco Smoking Causes Heart Attacks 90.8 0.86 2,141 1.88 0.01 1.68 89.09 92.45
Believes that Tobacco Smoking Causes Lung Cancer 94.8 0.62 2,141 1.64 0.01 1.21 93.56 95.98
Believes that SHS Causes Serious Illness in Non-Smokers
87.7 0.95 2,144 1.78 0.01 1.85 85.88 89.59
Number of Cigarettes Smoked per Day (by daily smokers)
9.5 1.22 24 0.97 0.13 2.40 7.05 11.85
Age at Daily Smoking Initiation 16.6 1.81 8 1.10 0.11 3.55 13.08 20.18
Monthly Expenditure on Manufactured Cigarettes 68.5 20.60 18 1.93 0.30 40.37 28.16 108.9
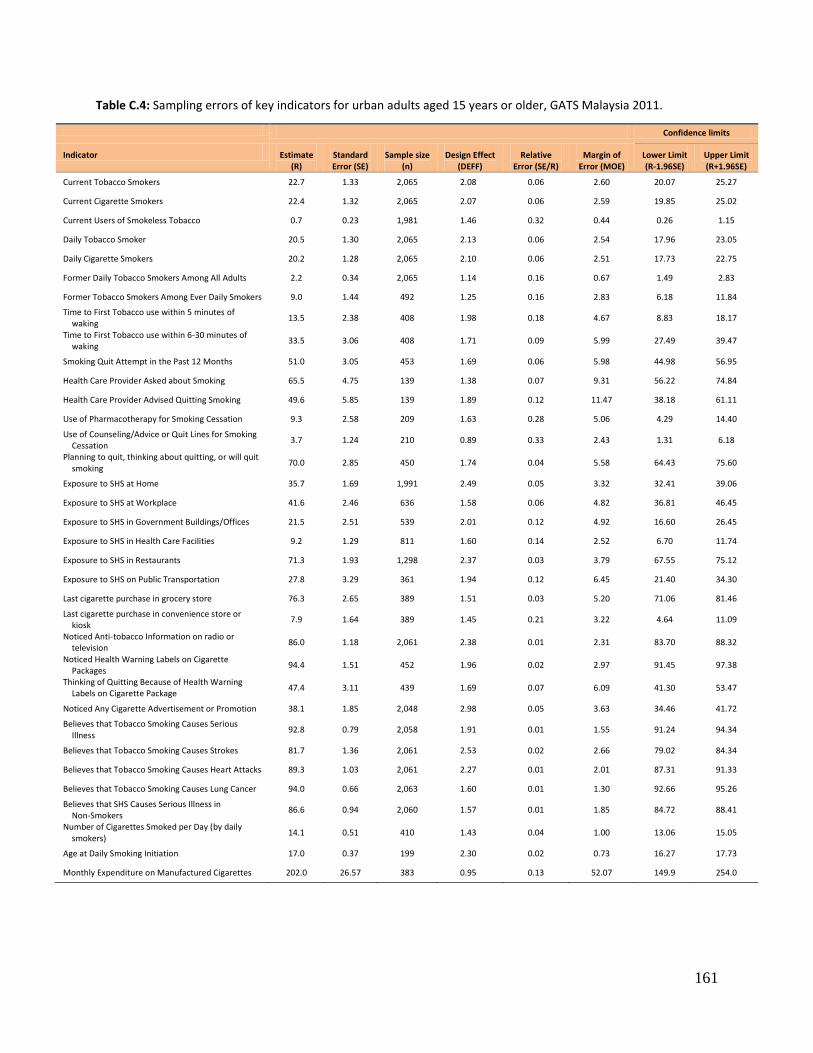
161
Table C.4: Sampling errors of key indicators for urban adults aged 15 years or older, GATS Malaysia 2011.
Confidence limits
Indicator Estimate (R)
Standard Error (SE)
Sample size (n)
Design Effect (DEFF)
Relative Error (SE/R)
Margin of Error (MOE)
Lower Limit (R-1.96SE)
Upper Limit (R+1.96SE)
Current Tobacco Smokers 22.7 1.33 2,065 2.08 0.06 2.60 20.07 25.27
Current Cigarette Smokers 22.4 1.32 2,065 2.07 0.06 2.59 19.85 25.02
Current Users of Smokeless Tobacco 0.7 0.23 1,981 1.46 0.32 0.44 0.26 1.15
Daily Tobacco Smoker 20.5 1.30 2,065 2.13 0.06 2.54 17.96 23.05
Daily Cigarette Smokers 20.2 1.28 2,065 2.10 0.06 2.51 17.73 22.75
Former Daily Tobacco Smokers Among All Adults 2.2 0.34 2,065 1.14 0.16 0.67 1.49 2.83
Former Tobacco Smokers Among Ever Daily Smokers 9.0 1.44 492 1.25 0.16 2.83 6.18 11.84
Time to First Tobacco use within 5 minutes of waking
13.5 2.38 408 1.98 0.18 4.67 8.83 18.17
Time to First Tobacco use within 6-30 minutes of waking
33.5 3.06 408 1.71 0.09 5.99 27.49 39.47
Smoking Quit Attempt in the Past 12 Months 51.0 3.05 453 1.69 0.06 5.98 44.98 56.95
Health Care Provider Asked about Smoking 65.5 4.75 139 1.38 0.07 9.31 56.22 74.84
Health Care Provider Advised Quitting Smoking 49.6 5.85 139 1.89 0.12 11.47 38.18 61.11
Use of Pharmacotherapy for Smoking Cessation 9.3 2.58 209 1.63 0.28 5.06 4.29 14.40
Use of Counseling/Advice or Quit Lines for Smoking Cessation
3.7 1.24 210 0.89 0.33 2.43 1.31 6.18
Planning to quit, thinking about quitting, or will quit smoking
70.0 2.85 450 1.74 0.04 5.58 64.43 75.60
Exposure to SHS at Home 35.7 1.69 1,991 2.49 0.05 3.32 32.41 39.06
Exposure to SHS at Workplace 41.6 2.46 636 1.58 0.06 4.82 36.81 46.45
Exposure to SHS in Government Buildings/Offices 21.5 2.51 539 2.01 0.12 4.92 16.60 26.45
Exposure to SHS in Health Care Facilities 9.2 1.29 811 1.60 0.14 2.52 6.70 11.74
Exposure to SHS in Restaurants 71.3 1.93 1,298 2.37 0.03 3.79 67.55 75.12
Exposure to SHS on Public Transportation 27.8 3.29 361 1.94 0.12 6.45 21.40 34.30
Last cigarette purchase in grocery store 76.3 2.65 389 1.51 0.03 5.20 71.06 81.46
Last cigarette purchase in convenience store or kiosk
7.9 1.64 389 1.45 0.21 3.22 4.64 11.09
Noticed Anti-tobacco Information on radio or television
86.0 1.18 2,061 2.38 0.01 2.31 83.70 88.32
Noticed Health Warning Labels on Cigarette Packages
94.4 1.51 452 1.96 0.02 2.97 91.45 97.38
Thinking of Quitting Because of Health Warning Labels on Cigarette Package
47.4 3.11 439 1.69 0.07 6.09 41.30 53.47
Noticed Any Cigarette Advertisement or Promotion 38.1 1.85 2,048 2.98 0.05 3.63 34.46 41.72
Believes that Tobacco Smoking Causes Serious Illness
92.8 0.79 2,058 1.91 0.01 1.55 91.24 94.34
Believes that Tobacco Smoking Causes Strokes 81.7 1.36 2,061 2.53 0.02 2.66 79.02 84.34
Believes that Tobacco Smoking Causes Heart Attacks 89.3 1.03 2,061 2.27 0.01 2.01 87.31 91.33
Believes that Tobacco Smoking Causes Lung Cancer 94.0 0.66 2,063 1.60 0.01 1.30 92.66 95.26
Believes that SHS Causes Serious Illness in Non-Smokers
86.6 0.94 2,060 1.57 0.01 1.85 84.72 88.41
Number of Cigarettes Smoked per Day (by daily smokers)
14.1 0.51 410 1.43 0.04 1.00 13.06 15.05
Age at Daily Smoking Initiation 17.0 0.37 199 2.30 0.02 0.73 16.27 17.73
Monthly Expenditure on Manufactured Cigarettes 202.0 26.57 383 0.95 0.13 52.07 149.9 254.0
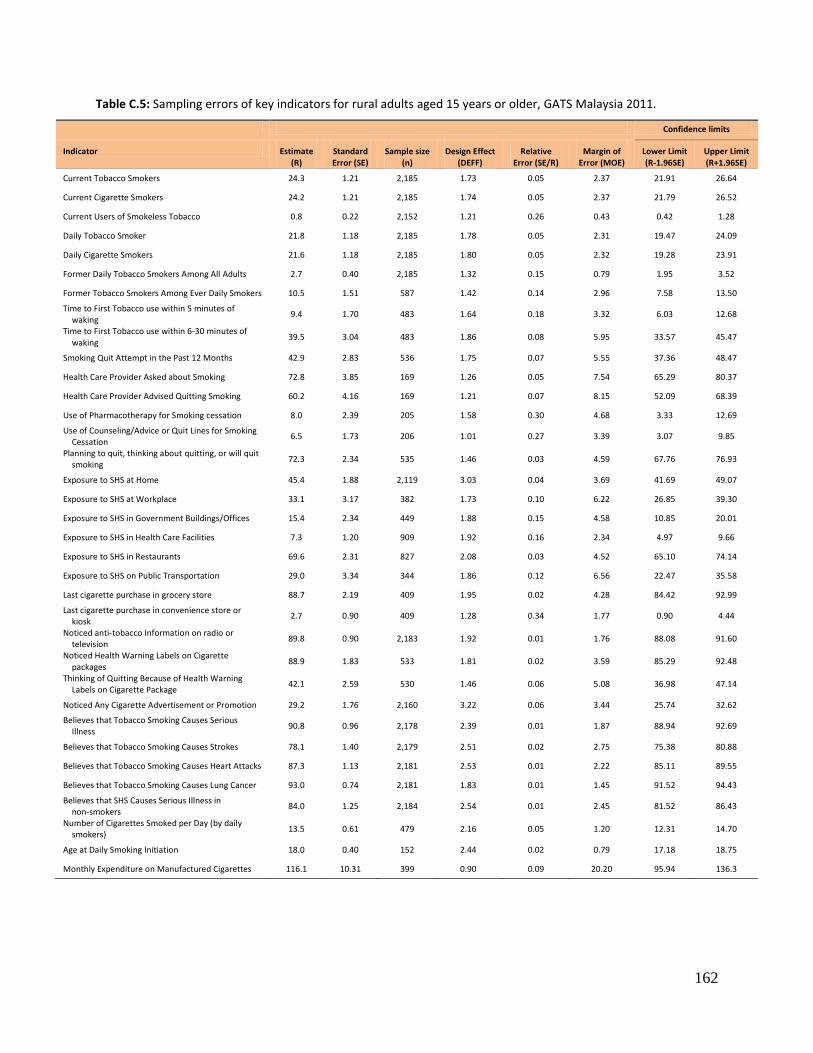
162
Table C.5: Sampling errors of key indicators for rural adults aged 15 years or older, GATS Malaysia 2011.
Confidence limits
Indicator Estimate (R)
Standard Error (SE)
Sample size (n)
Design Effect (DEFF)
Relative Error (SE/R)
Margin of Error (MOE)
Lower Limit (R-1.96SE)
Upper Limit (R+1.96SE)
Current Tobacco Smokers 24.3 1.21 2,185 1.73 0.05 2.37 21.91 26.64
Current Cigarette Smokers 24.2 1.21 2,185 1.74 0.05 2.37 21.79 26.52
Current Users of Smokeless Tobacco 0.8 0.22 2,152 1.21 0.26 0.43 0.42 1.28
Daily Tobacco Smoker 21.8 1.18 2,185 1.78 0.05 2.31 19.47 24.09
Daily Cigarette Smokers 21.6 1.18 2,185 1.80 0.05 2.32 19.28 23.91
Former Daily Tobacco Smokers Among All Adults 2.7 0.40 2,185 1.32 0.15 0.79 1.95 3.52
Former Tobacco Smokers Among Ever Daily Smokers 10.5 1.51 587 1.42 0.14 2.96 7.58 13.50
Time to First Tobacco use within 5 minutes of waking
9.4 1.70 483 1.64 0.18 3.32 6.03 12.68
Time to First Tobacco use within 6-30 minutes of waking
39.5 3.04 483 1.86 0.08 5.95 33.57 45.47
Smoking Quit Attempt in the Past 12 Months 42.9 2.83 536 1.75 0.07 5.55 37.36 48.47
Health Care Provider Asked about Smoking 72.8 3.85 169 1.26 0.05 7.54 65.29 80.37
Health Care Provider Advised Quitting Smoking 60.2 4.16 169 1.21 0.07 8.15 52.09 68.39
Use of Pharmacotherapy for Smoking cessation 8.0 2.39 205 1.58 0.30 4.68 3.33 12.69
Use of Counseling/Advice or Quit Lines for Smoking Cessation
6.5 1.73 206 1.01 0.27 3.39 3.07 9.85
Planning to quit, thinking about quitting, or will quit smoking
72.3 2.34 535 1.46 0.03 4.59 67.76 76.93
Exposure to SHS at Home 45.4 1.88 2,119 3.03 0.04 3.69 41.69 49.07
Exposure to SHS at Workplace 33.1 3.17 382 1.73 0.10 6.22 26.85 39.30
Exposure to SHS in Government Buildings/Offices 15.4 2.34 449 1.88 0.15 4.58 10.85 20.01
Exposure to SHS in Health Care Facilities 7.3 1.20 909 1.92 0.16 2.34 4.97 9.66
Exposure to SHS in Restaurants 69.6 2.31 827 2.08 0.03 4.52 65.10 74.14
Exposure to SHS on Public Transportation 29.0 3.34 344 1.86 0.12 6.56 22.47 35.58
Last cigarette purchase in grocery store 88.7 2.19 409 1.95 0.02 4.28 84.42 92.99
Last cigarette purchase in convenience store or kiosk
2.7 0.90 409 1.28 0.34 1.77 0.90 4.44
Noticed anti-tobacco Information on radio or television
89.8 0.90 2,183 1.92 0.01 1.76 88.08 91.60
Noticed Health Warning Labels on Cigarette packages
88.9 1.83 533 1.81 0.02 3.59 85.29 92.48
Thinking of Quitting Because of Health Warning Labels on Cigarette Package
42.1 2.59 530 1.46 0.06 5.08 36.98 47.14
Noticed Any Cigarette Advertisement or Promotion 29.2 1.76 2,160 3.22 0.06 3.44 25.74 32.62
Believes that Tobacco Smoking Causes Serious Illness
90.8 0.96 2,178 2.39 0.01 1.87 88.94 92.69
Believes that Tobacco Smoking Causes Strokes 78.1 1.40 2,179 2.51 0.02 2.75 75.38 80.88
Believes that Tobacco Smoking Causes Heart Attacks 87.3 1.13 2,181 2.53 0.01 2.22 85.11 89.55
Believes that Tobacco Smoking Causes Lung Cancer 93.0 0.74 2,181 1.83 0.01 1.45 91.52 94.43
Believes that SHS Causes Serious Illness in non-smokers
84.0 1.25 2,184 2.54 0.01 2.45 81.52 86.43
Number of Cigarettes Smoked per Day (by daily smokers)
13.5 0.61 479 2.16 0.05 1.20 12.31 14.70
Age at Daily Smoking Initiation 18.0 0.40 152 2.44 0.02 0.79 17.18 18.75
Monthly Expenditure on Manufactured Cigarettes 116.1 10.31 399 0.90 0.09 20.20 95.94 136.3
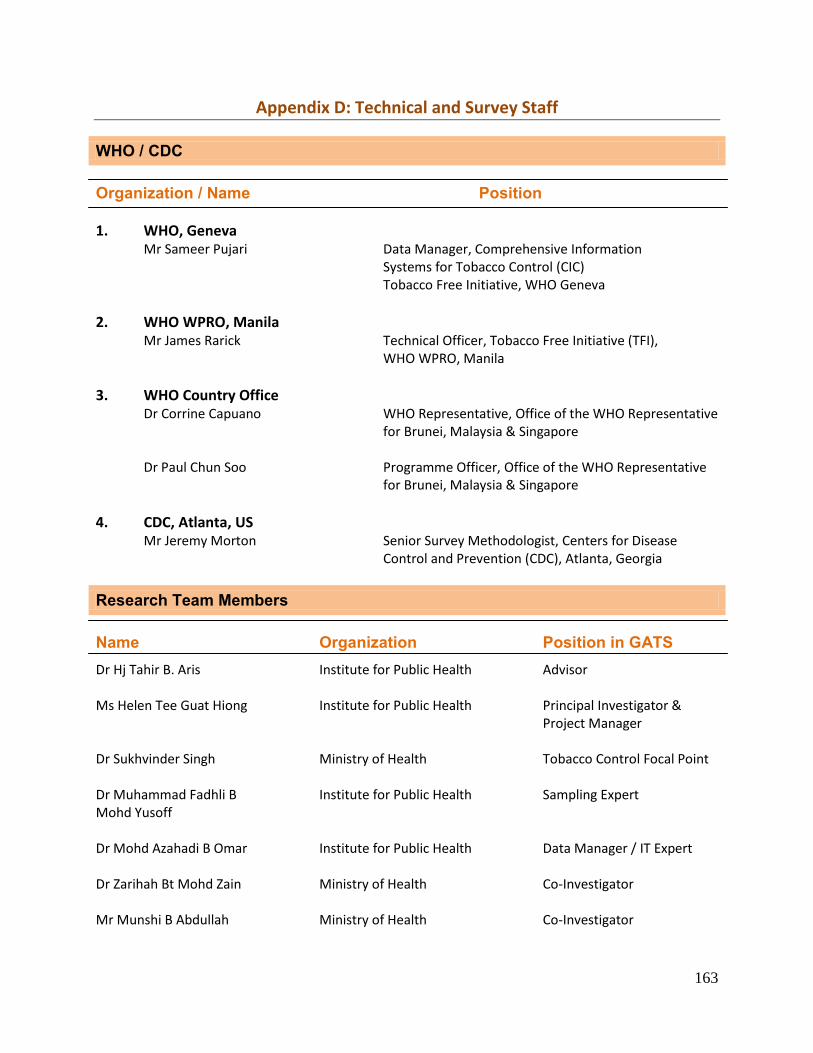
163
Appendix D: Technical and Survey Staff
WHO / CDC Organization / Name Position 1. WHO, Geneva
Mr Sameer Pujari Data Manager, Comprehensive Information Systems for Tobacco Control (CIC) Tobacco Free Initiative, WHO Geneva
2. WHO WPRO, Manila
Mr James Rarick Technical Officer, Tobacco Free Initiative (TFI), WHO WPRO, Manila
3. WHO Country Office Dr Corrine Capuano WHO Representative, Office of the WHO Representative
for Brunei, Malaysia & Singapore Dr Paul Chun Soo Programme Officer, Office of the WHO Representative
for Brunei, Malaysia & Singapore
4. CDC, Atlanta, US
Mr Jeremy Morton Senior Survey Methodologist, Centers for Disease Control and Prevention (CDC), Atlanta, Georgia
Research Team Members
Name Organization Position in GATS Dr Hj Tahir B. Aris Ms Helen Tee Guat Hiong
Institute for Public Health Institute for Public Health
Advisor Principal Investigator & Project Manager
Dr Sukhvinder Singh
Ministry of Health
Tobacco Control Focal Point
Dr Muhammad Fadhli B Mohd Yusoff
Institute for Public Health
Sampling Expert
Dr Mohd Azahadi B Omar
Institute for Public Health
Data Manager / IT Expert
Dr Zarihah Bt Mohd Zain
Ministry of Health
Co-Investigator
Mr Munshi B Abdullah
Ministry of Health
Co-Investigator
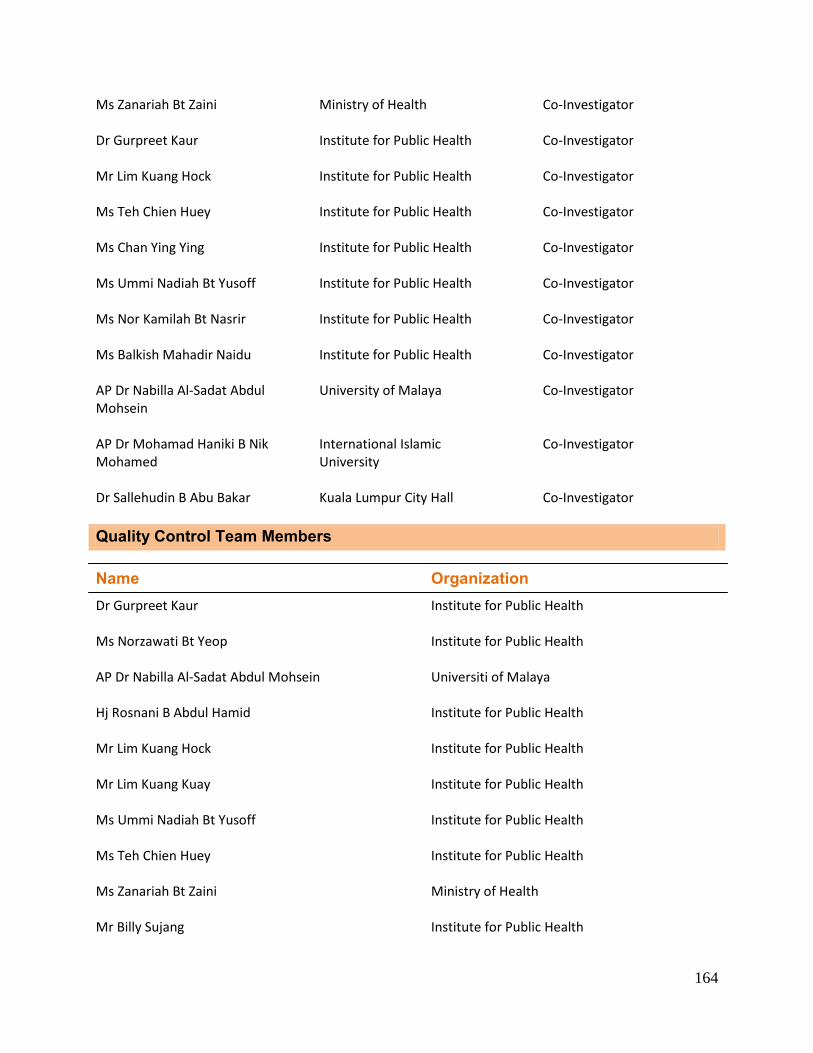
164
Ms Zanariah Bt Zaini
Ministry of Health
Co-Investigator
Dr Gurpreet Kaur Institute for Public Health Co-Investigator Mr Lim Kuang Hock
Institute for Public Health
Co-Investigator
Ms Teh Chien Huey Institute for Public Health Co-Investigator
Ms Chan Ying Ying Institute for Public Health Co-Investigator
Ms Ummi Nadiah Bt Yusoff Institute for Public Health Co-Investigator Ms Nor Kamilah Bt Nasrir Ms Balkish Mahadir Naidu
Institute for Public Health Institute for Public Health
Co-Investigator Co-Investigator
AP Dr Nabilla Al-Sadat Abdul Mohsein AP Dr Mohamad Haniki B Nik Mohamed
University of Malaya International Islamic University
Co-Investigator Co-Investigator
Dr Sallehudin B Abu Bakar
Kuala Lumpur City Hall
Co-Investigator
Quality Control Team Members Name Organization Dr Gurpreet Kaur Institute for Public Health Ms Norzawati Bt Yeop Institute for Public Health AP Dr Nabilla Al-Sadat Abdul Mohsein Universiti of Malaya Hj Rosnani B Abdul Hamid Institute for Public Health Mr Lim Kuang Hock Institute for Public Health Mr Lim Kuang Kuay Institute for Public Health Ms Ummi Nadiah Bt Yusoff Institute for Public Health Ms Teh Chien Huey Institute for Public Health Ms Zanariah Bt Zaini Ministry of Health Mr Billy Sujang Institute for Public Health
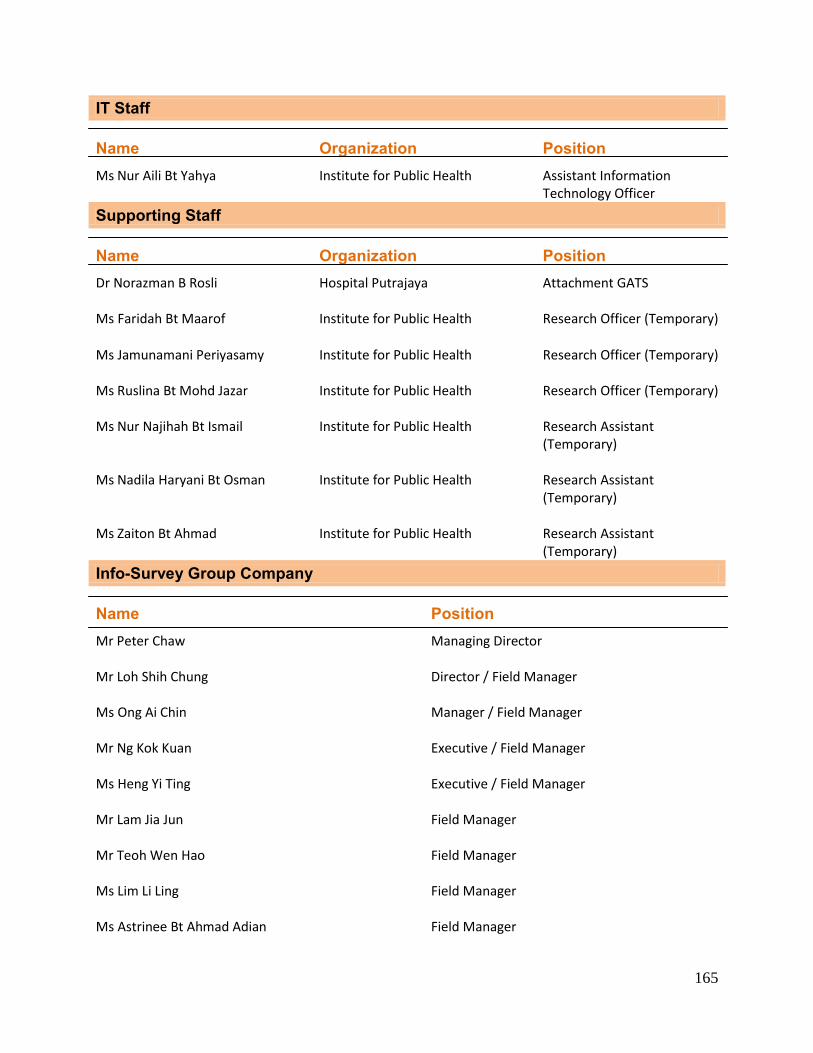
165
IT Staff Name Organization Position Ms Nur Aili Bt Yahya
Institute for Public Health
Assistant Information Technology Officer
Supporting Staff
Name Organization Position Dr Norazman B Rosli Hospital Putrajaya Attachment GATS Ms Faridah Bt Maarof Institute for Public Health Research Officer (Temporary)
Ms Jamunamani Periyasamy
Institute for Public Health
Research Officer (Temporary)
Ms Ruslina Bt Mohd Jazar Institute for Public Health Research Officer (Temporary) Ms Nur Najihah Bt Ismail
Institute for Public Health Research Assistant (Temporary)
Ms Nadila Haryani Bt Osman
Institute for Public Health Research Assistant (Temporary)
Ms Zaiton Bt Ahmad
Institute for Public Health
Research Assistant (Temporary)
Info-Survey Group Company
Name Position Mr Peter Chaw Managing Director
Mr Loh Shih Chung Director / Field Manager Ms Ong Ai Chin Manager / Field Manager
Mr Ng Kok Kuan Executive / Field Manager
Ms Heng Yi Ting Executive / Field Manager Mr Lam Jia Jun
Field Manager
Mr Teoh Wen Hao
Field Manager
Ms Lim Li Ling
Field Manager
Ms Astrinee Bt Ahmad Adian
Field Manager
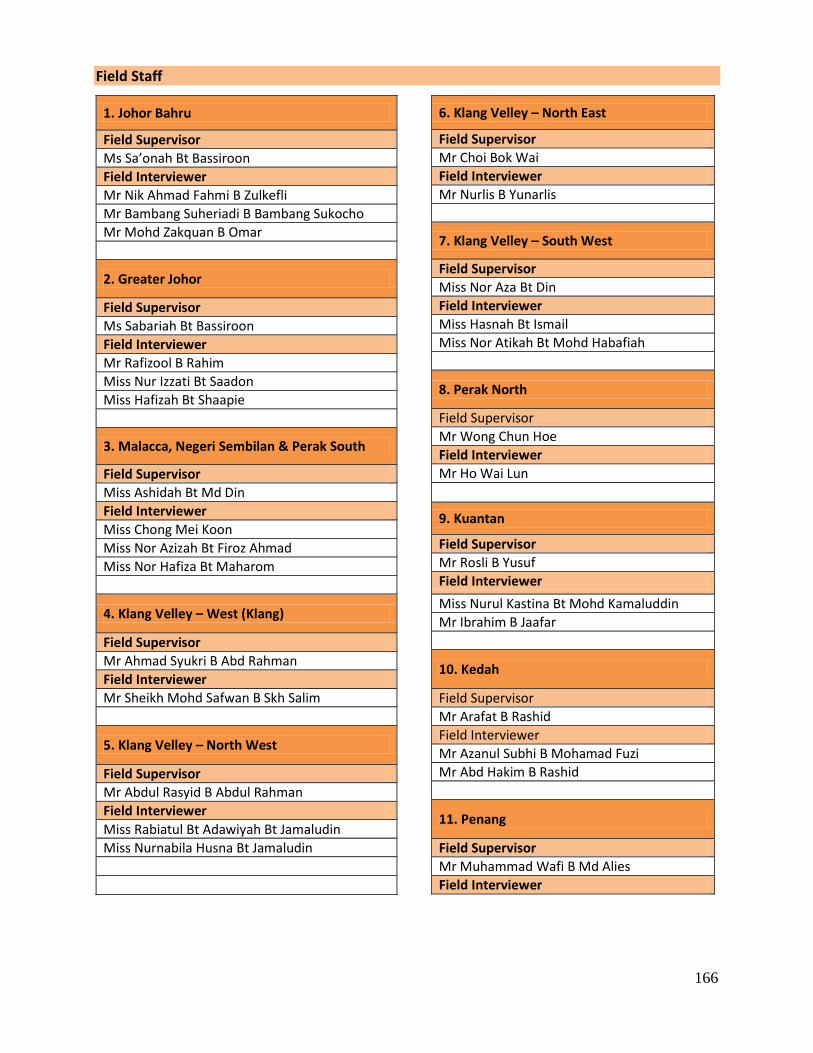
166
Field Staff
1. Johor Bahru
Field Supervisor
Ms Sa’onah Bt Bassiroon
Field Interviewer
Mr Nik Ahmad Fahmi B Zulkefli
Mr Bambang Suheriadi B Bambang Sukocho
Mr Mohd Zakquan B Omar
2. Greater Johor
Field Supervisor
Ms Sabariah Bt Bassiroon
Field Interviewer
Mr Rafizool B Rahim
Miss Nur Izzati Bt Saadon
Miss Hafizah Bt Shaapie
3. Malacca, Negeri Sembilan & Perak South
Field Supervisor
Miss Ashidah Bt Md Din
Field Interviewer
Miss Chong Mei Koon
Miss Nor Azizah Bt Firoz Ahmad
Miss Nor Hafiza Bt Maharom
4. Klang Velley – West (Klang)
Field Supervisor
Mr Ahmad Syukri B Abd Rahman
Field Interviewer
Mr Sheikh Mohd Safwan B Skh Salim
5. Klang Velley – North West
Field Supervisor
Mr Abdul Rasyid B Abdul Rahman
Field Interviewer
Miss Rabiatul Bt Adawiyah Bt Jamaludin
Miss Nurnabila Husna Bt Jamaludin
6. Klang Velley – North East
Field Supervisor
Mr Choi Bok Wai
Field Interviewer
Mr Nurlis B Yunarlis
7. Klang Velley – South West
Field Supervisor
Miss Nor Aza Bt Din
Field Interviewer
Miss Hasnah Bt Ismail
Miss Nor Atikah Bt Mohd Habafiah
8. Perak North
Field Supervisor
Mr Wong Chun Hoe
Field Interviewer
Mr Ho Wai Lun
9. Kuantan
Field Supervisor
Mr Rosli B Yusuf
Field Interviewer
Miss Nurul Kastina Bt Mohd Kamaluddin
Mr Ibrahim B Jaafar
10. Kedah
Field Supervisor
Mr Arafat B Rashid
Field Interviewer
Mr Azanul Subhi B Mohamad Fuzi
Mr Abd Hakim B Rashid
11. Penang
Field Supervisor
Mr Muhammad Wafi B Md Alies
Field Interviewer
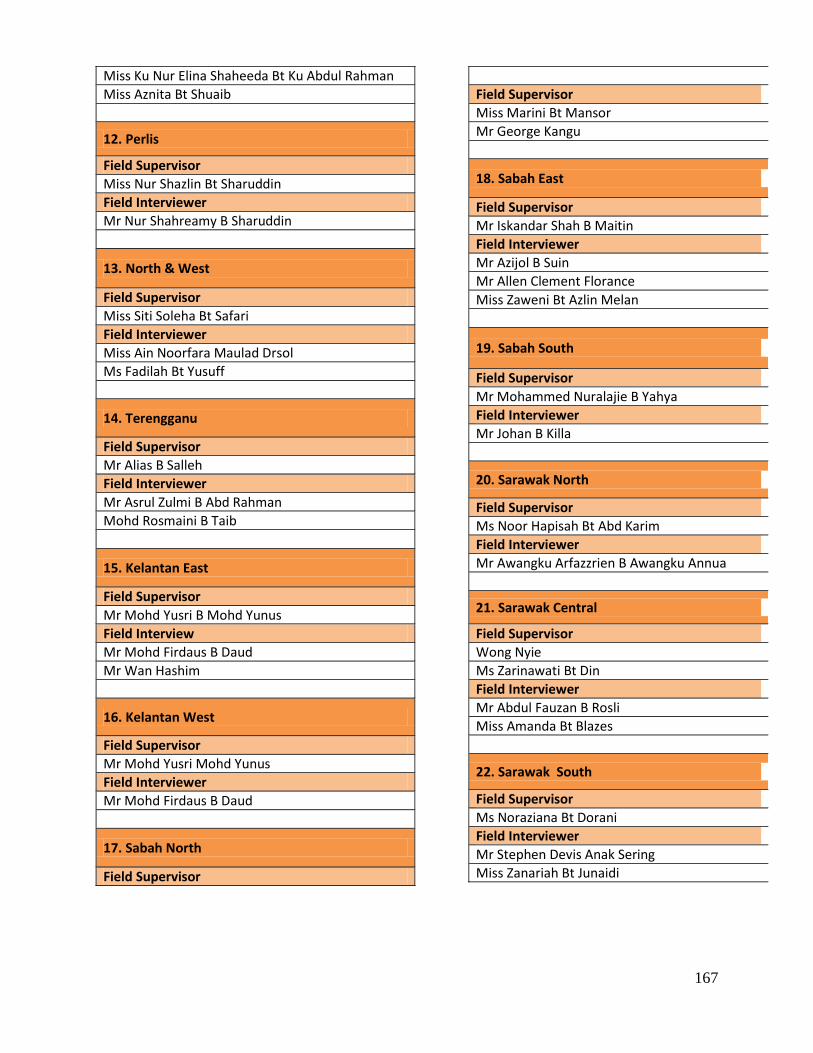
167
Miss Ku Nur Elina Shaheeda Bt Ku Abdul Rahman
Miss Aznita Bt Shuaib
12. Perlis
Field Supervisor
Miss Nur Shazlin Bt Sharuddin
Field Interviewer
Mr Nur Shahreamy B Sharuddin
13. North & West
Field Supervisor
Miss Siti Soleha Bt Safari
Field Interviewer
Miss Ain Noorfara Maulad Drsol
Ms Fadilah Bt Yusuff
14. Terengganu
Field Supervisor
Mr Alias B Salleh
Field Interviewer
Mr Asrul Zulmi B Abd Rahman
Mohd Rosmaini B Taib
15. Kelantan East
Field Supervisor
Mr Mohd Yusri B Mohd Yunus
Field Interview
Mr Mohd Firdaus B Daud
Mr Wan Hashim
16. Kelantan West
Field Supervisor
Mr Mohd Yusri Mohd Yunus
Field Interviewer
Mr Mohd Firdaus B Daud
17. Sabah North
Field Supervisor
Field Supervisor
Miss Marini Bt Mansor
Mr George Kangu
18. Sabah East
Field Supervisor
Mr Iskandar Shah B Maitin
Field Interviewer
Mr Azijol B Suin
Mr Allen Clement Florance
Miss Zaweni Bt Azlin Melan
19. Sabah South
Field Supervisor
Mr Mohammed Nuralajie B Yahya
Field Interviewer
Mr Johan B Killa
20. Sarawak North
Field Supervisor
Ms Noor Hapisah Bt Abd Karim
Field Interviewer
Mr Awangku Arfazzrien B Awangku Annua
21. Sarawak Central
Field Supervisor
Wong Nyie
Ms Zarinawati Bt Din
Field Interviewer
Mr Abdul Fauzan B Rosli
Miss Amanda Bt Blazes
22. Sarawak South
Field Supervisor
Ms Noraziana Bt Dorani
Field Interviewer
Mr Stephen Devis Anak Sering
Miss Zanariah Bt Junaidi
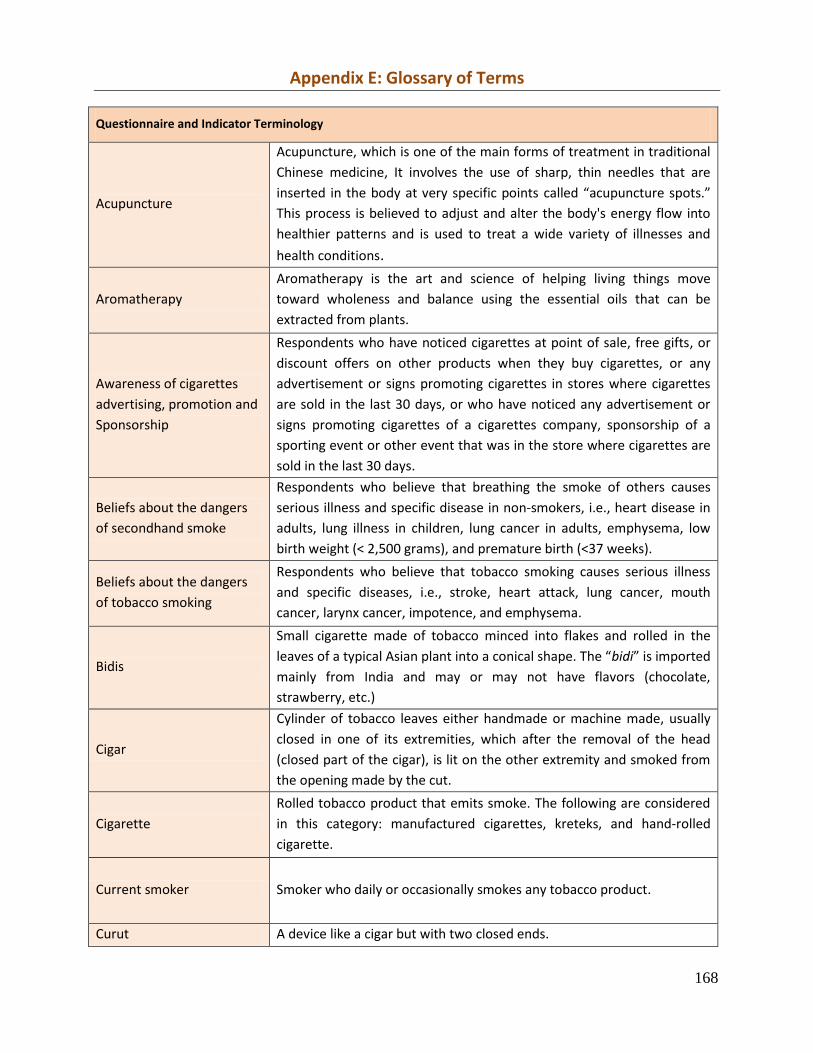
168
Appendix E: Glossary of Terms
Questionnaire and Indicator Terminology
Acupuncture
Acupuncture, which is one of the main forms of treatment in traditional
Chinese medicine, It involves the use of sharp, thin needles that are
inserted in the body at very specific points called “acupuncture spots.”
This process is believed to adjust and alter the body's energy flow into
healthier patterns and is used to treat a wide variety of illnesses and
health conditions.
Aromatherapy
Aromatherapy is the art and science of helping living things move
toward wholeness and balance using the essential oils that can be
extracted from plants.
Awareness of cigarettes
advertising, promotion and
Sponsorship
Respondents who have noticed cigarettes at point of sale, free gifts, or
discount offers on other products when they buy cigarettes, or any
advertisement or signs promoting cigarettes in stores where cigarettes
are sold in the last 30 days, or who have noticed any advertisement or
signs promoting cigarettes of a cigarettes company, sponsorship of a
sporting event or other event that was in the store where cigarettes are
sold in the last 30 days.
Beliefs about the dangers
of secondhand smoke
Respondents who believe that breathing the smoke of others causes
serious illness and specific disease in non‐smokers, i.e., heart disease in
adults, lung illness in children, lung cancer in adults, emphysema, low
birth weight (< 2,500 grams), and premature birth (<37 weeks).
Beliefs about the dangers
of tobacco smoking
Respondents who believe that tobacco smoking causes serious illness
and specific diseases, i.e., stroke, heart attack, lung cancer, mouth
cancer, larynx cancer, impotence, and emphysema.
Bidis
Small cigarette made of tobacco minced into flakes and rolled in the
leaves of a typical Asian plant into a conical shape. The “bidi” is imported
mainly from India and may or may not have flavors (chocolate,
strawberry, etc.)
Cigar
Cylinder of tobacco leaves either handmade or machine made, usually
closed in one of its extremities, which after the removal of the head
(closed part of the cigar), is lit on the other extremity and smoked from
the opening made by the cut.
Cigarette
Rolled tobacco product that emits smoke. The following are considered
in this category: manufactured cigarettes, kreteks, and hand-rolled
cigarette.
Current smoker Smoker who daily or occasionally smokes any tobacco product.
Curut A device like a cigar but with two closed ends.
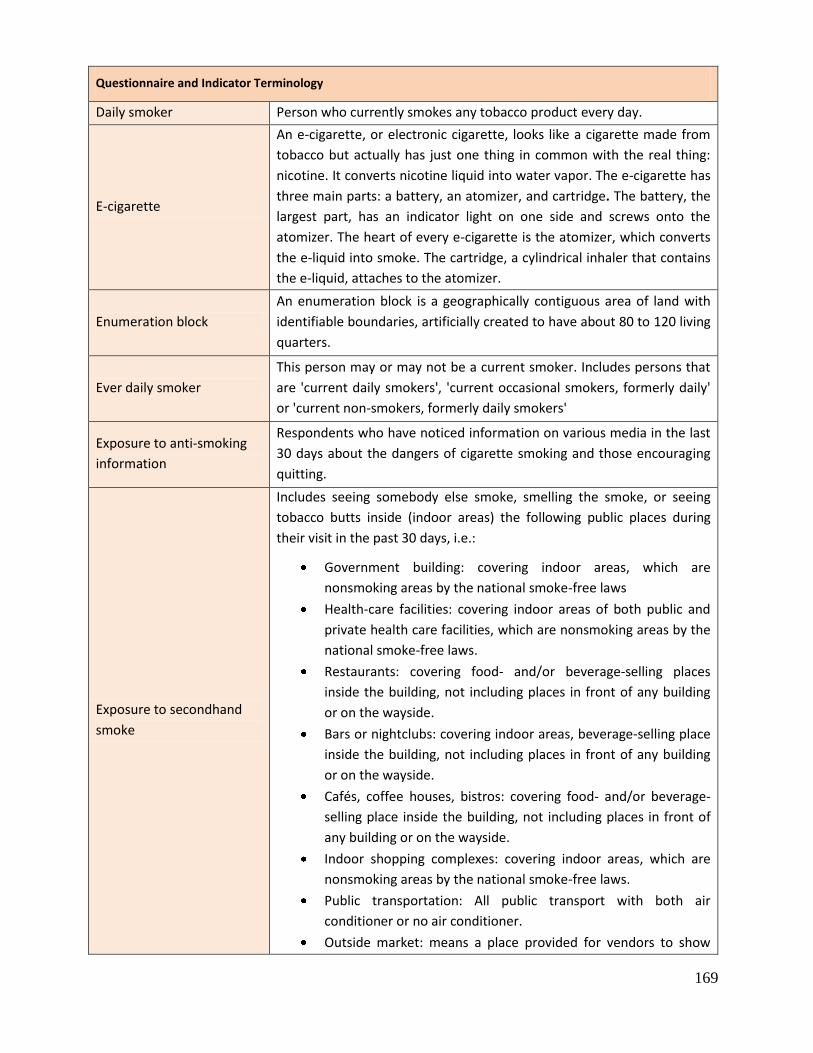
169
Questionnaire and Indicator Terminology
Daily smoker Person who currently smokes any tobacco product every day.
E-cigarette
An e-cigarette, or electronic cigarette, looks like a cigarette made from
tobacco but actually has just one thing in common with the real thing:
nicotine. It converts nicotine liquid into water vapor. The e-cigarette has
three main parts: a battery, an atomizer, and cartridge. The battery, the
largest part, has an indicator light on one side and screws onto the
atomizer. The heart of every e-cigarette is the atomizer, which converts
the e-liquid into smoke. The cartridge, a cylindrical inhaler that contains
the e-liquid, attaches to the atomizer.
Enumeration block
An enumeration block is a geographically contiguous area of land with
identifiable boundaries, artificially created to have about 80 to 120 living
quarters.
Ever daily smoker
This person may or may not be a current smoker. Includes persons that
are 'current daily smokers', 'current occasional smokers, formerly daily'
or 'current non-smokers, formerly daily smokers'
Exposure to anti-smoking
information
Respondents who have noticed information on various media in the last
30 days about the dangers of cigarette smoking and those encouraging
quitting.
Exposure to secondhand
smoke
Includes seeing somebody else smoke, smelling the smoke, or seeing
tobacco butts inside (indoor areas) the following public places during
their visit in the past 30 days, i.e.:
Government building: covering indoor areas, which are
nonsmoking areas by the national smoke-free laws
Health-care facilities: covering indoor areas of both public and
private health care facilities, which are nonsmoking areas by the
national smoke-free laws.
Restaurants: covering food- and/or beverage-selling places
inside the building, not including places in front of any building
or on the wayside.
Bars or nightclubs: covering indoor areas, beverage-selling place
inside the building, not including places in front of any building
or on the wayside.
Cafés, coffee houses, bistros: covering food- and/or beverage-
selling place inside the building, not including places in front of
any building or on the wayside.
Indoor shopping complexes: covering indoor areas, which are
nonsmoking areas by the national smoke-free laws.
Public transportation: All public transport with both air
conditioner or no air conditioner.
Outside market: means a place provided for vendors to show
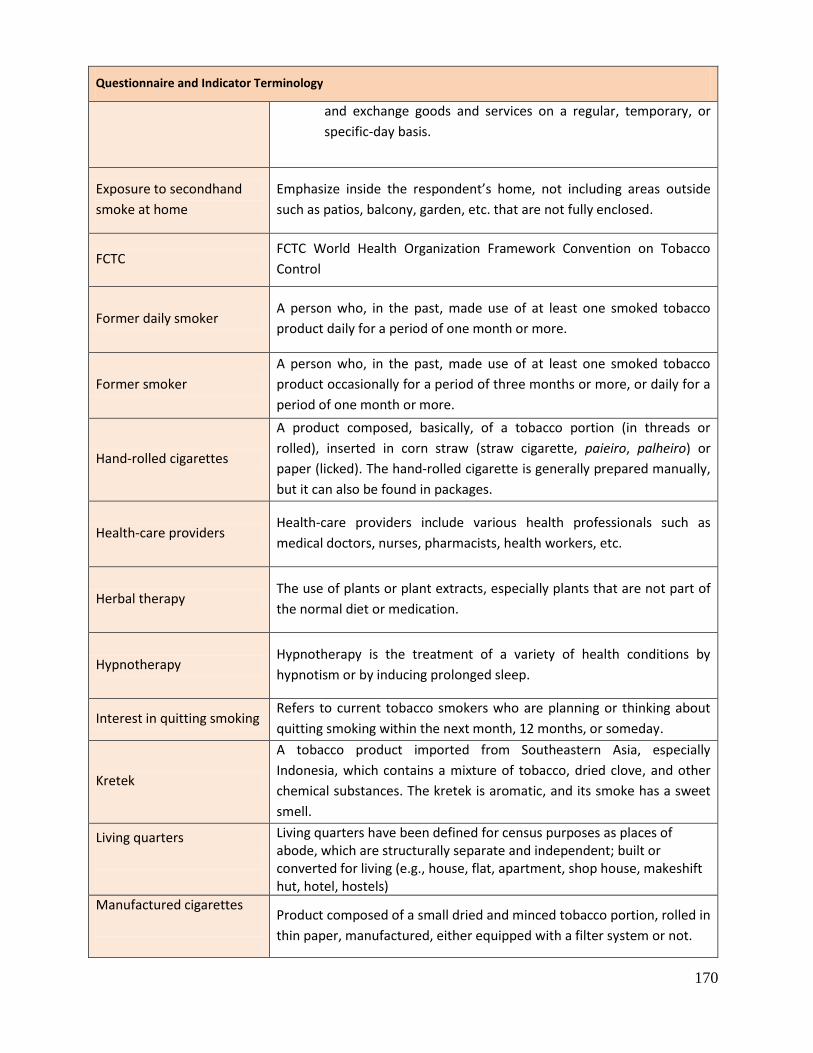
170
Questionnaire and Indicator Terminology
and exchange goods and services on a regular, temporary, or
specific‐day basis.
Exposure to secondhand
smoke at home
Emphasize inside the respondent’s home, not including areas outside
such as patios, balcony, garden, etc. that are not fully enclosed.
FCTC FCTC World Health Organization Framework Convention on Tobacco
Control
Former daily smoker A person who, in the past, made use of at least one smoked tobacco
product daily for a period of one month or more.
Former smoker
A person who, in the past, made use of at least one smoked tobacco
product occasionally for a period of three months or more, or daily for a
period of one month or more.
Hand‐rolled cigarettes
A product composed, basically, of a tobacco portion (in threads or
rolled), inserted in corn straw (straw cigarette, paieiro, palheiro) or
paper (licked). The hand-rolled cigarette is generally prepared manually,
but it can also be found in packages.
Health-care providers Health-care providers include various health professionals such as
medical doctors, nurses, pharmacists, health workers, etc.
Herbal therapy The use of plants or plant extracts, especially plants that are not part of
the normal diet or medication.
Hypnotherapy Hypnotherapy is the treatment of a variety of health conditions by
hypnotism or by inducing prolonged sleep.
Interest in quitting smoking Refers to current tobacco smokers who are planning or thinking about
quitting smoking within the next month, 12 months, or someday.
Kretek
A tobacco product imported from Southeastern Asia, especially
Indonesia, which contains a mixture of tobacco, dried clove, and other
chemical substances. The kretek is aromatic, and its smoke has a sweet
smell.
Living quarters
Living quarters have been defined for census purposes as places of abode, which are structurally separate and independent; built or converted for living (e.g., house, flat, apartment, shop house, makeshift hut, hotel, hostels)
Manufactured cigarettes
Product composed of a small dried and minced tobacco portion, rolled in
thin paper, manufactured, either equipped with a filter system or not.
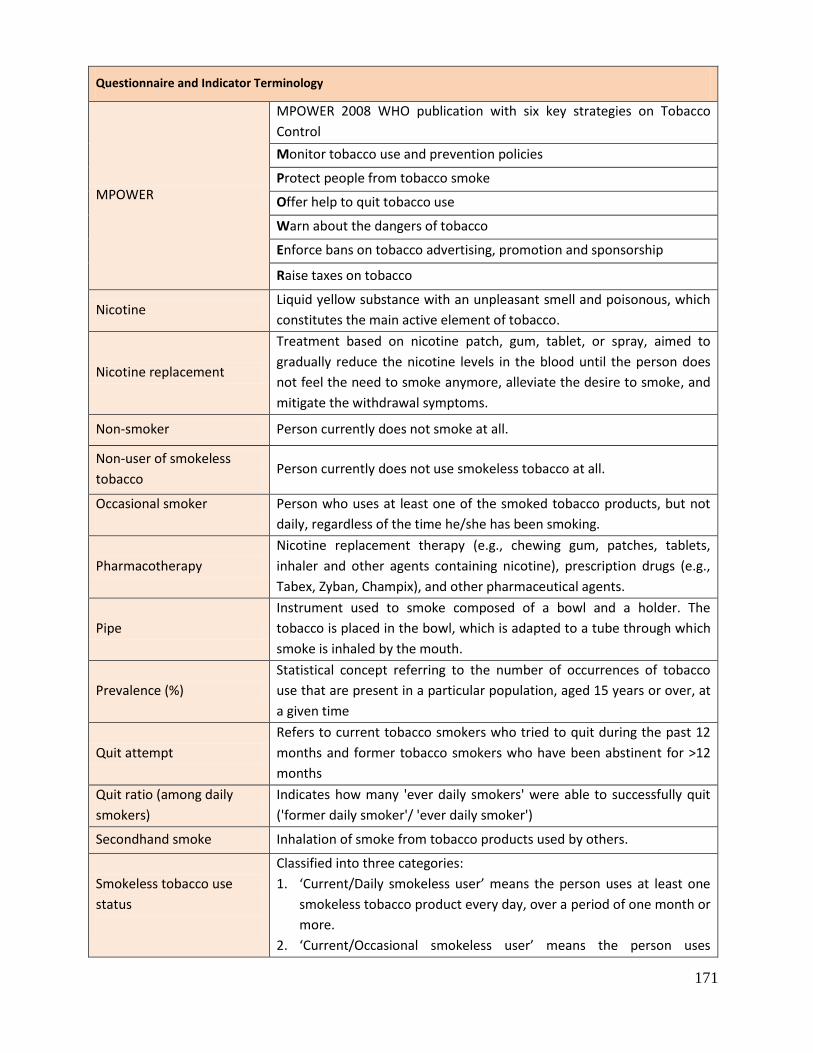
171
Questionnaire and Indicator Terminology
MPOWER
MPOWER 2008 WHO publication with six key strategies on Tobacco
Control
Monitor tobacco use and prevention policies
Protect people from tobacco smoke
Offer help to quit tobacco use
Warn about the dangers of tobacco
Enforce bans on tobacco advertising, promotion and sponsorship
Raise taxes on tobacco
Nicotine Liquid yellow substance with an unpleasant smell and poisonous, which
constitutes the main active element of tobacco.
Nicotine replacement
Treatment based on nicotine patch, gum, tablet, or spray, aimed to
gradually reduce the nicotine levels in the blood until the person does
not feel the need to smoke anymore, alleviate the desire to smoke, and
mitigate the withdrawal symptoms.
Non-smoker Person currently does not smoke at all.
Non-user of smokeless
tobacco Person currently does not use smokeless tobacco at all.
Occasional smoker
Person who uses at least one of the smoked tobacco products, but not
daily, regardless of the time he/she has been smoking.
Pharmacotherapy
Nicotine replacement therapy (e.g., chewing gum, patches, tablets,
inhaler and other agents containing nicotine), prescription drugs (e.g.,
Tabex, Zyban, Champix), and other pharmaceutical agents.
Pipe
Instrument used to smoke composed of a bowl and a holder. The
tobacco is placed in the bowl, which is adapted to a tube through which
smoke is inhaled by the mouth.
Prevalence (%)
Statistical concept referring to the number of occurrences of tobacco
use that are present in a particular population, aged 15 years or over, at
a given time
Quit attempt
Refers to current tobacco smokers who tried to quit during the past 12
months and former tobacco smokers who have been abstinent for >12
months
Quit ratio (among daily
smokers)
Indicates how many 'ever daily smokers' were able to successfully quit
('former daily smoker'/ 'ever daily smoker')
Secondhand smoke Inhalation of smoke from tobacco products used by others.
Smokeless tobacco use
status
Classified into three categories:
1. ‘Current/Daily smokeless user’ means the person uses at least one
smokeless tobacco product every day, over a period of one month or
more.
2. ‘Current/Occasional smokeless user’ means the person uses
172
Questionnaire and Indicator Terminology
smokeless tobacco products less than daily (either formerly daily or
never daily).
3. ‘Non-smokeless tobacco user’ means the person currently does not
use smokeless tobacco at all. This includes ‘Former daily user’ and
‘Never daily user’.
Smokeless tobacco user
Person who uses any smokeless tobacco product.
Smoking cessation Smoking cessation or quitting smoking is a process of discontinuing the
practice of inhaling a smoked substance.
Smoking status / smoking
frequency
Classified into three categories:
1. ‘Current/Daily smoker’ means the person currently smokes at least
one tobacco product every day, over a period of one month or more.
2. ‘Current/Occasional smoker’ means the person currently smokes less
than daily (either formerly daily or never daily).
3 ‘Non-smoker’ means the person currently does not smoke at all. This
includes ‘Former daily smoker’ (currently a non-smoker but had
previously smoked daily) and ‘Never daily smoker’ (currently a non-
smoker and has never smoked daily, but instead occasionally or a
never smoker).
Snuff (by mouth)
Tobacco product presented as powder, moistened, placed between the
gum and the upper lip and kept there for a period of time that may vary
from a few minutes to several hours. The most commonly found form is
the snuff in portions, prepackaged in little tea sacks, sold in little plastic
cans, but the product can also be found without prepackage. In this
case, the user gets a “pinch” and places it directly in contact with the
gum.
Snuff (by nose) Tobacco product presented in powder or grains, especially prepared to
be inhaled.
Thinking of quitting
because of pictorial health
warning on cigarettes
package
Current tobacco smokers who thought about quitting smoking in the last
30 days because of the pictorial health warning on cigarettes or
shredded tobacco package
Tobacco
Common name given to the plants of the genus Nicotiana, especially the
Nicotiana tabacum from South America, from which the substance
called nicotine is extracted.
Tobacco products
Two types of tobacco products:
1. Smoked tobacco: manufactured cigarettes, hand‐rolled cigarettes,
kreteks, others smoked tobacco such as pipe, curut / cigar /
cigarillos, water pipes/shisha/ hookah, bidis/ and others
2. Smokeless tobacco: snuff by keeping in mouth/nose, chewing
tobacco, betel quid with tobacco, electronic cigarettes, and others.
173
Questionnaire and Indicator Terminology
Water pipes /shisha /
hookah
Hubble-bubble or narghile. It has been used uniformly unless where
anecdotes and historical records are mentioned. The hookah is an Indian
water pipe. A type of pipe often used by Hindu, Persian, and Turkish
individuals, comprised of a pipe bowl, a long tube, and a small receptacle
containing aromatic water, through which smoke passes before getting
to the mouth. For being smoked by one person alone or a group of
individuals, being prepared with a special mixture of tobacco, sugar-cane
syrup, and fruit or seasoning.
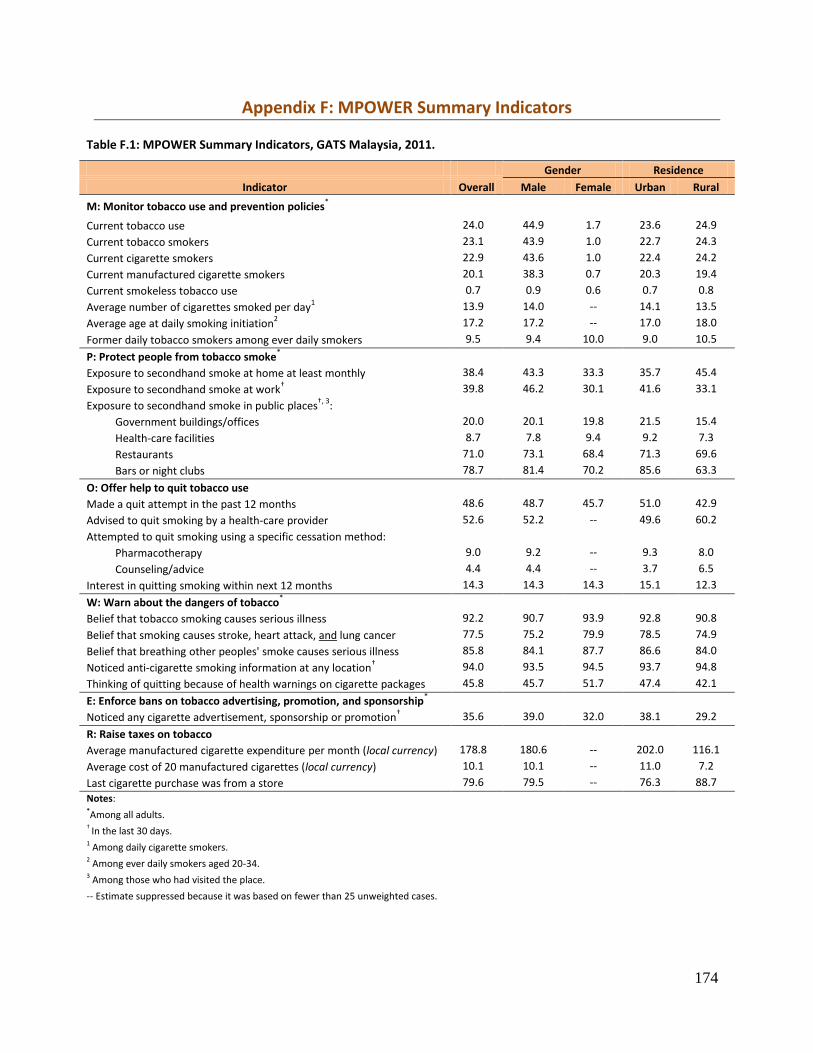
174
Appendix F: MPOWER Summary Indicators
Table F.1: MPOWER Summary Indicators, GATS Malaysia, 2011.
Gender Residence
Indicator Overall Male Female Urban Rural
M: Monitor tobacco use and prevention policies*
Current tobacco use 24.0 44.9 1.7 23.6 24.9
Current tobacco smokers 23.1 43.9 1.0 22.7 24.3
Current cigarette smokers 22.9 43.6 1.0 22.4 24.2
Current manufactured cigarette smokers 20.1 38.3 0.7 20.3 19.4
Current smokeless tobacco use 0.7 0.9 0.6 0.7 0.8
Average number of cigarettes smoked per day1 13.9 14.0 -- 14.1 13.5
Average age at daily smoking initiation2 17.2 17.2 -- 17.0 18.0
Former daily tobacco smokers among ever daily smokers 9.5 9.4 10.0 9.0 10.5
P: Protect people from tobacco smoke*
Exposure to secondhand smoke at home at least monthly 38.4 43.3 33.3 35.7 45.4
Exposure to secondhand smoke at work† 39.8 46.2 30.1 41.6 33.1
Exposure to secondhand smoke in public places†, 3
:
Government buildings/offices 20.0 20.1 19.8 21.5 15.4
Health-care facilities 8.7 7.8 9.4 9.2 7.3
Restaurants 71.0 73.1 68.4 71.3 69.6
Bars or night clubs 78.7 81.4 70.2 85.6 63.3
O: Offer help to quit tobacco use
Made a quit attempt in the past 12 months 48.6 48.7 45.7 51.0 42.9
Advised to quit smoking by a health-care provider 52.6 52.2 -- 49.6 60.2
Attempted to quit smoking using a specific cessation method:
Pharmacotherapy 9.0 9.2 -- 9.3 8.0
Counseling/advice 4.4 4.4 -- 3.7 6.5
Interest in quitting smoking within next 12 months 14.3 14.3 14.3 15.1 12.3
W: Warn about the dangers of tobacco*
Belief that tobacco smoking causes serious illness 92.2 90.7 93.9 92.8 90.8
Belief that smoking causes stroke, heart attack, and lung cancer 77.5 75.2 79.9 78.5 74.9
Belief that breathing other peoples' smoke causes serious illness 85.8 84.1 87.7 86.6 84.0
Noticed anti-cigarette smoking information at any location† 94.0 93.5 94.5 93.7 94.8
Thinking of quitting because of health warnings on cigarette packages 45.8 45.7 51.7 47.4 42.1
E: Enforce bans on tobacco advertising, promotion, and sponsorship*
Noticed any cigarette advertisement, sponsorship or promotion† 35.6 39.0 32.0 38.1 29.2
R: Raise taxes on tobacco
Average manufactured cigarette expenditure per month (local currency) 178.8 180.6 -- 202.0 116.1
Average cost of 20 manufactured cigarettes (local currency) 10.1 10.1 -- 11.0 7.2
Last cigarette purchase was from a store 79.6 79.5 -- 76.3 88.7
Notes: *Among all adults. † In the last 30 days. 1 Among daily cigarette smokers. 2 Among ever daily smokers aged 20-34. 3 Among those who had visited the place.
-- Estimate suppressed because it was based on fewer than 25 unweighted cases.