Embed Size (px)
Citation preview

GIS Modelling for Mineral Prosperity,
Can Data Speak Them Selves?
by
HARMAN SETYADI
Mine Engineering Program, Faculty of Mine and Petroleum Engineering
Institute Technology Bandung
November 2014

Background
Mineral Exploration is a high risk and uncertain business and prone to fluctuation of the metal price.
exploration decision commonly is taken only based on the qualitative interpretation based on partial information rather than quantitative analysis.
How to reduce the exploration risk and to imrpove the disovery rate?.
Mineral exploration model with quaintitative analysis and GIS technology was designed to improve the exploration risk and accelerate the discovery rate.
Exploration properity model commonly is designed on the Reconnaissance/ to find stage.
Another exploration stage which is high cost and uncertainty is on the drilling project.
How is the GIS modelling for mineral properity work on this stage?

Prosperity Modelling Approach
Data Driven :
(Pros) Quantitative, Objective, consistent, based on the designed formula.
Fuzzy Logic : score 0 – 1 in every anomaly class,
Binary – tertiary : true or false,
Weight of Evidence (WofE)
Data mining, mathematical approach
(Cons): Not all of anomaly is Lanier, in the one of prospect area should be occurs some different ore deposit.
In general use to indicate the ore deposit which have similar type and its anomaly.
Knowledge Driven:
Subjective, based on the expert judgment, not consistent. Based on the expert experiences and knowledge.
Need more time
Commonly use over the area with limited ore deposit discovered.

Exploration Stages
GIS modelling for
Mineral Properity
commonly uses on
the Recconaissance
& Prospecting
Could the Model
uses on this stages?
Need quicker
decision,
More costly,
Sub surface Target -
uncertainty

Contoh Model Prospeksi Endpan Mineral
Peneletian dengan menggunakan data regional, untuk
menemukan potensi endapan berdasarkan tambang yang
sudah diketemukan.
Domain geologi diabaikan, keberadaan lokasi tambang tidak
seslalu pada kelas tertinggi
Model Prospek Au-Cu porfiri di Iran dengan metoda
Interval Valued Fuzzy, Rad, dkk (2011)
Model Prospek Au di Gold Field, Australia dengan
metoda Stastitical Data Mining, Barnett, dkk (2006)

Case Study: Seruyung & Bakan

J. Resources is the Junior Mine company, which is very agresive the
ore reserve discovery is almost double from 2012 to 2014.

Assumption
Gold deposit concentration is very low (<10 gr/ton),
not able to indicate directly. No contrast physical
properties
Gold Ore deposit has correlation with the physical
properties (magnetic, resistivity, induction) which is
controlled by the mineralization type.
Gold ore deposit is controlled by the geological
processes and generate the distinctive anomaly
signatures.
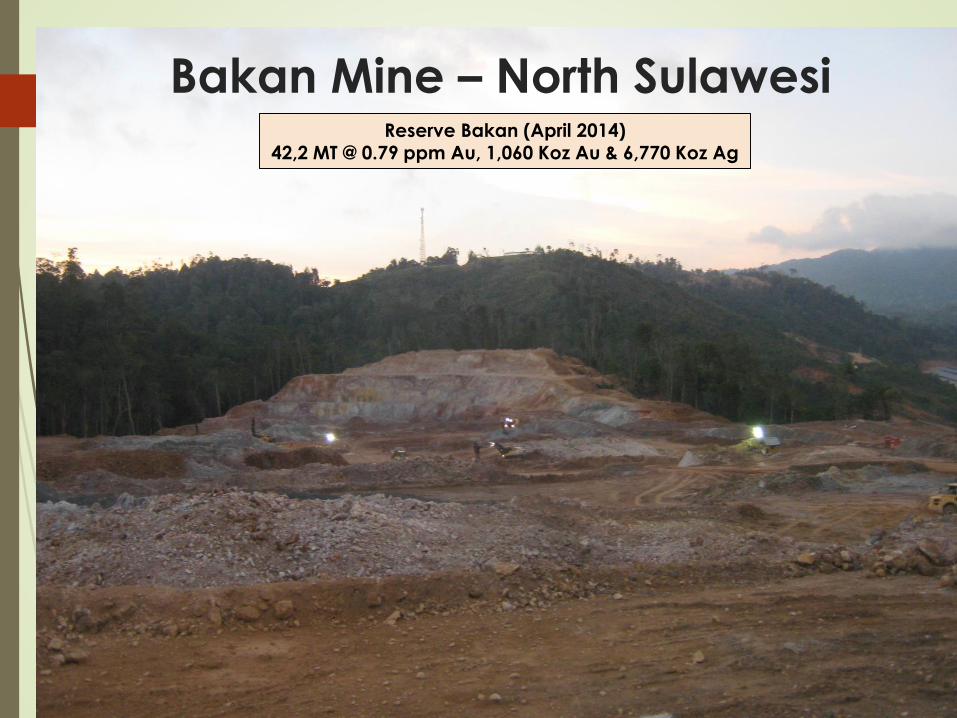
Bakan Mine – North SulawesiReserve Bakan (April 2014)
42,2 MT @ 0.79 ppm Au, 1,060 Koz Au & 6,770 Koz Ag

High Sulphidation Au deposit, multiple site. Oxide ore


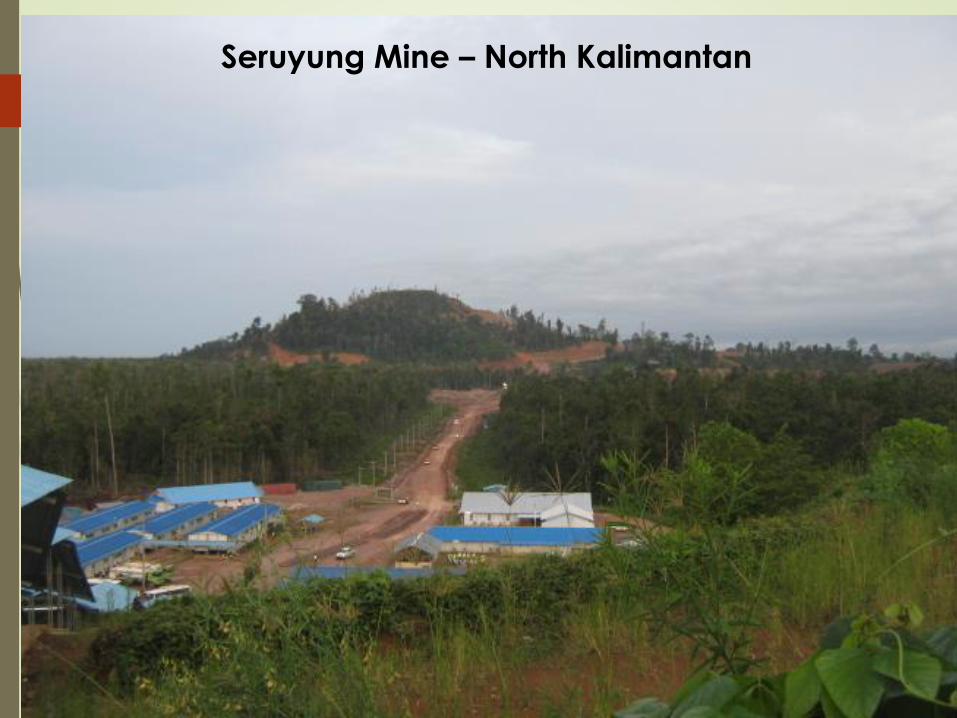
Seruyung Mine – North Kalimantan

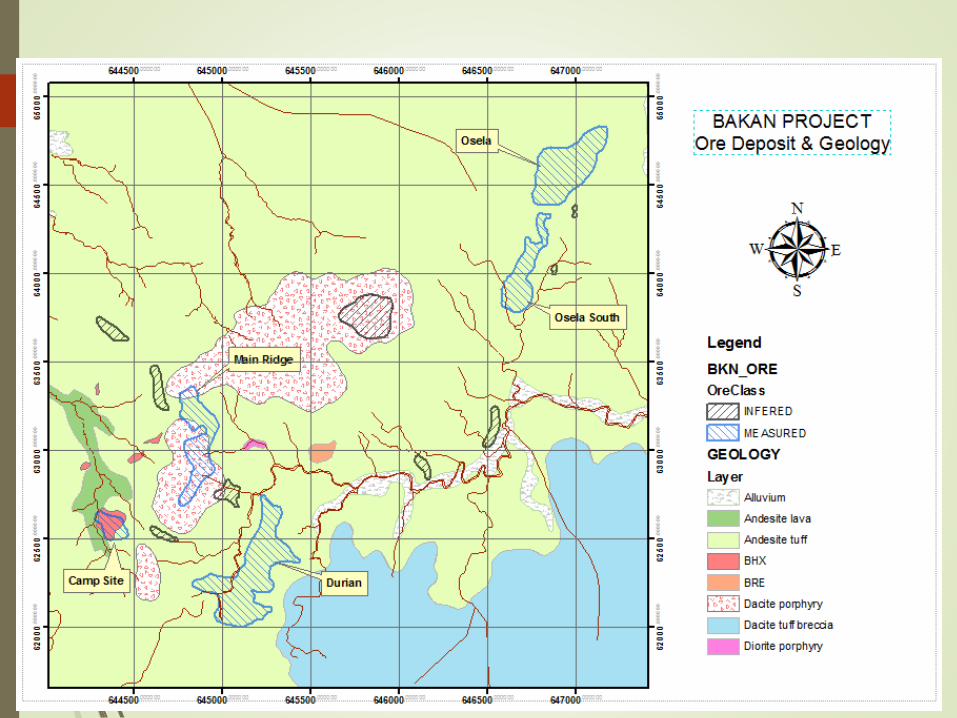
No directly corelate with specific Lithology Mapped

Ore Body is related to the low RTP anomaly but not all RTP is ore body

Ore Body is related to the high Resistivity anomaly but not as Linier
corelation

Ore Body is related to the IP – Chargebility anomaly but not as Linier
corelation

Ore Body is related to the high Soil anomaly but not all anomaly is ore
body and part of ore body is not represented by Soil Au Anomaly

Soil Anomaly Statistics

Soil Anomaly – What Element Indicators?

Geology Domain
• Memerlukan Pemahan geology yang matang (knowledge driven).
• Kombinasi feature geologi, geokimia, geofisika,
• Menggambarkan Genesa dan kedudukan endapan mineral

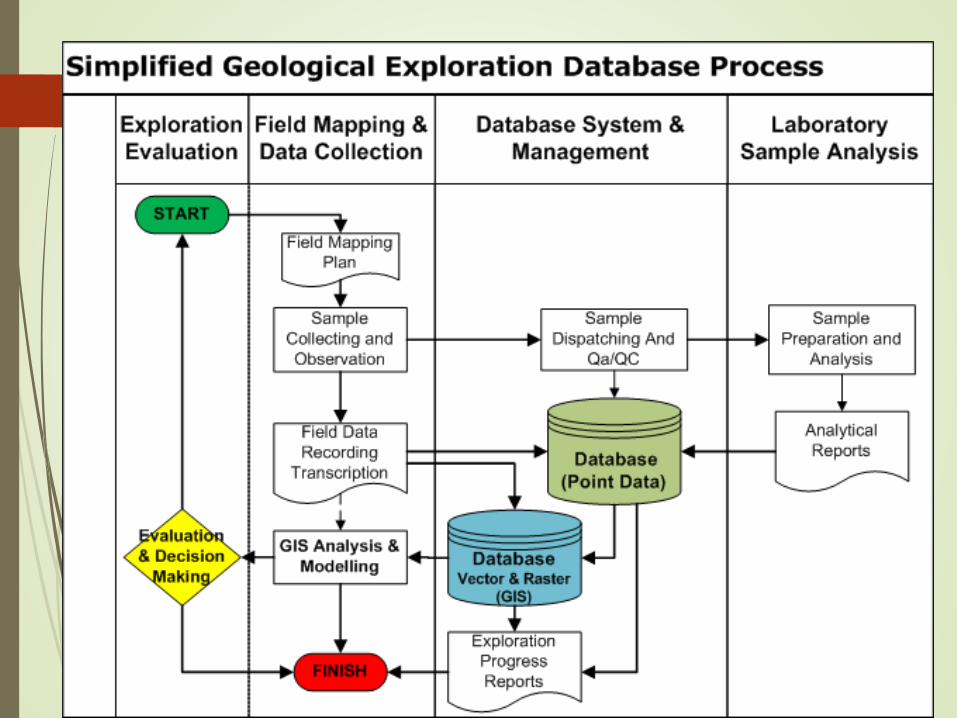
Exploration & Mine Data Hierarchy
Data Visualization
2D, 3D GIS Analysis and Modeling
System Management & QA
Validation, Consolidation, Integration, Data Warehouse –Data knowledge, Processing -
Gridding
Data Source Administration
Field Data Gathering: type of data required, data density, data orientation
Decision
Making

CONCLUSION
On the detailed project for drilling, Data cannot
uses directly for GIS modelling. Realized only on
the data model will miss leading.
Understanding the spatial anomaly signature and
its correlation to the geological model is very
important.
Geological Domain is required to optimize the
Mineral Prosperity GIS model.
However the data driven also important to
understanding of the relationalship of anomaly,
especially for the geochemical multielement
data.

Terima kasih
Thank You
Syukron