Embed Size (px)
Citation preview
County of Los Angeles
GIS Case StudiesEnterprise Geographic Information Systems (GIS)
Enterprise GIS Steering Committee 3/20/2009

Table of Contents 0B2010 Local Update of Census Addresses (LUCA) .................................................................................................................... 1
1BReferral Address Verification Systems (RAVS) ........................................................................................................................ 2
Subdivision GIS Web Mapping Application ............................................................................................................................. 3
2BLocal Owners Project Notification .......................................................................................................................................... 4
3BMental Health Provider Directory Search ............................................................................................................................... 5
4BCounty Portal ‐ Services Locator ............................................................................................................................................. 6
5BChildcare Provider Search Application .................................................................................................................................... 7
6BMental Health Mapping Site ................................................................................................................................................... 8
7BPublic Works Service Locator .................................................................................................................................................. 9
8BGeocortex Map Service for Parks .......................................................................................................................................... 10
9BMultiple Family Dwellings Risk Assessment.......................................................................................................................... 11
10BMLK Patient Referral Reimbursement Verification .............................................................................................................. 12
11BMock Reassignment of Health Plan Members ...................................................................................................................... 13
12BEnhanced 911 Response ....................................................................................................................................................... 14
13BBusiness Intelligence/Mapping Integration .......................................................................................................................... 15
Road Closure Website ........................................................................................................................................................... 16
2‐1‐1 Community Resource Guide ........................................................................................................................................ 17
1 | P a g e
0B2010 Local Update of Census Addresses (LUCA)Chief Executive Office (CEO), Urban Research Group
Uhttp://www.census.gov U Problem: The County of Los Angeles provides services to the residents of
the County. Many programs are supported by federal funding
that is calculated by the number of residents of the County.
The County is supporting the goal of the Census Bureau to find
and count all County residents in the 2010 Census.
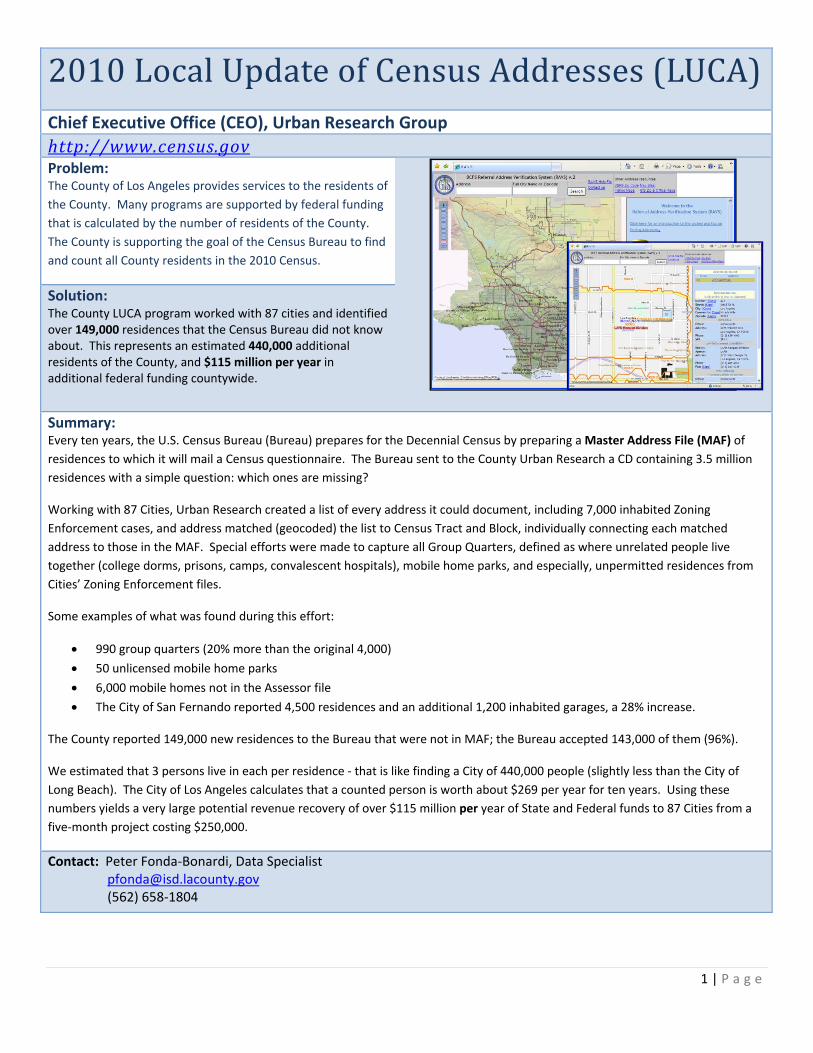
Solution: The County LUCA program worked with 87 cities and identified over 149,000 residences that the Census Bureau did not know about. This represents an estimated 440,000 additional residents of the County, and $115 million per year in additional federal funding countywide.
Summary: Every ten years, the U.S. Census Bureau (Bureau) prepares for the Decennial Census by preparing a Master Address File (MAF) of
residences to which it will mail a Census questionnaire. The Bureau sent to the County Urban Research a CD containing 3.5 million
residences with a simple question: which ones are missing?
Working with 87 Cities, Urban Research created a list of every address it could document, including 7,000 inhabited Zoning
Enforcement cases, and address matched (geocoded) the list to Census Tract and Block, individually connecting each matched
address to those in the MAF. Special efforts were made to capture all Group Quarters, defined as where unrelated people live
together (college dorms, prisons, camps, convalescent hospitals), mobile home parks, and especially, unpermitted residences from
Cities’ Zoning Enforcement files.
Some examples of what was found during this effort:
990 group quarters (20% more than the original 4,000)
50 unlicensed mobile home parks
6,000 mobile homes not in the Assessor file
The City of San Fernando reported 4,500 residences and an additional 1,200 inhabited garages, a 28% increase.
The County reported 149,000 new residences to the Bureau that were not in MAF; the Bureau accepted 143,000 of them (96%).
We estimated that 3 persons live in each per residence ‐ that is like finding a City of 440,000 people (slightly less than the City of
Long Beach). The City of Los Angeles calculates that a counted person is worth about $269 per year for ten years. Using these
numbers yields a very large potential revenue recovery of over $115 million per year of State and Federal funds to 87 Cities from a
five‐month project costing $250,000.
Contact: Peter Fonda‐Bonardi, Data Specialist [email protected] (562) 658‐1804
2 | P a g e
1BReferral Address Verification Systems (RAVS) Department of Children and Family Services (DCFS)
http://gis.lacounty.gov/ravs Problem: DCFS Child Protection Hotline (CPH) has no means of
determining the accuracy of the referral address to
appropriately assign referrals to Regional Office and cross
reporting to Law Enforcement Agency.
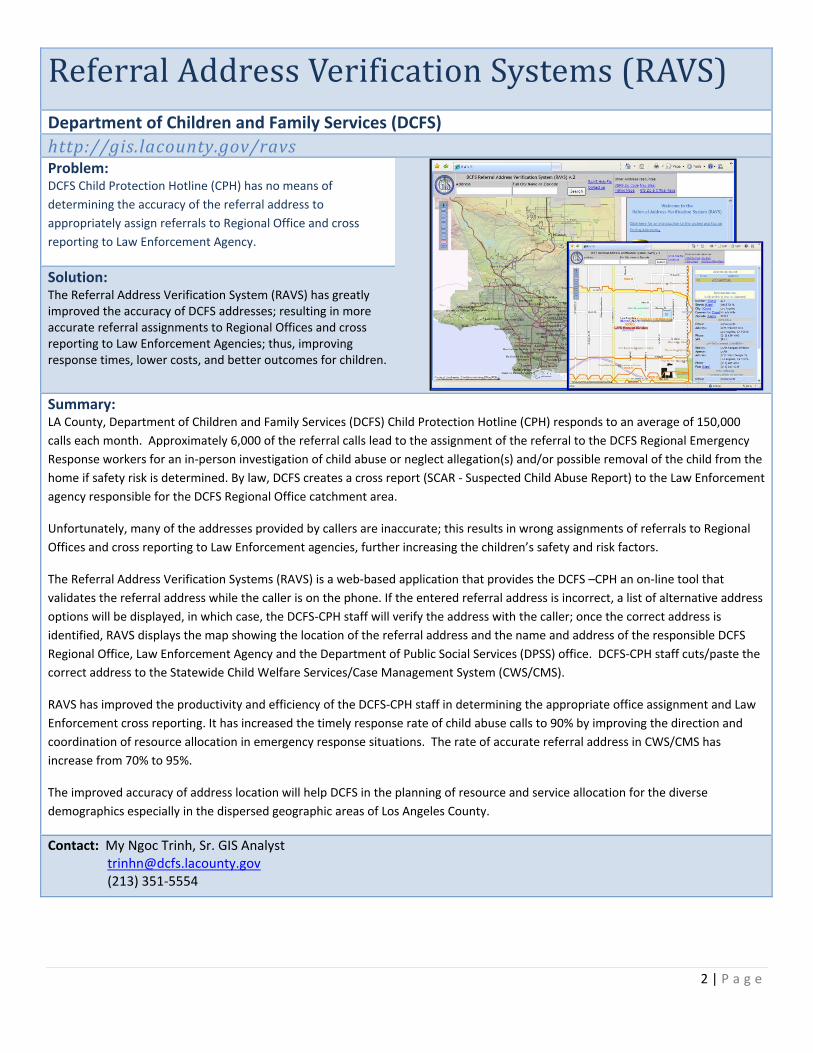
Solution: The Referral Address Verification System (RAVS) has greatly improved the accuracy of DCFS addresses; resulting in more accurate referral assignments to Regional Offices and cross reporting to Law Enforcement Agencies; thus, improving response times, lower costs, and better outcomes for children.
Summary: LA County, Department of Children and Family Services (DCFS) Child Protection Hotline (CPH) responds to an average of 150,000
calls each month. Approximately 6,000 of the referral calls lead to the assignment of the referral to the DCFS Regional Emergency
Response workers for an in‐person investigation of child abuse or neglect allegation(s) and/or possible removal of the child from the
home if safety risk is determined. By law, DCFS creates a cross report (SCAR ‐ Suspected Child Abuse Report) to the Law Enforcement
agency responsible for the DCFS Regional Office catchment area.
Unfortunately, many of the addresses provided by callers are inaccurate; this results in wrong assignments of referrals to Regional
Offices and cross reporting to Law Enforcement agencies, further increasing the children’s safety and risk factors.
The Referral Address Verification Systems (RAVS) is a web‐based application that provides the DCFS –CPH an on‐line tool that
validates the referral address while the caller is on the phone. If the entered referral address is incorrect, a list of alternative address
options will be displayed, in which case, the DCFS‐CPH staff will verify the address with the caller; once the correct address is
identified, RAVS displays the map showing the location of the referral address and the name and address of the responsible DCFS
Regional Office, Law Enforcement Agency and the Department of Public Social Services (DPSS) office. DCFS‐CPH staff cuts/paste the
correct address to the Statewide Child Welfare Services/Case Management System (CWS/CMS).
RAVS has improved the productivity and efficiency of the DCFS‐CPH staff in determining the appropriate office assignment and Law
Enforcement cross reporting. It has increased the timely response rate of child abuse calls to 90% by improving the direction and
coordination of resource allocation in emergency response situations. The rate of accurate referral address in CWS/CMS has
increase from 70% to 95%.
The improved accuracy of address location will help DCFS in the planning of resource and service allocation for the diverse
demographics especially in the dispersed geographic areas of Los Angeles County.
Contact: My Ngoc Trinh, Sr. GIS Analyst [email protected] (213) 351‐5554
3 | P a g e
Subdivision GIS Web Mapping Application Department of Regional Planning (DRP)
http://planning.lacounty.gov/intGisMaps.htm Problem: The public had limited access to subdivision information. It
was available by appointment only, which restricted them to
DRP office hours. Additionally, a significant amount of
subdivision data is stored offsite, often necessitating a return
visit.
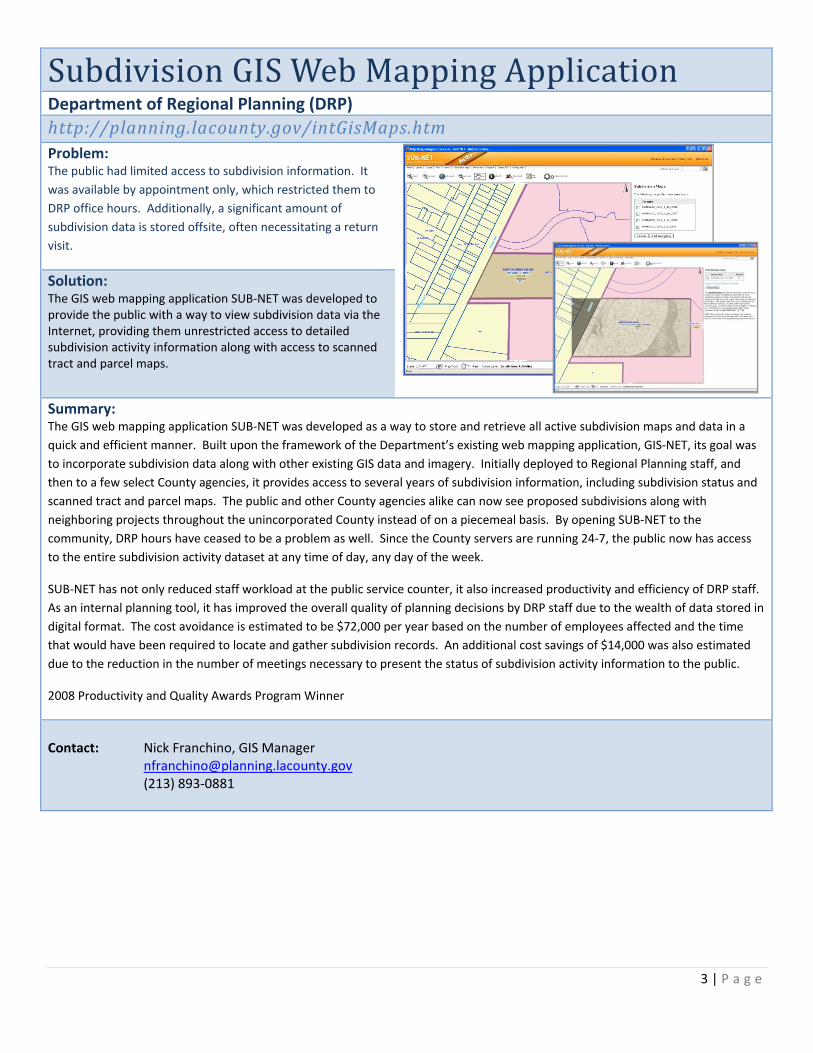
Solution: The GIS web mapping application SUB‐NET was developed to provide the public with a way to view subdivision data via the Internet, providing them unrestricted access to detailed subdivision activity information along with access to scanned tract and parcel maps.
Summary: The GIS web mapping application SUB‐NET was developed as a way to store and retrieve all active subdivision maps and data in a
quick and efficient manner. Built upon the framework of the Department’s existing web mapping application, GIS‐NET, its goal was
to incorporate subdivision data along with other existing GIS data and imagery. Initially deployed to Regional Planning staff, and
then to a few select County agencies, it provides access to several years of subdivision information, including subdivision status and
scanned tract and parcel maps. The public and other County agencies alike can now see proposed subdivisions along with
neighboring projects throughout the unincorporated County instead of on a piecemeal basis. By opening SUB‐NET to the
community, DRP hours have ceased to be a problem as well. Since the County servers are running 24‐7, the public now has access
to the entire subdivision activity dataset at any time of day, any day of the week.
SUB‐NET has not only reduced staff workload at the public service counter, it also increased productivity and efficiency of DRP staff.
As an internal planning tool, it has improved the overall quality of planning decisions by DRP staff due to the wealth of data stored in
digital format. The cost avoidance is estimated to be $72,000 per year based on the number of employees affected and the time
that would have been required to locate and gather subdivision records. An additional cost savings of $14,000 was also estimated
due to the reduction in the number of meetings necessary to present the status of subdivision activity information to the public.
2008 Productivity and Quality Awards Program Winner
Contact: Nick Franchino, GIS Manager [email protected] (213) 893‐0881
4 | P a g e
2BLocal Owners Project Notification Department of Beaches and Harbors (DBH)
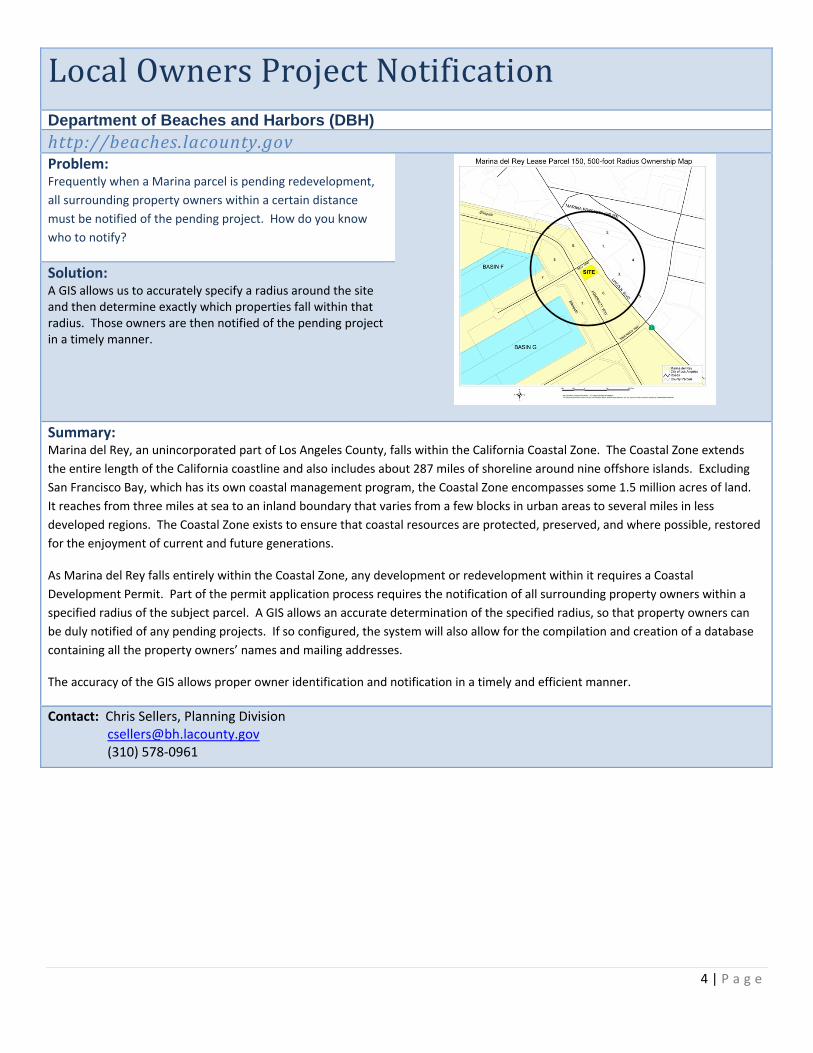
http://beaches.lacounty.gov Problem: Frequently when a Marina parcel is pending redevelopment,
all surrounding property owners within a certain distance
must be notified of the pending project. How do you know
who to notify?
Solution: A GIS allows us to accurately specify a radius around the site and then determine exactly which properties fall within that radius. Those owners are then notified of the pending project in a timely manner.
Summary: Marina del Rey, an unincorporated part of Los Angeles County, falls within the California Coastal Zone. The Coastal Zone extends
the entire length of the California coastline and also includes about 287 miles of shoreline around nine offshore islands. Excluding
San Francisco Bay, which has its own coastal management program, the Coastal Zone encompasses some 1.5 million acres of land.
It reaches from three miles at sea to an inland boundary that varies from a few blocks in urban areas to several miles in less
developed regions. The Coastal Zone exists to ensure that coastal resources are protected, preserved, and where possible, restored
for the enjoyment of current and future generations.
As Marina del Rey falls entirely within the Coastal Zone, any development or redevelopment within it requires a Coastal
Development Permit. Part of the permit application process requires the notification of all surrounding property owners within a
specified radius of the subject parcel. A GIS allows an accurate determination of the specified radius, so that property owners can
be duly notified of any pending projects. If so configured, the system will also allow for the compilation and creation of a database
containing all the property owners’ names and mailing addresses.
The accuracy of the GIS allows proper owner identification and notification in a timely and efficient manner.
Contact: Chris Sellers, Planning Division [email protected] (310) 578‐0961
5 | P a g e
3BMental Health Provider Directory Search Department of Mental Health (DMH)
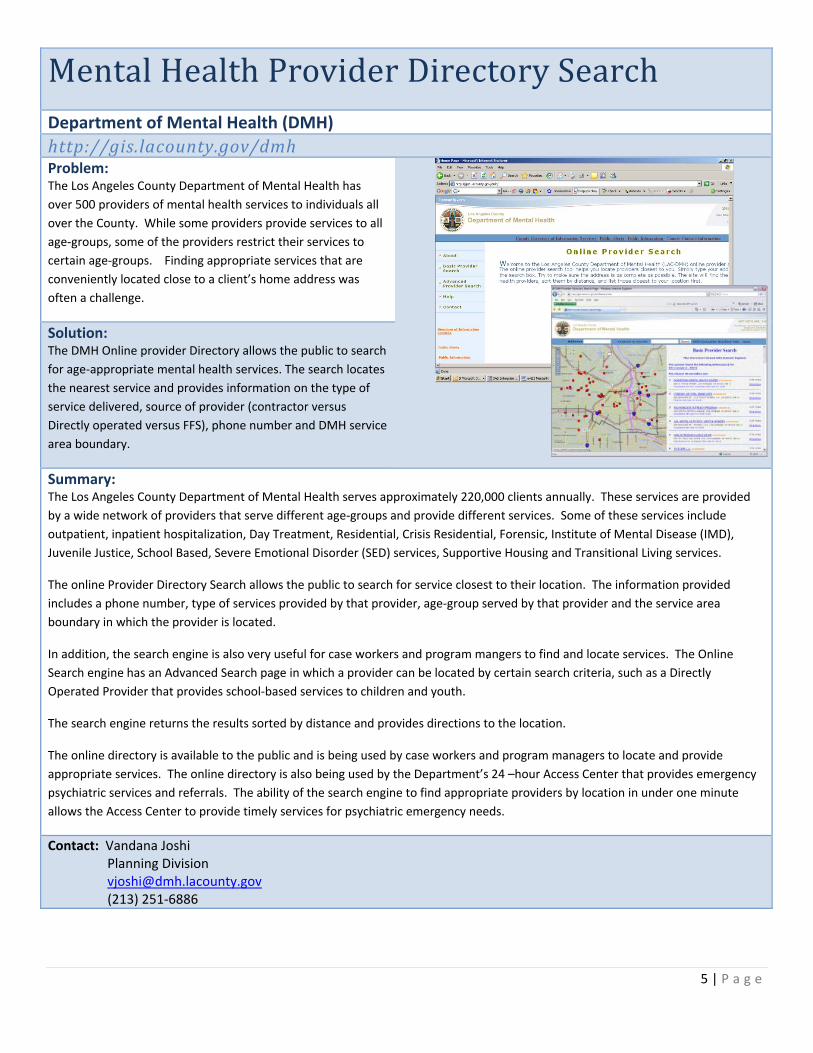
http://gis.lacounty.gov/dmh Problem: The Los Angeles County Department of Mental Health has
over 500 providers of mental health services to individuals all
over the County. While some providers provide services to all
age‐groups, some of the providers restrict their services to
certain age‐groups. Finding appropriate services that are
conveniently located close to a client’s home address was
often a challenge.
Solution: The DMH Online provider Directory allows the public to search
for age‐appropriate mental health services. The search locates
the nearest service and provides information on the type of
service delivered, source of provider (contractor versus
Directly operated versus FFS), phone number and DMH service
area boundary.
Summary: The Los Angeles County Department of Mental Health serves approximately 220,000 clients annually. These services are provided
by a wide network of providers that serve different age‐groups and provide different services. Some of these services include
outpatient, inpatient hospitalization, Day Treatment, Residential, Crisis Residential, Forensic, Institute of Mental Disease (IMD),
Juvenile Justice, School Based, Severe Emotional Disorder (SED) services, Supportive Housing and Transitional Living services.
The online Provider Directory Search allows the public to search for service closest to their location. The information provided
includes a phone number, type of services provided by that provider, age‐group served by that provider and the service area
boundary in which the provider is located.
In addition, the search engine is also very useful for case workers and program mangers to find and locate services. The Online
Search engine has an Advanced Search page in which a provider can be located by certain search criteria, such as a Directly
Operated Provider that provides school‐based services to children and youth.
The search engine returns the results sorted by distance and provides directions to the location.
The online directory is available to the public and is being used by case workers and program managers to locate and provide
appropriate services. The online directory is also being used by the Department’s 24 –hour Access Center that provides emergency
psychiatric services and referrals. The ability of the search engine to find appropriate providers by location in under one minute
allows the Access Center to provide timely services for psychiatric emergency needs.
Contact: Vandana Joshi Planning Division [email protected] (213) 251‐6886
6 | P a g e
4BCounty Portal ‐ Services Locator Chief Information Office (CIO)
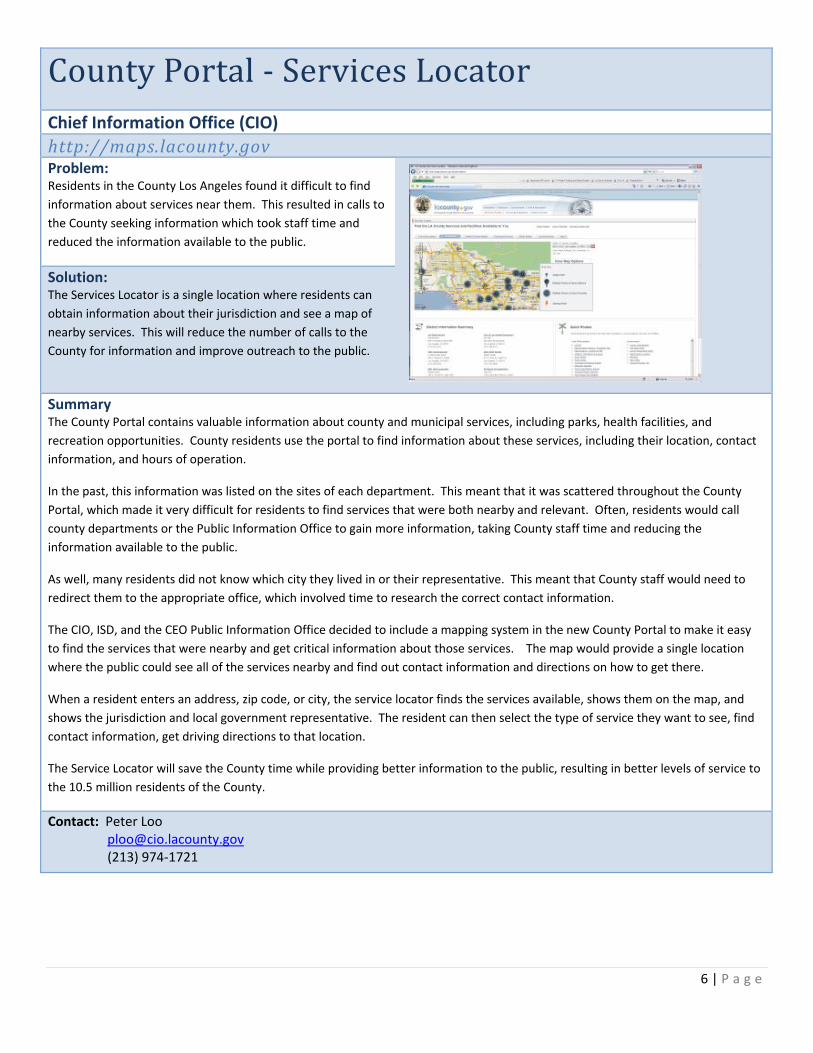
http://maps.lacounty.gov Problem: Residents in the County Los Angeles found it difficult to find
information about services near them. This resulted in calls to
the County seeking information which took staff time and
reduced the information available to the public.
Solution: The Services Locator is a single location where residents can
obtain information about their jurisdiction and see a map of
nearby services. This will reduce the number of calls to the
County for information and improve outreach to the public.
Summary The County Portal contains valuable information about county and municipal services, including parks, health facilities, and
recreation opportunities. County residents use the portal to find information about these services, including their location, contact
information, and hours of operation.
In the past, this information was listed on the sites of each department. This meant that it was scattered throughout the County
Portal, which made it very difficult for residents to find services that were both nearby and relevant. Often, residents would call
county departments or the Public Information Office to gain more information, taking County staff time and reducing the
information available to the public.
As well, many residents did not know which city they lived in or their representative. This meant that County staff would need to
redirect them to the appropriate office, which involved time to research the correct contact information.
The CIO, ISD, and the CEO Public Information Office decided to include a mapping system in the new County Portal to make it easy
to find the services that were nearby and get critical information about those services. The map would provide a single location
where the public could see all of the services nearby and find out contact information and directions on how to get there.
When a resident enters an address, zip code, or city, the service locator finds the services available, shows them on the map, and
shows the jurisdiction and local government representative. The resident can then select the type of service they want to see, find
contact information, get driving directions to that location.
The Service Locator will save the County time while providing better information to the public, resulting in better levels of service to
the 10.5 million residents of the County.
Contact: Peter Loo [email protected] (213) 974‐1721
7 | P a g e
5BChildcare Provider Search Application Department of Public Social Services
http://dpss.lacounty.gov/dpss/child_care/search.cfm Problem: The County of Los Angeles DPSS provides numerous services
to residents in Los Angeles County. One of the challenges for
parents is locating quality child care providers close to home
or work.
Solution: The Childcare Provider Search Application provides parents,
the public, and DPSS staff with an easy to use, fast, map
based, automated method of searching for childcare providers
that are licensed by the State of California. Searches can be
performed against an area such as a city or zip code, or by a
street address which is typically a home or work address.
Summary:
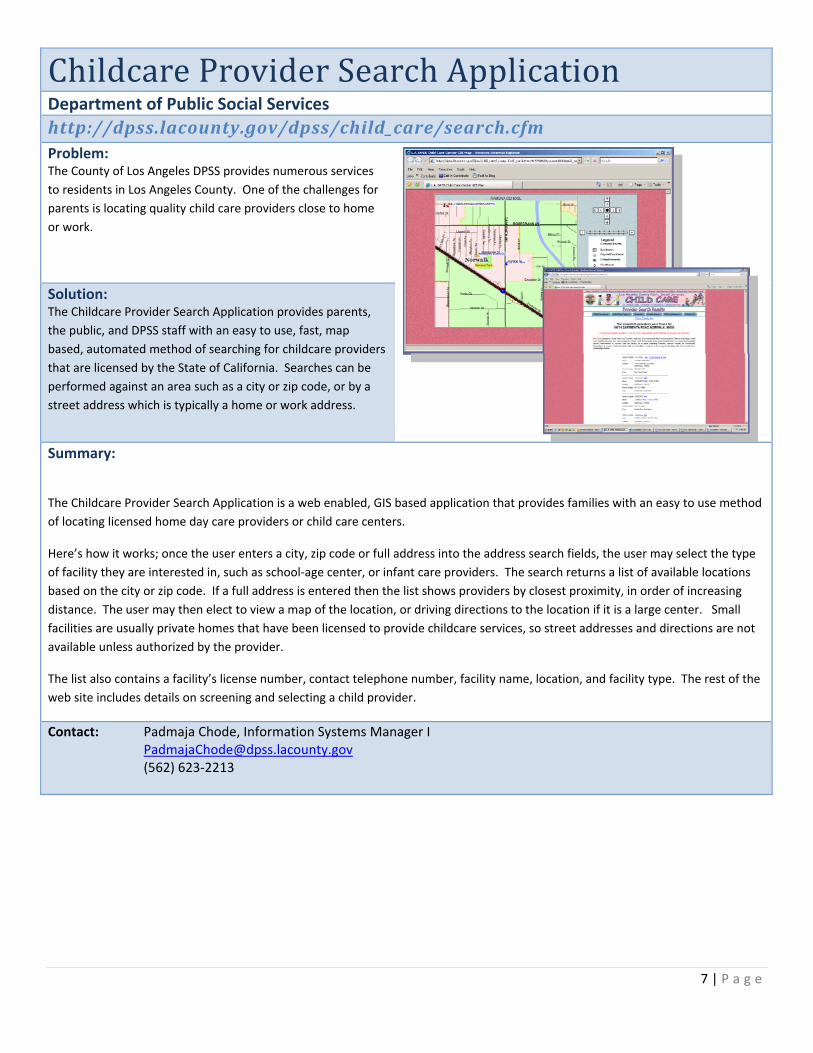
The Childcare Provider Search Application is a web enabled, GIS based application that provides families with an easy to use method
of locating licensed home day care providers or child care centers.
Here’s how it works; once the user enters a city, zip code or full address into the address search fields, the user may select the type
of facility they are interested in, such as school‐age center, or infant care providers. The search returns a list of available locations
based on the city or zip code. If a full address is entered then the list shows providers by closest proximity, in order of increasing
distance. The user may then elect to view a map of the location, or driving directions to the location if it is a large center. Small
facilities are usually private homes that have been licensed to provide childcare services, so street addresses and directions are not
available unless authorized by the provider.
The list also contains a facility’s license number, contact telephone number, facility name, location, and facility type. The rest of the
web site includes details on screening and selecting a child provider.
Contact: Padmaja Chode, Information Systems Manager I [email protected] (562) 623‐2213
8 | P a g e
6BMental Health Mapping Site Department of Mental Health
http://gis.lacounty.gov/imf/sites/dmh/jsp/launch.jsp Problem: The Los Angeles County Department of Mental Health wants
to ensure that its network of over 500 providers are effectively
located to serve their target populations. DMH wants to
identify and close gaps in service availability in certain
geographic locations based upon the needs of the actual
population.
Solution: The ability to show providers and target populations together
on a map is a very effective way for caseworkers and
managers to provide targeted Outreach and Engagement,
conduct gap analysis, and track program implementation to
ensure that the needs of County residents are being
effectively met.
Summary: The Los Angeles County Department of Mental Health provides a wide range of age appropriate services to consumers. The
recovery of consumers is dependent on providing adequate and appropriate services based on their needs. This requires extensive
efforts towards reaching and engaging target populations and conducting gap analysis of availability of services and consumer
needs.
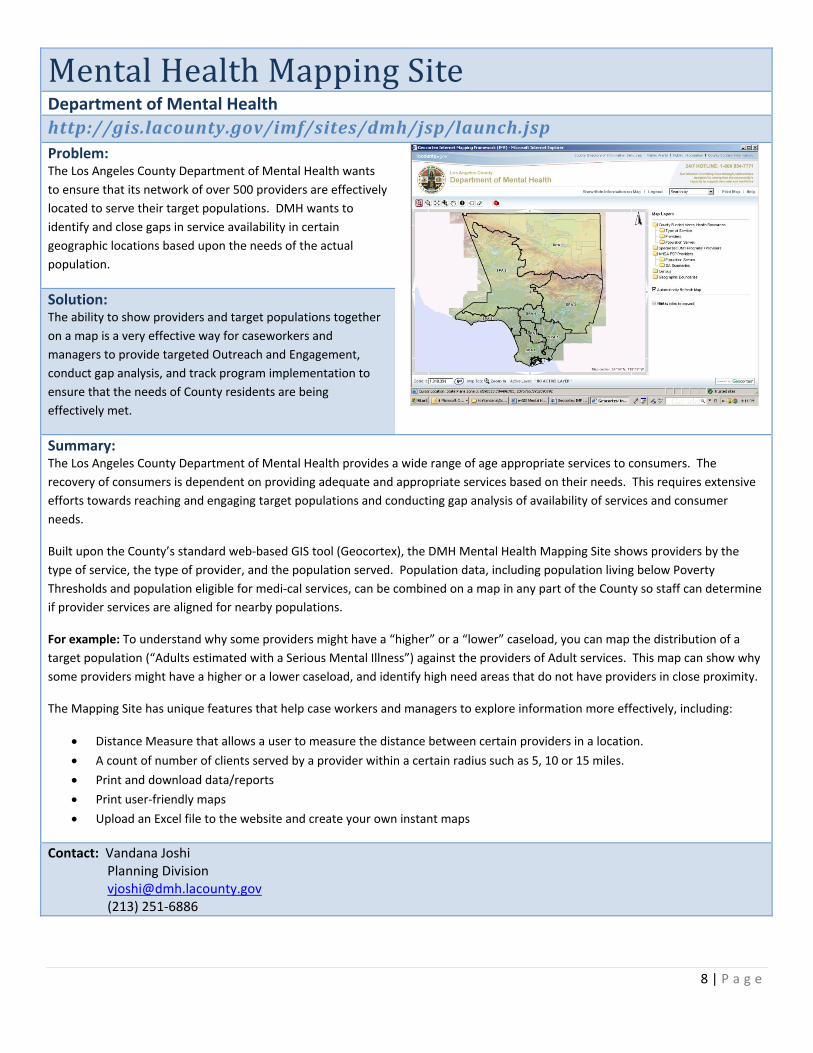
Built upon the County’s standard web‐based GIS tool (Geocortex), the DMH Mental Health Mapping Site shows providers by the
type of service, the type of provider, and the population served. Population data, including population living below Poverty
Thresholds and population eligible for medi‐cal services, can be combined on a map in any part of the County so staff can determine
if provider services are aligned for nearby populations.
For example: To understand why some providers might have a “higher” or a “lower” caseload, you can map the distribution of a
target population (“Adults estimated with a Serious Mental Illness”) against the providers of Adult services. This map can show why
some providers might have a higher or a lower caseload, and identify high need areas that do not have providers in close proximity.
The Mapping Site has unique features that help case workers and managers to explore information more effectively, including:
Distance Measure that allows a user to measure the distance between certain providers in a location.
A count of number of clients served by a provider within a certain radius such as 5, 10 or 15 miles.
Print and download data/reports
Print user‐friendly maps
Upload an Excel file to the website and create your own instant maps
Contact: Vandana Joshi Planning Division [email protected] (213) 251‐6886
9 | P a g e
7BPublic Works Service Locator Department of Public Works (DPW)
http://dpwgis.co.la.ca.us/website/ServiceLocator/ Problem: Residents of the County of Los Angeles searching for which agency provides public works services for a particular location found it a confusing and time consuming task. There was no centralized system to assist and many times, the search was further complicated when services were contracted out to other public agencies or private businesses. This lead to a series of phone calls, wait times, and a highly frustrating experience for the public.
Solution: This application provides a one‐stop access point to locate public works services, based on location. The innovation and originality lie in the fact that Service Locator also returns contact information for outside cities and agencies (non‐DPW). The result is an interactive, comprehensive, and enterprise‐scale solution that provides timely and valuable information to the public.
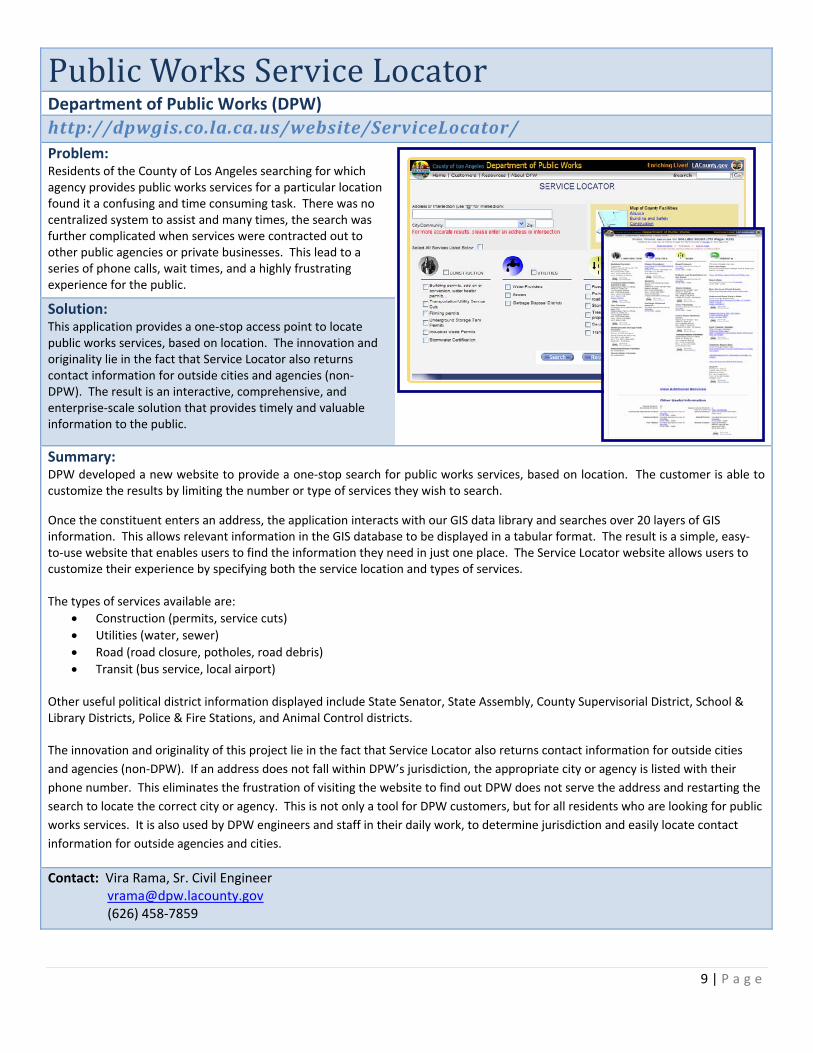
Summary: DPW developed a new website to provide a one‐stop search for public works services, based on location. The customer is able to customize the results by limiting the number or type of services they wish to search.
Once the constituent enters an address, the application interacts with our GIS data library and searches over 20 layers of GIS information. This allows relevant information in the GIS database to be displayed in a tabular format. The result is a simple, easy‐to‐use website that enables users to find the information they need in just one place. The Service Locator website allows users to customize their experience by specifying both the service location and types of services. The types of services available are:
Construction (permits, service cuts)
Utilities (water, sewer)
Road (road closure, potholes, road debris)
Transit (bus service, local airport) Other useful political district information displayed include State Senator, State Assembly, County Supervisorial District, School & Library Districts, Police & Fire Stations, and Animal Control districts. The innovation and originality of this project lie in the fact that Service Locator also returns contact information for outside cities
and agencies (non‐DPW). If an address does not fall within DPW’s jurisdiction, the appropriate city or agency is listed with their
phone number. This eliminates the frustration of visiting the website to find out DPW does not serve the address and restarting the
search to locate the correct city or agency. This is not only a tool for DPW customers, but for all residents who are looking for public
works services. It is also used by DPW engineers and staff in their daily work, to determine jurisdiction and easily locate contact
information for outside agencies and cities.
Contact: Vira Rama, Sr. Civil Engineer [email protected] (626) 458‐7859
10 | P a g e
8BGeocortex Map Service for Parks Department of Parks and Recreation (DPR)
http://gis.lacounty.gov/imf/sites/Parks/jsp/launch.jsp Problem: Due to the geographic locations of Parks, Golf Courses and miles of trails throughout the County, the Department of Parks and Recreation needed a map service to help manage, plan and develop our facilities.
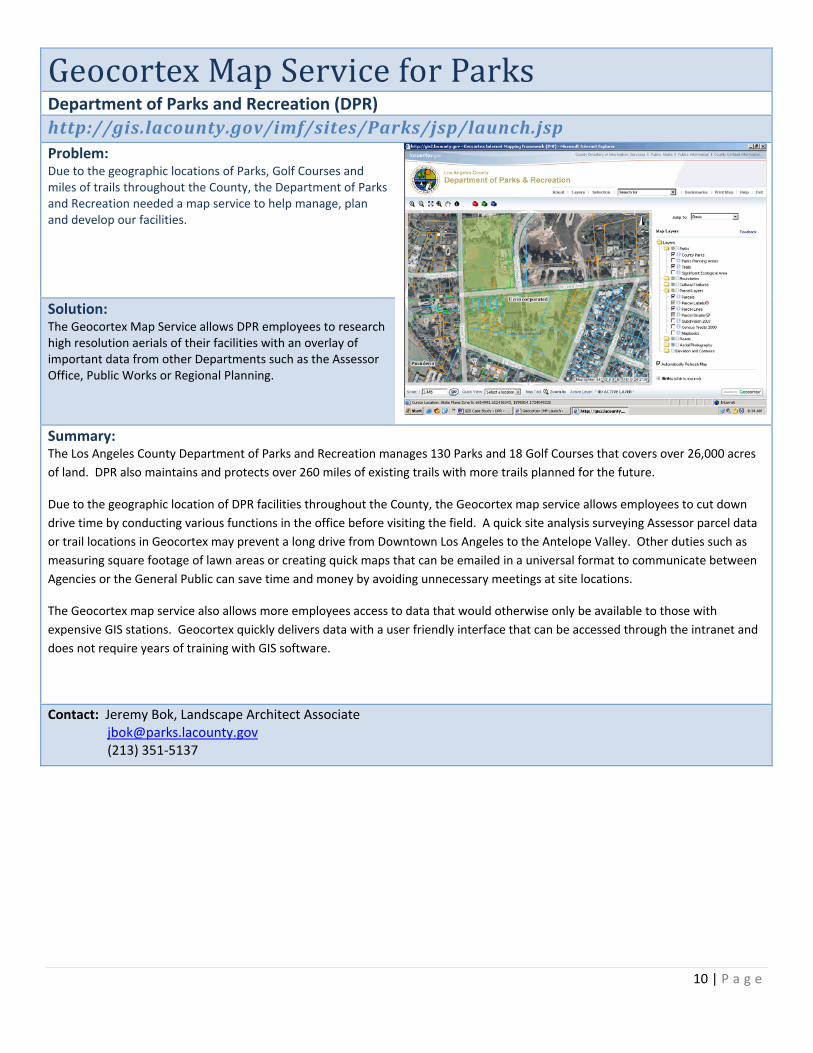
Solution: The Geocortex Map Service allows DPR employees to research high resolution aerials of their facilities with an overlay of important data from other Departments such as the Assessor Office, Public Works or Regional Planning.
Summary: The Los Angeles County Department of Parks and Recreation manages 130 Parks and 18 Golf Courses that covers over 26,000 acres
of land. DPR also maintains and protects over 260 miles of existing trails with more trails planned for the future.
Due to the geographic location of DPR facilities throughout the County, the Geocortex map service allows employees to cut down
drive time by conducting various functions in the office before visiting the field. A quick site analysis surveying Assessor parcel data
or trail locations in Geocortex may prevent a long drive from Downtown Los Angeles to the Antelope Valley. Other duties such as
measuring square footage of lawn areas or creating quick maps that can be emailed in a universal format to communicate between
Agencies or the General Public can save time and money by avoiding unnecessary meetings at site locations.
The Geocortex map service also allows more employees access to data that would otherwise only be available to those with
expensive GIS stations. Geocortex quickly delivers data with a user friendly interface that can be accessed through the intranet and
does not require years of training with GIS software.
Contact: Jeremy Bok, Landscape Architect Associate [email protected] (213) 351‐5137
11 | P a g e
9BMultiple Family Dwellings Risk Assessment Department of Public Health, Environmental Health
Problem: The County of Los Angeles Department of Environmental
Health had no method of visualizing risk assessment
categories for Multiple Family Dwellings (MFD).
Solution: The GIS application enables the Environmental Health
department to determine which areas have MFD with the
highest concentration of risk. Anyone who runs this report can
see which areas are in need of most attention based on hot
and cold spots, thus improving the efficiency of inspection
units.
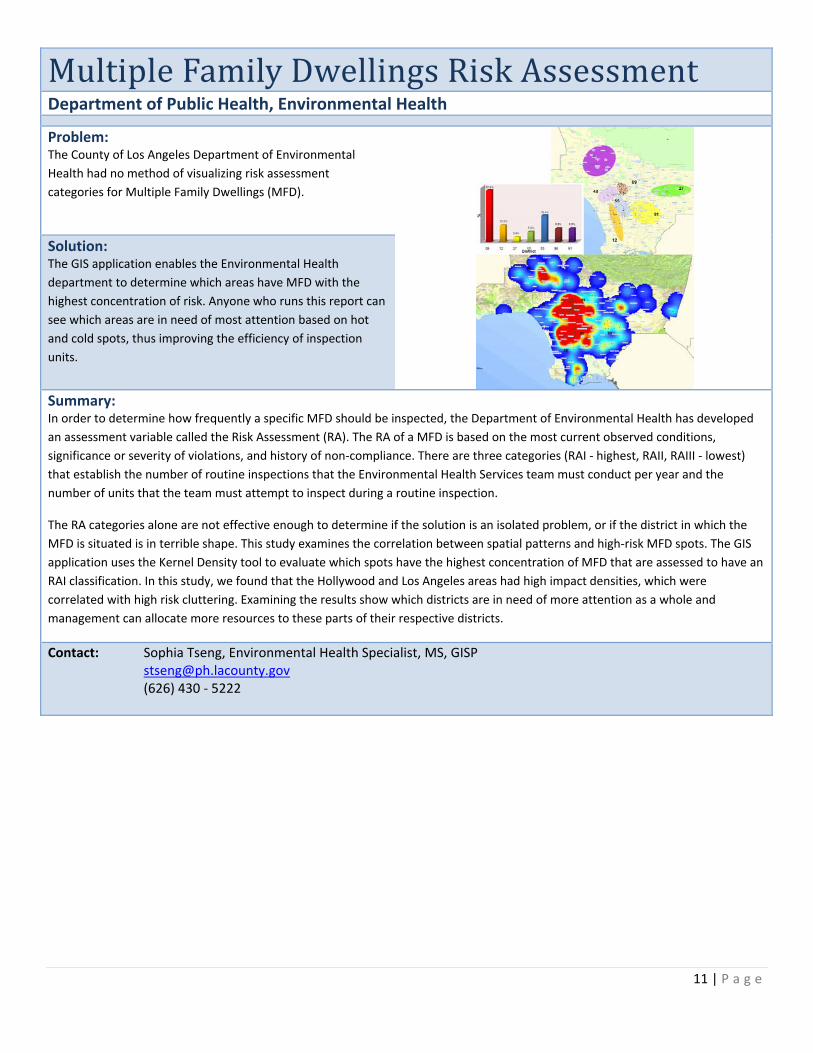
Summary: In order to determine how frequently a specific MFD should be inspected, the Department of Environmental Health has developed
an assessment variable called the Risk Assessment (RA). The RA of a MFD is based on the most current observed conditions,
significance or severity of violations, and history of non‐compliance. There are three categories (RAI ‐ highest, RAII, RAIII ‐ lowest)
that establish the number of routine inspections that the Environmental Health Services team must conduct per year and the
number of units that the team must attempt to inspect during a routine inspection.
The RA categories alone are not effective enough to determine if the solution is an isolated problem, or if the district in which the
MFD is situated is in terrible shape. This study examines the correlation between spatial patterns and high‐risk MFD spots. The GIS
application uses the Kernel Density tool to evaluate which spots have the highest concentration of MFD that are assessed to have an
RAI classification. In this study, we found that the Hollywood and Los Angeles areas had high impact densities, which were
correlated with high risk cluttering. Examining the results show which districts are in need of more attention as a whole and
management can allocate more resources to these parts of their respective districts.
Contact: Sophia Tseng, Environmental Health Specialist, MS, GISP [email protected] (626) 430 ‐ 5222
12 | P a g e
10BMLK Patient Referral Reimbursement Verification Department of Health Services, Emergency Medical Services Agency
Problem: The County of Los Angeles Health Services Department
needed to verify that patients impacted by the closing of
Martin Lither King Medical Center were going to the correct
hospitals.
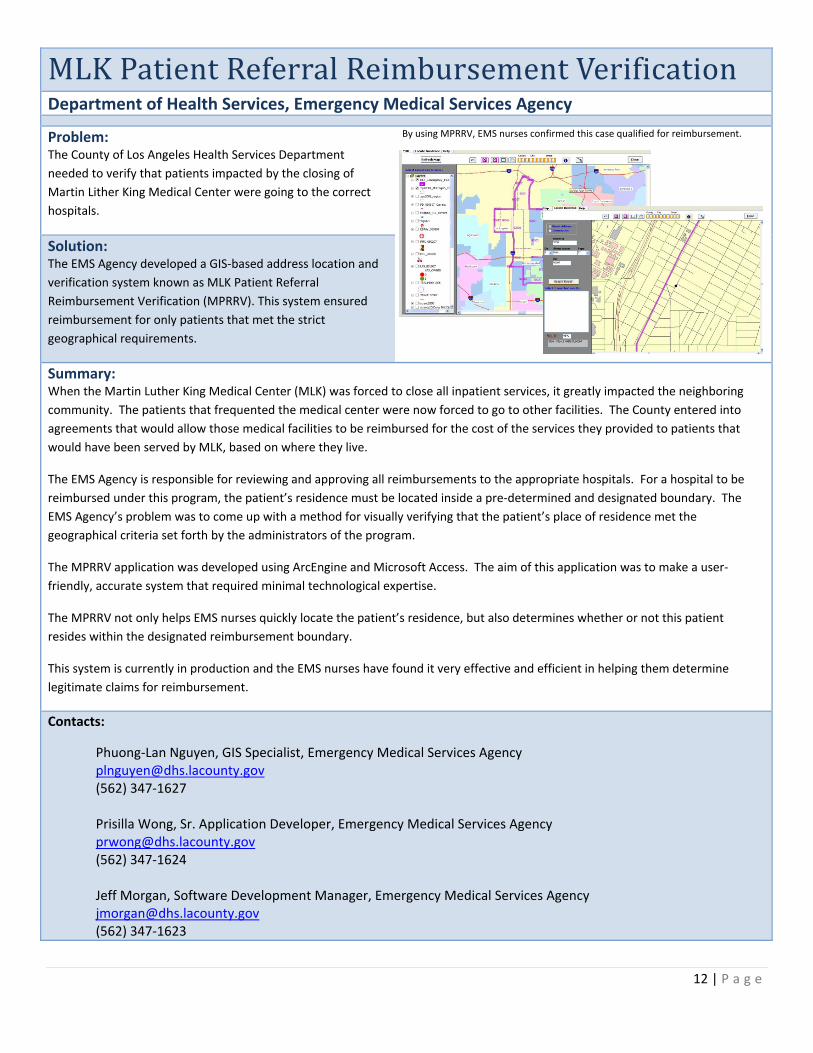
By using MPRRV, EMS nurses confirmed this case qualified for reimbursement.
Solution: The EMS Agency developed a GIS‐based address location and
verification system known as MLK Patient Referral
Reimbursement Verification (MPRRV). This system ensured
reimbursement for only patients that met the strict
geographical requirements.
Summary: When the Martin Luther King Medical Center (MLK) was forced to close all inpatient services, it greatly impacted the neighboring
community. The patients that frequented the medical center were now forced to go to other facilities. The County entered into
agreements that would allow those medical facilities to be reimbursed for the cost of the services they provided to patients that
would have been served by MLK, based on where they live.
The EMS Agency is responsible for reviewing and approving all reimbursements to the appropriate hospitals. For a hospital to be
reimbursed under this program, the patient’s residence must be located inside a pre‐determined and designated boundary. The
EMS Agency’s problem was to come up with a method for visually verifying that the patient’s place of residence met the
geographical criteria set forth by the administrators of the program.
The MPRRV application was developed using ArcEngine and Microsoft Access. The aim of this application was to make a user‐
friendly, accurate system that required minimal technological expertise.
The MPRRV not only helps EMS nurses quickly locate the patient’s residence, but also determines whether or not this patient
resides within the designated reimbursement boundary.
This system is currently in production and the EMS nurses have found it very effective and efficient in helping them determine
legitimate claims for reimbursement.
Contacts:
Phuong‐Lan Nguyen, GIS Specialist, Emergency Medical Services Agency [email protected] (562) 347‐1627 Prisilla Wong, Sr. Application Developer, Emergency Medical Services Agency [email protected] (562) 347‐1624 Jeff Morgan, Software Development Manager, Emergency Medical Services Agency [email protected] (562) 347‐1623

13 | P a g e
11BMock Reassignment of Health Plan Members Department of Health Services, Community Health Plan
Problem: Testing the impacts of reassigning health plan members was a
manual, repetitive, and inefficient process that lasted
generally from 5‐7 business days.
Solution: The Community Health Plan is able to complete the testing
more easily, ensuring that reassignments do not impact the
provision of services, supporting the continued health and
satisfaction of members.
Summary: A Mock Reassignment is a process where the Community Health Plan does a mock transfer of members from one
Medical group to another and make sure that all the requirements are met before an actual transfer.
In the past, the Health Plan lacked a readily available visual tool that would support the cross analysis of Provider, sites,
member information in event of contract termination and other changes in Provider Network. The process involved the
following:
Creation of a hard copy mock–reassignment report generated by IS which took from 5 to 7 business days.
Reports were be validated by network staff and summary cross analysis were manually prepared based.
Multiple runs before a final mock reassignment/cross analysis report was approved, which was time consuming and laborious.
The new GIS‐based mock reassignment tools have improved the process dramatically by supporting:
Easy and effective visual comparison on individual maps or by an overlay on base map, of the comparison between the terminating contract provider network and the proposed contract provider network.
Easy identification of outlier items (provider, sites, and members outside the standard geographic and/or accessibility access), providing better analysis and planning.
Increased efficiency by allowing timely comparison and analysis of reports.
More effective analysis and planning because information in Excel files can be reviewed in combination with visual displays on maps.
Contact: Vijay P Manghirmalani, Analyst [email protected] (626) 299‐3325
14 | P a g e
12BEnhanced 911 Response Sheriff Department
Problem: Sheriff crime response can be hampered by delays in
coordination between dispatchers, deputies, and the public.
Solution: A coordinated response using GPS systems to show a common
operation picture using maps to show the locations of
incidents, suspects, and sheriff deputies supports the fast and
safe apprehension of suspects.
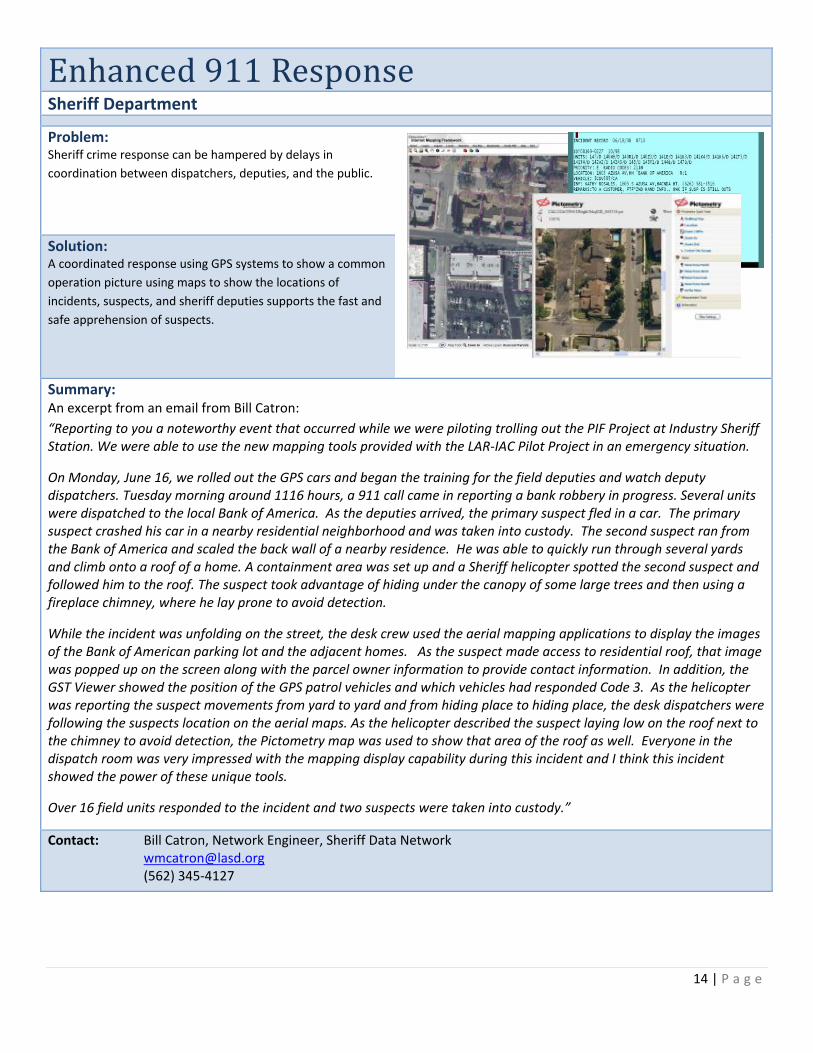
Summary: An excerpt from an email from Bill Catron:
“Reporting to you a noteworthy event that occurred while we were piloting trolling out the PIF Project at Industry Sheriff Station. We were able to use the new mapping tools provided with the LAR‐IAC Pilot Project in an emergency situation.
On Monday, June 16, we rolled out the GPS cars and began the training for the field deputies and watch deputy dispatchers. Tuesday morning around 1116 hours, a 911 call came in reporting a bank robbery in progress. Several units were dispatched to the local Bank of America. As the deputies arrived, the primary suspect fled in a car. The primary suspect crashed his car in a nearby residential neighborhood and was taken into custody. The second suspect ran from the Bank of America and scaled the back wall of a nearby residence. He was able to quickly run through several yards and climb onto a roof of a home. A containment area was set up and a Sheriff helicopter spotted the second suspect and followed him to the roof. The suspect took advantage of hiding under the canopy of some large trees and then using a fireplace chimney, where he lay prone to avoid detection.
While the incident was unfolding on the street, the desk crew used the aerial mapping applications to display the images of the Bank of American parking lot and the adjacent homes. As the suspect made access to residential roof, that image was popped up on the screen along with the parcel owner information to provide contact information. In addition, the GST Viewer showed the position of the GPS patrol vehicles and which vehicles had responded Code 3. As the helicopter was reporting the suspect movements from yard to yard and from hiding place to hiding place, the desk dispatchers were following the suspects location on the aerial maps. As the helicopter described the suspect laying low on the roof next to the chimney to avoid detection, the Pictometry map was used to show that area of the roof as well. Everyone in the dispatch room was very impressed with the mapping display capability during this incident and I think this incident showed the power of these unique tools.
Over 16 field units responded to the incident and two suspects were taken into custody.”
Contact: Bill Catron, Network Engineer, Sheriff Data Network [email protected] (562) 345‐4127
15 | P a g e
13BBusiness Intelligence/Mapping Integration CEO/Service Integration Branch/Office of Child Care
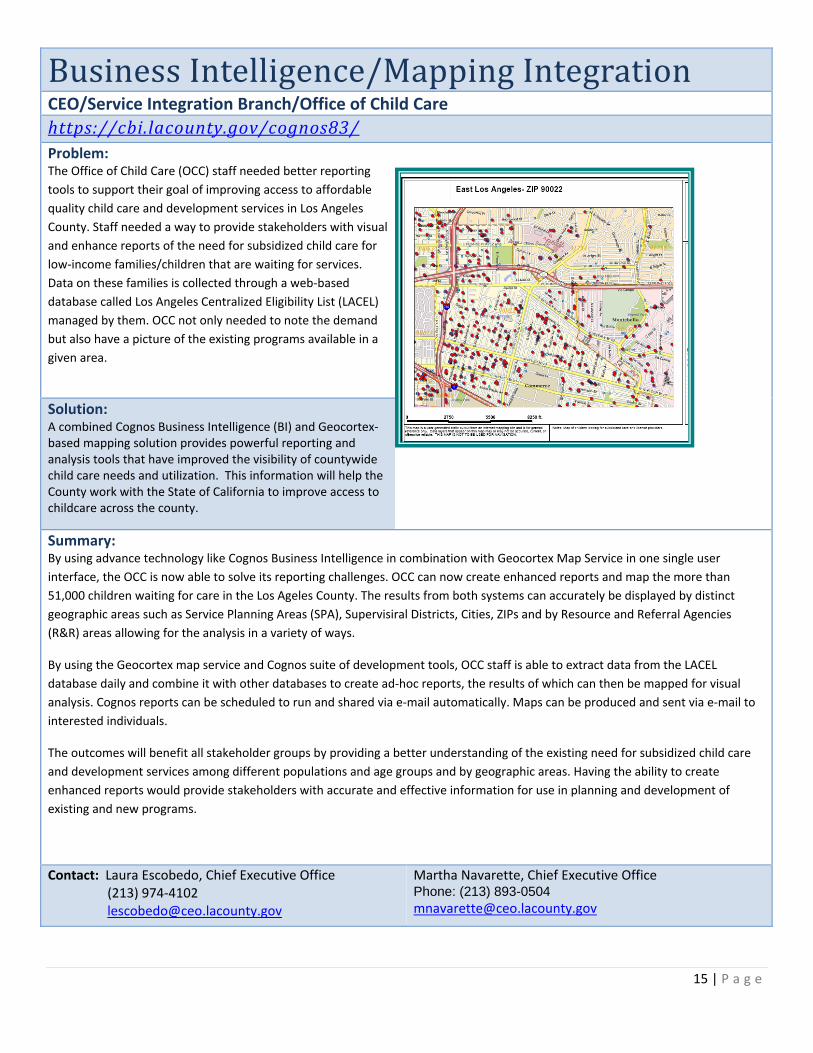
Uhttps://cbi.lacounty.gov/cognos83/ U Problem: The Office of Child Care (OCC) staff needed better reporting
tools to support their goal of improving access to affordable
quality child care and development services in Los Angeles
County. Staff needed a way to provide stakeholders with visual
and enhance reports of the need for subsidized child care for
low‐income families/children that are waiting for services.
Data on these families is collected through a web‐based
database called Los Angeles Centralized Eligibility List (LACEL)
managed by them. OCC not only needed to note the demand
but also have a picture of the existing programs available in a
given area.
Solution: A combined Cognos Business Intelligence (BI) and Geocortex‐based mapping solution provides powerful reporting and analysis tools that have improved the visibility of countywide child care needs and utilization. This information will help the County work with the State of California to improve access to childcare across the county.
Summary: By using advance technology like Cognos Business Intelligence in combination with Geocortex Map Service in one single user
interface, the OCC is now able to solve its reporting challenges. OCC can now create enhanced reports and map the more than
51,000 children waiting for care in the Los Ageles County. The results from both systems can accurately be displayed by distinct
geographic areas such as Service Planning Areas (SPA), Supervisiral Districts, Cities, ZIPs and by Resource and Referral Agencies
(R&R) areas allowing for the analysis in a variety of ways.
By using the Geocortex map service and Cognos suite of development tools, OCC staff is able to extract data from the LACEL
database daily and combine it with other databases to create ad‐hoc reports, the results of which can then be mapped for visual
analysis. Cognos reports can be scheduled to run and shared via e‐mail automatically. Maps can be produced and sent via e‐mail to
interested individuals.
The outcomes will benefit all stakeholder groups by providing a better understanding of the existing need for subsidized child care
and development services among different populations and age groups and by geographic areas. Having the ability to create
enhanced reports would provide stakeholders with accurate and effective information for use in planning and development of
existing and new programs.
Contact: Laura Escobedo, Chief Executive Office (213) 974‐4102 [email protected]
Martha Navarette, Chief Executive Office Phone: (213) 893-0504 [email protected]
16 | P a g e
Road Closure Website Department of Public Works (DPW)
http://dpwgis.co.la.ca.us/website/roadclosures/main.cfm Problem: In emergencies, the Department of Public Works (DPW)
needs to keep the public informed about which roads
are closed in order to enhance public safety. Existing
methods required numerous and time consuming steps
which resulted in multiple and varying road closures
information, slowing down the public notification about
closed roads.
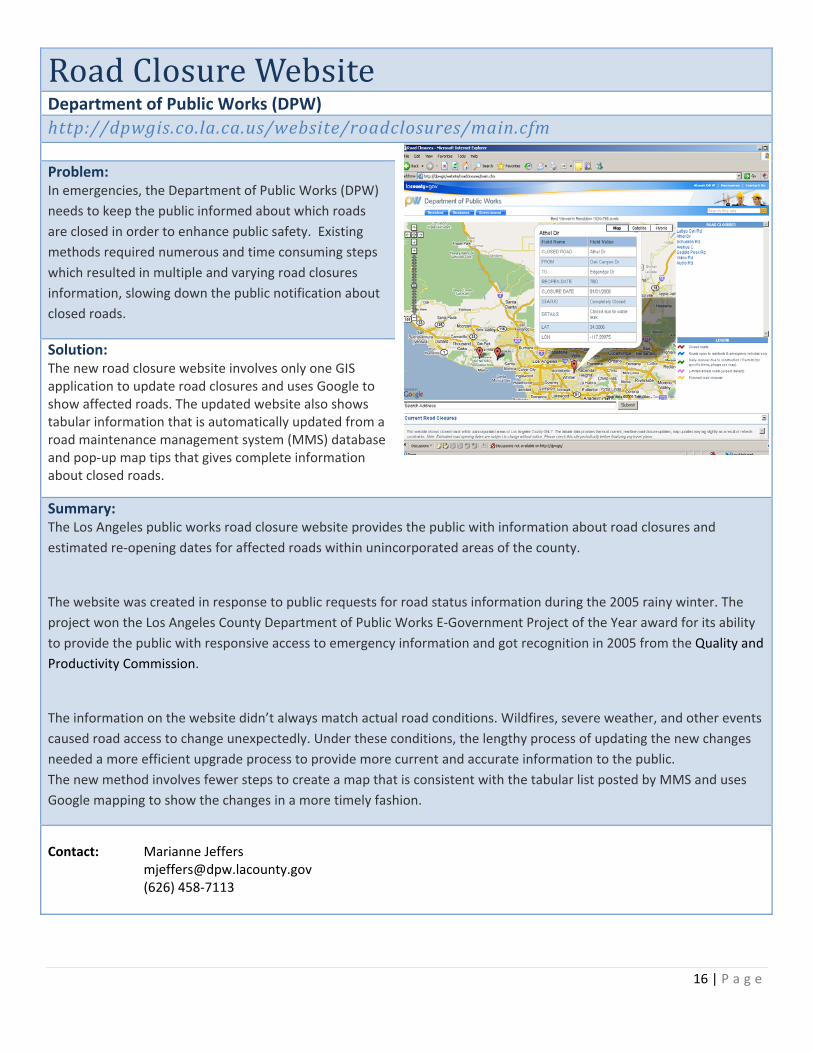
Solution: The new road closure website involves only one GIS application to update road closures and uses Google to show affected roads. The updated website also shows tabular information that is automatically updated from a road maintenance management system (MMS) database and pop‐up map tips that gives complete information about closed roads.
Summary: The Los Angeles public works road closure website provides the public with information about road closures and
estimated re‐opening dates for affected roads within unincorporated areas of the county.
The website was created in response to public requests for road status information during the 2005 rainy winter. The
project won the Los Angeles County Department of Public Works E‐Government Project of the Year award for its ability
to provide the public with responsive access to emergency information and got recognition in 2005 from the Quality and
Productivity Commission.
The information on the website didn’t always match actual road conditions. Wildfires, severe weather, and other events
caused road access to change unexpectedly. Under these conditions, the lengthy process of updating the new changes
needed a more efficient upgrade process to provide more current and accurate information to the public.
The new method involves fewer steps to create a map that is consistent with the tabular list posted by MMS and uses
Google mapping to show the changes in a more timely fashion.
Contact: Marianne Jeffers [email protected] (626) 458‐7113
17 | P a g e
2‐1‐1 Community Resource Guide Department of Mental Health (DMH)
http://crg.lacounty.gov/dmh
Problem: The Department of Mental Health provides mental health services to more than 220,000 consumers each year. It is difficult for mental health experts to find a comprehensive listing of available resources to help county residents find the support they need.
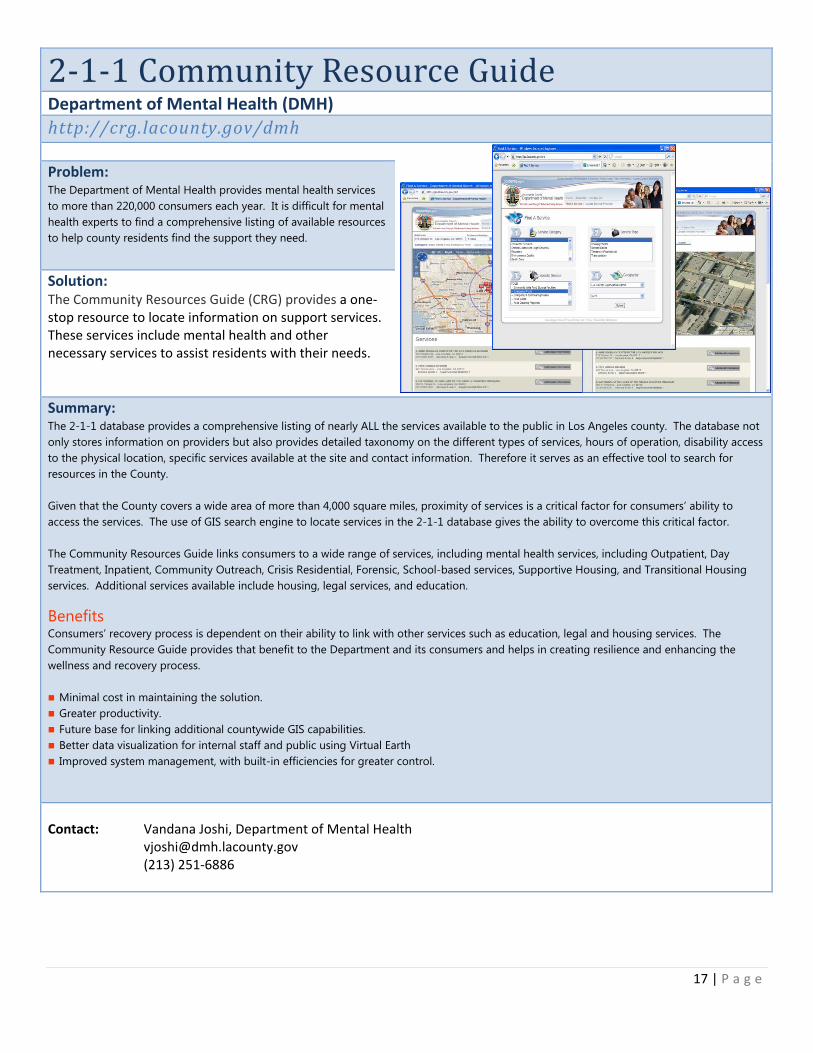
Solution: The Community Resources Guide (CRG) provides a one‐stop resource to locate information on support services. These services include mental health and other necessary services to assist residents with their needs.
Summary: The 2-1-1 database provides a comprehensive listing of nearly ALL the services available to the public in Los Angeles county. The database not only stores information on providers but also provides detailed taxonomy on the different types of services, hours of operation, disability access to the physical location, specific services available at the site and contact information. Therefore it serves as an effective tool to search for resources in the County. Given that the County covers a wide area of more than 4,000 square miles, proximity of services is a critical factor for consumers’ ability to access the services. The use of GIS search engine to locate services in the 2-1-1 database gives the ability to overcome this critical factor. The Community Resources Guide links consumers to a wide range of services, including mental health services, including Outpatient, Day Treatment, Inpatient, Community Outreach, Crisis Residential, Forensic, School-based services, Supportive Housing, and Transitional Housing services. Additional services available include housing, legal services, and education. Benefits Consumers’ recovery process is dependent on their ability to link with other services such as education, legal and housing services. The Community Resource Guide provides that benefit to the Department and its consumers and helps in creating resilience and enhancing the wellness and recovery process. Minimal cost in maintaining the solution. Greater productivity. Future base for linking additional countywide GIS capabilities. Better data visualization for internal staff and public using Virtual Earth Improved system management, with built-in efficiencies for greater control.
Contact: Vandana Joshi, Department of Mental Health [email protected] (213) 251‐6886