Embed Size (px)
Citation preview
Transportation Decision MakingPrinciples of Project Evaluation and Programming
GIS – An Overview, andA GIS Case Study
(Supplement to Chapter 19)
Muhammad IrfanNovember 26, 2007
Part 1: GIS Overview Part 1: GIS Overview
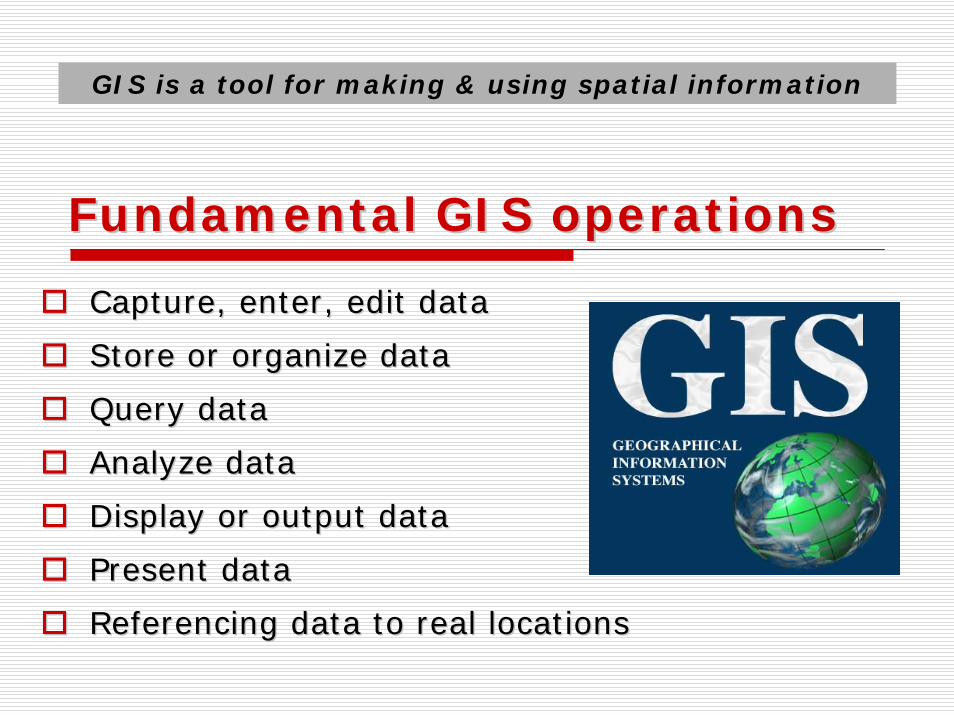
GIS is a tool for making & using spatial information
Fundamental GIS operationsFundamental GIS operations
Capture, enter, edit dataCapture, enter, edit data
Store or organize dataStore or organize data
Query data Query data
Analyze dataAnalyze data
Display or output data Display or output data
Present dataPresent data
Referencing data to real locationsReferencing data to real locations
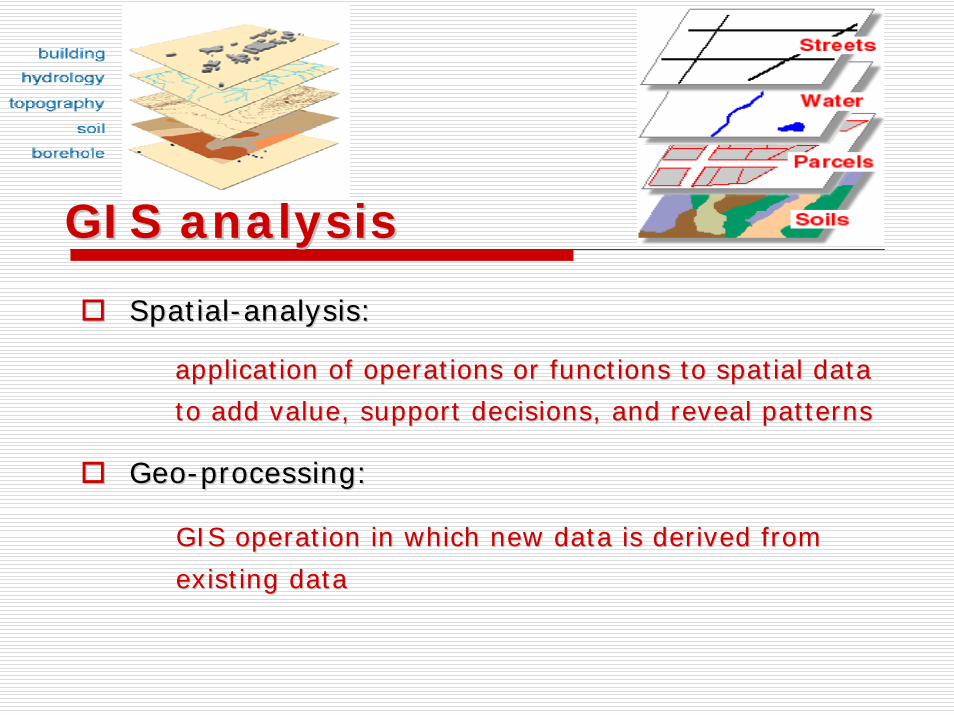
GIS analysisGIS analysis
SpatialSpatial--analysis:analysis:
application of operations or functions to spatial data application of operations or functions to spatial data to add value, support decisions, and reveal patternsto add value, support decisions, and reveal patterns
GeoGeo--processing:processing:
GIS operation in which new data is derived from GIS operation in which new data is derived from existing dataexisting data
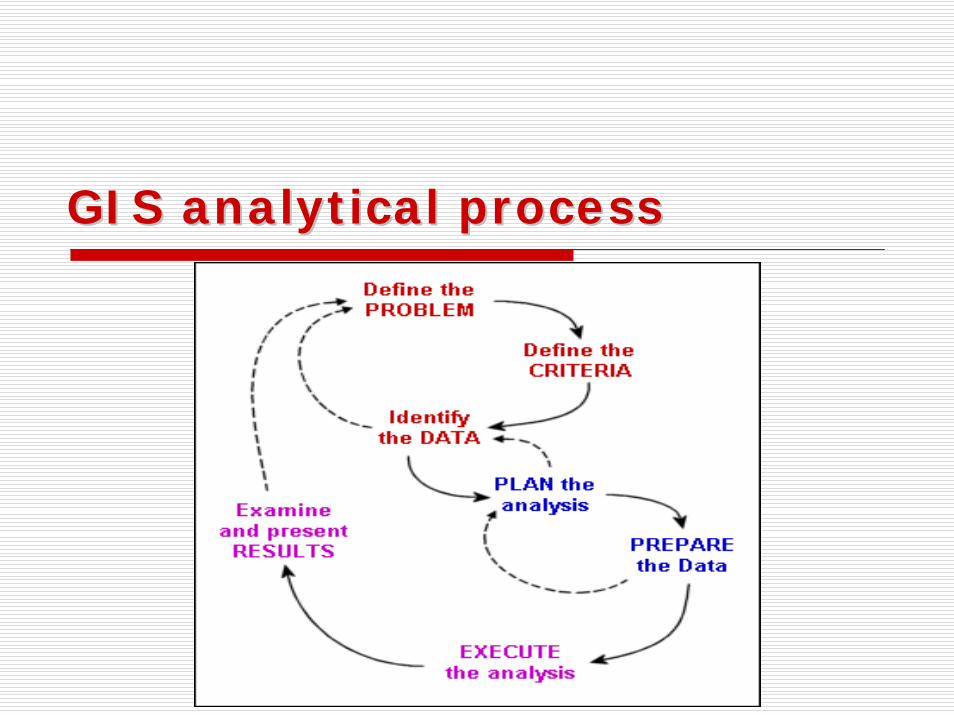
GIS analytical processGIS analytical process
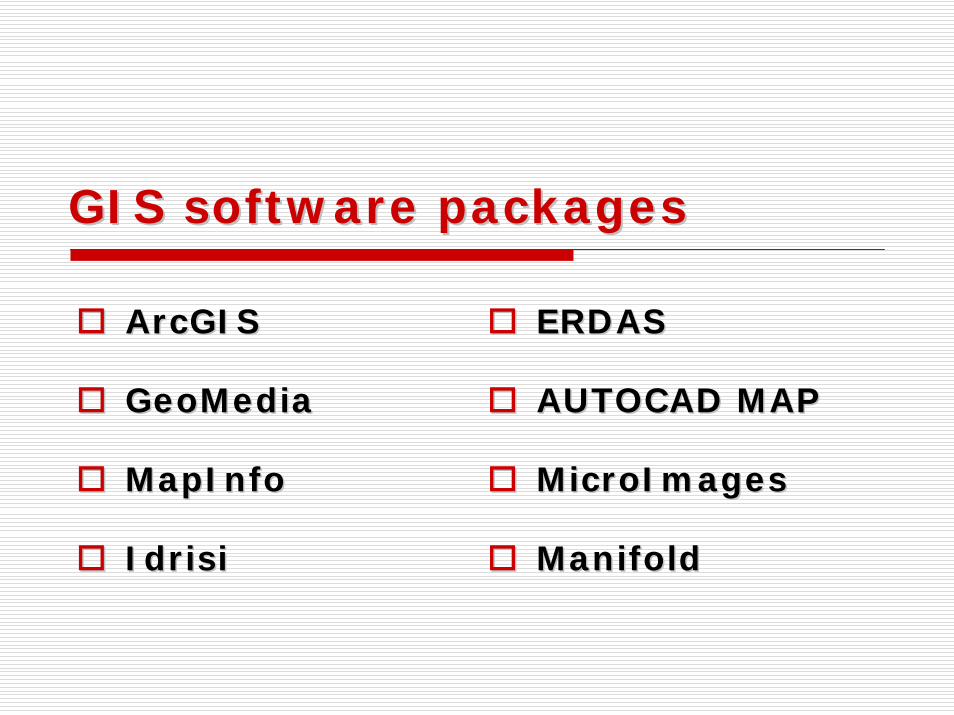
GIS software packagesGIS software packages
ArcGISArcGIS
GeoMediaGeoMedia
MapInfoMapInfo
Idrisi
ERDASERDAS
AUTOCAD MAPAUTOCAD MAP
MicroImagesMicroImages
ManifoldManifoldIdrisi
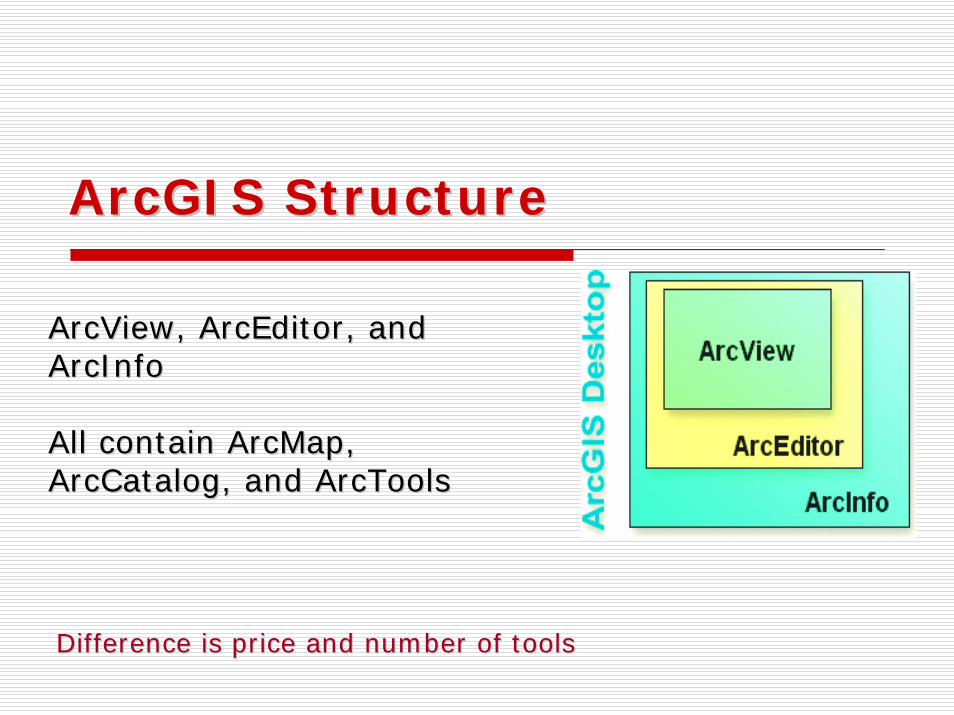
ArcGISArcGIS StructureStructure
ArcViewArcView, , ArcEditorArcEditor, and , and ArcInfoArcInfo
All contain All contain ArcMapArcMap, , ArcCatalogArcCatalog, and , and ArcToolsArcTools
Difference is price and number of toolsDifference is price and number of tools
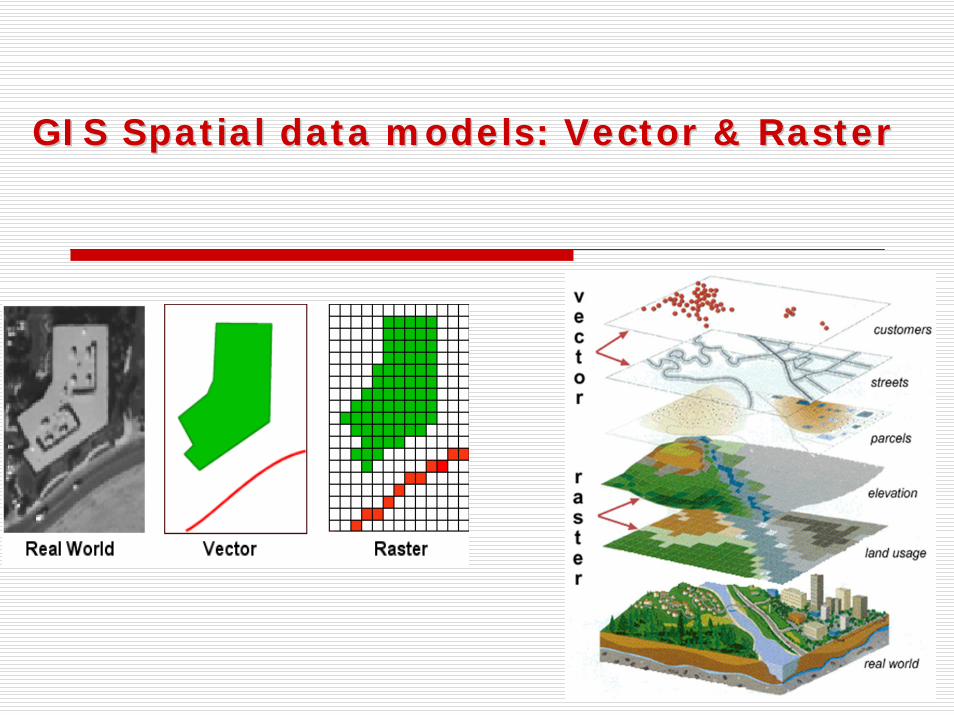
GIS Spatial data models: Vector & RasterGIS Spatial data models: Vector & Raster
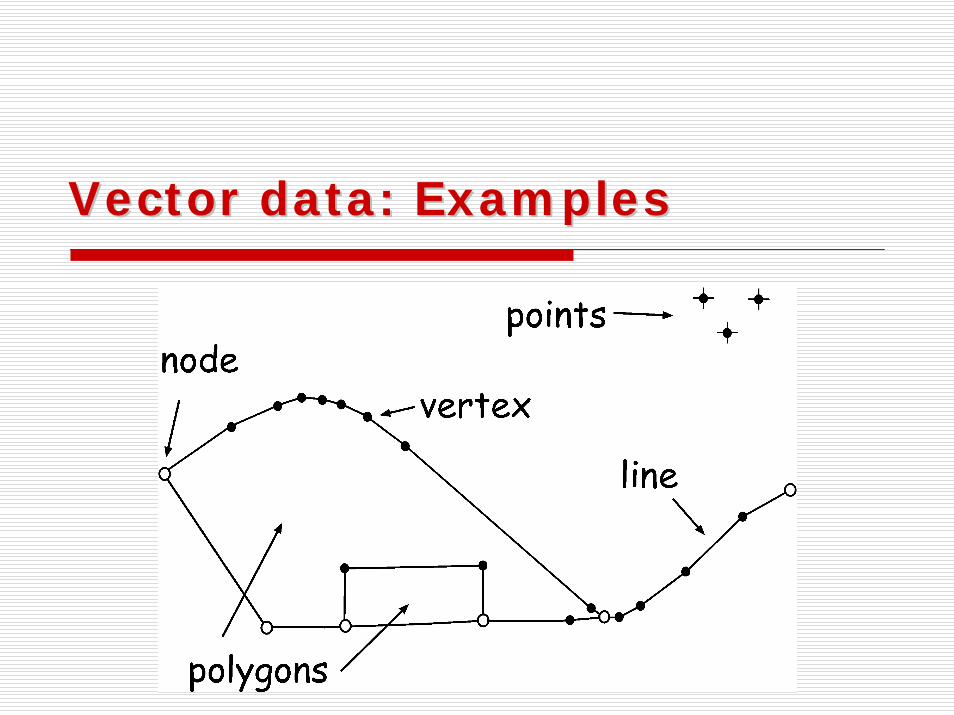
Vector data: ExamplesVector data: Examples

Raster data: ExamplesRaster data: Examples
Aerial PhotoAerial Photo Land useLand use
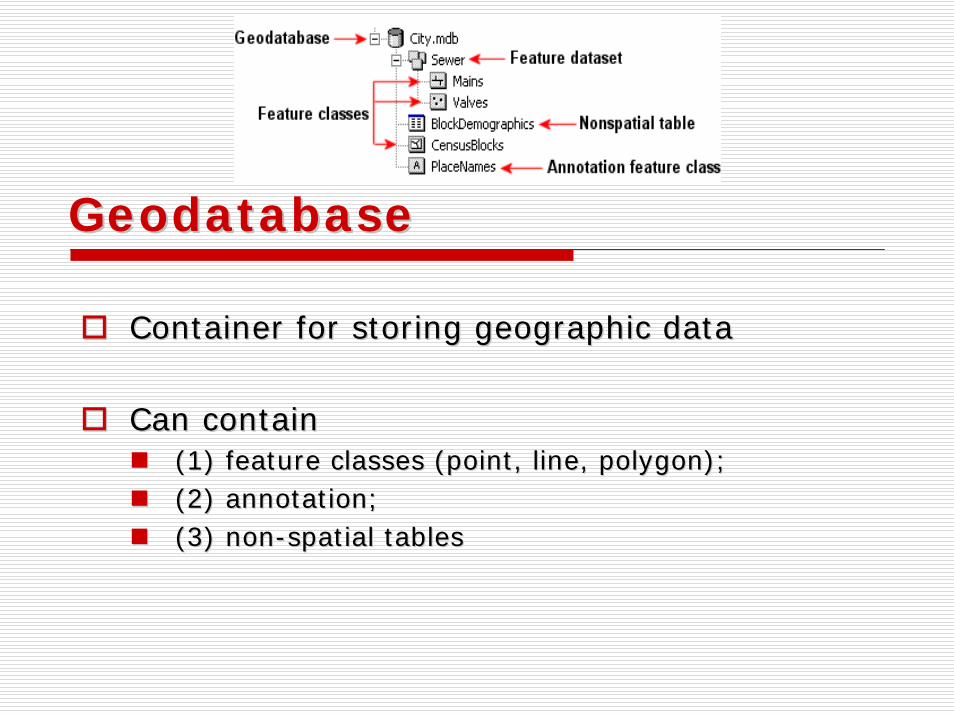
GeodatabaseGeodatabase
Container for storing geographic dataContainer for storing geographic data
Can contain Can contain (1) feature classes (point, line, polygon); (1) feature classes (point, line, polygon); (2) annotation; (2) annotation; (3) non(3) non--spatial tablesspatial tables
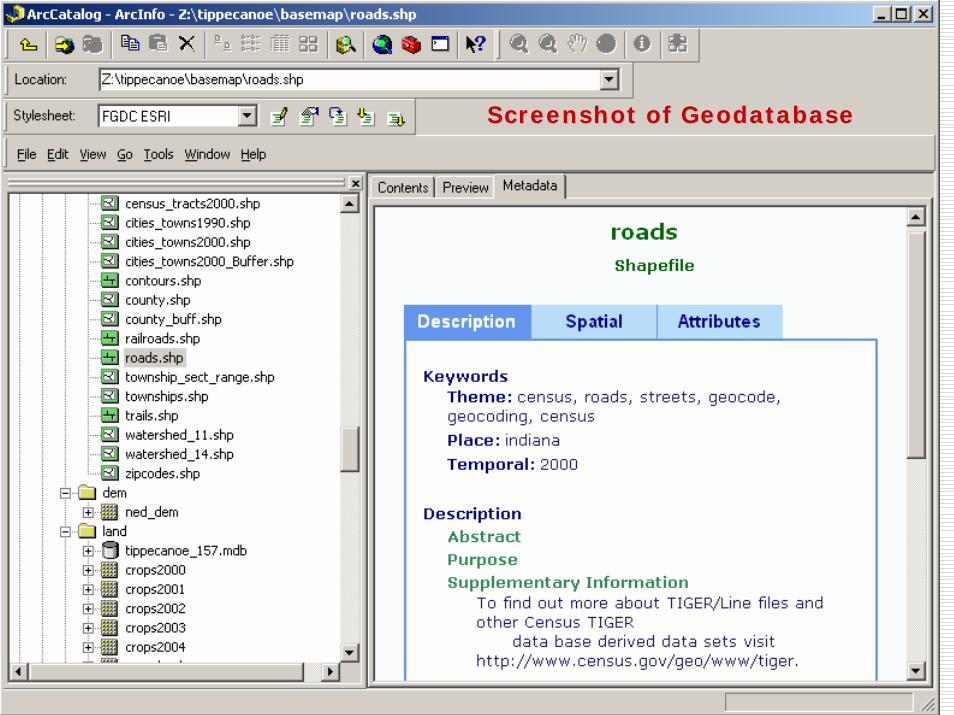
Screenshot of Screenshot of GeodatabaseGeodatabase
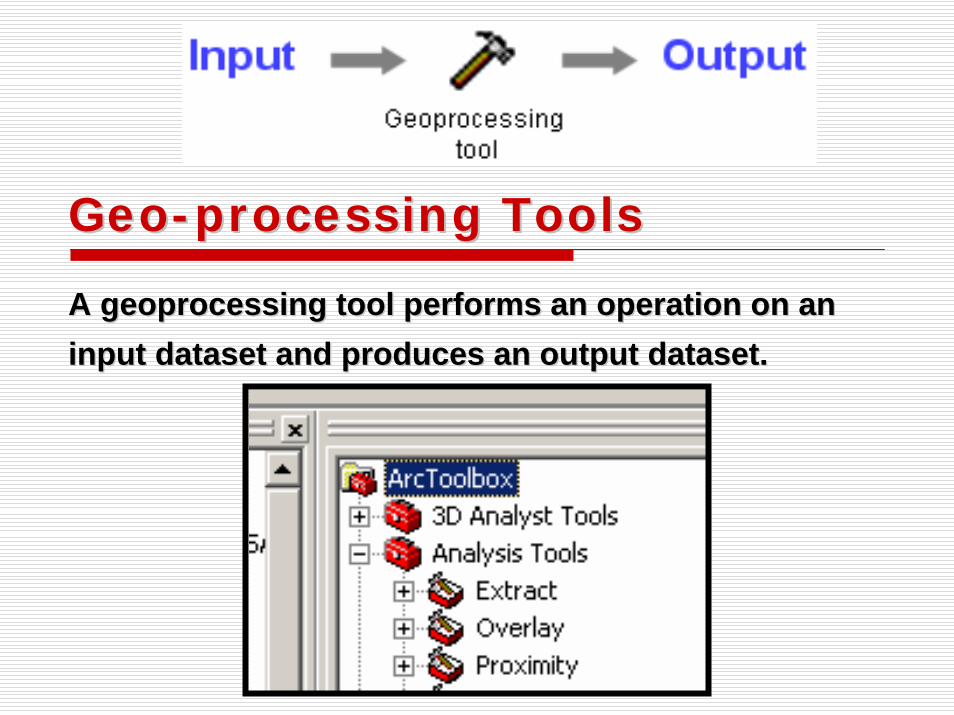
GeoGeo--processing Toolsprocessing Tools
A A geoprocessinggeoprocessing tool performs an operation on an tool performs an operation on an input dataset and produces an output dataset. input dataset and produces an output dataset.
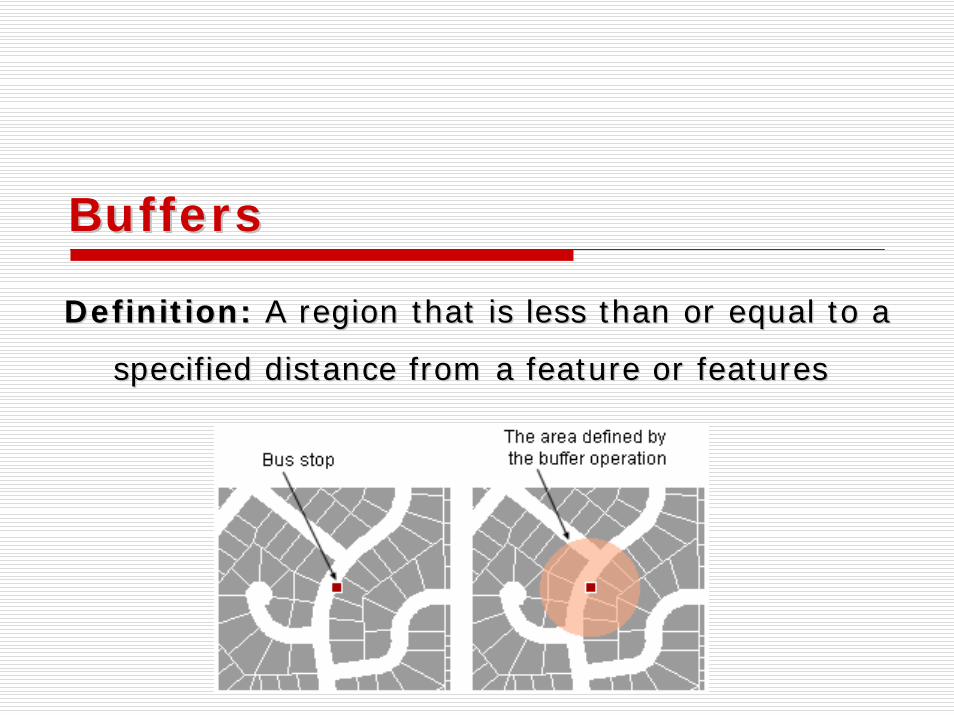
BuffersBuffers
Definition: Definition: A region that is less than or equal to a A region that is less than or equal to a
specified distance from a feature or featuresspecified distance from a feature or features
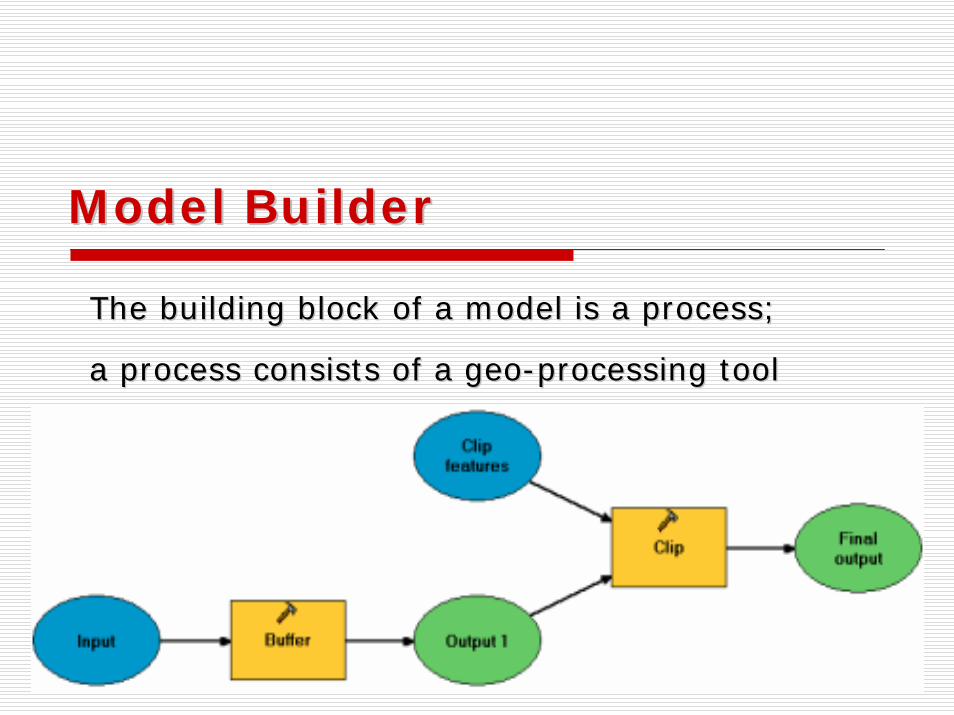
Model BuilderModel Builder
The building block of a model is a process; The building block of a model is a process;
a process consists of a geoa process consists of a geo--processing toolprocessing tool
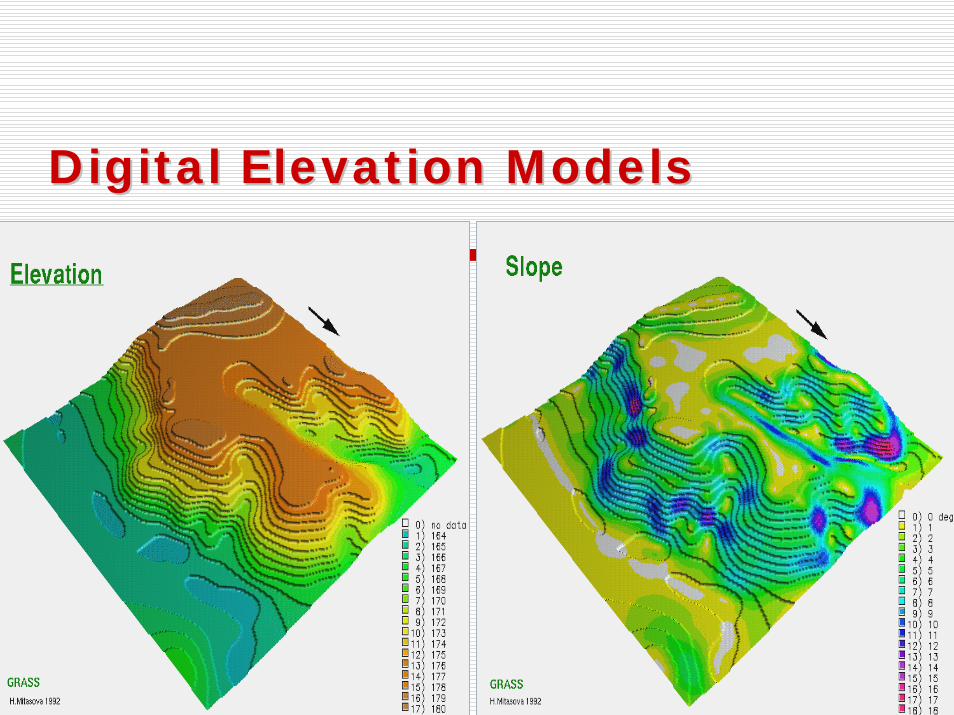
Digital Elevation ModelsDigital Elevation Models

ViewshedViewshed
ViewshedViewshed for a point is for a point is the collection of points the collection of points visible from that pointvisible from that point
Used in Used in sitingsiting facilitiesfacilities
-- power lines, power lines, --communication antennas, communication antennas, -- large industrial large industrial complexes, complexes, -- parks and scenic areasparks and scenic areas
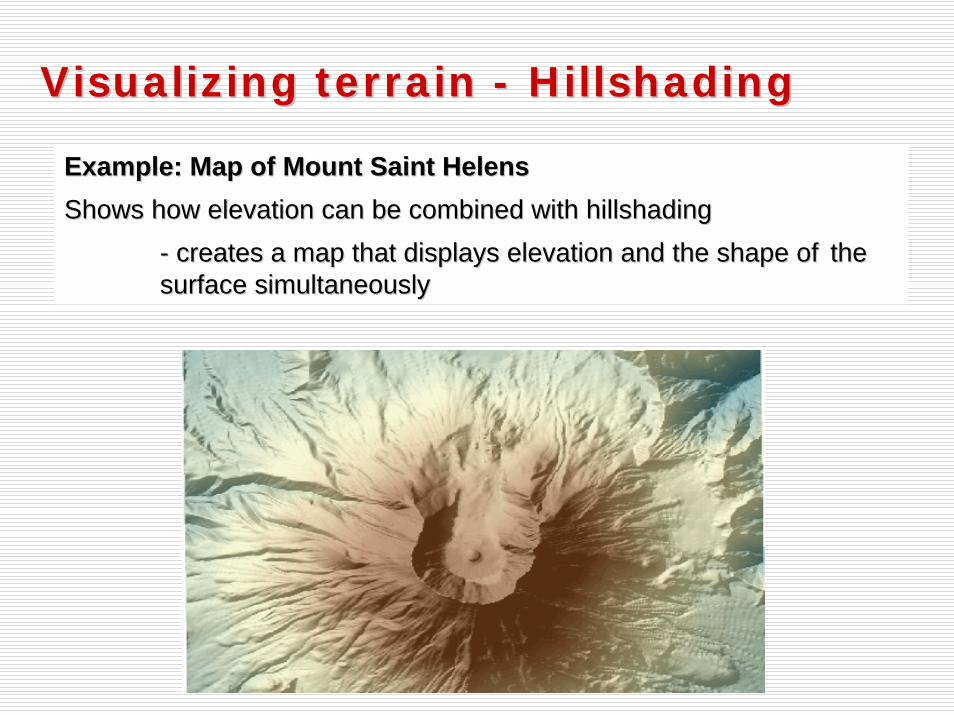
Visualizing terrain Visualizing terrain -- HillshadingHillshading
Example: Map of Mount Saint HelensExample: Map of Mount Saint HelensShows how elevation can be combined with Shows how elevation can be combined with hillshadinghillshading
-- creates a map that displays elevation and the shape of creates a map that displays elevation and the shape of the the surface simultaneouslysurface simultaneously
Software DemonstrationSoftware Demonstration
Part 2: GIS AnalysisPart 2: GIS Analysis-- A Case StudyA Case Study
Ashtabula Project
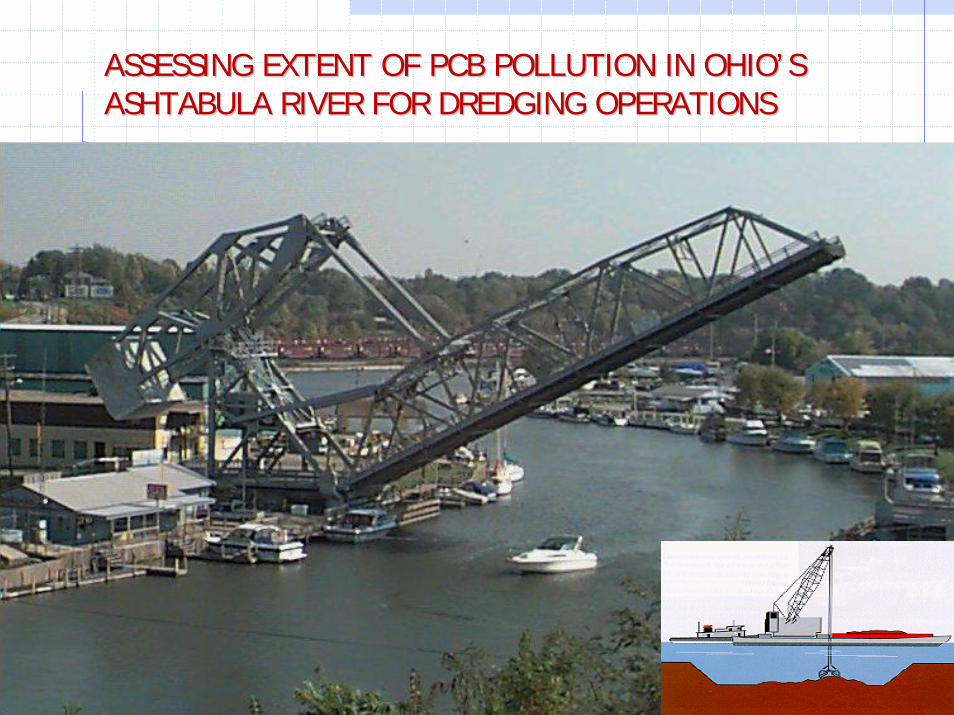
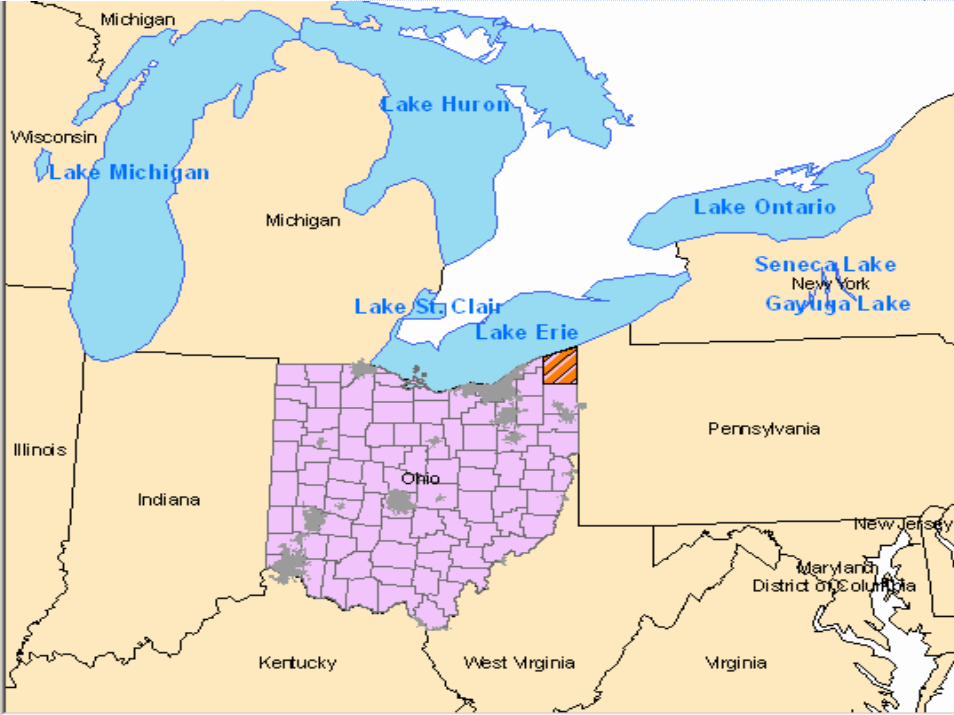
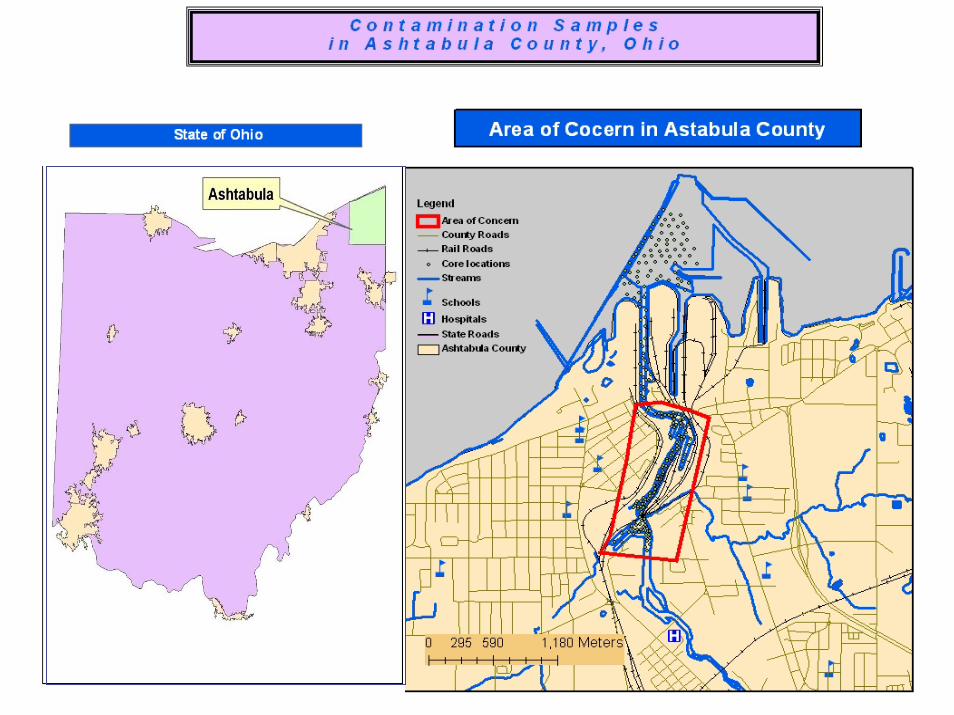
ASSESSING EXTENT OF PCB POLLUTION IN OHIOASSESSING EXTENT OF PCB POLLUTION IN OHIO’’S S ASHTABULA RIVER FOR DREDGING OPERATIONSASHTABULA RIVER FOR DREDGING OPERATIONS
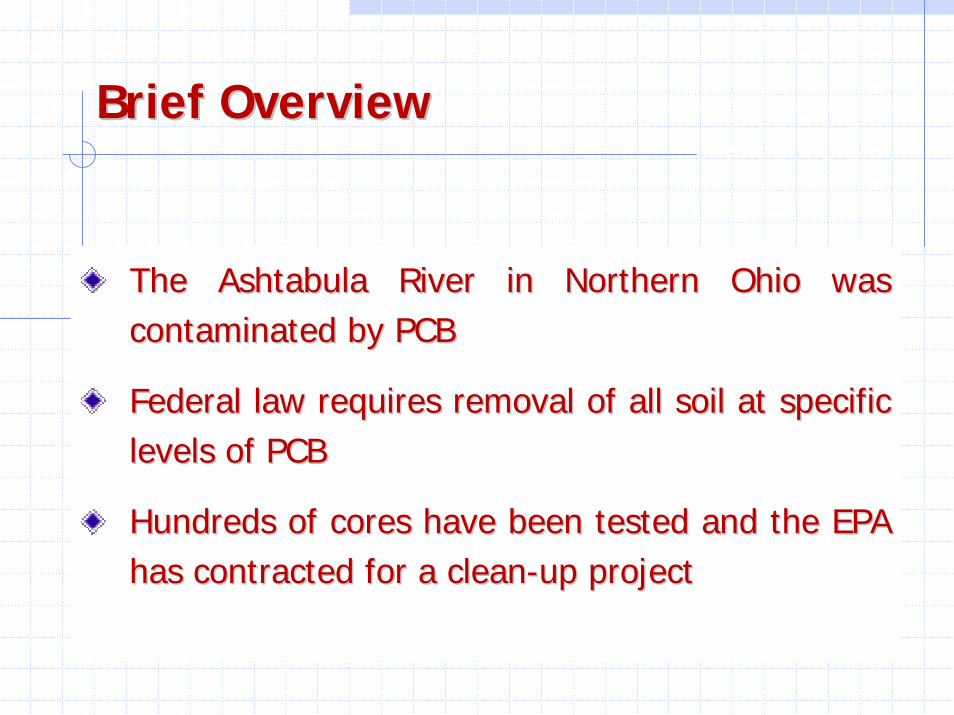
Brief OverviewBrief Overview
The Ashtabula River in Northern Ohio was The Ashtabula River in Northern Ohio was contaminated by PCBcontaminated by PCB
Federal law requires removal of all soil at specific Federal law requires removal of all soil at specific levels of PCBlevels of PCB
Hundreds of cores have been tested and the EPA Hundreds of cores have been tested and the EPA has contracted for a cleanhas contracted for a clean--up project up project
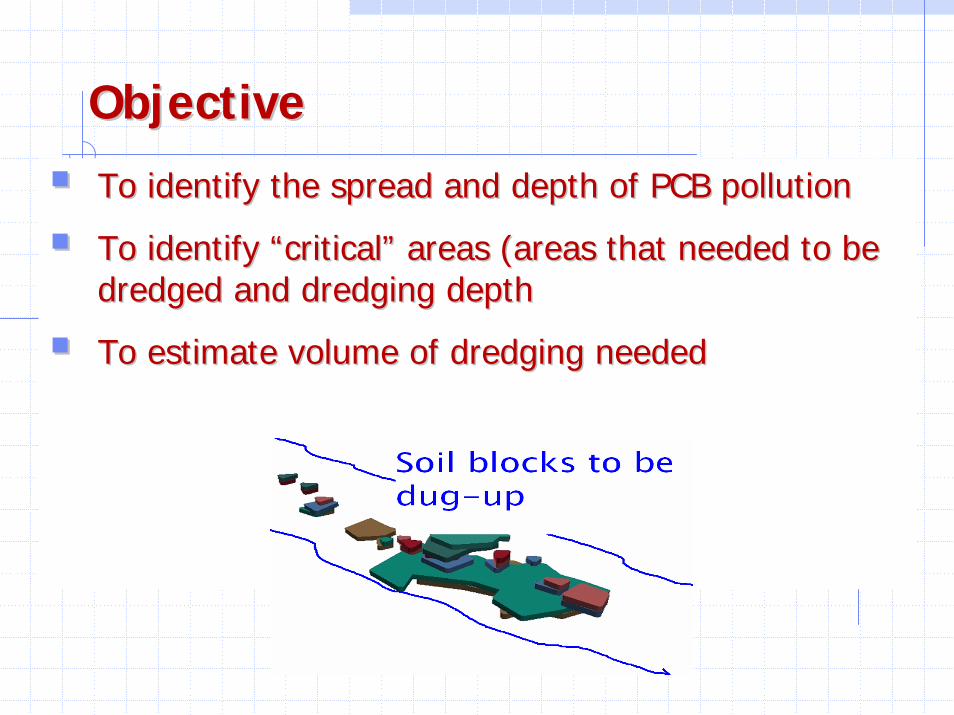
ObjectiveObjective
To identify the spread and depth of PCB pollutionTo identify the spread and depth of PCB pollution
To identify To identify ““criticalcritical”” areas (areas that needed to be areas (areas that needed to be dredged and dredging depthdredged and dredging depth
To estimate volume of dredging neededTo estimate volume of dredging needed
Name
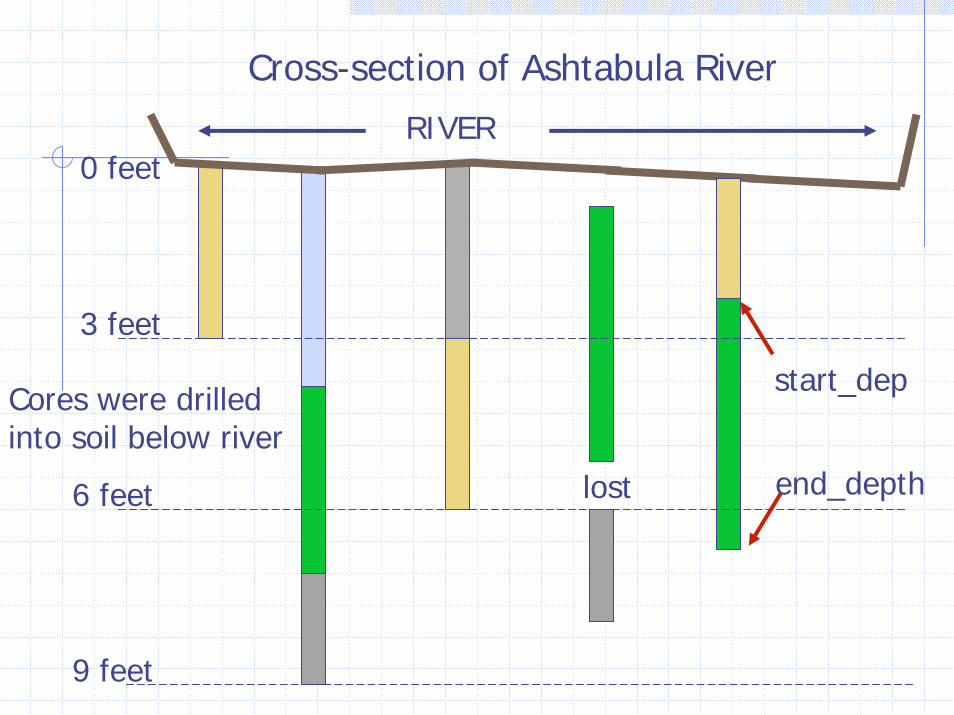
Cross-section of Ashtabula River
RIVER
3 feet
6 feet
Cores were drilled into soil below river
start_dep
end_depth
9 feet
0 feet
lost
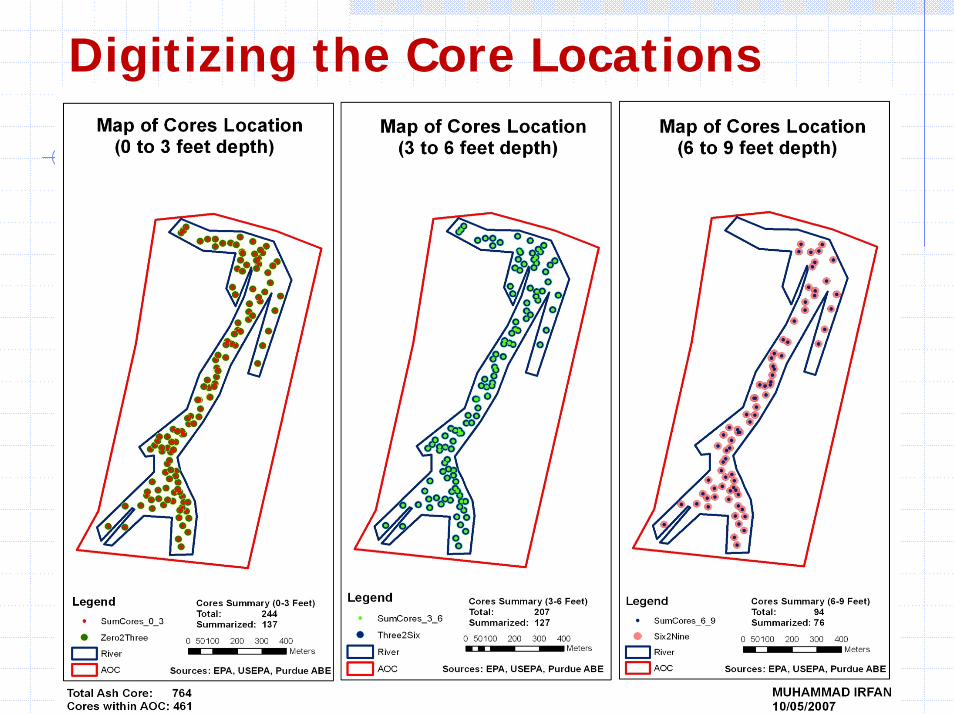
Digitizing the Core Locations
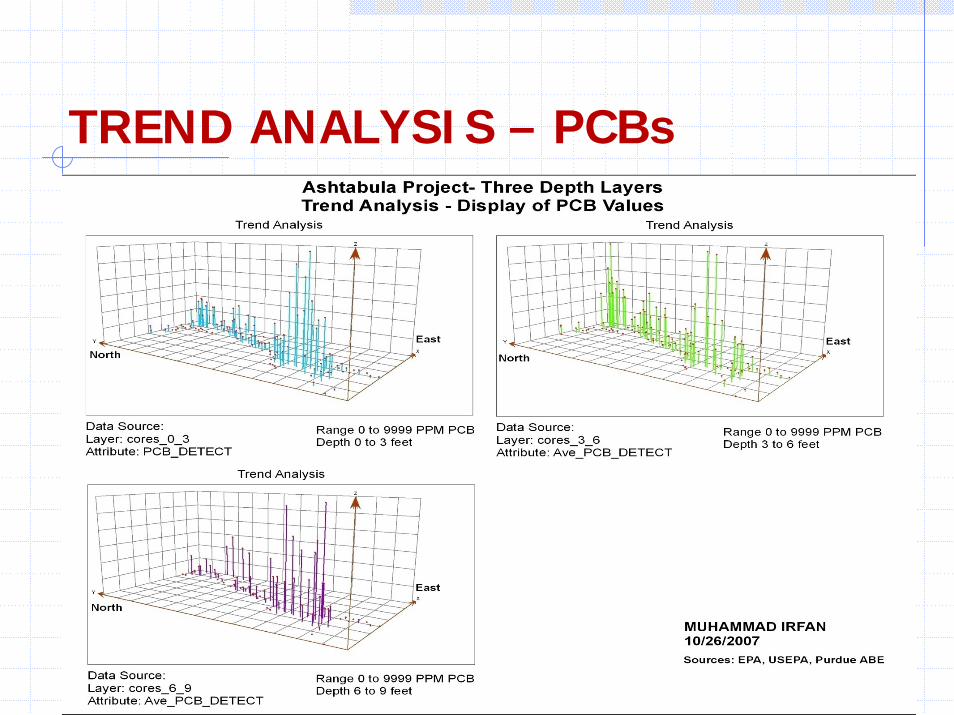
TREND ANALYSIS – PCBs

The sample points have The sample points have severalseveral cores at each locationcores at each location
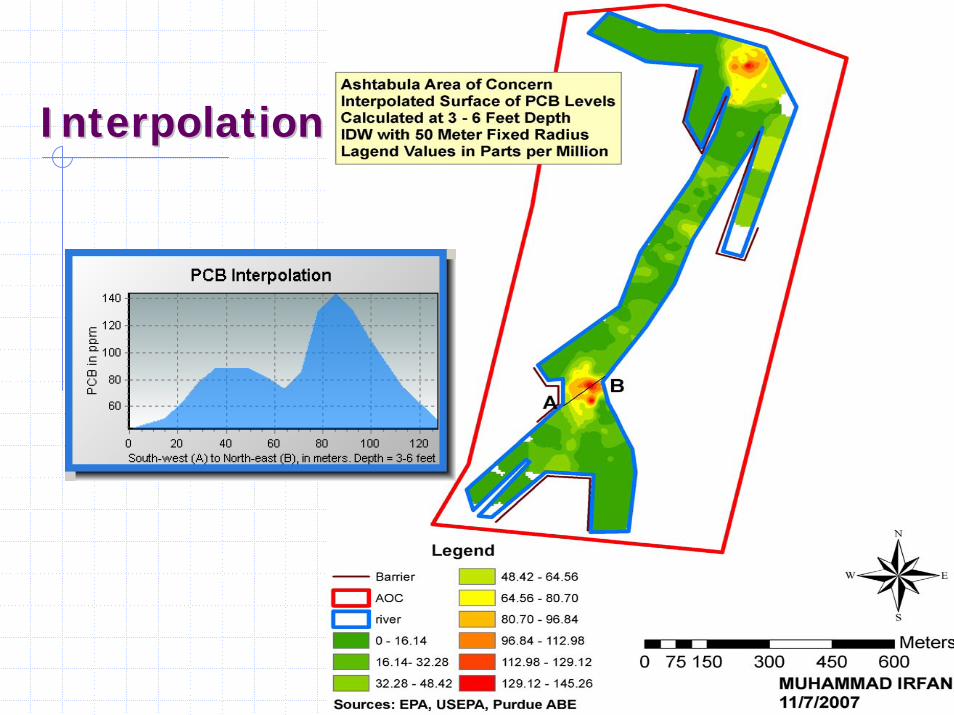
InterpolationInterpolation
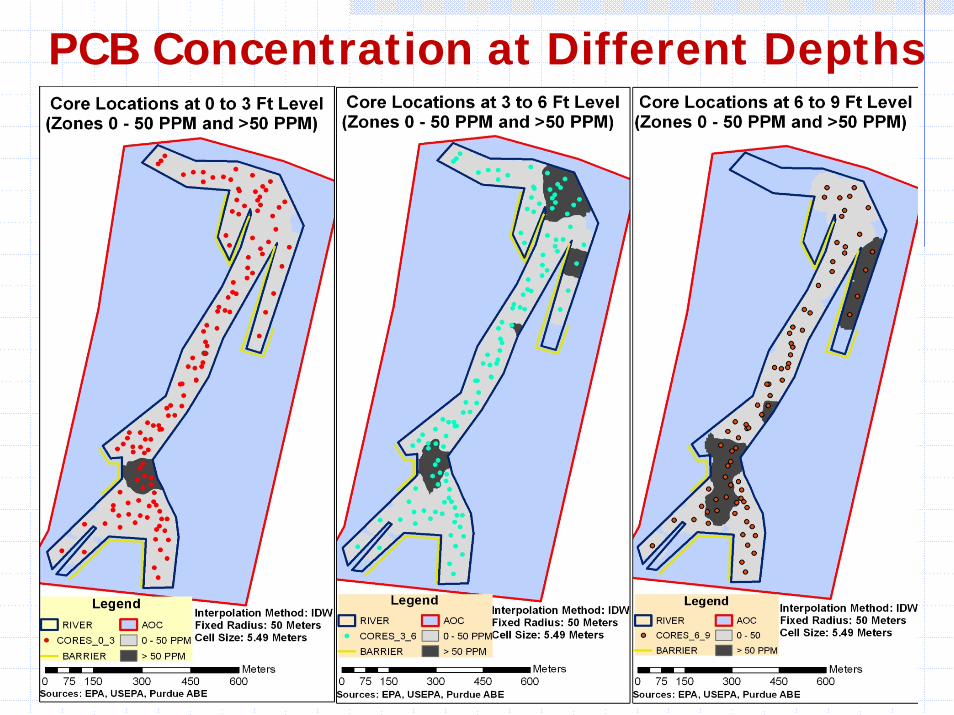
PCB Concentration at Different Depths
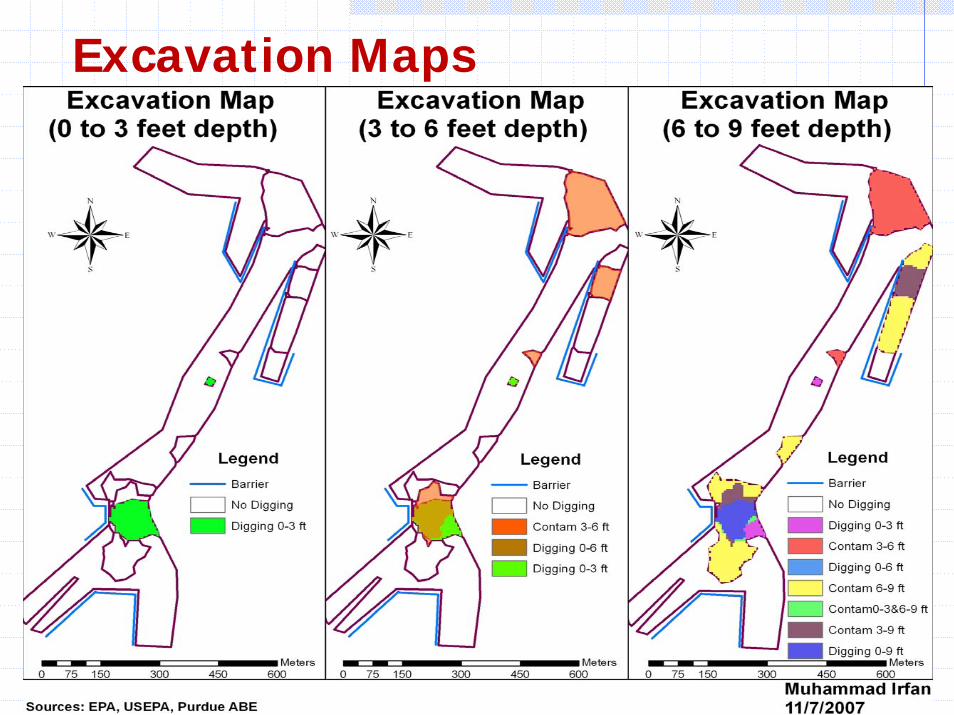
Excavation Maps
ConclusionsConclusions
GIS helped to:GIS helped to:Visualize the impacts of the PCB pollution Visualize the impacts of the PCB pollution
Geographical spread Geographical spread Intensity (depth)Intensity (depth)
Identify the critical areasIdentify the critical areasconcentration hotspots concentration hotspots -- southern and northsouthern and north--eastern eastern parts of Ashtabula Riverparts of Ashtabula River
Calculating the volume of work needed for remediationCalculating the volume of work needed for remediation
Questions?