Embed Size (px)
Citation preview

GIS Based System for Evaluating Groundwater Quality in the
Gaza Strip
By
Al-Moataz Billah Izzat Badwan
Supervised By
Dr. Fahid Rabah
Dr. Said Ghabayen
A Thesis Submitted in Partial Fulfillment of the Requirements for the
Degree of Master of Science in Civil - Water Resources Engineering
1431 هـ – 2010 م
The Islamic University of Gaza
High Studies Deanery
Faculty of Engineering
Civil Engineering Department
Water Resources Engineering
DEDICATION
- i -
DEDICATION
To
My Beloved Parents
My Little Motivators Amal and Nour
Brothers Farid, Mohammed and Sister Sana
and
My Wife

ABSTRACT
- ii -
ABSTRACT
Problems in Gaza water supply and sanitation have recently reached crisis levels, and are
largely connected to the deteriorating economical, political and security situations. The
potable water supply in the Gaza Strip will be depleted in 5-10 years.
This calls for strengthening the Palestinian Environmental Programmes by adaptation of
sustainability which is rapidly becoming a key decision driver in local and regional
planning, while planning is based on information, more than 80 percent of information is
geographically referenced, as faced with an overabundance of raw information, Gaza water
planners are awakening to the value of geographic analysis and spatial visualization.
Inclusion of information technology as part of the tools for WRM is becoming a necessity
using the advances in computer technologies which made geographic information services
a reachable goal, based on resources such as the MapWinGIS to support GIS functions in
totally unique GIS-enabled applications, this will increase the quality of information
provided to WRM and decision-makers, thus development of a tailored, process-based GIS
application will be of great help.
This application product is a prototype developed, using Visual Basic, map objects and
map files generated from ARCInfo. It has a set of menus and buttons with which managers
may query the geographic database. In this instance, data files supplied by CMWU have
been integrated with the map files prepared by PWA into a geographic database.
Monitoring of chloride as water quality indicator with respect to current practices may then
be followed while information accessed by managers as well as decision-makers can be
updated.
The easier it is to extend a GIS platform, the more usable it will be for scientists and
engineers who are not programmers. Thus, providing spatial solutions needs to be domain-
specific and easy-to-use through incorporating the power of a comprehensive GIS into a
user-friendly experience.

ملخـص الدراسـة
- iii -
501
81
MapWinGIS
Microsoft Visual Basic
ArcInfo

ACKNOWLEDGMENTS
- iv -
ACKNOWLEDGMENTS
Praise be to Allah the most compassionate the most merciful for giving me persistence and
potency to accomplish this.
Truthful thanks to my parents for being a great source of support and encouragement. I am
grateful to you for your love, moral support, and patience, through the time I've lived and
the time for me to live.
I would like to thank my supervisors Dr. Fahid Rabah and Dr. Said Ghabayen who were
there for me guiding and supporting.
Thanks also goes to Dr. Kahlid Qahman, who provided me and my colleagues with sound
advice.
Also thanks still goes to Eng. Ashraf Mushtaha, who also provided practical advice with
what is related to GIS.

TABLE OF CONTENTS
- v -
TABLE OF CONTENTS
DEDICATION ................................................................................................... i
ABSTRACT ...................................................................................................... ii
................................................................................................. iii
ACKNOWLEDGMENTS .................................................................................... iv
TABLE OF CONTENTS ..................................................................................... v
LIST OF TABLES ............................................................................................ ix
LIST OF FIGURES ........................................................................................... x
LIST OF ABBREVIATIONS..............................................................................xii
CHAPTER (1): INTRODUCTION ............................................................ 1
1.1. General Background .......................................................................................... 1
1.2. The looming water crisis in Gaza ......................................................................... 2 1.2.1 Climate change, population growth .............................................................................. 2 1.2.2 Israeli ―trap wells‖ allegation ...................................................................................... 2 1.2.3 Blockade ............................................................................................................... 3
1.3 The water resource situation in Gaza .................................................................... 3
1.4 The water supply situation in Gaza ....................................................................... 4
1.5 Problem statement ............................................................................................. 5
1.6 Justification of the research ................................................................................. 5 1.6.1 Gaza current situation in water resources development and management ............................... 5 1.6.2 Importance of the research ......................................................................................... 6
1.7 Research objective and anticipated outputs ............................................................ 6 1.7.1. Research objectives ................................................................................................. 6 1.7.2. Anticipated outputs ................................................................................................. 7
1.8 Area of Study .................................................................................................... 7 1.8.1 Location and Population ............................................................................................ 7 1.8.2 Demography ........................................................................................................... 7 1.8.3 Gaza strip geographical aspect .................................................................................... 8 1.8.4 Water supply institutions ........................................................................................... 9 1.8.5 Water Institutional Arrangement in Gaza ....................................................................... 9
1.9 Scope of the study and logical framework ............................................................ 10
1.10 Summary of Methodology ................................................................................ 10 1.10.1 Data collection phase ............................................................................................ 10 1.10.2 Tools................................................................................................................. 10 1.10.3 Thematic maps: ................................................................................................... 11 1.10.4 Application Structuring and development ................................................................... 11 1.10.5. Application testing and evaluation ........................................................................... 13
1.11 Conclusion .................................................................................................... 13
CHAPTER (2): LITERATURE REVIEW ................................................. 15
2.1 Introduction .................................................................................................... 15
2.2 Expert Systems and Artificial Intelligence ........................................................... 16 2.2.1 Expert Systems (ESs) ............................................................................................. 16
TABLE OF CONTENTS
- vi -
2.2.2 Benefits to End Users ............................................................................................. 17
2.3 Sustainability .................................................................................................. 17
2.4 Principles of Sustainable Groundwater Development ............................................ 18
2.5 Protection of groundwater quality ...................................................................... 18
2.6 The Geographic Information System (GIS) .......................................................... 19
2.7 GIS importance at its three levels ....................................................................... 19 2.7.1 Level (1).............................................................................................................. 19 2.7.2 Level (2).............................................................................................................. 20 2.7.3 Level (3).............................................................................................................. 20
2.8 Delivering Custom GIS Applications ................................................................... 20 2.8.1 Open Source applications ........................................................................................ 21 2.8.2 Custom open source GIS applications ......................................................................... 21 2.8.3 Solutions for Efficient GIS Development ..................................................................... 21 2.8.4 Delivering Custom GIS Applications with ArcGIS Engine from ESRI ................................ 21
2.8.4.1 ArcGIS Engine ............................................................................................... 21 2.8.4.2 Use of ArcGIS Engine ...................................................................................... 22
2.9 GIS for water utilities ....................................................................................... 22 2.9.1 Water Utilities‘ Primary Functions ............................................................................. 22
2.9.1.1 Planning ........................................................................................................ 22 2.9.1.2 Engineering ................................................................................................... 22 2.9.1.3 Operation and Maintenance................................................................................ 23 2.9.1.4 Administration ................................................................................................ 23
2.9.2 Rational Approach behind using GIS in water utilities .................................................... 23 2.9.3 GIS Applications in Water, Wastewater and Stormwater Systems ...................................... 24 2.9.4 Groundwater quality assessment using GIS .................................................................. 25
2.9.4.1 The groundwater quality index, GQI .................................................................... 25 2.9.4.2 Indexed Assessment of an aquifer‘s Water Quality .................................................. 25
2.10 GIS Analysis Techniques ................................................................................. 26 2.10.1 Overlay Analysis ................................................................................................. 26 2.10.2 Modeling ........................................................................................................... 27
2.10.2.1 Cartographic Modeling.................................................................................... 28 2.10.2.2 Simulation Modeling ...................................................................................... 28 2.10.2.3 Predictive Modeling ....................................................................................... 28 2.10.2.4 Model Calibration .......................................................................................... 28 2.10.2.5 Buffering ..................................................................................................... 29 2.10.2.6 Network Analysis .......................................................................................... 30
2.11 MapWindow GIS project ................................................................................ 30 2.11.1 Introduction to MapWindow project ......................................................................... 30 2.11.2 Background on MapWindow .................................................................................. 31 2.11.3 Other GIS extensibility architectures ......................................................................... 31
2.11.3.1 ArcGIS ........................................................................................................ 31 2.11.3.2 GRASS ....................................................................................................... 32 2.11.3.3 Quantum GIS ................................................................................................ 32
2.11.4 Logic behind developing MapWindow ...................................................................... 32 2.11.5 Architecture of MapWindow ActiveX Control ............................................................ 33
2.12 Future Water Needs for West Bank and Gaza .................................................... 36
2.13 Chlorides and Nitrates as Groundwater quality indicators ................................... 36 2.13.1 Chlorides and Nitrates in Groundwater ...................................................................... 37 2.13.2 Chlorides ........................................................................................................... 38
2.13.2.1 Sources of Chloride in groundwater .................................................................... 38 2.13.3 Nitrates .............................................................................................................. 38 2.13.4 Means of measuring Chloride and Nitrates: ................................................................ 39

TABLE OF CONTENTS
- vii -
2.14 Standards for chemicals of health significance .................................................... 39 2.14.1 Parameters and substances of aesthetic significance in international guidelines.................... 40
2.15 Conclusion .................................................................................................... 40
CHAPTER (3): METHODS AND MATERIALS USED FOR THE GIS-BASED
SYSTEM DEVELOPMENT ....... 41
3.1 Introduction .................................................................................................... 41
3.2 Application development environment ................................................................ 41
3.3 System Modularity ........................................................................................... 41
3.4 Materials and Methods ..................................................................................... 43 3.4.1 Data preparation .................................................................................................... 43 3.4.2 Database and object controls structure ........................................................................ 45
3.5 Conclusion ...................................................................................................... 47
CHAPTER (4): RESULTS AND DISCUSSION ......................................... 48
4.1 Application portability ...................................................................................... 48
4.2 Application overview ........................................................................................ 49
4.3 Regression analysis ........................................................................................... 62 4.3.1 Polynomial regression ............................................................................................. 62 4.3.2 Residues, Sum-of-Squares Error (SSE) ....................................................................... 65 4.3.3 Inflation of R2 in least squares regression..................................................................... 65
4.4 Map overlapping application ............................................................................. 68
4.5 Extended system application .............................................................................. 70 4.5.1 Virtual private network (VPN) .................................................................................. 70 4.5.2 Remote access VPNs .............................................................................................. 71 4.5.3 Productivity and Cost Benefit of VPNs ....................................................................... 71
4.6 Conclusion ...................................................................................................... 72
CHAPTER (5): CONCLUSION AND RECOMMENDATIONS .................... 73
5.1 Conclusion ...................................................................................................... 73 5.1.1 Introduction.......................................................................................................... 73 5.1.2 Benefits of the research ........................................................................................... 74 5.1.3 Compared to available applications ............................................................................ 74 5.1.4 Advantages of such development ............................................................................... 75 5.1.5 Constraints encountered .......................................................................................... 75 5.1.6 Shortcomings subject for further development .............................................................. 76
5.2 Recommendations ............................................................................................ 76
REFERENCES ................................................................................................ 78
APPENDIXIES ................................................................................................ 81
APPENDIX (A): Polynomial Regressions - Example .............................................. 81
APPENDIX (B): Map viewing Feature Code......................................................... 84
ANNEXES ...................................................................................................... 88
ANNEX (A): The Geographic Information System ................................................. 88
......................................................................................... 93

TABLE OF CONTENTS
- viii
-

LIST OF TABLES
- ix -
LIST OF TABLES
Table 1-1. PCBS, Population Growth in West Bank and Gaza (2000 to 2025) ................................8
Table 2-1. Projected Total Water Needs in MCM/year ................................................................. 36
Table 2-2. Maximum Concentrations Limits (MCL) of Cl- and NO3
-. ............................................ 37
Table 2-3. Standards for parameters in drinking-water, WHO guidelines ..................................... 40
Table 2-4. Standards for chemicals of health significance compared with WHO guidelines .......... 40

LIST OF FIGURES
- x -
LIST OF FIGURES
Figure 1-1. Map of shared and non shared groundwater aquifers, [1]. ..........................................4 Figure 1-2. Gaza strip ...................................................................................................................8
Figure 1-3. Existing Institutional Arrangement of Water Sector in Gaza [1] ..................................9
Figure 1-4. GIS-Based system development logical framework. ................................................... 11 Figure 1-5. System components, Inputs and Outputs .................................................................... 12
Figure 2-1. The 3 elements of geographic data ........................................................................... 19
Figure 2-2. An example of overlaying various layers in a GIS ..................................................... 26
Figure 2-3. Raster calculator concept in ArcMAP 9.1 ................................................................. 27 Figure 2-4. Obtaining information on same location from differ rent layers ................................ 27
Figure 2-5. User waiver search radius distances......................................................................... 29
Figure 2-6. User Buffering feature, available in three levels ....................................................... 30 Figure 2-7. Visual Basic 6, simplest MapWindow usage.............................................................. 34
Figure 2-8. Visual Basic 6, Code for showing a shapfile ............................................................. 34
Figure 2-9. Visual Basic 6, adding more shapefiles for MapWindow ........................................... 35
Figure 2-10. Visual Basic 6, Code for showing a shapefile .......................................................... 35 Figure 2-11. Water wells distribution in Gaza, source OCHA, oPT ............................................. 39
Figure 3-1. Use of Active X controls in Visual Basic programming environment ......................... 42
Figure 3-2. Use of Active X controls and handling other Shapefiles, Gaza governorates ............. 43 Figure 3-3. Collected information for 125 wells for research study, Map featuring mode. ........... 44
Figure 3-4. Collected information for 10 wells for research study, map prediction mode. ............ 44
Figure 3-5. Shapefile and data preparation for the 125 water wells ............................................ 45 Figure 3-6. Other shapefiles needed preparation such as landuse, soil and municipalities .......... 45
Figure 3-7. Database files in Access; ID key is the well code ...................................................... 46
Figure 4-1. Package and Deployment tool of Visual Basic 6.0 .................................................... 48
Figure 4-2. Map Viewing Features main screen .......................................................................... 50 Figure 4-3. Scaling capabilities of integrated mapping system (full scale) ................................... 50
Figure 4-4. Exploring through listed wells .................................................................................. 51
Figure 4-5. Well time series through a friendly charting system. ................................................. 52 Figure 4-6. Bore-log presented to describe different soil strata for the subject well. .................... 53
Figure 4-7. Bore-log and log legend and details. ........................................................................ 53
Figure 4-8. Local or international MCL, showing Wells with concentrations above .................... 54 Figure 4-9. Labeling feature (only active) when user prompt for. ................................................ 55
Figure 4-10. Buffering feature, Level 1: Buffering with specific radius. ....................................... 56
Figure 4-11. Buffering feature, Level 2: Buffering with dynamic radius, fixed well. ..................... 57
Figure 4-12. Buffering feature, Level 2: Buffering with dynamic Well location. ........................... 58 Figure 4-13. Switching between screens and modes (Map Viewing Features Mode). ................... 59
Figure 4-14. Loading other shapfiles .......................................................................................... 59
Figure 4-15. Shapefile Landuse loaded with automatic coloring system. ..................................... 60 Figure 4-16. Switching between screens and modes (Predication Features Mode). ..................... 61
Figure 4-17. Exporting to MS Excel ............................................................................................ 62
Figure 4-18. Buffering feature, level 3: Level three: fixed radius, different locations ................... 64
Figure 4-19. Polynomial regression analysis is conducted here through the least squared error . 65 Figure 4-20. Prediction for other years showing real and predicted values and error ................. 66
Figure 4-21. Preview of data recorded and developed and exporting it to MS Excel.................... 67
Figure 4-22. Time series calculation for set of years using the developed equation ..................... 67 Figure 4-23. Land use for selected well E/54 .............................................................................. 68
Figure 4-24. Soil type for selected well R/3 ................................................................................. 69
Figure 4-25. Municipality identifier for selected well Q/41 ......................................................... 69

LIST OF FIGURES
- xi -
Figure 4-26. Defined VPN through Gaza targeted areas ............................................................. 70
Figure 4-27. Remote Access VPNs .............................................................................................. 71

LIST OF ABBREVIATIONS
- xii -
LIST OF ABBREVIATIONS ADO ActiveX Data Objects: A data access interface that communicates with OLE DB-
compliant data sources to connect to, retrieve, manipulate, and update data).
AI Artificial Intelligence
APIs Application Programmer Interfaces
CL Chloride
CMWU Coastal Municipalities Water Utility
ES Expert System
ESRI Environmental Systems Research Institute
GIS Geographic Information System
GRASS Geographic Resources Analysis Support System
IAWQ Indexed Assessment of an aquifer‘s Water Quality
KBS Knowledge-Based System
KS Knowledge System
MCL Maximum Concentrations Limits
MCM Million Cubic Meters
Mo Object MapObjects
MoA Ministry of Agriculture
MoLG Ministry of Local Government
NO3 Nitrate
NWC National Water Council
OCHA Office for the Coordination of Humanitarian Affairs
OCX OCX or ActiveX control is implemented as a dynamic link library DLL module.
(One can think of a DLL program as a "subprogram" that can be used by any number of application programs.
ODBC (Open Database Connectivity) A standard protocol that permits applications to
connect to a variety of external database servers or files.
ODBC driver A dynamic-link library (DLL) used to connect a specific Open Database
Connectivity data source with another (client) application.
oPT occupied Palestinian Authority
PA Palestinian Authority
PCBS Palestinian Central Bureau of Statistics
PWA Palestinian Water Authority
RAD Rapid Application Development
SSE Sum of Square Errors
SQL Structured Query Language, such as SELECT, UPDATE, or DELETE.
TDS Total Dissolved Solids
UWRL Utah Water Research Lab
VBA Visual Basic for Applications
VPN Virtual Private Network
WAN Wide Area Network
WBGS West Bank and Gaza Strip
WHO World Health Organization
WRM Water resources manager
WYSIWYG What You See Is What You Get
CHAPTER (1): INTRODUCTION
- 0 -
1. CHAPTER (1): INTRODUCTION
1.1. General Background
No new sources have been officially developed in Gaza since Oslo II and heavy over
drafting of groundwater has led to groundwater quality decline and seawater intrusion.
Only 5-10% of the aquifer is now yielding drinking quality water. The population has
responded to water shortages with private well drilling and desalination for domestic
supply purposes [1], adding that every year Gaza is extracting more than what it is
injecting via rainfall and lateral/vertical groundwater flows into the aquifer.
The salinization of the near shore inland aquifers by infiltrating seawater represents a
world wide phenomenon. It becomes a problem in coastal regions such as Gaza where
inland fresh groundwaters are hydraulically connected with seawater, additional to the
groundwater nitrate problem that is also an international in scope, and local in Gaza, this is
due to the fact that Nitrate is not easy to detect and excessive concentrations of nitrate can
cause ecological damage and health hazards.
Accordingly, management of limited groundwater resources in such situations is a delicate
task and requires special attention.
Geographic Information System (GIS) can be defined as a system for entering, storing,
manipulating, analyzing, and displaying geographic or spatial data. The development of
Geographic Information Systems GIS is highly influenced by the evolution of information
technology; the paradigm of GIS is shifting. Traditional GIS systems provide capabilities
to handle georeferenced data, including data input, storage, retrieval, management,
manipulation, analysis, and output. However, with closed and centralized legacy
architecture, current GIS systems cannot fully accommodate distributed, diverse network
environments due to their lack of interoperability, modularity, and flexibility. With
advances in computer networking technologies, a distributed geographic information
services paradigm becomes a reachable goal [2].
To provide spatial solutions to non-GIS users, developers need the ability to build domain
specific, easy-to-use applications that can incorporate the power of a comprehensive GIS

CHAPTER (1): INTRODUCTION
- 2 -
into a user-friendly experience. These applications, if built from scratch, can be an
overwhelming development effort and may be time consuming and not cost-effective.
Assessment of current situation of GIS application through out Gaza water resources
associations and facilities indicates shortage in means of data manipulation, it became clear
also that water resources managers and municipalities' officers are not all familiar with
sophisticated applications in GIS such as ArcMap 9 series versions, and do not have much
time to learn the GIS software. To develop the application screens, the design of the GIS
prototype has therefore been focused on spatial data query, display, with the fact that no
prerequisite knowledge of GIS is necessary.
1.2. The looming water crisis in Gaza
Different factors are contributing to the situation of poor quality in Gaza, these are:
1.2.1 Climate change, population growth
The decrease in useable water reserves has also been linked to climatic changes, such as
lower rainfall, which have slowed the recharge rate of the aquifer. Other factors are a rapid
population growth and increasing suburban sprawl, leaving little space for rainwater
catchment areas. Gaza is one of the most densely populated places on earth with 1.6
million Palestinians living in 365 km2. Its population is expected to increase by 85 percent
to close to three million by 2025 [3].
Desperate to secure safe water resources, the population has responded by drilling private
wells - many of them unlicensed - which have further contributed to the degradation of the
aquifer, according to the World Bank. The Palestinian Water Authority (PWA), which
formulates water policies for the territories, has been effectively suspended in Gaza, as it is
a governmental institution of the Palestinian Authority (PA) in the West Bank.
1.2.2 Israeli “trap wells” allegation
―Unlike the West Bank, Gaza is ‗downstream‘ of the portion of the aquifer that lies
beneath Israel, with lateral groundwater flows coming from Israel into the Gaza portion of
the aquifer,‖ CMWU. ―The groundwater underneath Gaza is becoming limited due to
Israel‘s construction of trap wells [about 27 wells] inside Israel, along Gaza‘s eastern
political border, siphoning water supplies from the aquifer before they reach Gaza.‖

CHAPTER (1): INTRODUCTION
- 3 -
According to the Israeli Water Authority, the Gaza aquifer has no impact on Israel and
Israel does not prevent the flow of surface water or groundwater to the Gaza aquifer [3].
1.2.3 Blockade
Since 2005, Gaza‘s water supply has also been affected by restricted access to power, fuel
and spare parts, [1]. Equipment and supplies needed for the construction, maintenance and
operation of water and sanitation facilities have been denied entry to Gaza
―Fifty percent of Gaza households use septic tanks to dispose of sewage,‖ CMWU.
―Materials used to line and insulate the septic tanks are unavailable due to the closures.‖
Water and sanitation conditions worsened further during and after Israel‘s 23-day offensive
which ended on 18 January 2009, due to infrastructure damage. About 10,000 Gaza
residents do not have taps in or near their homes and an additional 60 percent of the
population - about one million people - do not have continuous access to water, CMWU.
Gaza has a master plan for water and sanitation but less that 2 percent of it has been
implemented because of the Israeli blockade. Even small relief projects have had to be
abandoned due to a lack of materials [3].
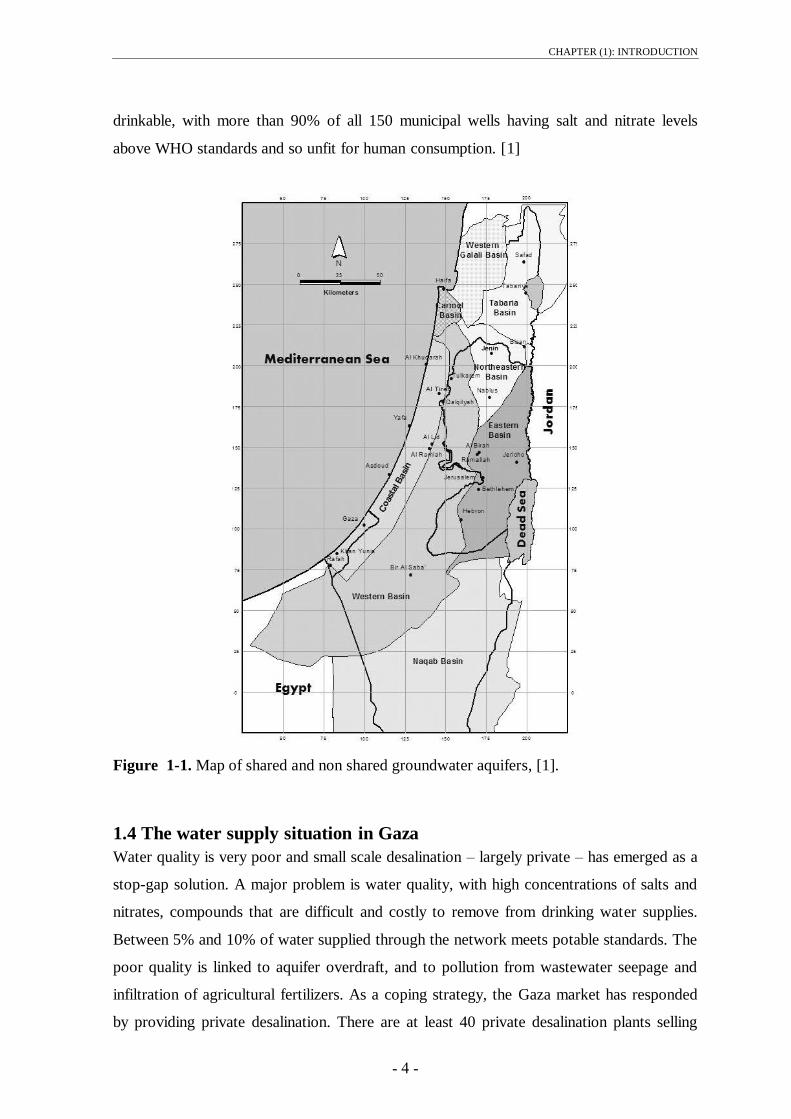
1.3 The water resource situation in Gaza
Gaza‘s coastal aquifer extends from Haifa in the north to the Sinai desert in the south, and
from Mt Hebron in the east to the Mediterranean in the west (Gaza‘s coastline), Figure 1.1,
[1].
The resource is overdrawn and needs to be returned to sustainable levels of extraction. The
sole fresh water resource of Gaza is the coastal aquifer, which also runs beneath the coast
of Israel. In contrast to the West Bank situation, Palestinian Gaza is ―downstream‖ of the
portion of the aquifer that underlies Israel, with flows coming from Israel into the Gaza
portion of the aquifer. With normal flows, the current sustainable yield of the aquifer
segment underlying Gaza is estimated at about 57 MCM, around 15% of the total yield of
the shared aquifer, which is estimated at 360-420 MCM. Abstractions in recent years have
been running well above any estimate of sustainable yield. The overdraft is currently
(2008) estimated at 100 MCM, almost 200%. As a result, there has been a continual
decline in the static water level, water quality has been deteriorating, and there is an
increase of seawater intrusion. Now 5-10% of the portion of the aquifer underlying Gaza is
CHAPTER (1): INTRODUCTION
- 4 -
drinkable, with more than 90% of all 150 municipal wells having salt and nitrate levels
above WHO standards and so unfit for human consumption. [1]
Figure 1-1. Map of shared and non shared groundwater aquifers, [1].
1.4 The water supply situation in Gaza
Water quality is very poor and small scale desalination – largely private – has emerged as a
stop-gap solution. A major problem is water quality, with high concentrations of salts and
nitrates, compounds that are difficult and costly to remove from drinking water supplies.
Between 5% and 10% of water supplied through the network meets potable standards. The
poor quality is linked to aquifer overdraft, and to pollution from wastewater seepage and
infiltration of agricultural fertilizers. As a coping strategy, the Gaza market has responded
by providing private desalination. There are at least 40 private desalination plants selling
CHAPTER (1): INTRODUCTION
- 5 -
both wholesale by tanker and retail by jerry can, producing about 2,000 m3 a day. There
are also estimated to be more than 20,000 home desalination plants. The feedstock is
brackish water from wells. Prices are high: NIS 50/m3, but there is no choice. Private
production supplements the four public desalination plants run by CMWU (the regional
water utility) that produce 1,000 m3/day. Now almost everyone who can depends on
brackish water desalination for drinking [1].
1.5 Problem statement
Decision-makers in the Gaza strip and non-technical water managers in water resources
management and more specifically in ground water quality assessment usually face
difficulties in dealing with sophisticated tools of information such as Geographical
Information System (GIS) through its adopted applications such as ArcMap, ArcView,
Geomedia Professional and other applications that could possibly be used locally.
Custom open GIS applications could act as Decision Support System (DSS) and to some
extent as a Spatial Decision Support System (SDSS) which is a computer–based system
designed to assist decision system. Typically, such a system will include spatial data
relevant to the decision. Expert Systems (ES) are also used to assist decision maker in
achieving their goals through proper manipulation of data available.
This lack of an easy-to-use tools in addition to the worsening situation of the ground water
available in Gaza through its coastal aquifer, led to management difficulties despite of the
availability of large set of data on water related parameters and factors.
1.6 Justification of the research
1.6.1 Gaza current situation in water resources development and management
No new sources have been officially developed in Gaza since Oslo II and heavy over
drafting of groundwater has led to groundwater quality decline and seawater intrusion.
Only 5-10% of the aquifer is now yielding drinking quality water [3]. The population has
responded to water shortages with private well drilling and desalination for domestic
supply purposes. The two principal causes of the impacts described above are:
Failings in water resources development and management that have contributed to the
low and declining per capita water resource availability; and

CHAPTER (1): INTRODUCTION
- 6 -
The low investment rates and weak management of water services that have led to poor
access, high costs and negative health and environmental impacts.
Failings in water resources development and management have contributed to the low and
declining per capita water resource availability and to inadequate development of new
water resources; and sub-optimal management of developed water sources [1].
1.6.2 Importance of the research
Contamination of drinking water has become a major challenge to the Environmentalist in
the Gaza, where more and more people are exposed to contamination of drinking water,
many issues arise that not only involve premeditating the contaminated water, but also
preventing similar situations from occurring in the future.
Supporting applications in the filed of water quality are essential tools towards correct
assessment of the situation and hence correct decision being made after that, thus, helping
to achieve sustainable and balanced system of utilizing current available resources.
By developing an expert system for decision makers and a software by which large number
of data can be handled in a user friendly manner, this is needed and possible through out
the development of an easy-to-use tool answering specific needs concerning specific water
quality parameters is essential especially that the spatial extent of information in use is
presented effectively in the application [6].
1.7 Research objective and anticipated outputs
1.7.1. Research objectives
Making GIS products more affordable and not confined to the exclusive environment
of professional GIS software, which is usually quite costly, and requires training and
skills.
Developing an easy-to-use GIS based application that should have a friendly user
interface enabling non-technical users maneuvering through indicator parameters of
groundwater quality.
Introducing the use of GIS open source libraries i.e. MapWindow GIS that is
commonly used worldwide in different custom applications for the Spatial Decision
Support System SDSS that provides the use of selected features from GIS applications

CHAPTER (1): INTRODUCTION
- 7 -
such as spatial distribution , accompanied with very rich set of database and elaborating
tools such as charts, diagrams, tables to allow the user to maneuver over large amount
of data
Providing a tool for assessing Chloride (Cl-) and Nitrate (NO3
-) occurrence and
variation from WHO guidelines and limits.
Assessing groundwater quality based on available data set.
To some extent, providing a prediction tool for expected future concentrations of
parameters.
1.7.2. Anticipated outputs
Anticipated application outputs:
1. Information tool (spatially presented and previewed data)
2. evaluation tool for water quality based on indicators through a time-series approach
3. preview thematic map of ground water quality,
4. Providing a forecast tool for future scenarios and situation based on current trend of
change of existing time-series data.
1.8 Area of Study
1.8.1 Location and Population
The Gaza strip is located in the southeastern coast of Palestine with Longitude of 34:21:38
E and Latitude of 31:29:45 N. The area is bounded by the Mediterranean in the west, the
1948 cease-fire line in the north and east and by Egypt in the south (Figure 1.2). The total
area of the Gaza strip is 365 km2 with approximately 40 km long and the width varies from
8 km in the north to 14 km in the south, shown in figure 1.2 [7].
1.8.2 Demography
The population in Gaza strip has reached about 1.8 million in the year 2010 with an annual
growth rate of 3.9%. The average population density is almost 2297 person/km2. The
population density in the refugee camps of the Gaza Governorates ranges form 29 to 100
thousands person/km2 in the Beach camp, Table 1.1 shows the revised estimates of the
population projection in Gaza strip as given by PCBS 2009 [8].
CHAPTER (1): INTRODUCTION
- 8 -
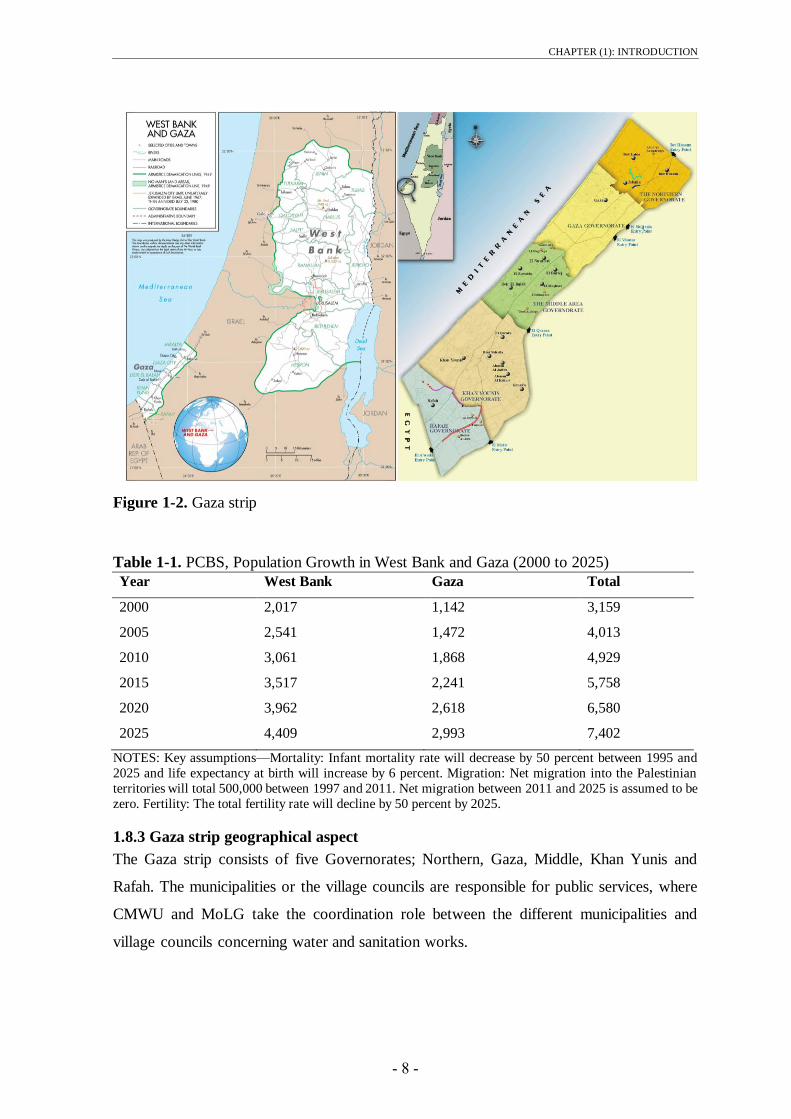
Figure 1-2. Gaza strip
Table 1-1. PCBS, Population Growth in West Bank and Gaza (2000 to 2025)
Year West Bank Gaza Total
2000 2,017 1,142 3,159
2005 2,541 1,472 4,013
2010 3,061 1,868 4,929
2015 3,517 2,241 5,758
2020 3,962 2,618 6,580
2025 4,409 2,993 7,402
NOTES: Key assumptions—Mortality: Infant mortality rate will decrease by 50 percent between 1995 and
2025 and life expectancy at birth will increase by 6 percent. Migration: Net migration into the Palestinian
territories will total 500,000 between 1997 and 2011. Net migration between 2011 and 2025 is assumed to be
zero. Fertility: The total fertility rate will decline by 50 percent by 2025.
1.8.3 Gaza strip geographical aspect
The Gaza strip consists of five Governorates; Northern, Gaza, Middle, Khan Yunis and
Rafah. The municipalities or the village councils are responsible for public services, where
CMWU and MoLG take the coordination role between the different municipalities and
village councils concerning water and sanitation works.

CHAPTER (1): INTRODUCTION
- 9 -
1.8.4 Water supply institutions
The key institutional constraint in water supply remains the ―jungle of providers‖. The
basic institutional constraint to improving water supply services has long been identified–
the plethora of several hundred organizations, large and small, lacking economy of scale
and sourcing water haphazardly. To counter these problems, stakeholders agreed on a new
institutional architecture with: (1) PWA as regulator and resource manager; (2) a bulk
water supplier (and single interface with Mekorot); and (3) four regional utilities grouping
the current suppliers together both institutionally and physically (via bulk connections)
[19].
1.8.5 Water Institutional Arrangement in Gaza
PWA operations – and water resource management - in Gaza are effectively suspended.
PWA developed a relatively strong presence in Gaza, which is now effectively suspended.
As a result, PWA‘s regulatory function is in abeyance and unlicensed wells are
proliferating. The political situation has reduced the effective linkages with Ramallah.
Water institutional arrangement is shown in figure 1.4:
Figure 1-3. Existing Institutional Arrangement of Water Sector in Gaza [1]

CHAPTER (1): INTRODUCTION
- 01 -
Gaza‘s CWMU is the most advanced of the regional utilities and some benefits have been
won, but the model is now vulnerable to the political and economic situation. Since 1996,
work has been going on to create the CWMU, and there are already some gains from the
model. Although the recent crises have led some municipalities to hesitate, stakeholder
views on the CWMU remain cautiously positive and management say there is still
determination that the model will work. However, it cannot function properly under the
current crisis situation and hence remains essentially still under test [1].
1.9 Scope of the study and logical framework
The study approach is following this logical framework towards achieving its objectives:
1. Sustainability as common concept for development.
2. Introducing GIS as a technology that should be integrated in water resources
system more efficiently in Gaza.
3. Custom GIS applications as new trend that proved its efficiency worldwide.
4. Introducing main parameters governing water quality in Gaza.
5. Describing the logic behind utilizing programming capabilities in integrating
mapping and spatial features and rich databases and presentation tools in one
platform, easy-to-use and affordable.
6. Discussing practical application of this development into water resources
concerned agency (s), i.e. CMWU. Logical frame work for the GIS-Based system
development is shown in figure 1.5.
1.10 Summary of Methodology
1.10.1 Data collection phase
Data records on monitored chloride parameter over the past decade will be collected from
the Palestinian Water Authority (PWA). This data will be based on test results for Cl- and
NO3- for variety of water wells across the Gaza strip (municipal and agricultural).
1.10.2 Tools
Required set of tools needed for this research, included:
ArcMAP 9.1 (From ESRI)
Microsoft Visual Basic 6, (From Microsoft)
MapwinGIS.ocx (Open SourceGIS), and
Microsoft Access as database engine (From Microsoft).

CHAPTER (1): INTRODUCTION
- 00 -
Figure 1-4. GIS-Based system development logical framework.
1.10.3 Thematic maps:
Based on available data, thematic maps describing parameters such as landuse, soil and
municipal, have been prepared in addition to allocating the locations of water wells as
points shape file.
1.10.4 Application Structuring and development
At this stage tools should be ready accompanied with filtered and screened set of data and
information to precede with developing the application, following is an illustration of the
components used within the Microsoft Visual Basic control container as inputs to the
container and then output as the developed system, figure 1.6.
Thematic Maps
Preparation
Shapefiles
(Polygons)
Gaza
Governorates
Land Use
Soil
Municipalities
Average Cl- per
Year
Data
Preparation
Data Screening DBF Preparation
Water Wells, for
Prediction,
10 Wells
Water Wells, for
Map Viewing,
125 Wells
Shapefiles
(Points)
Time history data
preparation
Final amendments and compiling
GIS-Based
System
Developed
Programming through more than 300
lines of code.
Microsoft Visual Basic, Ms Access,
MapWinGIS
Compiling developed GIS-Based
System
GIS-Based system discussion and
testing.
Development
Steps

CHAPTER (1): INTRODUCTION
- 02 -
Figure 1-5. System components, Inputs and Outputs
OUTPUT, Developed System
INPUT, Data Grid INPUT, Charts
Trough Visual Basic
Control Container.
INPUT, OCX Libraries
INPUT, Thematic Maps
INPUT, Numerical Data
INPUT, MS Access
Database Engine
- 03 -
1.10.5. Application testing and evaluation
It is intended to introduce the application to water resources managers in the PWA, but due
to recent prevailing situation, CMWU (through its planning and GIS unit) will be consulted
to measure the effectiveness with regard to its intended use; this will be as an evaluation of
the application where comments and suggestion will be considered for a final version.
1.11 Conclusion
Through the chapter, problem and research justification outlined enabling definition of
main outputs and objectives, additional to system components and development
methodology covering the tools and methods used.

CHAPTER (2): LITERATURE REVIEW
- 05 -
2. CHAPTER (2): LITERATURE REVIEW
2.1 Introduction
More than 80 percent of all the information used by local governments is geographically
referenced. A key element of the information is its location relative to geographic features,
other objects, established boundaries, etc. An information system is a framework by which
to ask questions and obtain answers from a data resource. A Geographic Information
System (GIS) is a special type of information system in which the database consists of
observations on spatially distributed features and procedures to collect, store, retrieve,
analyze, and display such geographic data. In the past decade, powerful workstations and
sophisticated software combined to bring mapping capability to any desktop. In the last
five years, computers have become so powerful that GIS and mapping software will now
run on off-the-shelf PCs. Once the province of cartographers and CAD technicians,
desktop mapping and GIS are ready to infiltrate almost all areas of water, wastewater, and
stormwater system management. The time has come for all the civil engineers involved in
the planning, design, construction, and operation of water, wastewater, and stormwater
systems to benefit from one of the most promising and exciting technologies of the decade
in their profession – the use of GIS [9].
Geographic Information Systems have become popular item on the wish list of
municipalities and water agencies [10].
Coupled with custom GIS applications needs, comes then the Sustainability, which is
defined in many different ways, but in general it refers to the concept that resources are
managed in a way that establishes a long-term balance between production and
consumption of those resources, and that production can be maintained at levels that ensure
the viability of the underlying resource.
Sustainability in terms of water resources is not only achieved by allocating enough
resources and quantities, but moreover, sources with acceptable quality standards are
essential to achieve the concept of sustainability.
Before exploring more in the sustainability, one should address the expert systems that are
of importance in linking GIS to sustainability terms.

CHAPTER (2): LITERATURE REVIEW
- 06 -
Expert Systems (ES), also called Knowledge-Based Systems (KBS) or simply Knowledge
Systems (KS), are computer programs that use expertise to assist people in performing a
wide variety of functions, including diagnosis, planning, scheduling and design [11].
2.2 Expert Systems and Artificial Intelligence
2.2.1 Expert Systems (ESs)
ESs are computer programs that are derived from a branch of computer science research
called Artificial Intelligence (AI). AI's scientific goal is to understand intelligence by
building computer programs that exhibit intelligent behavior [11].
Building an expert system is known as knowledge engineering and its practitioners are
called knowledge engineers. The knowledge engineer must make sure that the computer
has all the knowledge needed to solve a problem. The knowledge engineer must choose
one or more forms in which to represent the required knowledge as symbol patterns in the
memory of the computer, that is, he (or she) must choose a knowledge representation. He
must also ensure that the computer can use the knowledge efficiently by selecting from a
handful of reasoning methods.
Every expert system consists of two principal parts: the knowledge base; and the
reasoning, or inference, engine.
The problem-solving model, or paradigm, organizes and controls the steps taken to solve
the problem. One common but powerful paradigm involves chaining of IF-THEN rules to
form a line of reasoning. If the chaining starts from a set of conditions and moves toward
some conclusion, the method is called forward chaining. If the conclusion is known (for
example, a goal to be achieved) but the path to that conclusion is not known, then
reasoning backwards is called for, and the method is backward chaining. These problem-
solving methods are built into program modules called inference engines or inference
procedures that manipulate and use knowledge to form a line of reasoning [11].
The most important ingredient in any expert system is knowledge. The power of expert
systems resides in the specific, high-quality knowledge they contain about task domains.

CHAPTER (2): LITERATURE REVIEW
- 07 -
2.2.2 Benefits to End Users
Primarily, the benefits of ESs to end users include:
A speed-up of human professional or semi-professional work, typically by a factor
of ten and sometimes by a factor of a hundred or more.
Within companies, major internal cost savings. For small systems, savings are
sometimes in the tens or hundreds of thousands of dollars; but for large systems,
often in the tens of millions of dollars and as high as hundreds of millions of
dollars. These cost savings are a result of quality improvement, a major motivation
for employing expert system technology.
Improved quality of decision making. In some cases, the quality or correctness of
decisions evaluated after the fact show a ten-fold improvement.
Preservation of scarce expertise. ESs are used to preserve scarce know-how in
organizations, to capture the expertise of individuals who are retiring, and to
preserve corporate know-how so that it can be widely distributed to other factories,
offices or plants of the company.
Introduction of new products. A good example of a new product is a pathology
advisor sold to clinical pathologists in hospitals to assist in the diagnosis of
diseased tissue.
2.3 Sustainability
Sustainable development, as presently understood, had its origin in the World
Conservation Strategy. This strategy sets out some now widely accepted principles of
environmental sustainability and identified three essential life support systems: soil, air and
water.
Water resources projects are sustainable, if water of sufficient quantity and quality at
acceptable prices is available to meet demands and quality standards of the region now and
in the future without causing the environment to deteriorate.
Water resources come from systems which include rivers, lakes, wetlands and aquifers.
The planning for utilization of these resources must be considered in association with their
functions in the hydrological cycle and their interactions with the physical, chemical and
biological processes in terrestrial ecosystems. Planning and decision making for
groundwater development is a continuous dynamic process.
CHAPTER (2): LITERATURE REVIEW
- 08 -
When one addresses the question of sustainable development, the objectives and concerns
of development will change over time and the development planning must adjust with the
changing conditions. Short term socio-economic gains may have to be traded with long
term sustainability, with its varied dimensions. [12].
2.4 Principles of Sustainable Groundwater Development
The goal of environmentally sound and sustainable development of water resources is to
develop and manage them in such a way that the resource base is maintained and enhanced
over the long term. Groundwater development begins typically with a few pumping wells
and initially the groundwater management practice, in many cases, is geared to facilitate
usage and development. As development progresses with more and more drilled wells
scattered over the basin, issues such as overexploitation, equitable sharing of water and
degradation of water quality become apparent in many basins. Thus, the emphasis of
groundwater management practice has to be changed so that the available resource is
utilized in an efficient, sustainable and equitable manner contributing to the economic and
social well being of the broader community. A sustainable groundwater development
depends on the understanding of processes in the aquifer system, quantitative and
qualitative monitoring of the resource and the interaction with land and surface water
development. The following key principles reflect different aspects of concern in the
evolution of sustainability in groundwater development:
(a) Long term conservation of groundwater resources;
(b) Protection of groundwater quality from significant degradation; and
(c) Consideration of environmental impacts of groundwater development [12].
2.5 Protection of groundwater quality
Contamination should be prevented. Successful prevention means that the potential
contaminants must be controlled so that they cannot react with the groundwater system.
Land use planning is a major form of prevention in which the producers of hazardous
wastes are kept away from the areas overlying groundwater resources so that in the event
of an accidental leakage, little damage will occur. Once contamination of a local
groundwater supply has occurred, action must be taken to find and eliminate the sources,
contain the contaminants in the area already affected and restore the water quality of the
aquifer [12].
CHAPTER (2): LITERATURE REVIEW
- 09 -
GIS based tools and systems contributing much to having the landuse planning aspect
managed properly.
2.6 The Geographic Information System (GIS)
A Geographic Information System (GIS) can be defined as a system for entering, storing,
manipulating, analyzing, and displaying geographic or spatial data. These data are
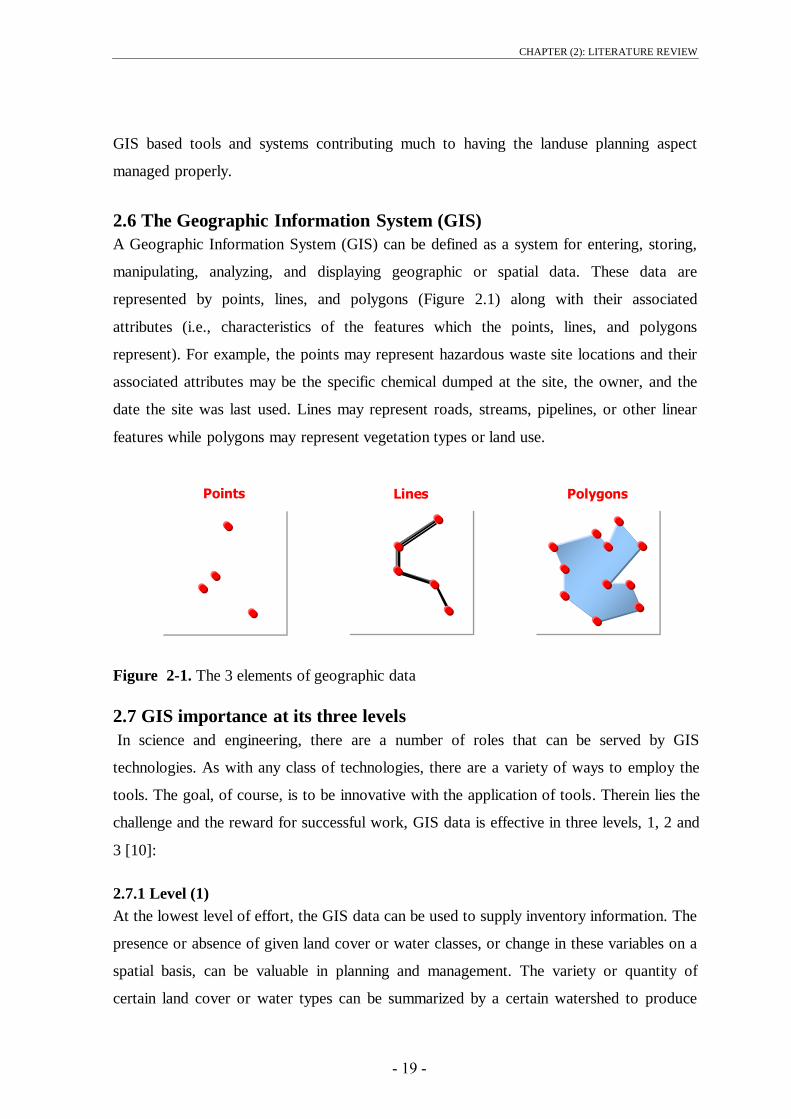
represented by points, lines, and polygons (Figure 2.1) along with their associated
attributes (i.e., characteristics of the features which the points, lines, and polygons
represent). For example, the points may represent hazardous waste site locations and their
associated attributes may be the specific chemical dumped at the site, the owner, and the
date the site was last used. Lines may represent roads, streams, pipelines, or other linear
features while polygons may represent vegetation types or land use.
Figure 2-1. The 3 elements of geographic data
2.7 GIS importance at its three levels
In science and engineering, there are a number of roles that can be served by GIS
technologies. As with any class of technologies, there are a variety of ways to employ the
tools. The goal, of course, is to be innovative with the application of tools. Therein lies the
challenge and the reward for successful work, GIS data is effective in three levels, 1, 2 and
3 [10]:
2.7.1 Level (1)
At the lowest level of effort, the GIS data can be used to supply inventory information. The
presence or absence of given land cover or water classes, or change in these variables on a
spatial basis, can be valuable in planning and management. The variety or quantity of
certain land cover or water types can be summarized by a certain watershed to produce
Points Lines Polygons
CHAPTER (2): LITERATURE REVIEW
- 21 -
statistics of interest. The capability to store, quantify, and present data on a spatial basis is
an inherent characteristic of GIS technologies.
2.7.2 Level (2)
At the highest level of technology, a GIS can provide a spatial database of information to
support modeling of phenomena. The GIS supplies the spatial data in a form that can be
input to deterministic or statistical models. The spatial power of the GIS database is used in
full by the model, and more detailed and spatially averaged results are produced. This
represents a high level of integration and achievement that is now seen in the industry. It
has taken a while for such applications to develop, however. This is due to the absence of
spatially integrated models for water resource phenomena. Many models use spatial data
but average or summarize these data by watershed and/or subwatershed, and thereby lose
much of the detail of spatial variability that often influences phenomena. This is the same
level of detail necessary to provide high quality model simulations. In general, the strength
of GIS is that it is possible to process the data sets using any type of numerical analysis
procedure. In particular, certain procedures are valuable for data visualization and analysis,
including image processing techniques, virtual reality, and simulation modeling. The
digital approach to storing and processing spatial or image data is a fantastic boon to these
analyses of data, and the capabilities have yet to be fully realized.
2.7.3 Level (3)
Of particular interest is also the application of a GIS in the automation of infrastructure
modeling and information management using modern computer techniques and graphics
technology to build what is called ‗intelligent infrastructures‘. However, this along with the
other rewarding applications of a GIS in environmental and water resources engineering
cannot be fully conceived by the reader before a terse overview of the basic components
and features of any GIS.
2.8 Delivering Custom GIS Applications
Faced with an overabundance of raw information, organizations are awakening to the value
of geographic analysis and spatial visualization because of their proven ability to improve
operational efficiency and decision making within an organization. May be called business
intelligence, analytic applications, or decision support, knowledge workers benefit from
software applications that provide them with the information they need to quickly and
accurately assess a situation and act accordingly. There are many potential users of
CHAPTER (2): LITERATURE REVIEW
- 20 -
geographic information system (GIS)-enhanced applications who are not GIS professionals
and are unequipped to take advantage of the comprehensive tools available on the market
without a steep learning curve.
2.8.1 Open Source applications
―When programmers can read, redistribute, and modify the source code for a piece of
software, the software evolves. People improve it, people adapt it, people fix bugs. And
this can happen at a speed that, if one is used to the slow pace of conventional software
development, seems astonishing.‖ [30].
2.8.2 Custom open source GIS applications
Custom open source GIS applications could act as Decision Support System (DSS) and to
some extent as a Spatial Decision Support System (SDSS) which is a computer–based
system designed to assist decision system. Typically, such a system will include spatial
data relevant to the decision.
2.8.3 Solutions for Efficient GIS Development
The ideal solution to a prolonged GIS development effort is the availability of a
component-based development framework that will allow solution providers or an
organization's internal developers to rapidly build industry specific GIS applications. A
GIS development framework provides the necessary comprehensive spatial functionality
for applications and allows the software developer to focus on building application specific
logic. ESRI® ArcGIS® Engine is such a GIS framework, created in response to ESRI
software users' requests that the rich technology of ArcGIS be productized to enable
embedding of spatial functionality in new or existing applications. This will be of
particular interest to programmers and project managers who want to embed mapping and
GIS functionality in new or existing custom applications and deploy those applications,
perhaps in a cross platform environment, in a cost-effective manner [13].
2.8.4 Delivering Custom GIS Applications with ArcGIS Engine from ESRI
2.8.4.1 ArcGIS Engine
ArcGIS Engine is a complete library of embeddable GIS components and tools packaged
together for developers to build new or extend existing custom desktop applications. Using
ArcGIS Engine, developers can embed GIS functions into existing applications, such as
custom industry specific products, and commercial productivity applications, such as
CHAPTER (2): LITERATURE REVIEW
- 22 -
Microsoft Word and Excel, as well as build focused custom applications for delivering GIS
to many users in their organizations [13].
2.8.4.2 Use of ArcGIS Engine
Many users require focused, industry specific access to GIS from within familiar software
applications. They need much less than the general GIS products, yet they may require
access to sophisticated GIS logic in their applications [13].
2.9 GIS for water utilities
Although a GIS is often seen as an important technology for water utilities, it is sometimes
hard to see the real benefits of a GIS when compared to the high hardware, software, and
human implementation costs, this require well defined objectives behind its use.
2.9.1 Water Utilities’ Primary Functions
GIS technology can be utilized by each of the following water utility function groups, but
there are considerable differences in the uses and relative advantages of such technology:
Planning: planning the timed expansion of the water system (future demands).
Engineering: detailed design and construction of water facilities.
Operation and Maintenance (O&M): operating and maintaining water transmission and
supply facilities.
Administration: managing the paperwork and dollars associated with operating the
water system.
These functions are explained hereunder in more details:
2.9.1.1 Planning
A water utility‘s planning group generally performs estimates of future water demands,
evaluates the transmission system utilizing these estimates, specifies the required system
improvements, and structures a long term capital investment program around these
improvements.
2.9.1.2 Engineering
The engineering group within a water utility is generally responsible for facility design,
construction, and mapping. Unlike the planning function, engineering deals with facilities
as they are actually built.
CHAPTER (2): LITERATURE REVIEW
- 23 -
2.9.1.3 Operation and Maintenance
Operations and maintenance performs work on geographically distributed facilities. The
primary need on a daily basis is to manage work crews. The technology required to satisfy
this need is a database application that provides work order management, work scheduling,
and work history logging.
2.9.1.4 Administration
Administrative functions have been computerized for many years and a wide variety of
standard applications now exist to serve administrative needs. Although it is certainly
possible to integrate administrative data within a GIS, GIS technology does not yield many
tangible benefits for water utility administrators.
2.9.2 Rational Approach behind using GIS in water utilities
As the above discussion shows, GIS technology can provide a water utility with a flexible
capability to store and present geographic information. These features are complementary
to applications that solve the problems of specific activities within a utility. The key
requirement, prior to making any investment in technology, is to establish and maintain a
long-term vision and plan while focusing on short-term benefits. A rational approach to
technology investment for water utilities has to focus on two critical points: data
maintenance and system modularity.
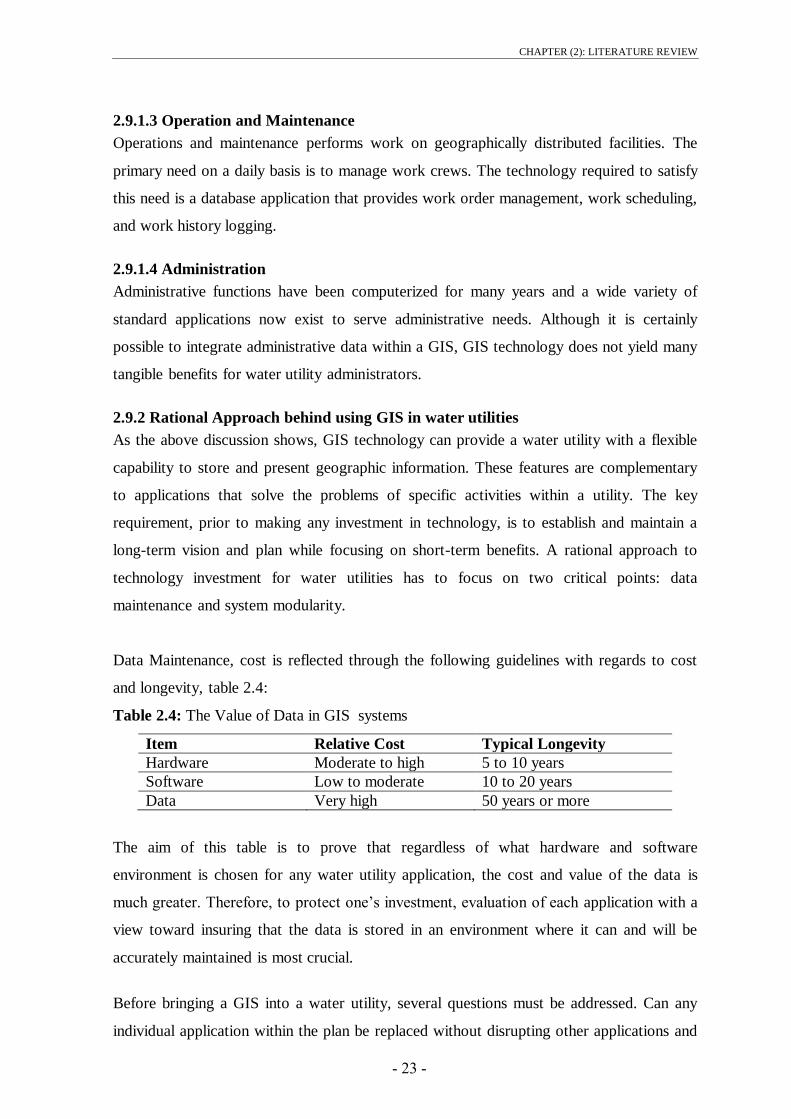
Data Maintenance, cost is reflected through the following guidelines with regards to cost
and longevity, table 2.4:
Table 2.4: The Value of Data in GIS systems
Item Relative Cost Typical Longevity
Hardware Moderate to high 5 to 10 years
Software Low to moderate 10 to 20 years
Data Very high 50 years or more
The aim of this table is to prove that regardless of what hardware and software
environment is chosen for any water utility application, the cost and value of the data is
much greater. Therefore, to protect one‘s investment, evaluation of each application with a
view toward insuring that the data is stored in an environment where it can and will be
accurately maintained is most crucial.
Before bringing a GIS into a water utility, several questions must be addressed. Can any
individual application within the plan be replaced without disrupting other applications and

CHAPTER (2): LITERATURE REVIEW
- 24 -
users? Does the architecture avoid data redundancy? (In other words, is each type of data
maintained in only one place?) Is the long term maintenance of all types of data assured?
Are the appropriate users maintaining their own data? Are there immediate benefits and
what are they?
All in all, water utilities – especially smaller ones – should adopt a slightly conservative
approach to acquiring GIS technologies. Emphasis should be placed first on the utility‘s
immediate needs while stressing the issues of long term investment with regards to data
collection and management, and then on following a growth path towards a full GIS
environment.
Although a GIS is a very potent decision-making tool, it is just a tool. There is a great
temptation to rely too heavily on the computer and to stop thinking. There is also a
tendency to collect too much spatial data. One more layer of data is not always the answer.
Therefore, be warned, and GIS will serve you well! [10]
2.9.3 GIS Applications in Water, Wastewater and Stormwater Systems
Representation and analysis of water-related phenomena by GIS facilitates their
management. By using geographic information from mapping, modeling, facilities
management, and work order management, a drinking water distribution system manager
can develop a detailed capital improvement program or operations and maintenance plan.
The GIS applications that are of particular importance to water, wastewater, and
stormwater system managers are: Mapping, Monitoring, Modeling, and Maintenance.
These four Ms define the four most important activities in effectively managing water,
wastewater, and stormwater systems.
GIS can be used to implement the 4M management strategy in the field of water,
wastewater, and stormwater. GIS integrates all kinds of information and applications with
a geographic component into one, manageable system. GIS offers integrated solutions in
the areas of planning and engineering, operation and maintenance, and finance and
administration.
Also, with GIS the possibilities to map, monitor, model, and maintain water, wastewater,

CHAPTER (2): LITERATURE REVIEW
- 25 -
and stormwater systems are endless by applying the power of GIS to manage them through
its full potential in solving water-related problems [9].
2.9.4 Groundwater quality assessment using GIS
Groundwater quality assessment is a key issue to decision makers. Through the use of the
developed open GIS system a rapid global "at a glance" appraisal of groundwater quality
can be achieved [14].
Assessing the quality of groundwater is important to ensure sustainable safe use of these
resources. However, describing the overall water quality condition is difficult due to the
spatial variability of multiple contaminants and the wide range of indicators (chemical,
physical and biological) that could be measured [15].
Several indicators have been developed to easy the understanding of indicators expressing
ground water quality, among these indexes are the following:
2.9.4.1 The groundwater quality index, GQI
Team in [15], developed a GIS based groundwater quality index (GQI) combining
different available water quality data (e.g., Cl-, Na+, Ca2+) and linked them to the World
Health Organization (WHO) standards. They applied the proposed index to Nasuno basin,
Japan and they related the final GQI map with more data such as the depth to groundwater
table, the geomorphologic structures, the land-use types and population density in order to
find out which factors control the spatial variability of groundwater quality.
The main part of the GQI represents an averaged linear combination of factors. The weight
(w) assigned to each parameter indicating its relative importance to groundwater quality,
corresponds to the mean rating value of its ―rank map‖. Parameters which have higher
impact over groundwater quality (high mean rate) are assumed to be similarly more
important in evaluating the overall groundwater quality. High GQI values close to 100
reflect high water quality and index values far below 100 (close to 1) indicate low water
quality. [16].
2.9.4.2 Indexed Assessment of an aquifer’s Water Quality
Similar approach to that presented by team in [15], the IAWQ (Indexed Assessment of an
aquifer‘s Water Quality), however their basic assumptions and formulations are generally
different from those introduced team in [15], [16].
CHAPTER (2): LITERATURE REVIEW
- 26 -
2.10 GIS Analysis Techniques
Once all the necessary existing and new data have been collected then it can all be
registered to a common base map. As mentioned, the collection and registering of all these
data from various sources can be an expensive, time consuming, and frustrating process.
Once completed, however, the analysis can begin. Basic GIS analysis techniques include
overlay analysis, modeling, buffering, and network analysis.
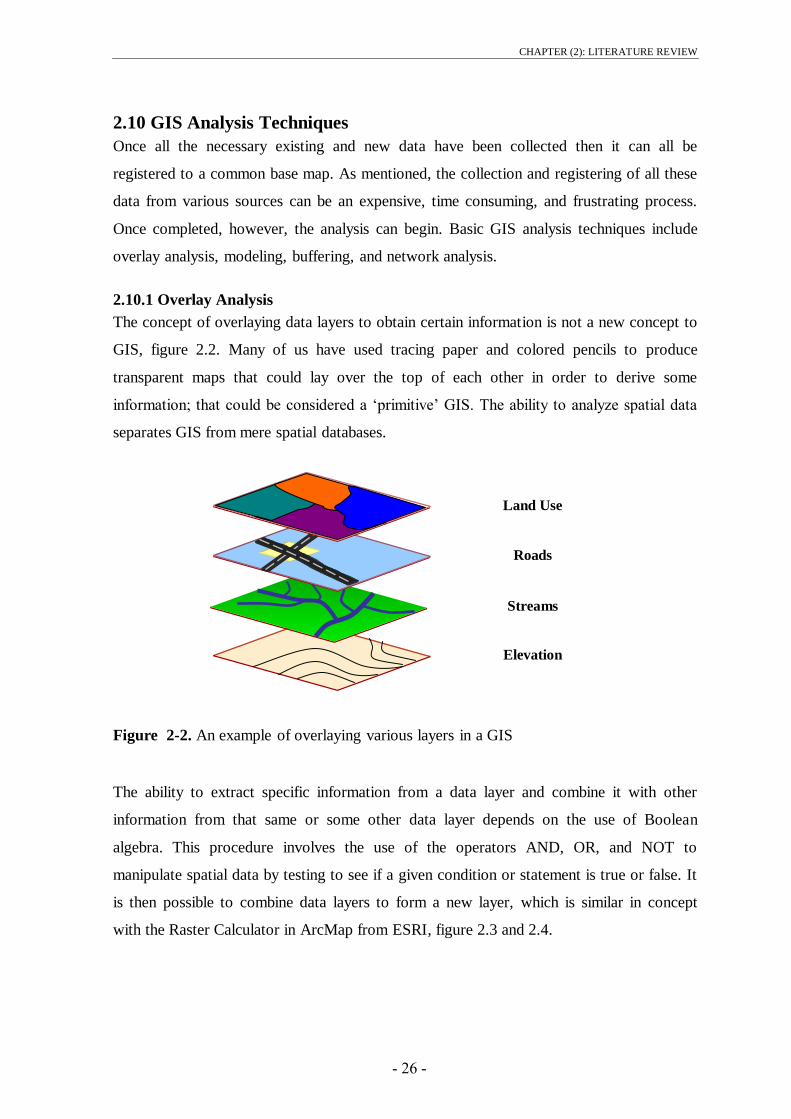
2.10.1 Overlay Analysis
The concept of overlaying data layers to obtain certain information is not a new concept to
GIS, figure 2.2. Many of us have used tracing paper and colored pencils to produce
transparent maps that could lay over the top of each other in order to derive some
information; that could be considered a ‗primitive‘ GIS. The ability to analyze spatial data
separates GIS from mere spatial databases.
Figure 2-2. An example of overlaying various layers in a GIS
The ability to extract specific information from a data layer and combine it with other
information from that same or some other data layer depends on the use of Boolean
algebra. This procedure involves the use of the operators AND, OR, and NOT to
manipulate spatial data by testing to see if a given condition or statement is true or false. It
is then possible to combine data layers to form a new layer, which is similar in concept
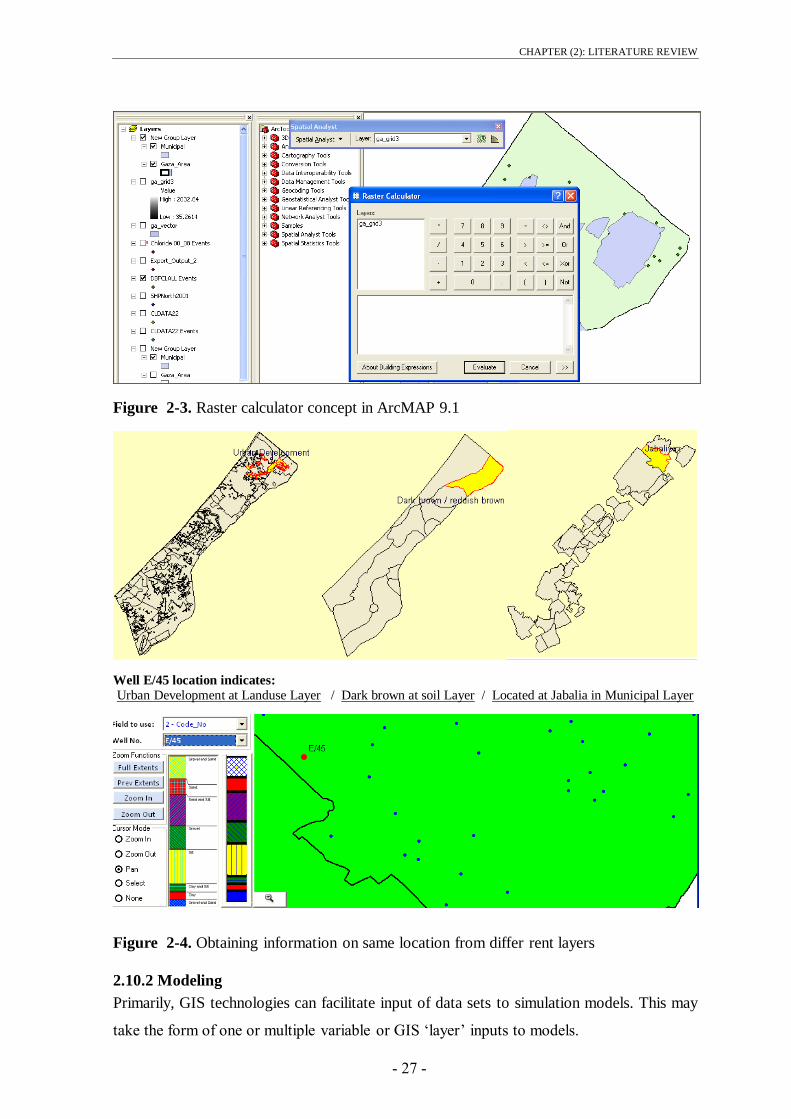
with the Raster Calculator in ArcMap from ESRI, figure 2.3 and 2.4.
Land Use
Roads
Streams
Elevation
CHAPTER (2): LITERATURE REVIEW
- 27 -
Figure 2-3. Raster calculator concept in ArcMAP 9.1
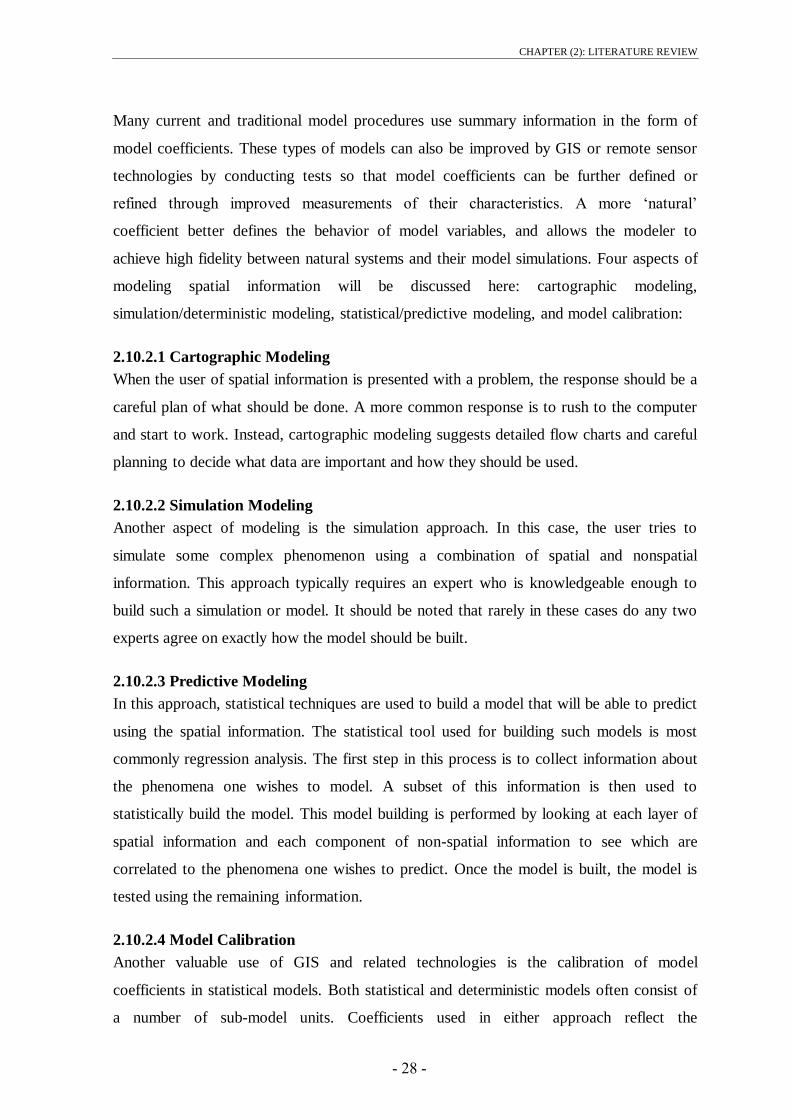
Well E/45 location indicates:
Urban Development at Landuse Layer / Dark brown at soil Layer / Located at Jabalia in Municipal Layer
Figure 2-4. Obtaining information on same location from differ rent layers
2.10.2 Modeling
Primarily, GIS technologies can facilitate input of data sets to simulation models. This may
take the form of one or multiple variable or GIS ‗layer‘ inputs to models.
CHAPTER (2): LITERATURE REVIEW
- 28 -
Many current and traditional model procedures use summary information in the form of
model coefficients. These types of models can also be improved by GIS or remote sensor
technologies by conducting tests so that model coefficients can be further defined or
refined through improved measurements of their characteristics. A more ‗natural‘
coefficient better defines the behavior of model variables, and allows the modeler to
achieve high fidelity between natural systems and their model simulations. Four aspects of
modeling spatial information will be discussed here: cartographic modeling,
simulation/deterministic modeling, statistical/predictive modeling, and model calibration:
2.10.2.1 Cartographic Modeling
When the user of spatial information is presented with a problem, the response should be a
careful plan of what should be done. A more common response is to rush to the computer
and start to work. Instead, cartographic modeling suggests detailed flow charts and careful
planning to decide what data are important and how they should be used.
2.10.2.2 Simulation Modeling
Another aspect of modeling is the simulation approach. In this case, the user tries to
simulate some complex phenomenon using a combination of spatial and nonspatial
information. This approach typically requires an expert who is knowledgeable enough to
build such a simulation or model. It should be noted that rarely in these cases do any two
experts agree on exactly how the model should be built.
2.10.2.3 Predictive Modeling
In this approach, statistical techniques are used to build a model that will be able to predict
using the spatial information. The statistical tool used for building such models is most
commonly regression analysis. The first step in this process is to collect information about
the phenomena one wishes to model. A subset of this information is then used to
statistically build the model. This model building is performed by looking at each layer of
spatial information and each component of non-spatial information to see which are
correlated to the phenomena one wishes to predict. Once the model is built, the model is
tested using the remaining information.
2.10.2.4 Model Calibration
Another valuable use of GIS and related technologies is the calibration of model
coefficients in statistical models. Both statistical and deterministic models often consist of
a number of sub-model units. Coefficients used in either approach reflect the

CHAPTER (2): LITERATURE REVIEW
- 29 -
characteristics of nature, and they will adjust the contribution of variables or submodels to
the overall model results.
To optimize the model simulation of natural phenomenon, the coefficients need to reflect
the reality of the situation. As a given model begins to approximate nature, its further
development often takes the path of improving the quality of coefficients. Many times, a
number of experiments will be executed to better measure the level of a coefficient and
thus to help supply better model predictions.
2.10.2.5 Buffering
Buffering is a technique by which a boundary of known width is drawn around a point or
linear feature. Some examples of point buffers may be a zone around a hazardous waste
site or around a tree that is a nest for a particular endangered bird. Examples of linear
buffers may be an area around a stream to prevent logging or an area around a utility
pipeline to prevent digging. A related function is generally referred to as ―proximity
searches‖, figure 2.5.
Figure 2-5. User waiver search radius distances
Proximity searches can be used to identify adjacencies between particular features or data
classifications. Examples might include identifying all groundwater pollution cases within
a specific radius of a given drinking supply well, Proximity search can be used to locate
potential sources of contamination, to schedule inspections, to identify monitoring wells or
sampling points which might provide relevant data from nearby sites, to identify specific
residents or the size exposed populations, or to generate mailing lists for further
investigation, figure 2.6 shows the concept in developed system.
Well
0.25 KM
0.5 KM
1 KM
= Wells
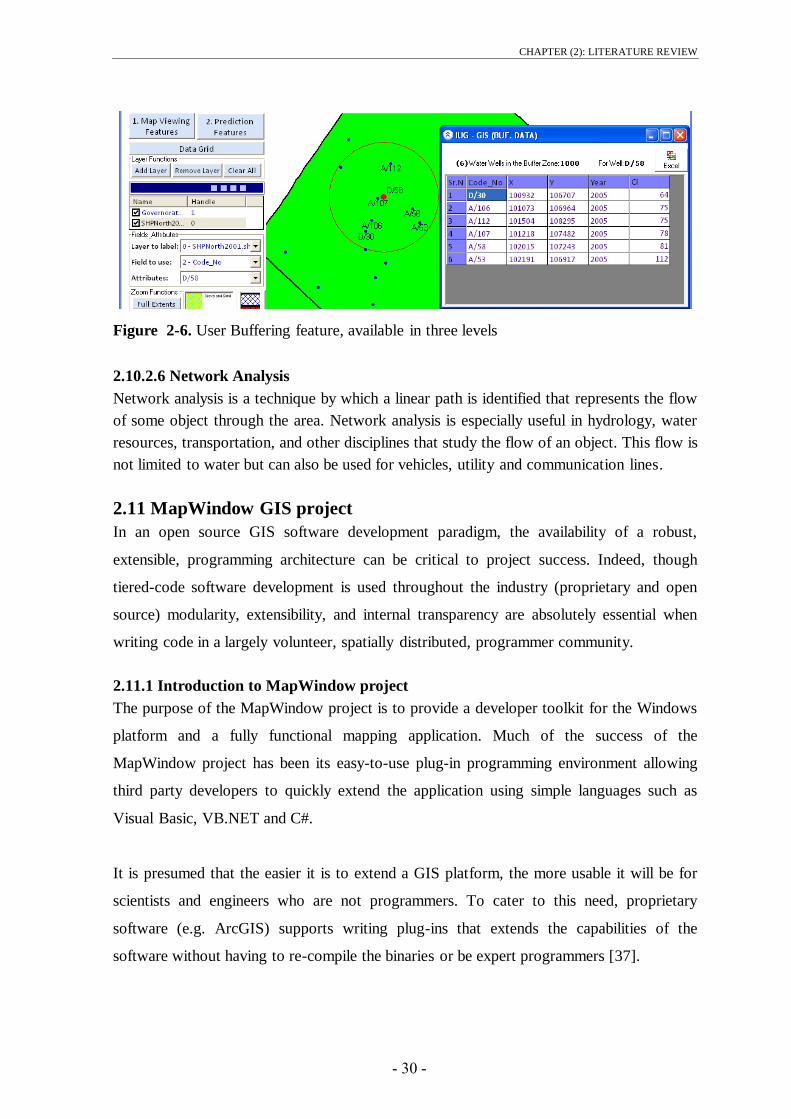
CHAPTER (2): LITERATURE REVIEW
- 31 -
Figure 2-6. User Buffering feature, available in three levels
2.10.2.6 Network Analysis
Network analysis is a technique by which a linear path is identified that represents the flow
of some object through the area. Network analysis is especially useful in hydrology, water
resources, transportation, and other disciplines that study the flow of an object. This flow is
not limited to water but can also be used for vehicles, utility and communication lines.
2.11 MapWindow GIS project
In an open source GIS software development paradigm, the availability of a robust,
extensible, programming architecture can be critical to project success. Indeed, though
tiered-code software development is used throughout the industry (proprietary and open
source) modularity, extensibility, and internal transparency are absolutely essential when
writing code in a largely volunteer, spatially distributed, programmer community.
2.11.1 Introduction to MapWindow project
The purpose of the MapWindow project is to provide a developer toolkit for the Windows
platform and a fully functional mapping application. Much of the success of the
MapWindow project has been its easy-to-use plug-in programming environment allowing
third party developers to quickly extend the application using simple languages such as
Visual Basic, VB.NET and C#.
It is presumed that the easier it is to extend a GIS platform, the more usable it will be for
scientists and engineers who are not programmers. To cater to this need, proprietary
software (e.g. ArcGIS) supports writing plug-ins that extends the capabilities of the
software without having to re-compile the binaries or be expert programmers [37].
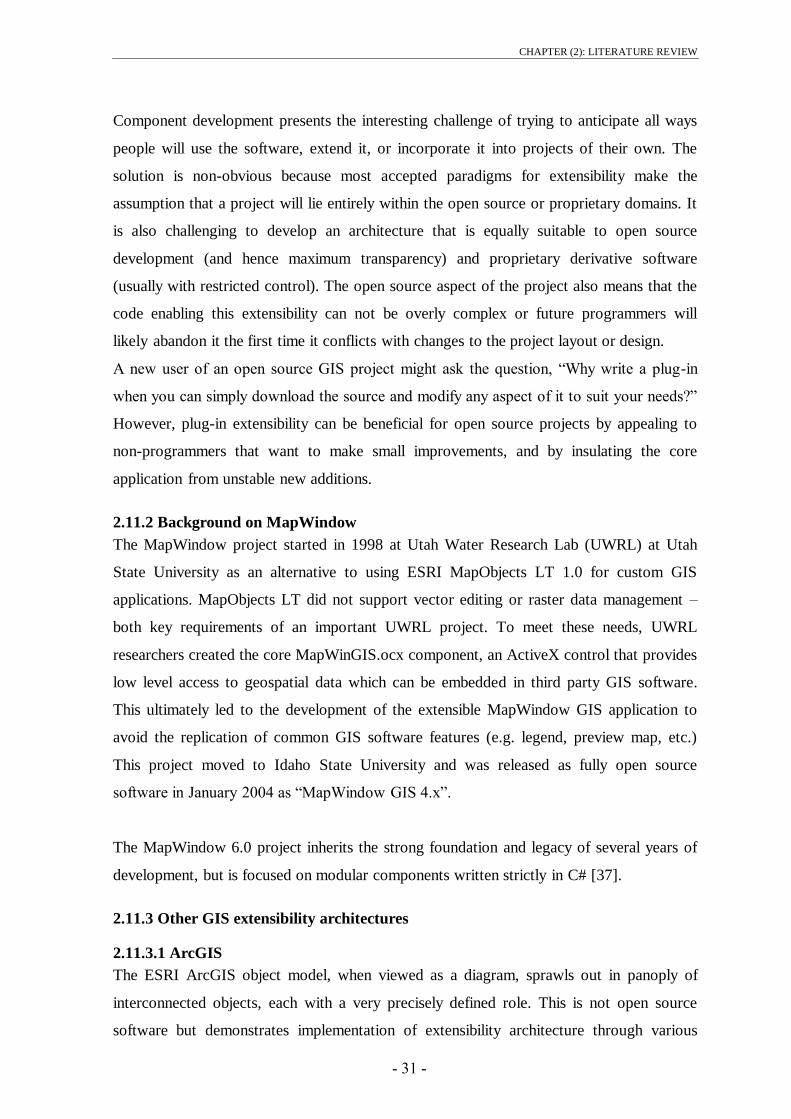
CHAPTER (2): LITERATURE REVIEW
- 30 -
Component development presents the interesting challenge of trying to anticipate all ways
people will use the software, extend it, or incorporate it into projects of their own. The
solution is non-obvious because most accepted paradigms for extensibility make the
assumption that a project will lie entirely within the open source or proprietary domains. It
is also challenging to develop an architecture that is equally suitable to open source
development (and hence maximum transparency) and proprietary derivative software
(usually with restricted control). The open source aspect of the project also means that the
code enabling this extensibility can not be overly complex or future programmers will
likely abandon it the first time it conflicts with changes to the project layout or design.
A new user of an open source GIS project might ask the question, ―Why write a plug-in
when you can simply download the source and modify any aspect of it to suit your needs?‖
However, plug-in extensibility can be beneficial for open source projects by appealing to
non-programmers that want to make small improvements, and by insulating the core
application from unstable new additions.
2.11.2 Background on MapWindow
The MapWindow project started in 1998 at Utah Water Research Lab (UWRL) at Utah
State University as an alternative to using ESRI MapObjects LT 1.0 for custom GIS
applications. MapObjects LT did not support vector editing or raster data management –
both key requirements of an important UWRL project. To meet these needs, UWRL
researchers created the core MapWinGIS.ocx component, an ActiveX control that provides
low level access to geospatial data which can be embedded in third party GIS software.
This ultimately led to the development of the extensible MapWindow GIS application to
avoid the replication of common GIS software features (e.g. legend, preview map, etc.)
This project moved to Idaho State University and was released as fully open source
software in January 2004 as ―MapWindow GIS 4.x‖.
The MapWindow 6.0 project inherits the strong foundation and legacy of several years of
development, but is focused on modular components written strictly in C# [37].
2.11.3 Other GIS extensibility architectures
2.11.3.1 ArcGIS
The ESRI ArcGIS object model, when viewed as a diagram, sprawls out in panoply of
interconnected objects, each with a very precisely defined role. This is not open source
software but demonstrates implementation of extensibility architecture through various

CHAPTER (2): LITERATURE REVIEW
- 32 -
interfaces. In the Visual Basic for Applications (VBA) Macro development environment
that is associated with ArcGIS versions 8.0 and later, directly accessing an object does not
expose the majority of its properties or methods. Also, ArcGIS plug-ins can not be used
without the proprietary ArcGIS software.
2.11.3.2 GRASS
Modularity is a major strength for GRASS. As is noted in Open source GIS A GRASS GIS
Approach, GRASS 6 is written in the ANSI C programming language and hosts more than
350 modules for management, processing, analysis and visualisation of GIS data. The
GRASS development team is actively developing new graphical user interfaces, but the
core project is built around a series of completely independent core libraries. The
opportunity for open source style extensibility in this setting is obvious. One simply needs
to add a new library to the list of libraries and to extend GRASS. There is also recognition
that not every user will be an expert coder. To support intermediate level programmers,
GRASS accepts script programming. UNIX Shell, PERL and Python scripts are supported,
allowing repetitious tasks to be handled through scripting languages.
2.11.3.3 Quantum GIS
Another open source desktop GIS with a well established plug-in architecture is Quantum
GIS. The Quantum GIS plug-in architecture is similar to the MapWindow GIS approach in
that new functionality is provided through compiled binaries that are referenced by the
software at runtime. A powerful and useful concept in Quantum GIS is the idea of a ―Data
Provider‖ plug-in that allows developers to specifically extend the data formats that can be
supported by the software.
2.11.4 Logic behind developing MapWindow
In summary, this project has developed a plug-in extensibility architecture that is modular
in order to be used side by side with modular components. It uses a simple component-like
drag and drop behaviour that should be very familiar to visual developers. The project
makes this possible by using interfaces for each of its classes. The interfaces allow for
interchangeability, can provide restricted access to components, and consist of smaller
interfaces that can be used where implementing the entire class is not necessary. These
interfaces then allow for the addition of run-time classes identified by using system
reflection. Because the new classes implement pre-defined interfaces, other components in
the architecture can interact with the new classes as if they had a programmatic reference
CHAPTER (2): LITERATURE REVIEW
- 33 -
to them. Because the entire project has been built to use interfaces, future developers can
exchange literally any part of it with their own classes as long as the classes implement the
same interfaces [37].
The steps being taken by this project show an exciting new trend for community code.
While mapping projects are abundant, projects that set themselves up to provide
components for use by other projects are rarer, and projects that allow those components to
be used for free by developers of proprietary software are extremely rare. This approach
may prove to be naïve, as many advocates of the GNU general public licence warn.
However, producing easy-to-use components that are specifically designed for an
environment used predominantly by proprietary developers would be largely useless unless
those proprietary developers could use the software. Attempting to create tools that can be
used for multiple purposes also presents new problems and perspectives that can lead to
solutions that benefit the entire community.
In short, the MapWinGIS.ocx ActiveX control was built to support GIS functions in totally
unique GIS-enabled applications, and the MapWindow application was built to help users
deploy GIS-enabled applications that can be assembled from pre-built plug-ins and data
2.11.5 Architecture of MapWindow ActiveX Control
The core MapWindow component is the ActiveX control, "MapWinGIS.ocx". This is an
programming object that can be added to a form in Visual Basic, Delphi, or other
languages that support ActiveX, providing a built-in GIS data map. It have been optimized
for use as a fully functional model interface, not just as a map viewer. This involved
speeding up image and grid display, limiting the amount of redrawing that the user sees,
and including application programmer interfaces (APIs) for low-level access to grid, shape,
table and image data. Here is an example in Visual Basic 6 of the simplest MapWindow
project you can build figure 2.7:

CHAPTER (2): LITERATURE REVIEW
- 34 -
Figure 2-7. Visual Basic 6, simplest MapWindow usage
The code that adds above shape file to the map is shown in figure 2.8:
Figure 2-8. Visual Basic 6, Code for showing a shapfile
With a shape file layer loaded in the map, the user can navigate the map using the left and
right mouse buttons to zoom-in and zoom-out. Noting that although this is the simplest
MapWindow project one can build, actually the simplest project would be to just put the
map on a form and compile with no code. Although the program would start with an empty
white box, a user could grab any shape file or geo-referenced bitmap and drop it in the
map, and the map will display it.
The MapWindow core component can be more interesting when one add a few layers of
data to it and provide other means for navigation. For example, with just a few lines of
code, the project above can be extended to display this, figure 2.9:

CHAPTER (2): LITERATURE REVIEW
- 35 -
Figure 2-9. Visual Basic 6, adding more shapefiles for MapWindow
The code for the above application is shown in figure 2.10:
Figure 2-10. Visual Basic 6, Code for showing a shapefile
These are very basic demonstrations, but the idea is that the control can do and how it can
be used. Additional functions of the core component ActiveX control include:
Open, create, edit, and save geo-referenced image, grid, shapefile, triangulated
irregular network (TIN), and dbf (shape attribute) data directly;
View, label, color, highlight, shape file data in the map;
Perform spatial queries on the data;
Search for features with specific attributes;
Dynamically edit the spatial data and immediately see the changes in the map;

CHAPTER (2): LITERATURE REVIEW
- 36 -
Interact with the data through the map;
Build TINs from Grids, Images from Grids, Shape files from TINs and Grids, Grids
from Shape files, etc.
2.12 Future Water Needs for West Bank and Gaza
Future water needs for the major three consuming sectors (municipal, industry and
agriculture) were estimated in the scope of future water needs for municipal and industrial
sectors based on their current consumption levels and the expected growth in population.
According to these calculations, the Palestinian water sector should develop a total amount
of around 860 MCM/year by the year 2020. This amount is about three fold the supply
available at present, table 2.1[22].
Table 2-1. Projected Total Water Needs in MCM/year
Year 2010 2015 2020
Municipal 165 218 268
Industrial 24 31 39
Irrigation 200 370 552
Total for Palestine 389 619 859
The Gaza aquifer - the only fresh water source in Gaza – is already over-extracted (about 3
times the renewable resources); the UN estimates that Gaza will have no drinking water in
the next 15 years, at present only 5-10% of the aquifer is fit for human consumption. The
UNEP estimates that over $1.5 billion are needed over 20 years to restore the aquifer back
to health, including the establishment of desalination plants to take pressure off the
underground water supplies [23].
2.13 Chlorides and Nitrates as Groundwater quality indicators
Based on several conducted studies and researches, it has been proved that the main
parameters contributing much to the overall quality assessment are Chloride (Cl-) and
Nitrate (NO3-).
A study of redesigning groundwater quality monitoring network suggested the definition of
different monitoring objectives, such as Chloride (Cl-) as an indicator of salinity, Nitrate
(NO3-) as indicator of pollution from wastewater or Electrical Conductivity (EC) as
indicator of the amount of dissolved salts due to saltwater intrusion [19].

CHAPTER (2): LITERATURE REVIEW
- 37 -
Most recent samples collected in 2007 from Gaza water wells showed that 90% of the
wells having NO3- concentration that are several times higher than the WHO of 50 mg/l.
[24]
A recent study developed an indexed assessment of an aquifer's water quality (IAWQ)
initially using the chemical parameters chloride (Cl-) and nitrate (NO3
-), implemented in
Israel's Sharon region [16]. Hence, it would be reasonable to consider Cl- and NO3
- as
main parameters/indicators of water quality in the Gaza strip, thresholds of these
parameters are shown in table 2.2.
Table 2-2. Maximum Concentrations Limits (MCL) of Cl- and NO3
-.
Parameter Abbreviation Unit Standards for drinking water
National1 International
2
Chloride Cl- mg/l 600 250
Nitrate NO3- mg/l 70 50
1 Palestinian National Drinking water standards.
2 WHO Drinking water standard
State indicator of water quality, [25] =
Actual concentration of a substance - Standard for that substance for specific use (i.e.
drinking water)
2.13.1 Chlorides and Nitrates in Groundwater
Chloride and nitrate are proven to be good indicators for groundwater quality evaluation
since these parameters potentially contributing to salinity and pollution and therefore
monitoring is mostly carried out for them in all wells. Chlorides are considered here as
representative of salinity, owing to their highly conservative properties (i.e., not subject to
adsorption) and their direct relationship with total dissolved solids (TDS). Nitrates,
although not conservative, are used here as indicative of anthropogenic pollution mainly
from intensive agriculture and domestic sewage disposal [2].
In application development, just chloride will be used as example indicator, while what
would be applied as limits identifier, buffering, interpolation, map overlaying, etc.. on
chloride would also be applied on Nitrates.
CHAPTER (2): LITERATURE REVIEW
- 38 -
2.13.2 Chlorides
Chlorides are salt compounds present in nearly all natural waters and usually found at low
concentrations in groundwater. Its range of concentrations can vary widely. Chlorine in
combination with a metal such as sodium is essential for life but high chloride levels can
cause human illness and also can affect plant growth at levels in excess of 1000 mg/L.
Taste threshold is about 250 mg/L for most people. Therefore, public drinking water
standards require chloride levels not to exceed 250 mg/L, recommended World Health
Organization WHO level [26].
2.13.2.1 Sources of Chloride in groundwater
Chlorides in groundwater may come from many processes such as dissolution of rocks
containing chlorides, irrigation drainage, seawater intrusion in coastal aquifers, and salt
water up coning of ancient seawater (connate water). Also, it may come from application
of fertilizers or pesticides, effluent of wastewater treatment plants and industrial waste and
from lateral movement of saline groundwater from up gradient areas of the aquifer, or
upward movement from connected aquifers. Heavy pumping led to water level declines
and changes in flow directions in the aquifers. In some cases, this has induced saline water
from the sea or deep brines, to move into and contaminate an aquifer.
2.13.3 Nitrates
Of the inorganic contaminants found in groundwater, nitrate reserves the most attention.
Nitrate has been reported above background concentrations in groundwater worldwide and
it has been identified to be the most common and widespread chemical contaminant in
groundwater. It is commonly associated with diffuse sources such as intensive agriculture,
high density housing with unsewered sanitation and point sources such as discharge of
sewage effluent onto land. It is highly soluble, very mobile and usually not adsorbed much
by soil particles and so it can leach into groundwater if not absorbed by plants. Nitrate (as
N) is usually present naturally at least in low concentrations between 0.45 and 2.0 mg /1,
Some studies show that groundwater concentrations exceeding an arbitrary threshold of 3
mg/l may be indicative of contamination of natural groundwater as a result of human
activities [2].
Decomposition of organic matters in soils, leaching from excess fertilizer application in
agriculture area, human and animal excreta, untreated effluents of nitrogenous industries
and sewage disposal are potential sources of nitrate contamination in groundwater [2].
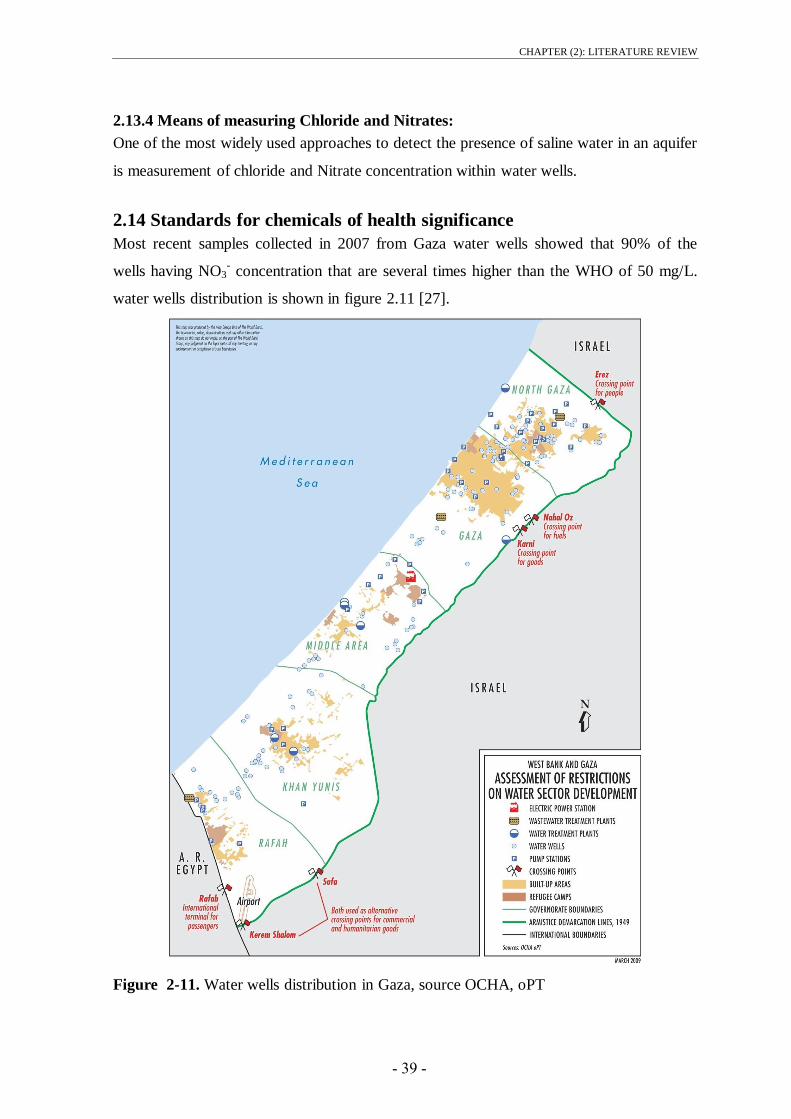
CHAPTER (2): LITERATURE REVIEW
- 39 -
2.13.4 Means of measuring Chloride and Nitrates:
One of the most widely used approaches to detect the presence of saline water in an aquifer
is measurement of chloride and Nitrate concentration within water wells.
2.14 Standards for chemicals of health significance
Most recent samples collected in 2007 from Gaza water wells showed that 90% of the
wells having NO3- concentration that are several times higher than the WHO of 50 mg/L.
water wells distribution is shown in figure 2.11 [27].
Figure 2-11. Water wells distribution in Gaza, source OCHA, oPT
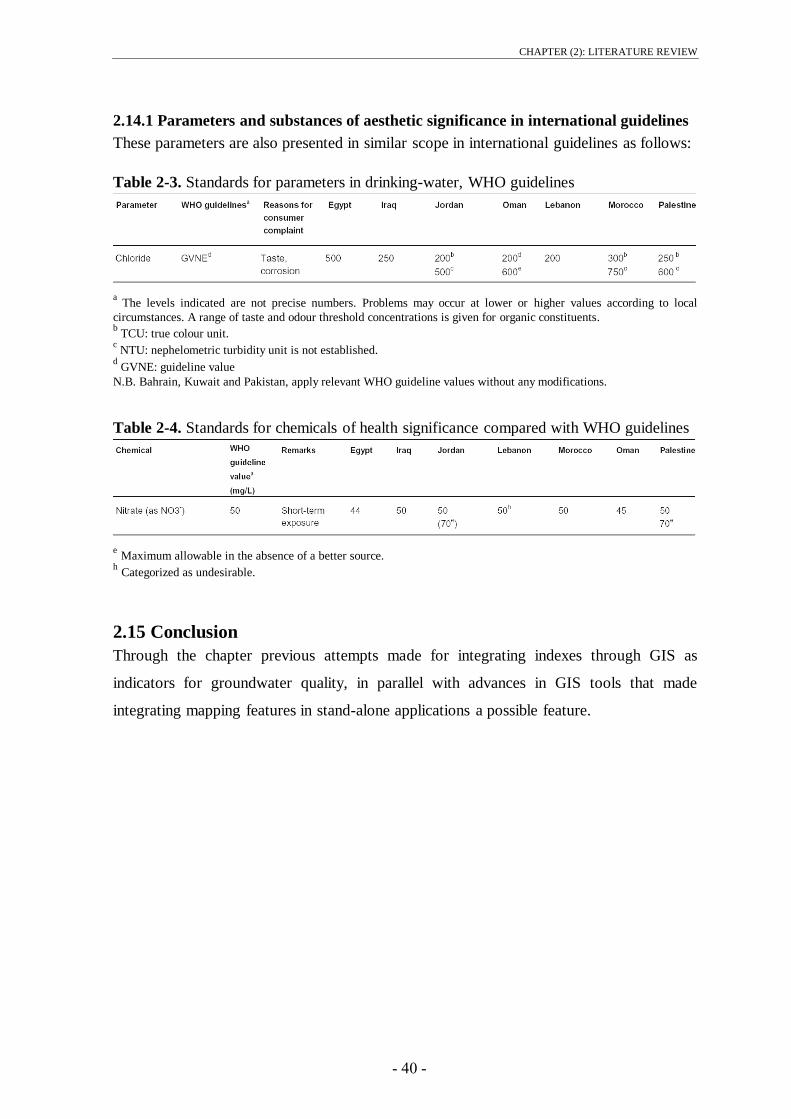
CHAPTER (2): LITERATURE REVIEW
- 41 -
2.14.1 Parameters and substances of aesthetic significance in international guidelines
These parameters are also presented in similar scope in international guidelines as follows:
Table 2-3. Standards for parameters in drinking-water, WHO guidelines
a The levels indicated are not precise numbers. Problems may occur at lower or higher values according to local
circumstances. A range of taste and odour threshold concentrations is given for organic constituents. b TCU: true colour unit.
c NTU: nephelometric turbidity unit is not established.
d GVNE: guideline value
N.B. Bahrain, Kuwait and Pakistan, apply relevant WHO guideline values without any modifications.
Table 2-4. Standards for chemicals of health significance compared with WHO guidelines
e Maximum allowable in the absence of a better source.
h Categorized as undesirable.
2.15 Conclusion
Through the chapter previous attempts made for integrating indexes through GIS as
indicators for groundwater quality, in parallel with advances in GIS tools that made
integrating mapping features in stand-alone applications a possible feature.
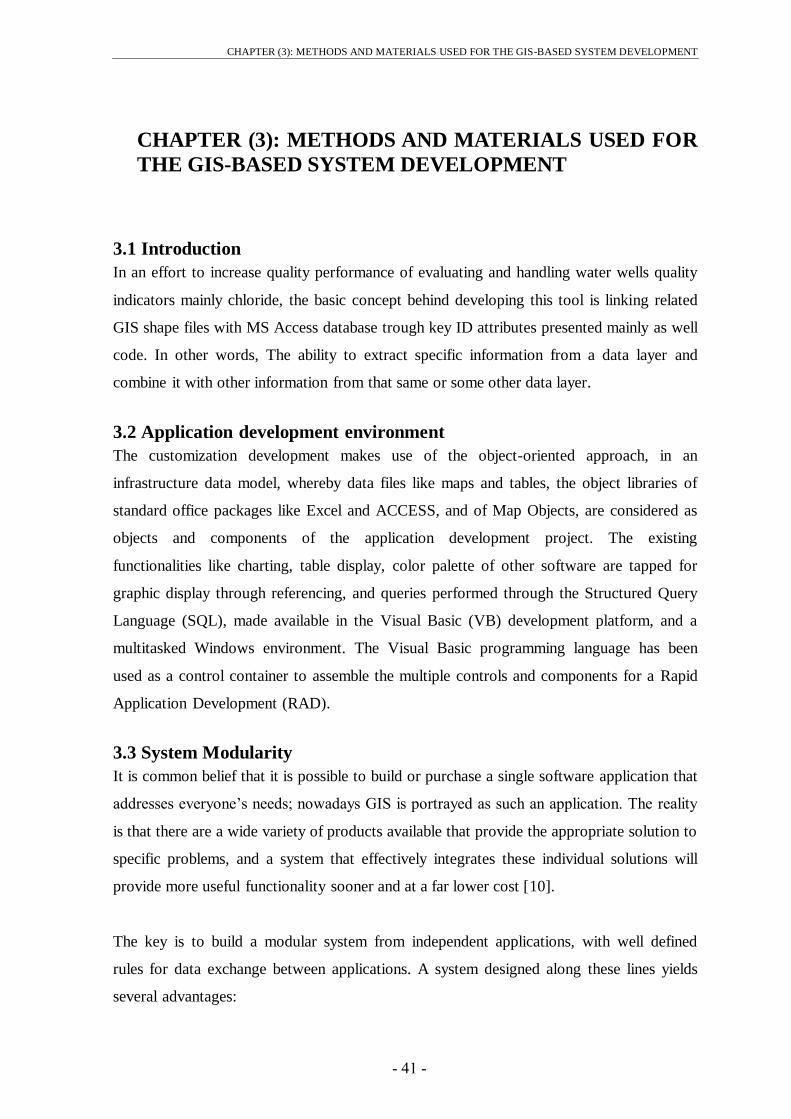
CHAPTER (3): METHODS AND MATERIALS USED FOR THE GIS-BASED SYSTEM DEVELOPMENT
- 40 -
3. CHAPTER (3): METHODS AND MATERIALS USED FOR
THE GIS-BASED SYSTEM DEVELOPMENT
3.1 Introduction
In an effort to increase quality performance of evaluating and handling water wells quality
indicators mainly chloride, the basic concept behind developing this tool is linking related
GIS shape files with MS Access database trough key ID attributes presented mainly as well
code. In other words, The ability to extract specific information from a data layer and
combine it with other information from that same or some other data layer.
3.2 Application development environment
The customization development makes use of the object-oriented approach, in an
infrastructure data model, whereby data files like maps and tables, the object libraries of
standard office packages like Excel and ACCESS, and of Map Objects, are considered as
objects and components of the application development project. The existing
functionalities like charting, table display, color palette of other software are tapped for
graphic display through referencing, and queries performed through the Structured Query
Language (SQL), made available in the Visual Basic (VB) development platform, and a
multitasked Windows environment. The Visual Basic programming language has been
used as a control container to assemble the multiple controls and components for a Rapid
Application Development (RAD).
3.3 System Modularity
It is common belief that it is possible to build or purchase a single software application that
addresses everyone‘s needs; nowadays GIS is portrayed as such an application. The reality
is that there are a wide variety of products available that provide the appropriate solution to
specific problems, and a system that effectively integrates these individual solutions will
provide more useful functionality sooner and at a far lower cost [10].
The key is to build a modular system from independent applications, with well defined
rules for data exchange between applications. A system designed along these lines yields
several advantages:
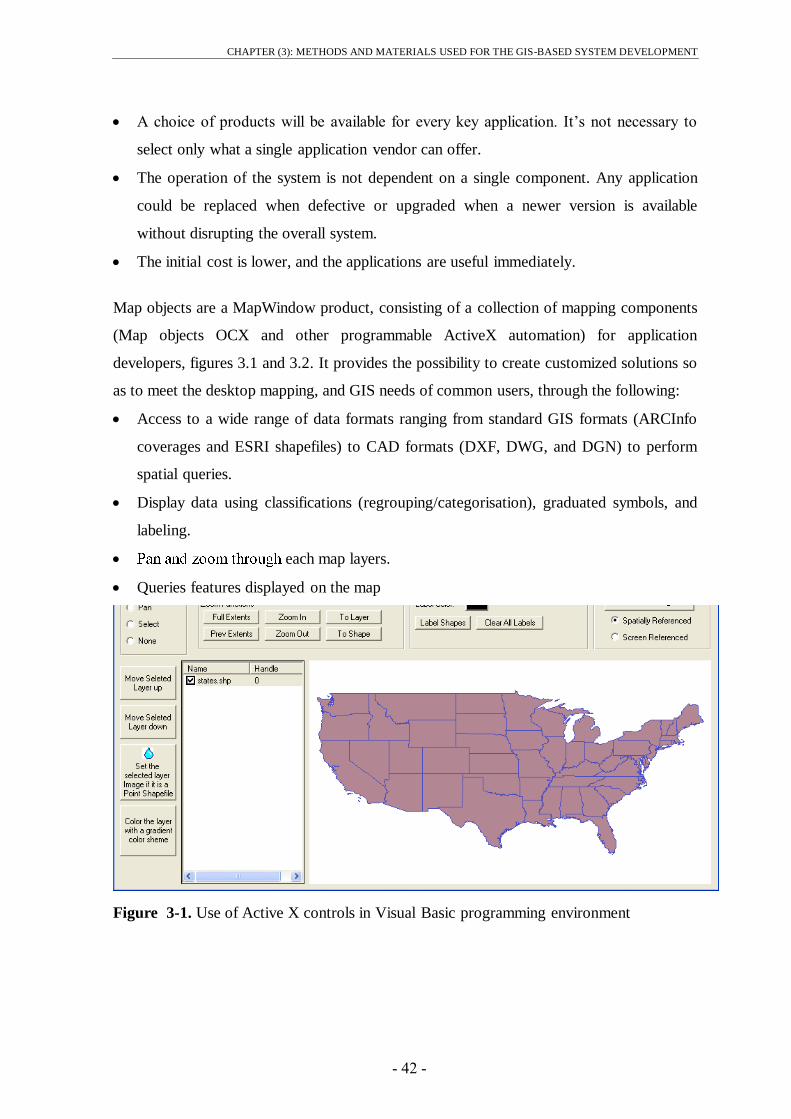
CHAPTER (3): METHODS AND MATERIALS USED FOR THE GIS-BASED SYSTEM DEVELOPMENT
- 42 -
A choice of products will be available for every key application. It‘s not necessary to
select only what a single application vendor can offer.
The operation of the system is not dependent on a single component. Any application
could be replaced when defective or upgraded when a newer version is available
without disrupting the overall system.
The initial cost is lower, and the applications are useful immediately.
Map objects are a MapWindow product, consisting of a collection of mapping components
(Map objects OCX and other programmable ActiveX automation) for application
developers, figures 3.1 and 3.2. It provides the possibility to create customized solutions so
as to meet the desktop mapping, and GIS needs of common users, through the following:
Access to a wide range of data formats ranging from standard GIS formats (ARCInfo
coverages and ESRI shapefiles) to CAD formats (DXF, DWG, and DGN) to perform
spatial queries.
Display data using classifications (regrouping/categorisation), graduated symbols, and
labeling.
each map layers.
Queries features displayed on the map
Figure 3-1. Use of Active X controls in Visual Basic programming environment

CHAPTER (3): METHODS AND MATERIALS USED FOR THE GIS-BASED SYSTEM DEVELOPMENT
- 43 -
Figure 3-2. Use of Active X controls and handling other Shapefiles, Gaza governorates
By means of map objects.OCX and a data connection string, the directory containing the
different map files, and their related databases are retrieved and read, figure 3.2.
3.4 Materials and Methods
3.4.1 Data preparation
Data regarding time history of chloride concentration have been collected previously from
PWA, and currently from CMWU where information regarding selected wells overall Gaza
have been collected. Information regarding 125 wells in the northern area have been
possible, chloride concentration for years 1999, 2000, 2001, 2002, and 2005 were recorded
(625 records), figure 3.3.
Time series reflecting the period from 1987 to 2008 have been possible for 10 selected
wells in the northern area, figure3.4, to enable conducting mathematical interpolation
through polynomial regression of least squared error. The spatial data were prepared with
the Arc/Info GIS software, figures 3.5 and 3.6. Minor changes in the geographic database
were then done in the desktop module ARCView, as the map files were linked with
descriptive database for shape files creation through a common key ID.

CHAPTER (3): METHODS AND MATERIALS USED FOR THE GIS-BASED SYSTEM DEVELOPMENT
- 44 -
Figure 3-3. Collected information for 125 wells for research study, Map featuring mode.
Figure 3-4. Collected information for 10 wells for research study, map prediction mode.

CHAPTER (3): METHODS AND MATERIALS USED FOR THE GIS-BASED SYSTEM DEVELOPMENT
- 45 -
Figure 3-5. Shapefile and data preparation for the 125 water wells
Figure 3-6. Other shapefiles needed preparation such as landuse, soil and municipalities
3.4.2 Database and object controls structure
The databases received as excel files that were imported into Microsoft Access 2003, and
classified according to years. The key ID is advised through the well code. A similar key

CHAPTER (3): METHODS AND MATERIALS USED FOR THE GIS-BASED SYSTEM DEVELOPMENT
- 46 -
was applied to the map files or shapefiles, figure 3.7.
Figure 3-7. Database files in Access; ID key is the well code
List of OCX (Object Controls) used within Microsoft Visual Basic environment:
Text boxes: data is bound with the respective database for display results
Combo boxes: offers possible choice for selection
Check boxes: Click for display
Command button: To execute the different functions or events allocated.
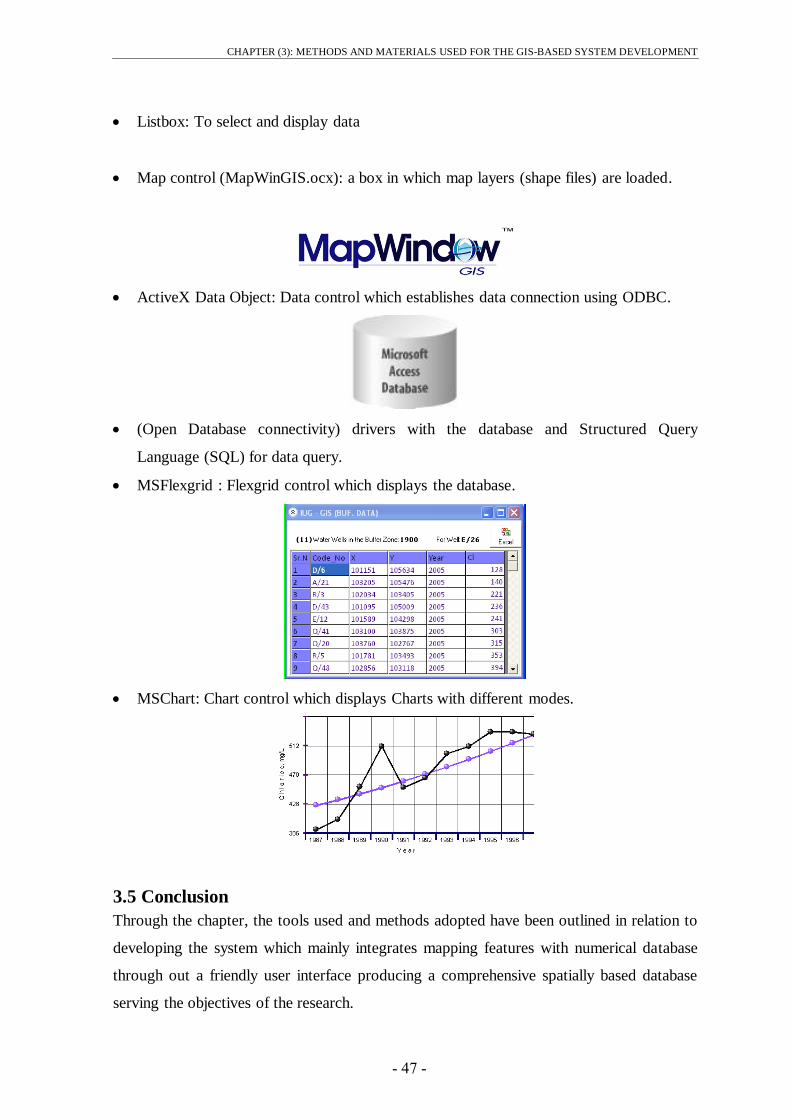
CHAPTER (3): METHODS AND MATERIALS USED FOR THE GIS-BASED SYSTEM DEVELOPMENT
- 47 -
Listbox: To select and display data
Map control (MapWinGIS.ocx): a box in which map layers (shape files) are loaded.
ActiveX Data Object: Data control which establishes data connection using ODBC.
(Open Database connectivity) drivers with the database and Structured Query
Language (SQL) for data query.
MSFlexgrid : Flexgrid control which displays the database.
MSChart: Chart control which displays Charts with different modes.
3.5 Conclusion
Through the chapter, the tools used and methods adopted have been outlined in relation to
developing the system which mainly integrates mapping features with numerical database
through out a friendly user interface producing a comprehensive spatially based database
serving the objectives of the research.
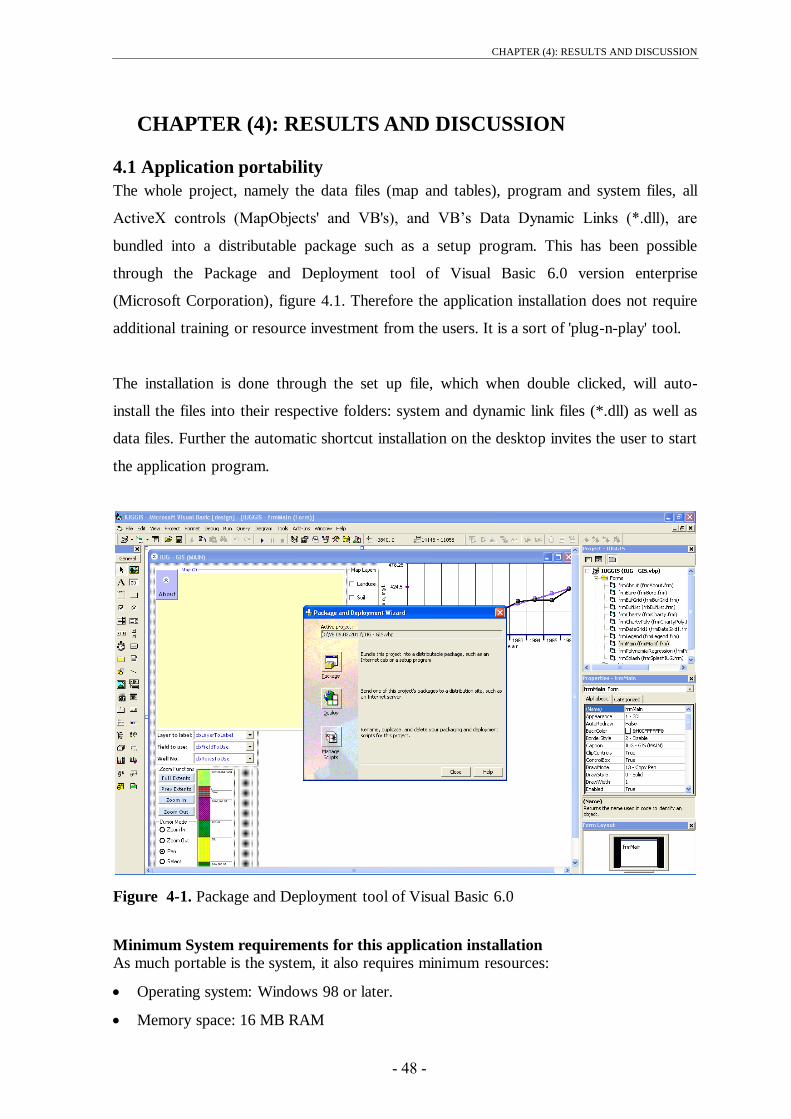
CHAPTER (4): RESULTS AND DISCUSSION
- 48 -
4. CHAPTER (4): RESULTS AND DISCUSSION
4.1 Application portability
The whole project, namely the data files (map and tables), program and system files, all
ActiveX controls (MapObjects' and VB's), and VB‘s Data Dynamic Links (*.dll), are
bundled into a distributable package such as a setup program. This has been possible
through the Package and Deployment tool of Visual Basic 6.0 version enterprise
(Microsoft Corporation), figure 4.1. Therefore the application installation does not require
additional training or resource investment from the users. It is a sort of 'plug-n-play' tool.
The installation is done through the set up file, which when double clicked, will auto-
install the files into their respective folders: system and dynamic link files (*.dll) as well as
data files. Further the automatic shortcut installation on the desktop invites the user to start
the application program.
Figure 4-1. Package and Deployment tool of Visual Basic 6.0
Minimum System requirements for this application installation
As much portable is the system, it also requires minimum resources:
Operating system: Windows 98 or later.
Memory space: 16 MB RAM

CHAPTER (4): RESULTS AND DISCUSSION
- 49 -
Free Hard disk space: 50MB
Microsoft Excel 97 or later
Microsoft Access 97 or later
Data files*: 5 MB
System & program files: 10 MB
Total disk space for setup: 15 MB
* The size may vary with amount of details collected, and is expected to normally increase
with time.
4.2 Application overview
It consists of a user-friendly interface, based on WYSIWYG through figures from 4.2 to
4.17, where the user easily moves across the different screens, with the help of clickable
icons, combo boxes, pull down menus for dynamic mapping of the area of interest, and
eventual hard prints output of data grids through MS Excel.
Through the outlined button in figure 4.2, the user is able to load the needed maps by one
click, application will read the path where the shapfiles are stored and load them into the
map.
Attributes presented in the well ID will be loaded into the combo box for Attributes label.
As full code resulted in more than 300 lines, partial code of this functionality, provided
through Appendix B.
In figure 4.3, outlined buttons, are used to enable the user to zoom in and out, full extent or
previous extent, identical to available previewing pan as in ESRI ArcMAP. This will
provide the user with rich map maneuvering tool menu.
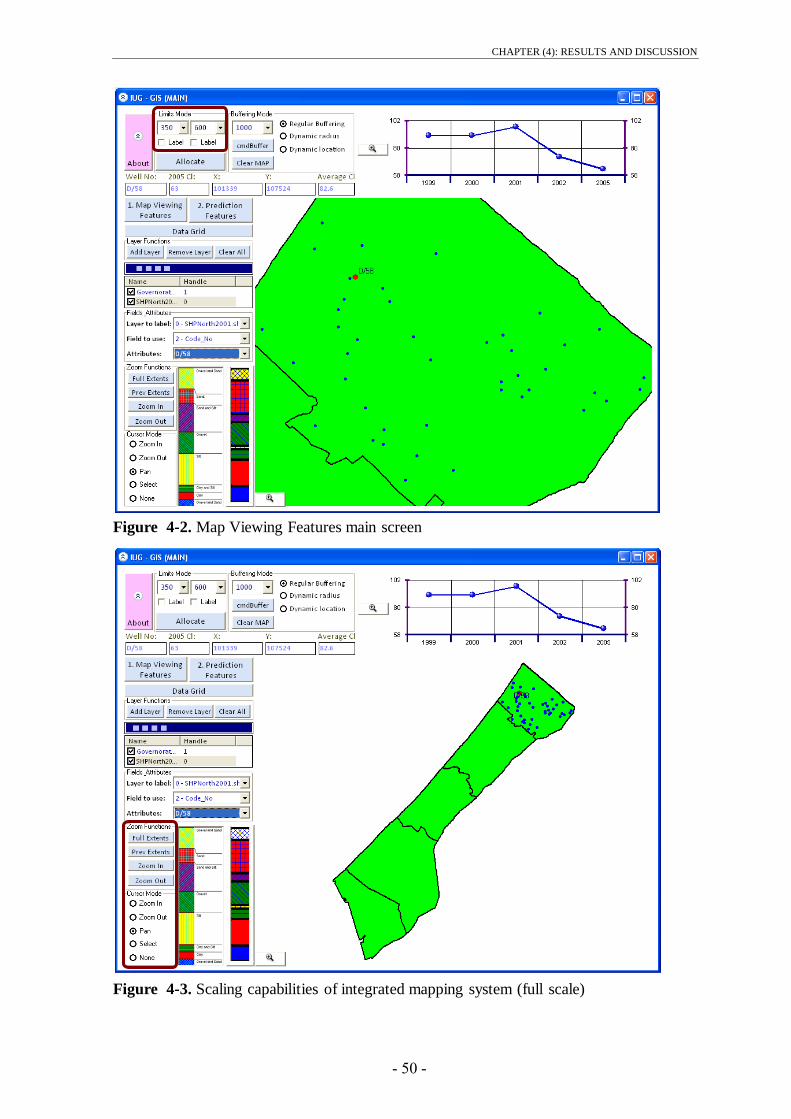
CHAPTER (4): RESULTS AND DISCUSSION
- 51 -
Figure 4-2. Map Viewing Features main screen
Figure 4-3. Scaling capabilities of integrated mapping system (full scale)

CHAPTER (4): RESULTS AND DISCUSSION
- 50 -
In figure 4.4, exploring through listed well, is giving the user ability to manipulate with
every well data, obtain, time-series chart, log-plots, etc…
Figure 4-4. Exploring through listed wells
Through spatial and map viewing user can maneuver through the list and obtain
information on subject well.
Choosing from a list could be developed further if the user is allowed to directly select the
subject well from the map by just a mouse click.
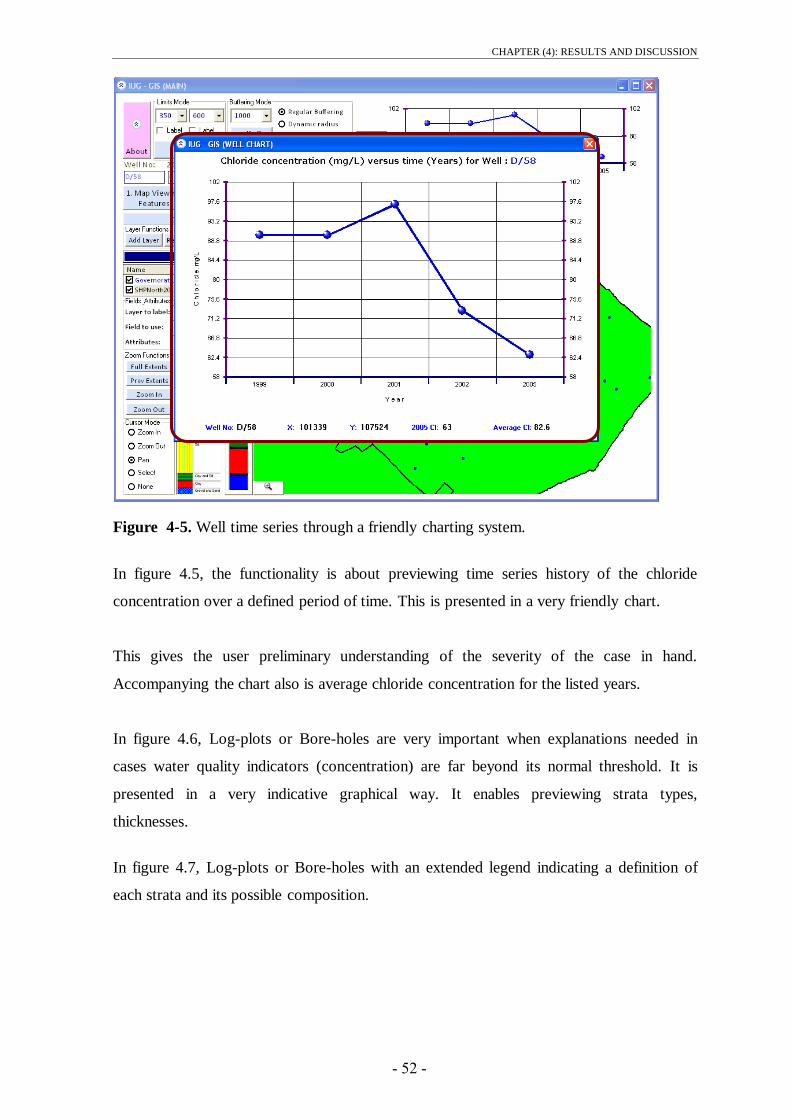
CHAPTER (4): RESULTS AND DISCUSSION
- 52 -
Figure 4-5. Well time series through a friendly charting system.
In figure 4.5, the functionality is about previewing time series history of the chloride
concentration over a defined period of time. This is presented in a very friendly chart.
This gives the user preliminary understanding of the severity of the case in hand.
Accompanying the chart also is average chloride concentration for the listed years.
In figure 4.6, Log-plots or Bore-holes are very important when explanations needed in
cases water quality indicators (concentration) are far beyond its normal threshold. It is
presented in a very indicative graphical way. It enables previewing strata types,
thicknesses.
In figure 4.7, Log-plots or Bore-holes with an extended legend indicating a definition of
each strata and its possible composition.

CHAPTER (4): RESULTS AND DISCUSSION
- 53 -
Figure 4-6. Bore-log presented to describe different soil strata for the subject well.
Figure 4-7. Bore-log and log legend and details.

CHAPTER (4): RESULTS AND DISCUSSION
- 54 -
In figure 4.8, water quality status is usually interpreted by comparing current
concentrations of substances i.e. chloride, Nitrate, etc with those national/international
MCLs of those substances.
This is made available for the chloride case Cl-, where user can identify an MCL to see
how many water wells are not meeting that condition i.e. above it.
MCL is known to be a good interpreter of water quality, making this even more interactive
using the spatial extent of such indicator will give the user ability to identify the extent of
the problem if happened and could start using that in identifying possible reasons for that.
Figure 4-8. Local or international MCL, showing Wells with concentrations above
In figure 4.9, labeling identified wells above MCL upon user request enabling enough
screen space to preview all map features without need to zoom in or out.
A utility that can let the user avoid congestion of elements on the map when no need to
show all of them.
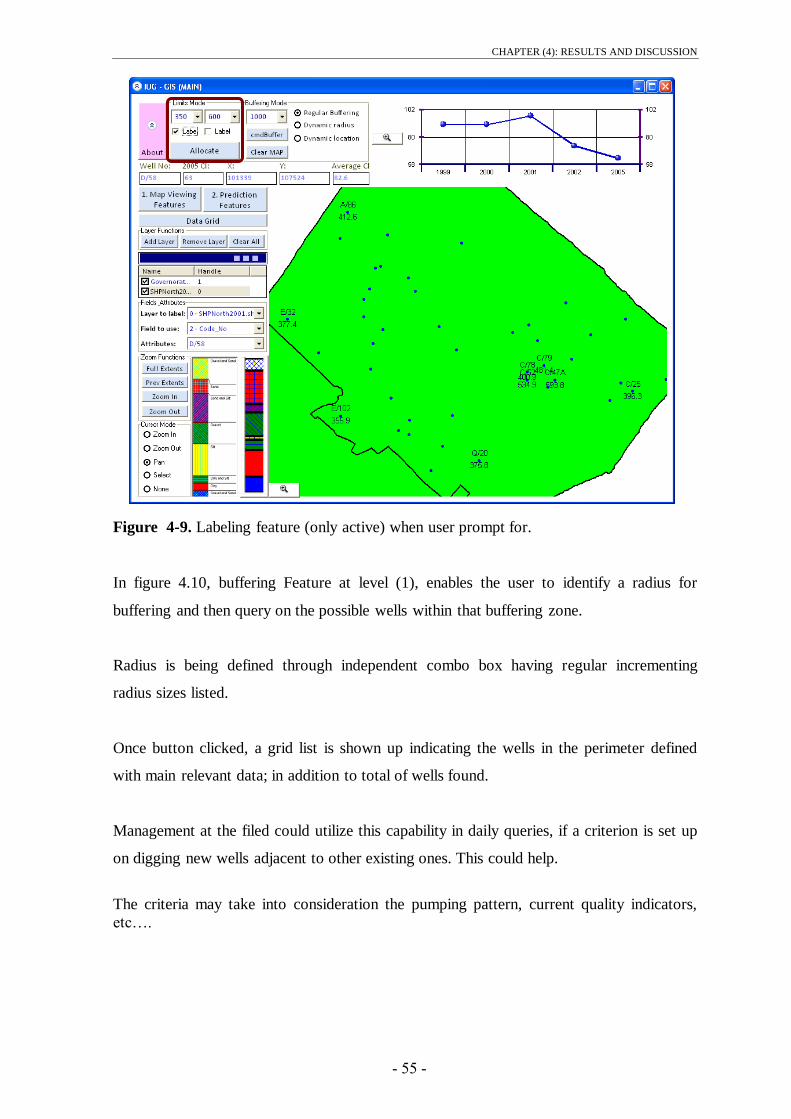
CHAPTER (4): RESULTS AND DISCUSSION
- 55 -
Figure 4-9. Labeling feature (only active) when user prompt for.
In figure 4.10, buffering Feature at level (1), enables the user to identify a radius for
buffering and then query on the possible wells within that buffering zone.
Radius is being defined through independent combo box having regular incrementing
radius sizes listed.
Once button clicked, a grid list is shown up indicating the wells in the perimeter defined
with main relevant data; in addition to total of wells found.
Management at the filed could utilize this capability in daily queries, if a criterion is set up
on digging new wells adjacent to other existing ones. This could help.
The criteria may take into consideration the pumping pattern, current quality indicators,
etc….
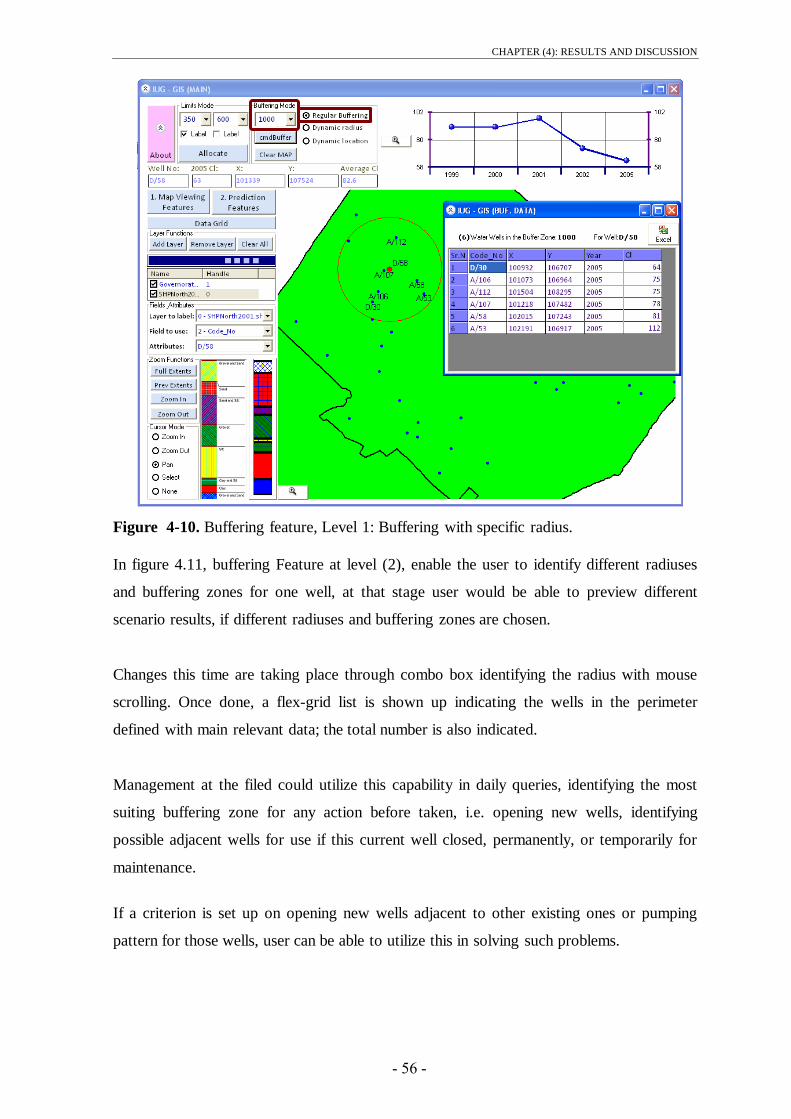
CHAPTER (4): RESULTS AND DISCUSSION
- 56 -
Figure 4-10. Buffering feature, Level 1: Buffering with specific radius.
In figure 4.11, buffering Feature at level (2), enable the user to identify different radiuses
and buffering zones for one well, at that stage user would be able to preview different
scenario results, if different radiuses and buffering zones are chosen.
Changes this time are taking place through combo box identifying the radius with mouse
scrolling. Once done, a flex-grid list is shown up indicating the wells in the perimeter
defined with main relevant data; the total number is also indicated.
Management at the filed could utilize this capability in daily queries, identifying the most
suiting buffering zone for any action before taken, i.e. opening new wells, identifying
possible adjacent wells for use if this current well closed, permanently, or temporarily for
maintenance.
If a criterion is set up on opening new wells adjacent to other existing ones or pumping
pattern for those wells, user can be able to utilize this in solving such problems.

CHAPTER (4): RESULTS AND DISCUSSION
- 57 -
Figure 4-11. Buffering feature, Level 2: Buffering with dynamic radius, fixed well.
In figure 4.12, buffering Feature at level (3), enable the user to fix a radius and then
buffering for multiple wells, at that stage user would be able to preview different scenario
results for one buffering and see its impact on every well and what wells could be in the
vicinity of the subject well.
Changes this time are taking place through the combo box identifying the wells with
mouse scrolling.
Once button clicked, a grid list is shown up indicating the wells in the perimeter defined
with main relevant data; the total number is also indicated.
Management at the filed could utilize this capability in daily queries, as some time
constraint regarding buffering zone would result in switching between available wells and
see where this could apply.

CHAPTER (4): RESULTS AND DISCUSSION
- 58 -
Figure 4-12. Buffering feature, Level 2: Buffering with dynamic Well location.
In figure 4.13, user will be always able to switch back between screens and modes by one
click, at this stage button (1) was clicked to get us back to the map viewing features and
start again from there.
A tool with easy-to-manipulate is usually a need whether during daily work, or when
conducting training, easy and direct.
In figure 4.14, it has been made possible that user load other shapfiles, but they will not be
linked to any database, user will be able to navigate through shapefiles loaded only.
Even if the system is purpose-specific, it is still a GIS based tool, that should be rich such
any GIS tool, map viewing, zooming, etc..
At this stage, this GIS-based system is not developed to cope with different database or
shapefile, it could be developed in a way that user is prompt to choose the shapefile and the
database for the study need.
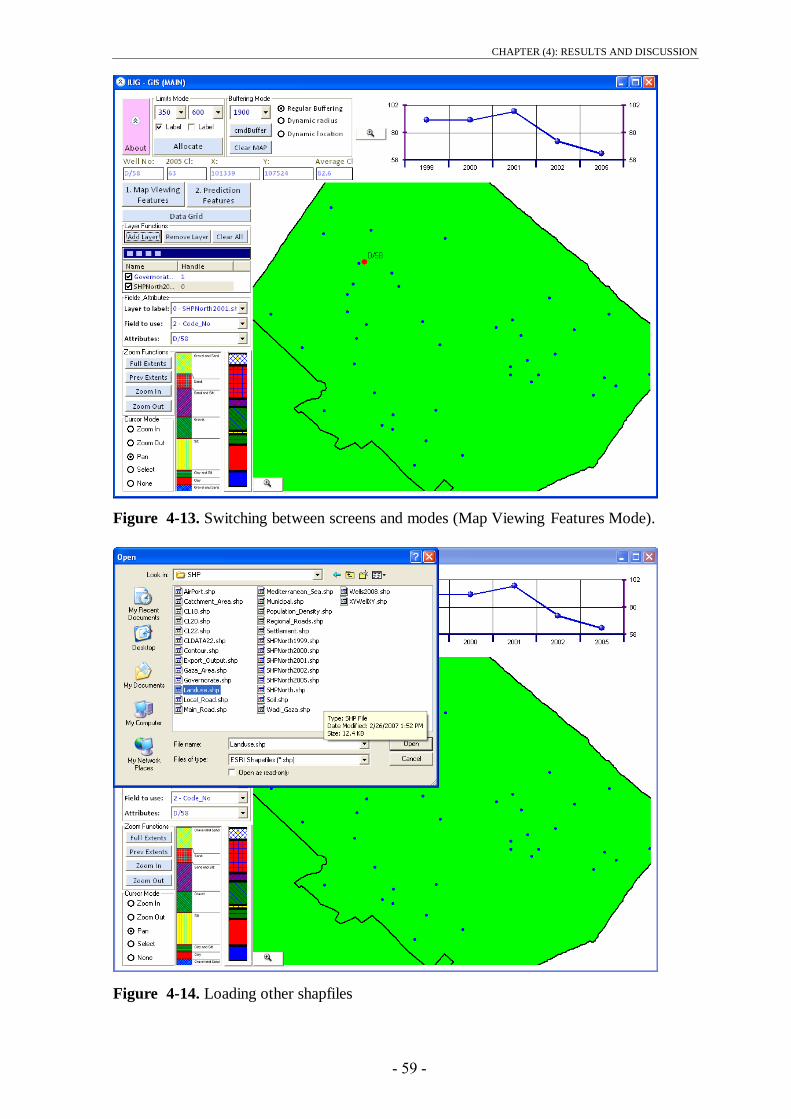
CHAPTER (4): RESULTS AND DISCUSSION
- 59 -
Figure 4-13. Switching between screens and modes (Map Viewing Features Mode).
Figure 4-14. Loading other shapfiles
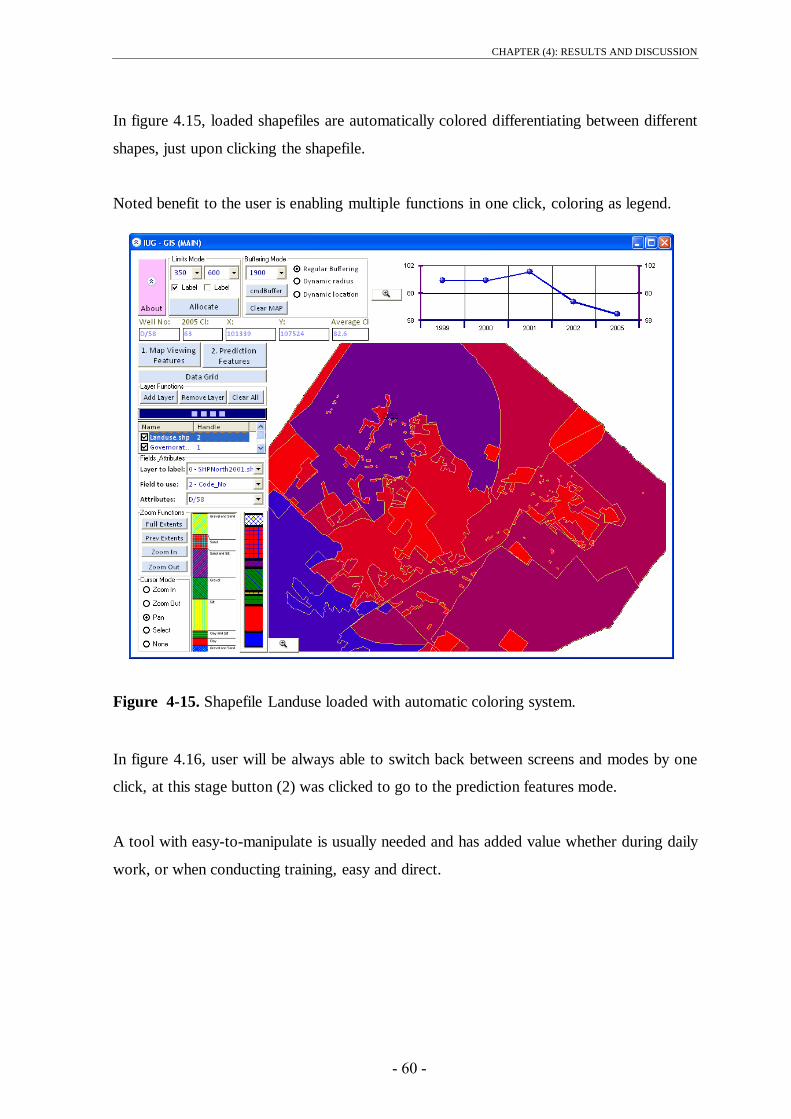
CHAPTER (4): RESULTS AND DISCUSSION
- 61 -
In figure 4.15, loaded shapefiles are automatically colored differentiating between different
shapes, just upon clicking the shapefile.
Noted benefit to the user is enabling multiple functions in one click, coloring as legend.
Figure 4-15. Shapefile Landuse loaded with automatic coloring system.
In figure 4.16, user will be always able to switch back between screens and modes by one
click, at this stage button (2) was clicked to go to the prediction features mode.
A tool with easy-to-manipulate is usually needed and has added value whether during daily
work, or when conducting training, easy and direct.

CHAPTER (4): RESULTS AND DISCUSSION
- 60 -
Figure 4-16. Switching between screens and modes (Predication Features Mode).
In figure 4.17, exporting to MS Excel facility is available, through outlined button as
, which export lists to Excel.
This would enable the user to export any developed or extracted information to Excel,
allowing for further manipulation or utilization of listed information.
Reporting, is to be developed in a way allowing for printing maps and figures, printing
prepared lists directly from the application without the need to obtain other applications
support such as MS Excel.
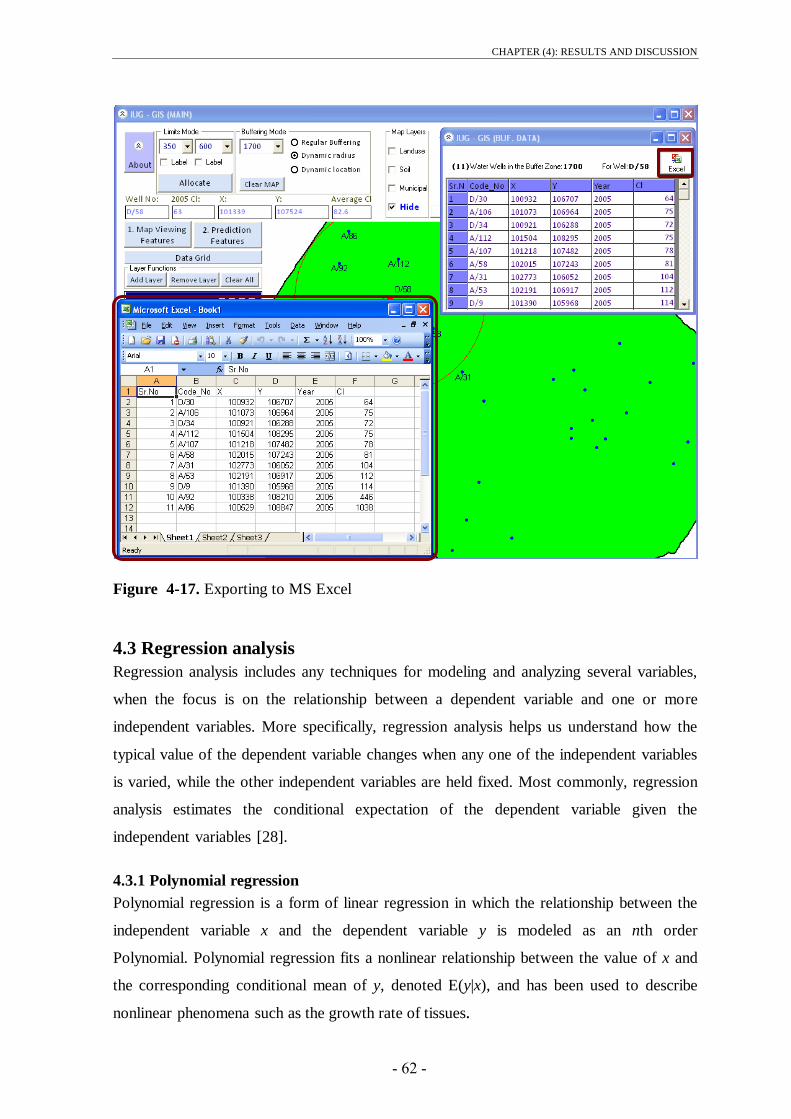
CHAPTER (4): RESULTS AND DISCUSSION
- 62 -
Figure 4-17. Exporting to MS Excel
4.3 Regression analysis
Regression analysis includes any techniques for modeling and analyzing several variables,
when the focus is on the relationship between a dependent variable and one or more
independent variables. More specifically, regression analysis helps us understand how the
typical value of the dependent variable changes when any one of the independent variables
is varied, while the other independent variables are held fixed. Most commonly, regression
analysis estimates the conditional expectation of the dependent variable given the
independent variables [28].
4.3.1 Polynomial regression
Polynomial regression is a form of linear regression in which the relationship between the
independent variable x and the dependent variable y is modeled as an nth order
Polynomial. Polynomial regression fits a nonlinear relationship between the value of x and
the corresponding conditional mean of y, denoted E(y|x), and has been used to describe
nonlinear phenomena such as the growth rate of tissues.

CHAPTER (4): RESULTS AND DISCUSSION
- 63 -
Polynomial regression models are usually fit using the method of least squares. The least-
squares method minimizes the variance of the unbiased estimators of the coefficients,
under the conditions of the Gauss–Markov theorem. Analyzing a Matrix for polynomial
regression includes [29]:
The basis of polynomial regression is that a data set of n paired (x, y) members:
…………………… (1)
Can be processed using a least-squares method to create a predictive polynomial equation
of degree p:
…………… (2)
The essence of the method is to reduce the residual R at each data point:
………………… (3)
This is accomplished by first expressing the system in matrix form (this example
represents a polynomial of degree 4):
… (4)
Then solving for the unknown middle column, (e.g. a0, a1, a2 ...) by means of Gauss-Jordan
elimination. The resulting values represent the polynomial coefficients for equation (2)
above.
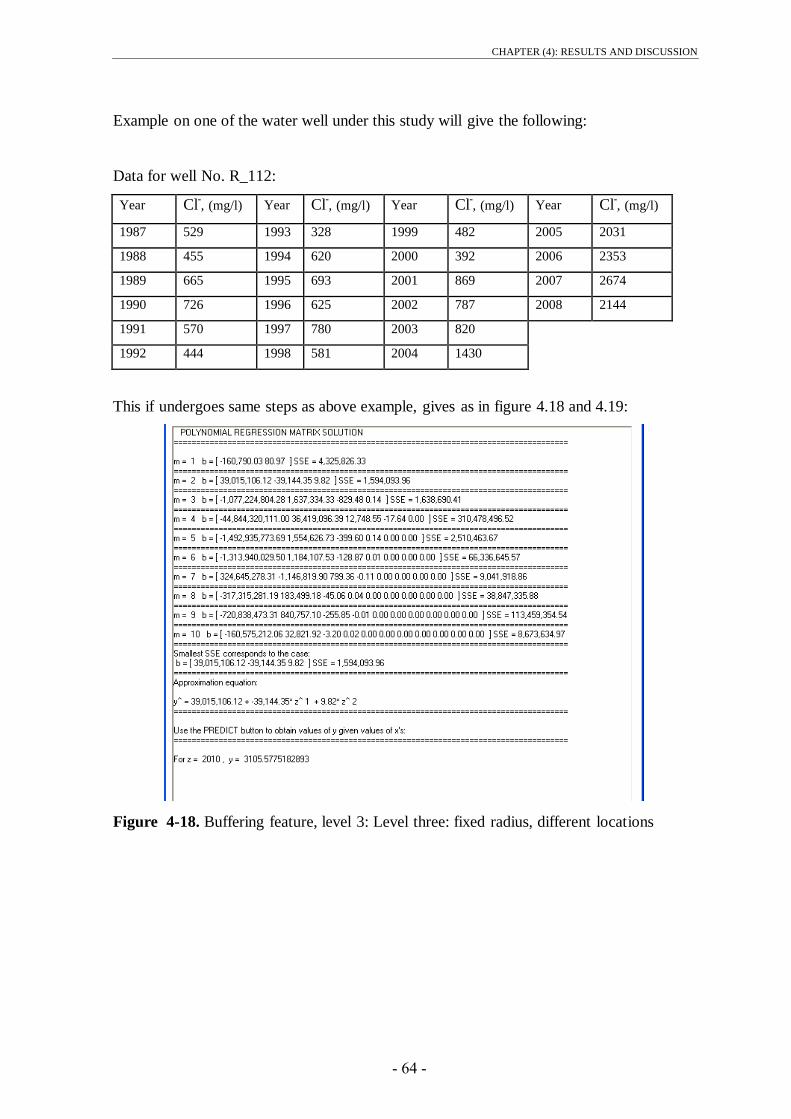
CHAPTER (4): RESULTS AND DISCUSSION
- 64 -
Example on one of the water well under this study will give the following:
Data for well No. R_112:
Year Cl-, (mg/l) Year Cl
-, (mg/l) Year Cl
-, (mg/l) Year Cl
-, (mg/l)
1987 529 1993 328 1999 482 2005 2031
1988 455 1994 620 2000 392 2006 2353
1989 665 1995 693 2001 869 2007 2674
1990 726 1996 625 2002 787 2008 2144
1991 570 1997 780 2003 820
1992 444 1998 581 2004 1430
This if undergoes same steps as above example, gives as in figure 4.18 and 4.19:
Figure 4-18. Buffering feature, level 3: Level three: fixed radius, different locations

CHAPTER (4): RESULTS AND DISCUSSION
- 65 -
Figure 4-19. Polynomial regression analysis is conducted here through the least squared
error
Where degree of equation is defined according to the minimum SSE.
Error = (yobserved - ypredicted) * 100
4.3.2 Residues, Sum-of-Squares Error (SSE)
A residue is the difference between an observed and predicted value of a function. (A
predicted value means a value given by some mathematical model.)
Residue = Observed value - Predicted value
The sum-of-squares error (SSE) when observed data are approximated by a function is
given by: SSE = Sum of squares of residues = Sum of (yobserved - ypredicted)2
The smaller SSE, the better the approximating function fits the data.
4.3.3 Inflation of R2 in least squares regression
The quantity r, called the linear correlation coefficient, measures the strength and the
direction of a linear relationship between two variables. The linear correlation coefficient
is sometimes referred to as the Pearson product moment correlation coefficient in honor of
its developer Karl Pearson.
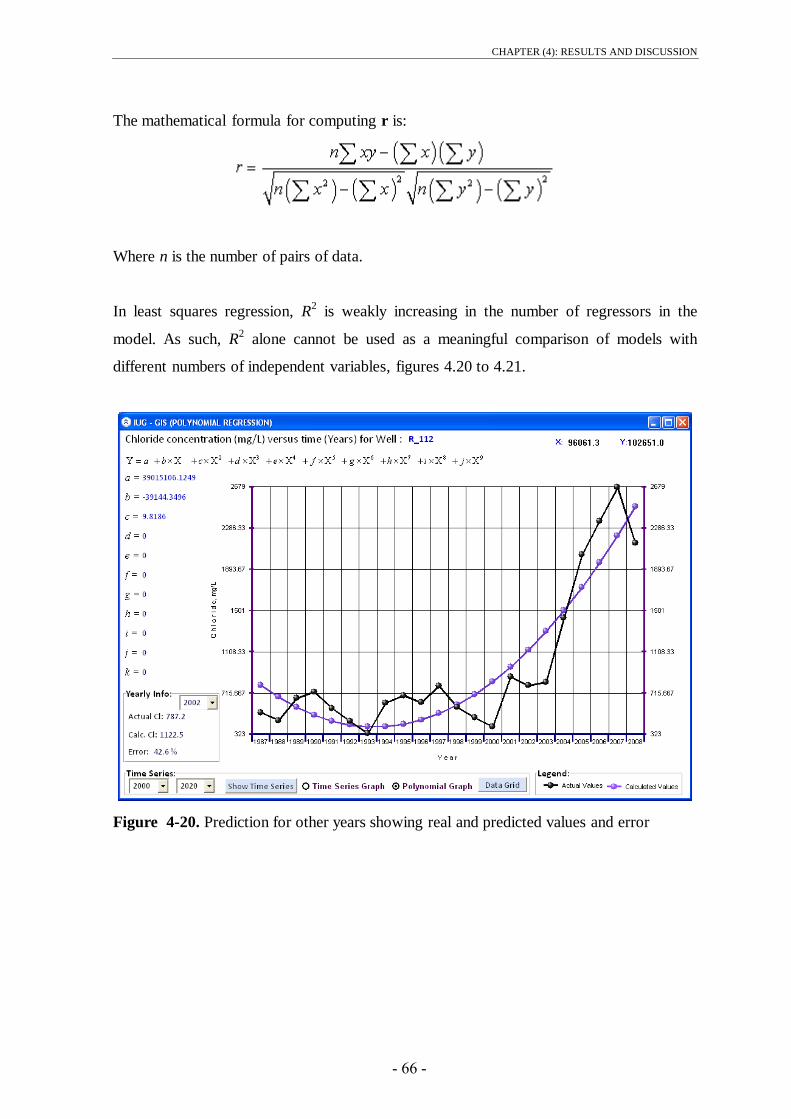
CHAPTER (4): RESULTS AND DISCUSSION
- 66 -
The mathematical formula for computing r is:
Where n is the number of pairs of data.
In least squares regression, R2 is weakly increasing in the number of regressors in the
model. As such, R2 alone cannot be used as a meaningful comparison of models with
different numbers of independent variables, figures 4.20 to 4.21.
Figure 4-20. Prediction for other years showing real and predicted values and error
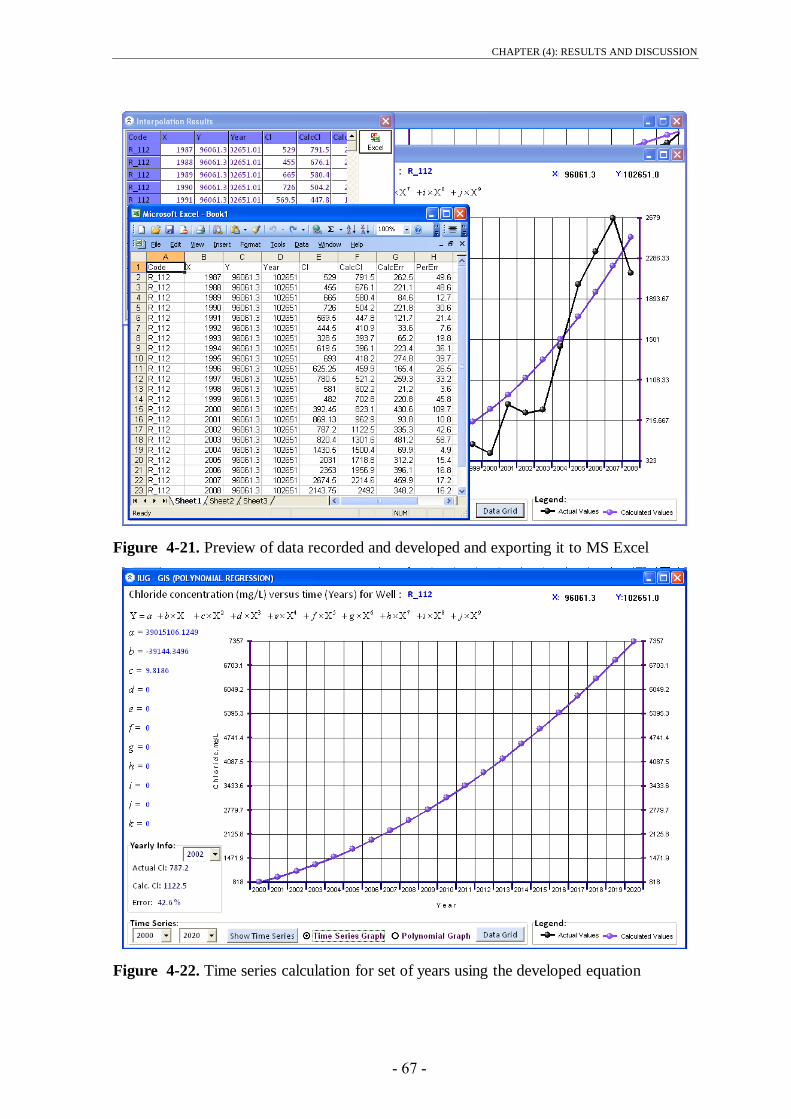
CHAPTER (4): RESULTS AND DISCUSSION
- 67 -
Figure 4-21. Preview of data recorded and developed and exporting it to MS Excel
Figure 4-22. Time series calculation for set of years using the developed equation

CHAPTER (4): RESULTS AND DISCUSSION
- 68 -
4.4 Map overlapping application
Throughout this developed system, user will be able to identify several related information
at one time for a specific query i.e. Performing spatial queries on the data, and searching
for features with specific attributes:
This is possible through selecting one additional map and hence information source in
addition to existing information where location of subject water well is automatically
identified and shows related information to that well from the other map. Below is
illustration, figures 4.23 to 4.25:
Figure 4-23. Land use for selected well E/54
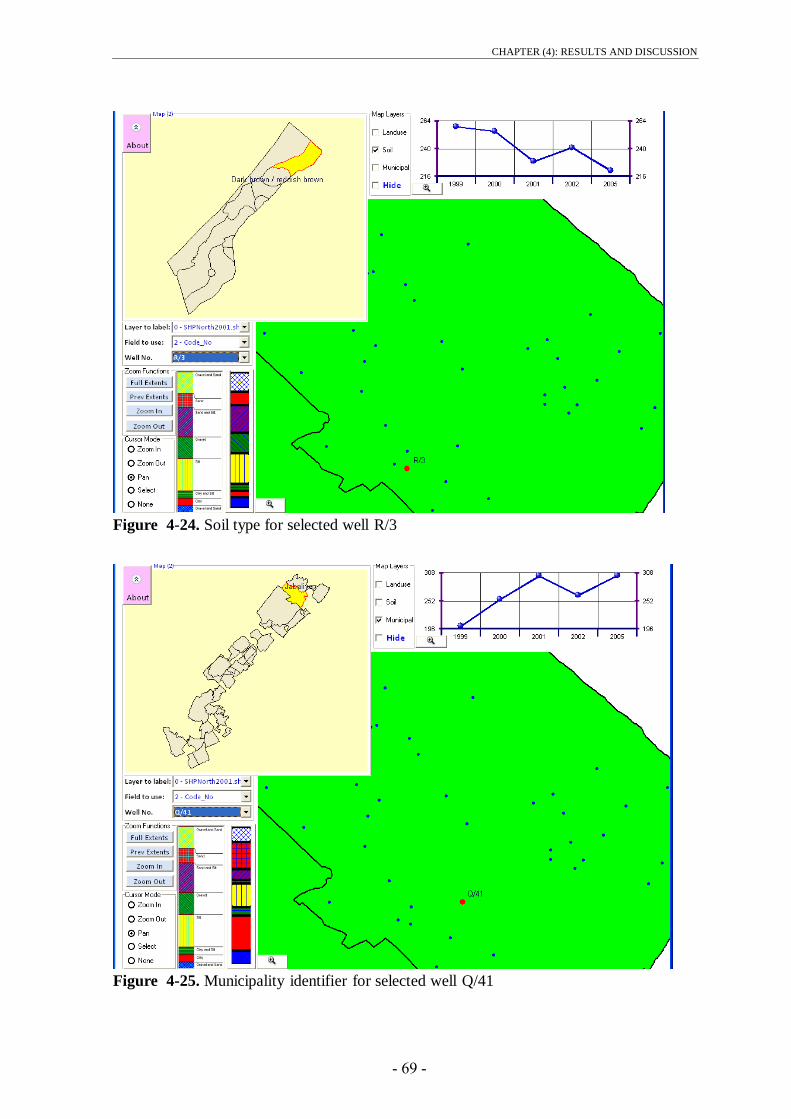
CHAPTER (4): RESULTS AND DISCUSSION
- 69 -
Figure 4-24. Soil type for selected well R/3
Figure 4-25. Municipality identifier for selected well Q/41
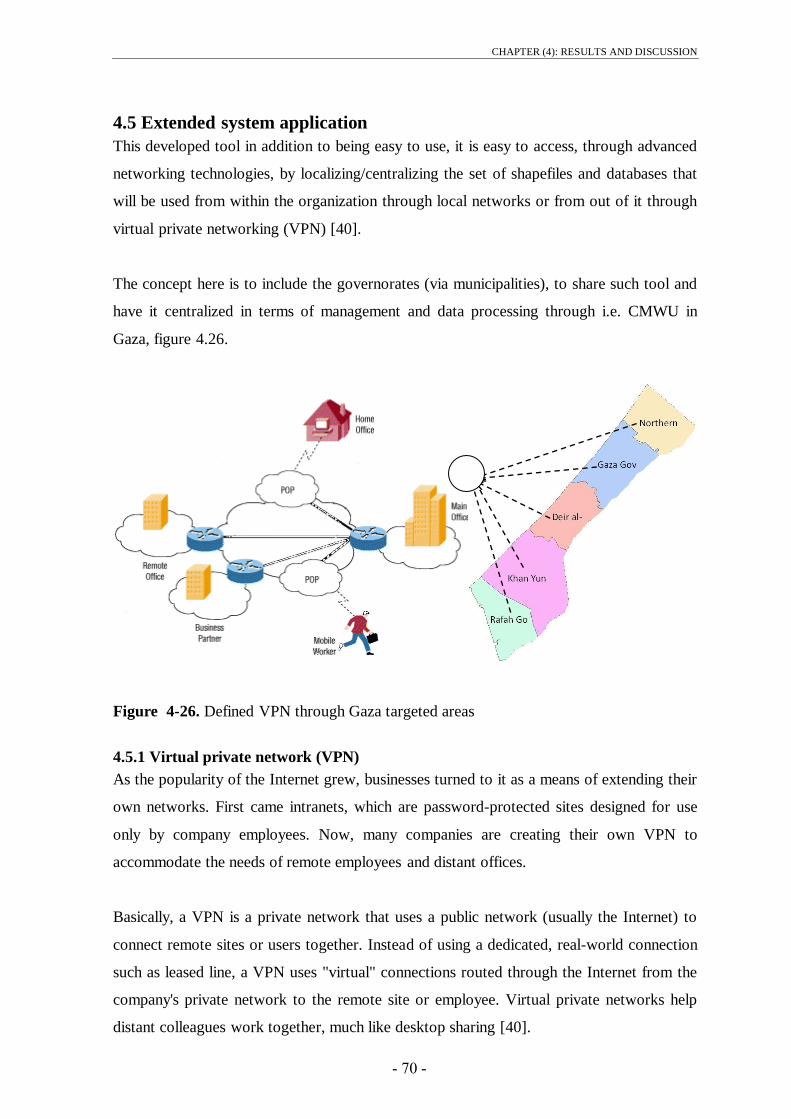
CHAPTER (4): RESULTS AND DISCUSSION
- 71 -
4.5 Extended system application
This developed tool in addition to being easy to use, it is easy to access, through advanced
networking technologies, by localizing/centralizing the set of shapefiles and databases that
will be used from within the organization through local networks or from out of it through
virtual private networking (VPN) [40].
The concept here is to include the governorates (via municipalities), to share such tool and
have it centralized in terms of management and data processing through i.e. CMWU in
Gaza, figure 4.26.
Figure 4-26. Defined VPN through Gaza targeted areas
4.5.1 Virtual private network (VPN)
As the popularity of the Internet grew, businesses turned to it as a means of extending their
own networks. First came intranets, which are password-protected sites designed for use
only by company employees. Now, many companies are creating their own VPN to
accommodate the needs of remote employees and distant offices.
Basically, a VPN is a private network that uses a public network (usually the Internet) to
connect remote sites or users together. Instead of using a dedicated, real-world connection
such as leased line, a VPN uses "virtual" connections routed through the Internet from the
company's private network to the remote site or employee. Virtual private networks help
distant colleagues work together, much like desktop sharing [40].

CHAPTER (4): RESULTS AND DISCUSSION
- 70 -
Remote-access, also called a virtual private dial-up network (VPDN), is a user-to-LAN
(local area networks) connection used by a company that has employees who need to
connect to the private network from various remote locations. Typically, a corporation that
wishes to set up a large remote-access VPN will outsource to an enterprise service provider
(ESP).
4.5.2 Remote access VPNs
Remote access VPNs (see Figure 2), enables mobile users to establish a connection to an
organization server by using the infrastructure provided by an ISP (Internet Services
Provider). Remote access VPN allows users to connect to their corporate intranets or
extranets wherever or whenever is needed. Users have access to all the resources on the
organization‘s network as if they are physically located in organization.
Figure 4-27. Remote Access VPNs
4.5.3 Productivity and Cost Benefit of VPNs
A well-designed VPN can greatly benefit a company. For example, it can:
Extend geographic connectivity
Improve security
Reduce operational costs versus traditional wide area network (WAN)
Reduce transit time and transportation costs for remote users
Improve productivity
Simplify network topology
Provide global networking opportunities
CHAPTER (4): RESULTS AND DISCUSSION
- 72 -
Provide telecommuter support
Provide broadband networking compatibility
Provide faster ROI (return on investment) than traditional WAN
In terms of productivity VPN‘s have come a long way, also VPN‘s Benefit an organization
or in the following ways:
1. Extends Geographic Connectivity- a VPN connects remote workers to central
resources, making it easier to set up global operations.
2. Boosts Employee Productivity- A VPN solution enables telecommuters to boost their
productivity by 22% - 45% (Gallup Organization and Opinion Research) by
eliminating time-consuming commutes and by creating uninterrupted time for focused
work.
3. Improves Internet Security – An always-on broadband connection to the Internet makes
a network vulnerable to hacker attacks. Many VPN solutions include additional
security measures, such as firewalls and anti-virus checks to counteract the different
types of network security threats.
4. Scales Easily – A VPN allows companies to utilize the remote access infrastructure
within ISPs. Therefore, companies are able to add a virtually unlimited amount of
capacity without adding significant infrastructure [40].
4.6 Conclusion
Through the chapter, focus made on the outputs of the system developed through
discussing main features such as the used prediction model and explaining other relevant
measures introduced to ensure system integration and extendibility within the real
application environment such as the VPN technology.
CHAPTER (5): CONCLUSION AND RECOMMENDATIONS
- 73 -
5. CHAPTER (5): CONCLUSION AND
RECOMMENDATIONS
5.1 Conclusion
5.1.1 Introduction
The water resources management in the Gaza strip when it comes to GIS related
technology relies on ordinary applications such as ESRI ArcMAP and Geomedia
Professional, this result in the following:
1- Very high cost to adopt such platforms as each license should have a cost.
2- These applications are sophisticated in the general concept when it comes to non-
technical users of the GIS.
3- Intensive training and up-to-date knowledge is required to keep tracking of the changes
and updates on the versions of these products.
4- Portability is considered not possible as only the computer that have the application
installed is the one to run that application, switching to another for the same licensing
requires removing and re-installing.
5- It is not direct in its concept, as it serves a divers users over the world, this lets reaching
some results time and effort consuming.
Trying to mitigate the effect of such complication, comes this research as a developing
effort for a GIS-Based system for evaluating the water quality parameters / indicators and
hence water quality in the Gaza strip, that tackles a very important issue for water
resources management through availing the proper and easy tools to keep up-to-date
tracking of data, which is a key element in the management cycle especially in water
related issues and water wells more specifically.
The main contribution of this study is providing the water facilities and utilities with a
daily to use tool if updated records preserved, that enable its users to have effective
understanding of the water issues at their area through keeping track of quality indicators
of water wells in that area.
This tool through application on water wells in Gaza is proving to give very needy results
and outputs to water resources managers in the strip.
CHAPTER (5): CONCLUSION AND RECOMMENDATIONS
- 74 -
This new paradigm of GIS is moving to an open platform, where it is an equal component
with other third party software, brings new avenues to water resources users, and
application developers in this field.
5.1.2 Benefits of the research
This research addresses the current situation of Gaza's water resources that are depleting by
time and the need to utilize current affordable technologies in its management practices,
additionally:
1. It introduces this concept practice into water utility association, as a supplementary tool
for current GIS practices.
2. The GIS practice in Gaza is still in its very primitive levels, through but developing
maps of different types including the interpolation and prediction maps. Thus, this GIS
Based technology could provide other means of interpreting the information and data
for water issues such as its quality, this is addition to providing a tool that can be used
in the filed i.e. at municipality level, while it is developed enough to assist even a
broader management level with current and future indicators.
3. The introduction of this technology at its academic level through this research and then
at the field level through its application at municipalities could enhance the decision
making process of managers in this field by allowing extracting information on the
time-history of a well with regard to chloride, NO3- etc…, buffering, threshold
identifying, map overlaying, etc…
4. At the field, heavy installed applications that require specific high resources would not
be an available options, research application is put on a very easy-to-use way, enabling
GIS features with minimum system requirements.
5. At the field, with just one session of on the job training would easily enable non-
technical users to benefit and utilize this application for their needs.
5.1.3 Compared to available applications
A GIS development framework provides the necessary comprehensive spatial functionality
for applications and allows the software developer to focus on building application specific
logic. ESRI ArcGIS Engine is such a GIS framework, created in response to ESRI software
users' requests that the rich technology of ArcGIS be productized to enable embedding of
spatial functionality in new or existing applications. ArcGIS plug-ins can not be used
without the proprietary ArcGIS software. This application does not require this proprietary,

CHAPTER (5): CONCLUSION AND RECOMMENDATIONS
- 75 -
but also, does not give ArcGIS Engine capabilities, but still acting as a component that is
meeting variety of user GIS related needs in a very friendly user environment. Other issues
that worth addressing:
1- the system guides the user through direct ways for obtaining information that could also
be extracted using other popular applications such as ArcMAP, but this may require
several steps from this application to obtain the same results obtained through this system
with one step, such as buffering and results orientation.
2- layers overlaying, at instant this system allows the user to enquire and spatially preview
information of same location (i.e. water well) on different maps, while to do that using
other applications may require activating and deactivating and locating, etc…
3- The system enable the user to get to specific location, termed in the x and y at once,
obtaining attribute value and using it if needed for other calculations, this could act as the
Raster Calculator in ArcMAP, without the need to raster the shapfile into cells for specific
value.
5.1.4 Advantages of such development
1. Minimum IT investment. The existing desktop environment: Windows and Microsoft
Office package is sufficient.
2. A minimum GIS tool is made available, through screen navigation for visual output. No
training is required.
3. No disruption of existing practice. The users may continue with their usual data entry
and update with the standard office packages like Excel, or Access, or in simple relational
database like Dbase as these components are embedded in the application.
4. Minimum developer‘s intervention.
5. The ease of information retrieval facilitates decision-making at all levels (field officers,
management)
5.1.5 Constraints encountered
1. Lack of available updates and tracking of data records over time, renaming of wells
and closing of others could present gap in flow of data of time.
2. No previous similar practice or research encountered in Gaza.

CHAPTER (5): CONCLUSION AND RECOMMENDATIONS
- 76 -
5.1.6 Shortcomings subject for further development
1. Using polynomial regression for water quality in this case, was not encountering for
seasonal variations i.e. average was taken per year this could result in data variation
giving only short term predicting models i.e. for 2-3 coming years.
2. Management improvement was not reflected in Model inputs for the quality of water
versus time, this could result in variation of input data and consequently the expected
output information.
3. Limited capabilities when it comes to modeling, or deep data manipulation, where in
such cases, referring back to GIS ordinary softwares/application would be the other
option.
4. Scope of this study permitted tackling basics behind such system, still that several
aspects of this application are prototyped and have larger extents for development.
5.2 Recommendations
It is recommended that Gaza water institutions and facilities start considering the
utilization of purpose-specific systems such as the GIS-Based system prototype developed
out of this research, such facilities would be the CMWU, PWA, and the Municipalities that
are usually governed by MoLG.
It is also recommended to enhance and improve this prototype system to broader levels
beyond the scope of this study at both academic (professional) and commercial levels, as
this would be a step forward towards upgrading the level of knowledge and then a strong
base towards well developed institutions and utilities for the water component in the Gaza
strip, the following points are recommended for further enhancement of the developed
tool:
1. As future scenarios prediction is very important to decision makers, examining
available data and covering any gaps will add to the value of obtaining reliable results,
through out offering other models for the user (i.e. exponential, logarithmic, etc…),
while giving the ability to eliminate or add any data value to the system, to enrich its
capabilities. Simultaneously, seasonal variations could be accounted for if enough
information and data recording through the years is made available.
2. Possibility of extending application capabilities to reach and extent of adding/editing
shapefiles, editing (both map, and data) through customized menus / buttons e.g editing
of fields while getting more deeper in its attributes, which gives more extendibility to
the application making it extensive as any GIS application.

CHAPTER (5): CONCLUSION AND RECOMMENDATIONS
- 77 -
3. Extending the project to a larger scale and larger scope among water resources
stakeholders in the Gaza strip.
4. Setting up an early warning and emergency response system that will enable to take
appropriate actions to prevent or mitigate the impacts of large accidents on
groundwater quality.
5. Enhancing the reporting system to include printing out useful and well arranged reports
comprising of previewed maps and listed information.
6. Giving more interactivity to the system by allowing users to use the map directly for
enquiring about the water wells rather enquiring through listed attributes.
7. Compatibility of the system should be extended for other database and shapefiles, to
enrich the system capabilities of integrating much more information in it.

REFERENCES
- 78 -
REFERENCES
1 The World Bank, West Bank and Gaza, 2009. Assessment of Restrictions on Palestinian
Water Sector Development, Report No. 47657-Gz.
2 Hengl T., 2007. A Practical Guide to Geostatistical Mapping of Environmental
Variables. EUR — Scientific and Technical Research series — ISSN 1018-5593, 143 pp.
3 IRIN, project of the UN Office for the Coordination of Humanitarian Affairs (OCHA),
2009. [Online], accessed on 17 Mar 2009, www.IRINnews.org.
4 Institutes for Geospatial Research and Education, 2009. Eastern Michigan University,
GIS education, [Online], accessed on 25 Aug 2009,http://igre.emich.edu/igre/giseducation.
5 United Nations Environment Programme (UNEP), 2009, Environmental Assessment
of the Gaza Report, following the escalation of hostilities in December 2008 – January
2009, ISBN: 978-92-807-3041-8. [Online], accessed on 15 Jan 2010,
http://oneresponse.info/crosscutting/environment/publicdocuments/UNEP_Gaza_EA.pdf
6 Veerabhadram K., 2003. Mapping of Water Quality Index (WQI) using Geographical
Information System (GIS) as Decision Supporting System Tool. [Online], accessed on 15
Jan 2009, http://www.gisdevelopment.net/application/environment/Water/ma03123abs.htm
7 Khaldi R., 2003. Evaluation of Beit Lahia Wastewater Treatment Plant, MSc. Thesis,
Islamic University, Gaza, Palestine.
8 Palestinian Central Bureau of Statistics (PCBS), 2009. Demographic Statistics,
[Online], accessed on 15 Jan 2009 2010, www.pcbs.gov.ps.
9 U. M. Shamsi, 2002, Reston, VA: American Society of Civil Engineers (ASCE) Press,
0-7844-0573-5, 2002, 375 pp.
10 Ayoub G., 2002. GIS Applications in Environmental & Water Resources
Engineering.lecture notes, [Online], accessed on 20 Mar 2009, http://www.loai-
naamani.com/Academics/GIS_Applications.htm.
11 Japanese Technology Evaluation Center, Knowledge-Based system in Japan,
[Online], accessed on 15 Feb 2010. http://www.wtec.org/loyola/kb/execsum.htm
12 GUPTA A., ONTA P., 1997. Sustainable groundwater resources development,
Hydrological Sciences Journal, 42 (2).
13 ESRI, 2004. Delivering Custom GIS Applications with ArcGIS Engine, White Paper.
14 Panagopoulos A., Koumantakis M., 2003. G.I.S.-Based System for Groundwater
Resources Evaluation. Case Study of Korinthos Coastal Aquifer System, 8th meeting of
Greek users of ARC/INFO-ARCVIEW GIS, Thessaloniki, Greece.
15 Babiker I., Mohamed M., 2007. Assessing groundwater quality using GIS, Water
Resour Manage, Springer Science, Business Media, 21, pp.699–715.

REFERENCES
- 79 -
16 Kouli M., Lydakis-Simantiris N. and Soupios P., 2008. GIS-based aquifer modeling
and planning using integrated geoenvironmental and chemical approaches, Groundwater:
Modeling, Management and Contanimation (eds. Luka F. König and Jonas L. Weiss), Pub.
Date: 2008, 4th Quarter, ISBN: 978-1-60456-832-5, Nova Publishers-USA
17 Lavkulich L. and Ulazzi E., 2005. Integrated Water Management Book, Journal
Information, 2005 Springer. Printed in the Netherlands.
18 El-Gafy, I., Farid M., El-Bahrawy A., Khalifa A., El-Basiony E. Abdelmotaleb
M., 2005. Decision Support System for Evaluating the Groundwater Quality, Emirates
Journal for Engineering Research, 10 (1), 69-78.
19 Mogheir, Y., J. L. M. P. de Lima and V. P. Singh, 2008. Entropy and Multi-
Objective Based Approach for Groundwater Quality Monitoring Network Assessment and
Redesign. Water Resources Management, DOI 10.1007/s11269-008-9343-8.
20 WaterStrategyMan Newsletter, 2004. Indicators and Indices for decision making in
water resources management, Issue 4, accessed on 15 Jan 2009,
http://environ.chemeng.ntua.gr/WSM/Newsletters/Issue4/Indicators.htm
21 Power D., DSS Basics, 2009. Decision Support Systems Resources, [Online],
accessed on 15 Aug 2009, http://www.dssresources.com/
22 Jayyousi A., Srouji F., 2009. Report on: Future Water Needs in Palestine, The
Palestine Economic Policy Research Institute, Jerusalem.
23 PASSIA, Palestinian Academic Society for the Study of International Affairs,
2010, [Online], accessed on 15 Feb 2010. www.passia.org.
24 File Extension Organization, 2009. [Online], accessed on 12 Jun 2009,
http://www.file-extensions.org/
25 Palestinian National Authority, EQA, 2004. Strengthening the Palestinian
Environmental Action Program, Palestine.
26 World Health Organization, 2006. A compendium of Drinking-water Quality
Standards in the Eastern Mediterranean Region, WHO-EM/CEH/143/E.
27 Shomar B, Osenbrück K, Yahya, A. 2008. Elevated Nitrate Levels in the
Groundwater of the Gaza Strip: Distribution and Sources. The Science of the Total
Environment, 398,164-174.
28 WIKIPEDIA, 2010. Multilingual, web-based, free-content encyclopedia project based
on an openly-editable model. [Online], accessed during 2009 and 2010.
http://en.wikipedia.org/wiki/Main_Page
29 Intellectual Resources, programming, 2010. astronomy, science, mathematics, Java
applets, [Online], accessed on 24 Feb 2010. http://www.arachnoid.com/

REFERENCES
- 81 -
30 Open source application, GIS, 2009. [Online], accessed on 20 Oct 2009,
www.OpenSource.org
31 Malczewski, J., 1997. Spatial Decision Support Systems, NCGIA Core Curriculum in
GIScience, [Online], accessed on 15 May 2009.
http://www.ncgia.ucsb.edu/giscc/units/u127/u127.html, posted October 6, 1998.
32 Maximov I., 2006. Decision Support System (DSS) in Water Resources
Management. [Online], accessed on 15 Jan 2009,
http://enrin.grida.no/proceedings.cfm?article=31
33 IRIN, Humanitarian news and analysis, 2009. UN humanitarian news and information
service, a project of the UN Office for the Coordination of Humanitarian Affairs, [Online],
accessed on 15 Jan 2010, www.IRINnews.org
34 Dias J.; Martins R.; Ferreira C. ; Esteves T.; Soares M.;Costa M.L.; Costa M.C.,
2006. Application of GIS Database Tool to Surface Water Quality at ESAC, The Quest for
Sustainability: The role of Environmental Management Systems and Tools
ESAC, Coimbra, Portugal, 27-29 September 2006.
35 Cheong M., Appave R., Jamala S., 2001. Developing a Geographic Information
System (GIS) Tool for Extension Purposes in Mauritius, Food and Agricultural Research
Council, Réduit, Mauritius.
36 SUSMAQ, 2005. Sustainability Assessment Case Studies of Water Resources
Management Options in Palestine. Report No. SUSMAQ - SUS #60 V1.1, Sustainable
Management of the West Bank and Gaza Aquifers, Palestinian Water Authority (Palestine)
and University of Newcastle upon Tyne (UK).
37 Dunsford H., Ames D., 2009. Restructuring of the MapWindow GIS project, Idaho
State University, USA.
38 Jin Z., Sieker F. , Bandermann S., Sieker H. 2006. Development of a GIS-based
Expert System for on-site Stormwater Management, Rennbahnalle 109A, 15366 Dahlwitz-
Hoppegarten, Germany.
39 CAMP (Costal Aquifer Management Program), 2000. Integrated Aquifer
Management Plan, PWA.
40 Virtual Private Networks (VPNs), 2002, International Engineering Consortium.
[Online], accessed on 12 Dec 2009, http://www.iec.org/online/tutorials/vpn/index.html
41 Abu El-Naeem M., 2007. Evaluation of groundwater quality in North Governorates of
Gaza Strip (1994-2004), MSc. Thesis, Islamic University, Gaza, Palestine

APPENDIXIES
- 80 -
APPENDIXIES
APPENDIX (A): Polynomial Regressions - Example
The basis of Polynomial Regressions - least square errors is that a data set of n paired (x,
y) members:
…………………… (1)
Can be processed using a least-squares method to create a predictive polynomial equation
of degree p:
…………… (2)
The essence of the method is to reduce the residual R at each data point:
………………… (3)
This is accomplished by first expressing the system in matrix form (this example
represents a polynomial of degree 4):
… (4)
For implementing this method in computer code, the following is a detailed procedure with
an example data set.
x y x y x y x y
-1 -1 3 4 1 2.5 7 5
0 3 5 2 2 5 9 4
Creation of this particular data set for its pathological properties and its ability to show
what sorts of things can go wrong during efforts to apply polynomial regressions to real-
world data.
Referring now to equation (4) above and to the example data set, we can perform the
operations required to produce this numerical matrix content:
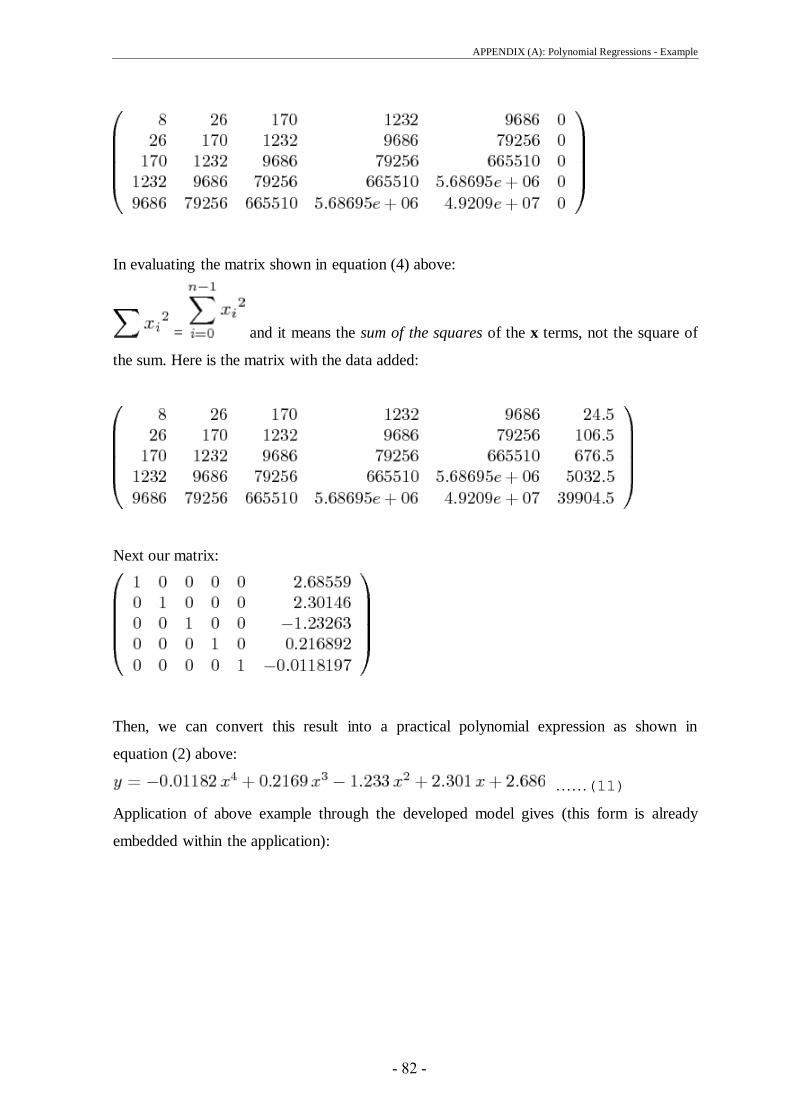
APPENDIX (A): Polynomial Regressions - Example
- 82 -
In evaluating the matrix shown in equation (4) above:
= and it means the sum of the squares of the x terms, not the square of
the sum. Here is the matrix with the data added:
Next our matrix:
Then, we can convert this result into a practical polynomial expression as shown in
equation (2) above:
……(11)
Application of above example through the developed model gives (this form is already
embedded within the application):

- 83 -
Figure App.-A-1. Buffering feature, level 3: Level three: fixed radius, different locations

APPENDIX (B): Map viewing Feature Code
- 84 -
APPENDIX (B): Map viewing Feature Code
The application code is extracted from Microsoft Visual Basic, more than 300 lines of code
written for this application, following is the code in its window at Microsoft Visual Basic,
(Figure App-B-1):
Figure 0-1. Buffering feature, level 3: Level three: fixed radius, different locations
Extracted Code:
Dim FileSys As New Scripting.FileSystemObject Dim sf As MapWinGIS.Shapefile, handle As Long Dim ErrMsg As String Dim Item As ListItem Dim FileName As String ' Dim FileSys As New Scripting.FileSystemObject ' Dim sf As New MapWinGIS.Shapefile On Error Resume Next Map1.RemoveAllLayers 'remove all layers in the legend lvLegend.ListItems.Clear '\\\\\\\\\\\\\\\\\\\\\\\ Picture3.visible = False optRB.visible = True optDR.visible = True optDL.visible = True cmbWells.visible = True cmdexport.visible = False cmbCLT.visible = True cmbCLTD.visible = True cmbBuff.visible = True OsenXPCheckBox1.visible = True
APPENDIX (B): Map viewing Feature Code
- 85 -
OsenXPCheckBox2.visible = True Command1.visible = True cmdBuffer.visible = True MSChart1.visible = True Picture1.visible = True Command9.visible = True Command5.visible = True Command11.visible = True Command6.visible = True cmdClearMap.visible = True Charty.visible = True Frame6.visible = True Frame5.visible = True optRB.Value = True cdlOpen.CancelError = True FileName = App.Path + "\GISWORK\SHP\SHPNorth2001.shp" FileNameC = SHPNorth2001 txtFileNameC = "SHPNorth2001" If LCase(Right(FileName, 3)) = "shp" Then Set sf = New MapWinGIS.Shapefile If sf.Open(FileName) = False Then ErrMsg = sf.ErrorMsg(sf.LastErrorCode) MsgBox "The file, " & FileName & " failed to open for the following reason:" & vbCrLf & ErrMsg, vbCritical Exit Sub Else handle = Map1.AddLayer(sf, True) If handle < 0 Then Exit Sub Map1.layerName(handle) = FileSys.GetFileName(sf.FileName) Set Item = lvLegend.ListItems.Add(1, , Map1.layerName(handle)) Item.ListSubItems.Add , , handle Item.Tag = handle Item.Checked = True Map1.ShapeLayerFillColor(handle) = RGB((1 - 1) * Rnd, (1 - 1) * Rnd, (1 - 1) * Rnd) Map1.ShapeLayerLineColor(handle) = RGB(300, 399, 388) Map1.ShapeLayerPointSize(handle) = 10 Map1.ShapeLayerPointType(handle) = ptCircle Map1.ShapeLayerPointSize(handle) = 5 Map1.ShapeLayerPointColor(handle) = vbBlue
End If Else MsgBox "The file, " & FileName & " is not a shapefile." End If FileName = App.Path + "\GISWORK\SHP\Governorate.shp" If LCase(Right(FileName, 3)) = "shp" Then Set sf = New MapWinGIS.Shapefile If sf.Open(FileName) = False Then ErrMsg = sf.ErrorMsg(sf.LastErrorCode) MsgBox "The file, " & FileName & " failed to open for the following reason:" & vbCrLf & ErrMsg, vbCritical Exit Sub Else handle = Map1.AddLayer(sf, True) If handle < 0 Then Exit Sub Map1.layerName(handle) = FileSys.GetFileName(sf.FileName) Set Item = lvLegend.ListItems.Add(1, , Map1.layerName(handle)) Item.ListSubItems.Add , , handle

APPENDIX (B): Map viewing Feature Code
- 86 -
Item.Tag = handle Item.Checked = True Map1.ShapeLayerFillColor(handle) = RGB(0, 255, 0) 'RGB((255 - 1) * Rnd, (255 - 1) * Rnd, (255 - 1) * Rnd) Map1.ShapeLayerLineColor(handle) = vbBlack Map1.ShapeLayerLineWidth(handle) = 2 End If Else MsgBox "The file, " & FileName & " is not a shapefile." End If Dim Name As String Dim Index As Long Dim retval As Boolean Dim visible As Boolean If (lvLegend.SelectedItem Is Nothing) Then Exit Sub handle = lvLegend.SelectedItem.Tag Index = lvLegend.SelectedItem.Index Name = lvLegend.SelectedItem.text visible = lvLegend.SelectedItem.Checked Set Item = lvLegend.ListItems.Add(Index, , Name) Item.ListSubItems.Add , , handle Item.Tag = handle Item.Checked = visible lvLegend.SelectedItem.Selected = True retval = Map1.MoveLayerUp(Map1.LayerPosition(handle)) 'move the selected layer up If (Index > 1) Then lvLegend.ListItems.Remove Index End If cbLayerToLabel.Clear For i = 0 To Map1.NumLayers - 1 handle = Map1.LayerHandle(i) layerName = Map1.layerName(handle) cbLayerToLabel.AddItem (handle & " - " & layerName) Next cbLayerToLabel.ListIndex = 1 cbFieldToUse.Clear If cbLayerToLabel.ListCount > 0 And cbLayerToLabel.text <> "" Then handle = Split(cbLayerToLabel.text, " - ")(0) Set sf = Map1.GetObject(handle) For i = 0 To sf.NumFields - 1 cbFieldToUse.AddItem (i & " - " & sf.Field(i).Name) Next End If cbFieldToUse.ListIndex = 2 cbRowsToUse.Clear Dim fieldIndex As Long Dim text As String
- 87 -
If (cbLayerToLabel.text = "" Or cbFieldToUse = "") Then Exit Sub On Error Resume Next handle = Split(cbLayerToLabel, " - ")(0) fieldIndex = Split(cbFieldToUse, " - ")(0) cmbWells.Clear Set sf = Map1.GetObject(handle) For i = 0 To sf.NumShapes - 1 text = sf.CellValue(fieldIndex, i) cbRowsToUse.AddItem (text) cmbWells.AddItem (text) 'Map1.AddLabel handle, text, cmdFontColor.BackColor, sf.Shape(i).extents.xMin, sf.Shape(i).extents.yMin, hjCenter Next i cbRowsToUse.ListIndex = 0 ycl = 200
For i = 1 To 25 cmbCLT.AddItem (ycl) ycl = ycl + 50 Next i cmbCLT.ListIndex = 3 ycl = 200
For i = 1 To 25 cmbCLTD.AddItem (ycl) ycl = ycl + 25 Next i ycl = 200
For i = 1 To 24 cmbBuff.AddItem (ycl) ycl = ycl + 100 Next i cmbBuff.ListIndex = 8 cbRowsToUse.SetFocus

ANNEXES
- 88 -
ANNEXES
ANNEX (A): The Geographic Information System
A.1 Introduction to Geographic Information System (GIS)
A Geographic Information System (GIS) can be defined as a system for entering, storing,
manipulating, analyzing, and displaying geographic or spatial data. These data are
represented by points, lines, and polygons (Figure A.1) along with their associated
attributes (i.e., characteristics of the features which the points, lines, and polygons
represent). For example, the points may represent hazardous waste site locations and their
associated attributes may be the specific chemical dumped at the site, the owner, and the
date the site was last used. Lines may represent roads, streams, pipelines, or other linear
features while polygons may represent vegetation types or land use.
Figure A.1: The 3 elements of geographic data
In addition, geographic data can be represented in two data formats. The first of these
formats is called raster or grid structure and is the older of the two data formats. Raster
data are stored in a grid or pixel format which is referenced to some coordinate system
(i.e., latitude and longitude). The size of the grid can vary and therefore the spatial
resolution of the data is determined by the size of the grid. Raster data are computationally
easier to manipulate but typically require larger amounts of storage. Digital remotely
sensed data (i.e., satellite imagery) is a good example of raster or grid data.
Vector or polygon data are the second way geographic data may be represented. Vector
data uses a series of points (i.e., x, y coordinates) to define the boundary of the object of
interest. These types of data may require less storage and are preferred for display purposes
Points Lines Polygons
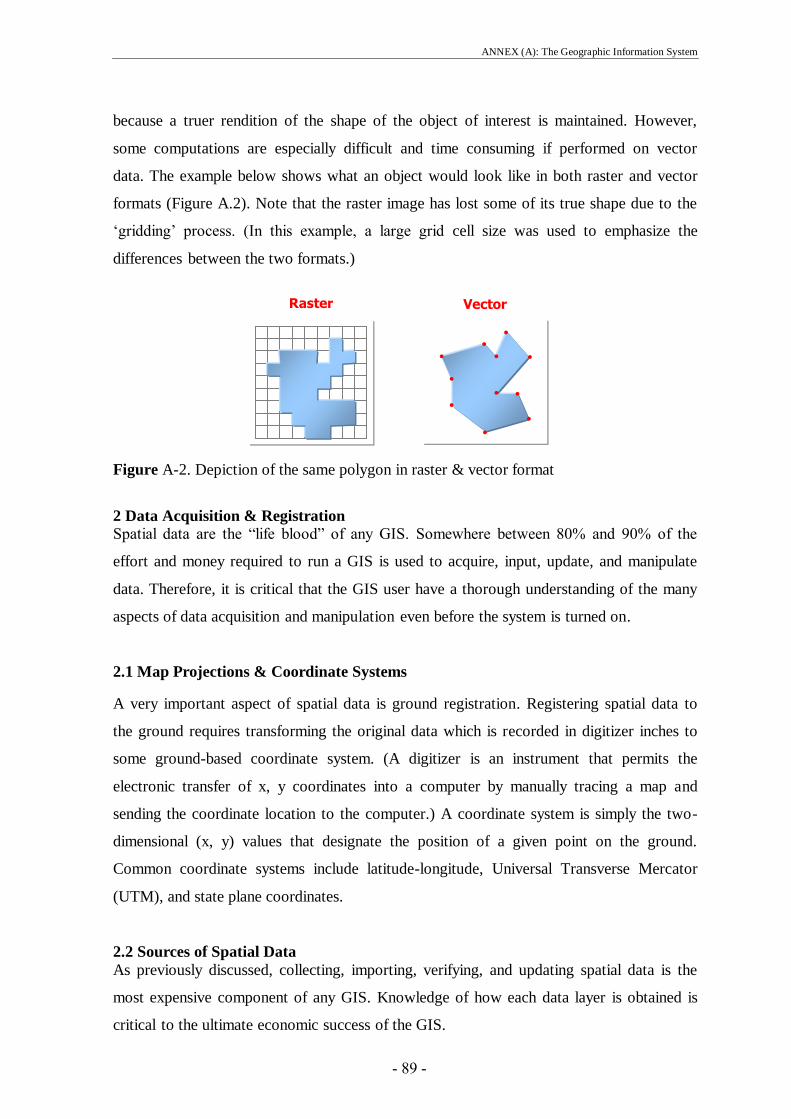
ANNEX (A): The Geographic Information System
- 89 -
because a truer rendition of the shape of the object of interest is maintained. However,
some computations are especially difficult and time consuming if performed on vector
data. The example below shows what an object would look like in both raster and vector
formats (Figure A.2). Note that the raster image has lost some of its true shape due to the
‗gridding‘ process. (In this example, a large grid cell size was used to emphasize the
differences between the two formats.)
Figure A-2. Depiction of the same polygon in raster & vector format
2 Data Acquisition & Registration
Spatial data are the ―life blood‖ of any GIS. Somewhere between 80% and 90% of the
effort and money required to run a GIS is used to acquire, input, update, and manipulate
data. Therefore, it is critical that the GIS user have a thorough understanding of the many
aspects of data acquisition and manipulation even before the system is turned on.
2.1 Map Projections & Coordinate Systems
A very important aspect of spatial data is ground registration. Registering spatial data to
the ground requires transforming the original data which is recorded in digitizer inches to
some ground-based coordinate system. (A digitizer is an instrument that permits the
electronic transfer of x, y coordinates into a computer by manually tracing a map and
sending the coordinate location to the computer.) A coordinate system is simply the two-
dimensional (x, y) values that designate the position of a given point on the ground.
Common coordinate systems include latitude-longitude, Universal Transverse Mercator
(UTM), and state plane coordinates.
2.2 Sources of Spatial Data
As previously discussed, collecting, importing, verifying, and updating spatial data is the
most expensive component of any GIS. Knowledge of how each data layer is obtained is
critical to the ultimate economic success of the GIS.
Raster Vector
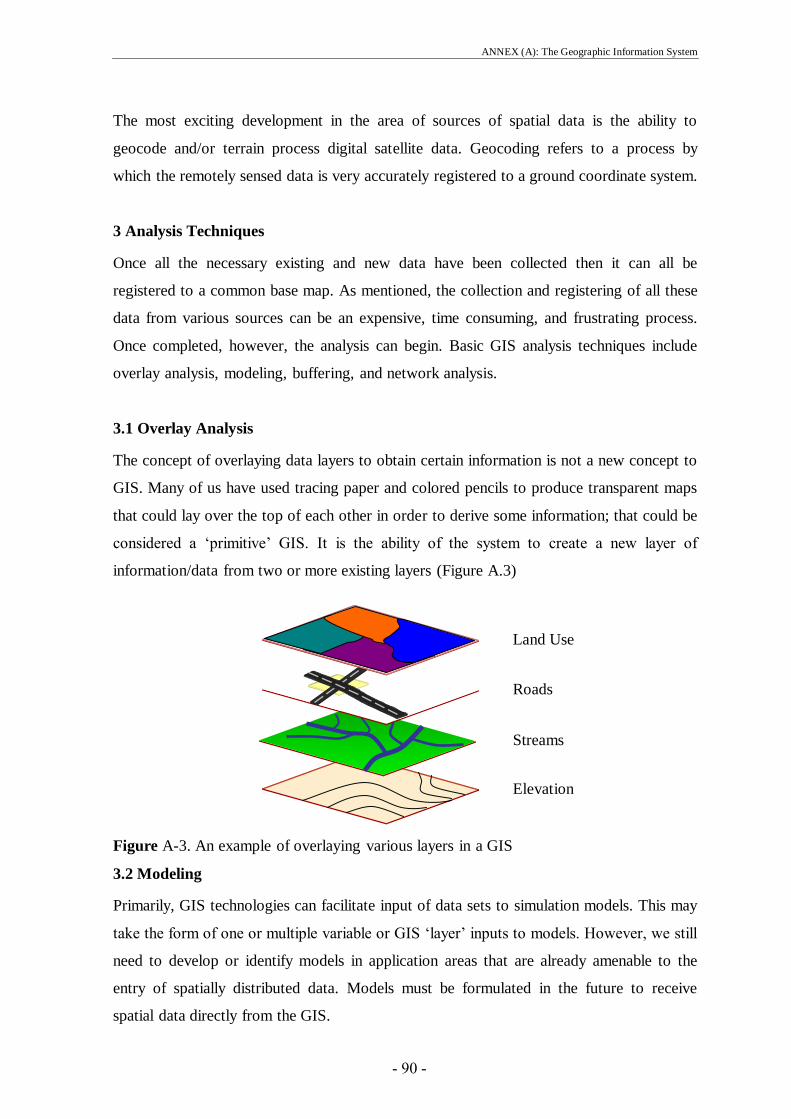
ANNEX (A): The Geographic Information System
- 91 -
The most exciting development in the area of sources of spatial data is the ability to
geocode and/or terrain process digital satellite data. Geocoding refers to a process by
which the remotely sensed data is very accurately registered to a ground coordinate system.
3 Analysis Techniques
Once all the necessary existing and new data have been collected then it can all be
registered to a common base map. As mentioned, the collection and registering of all these
data from various sources can be an expensive, time consuming, and frustrating process.
Once completed, however, the analysis can begin. Basic GIS analysis techniques include
overlay analysis, modeling, buffering, and network analysis.
3.1 Overlay Analysis
The concept of overlaying data layers to obtain certain information is not a new concept to
GIS. Many of us have used tracing paper and colored pencils to produce transparent maps
that could lay over the top of each other in order to derive some information; that could be
considered a ‗primitive‘ GIS. It is the ability of the system to create a new layer of
information/data from two or more existing layers (Figure A.3)
Figure A-3. An example of overlaying various layers in a GIS
3.2 Modeling
Primarily, GIS technologies can facilitate input of data sets to simulation models. This may
take the form of one or multiple variable or GIS ‗layer‘ inputs to models. However, we still
need to develop or identify models in application areas that are already amenable to the
entry of spatially distributed data. Models must be formulated in the future to receive
spatial data directly from the GIS.
Land Use
Roads
Streams
Elevation
ANNEX (A): The Geographic Information System
- 90 -
3.3 Buffering
Buffering is a technique by which a boundary of known width is drawn around a point or
linear feature. Some examples of point buffers may be a zone around a hazardous waste
site or around a tree that is a nest for a particular endangered bird. Examples of linear
buffers may be an area around a stream to prevent logging or an area around a utility
pipeline to prevent digging. A related function is generally referred to as ―proximity
searches‖. Proximity searches can be used to identify adjacencies between particular
features or data classifications.
3.4 Network Analysis
Network analysis is a technique by which a linear path is identified that represents the flow
of some object through the area. Network analysis is especially useful in hydrology, water
resources, transportation, and other disciplines that study the flow of an object. This flow is
not limited to water but can also be used for vehicles, utility and communication lines, and
animals.
4 Presentation Capabilities
A particularly valuable use of a GIS is in project presentations. The managers or decision
makers on any project appreciate the quantitative information derived from GIS analyses.
Naturally, they also appreciate the high quality graphical products that support the project,
and demonstrate the results of project analyses. Another valuable use is the public
presentation of the results of project analyses using GIS. This is appropriate for public
meetings and audiences beyond those of the immediate group. Current land and water
planning efforts involve a wealth of information. GIS products can help to display the site
conditions, and to show some of the variables that must be weighed to make a decision.
The GIS displays can also help lead the audience through the same decision-making
process, and help lend insight into the results of the planning study.
5 Error Analysis
In order to effectively use any GIS, one must understand the errors associated with spatial
information. Errors associated with spatial information can be divided into three groups:
user errors, measurement/data errors, and processing errors. User errors are those errors
which are probably most obvious and are more directly controlled by the user.
ANNEX (A): The Geographic Information System
- 92 -
6 Hardware & Software
The GIS software links the attribute data to the geographic features (represented by points,
lines, and polygons and their topology), using a database management system. It also
provides for the input, editing, and analysis functions previously discussed. The
capabilities and costs of GIS software vary greatly from vendor to vendor and the selection
of such software depends on the needs of the user. The following factors should be
considered when choosing GIS software:
Data input and editing functions
Analysis functions
Flexibility of the system (compatibility with other software/hardware)
Risk associated with the vendor
Cost to purchase, operate, and maintain the system
Type of database management system
7 People
An integral and yet largely forgotten and unnoticed component of a GIS is people.
Geographic information systems need people in order to operate. Without well-trained
people and an adequate staff, it is likely that an investment of thousands of dollars on state-
of-the-art equipment and data will be wasted. Continued funding is critical to provide the
necessary training and database maintenance. All in all, people are the most important
resource; failure to make a strong commitment to the people operating the GIS dooms it to
failure.

تمــت بحمــد الـلـه
- 93 -