Embed Size (px)
Citation preview
Elizabeth LeeDept. of Plant Ag.University of Guelph@Maize_Canada
Ghosts of cornfields past, present and future…..
• May 23rd 2015 frost event• Weather variability• Goss’s Wilt • Genetic improvement
Things that have been on twitter….
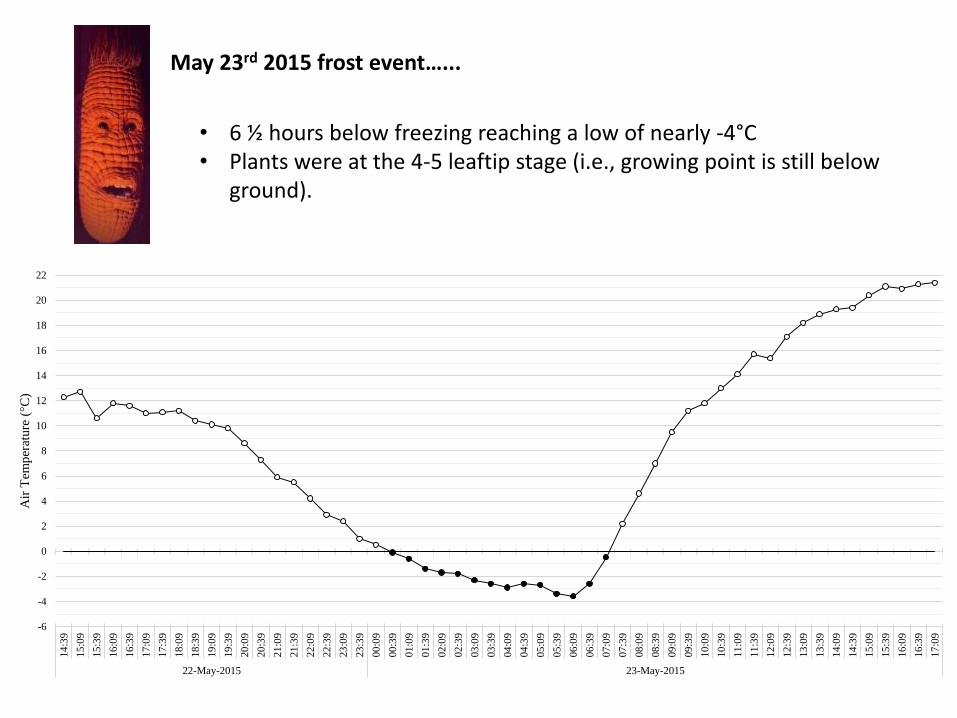
May 23rd 2015 frost event…...
-6
-4
-2
0
2
4
6
8
10
12
14
16
18
20
22
14
:39
15
:09
15
:39
16
:09
16
:39
17
:09
17
:39
18
:09
18
:39
19
:09
19
:39
20
:09
20
:39
21
:09
21
:39
22
:09
22
:39
23
:09
23
:39
00
:09
00
:39
01
:09
01
:39
02
:09
02
:39
03
:09
03
:39
04
:09
04
:39
05
:09
05
:39
06
:09
06
:39
07
:09
07
:39
08
:09
08
:39
09
:09
09
:39
10
:09
10
:39
11
:09
11
:39
12
:09
12
:39
13
:09
13
:39
14
:09
14
:39
15
:09
15
:39
16
:09
16
:39
17
:09
22-May-2015 23-May-2015
Air
Tem
per
ature
(°C
)
• 6 ½ hours below freezing reaching a low of nearly -4°C• Plants were at the 4-5 leaftip stage (i.e., growing point is still below
ground).
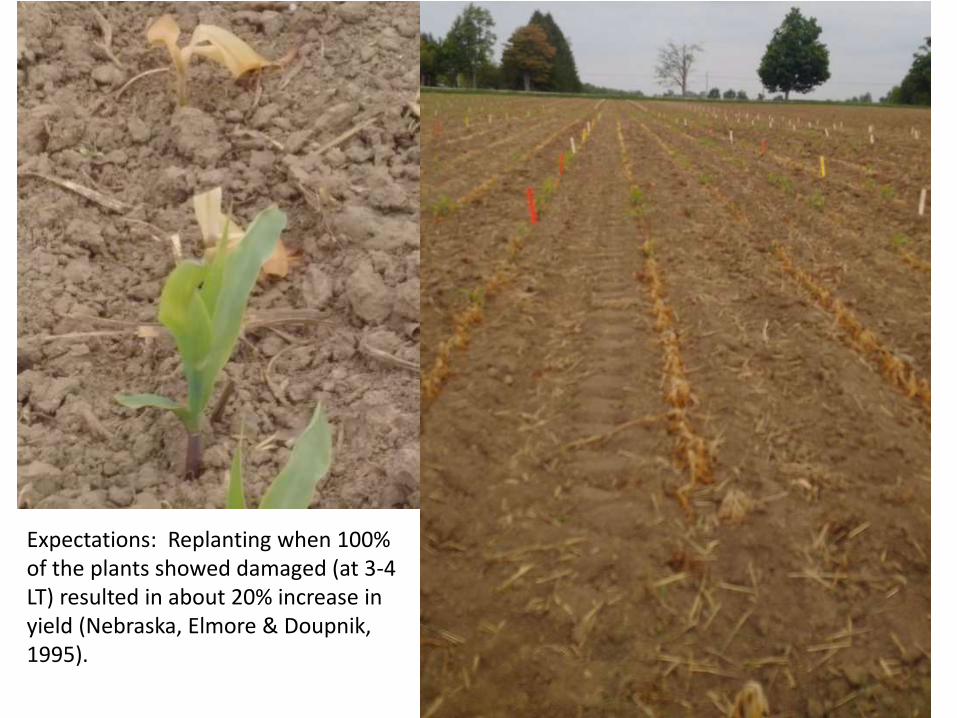
Expectations: Replanting when 100% of the plants showed damaged (at 3-4 LT) resulted in about 20% increase in yield (Nebraska, Elmore & Doupnik, 1995).
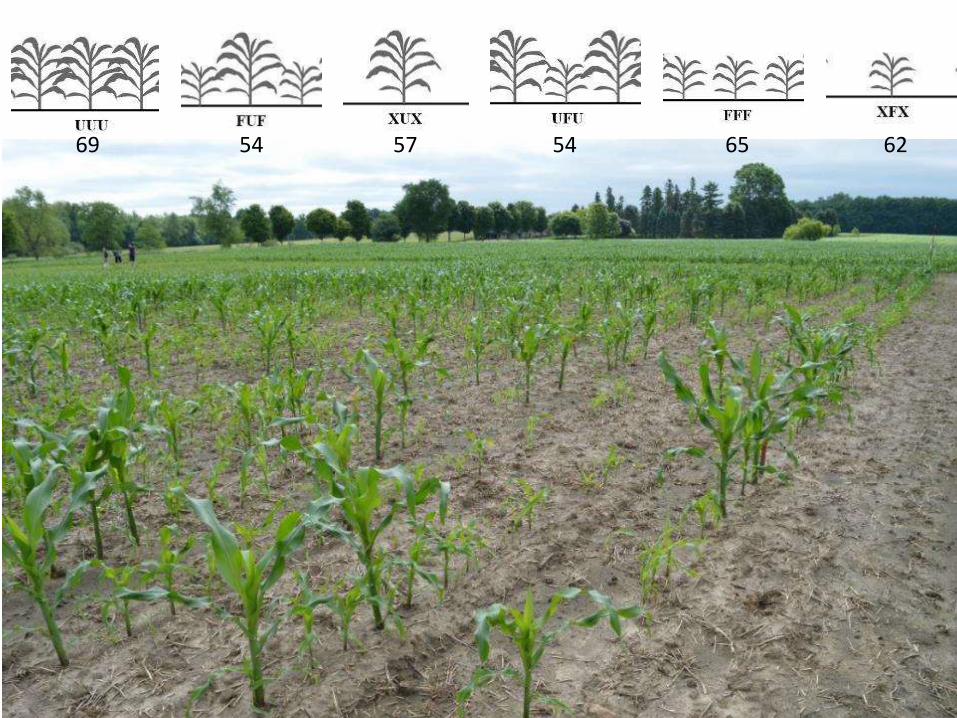
6569 54 54 6257
100
200
300
400
500
600
700
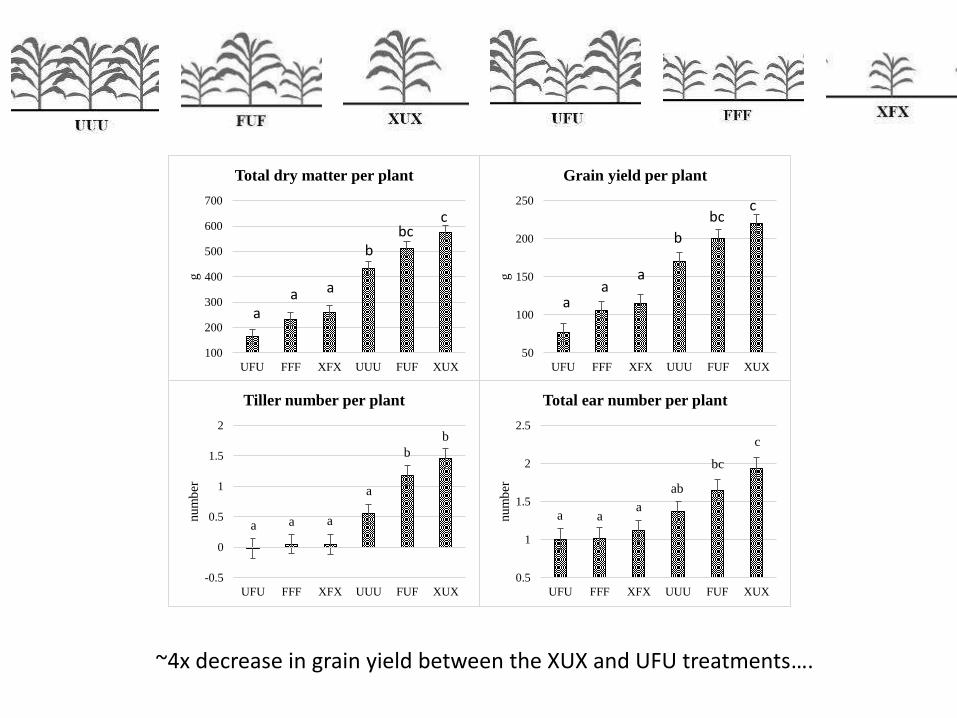
UFU FFF XFX UUU FUF XUX
g
Total dry matter per plant
50
100
150
200
250
UFU FFF XFX UUU FUF XUX
g
Grain yield per plant
-0.5
0
0.5
1
1.5
2
UFU FFF XFX UUU FUF XUX
num
ber
Tiller number per plant
a a a
a
b
b
0.5
1
1.5
2
2.5
UFU FFF XFX UUU FUF XUX
num
ber
Total ear number per plant
a aa
ab
bc
c
b
aa a
aa
a
bcc
b
bcc
~4x decrease in grain yield between the XUX and UFU treatments….
0
5
10
15
20
25
30
35
40
45
-10
-5
0
5
10
15
20
25
30
35
May
11
May
12
May
13
May
14
May
15
May
16
May
17
May
18
May
19
May
20
May
21
May
22
May
23
May
24
May
25
May
26
May
27
May
28
May
29
May
30
May
31
Jun1
Jun2
Jun3
Jun4
Jun5
Jun6
Jun7
Jun8
Jun9
Jun1
0
Jun1
1
Jun1
2
Jun1
3
Jun1
4
Jun1
5
Jun1
6
Jun1
7
Jun1
8
Jun1
9
Jun2
0
Jun2
1
Jun2
2
Jun2
3
Rai
nfa
ll (
mm
)
Tem
per
ature
(°C
)
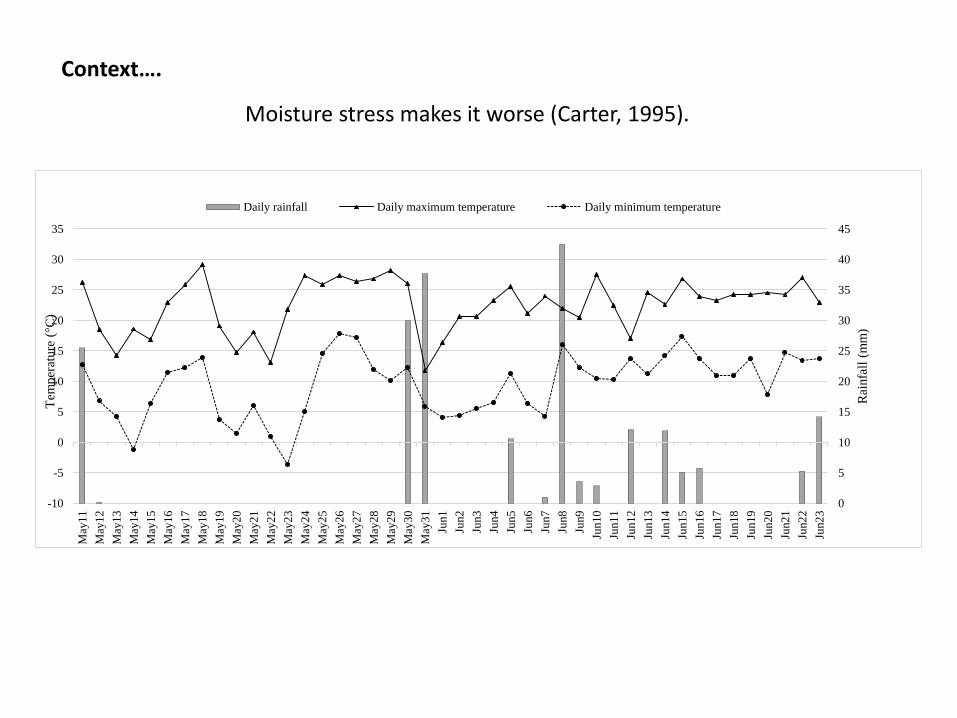
Daily rainfall Daily maximum temperature Daily minimum temperature
Context….
Moisture stress makes it worse (Carter, 1995).
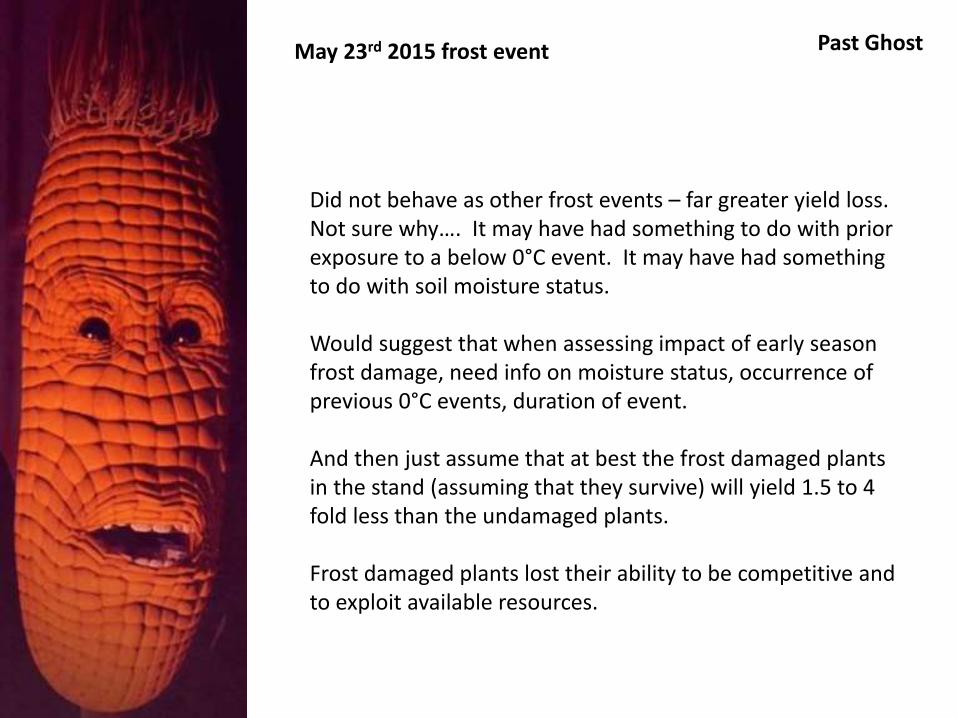
May 23rd 2015 frost event Past Ghost
Did not behave as other frost events – far greater yield loss. Not sure why…. It may have had something to do with prior exposure to a below 0°C event. It may have had something to do with soil moisture status.
Would suggest that when assessing impact of early season frost damage, need info on moisture status, occurrence of previous 0°C events, duration of event.
And then just assume that at best the frost damaged plants in the stand (assuming that they survive) will yield 1.5 to 4 fold less than the undamaged plants.
Frost damaged plants lost their ability to be competitive and to exploit available resources.
Weather – your iPhone has an app for this….. It is the conditions of the atmosphere at a particular place and time.
Climate – your iPhone does not have an app for this…. It is long-term averages and trends of the atmosphere of a region.
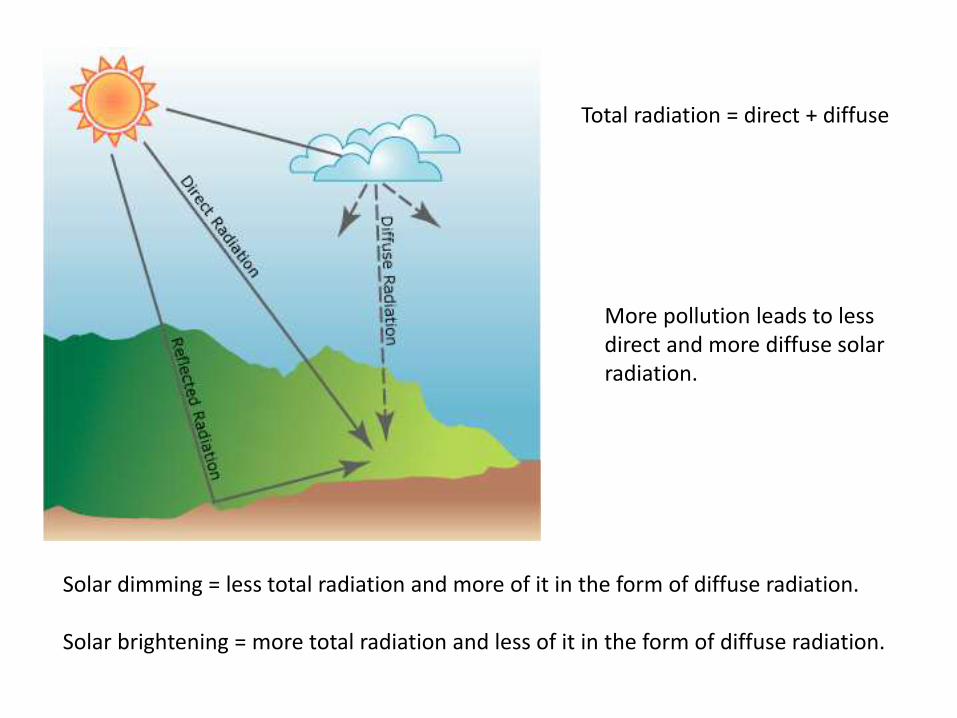
Solar dimming = less total radiation and more of it in the form of diffuse radiation.
Solar brightening = more total radiation and less of it in the form of diffuse radiation.
Total radiation = direct + diffuse
More pollution leads to less direct and more diffuse solar radiation.
10
30
50
70
90
110
130
150
170
190
1840 1860 1880 1900 1920 1940 1960 1980 2000 2020 2040
Gra
in y
ield
(b
u/a
c)
Production Year
US Ontario
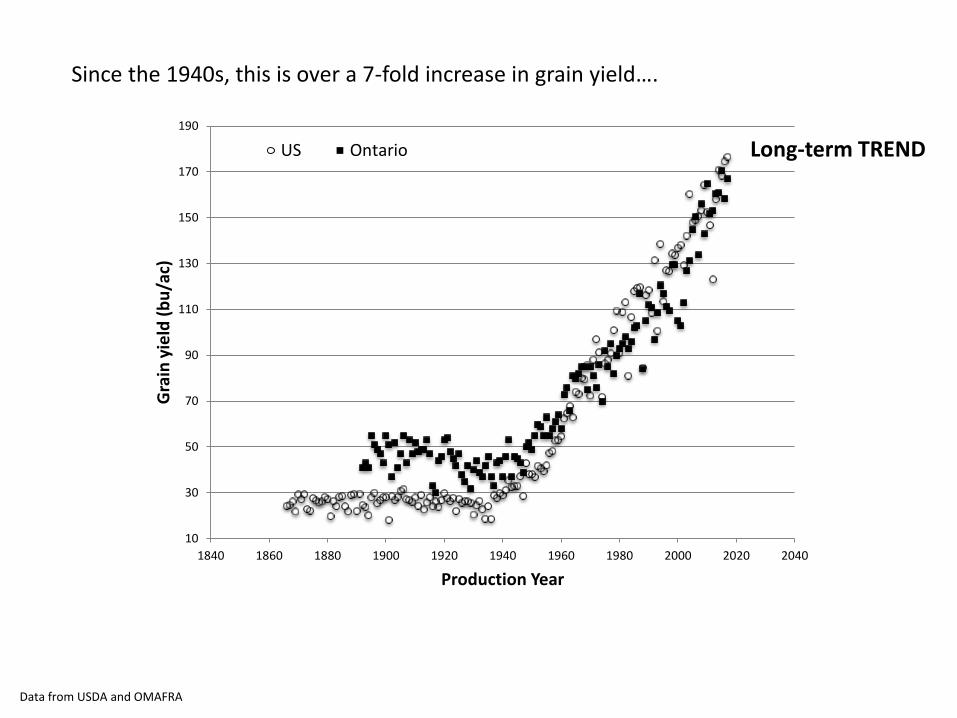
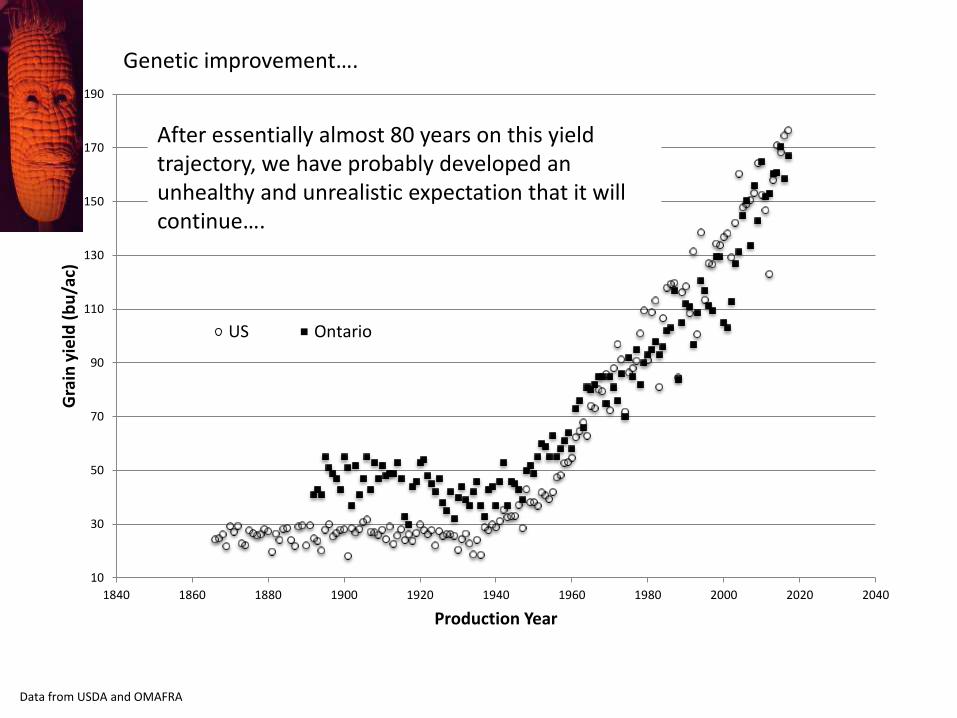
Data from USDA and OMAFRA
Since the 1940s, this is over a 7-fold increase in grain yield….
Long-term TREND
10
30
50
70
90
110
130
150
170
190
1980 1985 1990 1995 2000 2005 2010 2015 2020
Gra
in Y
ield
(b
u/a
c)
Production Year
US Ontario
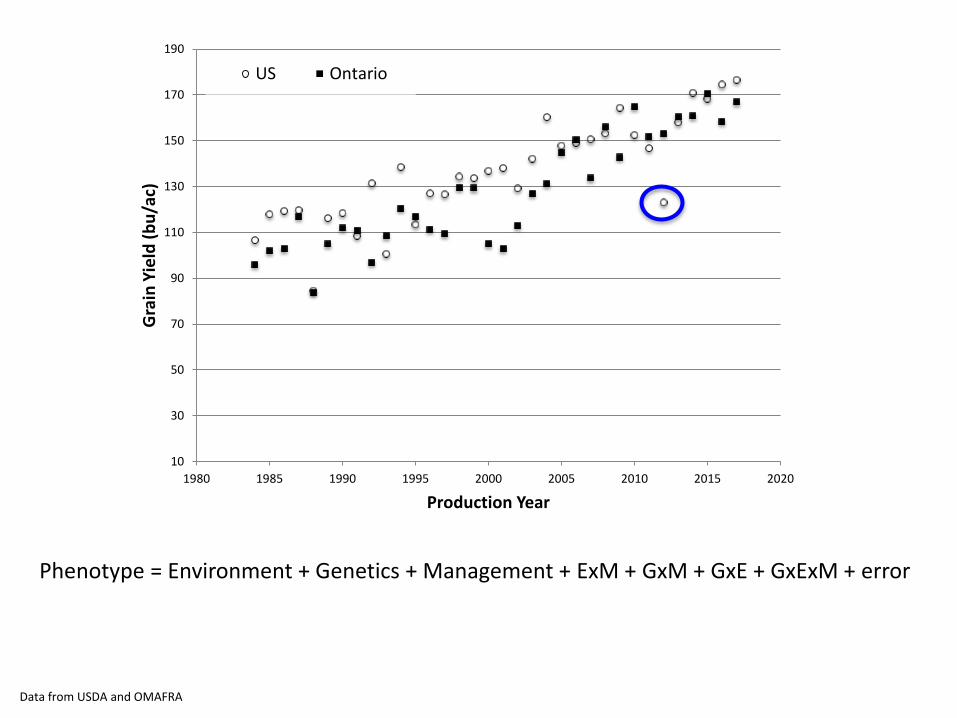
Data from USDA and OMAFRA
Phenotype = Environment + Genetics + Management + ExM + GxM + GxE + GxExM + error
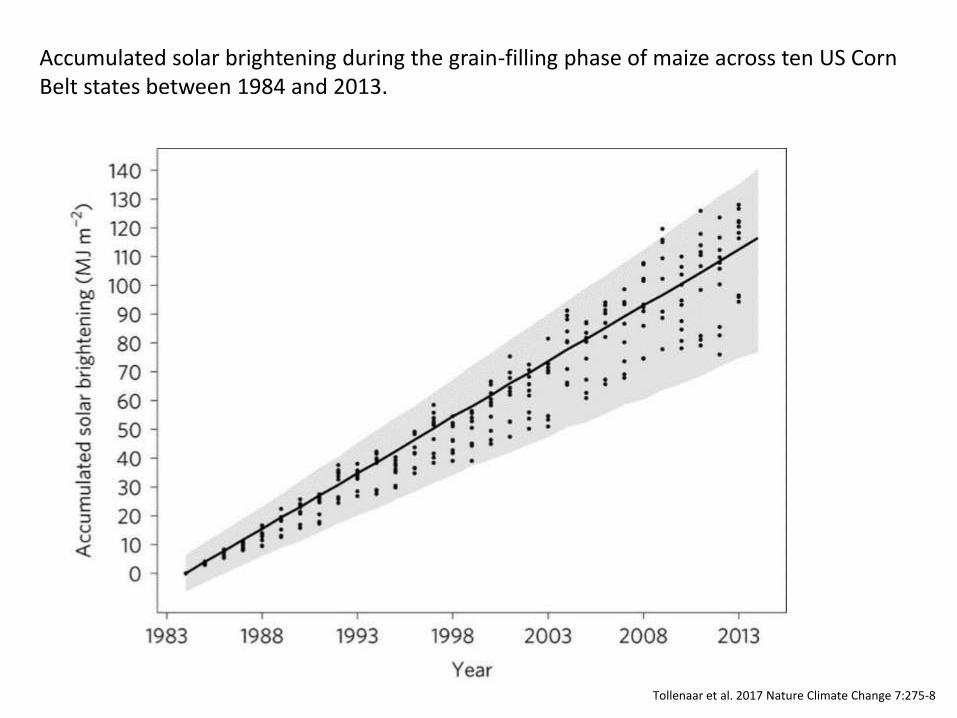
Tollenaar et al. 2017 Nature Climate Change 7:275-8
Accumulated solar brightening during the grain-filling phase of maize across ten US Corn Belt states between 1984 and 2013.
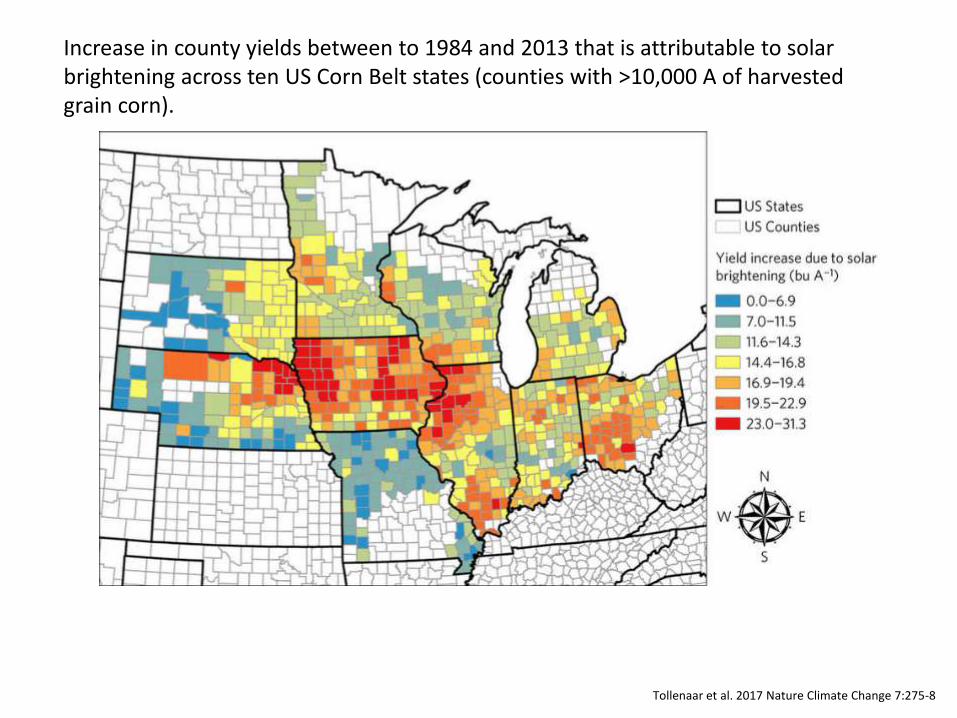
Increase in county yields between to 1984 and 2013 that is attributable to solar brightening across ten US Corn Belt states (counties with >10,000 A of harvested grain corn).
Tollenaar et al. 2017 Nature Climate Change 7:275-8
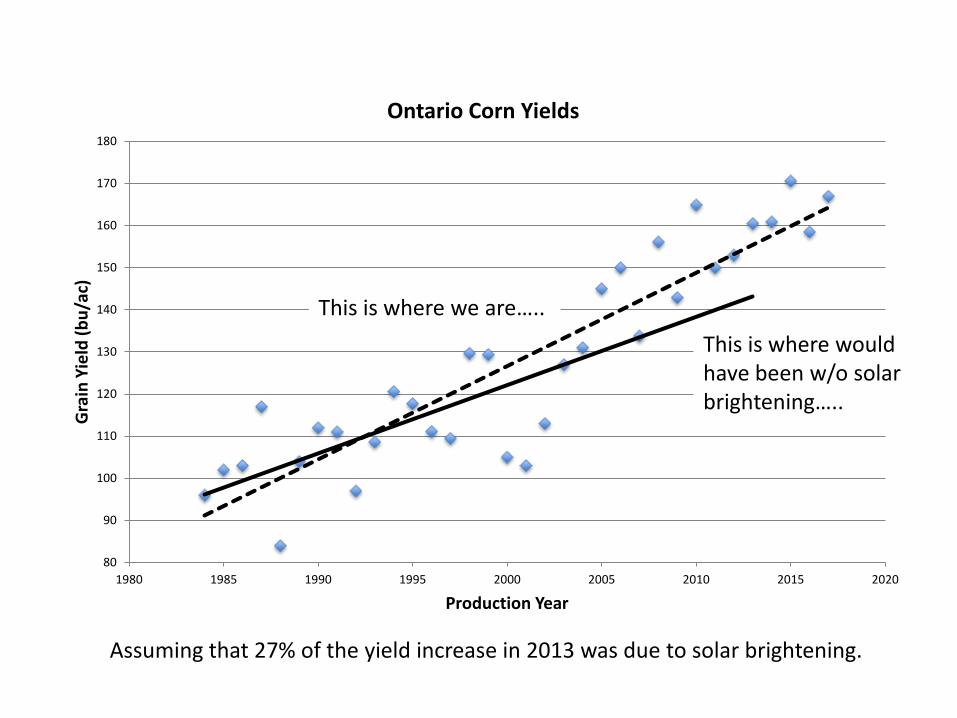
Assuming that 27% of the yield increase in 2013 was due to solar brightening.
80
90
100
110
120
130
140
150
160
170
180
1980 1985 1990 1995 2000 2005 2010 2015 2020
Gra
in Y
ield
(b
u/a
c)
Production Year
Ontario Corn Yields
This is where would have been w/o solar brightening…..
This is where we are…..
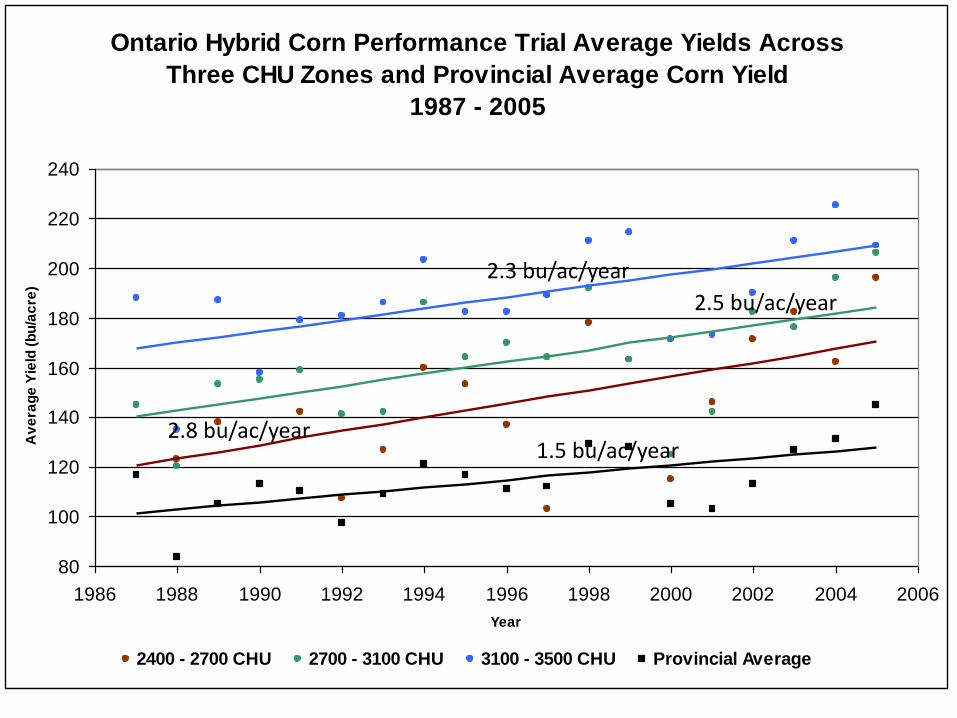
Ontario Hybrid Corn Performance Trial Average Yields Across
Three CHU Zones and Provincial Average Corn Yield
1987 - 2005
80
100
120
140
160
180
200
220
240
1986 1988 1990 1992 1994 1996 1998 2000 2002 2004 2006
Year
Av
era
ge
Yie
ld (
bu
/ac
re)
2400 - 2700 CHU 2700 - 3100 CHU 3100 - 3500 CHU Provincial Average
2.3 bu/ac/year
2.5 bu/ac/year
2.8 bu/ac/year1.5 bu/ac/year
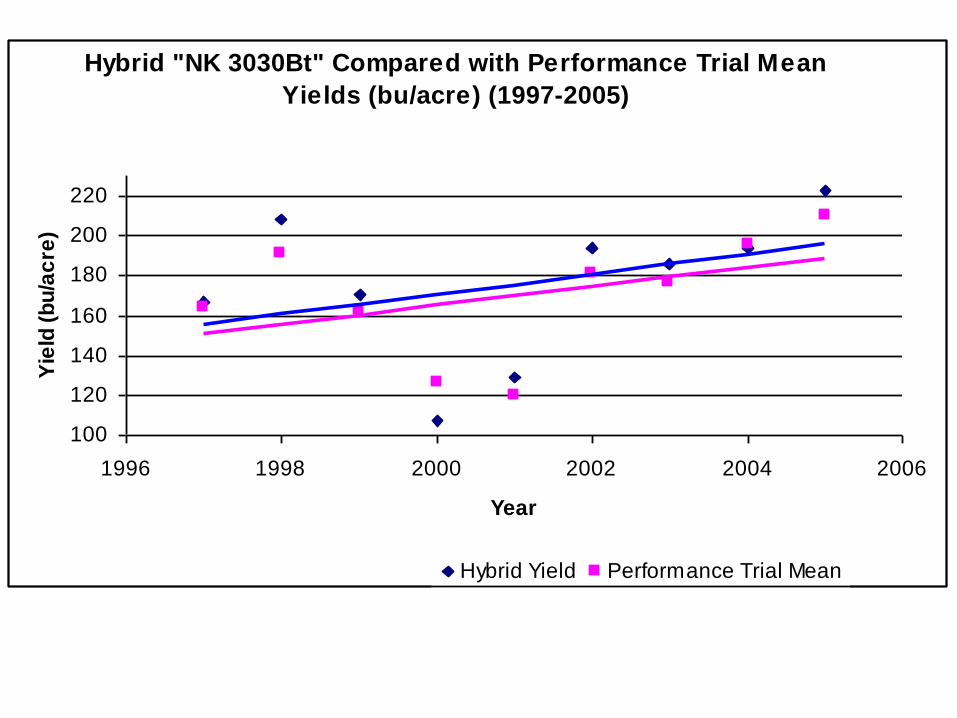
Hybrid "NK 3030Bt" Compared with Performance Trial Mean
Yields (bu/acre) (1997-2005)
100
120
140
160
180
200
220
1996 1998 2000 2002 2004 2006
Year
Yie
ld (
bu
/ac
re)
Hybrid Yield Performance Trial Mean
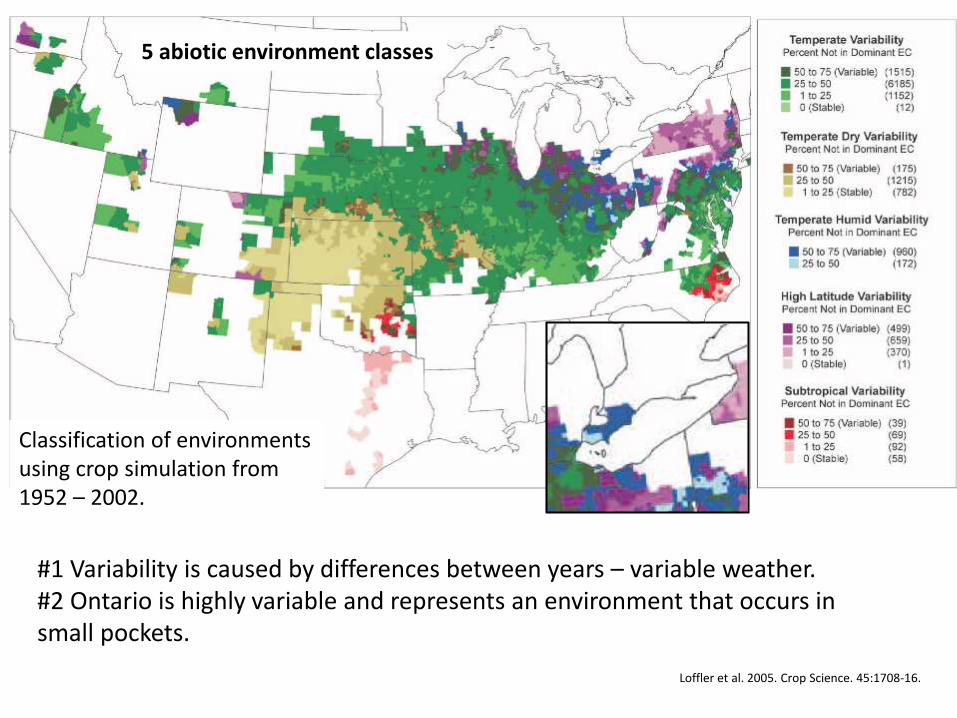
#1 Variability is caused by differences between years – variable weather.#2 Ontario is highly variable and represents an environment that occurs in small pockets.
Loffler et al. 2005. Crop Science. 45:1708-16.
Classification of environments using crop simulation from 1952 – 2002.
5 abiotic environment classes
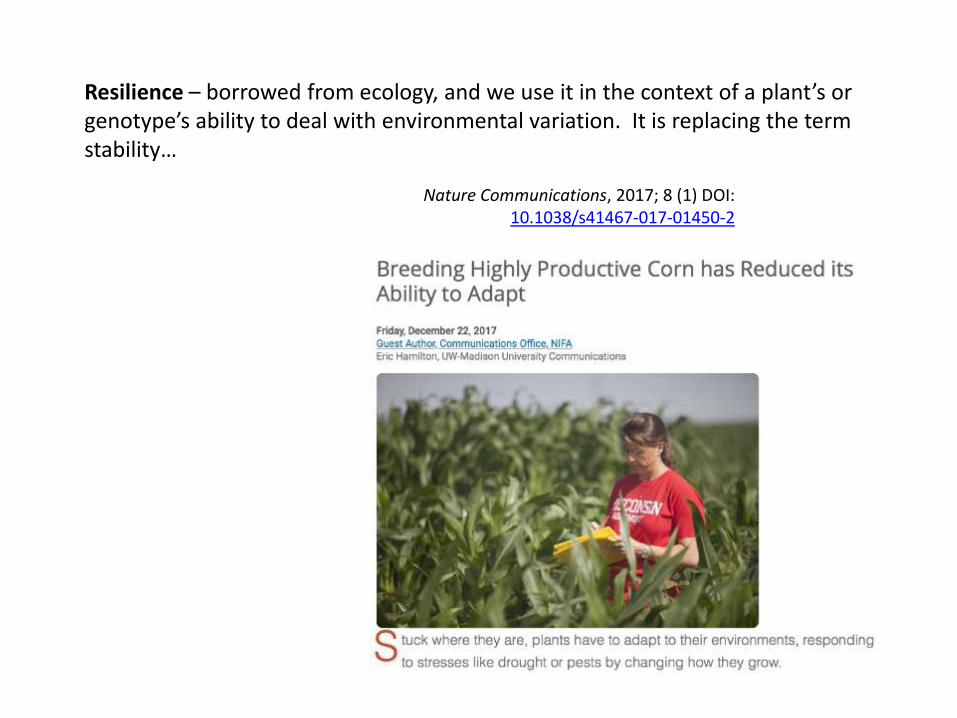
Resilience – borrowed from ecology, and we use it in the context of a plant’s or genotype’s ability to deal with environmental variation. It is replacing the term stability…
Nature Communications, 2017; 8 (1) DOI: 10.1038/s41467-017-01450-2
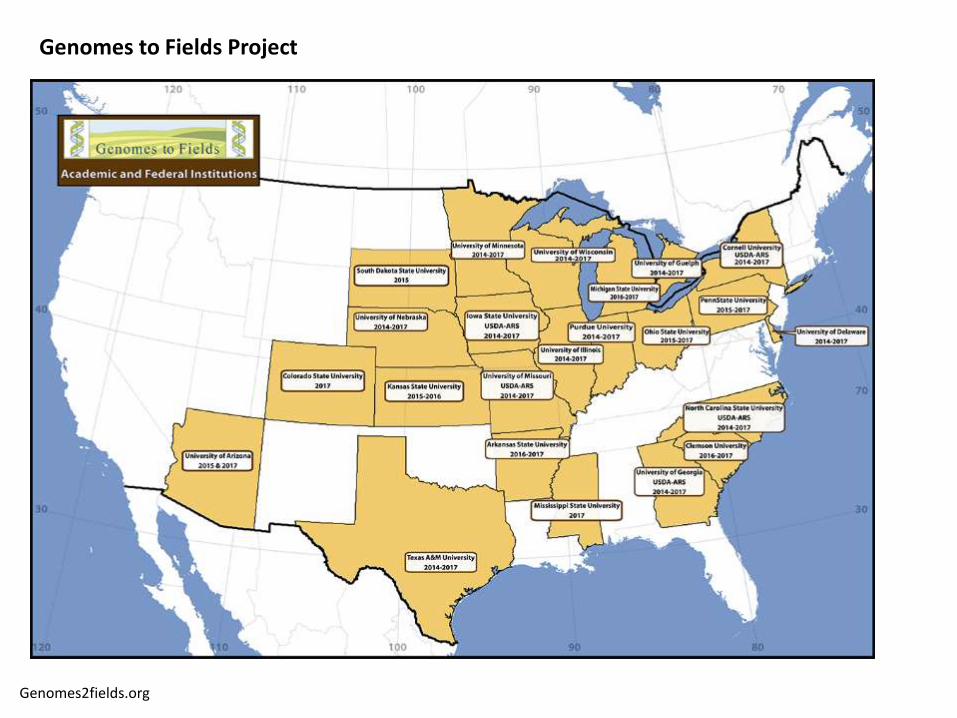
Genomes to Fields Project
Genomes2fields.org
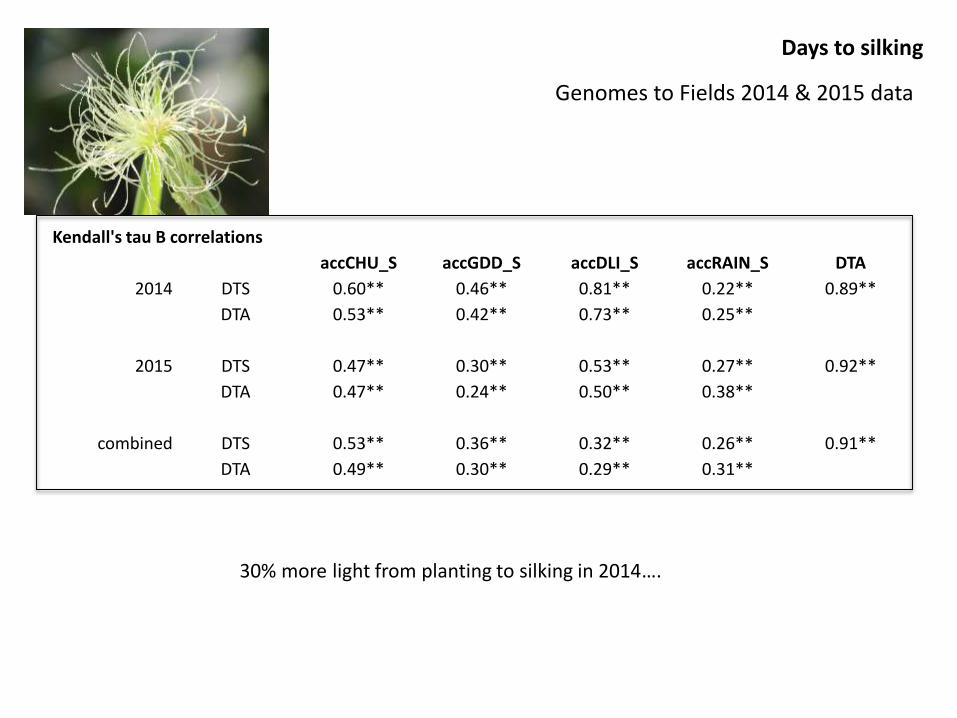
Days to silking
Kendall's tau B correlations
accCHU_S accGDD_S accDLI_S accRAIN_S DTA
2014 DTS 0.60** 0.46** 0.81** 0.22** 0.89**
DTA 0.53** 0.42** 0.73** 0.25**
2015 DTS 0.47** 0.30** 0.53** 0.27** 0.92**
DTA 0.47** 0.24** 0.50** 0.38**
combined DTS 0.53** 0.36** 0.32** 0.26** 0.91**
DTA 0.49** 0.30** 0.29** 0.31**
30% more light from planting to silking in 2014….
Genomes to Fields 2014 & 2015 data
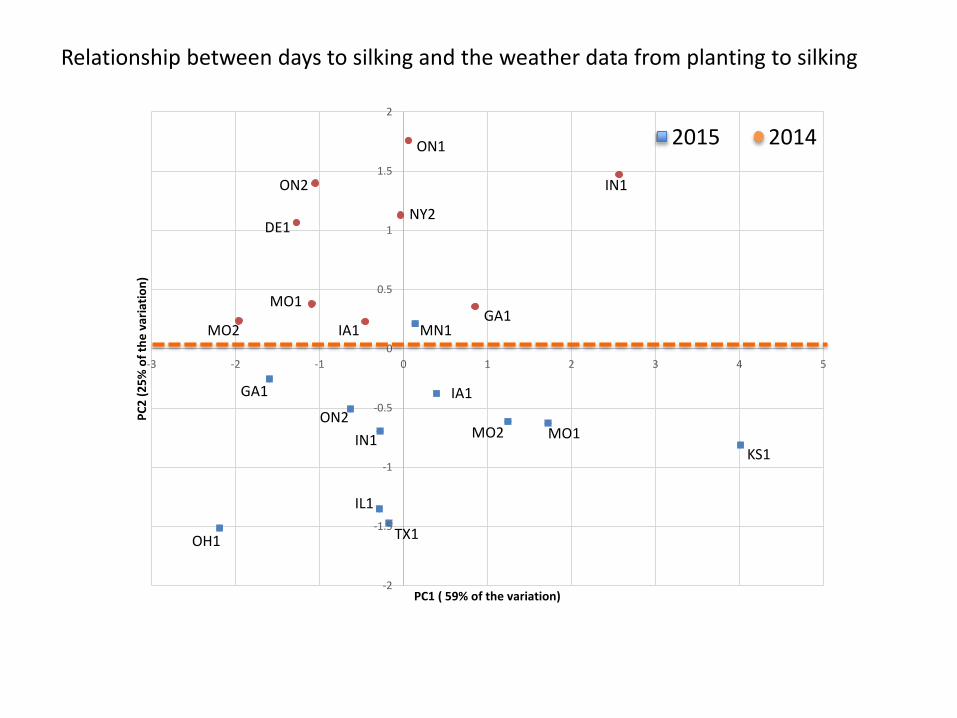
-2
-1.5
-1
-0.5
0
0.5
1
1.5
2
-3 -2 -1 0 1 2 3 4 5
PC
2 (
25
% o
f th
e v
aria
tio
n)
PC1 ( 59% of the variation)
KS1
MO1MO2
IA1
NY2
GA1
OH1
DE1
MO1
MO2 IA1
GA1
IL1
TX1
Relationship between days to silking and the weather data from planting to silking
2015 2014
MN1
IN1
ON1
ON2
ON2
IN1
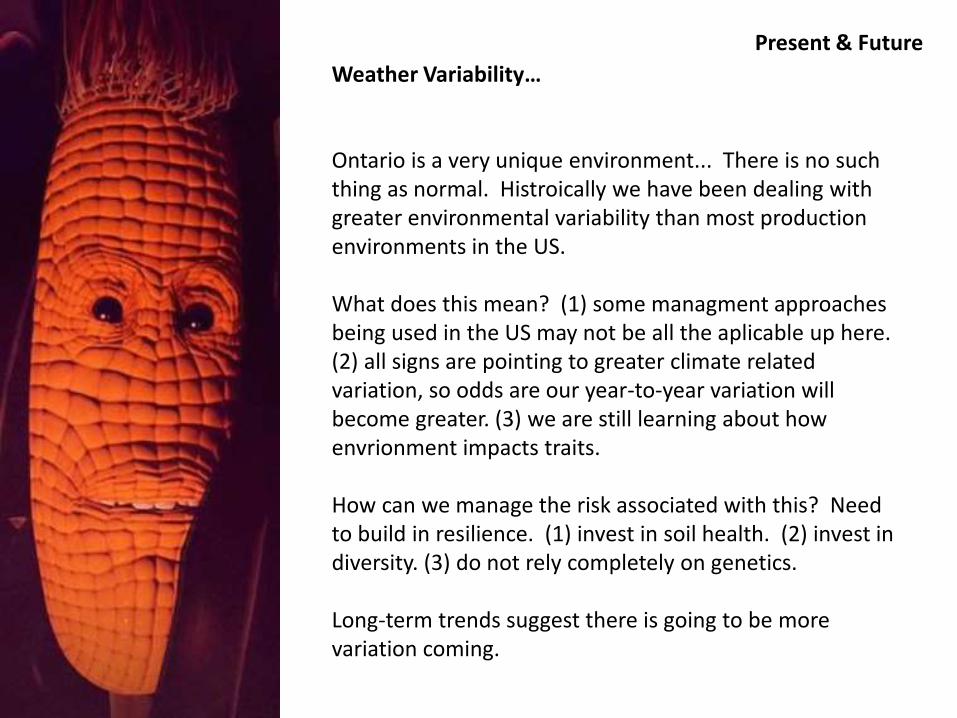
Weather Variability…
Present & Future
Ontario is a very unique environment... There is no such thing as normal. Histroically we have been dealing with greater environmental variability than most production environments in the US.
What does this mean? (1) some managment approaches being used in the US may not be all the aplicable up here. (2) all signs are pointing to greater climate related variation, so odds are our year-to-year variation will become greater. (3) we are still learning about how envrionment impacts traits.
How can we manage the risk associated with this? Need to build in resilience. (1) invest in soil health. (2) invest in diversity. (3) do not rely completely on genetics.
Long-term trends suggest there is going to be more variation coming.
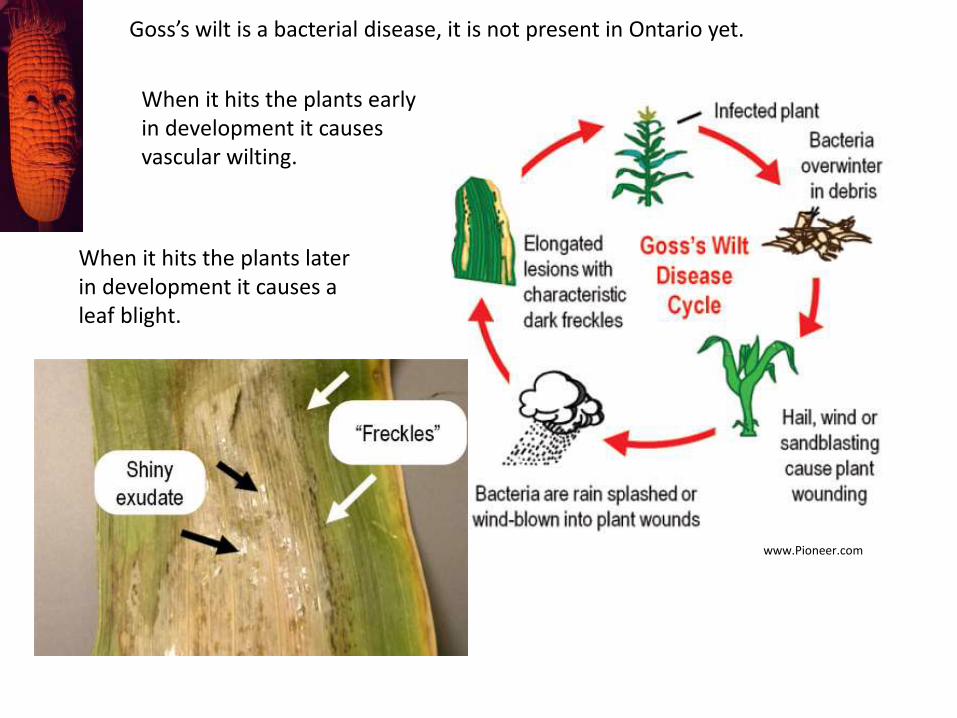
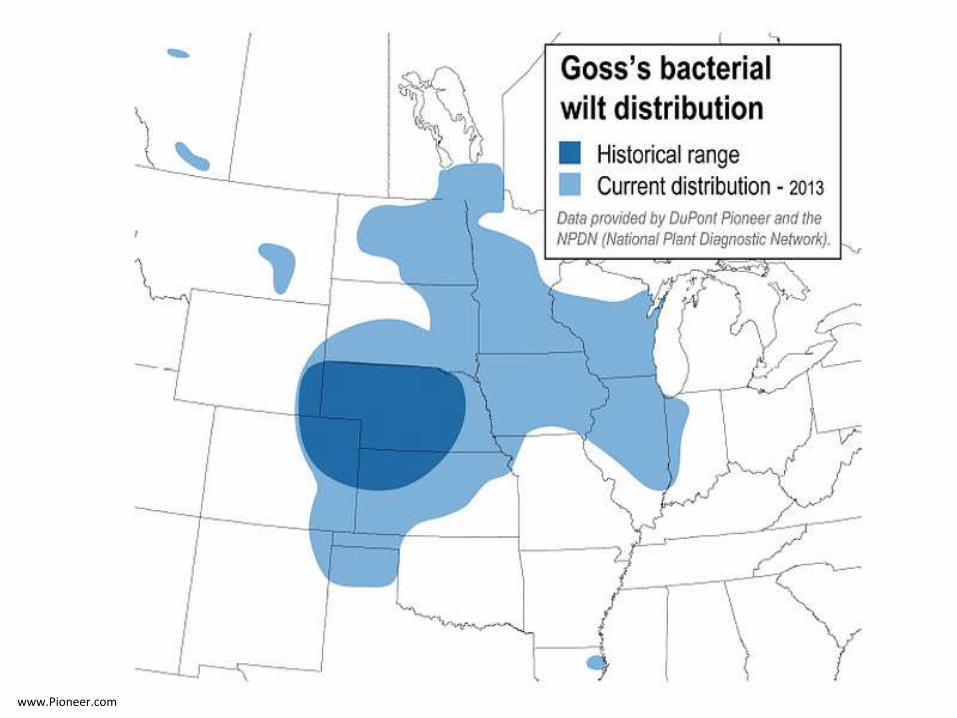
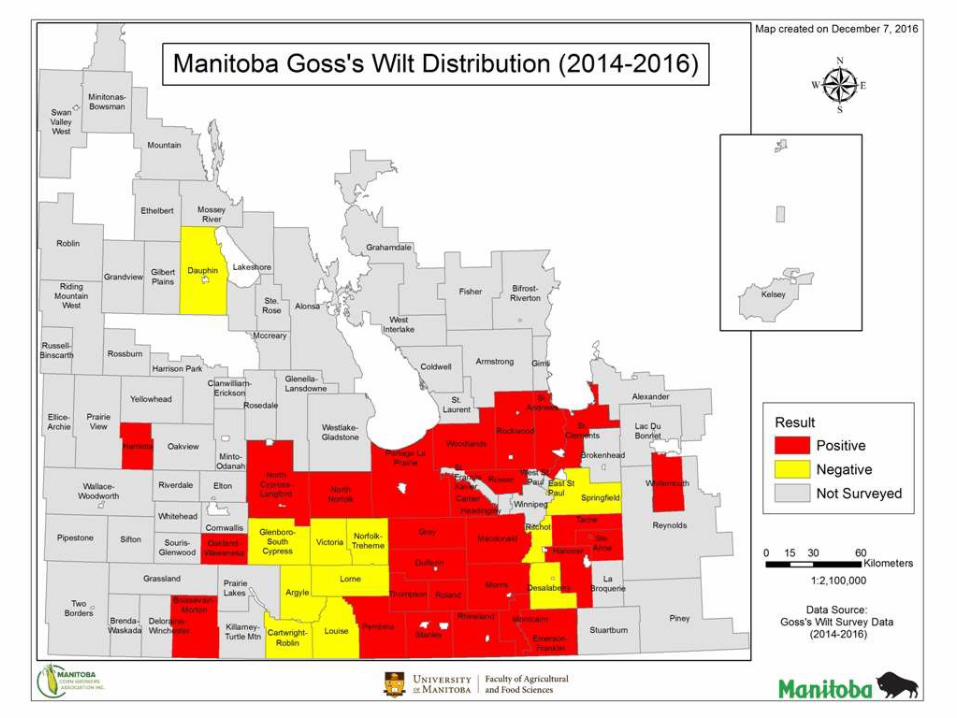
Goss’s wilt is a bacterial disease, it is not present in Ontario yet.
www.Pioneer.com
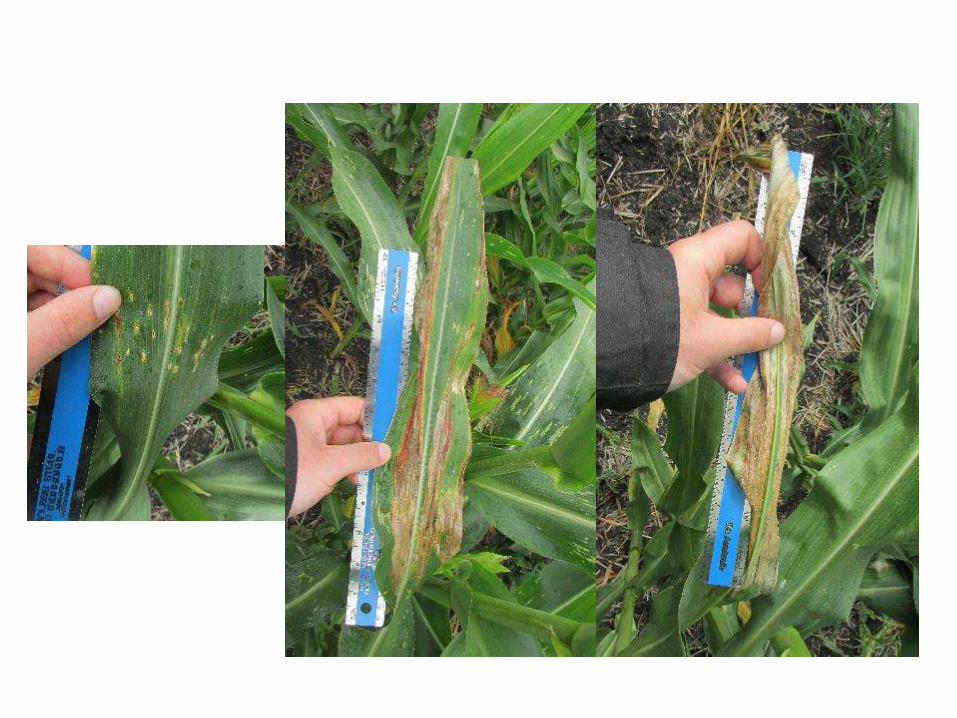
When it hits the plants early in development it causes vascular wilting.
When it hits the plants later in development it causes a leaf blight.
www.Pioneer.com

There is reason to be optimistic….
4 isolates from Manitoba
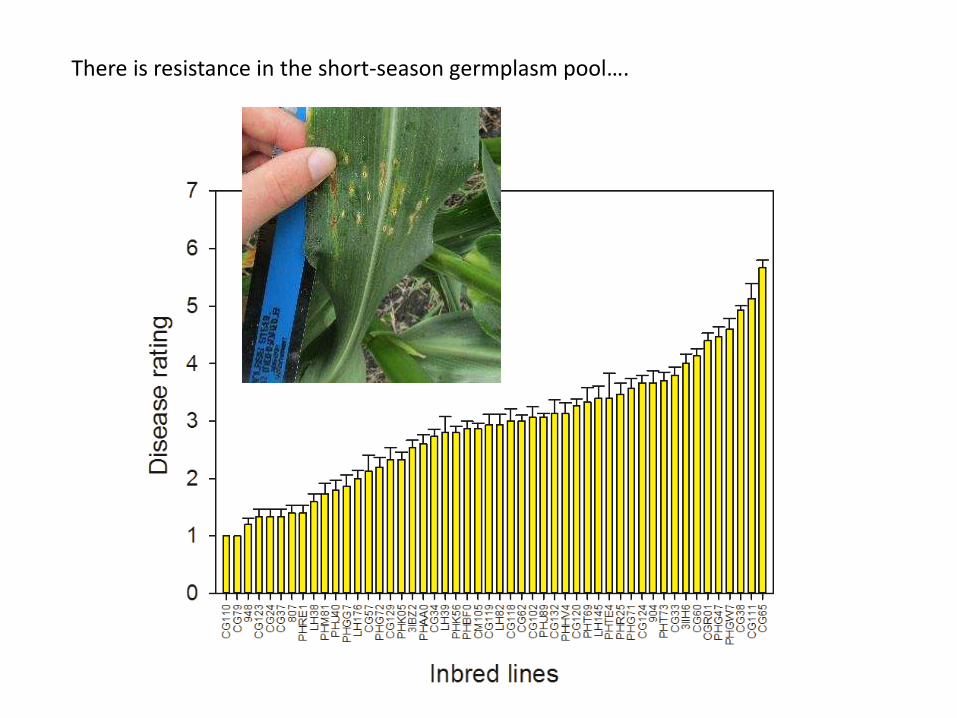
There is resistance in the short-season germplasm pool….
10
30
50
70
90
110
130
150
170
190
1840 1860 1880 1900 1920 1940 1960 1980 2000 2020 2040
Gra
in y
ield
(b
u/a
c)
Production Year
US Ontario
Data from USDA and OMAFRA
After essentially almost 80 years on this yield trajectory, we have probably developed an unhealthy and unrealistic expectation that it will continue….
Genetic improvement….
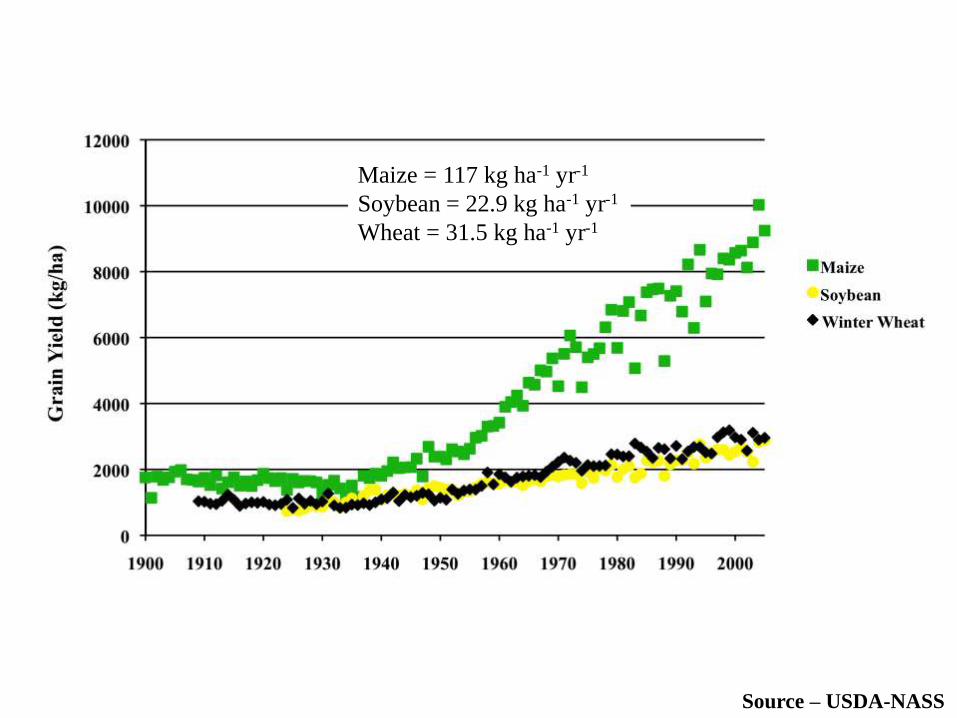
Source – USDA-NASS
Maize = 117 kg ha-1 yr-1
Soybean = 22.9 kg ha-1 yr-1
Wheat = 31.5 kg ha-1 yr-1
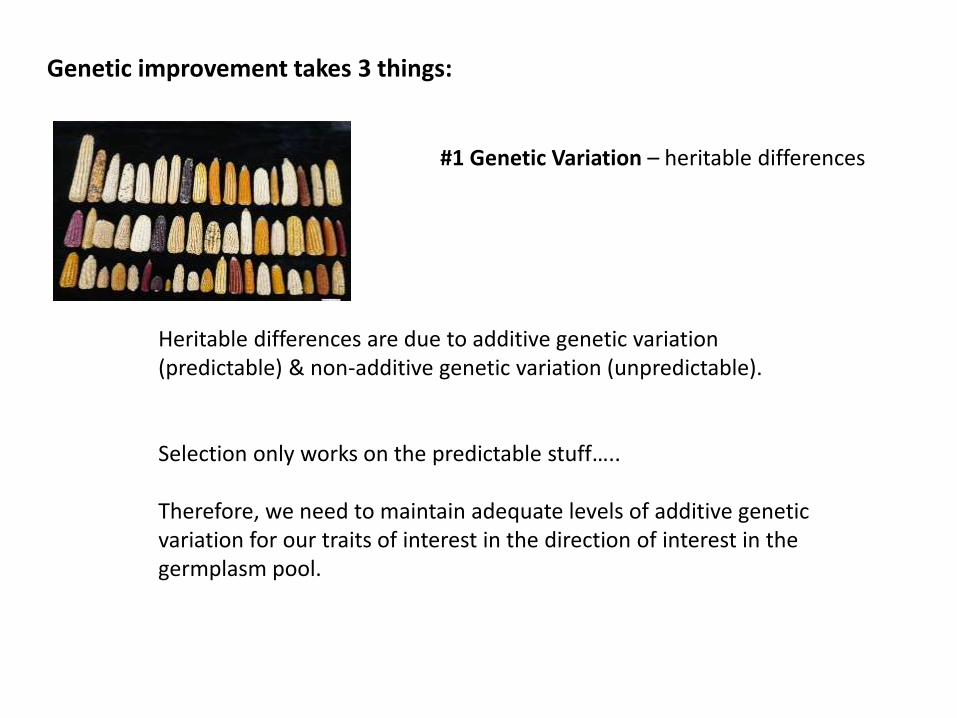
Heritable differences are due to additive genetic variation (predictable) & non-additive genetic variation (unpredictable).
Genetic improvement takes 3 things:
#1 Genetic Variation – heritable differences
Selection only works on the predictable stuff…..
Therefore, we need to maintain adequate levels of additive genetic variation for our traits of interest in the direction of interest in the germplasm pool.
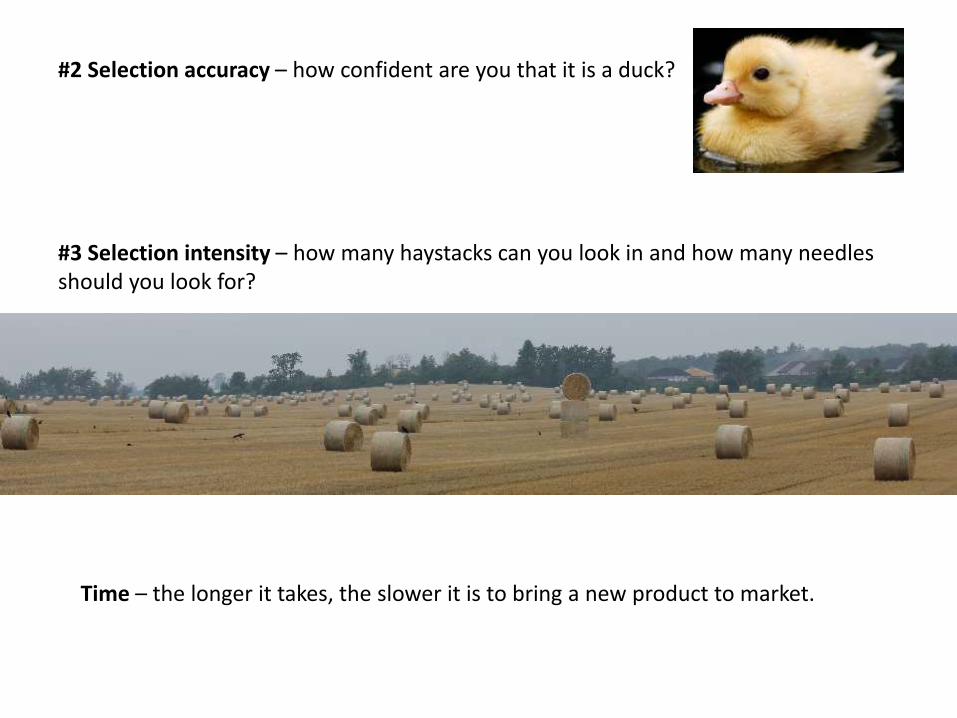
#2 Selection accuracy – how confident are you that it is a duck?
#3 Selection intensity – how many haystacks can you look in and how many needles should you look for?
Time – the longer it takes, the slower it is to bring a new product to market.
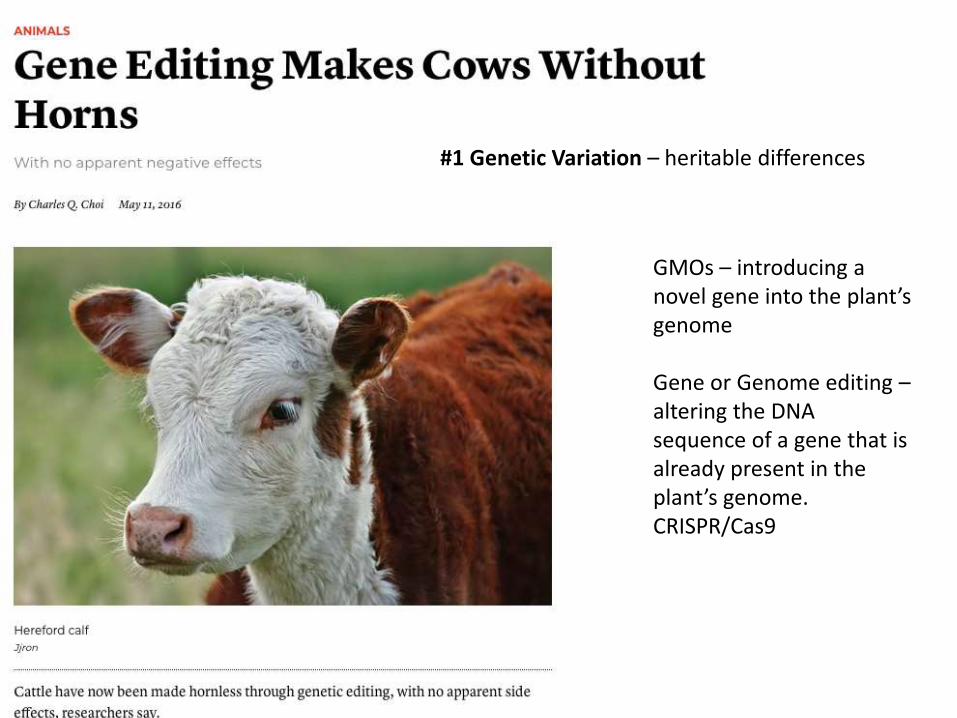
#1 Genetic Variation – heritable differences
GMOs – introducing a novel gene into the plant’s genome
Gene or Genome editing –altering the DNA sequence of a gene that is already present in the plant’s genome. CRISPR/Cas9
What about GMOs and gene editing to introduce genetic variation?
We’ve done the “easy stuff”…. Bt, herbicide tolerance, virus resistance, even golden rice. We understood the biology & the genetics of the traits. It was relatively affordable R&D for the companies. And there was a clear benefit to producers and they were willing to pay the additional cost.
Have to remember that corn is a commodity crop, by definition we want a lot of it and we want it cheaply. I am going to argue that the additional traits (GMO or GE) that we will see in corn will be few and far between…..