Embed Size (px)
DESCRIPTION
GHE DthGlobal Proj 2015 2030
Citation preview
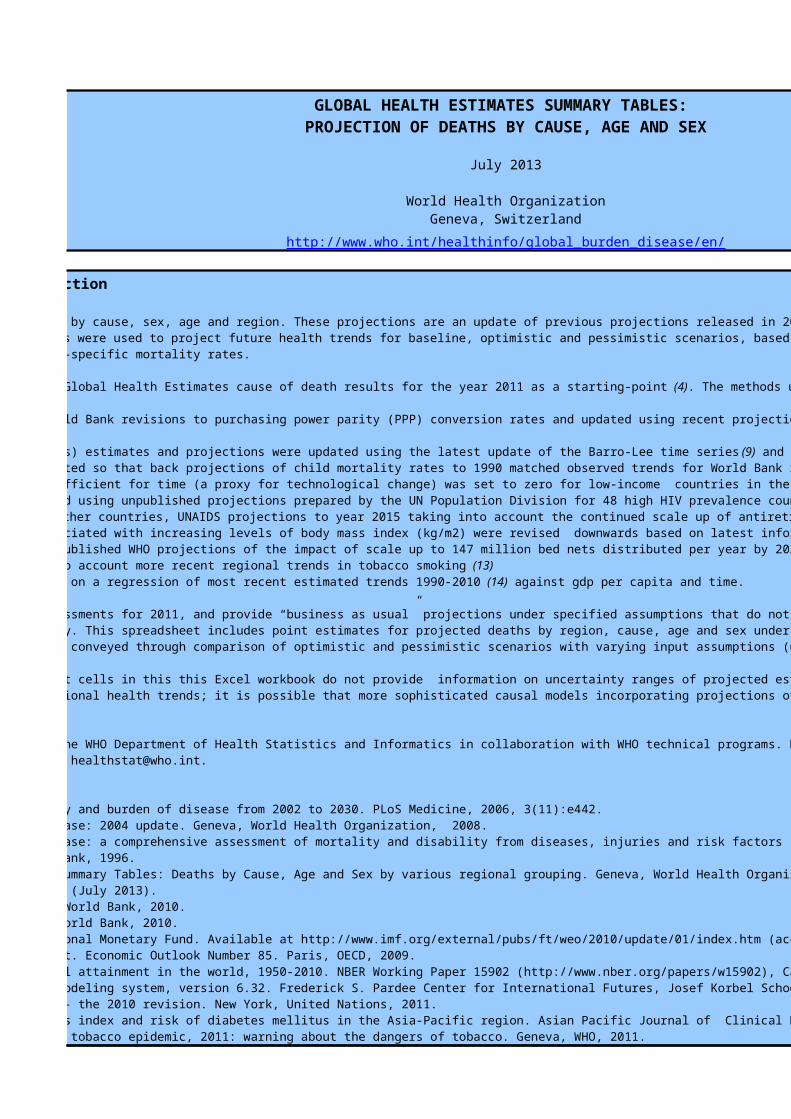
GLOBAL HEALTH ESTIMATES SUMMARY TABLES: PROJECTION OF DEATHS BY CAUSE, AGE AND SEX
July 2013
World Health OrganizationGeneva, Switzerland
http://www.who.int/healthinfo/global_burden_disease/en/
Global Health Estimates Summary Tables: Projection
This workbook contains summary projections of mortality by cause, sex, age and region. These projections are an update of previous projections released in 2006 (1) and in 2008 (2), and use methods similar to those applied in the original GBD study (3). A set of relatively simple models were used to project future health trends for baseline, optimistic and pessimistic scenarios, based largely on projections of economic and social development, and using the historically observed relationships of these with cause-specific mortality rates. These updated projections have been prepared using the Global Health Estimates cause of death results for the year 2011 as a starting-point (4). The methods used are essentially the same as those previously published (1), with the following changes:(a) GNI projections were revised to take account of World Bank revisions to purchasing power parity (PPP) conversion rates and updated using recent projections of real growth per annum in income per capita from the World Bank (5, 6), International Monetary Fund (7) and OECD (8). (b) Human capital (average years of schooling for adults) estimates and projections were updated using the latest update of the Barro-Lee time series (9) and projections from the International Futures project base case (10).(c) The projection regression equations were recalibrated so that back projections of child mortality rates to 1990 matched observed trends for World Bank regions. In the recalibrated projections, the regression coefficient for human capital was left unchanged and the regression coefficient for time (a proxy for technological change) was set to zero for low-income countries in the WHO African, European, South East Asia and Western Pacific Regions;(d) Baseline projections for HIV mortality were updated using unpublished projections prepared by the UN Population Division for 48 high HIV prevalence countries as part of the overall projection of life tables to the year 2100 for the World Population Prospects 2010 revision (11). For other countries, UNAIDS projections to year 2015 taking into account the continued scale up of antiretroviral therapy coverage were extended to 2030 with optimistic trends;(e) Relative risks for diabetes mellitus mortality associated with increasing levels of body mass index (kg/m2) were revised downwards based on latest information from the Asia Pacific Cohorts study (12); (6) Malaria mortality trends were revised to follow unpublished WHO projections of the impact of scale up to 147 million bed nets distributed per year by 2020 (Global Fund Scenario 2);(7) Smoking impact projections were updated to take into account more recent regional trends in tobacco smoking (13)(8) Body mass index projections were also updated based on a regression of most recent estimated trends 1990-2010 (14) against gdp per capita and time.
These projections are less firm than the base year assessments for 2011, and provide “business as usual” projections under specified assumptions that do not specifically take account of trends in major risk factors apart from tobacco smoking, and to a limited extent, overweight and obesity. This spreadsheet includes point estimates for projected deaths by region, cause, age and sex under a base scenario for projected covariates. Explicit uncertainty ranges are not included here, uncertainty in projections is better conveyed through comparison of optimistic and pessimistic scenarios with varying input assumptions (under preparation and not yet released).
The number of significant figures displayed in worksheet cells in this this Excel workbook do not provide information on uncertainty ranges of projected estimates. The base scenario does not necessarily represent the best predictions or potential range of future global and regional health trends; it is possible that more sophisticated causal models incorporating projections of important determinants may provide better predictions for specific diseases.
The preparation of these statistics was undertaken by the WHO Department of Health Statistics and Informatics in collaboration with WHO technical programs. Documentation and regional-level summary tables are available on the WHO website (4). For other queries, please send an email to [email protected].
References1. Mathers CD, Loncar D. Projections of global mortality and burden of disease from 2002 to 2030. PLoS Medicine, 2006, 3(11):e442.2. World Health Organization. The global burden of disease: 2004 update. Geneva, World Health Organization, 2008.3. Murray CJL, Lopez AD, eds. The global burden of disease: a comprehensive assessment of mortality and disability from diseases, injuries and risk factors in 1990 and projected to 2020. Cambridge, Harvard School of Public Health on behalf of the World Health Organization and the World Bank, 1996.4. World Health Organization. Global Health Estimates Summary Tables: Deaths by Cause, Age and Sex by various regional grouping. Geneva, World Health Organization, 2013. Available at http://www.who.int/healthinfo/global_burden_disease/en/ (July 2013). 5. Global economic prospects 2010. Washington, DC, The World Bank, 2010.6. World Development Report 2010. Washington, DC, The World Bank, 2010.7. World Economic Outlook 2009 (update 2010). International Monetary Fund. Available at http://www.imf.org/external/pubs/ft/weo/2010/update/01/index.htm (accessed 12 June 2013).8. Organization for Economic Cooperation and Development. Economic Outlook Number 85. Paris, OECD, 2009.9. Barro RJ, Jong-Wha Lee, A new dataset of educational attainment in the world, 1950-2010. NBER Working Paper 15902 (http://www.nber.org/papers/w15902), Cambridge MA, National Bureau of Economic Research (2010). 10. Hughes BB et al. The International Futures (IFs) modeling system, version 6.32. Frederick S. Pardee Center for International Futures, Josef Korbel School of International Studies, University of Denver, www.ifs.du.edu.11. UN Population Division. World Population Prospects - the 2010 revision. New York, United Nations, 2011.12. Asia Pacific Cohort Studies Collaboration. Body mass index and risk of diabetes mellitus in the Asia-Pacific region. Asian Pacific Journal of Clinical Nutrition, 2006, 15:127-133.13. World Health Organization. WHO report on the global tobacco epidemic, 2011: warning about the dangers of tobacco. Geneva, WHO, 2011.14. Finucane MM; Stevens GA; Cowan MJ; Danaei G; Lin JK; Paciorek CJ; Singh GM; Gutierrez HR; et al. National, regional, and global trends in body-mass index since 1980: systematic analysis of health examination surveys and epidemiological studies with 960 country-years and 9•1 million participants. Lancet 2011, 377:557-567.
GLOBAL HEALTH ESTIMATES SUMMARY TABLES: PROJECTION OF DEATHS BY CAUSE, AGE AND SEX
July 2013
World Health OrganizationGeneva, Switzerland
http://www.who.int/healthinfo/global_burden_disease/en/
Global Health Estimates Summary Tables: Projection
This workbook contains summary projections of mortality by cause, sex, age and region. These projections are an update of previous projections released in 2006 (1) and in 2008 (2), and use methods similar to those applied in the original GBD study (3). A set of relatively simple models were used to project future health trends for baseline, optimistic and pessimistic scenarios, based largely on projections of economic and social development, and using the historically observed relationships of these with cause-specific mortality rates.
These updated projections have been prepared using the Global Health Estimates cause of death results for the year 2011 as a starting-point (4). The methods used are essentially the same as those previously published (1), with the following changes:(a) GNI projections were revised to take account of World Bank revisions to purchasing power parity (PPP) conversion rates and updated using recent projections of real growth per annum in income per capita from the World Bank (5, 6), International Monetary Fund (7) and OECD (8). (b) Human capital (average years of schooling for adults) estimates and projections were updated using the latest update of the Barro-Lee time series (9) and projections from the International Futures project base case (10).(c) The projection regression equations were recalibrated so that back projections of child mortality rates to 1990 matched observed trends for World Bank regions. In the recalibrated projections, the regression coefficient for human capital was left unchanged and the regression coefficient for time (a proxy for technological change) was set to zero for low-income countries in the WHO African, European, South East Asia and Western Pacific Regions;(d) Baseline projections for HIV mortality were updated using unpublished projections prepared by the UN Population Division for 48 high HIV prevalence countries as part of the overall projection of life tables to the year 2100 for the World Population Prospects 2010 revision (11). For other countries, UNAIDS projections to year 2015 taking into account the continued scale up of antiretroviral therapy coverage were extended to 2030 with optimistic trends;(e) Relative risks for diabetes mellitus mortality associated with increasing levels of body mass index (kg/m2) were revised downwards based on latest information from the Asia Pacific Cohorts study (12); (6) Malaria mortality trends were revised to follow unpublished WHO projections of the impact of scale up to 147 million bed nets distributed per year by 2020 (Global Fund Scenario 2);(7) Smoking impact projections were updated to take into account more recent regional trends in tobacco smoking (13)(8) Body mass index projections were also updated based on a regression of most recent estimated trends 1990-2010 (14) against gdp per capita and time.
These projections are less firm than the base year assessments for 2011, and provide “business as usual” projections under specified assumptions that do not specifically take account of trends in major risk factors apart from tobacco smoking, and to a limited extent, overweight and obesity. This spreadsheet includes point estimates for projected deaths by region, cause, age and sex under a base scenario for projected covariates. Explicit uncertainty ranges are not included here, uncertainty in projections is better conveyed through comparison of optimistic and pessimistic scenarios with varying input assumptions (under preparation and not yet released).
The number of significant figures displayed in worksheet cells in this this Excel workbook do not provide information on uncertainty ranges of projected estimates. The base scenario does not necessarily represent the best predictions or potential range of future global and regional health trends; it is possible that more sophisticated causal models incorporating projections of important determinants may provide better predictions for specific diseases.
The preparation of these statistics was undertaken by the WHO Department of Health Statistics and Informatics in collaboration with WHO technical programs. Documentation and regional-level summary tables are available on the WHO website (4). For other queries, please send an email
1. Mathers CD, Loncar D. Projections of global mortality and burden of disease from 2002 to 2030. PLoS Medicine, 2006, 3(11):e442.2. World Health Organization. The global burden of disease: 2004 update. Geneva, World Health Organization, 2008.3. Murray CJL, Lopez AD, eds. The global burden of disease: a comprehensive assessment of mortality and disability from diseases, injuries and risk factors in 1990 and projected to 2020. Cambridge, Harvard School of Public Health on behalf of the World Health Organization and the World
4. World Health Organization. Global Health Estimates Summary Tables: Deaths by Cause, Age and Sex by various regional grouping. Geneva, World Health Organization, 2013. Available at http://www.who.int/healthinfo/global_burden_disease/en/ (July 2013). 5. Global economic prospects 2010. Washington, DC, The World Bank, 2010.6. World Development Report 2010. Washington, DC, The World Bank, 2010.7. World Economic Outlook 2009 (update 2010). International Monetary Fund. Available at http://www.imf.org/external/pubs/ft/weo/2010/update/01/index.htm (accessed 12 June 2013).8. Organization for Economic Cooperation and Development. Economic Outlook Number 85. Paris, OECD, 2009.9. Barro RJ, Jong-Wha Lee, A new dataset of educational attainment in the world, 1950-2010. NBER Working Paper 15902 (http://www.nber.org/papers/w15902), Cambridge MA, National Bureau of Economic Research (2010). 10. Hughes BB et al. The International Futures (IFs) modeling system, version 6.32. Frederick S. Pardee Center for International Futures, Josef Korbel School of International Studies, University of Denver, www.ifs.du.edu.11. UN Population Division. World Population Prospects - the 2010 revision. New York, United Nations, 2011.12. Asia Pacific Cohort Studies Collaboration. Body mass index and risk of diabetes mellitus in the Asia-Pacific region. Asian Pacific Journal of Clinical Nutrition, 2006, 15:127-133.13. World Health Organization. WHO report on the global tobacco epidemic, 2011: warning about the dangers of tobacco. Geneva, WHO, 2011.14. Finucane MM; Stevens GA; Cowan MJ; Danaei G; Lin JK; Paciorek CJ; Singh GM; Gutierrez HR; et al. National, regional, and global trends in body-mass index since 1980: systematic analysis of health examination surveys and epidemiological studies with 960 country-years and 9•1 million
, and use methods similar to those applied in the original GBD study (3). A set of relatively simple models were used to project future health trends for baseline, optimistic and pessimistic scenarios, based largely on projections of economic and social development, and using the historically observed relationships of these with cause-specific mortality rates.
. The methods used are essentially the same as those previously published (1), with the following changes:(a) GNI projections were revised to take account of World Bank revisions to purchasing power parity (PPP) conversion rates and updated using recent projections of real growth per annum in income per capita from the World Bank (5, 6), International Monetary Fund (7) and OECD (8).
and projections from the International Futures project base case (10).(c) The projection regression equations were recalibrated so that back projections of child mortality rates to 1990 matched observed trends for World Bank regions. In the recalibrated projections, the regression coefficient for human capital was left unchanged and the regression coefficient
(d) Baseline projections for HIV mortality were updated using unpublished projections prepared by the UN Population Division for 48 high HIV prevalence countries as part of the overall projection of life tables to the year 2100 for the World Population Prospects 2010 revision (11). For
These projections are less firm than the base year assessments for 2011, and provide “business as usual” projections under specified assumptions that do not specifically take account of trends in major risk factors apart from tobacco smoking, and to a limited extent, overweight and obesity. This spreadsheet includes point estimates for projected deaths by region, cause, age and sex under a base scenario for projected covariates. Explicit uncertainty ranges are not included here, uncertainty in projections is better conveyed through comparison of optimistic and pessimistic
The number of significant figures displayed in worksheet cells in this this Excel workbook do not provide information on uncertainty ranges of projected estimates. The base scenario does not necessarily represent the best predictions or potential range of future global and regional health
The preparation of these statistics was undertaken by the WHO Department of Health Statistics and Informatics in collaboration with WHO technical programs. Documentation and regional-level summary tables are available on the WHO website (4). For other queries, please send an email
3. Murray CJL, Lopez AD, eds. The global burden of disease: a comprehensive assessment of mortality and disability from diseases, injuries and risk factors in 1990 and projected to 2020. Cambridge, Harvard School of Public Health on behalf of the World Health Organization and the World
4. World Health Organization. Global Health Estimates Summary Tables: Deaths by Cause, Age and Sex by various regional grouping. Geneva, World Health Organization, 2013. Available at http://www.who.int/healthinfo/global_burden_disease/en/ (July 2013).
9. Barro RJ, Jong-Wha Lee, A new dataset of educational attainment in the world, 1950-2010. NBER Working Paper 15902 (http://www.nber.org/papers/w15902), Cambridge MA, National Bureau of Economic Research (2010). 10. Hughes BB et al. The International Futures (IFs) modeling system, version 6.32. Frederick S. Pardee Center for International Futures, Josef Korbel School of International Studies, University of Denver, www.ifs.du.edu.
14. Finucane MM; Stevens GA; Cowan MJ; Danaei G; Lin JK; Paciorek CJ; Singh GM; Gutierrez HR; et al. National, regional, and global trends in body-mass index since 1980: systematic analysis of health examination surveys and epidemiological studies with 960 country-years and 9•1 million
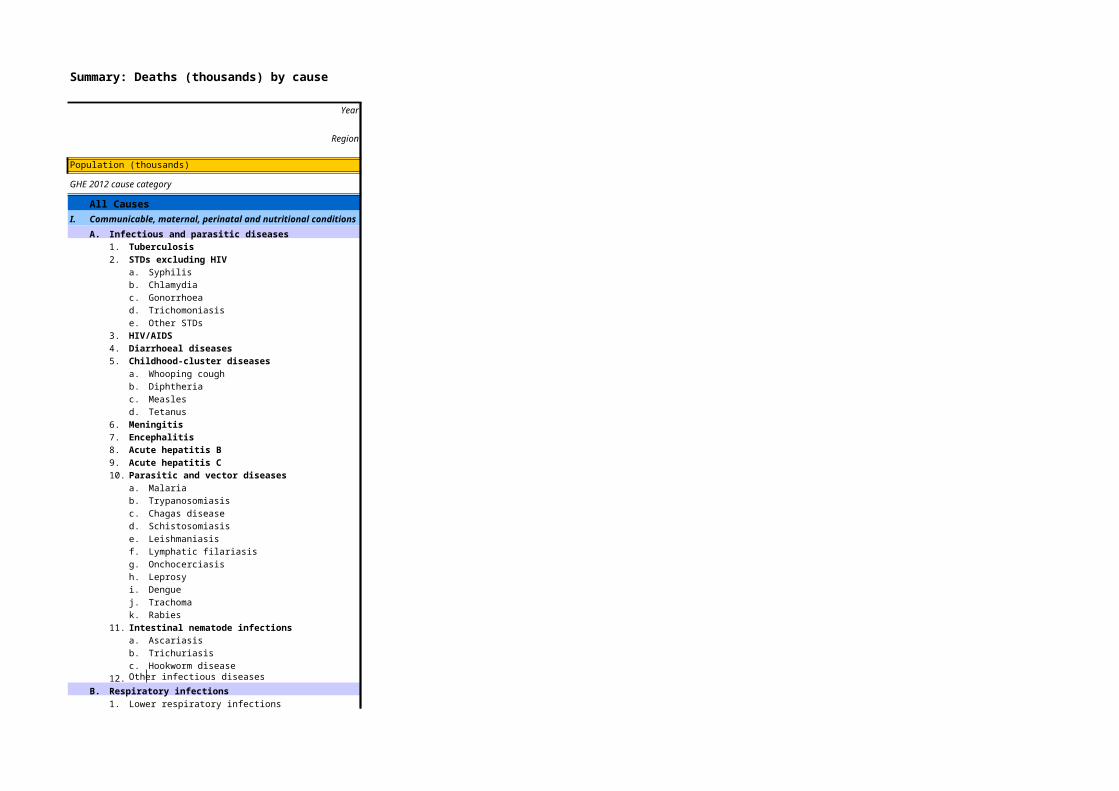
Summary: Deaths (thousands) by cause
Year
Region
Population (thousands)
GHE 2012 cause category
All Causes
I.
A. Infectious and parasitic diseases
1. Tuberculosis
2. STDs excluding HIV
a. Syphilis
b. Chlamydia
c. Gonorrhoea
d. Trichomoniasis
e. Other STDs
3. HIV/AIDS
4. Diarrhoeal diseases
5. Childhood-cluster diseases
a. Whooping cough
b. Diphtheria
c. Measles
d. Tetanus
6. Meningitis
7. Encephalitis
8. Acute hepatitis B
9. Acute hepatitis C
10. Parasitic and vector diseases
a. Malaria
b. Trypanosomiasis
c. Chagas disease
d. Schistosomiasis
e. Leishmaniasis
f. Lymphatic filariasis
g. Onchocerciasis
h. Leprosy
i. Dengue
j. Trachoma
k. Rabies
11. Intestinal nematode infections
a. Ascariasis
b. Trichuriasis
c. Hookworm disease
12. Other infectious diseases
B. Respiratory infections
1. Lower respiratory infections
Communicable, maternal, perinatal and nutritional conditions
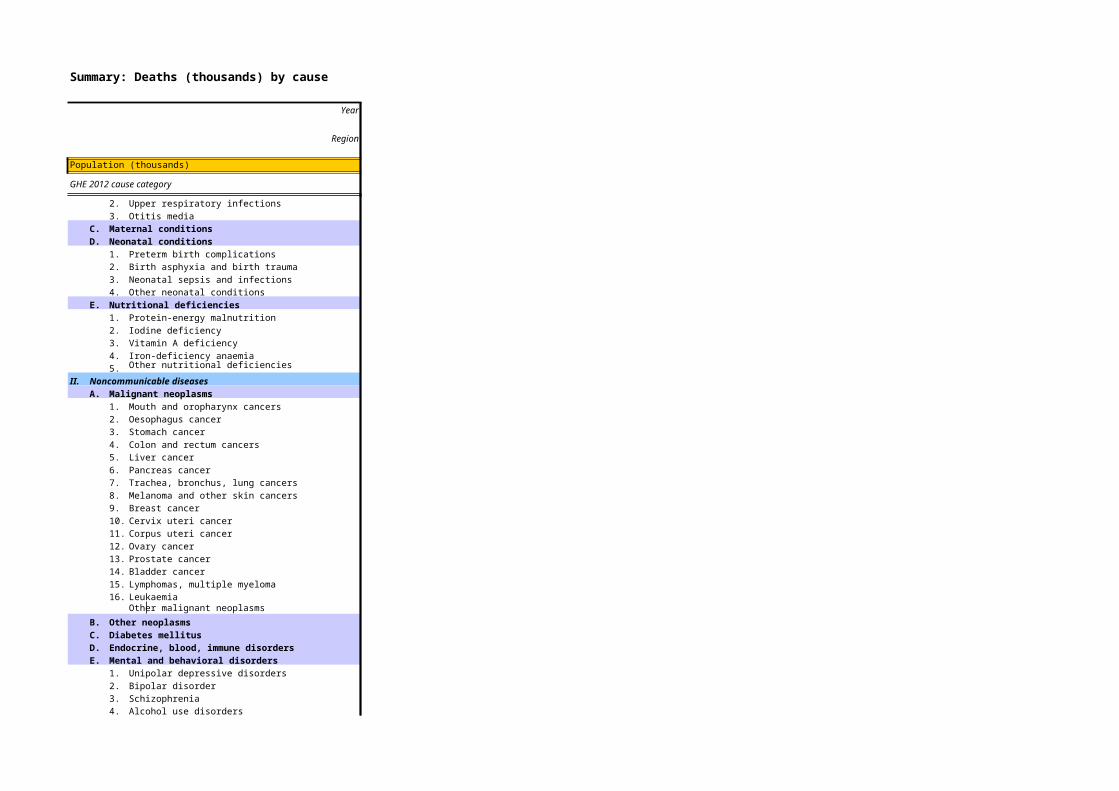
Summary: Deaths (thousands) by cause
Year
Region
Population (thousands)
GHE 2012 cause category
2. Upper respiratory infections
3. Otitis media
C. Maternal conditions
D. Neonatal conditions
1. Preterm birth complications
2. Birth asphyxia and birth trauma
3. Neonatal sepsis and infections
4. Other neonatal conditions
E. Nutritional deficiencies
1. Protein-energy malnutrition
2. Iodine deficiency
3. Vitamin A deficiency
4. Iron-deficiency anaemia
5. Other nutritional deficiencies
II. Noncommunicable diseases
A. Malignant neoplasms
1. Mouth and oropharynx cancers
2. Oesophagus cancer
3. Stomach cancer
4. Colon and rectum cancers
5. Liver cancer
6. Pancreas cancer
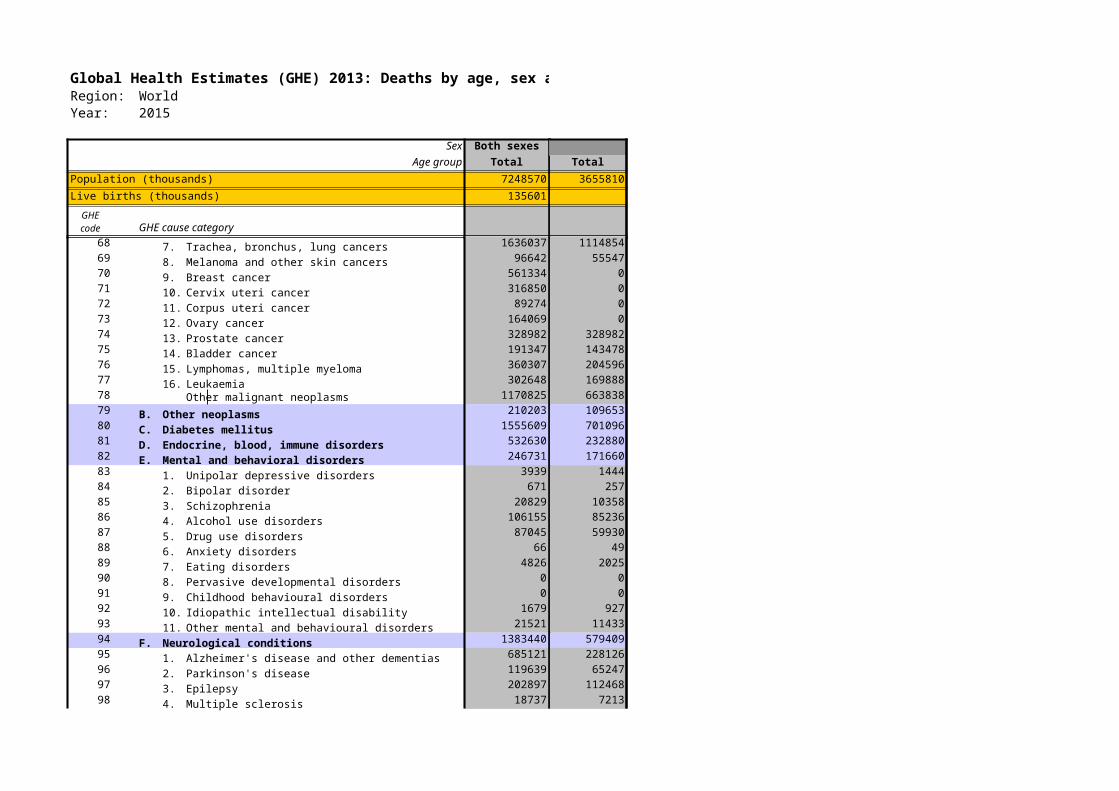
7. Trachea, bronchus, lung cancers
8. Melanoma and other skin cancers
9. Breast cancer
10. Cervix uteri cancer
11. Corpus uteri cancer
12. Ovary cancer
13. Prostate cancer
14. Bladder cancer
15. Lymphomas, multiple myeloma
16. LeukaemiaOther malignant neoplasms
B. Other neoplasms
C. Diabetes mellitus
D. Endocrine, blood, immune disorders
E. Mental and behavioral disorders
1. Unipolar depressive disorders
2. Bipolar disorder
3. Schizophrenia
4. Alcohol use disorders
Summary: Deaths (thousands) by cause
Year
Region
Population (thousands)
GHE 2012 cause category
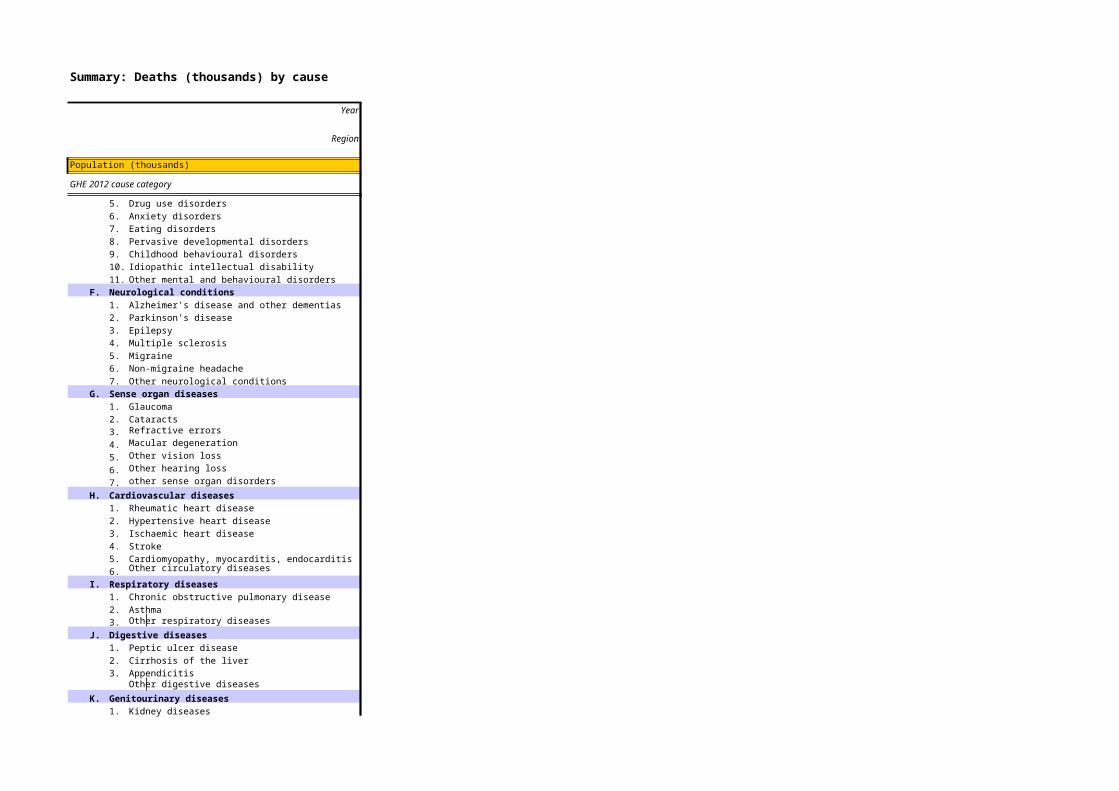
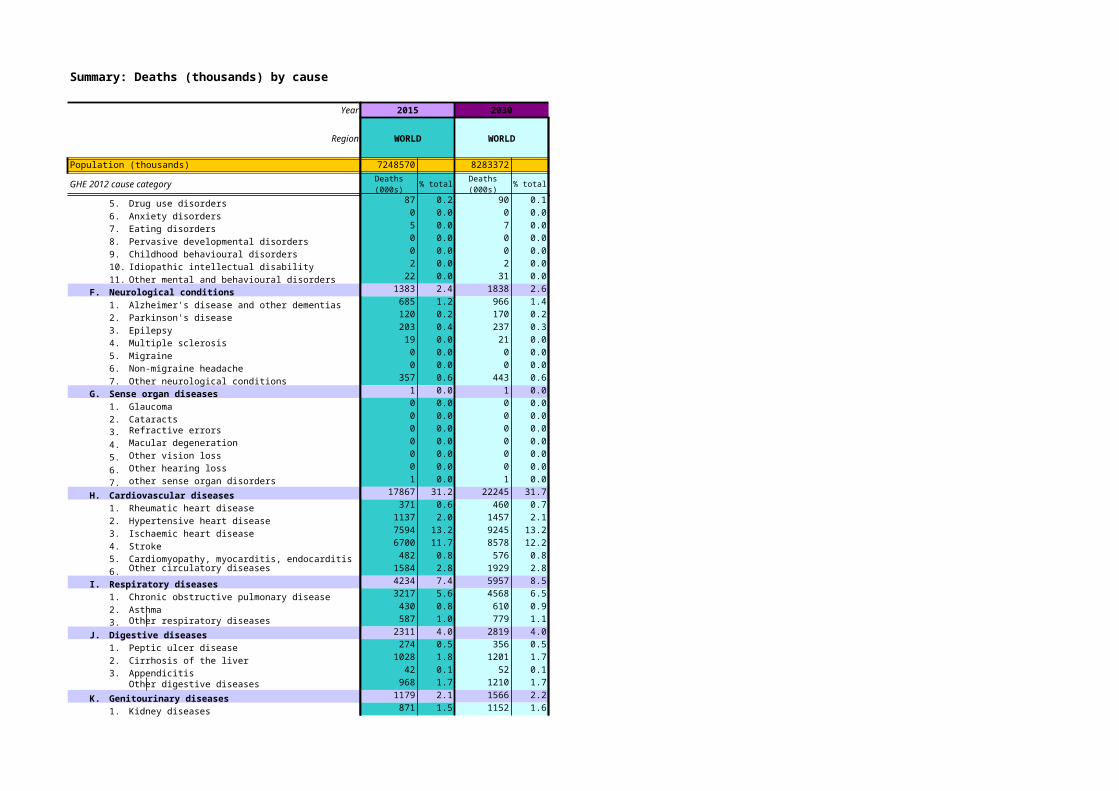
5. Drug use disorders
6. Anxiety disorders
7. Eating disorders
8. Pervasive developmental disorders
9. Childhood behavioural disorders
10. Idiopathic intellectual disability
11. Other mental and behavioural disorders
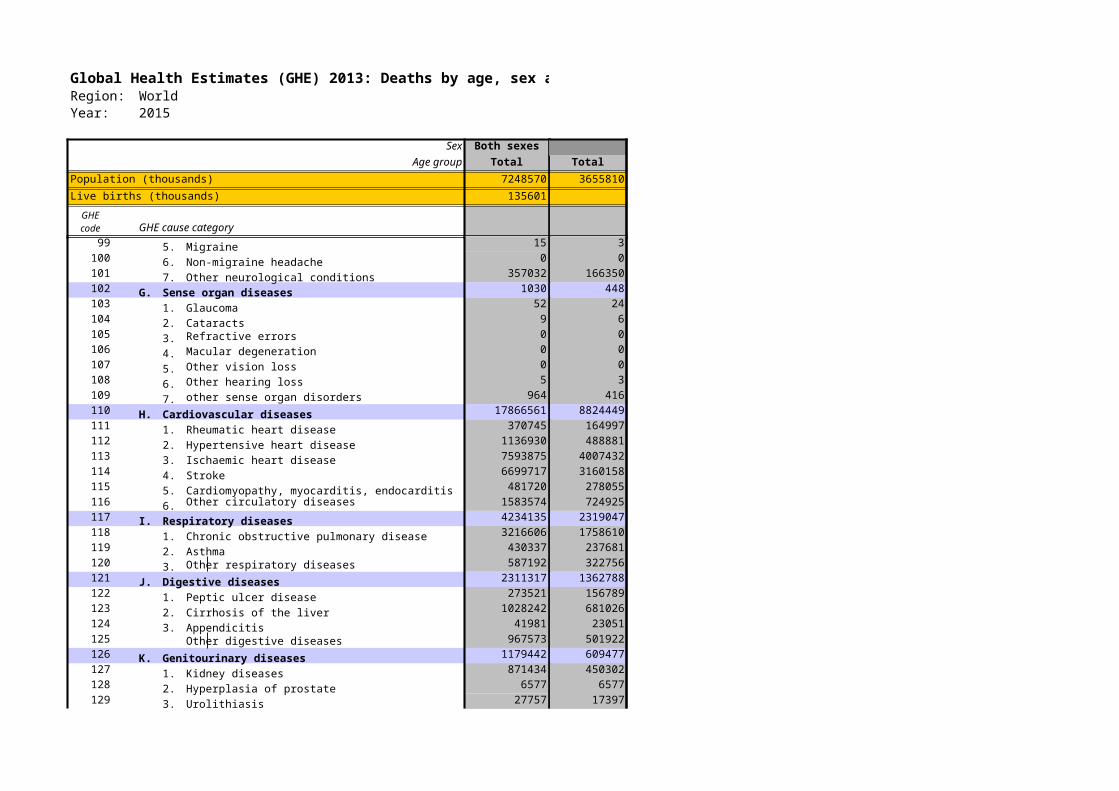
F. Neurological conditions
1. Alzheimer's disease and other dementias
2. Parkinson's disease
3. Epilepsy
4. Multiple sclerosis
5. Migraine
6. Non-migraine headache
7. Other neurological conditions
G. Sense organ diseases
1. Glaucoma
2. Cataracts
3. Refractive errors
4. Macular degeneration
5. Other vision loss
6. Other hearing loss
7. other sense organ disorders
H. Cardiovascular diseases
1. Rheumatic heart disease
2. Hypertensive heart disease
3. Ischaemic heart disease
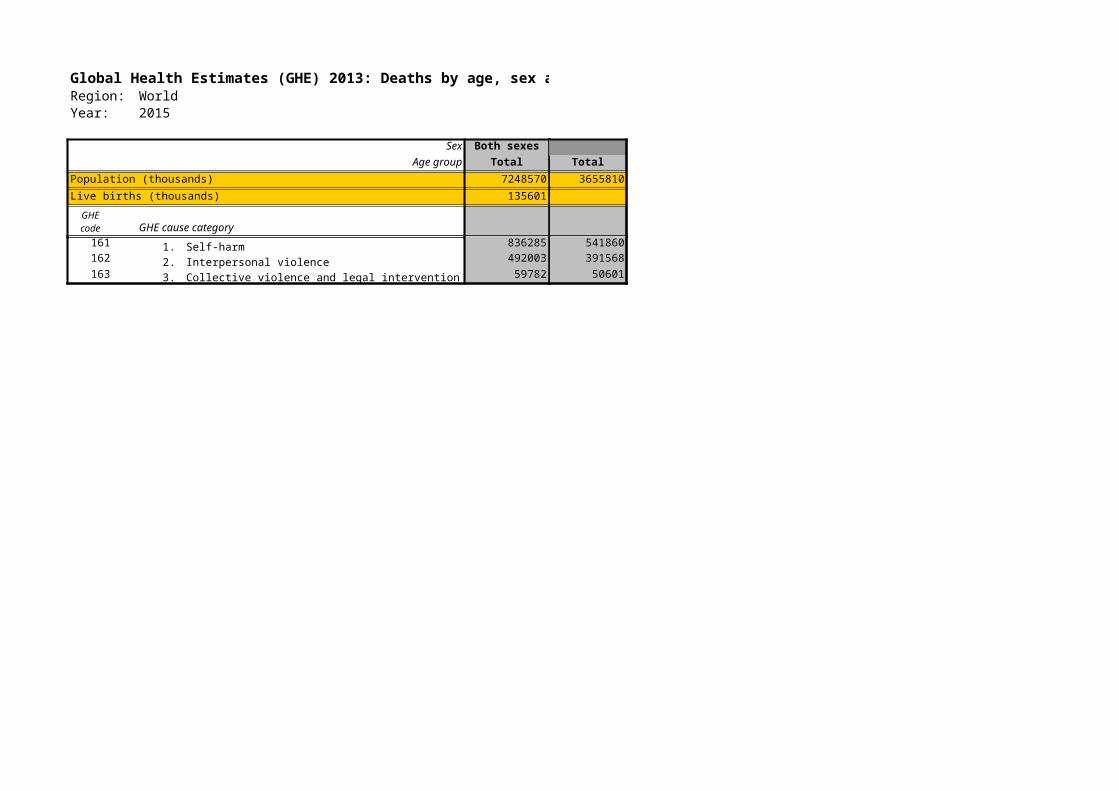
4. Stroke
5. Cardiomyopathy, myocarditis, endocarditis
6. Other circulatory diseases
I. Respiratory diseases
1. Chronic obstructive pulmonary disease
2. Asthma
3. Other respiratory diseases
J. Digestive diseases
1. Peptic ulcer disease
2. Cirrhosis of the liver
3. AppendicitisOther digestive diseases
K. Genitourinary diseases
1. Kidney diseases
Summary: Deaths (thousands) by cause
Year
Region
Population (thousands)
GHE 2012 cause category
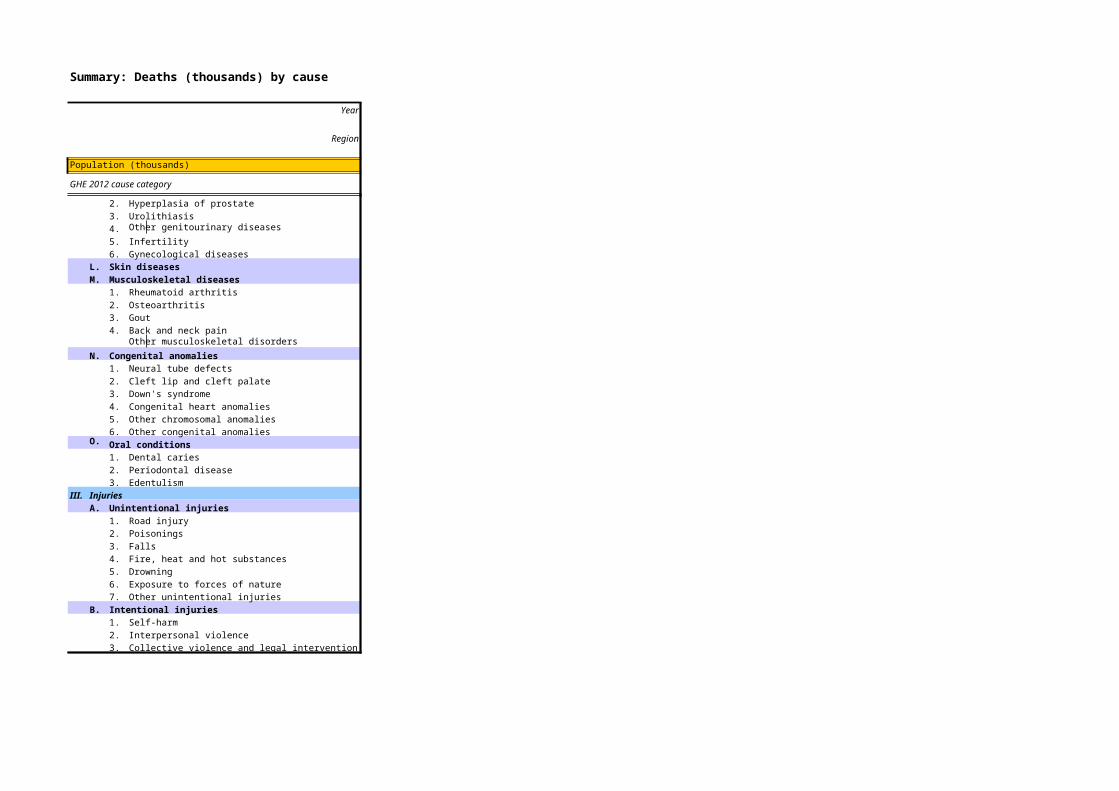
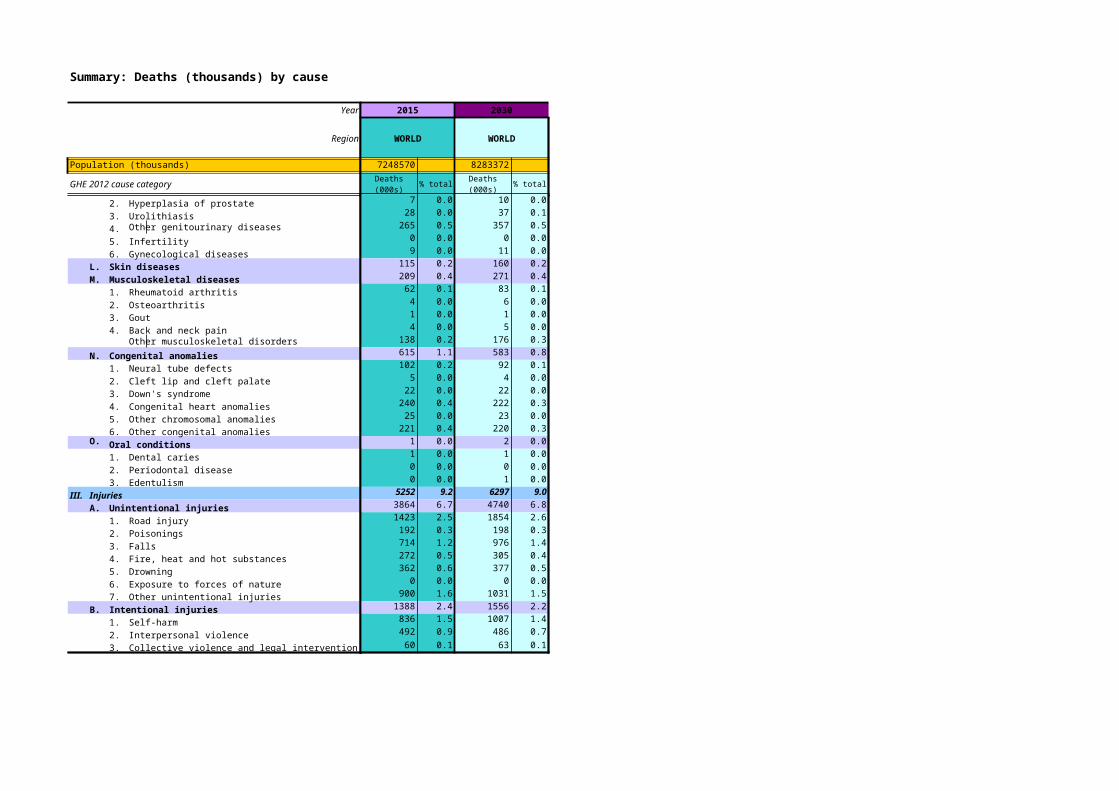
2. Hyperplasia of prostate
3. Urolithiasis
4. Other genitourinary diseases
5. Infertility
6. Gynecological diseases
L. Skin diseases
M. Musculoskeletal diseases
1. Rheumatoid arthritis
2. Osteoarthritis
3. Gout
4. Back and neck painOther musculoskeletal disorders
N. Congenital anomalies
1. Neural tube defects
2. Cleft lip and cleft palate
3. Down's syndrome
4. Congenital heart anomalies
5. Other chromosomal anomalies
6. Other congenital anomaliesO. Oral conditions
1. Dental caries
2. Periodontal disease
3. Edentulism
III. Injuries
A. Unintentional injuries
1. Road injury
2. Poisonings
3. Falls
4. Fire, heat and hot substances
5. Drowning
6. Exposure to forces of nature
7. Other unintentional injuries
B. Intentional injuries
1. Self-harm
2. Interpersonal violence
3. Collective violence and legal intervention
Summary: Deaths (thousands) by cause
Year
Region
Population (thousands)
GHE 2012 cause category
All Causes
I.
A. Infectious and parasitic diseases
1. Tuberculosis
2. STDs excluding HIV
a. Syphilis
b. Chlamydia
c. Gonorrhoea
d. Trichomoniasis
e. Other STDs
3. HIV/AIDS
4. Diarrhoeal diseases
5. Childhood-cluster diseases
a. Whooping cough
b. Diphtheria
c. Measles
d. Tetanus
6. Meningitis
7. Encephalitis
8. Acute hepatitis B
9. Acute hepatitis C
10. Parasitic and vector diseases
a. Malaria
b. Trypanosomiasis
c. Chagas disease
d. Schistosomiasis
e. Leishmaniasis
f. Lymphatic filariasis
g. Onchocerciasis
h. Leprosy
i. Dengue
j. Trachoma
k. Rabies
11. Intestinal nematode infections
a. Ascariasis
b. Trichuriasis
c. Hookworm disease
12. Other infectious diseases
B. Respiratory infections
1. Lower respiratory infections
Communicable, maternal, perinatal and nutritional conditions
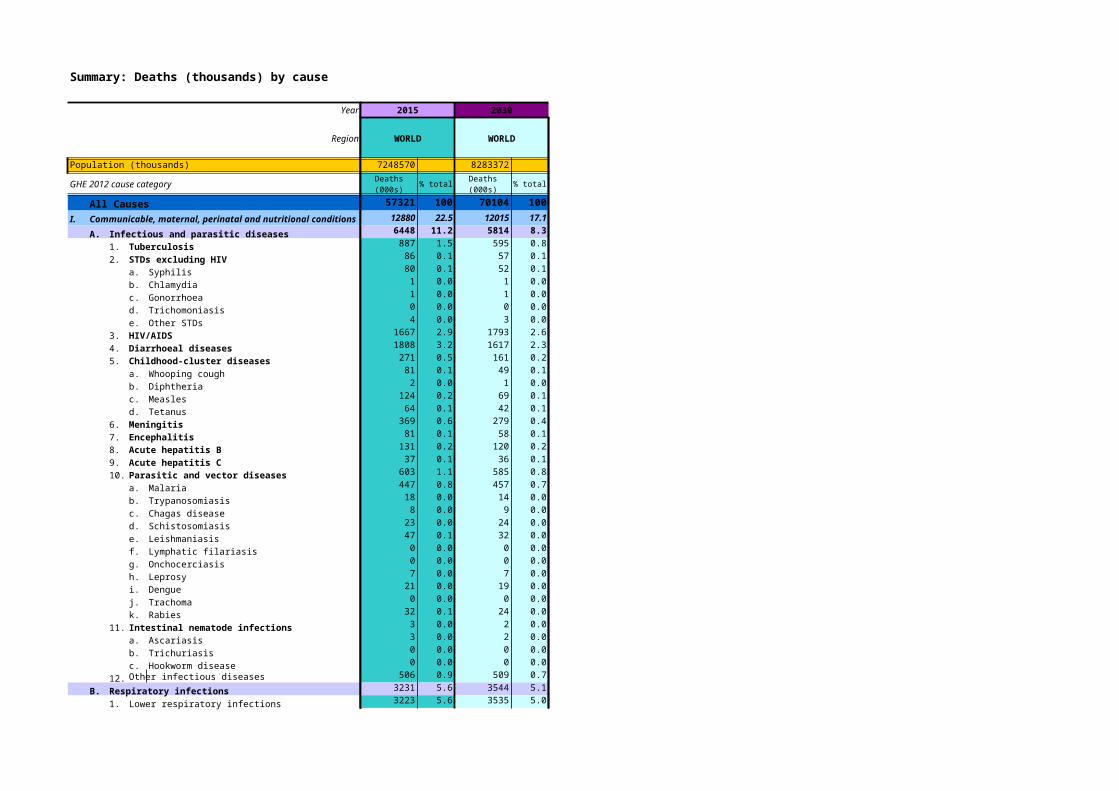
2015 2030
WORLD WORLD
7248570 8283372
% total % total
57321 100 70104 100
12880 22.5 12015 17.1
6448 11.2 5814 8.3
887 1.5 595 0.8
86 0.1 57 0.1
80 0.1 52 0.1
1 0.0 1 0.0
1 0.0 1 0.0
0 0.0 0 0.0
4 0.0 3 0.0
1667 2.9 1793 2.6
1808 3.2 1617 2.3
271 0.5 161 0.2
81 0.1 49 0.1
2 0.0 1 0.0
124 0.2 69 0.1
64 0.1 42 0.1
369 0.6 279 0.4
81 0.1 58 0.1
131 0.2 120 0.2
37 0.1 36 0.1
603 1.1 585 0.8
447 0.8 457 0.7
18 0.0 14 0.0
8 0.0 9 0.0
23 0.0 24 0.0
47 0.1 32 0.0
0 0.0 0 0.0
0 0.0 0 0.0
7 0.0 7 0.0
21 0.0 19 0.0
0 0.0 0 0.0
32 0.1 24 0.0
3 0.0 2 0.0
3 0.0 2 0.0
0 0.0 0 0.0
0 0.0 0 0.0
506 0.9 509 0.7
3231 5.6 3544 5.1
3223 5.6 3535 5.0
Deaths (000s)
Deaths (000s)
Summary: Deaths (thousands) by cause
Year
Region
Population (thousands)
GHE 2012 cause category
2. Upper respiratory infections
3. Otitis media
C. Maternal conditions
D. Neonatal conditions
1. Preterm birth complications
2. Birth asphyxia and birth trauma
3. Neonatal sepsis and infections
4. Other neonatal conditions
E. Nutritional deficiencies
1. Protein-energy malnutrition
2. Iodine deficiency
3. Vitamin A deficiency
4. Iron-deficiency anaemia
5. Other nutritional deficiencies
II. Noncommunicable diseases
A. Malignant neoplasms
1. Mouth and oropharynx cancers
2. Oesophagus cancer
3. Stomach cancer
4. Colon and rectum cancers
5. Liver cancer
6. Pancreas cancer
7. Trachea, bronchus, lung cancers
8. Melanoma and other skin cancers
9. Breast cancer
10. Cervix uteri cancer
11. Corpus uteri cancer
12. Ovary cancer
13. Prostate cancer
14. Bladder cancer
15. Lymphomas, multiple myeloma
16. LeukaemiaOther malignant neoplasms
B. Other neoplasms
C. Diabetes mellitus
D. Endocrine, blood, immune disorders
E. Mental and behavioral disorders
1. Unipolar depressive disorders
2. Bipolar disorder
3. Schizophrenia
4. Alcohol use disorders
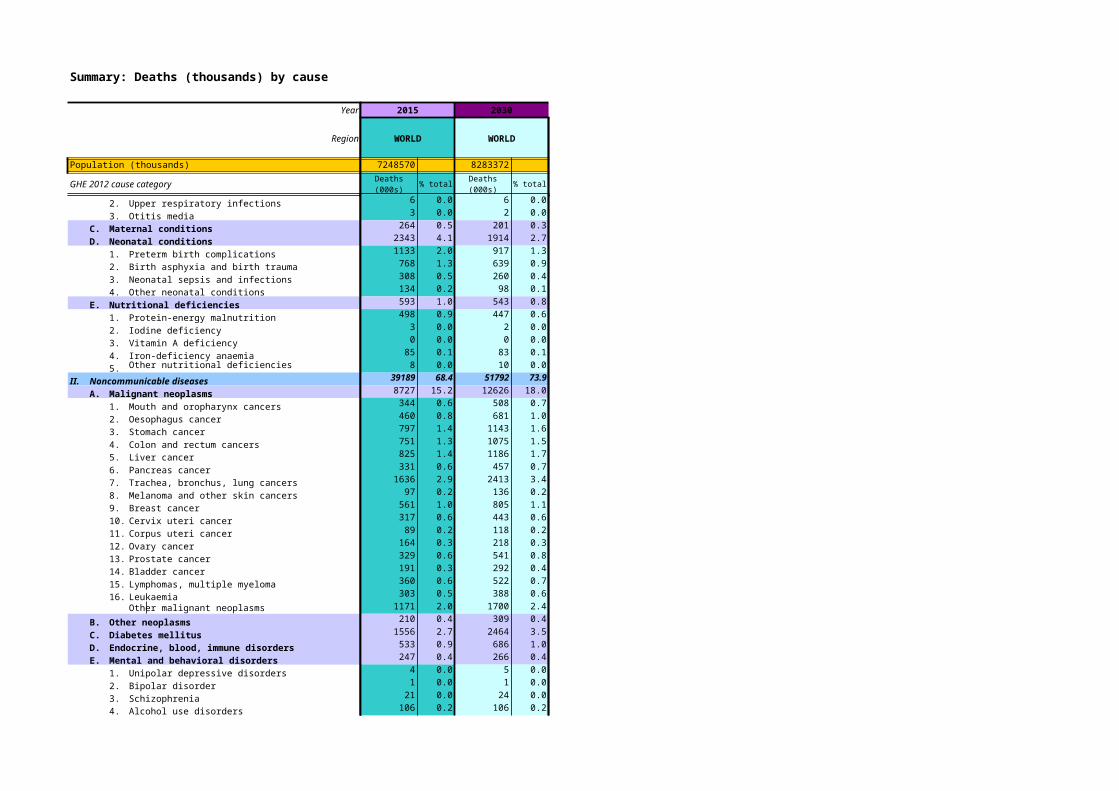
2015 2030
WORLD WORLD
7248570 8283372
% total % totalDeaths (000s)
Deaths (000s)
6 0.0 6 0.0
3 0.0 2 0.0
264 0.5 201 0.3
2343 4.1 1914 2.7
1133 2.0 917 1.3
768 1.3 639 0.9
308 0.5 260 0.4
134 0.2 98 0.1
593 1.0 543 0.8
498 0.9 447 0.6
3 0.0 2 0.0
0 0.0 0 0.0
85 0.1 83 0.1
8 0.0 10 0.0
39189 68.4 51792 73.9
8727 15.2 12626 18.0
344 0.6 508 0.7
460 0.8 681 1.0
797 1.4 1143 1.6
751 1.3 1075 1.5
825 1.4 1186 1.7
331 0.6 457 0.7
1636 2.9 2413 3.4
97 0.2 136 0.2
561 1.0 805 1.1
317 0.6 443 0.6
89 0.2 118 0.2
164 0.3 218 0.3
329 0.6 541 0.8
191 0.3 292 0.4
360 0.6 522 0.7
303 0.5 388 0.6
1171 2.0 1700 2.4
210 0.4 309 0.4
1556 2.7 2464 3.5
533 0.9 686 1.0
247 0.4 266 0.4
4 0.0 5 0.0
1 0.0 1 0.0
21 0.0 24 0.0
106 0.2 106 0.2
Summary: Deaths (thousands) by cause
Year
Region
Population (thousands)
GHE 2012 cause category
5. Drug use disorders
6. Anxiety disorders
7. Eating disorders
8. Pervasive developmental disorders
9. Childhood behavioural disorders
10. Idiopathic intellectual disability
11. Other mental and behavioural disorders
F. Neurological conditions
1. Alzheimer's disease and other dementias
2. Parkinson's disease
3. Epilepsy
4. Multiple sclerosis
5. Migraine
6. Non-migraine headache
7. Other neurological conditions
G. Sense organ diseases
1. Glaucoma
2. Cataracts
3. Refractive errors
4. Macular degeneration
5. Other vision loss
6. Other hearing loss
7. other sense organ disorders
H. Cardiovascular diseases
1. Rheumatic heart disease
2. Hypertensive heart disease
3. Ischaemic heart disease
4. Stroke
5. Cardiomyopathy, myocarditis, endocarditis
6. Other circulatory diseases
I. Respiratory diseases
1. Chronic obstructive pulmonary disease
2. Asthma
3. Other respiratory diseases
J. Digestive diseases
1. Peptic ulcer disease
2. Cirrhosis of the liver
3. AppendicitisOther digestive diseases
K. Genitourinary diseases
1. Kidney diseases
2015 2030
WORLD WORLD
7248570 8283372
% total % totalDeaths (000s)
Deaths (000s)
87 0.2 90 0.1
0 0.0 0 0.0
5 0.0 7 0.0
0 0.0 0 0.0
0 0.0 0 0.0
2 0.0 2 0.0
22 0.0 31 0.0
1383 2.4 1838 2.6
685 1.2 966 1.4
120 0.2 170 0.2
203 0.4 237 0.3
19 0.0 21 0.0
0 0.0 0 0.0
0 0.0 0 0.0
357 0.6 443 0.6
1 0.0 1 0.0
0 0.0 0 0.0
0 0.0 0 0.0
0 0.0 0 0.0
0 0.0 0 0.0
0 0.0 0 0.0
0 0.0 0 0.0
1 0.0 1 0.0
17867 31.2 22245 31.7
371 0.6 460 0.7
1137 2.0 1457 2.1
7594 13.2 9245 13.2
6700 11.7 8578 12.2
482 0.8 576 0.8
1584 2.8 1929 2.8
4234 7.4 5957 8.5
3217 5.6 4568 6.5
430 0.8 610 0.9
587 1.0 779 1.1
2311 4.0 2819 4.0
274 0.5 356 0.5
1028 1.8 1201 1.7
42 0.1 52 0.1
968 1.7 1210 1.7
1179 2.1 1566 2.2
871 1.5 1152 1.6
Summary: Deaths (thousands) by cause
Year
Region
Population (thousands)
GHE 2012 cause category
2. Hyperplasia of prostate
3. Urolithiasis
4. Other genitourinary diseases
5. Infertility
6. Gynecological diseases
L. Skin diseases
M. Musculoskeletal diseases
1. Rheumatoid arthritis
2. Osteoarthritis
3. Gout
4. Back and neck painOther musculoskeletal disorders
N. Congenital anomalies
1. Neural tube defects
2. Cleft lip and cleft palate
3. Down's syndrome
4. Congenital heart anomalies
5. Other chromosomal anomalies
6. Other congenital anomaliesO. Oral conditions
1. Dental caries
2. Periodontal disease
3. Edentulism
III. Injuries
A. Unintentional injuries
1. Road injury
2. Poisonings
3. Falls
4. Fire, heat and hot substances
5. Drowning
6. Exposure to forces of nature
7. Other unintentional injuries
B. Intentional injuries
1. Self-harm
2. Interpersonal violence
3. Collective violence and legal intervention
2015 2030
WORLD WORLD
7248570 8283372
% total % totalDeaths (000s)
Deaths (000s)
7 0.0 10 0.0
28 0.0 37 0.1
265 0.5 357 0.5
0 0.0 0 0.0
9 0.0 11 0.0
115 0.2 160 0.2
209 0.4 271 0.4
62 0.1 83 0.1
4 0.0 6 0.0
1 0.0 1 0.0
4 0.0 5 0.0
138 0.2 176 0.3
615 1.1 583 0.8
102 0.2 92 0.1
5 0.0 4 0.0
22 0.0 22 0.0
240 0.4 222 0.3
25 0.0 23 0.0
221 0.4 220 0.3
1 0.0 2 0.0
1 0.0 1 0.0
0 0.0 0 0.0
0 0.0 1 0.0
5252 9.2 6297 9.0
3864 6.7 4740 6.8
1423 2.5 1854 2.6
192 0.3 198 0.3
714 1.2 976 1.4
272 0.5 305 0.4
362 0.6 377 0.5
0 0.0 0 0.0
900 1.6 1031 1.5
1388 2.4 1556 2.2
836 1.5 1007 1.4
492 0.9 486 0.7
60 0.1 63 0.1
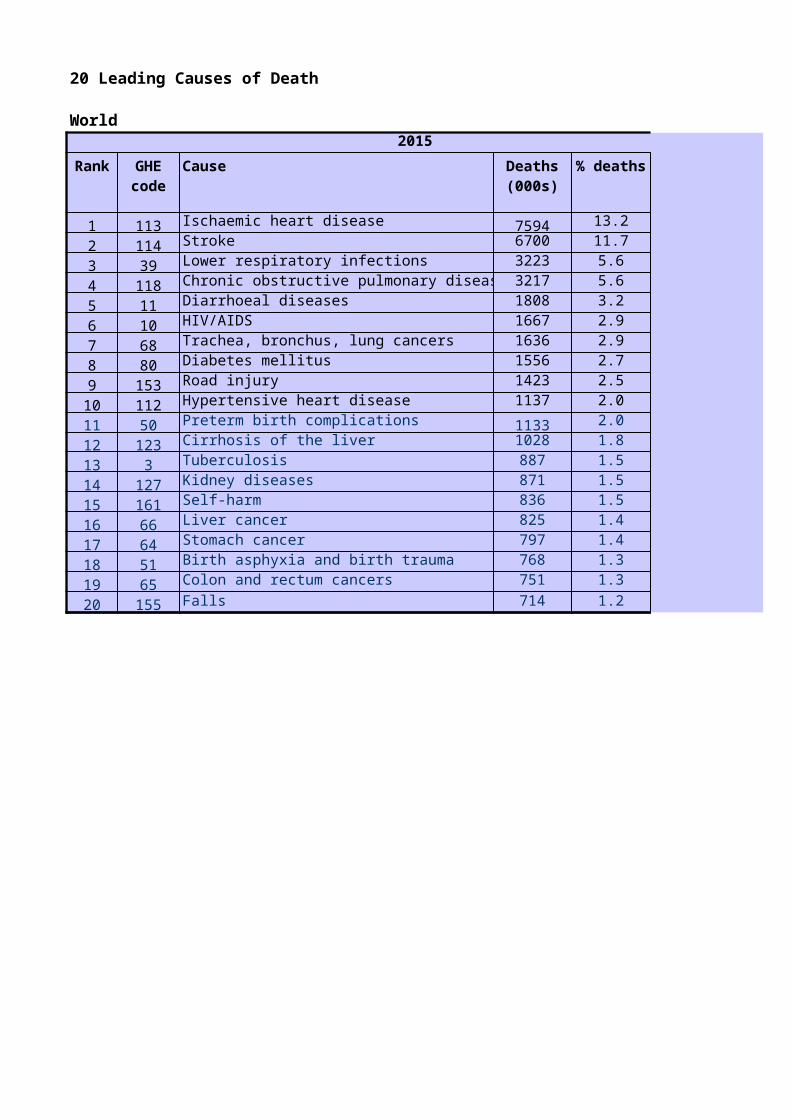
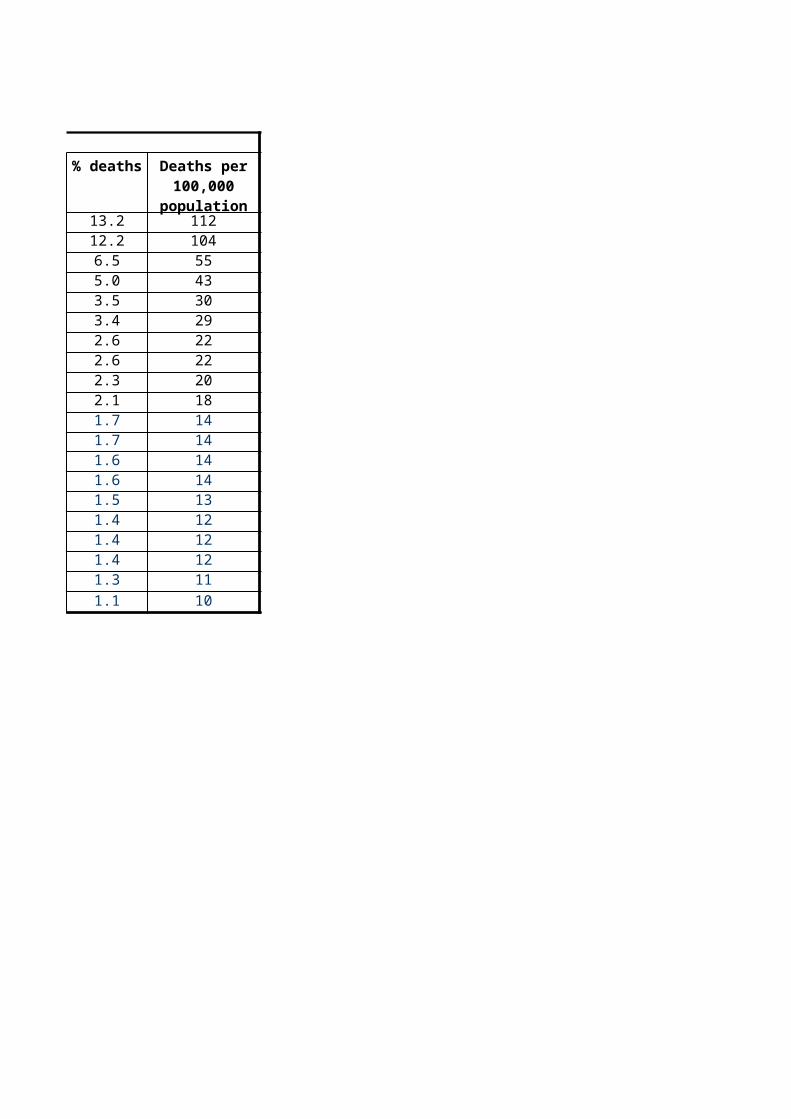
20 Leading Causes of Death
World2015 2030
Rank Cause % deaths Rank
1 113 Ischaemic heart disease 7594 13.2 105 12 114 Stroke 6700 11.7 92 23 39 Lower respiratory infections 3223 5.6 44 34 118 Chronic obstructive pulmonary disease 3217 5.6 44 45 11 Diarrhoeal diseases 1808 3.2 25 56 10 HIV/AIDS 1667 2.9 23 67 68 Trachea, bronchus, lung cancers 1636 2.9 23 78 80 Diabetes mellitus 1556 2.7 21 89 153 Road injury 1423 2.5 20 9
10 112 Hypertensive heart disease 1137 2.0 16 1011 50 Preterm birth complications 1133 2.0 16 1112 123 Cirrhosis of the liver 1028 1.8 14 1213 3 Tuberculosis 887 1.5 12 1314 127 Kidney diseases 871 1.5 12 1415 161 Self-harm 836 1.5 12 1516 66 Liver cancer 825 1.4 11 1617 64 Stomach cancer 797 1.4 11 1718 51 Birth asphyxia and birth trauma 768 1.3 11 1819 65 Colon and rectum cancers 751 1.3 10 1920 155 Falls 714 1.2 10 20
GHE code
Deaths (000s)
Deaths per 100,000
population
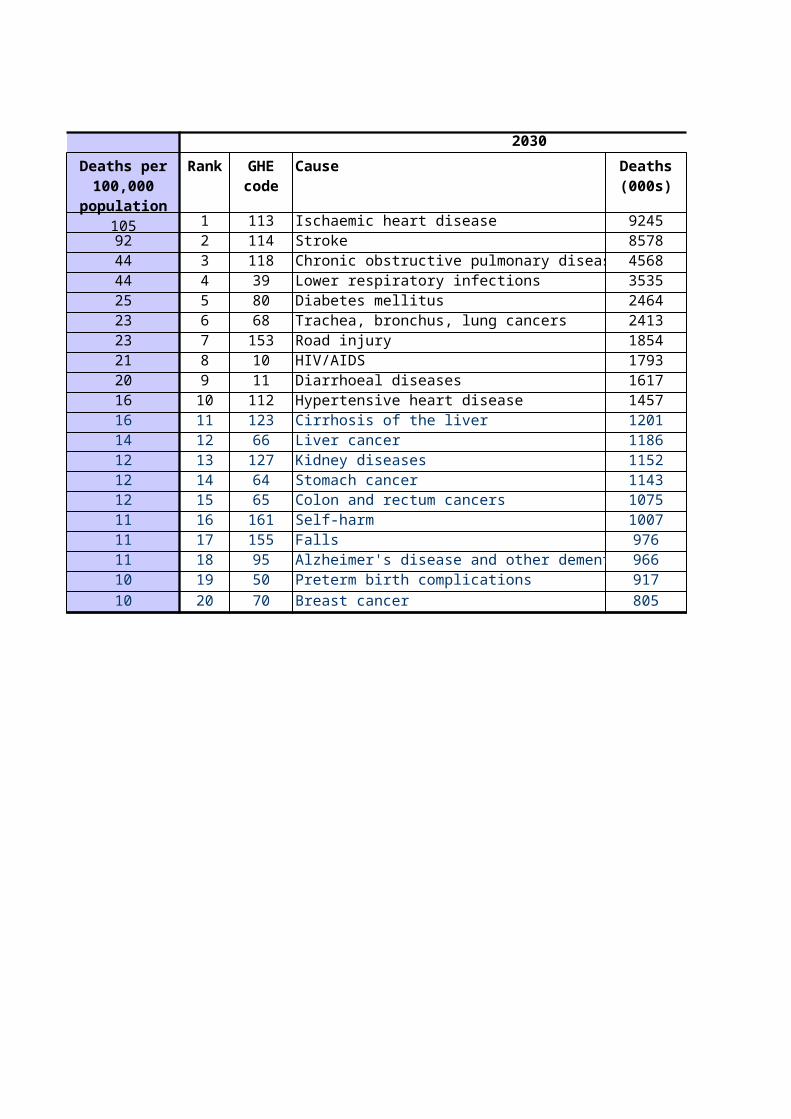
2030Cause % deaths
113 Ischaemic heart disease 9245 13.2 112114 Stroke 8578 12.2 104118 Chronic obstructive pulmonary disease 4568 6.5 5539 Lower respiratory infections 3535 5.0 4380 Diabetes mellitus 2464 3.5 3068 Trachea, bronchus, lung cancers 2413 3.4 29
153 Road injury 1854 2.6 2210 HIV/AIDS 1793 2.6 2211 Diarrhoeal diseases 1617 2.3 20
112 Hypertensive heart disease 1457 2.1 18123 Cirrhosis of the liver 1201 1.7 1466 Liver cancer 1186 1.7 14
127 Kidney diseases 1152 1.6 1464 Stomach cancer 1143 1.6 1465 Colon and rectum cancers 1075 1.5 13
161 Self-harm 1007 1.4 12155 Falls 976 1.4 1295 Alzheimer's disease and other dementias 966 1.4 1250 Preterm birth complications 917 1.3 1170 Breast cancer 805 1.1 10
GHE code
Deaths (000s)
Deaths per 100,000
population
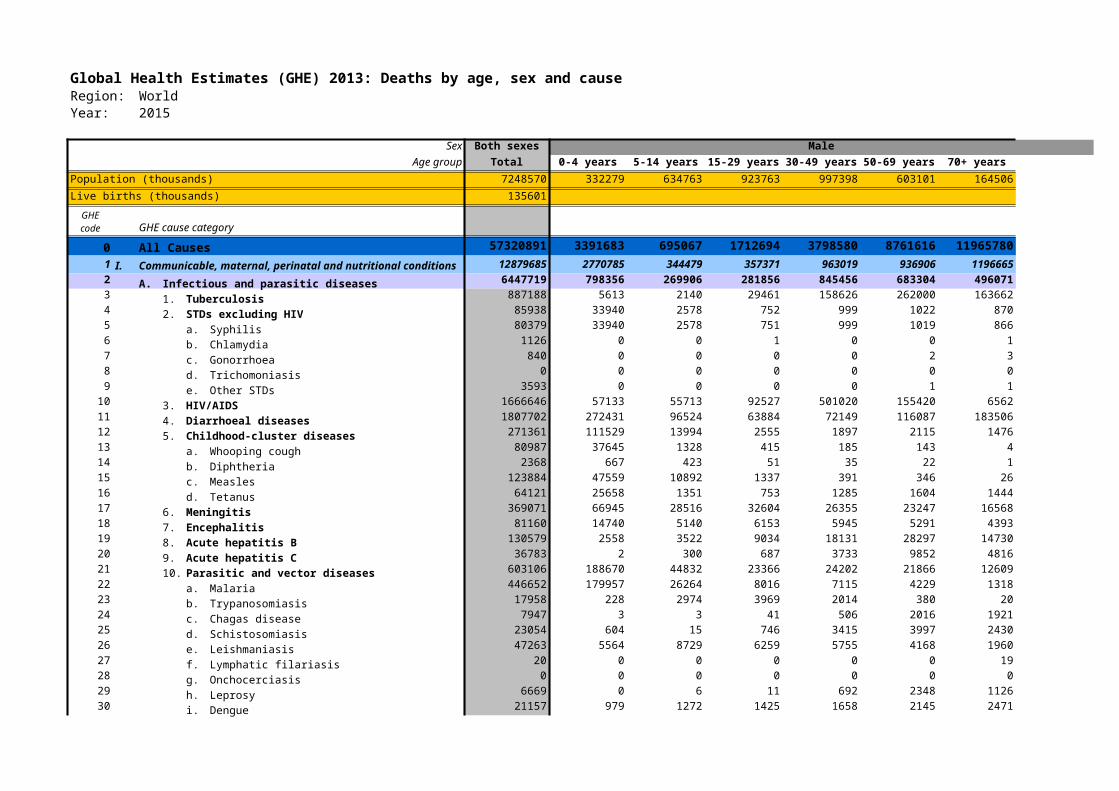
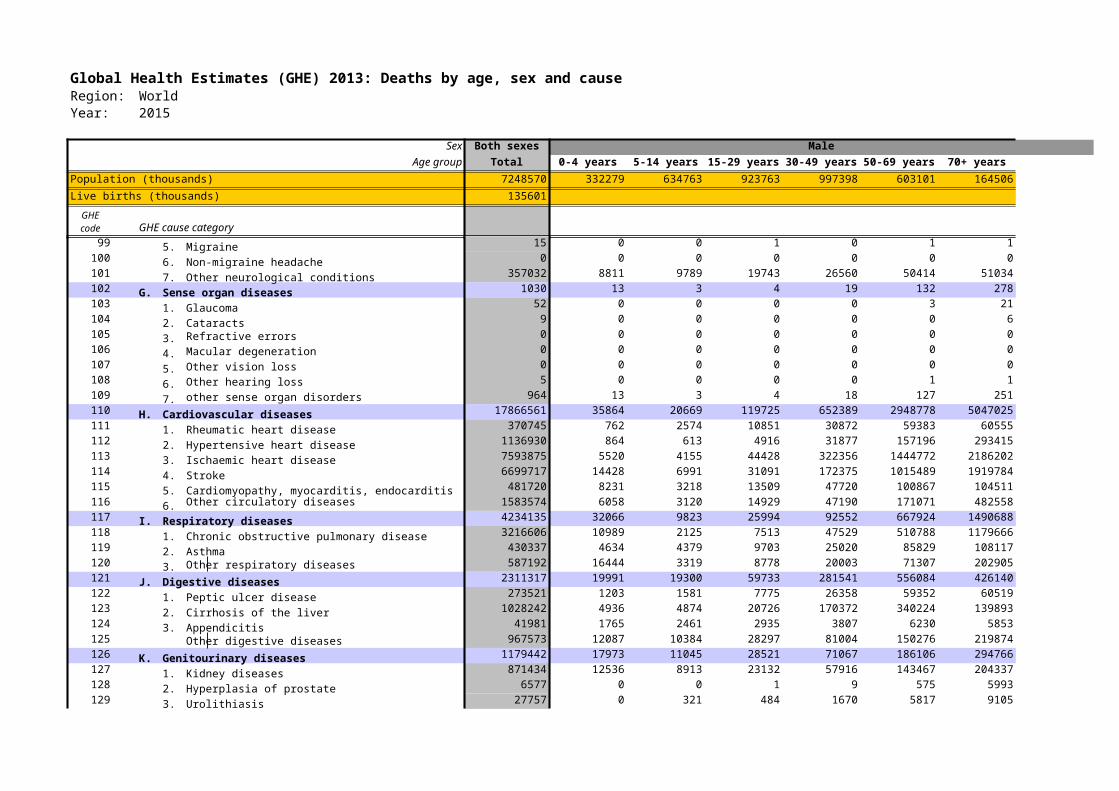
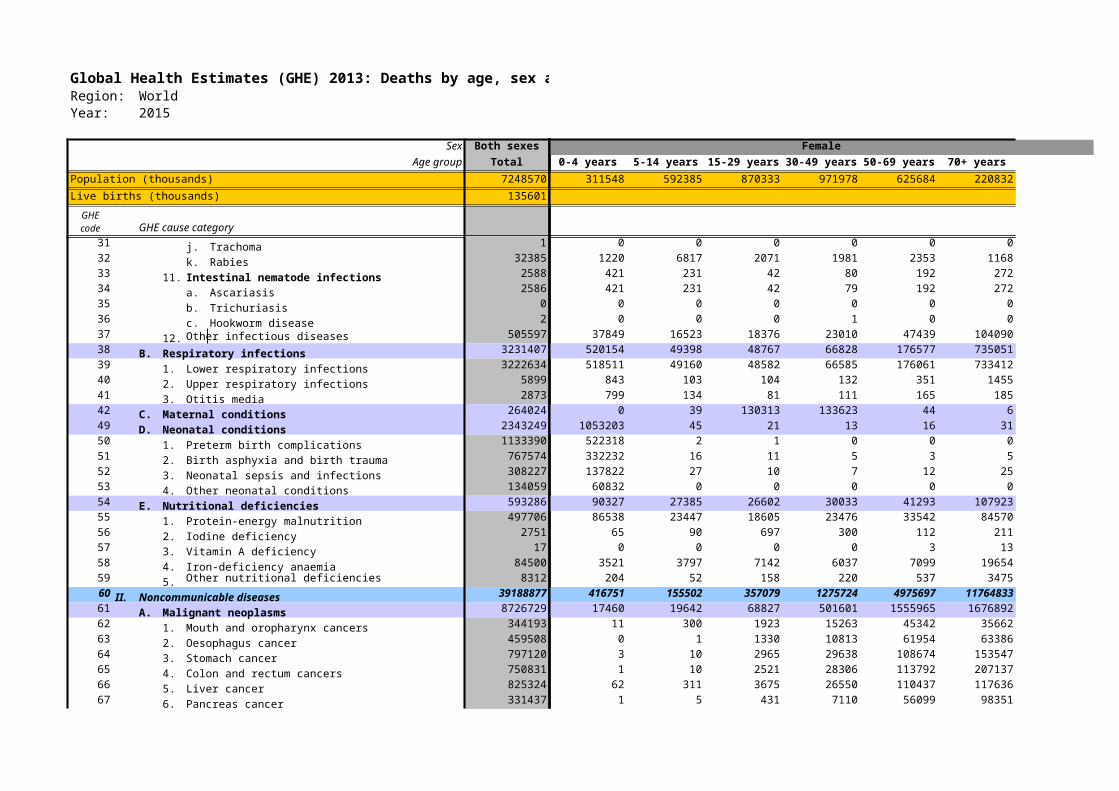
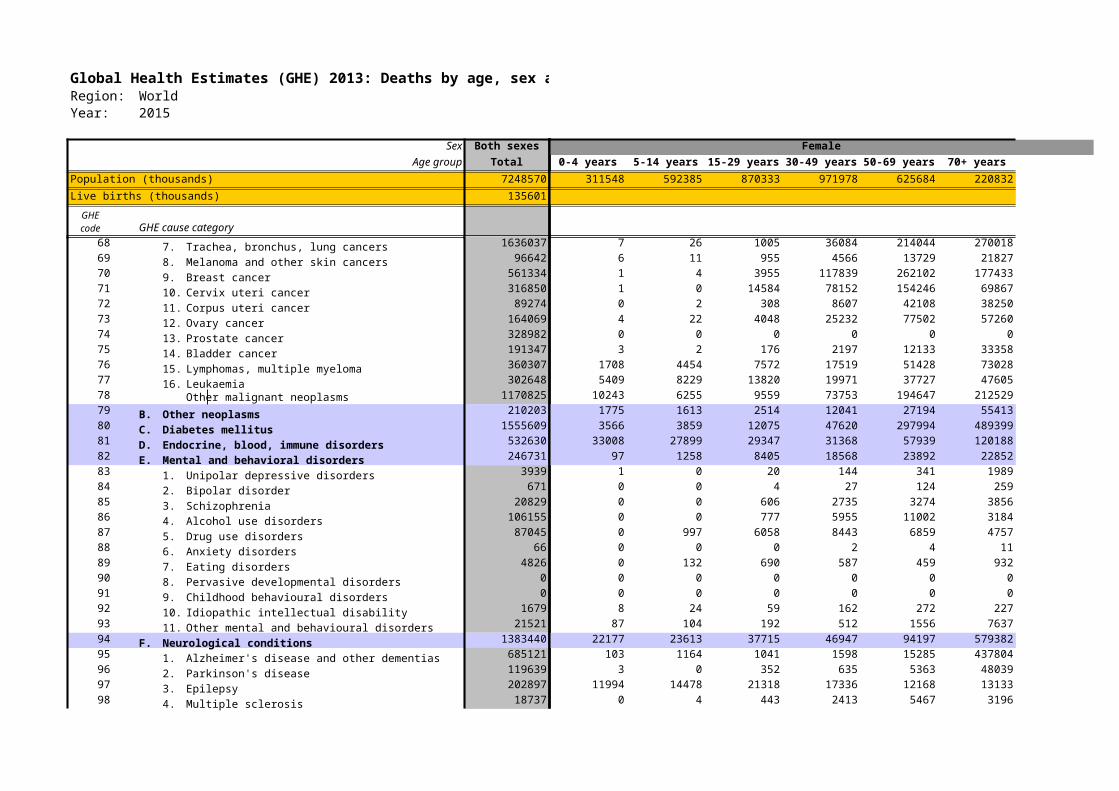
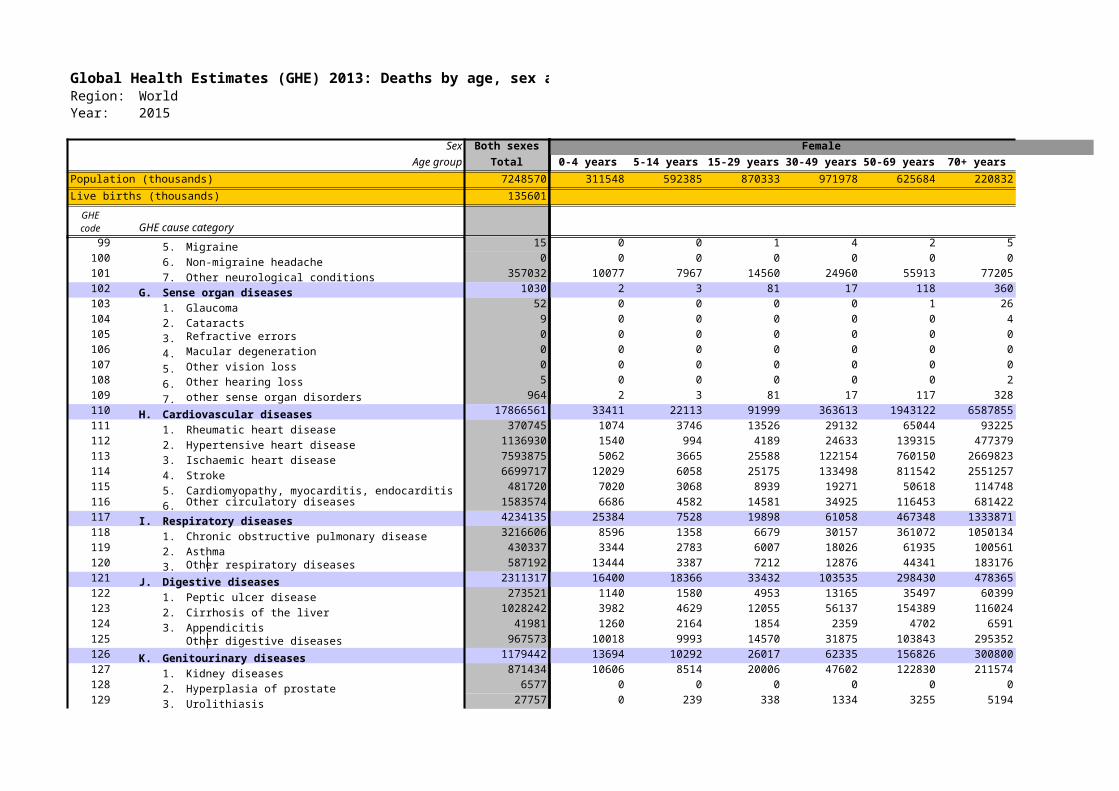
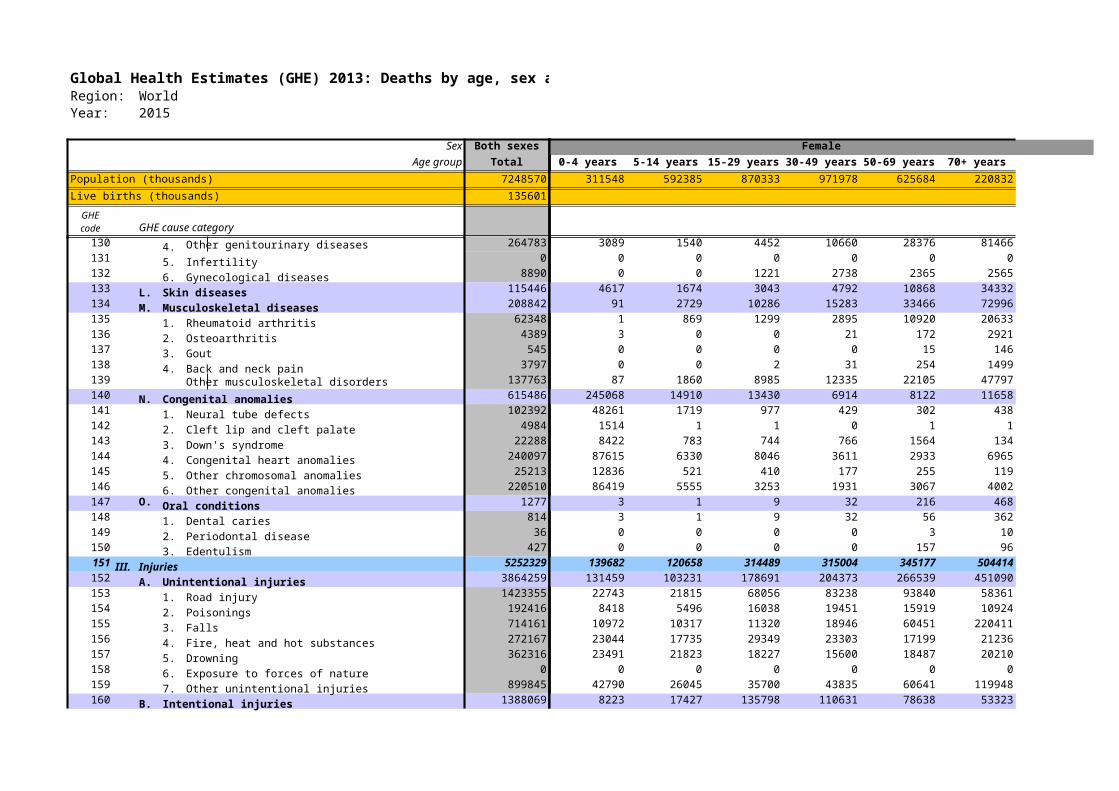
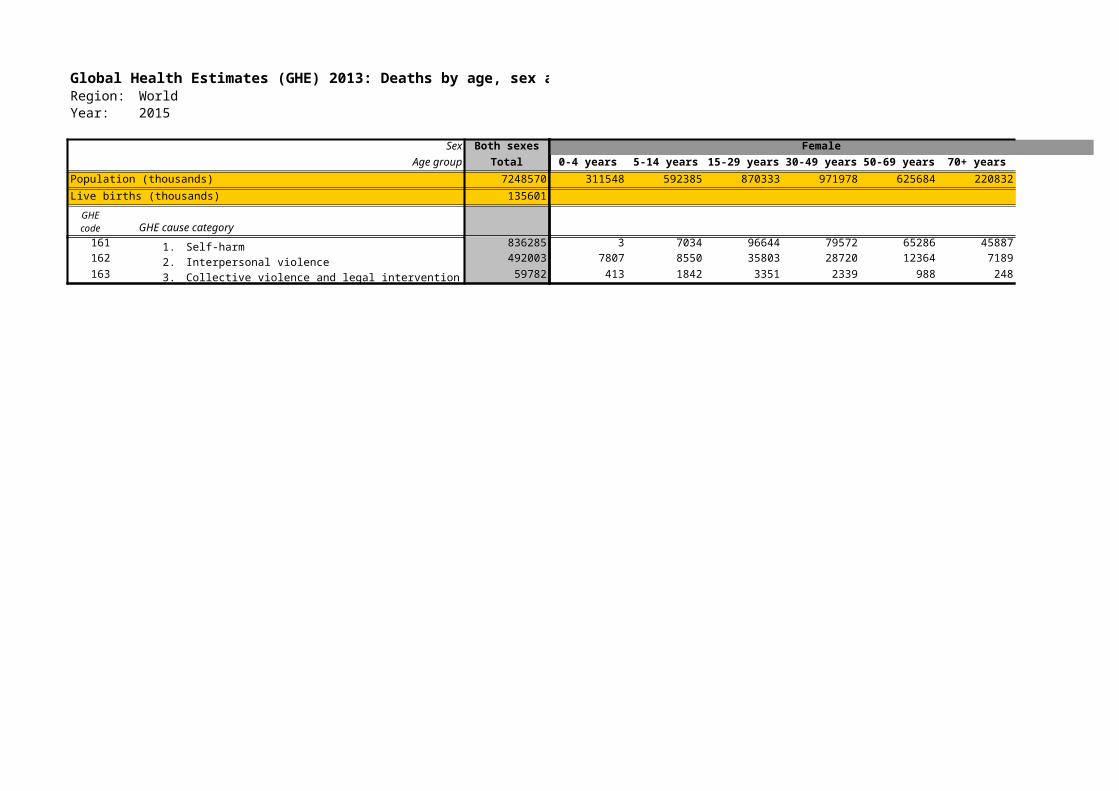
Global Health Estimates (GHE) 2013: Deaths by age, sex and causeRegion: WorldYear: 2015
Sex Both sexes Male
Age group Total 0-4 years 5-14 years 15-29 years 30-49 years 50-69 years 70+ years Total
Population (thousands) 7248570 332279 634763 923763 997398 603101 164506 3655810
Live births (thousands) 135601
GHE cause category
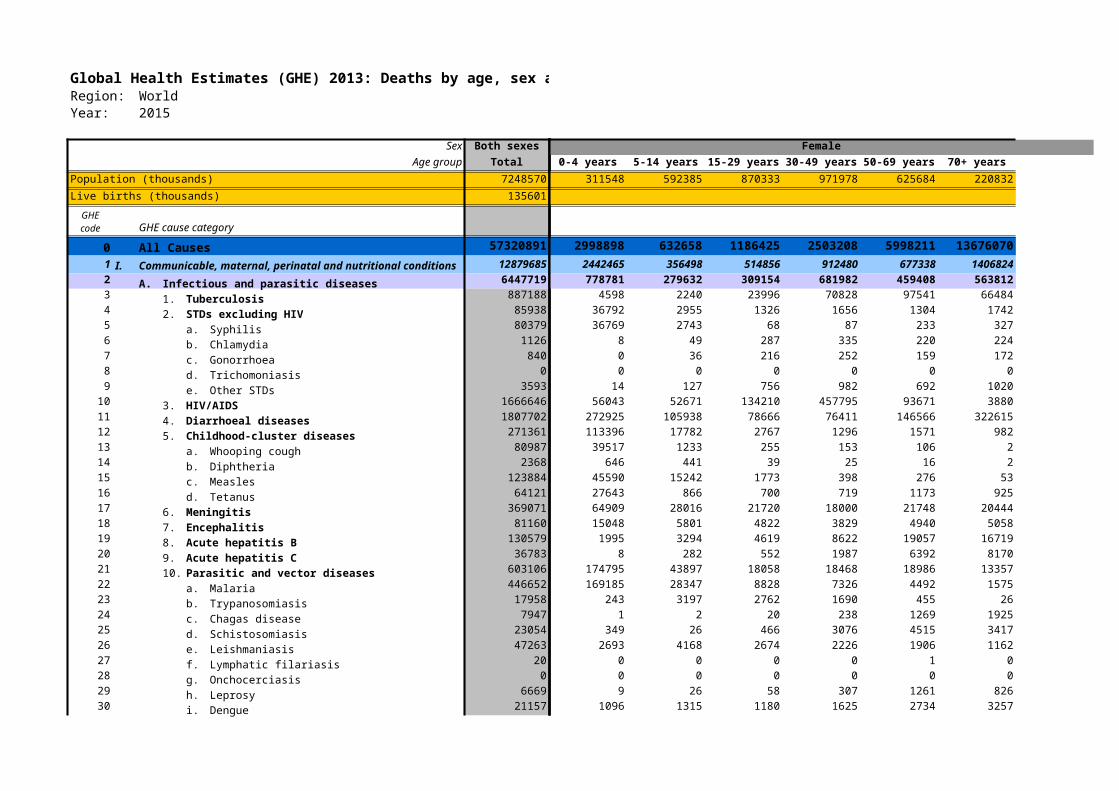
0 All Causes 57320891 3391683 695067 1712694 3798580 8761616 11965780 30325421
1 I. 12879685 2770785 344479 357371 963019 936906 1196665 6569225
2 A. Infectious and parasitic diseases 6447719 798356 269906 281856 845456 683304 496071 3374950
3 1. Tuberculosis 887188 5613 2140 29461 158626 262000 163662 621502
4 2. STDs excluding HIV 85938 33940 2578 752 999 1022 870 40162
5 a. Syphilis 80379 33940 2578 751 999 1019 866 40152
6 b. Chlamydia 1126 0 0 1 0 0 1 3
7 c. Gonorrhoea 840 0 0 0 0 2 3 5
8 d. Trichomoniasis 0 0 0 0 0 0 0 0
9 e. Other STDs 3593 0 0 0 0 1 1 2
10 3. HIV/AIDS 1666646 57133 55713 92527 501020 155420 6562 868375
11 4. Diarrhoeal diseases 1807702 272431 96524 63884 72149 116087 183506 804581
12 5. Childhood-cluster diseases 271361 111529 13994 2555 1897 2115 1476 133567
13 a. Whooping cough 80987 37645 1328 415 185 143 4 39720
14 b. Diphtheria 2368 667 423 51 35 22 1 1200
15 c. Measles 123884 47559 10892 1337 391 346 26 60552
16 d. Tetanus 64121 25658 1351 753 1285 1604 1444 32095
17 6. Meningitis 369071 66945 28516 32604 26355 23247 16568 194234
18 7. Encephalitis 81160 14740 5140 6153 5945 5291 4393 41662
19 8. Acute hepatitis B 130579 2558 3522 9034 18131 28297 14730 76272
20 9. Acute hepatitis C 36783 2 300 687 3733 9852 4816 19391
21 10. Parasitic and vector diseases 603106 188670 44832 23366 24202 21866 12609 315545
22 a. Malaria 446652 179957 26264 8016 7115 4229 1318 226899
23 b. Trypanosomiasis 17958 228 2974 3969 2014 380 20 9584
24 c. Chagas disease 7947 3 3 41 506 2016 1921 4491
25 d. Schistosomiasis 23054 604 15 746 3415 3997 2430 11206
26 e. Leishmaniasis 47263 5564 8729 6259 5755 4168 1960 32434
27 f. Lymphatic filariasis 20 0 0 0 0 0 19 19
28 g. Onchocerciasis 0 0 0 0 0 0 0 0
29 h. Leprosy 6669 0 6 11 692 2348 1126 4184
30 i. Dengue 21157 979 1272 1425 1658 2145 2471 9951
GHE code
Communicable, maternal, perinatal and nutritional conditions
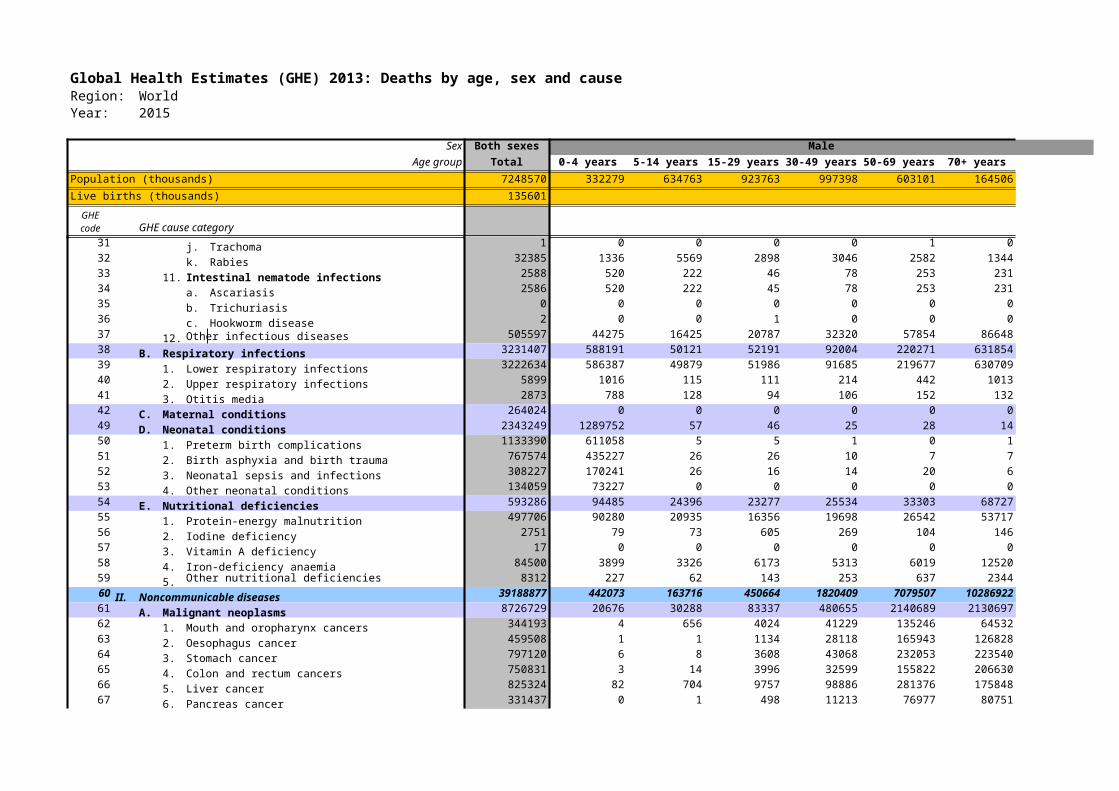
Global Health Estimates (GHE) 2013: Deaths by age, sex and causeRegion: WorldYear: 2015
Sex Both sexes Male
Age group Total 0-4 years 5-14 years 15-29 years 30-49 years 50-69 years 70+ years Total
Population (thousands) 7248570 332279 634763 923763 997398 603101 164506 3655810
Live births (thousands) 135601
GHE cause categoryGHE code
31 j. Trachoma 1 0 0 0 0 1 0 1
32 k. Rabies 32385 1336 5569 2898 3046 2582 1344 16775
33 11. Intestinal nematode infections 2588 520 222 46 78 253 231 1351
34 a. Ascariasis 2586 520 222 45 78 253 231 1349
35 b. Trichuriasis 0 0 0 0 0 0 0 0
36 c. Hookworm disease 2 0 0 1 0 0 0 1
37 12. Other infectious diseases 505597 44275 16425 20787 32320 57854 86648 258310
38 B. Respiratory infections 3231407 588191 50121 52191 92004 220271 631854 1634632
39 1. Lower respiratory infections 3222634 586387 49879 51986 91685 219677 630709 1630324
40 2. Upper respiratory infections 5899 1016 115 111 214 442 1013 2910
41 3. Otitis media 2873 788 128 94 106 152 132 1398
42 C. Maternal conditions 264024 0 0 0 0 0 0 0
49 D. Neonatal conditions 2343249 1289752 57 46 25 28 14 1289921
50 1. Preterm birth complications 1133390 611058 5 5 1 0 1 611069
51 2. Birth asphyxia and birth trauma 767574 435227 26 26 10 7 7 435302
52 3. Neonatal sepsis and infections 308227 170241 26 16 14 20 6 170324
53 4. Other neonatal conditions 134059 73227 0 0 0 0 0 73227
54 E. Nutritional deficiencies 593286 94485 24396 23277 25534 33303 68727 269721
55 1. Protein-energy malnutrition 497706 90280 20935 16356 19698 26542 53717 227528
56 2. Iodine deficiency 2751 79 73 605 269 104 146 1276
57 3. Vitamin A deficiency 17 0 0 0 0 0 0 0
58 4. Iron-deficiency anaemia 84500 3899 3326 6173 5313 6019 12520 37251
59 5. Other nutritional deficiencies 8312 227 62 143 253 637 2344 3666
60 II. Noncommunicable diseases 39188877 442073 163716 450664 1820409 7079507 10286922 20243290
61 A. Malignant neoplasms 8726729 20676 30288 83337 480655 2140689 2130697 4886341
62 1. Mouth and oropharynx cancers 344193 4 656 4024 41229 135246 64532 245691
63 2. Oesophagus cancer 459508 1 1 1134 28118 165943 126828 322025
64 3. Stomach cancer 797120 6 8 3608 43068 232053 223540 502283
65 4. Colon and rectum cancers 750831 3 14 3996 32599 155822 206630 399065
66 5. Liver cancer 825324 82 704 9757 98886 281376 175848 566653
67 6. Pancreas cancer 331437 0 1 498 11213 76977 80751 169441
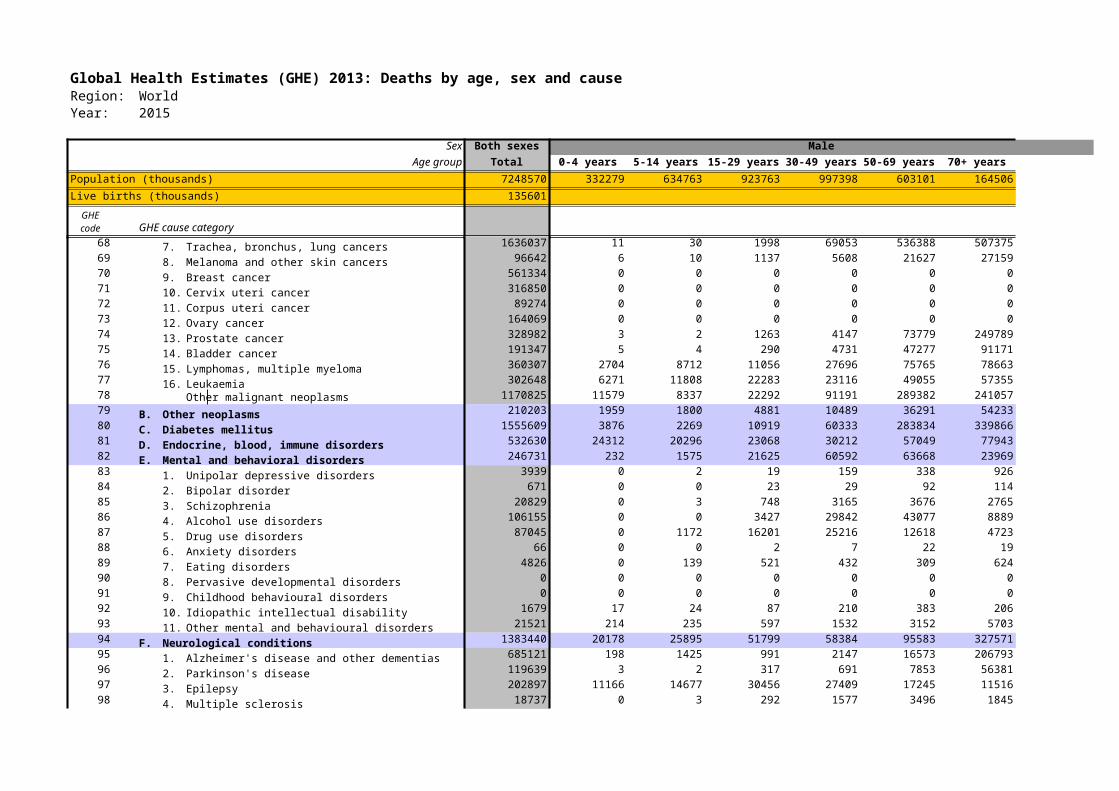
Global Health Estimates (GHE) 2013: Deaths by age, sex and causeRegion: WorldYear: 2015
Sex Both sexes Male
Age group Total 0-4 years 5-14 years 15-29 years 30-49 years 50-69 years 70+ years Total
Population (thousands) 7248570 332279 634763 923763 997398 603101 164506 3655810
Live births (thousands) 135601
GHE cause categoryGHE code
68 7. Trachea, bronchus, lung cancers 1636037 11 30 1998 69053 536388 507375 1114854
69 8. Melanoma and other skin cancers 96642 6 10 1137 5608 21627 27159 55547
70 9. Breast cancer 561334 0 0 0 0 0 0 0
71 10. Cervix uteri cancer 316850 0 0 0 0 0 0 0
72 11. Corpus uteri cancer 89274 0 0 0 0 0 0 0
73 12. Ovary cancer 164069 0 0 0 0 0 0 0
74 13. Prostate cancer 328982 3 2 1263 4147 73779 249789 328982
75 14. Bladder cancer 191347 5 4 290 4731 47277 91171 143478
76 15. Lymphomas, multiple myeloma 360307 2704 8712 11056 27696 75765 78663 204596
77 16. Leukaemia 302648 6271 11808 22283 23116 49055 57355 169888
78 Other malignant neoplasms 1170825 11579 8337 22292 91191 289382 241057 663838
79 B. Other neoplasms 210203 1959 1800 4881 10489 36291 54233 109653
80 C. Diabetes mellitus 1555609 3876 2269 10919 60333 283834 339866 701096
81 D. Endocrine, blood, immune disorders 532630 24312 20296 23068 30212 57049 77943 232880
82 E. Mental and behavioral disorders 246731 232 1575 21625 60592 63668 23969 171660
83 1. Unipolar depressive disorders 3939 0 2 19 159 338 926 1444
84 2. Bipolar disorder 671 0 0 23 29 92 114 257
85 3. Schizophrenia 20829 0 3 748 3165 3676 2765 10358
86 4. Alcohol use disorders 106155 0 0 3427 29842 43077 8889 85236
87 5. Drug use disorders 87045 0 1172 16201 25216 12618 4723 59930
88 6. Anxiety disorders 66 0 0 2 7 22 19 49
89 7. Eating disorders 4826 0 139 521 432 309 624 2025
90 8. Pervasive developmental disorders 0 0 0 0 0 0 0 0
91 9. Childhood behavioural disorders 0 0 0 0 0 0 0 0
92 10. Idiopathic intellectual disability 1679 17 24 87 210 383 206 927
93 11. Other mental and behavioural disorders 21521 214 235 597 1532 3152 5703 11433
94 F. Neurological conditions 1383440 20178 25895 51799 58384 95583 327571 579409
95 1. Alzheimer's disease and other dementias 685121 198 1425 991 2147 16573 206793 228126
96 2. Parkinson's disease 119639 3 2 317 691 7853 56381 65247
97 3. Epilepsy 202897 11166 14677 30456 27409 17245 11516 112468
98 4. Multiple sclerosis 18737 0 3 292 1577 3496 1845 7213
Global Health Estimates (GHE) 2013: Deaths by age, sex and causeRegion: WorldYear: 2015
Sex Both sexes Male
Age group Total 0-4 years 5-14 years 15-29 years 30-49 years 50-69 years 70+ years Total
Population (thousands) 7248570 332279 634763 923763 997398 603101 164506 3655810
Live births (thousands) 135601
GHE cause categoryGHE code
99 5. Migraine 15 0 0 1 0 1 1 3
100 6. Non-migraine headache 0 0 0 0 0 0 0 0
101 7. Other neurological conditions 357032 8811 9789 19743 26560 50414 51034 166350
102 G. Sense organ diseases 1030 13 3 4 19 132 278 448
103 1. Glaucoma 52 0 0 0 0 3 21 24
104 2. Cataracts 9 0 0 0 0 0 6 6
105 3. Refractive errors 0 0 0 0 0 0 0 0
106 4. Macular degeneration 0 0 0 0 0 0 0 0
107 5. Other vision loss 0 0 0 0 0 0 0 0
108 6. Other hearing loss 5 0 0 0 0 1 1 3
109 7. other sense organ disorders 964 13 3 4 18 127 251 416
110 H. Cardiovascular diseases 17866561 35864 20669 119725 652389 2948778 5047025 8824449
111 1. Rheumatic heart disease 370745 762 2574 10851 30872 59383 60555 164997
112 2. Hypertensive heart disease 1136930 864 613 4916 31877 157196 293415 488881
113 3. Ischaemic heart disease 7593875 5520 4155 44428 322356 1444772 2186202 4007432
114 4. Stroke 6699717 14428 6991 31091 172375 1015489 1919784 3160158
115 5. Cardiomyopathy, myocarditis, endocarditis 481720 8231 3218 13509 47720 100867 104511 278055
116 6. Other circulatory diseases 1583574 6058 3120 14929 47190 171071 482558 724925
117 I. Respiratory diseases 4234135 32066 9823 25994 92552 667924 1490688 2319047
118 1. Chronic obstructive pulmonary disease 3216606 10989 2125 7513 47529 510788 1179666 1758610
119 2. Asthma 430337 4634 4379 9703 25020 85829 108117 237681
120 3. Other respiratory diseases 587192 16444 3319 8778 20003 71307 202905 322756
121 J. Digestive diseases 2311317 19991 19300 59733 281541 556084 426140 1362788
122 1. Peptic ulcer disease 273521 1203 1581 7775 26358 59352 60519 156789
123 2. Cirrhosis of the liver 1028242 4936 4874 20726 170372 340224 139893 681026
124 3. Appendicitis 41981 1765 2461 2935 3807 6230 5853 23051
125 Other digestive diseases 967573 12087 10384 28297 81004 150276 219874 501922
126 K. Genitourinary diseases 1179442 17973 11045 28521 71067 186106 294766 609477
127 1. Kidney diseases 871434 12536 8913 23132 57916 143467 204337 450302
128 2. Hyperplasia of prostate 6577 0 0 1 9 575 5993 6577
129 3. Urolithiasis 27757 0 321 484 1670 5817 9105 17397
Global Health Estimates (GHE) 2013: Deaths by age, sex and causeRegion: WorldYear: 2015
Sex Both sexes Male
Age group Total 0-4 years 5-14 years 15-29 years 30-49 years 50-69 years 70+ years Total
Population (thousands) 7248570 332279 634763 923763 997398 603101 164506 3655810
Live births (thousands) 135601
GHE cause categoryGHE code
130 4. Other genitourinary diseases 264783 5436 1811 4904 11472 36248 75331 135201
131 5. Infertility 0 0 0 0 0 0 0 0
132 6. Gynecological diseases 8890 0 0 0 0 0 0 0
133 L. Skin diseases 115446 5181 1773 3157 6587 13869 25553 56120
134 M. Musculoskeletal diseases 208842 87 1777 4793 7847 21030 38455 73989
135 1. Rheumatoid arthritis 62348 0 595 1190 2259 7976 13711 25731
136 2. Osteoarthritis 4389 3 0 3 18 144 1103 1272
137 3. Gout 545 0 0 2 38 125 218 383
138 4. Back and neck pain 3797 0 0 8 67 463 1474 2011
139 Other musculoskeletal disorders 137763 84 1182 3590 5465 12322 21950 44593
140 N. Congenital anomalies 615486 259661 17202 13098 7702 8296 9425 315383
141 1. Neural tube defects 102392 46510 1816 814 474 315 338 50267
142 2. Cleft lip and cleft palate 4984 3463 0 0 0 0 2 3465
143 3. Down's syndrome 22288 6156 658 691 767 1516 87 9875
144 4. Congenital heart anomalies 240097 97939 7234 7916 3721 2943 4845 124598
145 5. Other chromosomal anomalies 25213 9791 410 281 158 180 75 10895
146 6. Other congenital anomalies 220510 95802 7084 3397 2581 3343 4077 116283
147 O. Oral conditions 1277 3 1 14 40 176 316 549
148 1. Dental caries 814 3 1 14 39 83 212 352
149 2. Periodontal disease 36 0 0 0 1 12 10 23
150 3. Edentulism 427 0 0 0 0 81 93 174
151 III. Injuries 5252329 178826 186872 904659 1015153 745203 482193 3512906
152 A. Unintentional injuries 3864259 170603 163517 563767 668229 561447 401314 2528877
153 1. Road injury 1423355 33794 38132 312866 352709 243469 94328 1075300
154 2. Poisonings 192416 10162 5620 24756 36033 27514 12084 116169
155 3. Falls 714161 15465 16659 35011 63007 99469 152134 381744
156 4. Fire, heat and hot substances 272167 28127 19435 23788 27829 23568 17552 140300
157 5. Drowning 362316 35682 41783 57911 50110 38625 20367 244478
158 6. Exposure to forces of nature 0 0 0 0 0 0 0 0
159 7. Other unintentional injuries 899845 47372 41888 109435 138542 128802 104848 570886
160 B. Intentional injuries 1388069 8223 23355 340891 346923 183756 80879 984029

Global Health Estimates (GHE) 2013: Deaths by age, sex and causeRegion: WorldYear: 2015
Sex Both sexes Male
Age group Total 0-4 years 5-14 years 15-29 years 30-49 years 50-69 years 70+ years Total
Population (thousands) 7248570 332279 634763 923763 997398 603101 164506 3655810
Live births (thousands) 135601
GHE cause categoryGHE code
161 1. Self-harm 836285 16 7908 147336 182030 133856 70714 541860
162 2. Interpersonal violence 492003 7799 11544 169539 147301 45931 9453 391568
163 3. Collective violence and legal intervention 59782 408 3903 24016 17593 3969 712 50601
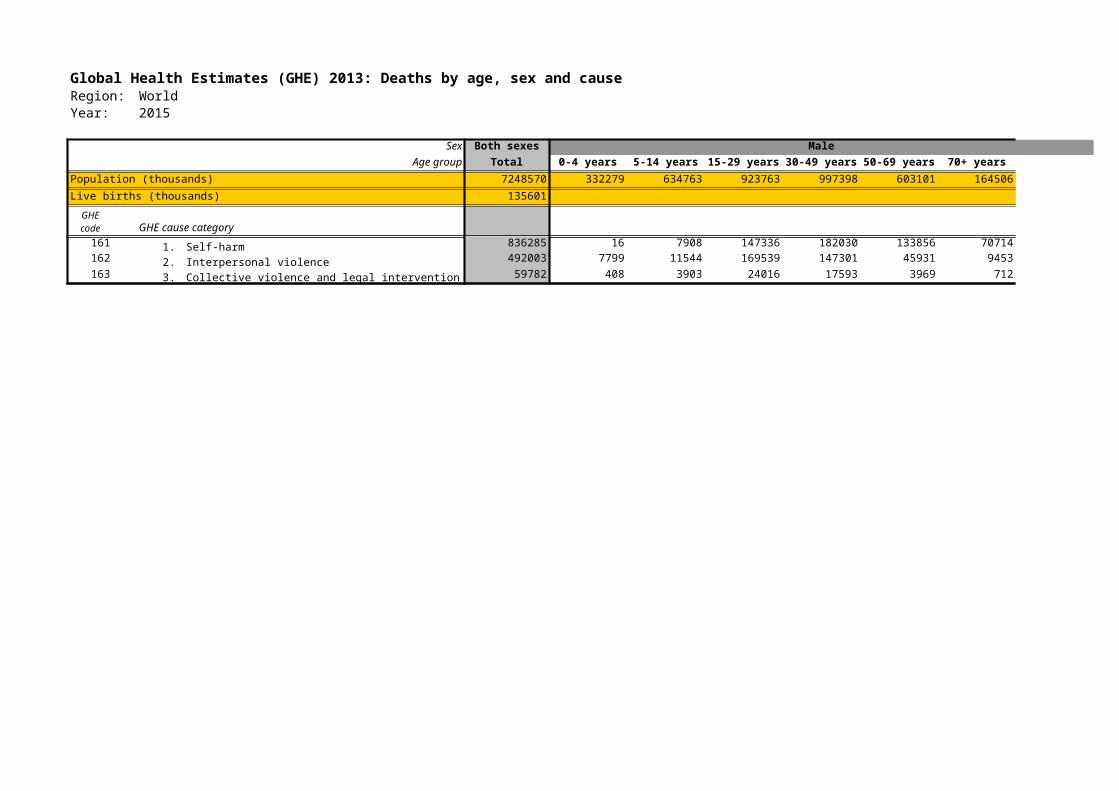
Global Health Estimates (GHE) 2013: Deaths by age, sex and causeRegion: WorldYear: 2015
Sex Both sexes
Age group Total
Population (thousands) 7248570
Live births (thousands) 135601
GHE cause category
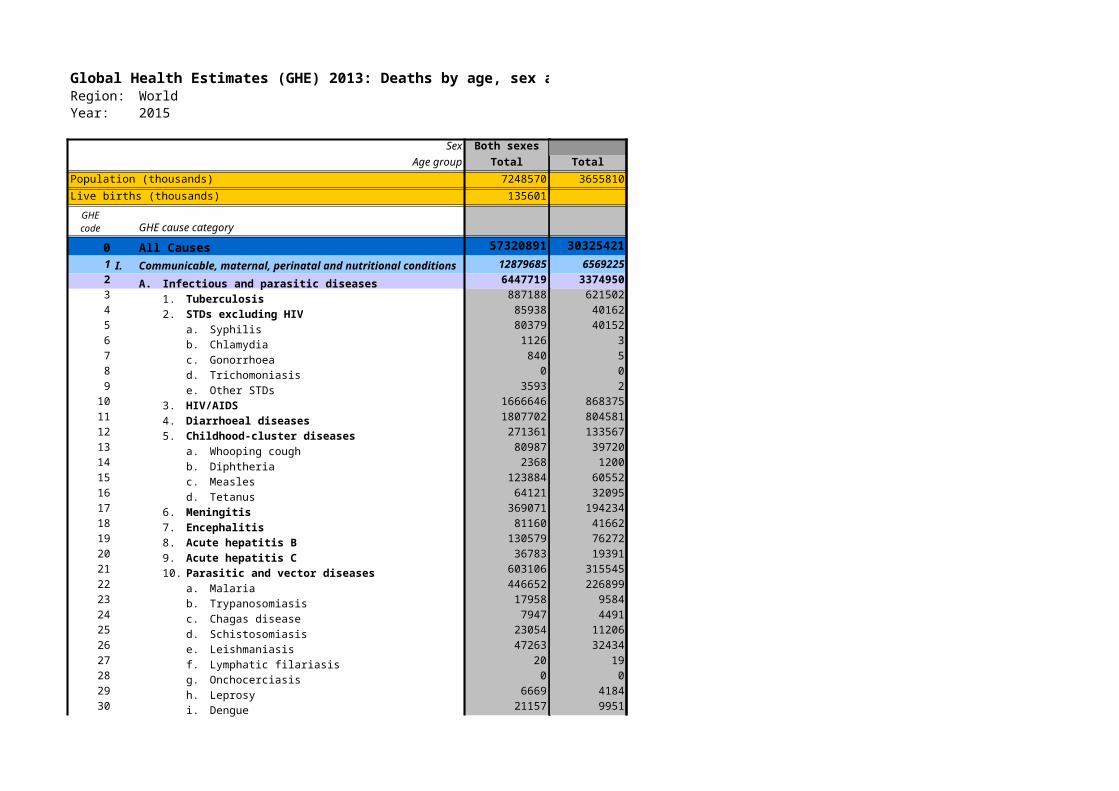
0 All Causes 57320891
1 I. 12879685
2 A. Infectious and parasitic diseases 6447719
3 1. Tuberculosis 887188
4 2. STDs excluding HIV 85938
5 a. Syphilis 80379
6 b. Chlamydia 1126
7 c. Gonorrhoea 840
8 d. Trichomoniasis 0
9 e. Other STDs 3593
10 3. HIV/AIDS 1666646
11 4. Diarrhoeal diseases 1807702
12 5. Childhood-cluster diseases 271361
13 a. Whooping cough 80987
14 b. Diphtheria 2368
15 c. Measles 123884
16 d. Tetanus 64121
17 6. Meningitis 369071
18 7. Encephalitis 81160
19 8. Acute hepatitis B 130579
20 9. Acute hepatitis C 36783
21 10. Parasitic and vector diseases 603106
22 a. Malaria 446652
23 b. Trypanosomiasis 17958
24 c. Chagas disease 7947
25 d. Schistosomiasis 23054
26 e. Leishmaniasis 47263
27 f. Lymphatic filariasis 20
28 g. Onchocerciasis 0
29 h. Leprosy 6669
30 i. Dengue 21157
GHE code
Communicable, maternal, perinatal and nutritional conditions
Female
0-4 years 5-14 years 15-29 years 30-49 years 50-69 years 70+ years Total
311548 592385 870333 971978 625684 220832 3592760
2998898 632658 1186425 2503208 5998211 13676070 26995471
2442465 356498 514856 912480 677338 1406824 6310461
778781 279632 309154 681982 459408 563812 3072769
4598 2240 23996 70828 97541 66484 265686
36792 2955 1326 1656 1304 1742 45776
36769 2743 68 87 233 327 40227
8 49 287 335 220 224 1123
0 36 216 252 159 172 835
0 0 0 0 0 0 0
14 127 756 982 692 1020 3591
56043 52671 134210 457795 93671 3880 798270
272925 105938 78666 76411 146566 322615 1003122
113396 17782 2767 1296 1571 982 137794
39517 1233 255 153 106 2 41267
646 441 39 25 16 2 1168
45590 15242 1773 398 276 53 63333
27643 866 700 719 1173 925 32026
64909 28016 21720 18000 21748 20444 174837
15048 5801 4822 3829 4940 5058 39498
1995 3294 4619 8622 19057 16719 54307
8 282 552 1987 6392 8170 17393
174795 43897 18058 18468 18986 13357 287562
169185 28347 8828 7326 4492 1575 219753
243 3197 2762 1690 455 26 8374
1 2 20 238 1269 1925 3456
349 26 466 3076 4515 3417 11848
2693 4168 2674 2226 1906 1162 14829
0 0 0 0 1 0 1
0 0 0 0 0 0 0
9 26 58 307 1261 826 2486
1096 1315 1180 1625 2734 3257 11206
Global Health Estimates (GHE) 2013: Deaths by age, sex and causeRegion: WorldYear: 2015
Sex Both sexes
Age group Total
Population (thousands) 7248570
Live births (thousands) 135601
GHE cause categoryGHE code
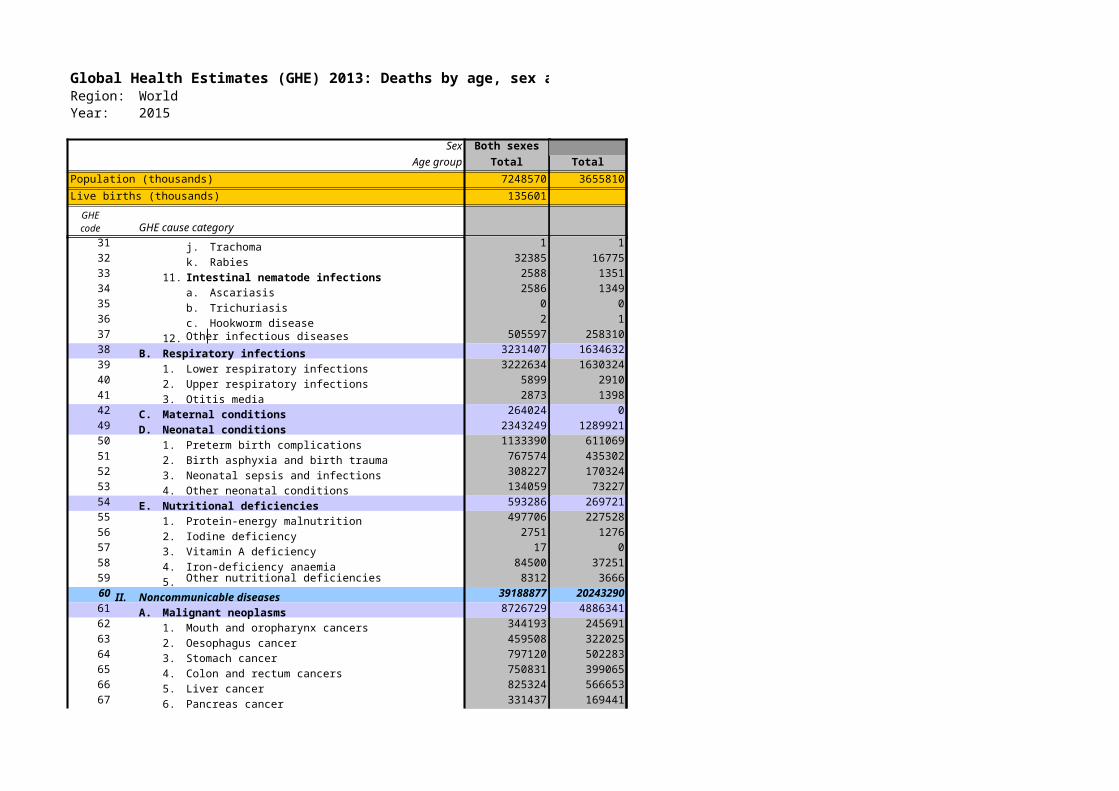
31 j. Trachoma 1
32 k. Rabies 32385
33 11. Intestinal nematode infections 2588
34 a. Ascariasis 2586
35 b. Trichuriasis 0
36 c. Hookworm disease 2
37 12. Other infectious diseases 505597
38 B. Respiratory infections 3231407
39 1. Lower respiratory infections 3222634
40 2. Upper respiratory infections 5899
41 3. Otitis media 2873
42 C. Maternal conditions 264024
49 D. Neonatal conditions 2343249
50 1. Preterm birth complications 1133390
51 2. Birth asphyxia and birth trauma 767574
52 3. Neonatal sepsis and infections 308227
53 4. Other neonatal conditions 134059
54 E. Nutritional deficiencies 593286
55 1. Protein-energy malnutrition 497706
56 2. Iodine deficiency 2751
57 3. Vitamin A deficiency 17
58 4. Iron-deficiency anaemia 84500
59 5. Other nutritional deficiencies 8312
60 II. Noncommunicable diseases 39188877
61 A. Malignant neoplasms 8726729
62 1. Mouth and oropharynx cancers 344193
63 2. Oesophagus cancer 459508
64 3. Stomach cancer 797120
65 4. Colon and rectum cancers 750831
66 5. Liver cancer 825324
67 6. Pancreas cancer 331437
Female
0-4 years 5-14 years 15-29 years 30-49 years 50-69 years 70+ years Total
311548 592385 870333 971978 625684 220832 3592760
0 0 0 0 0 0 0
1220 6817 2071 1981 2353 1168 15609
421 231 42 80 192 272 1238
421 231 42 79 192 272 1237
0 0 0 0 0 0 0
0 0 0 1 0 0 1
37849 16523 18376 23010 47439 104090 247287
520154 49398 48767 66828 176577 735051 1596775
518511 49160 48582 66585 176061 733412 1592311
843 103 104 132 351 1455 2989
799 134 81 111 165 185 1475
0 39 130313 133623 44 6 264024
1053203 45 21 13 16 31 1053328
522318 2 1 0 0 0 522321
332232 16 11 5 3 5 332272
137822 27 10 7 12 25 137902
60832 0 0 0 0 0 60832
90327 27385 26602 30033 41293 107923 323564
86538 23447 18605 23476 33542 84570 270178
65 90 697 300 112 211 1475
0 0 0 0 3 13 17
3521 3797 7142 6037 7099 19654 47249
204 52 158 220 537 3475 4646
416751 155502 357079 1275724 4975697 11764833 18945587
17460 19642 68827 501601 1555965 1676892 3840388
11 300 1923 15263 45342 35662 98502
0 1 1330 10813 61954 63386 137483
3 10 2965 29638 108674 153547 294837
1 10 2521 28306 113792 207137 351766
62 311 3675 26550 110437 117636 258670
1 5 431 7110 56099 98351 161996
Global Health Estimates (GHE) 2013: Deaths by age, sex and causeRegion: WorldYear: 2015
Sex Both sexes
Age group Total
Population (thousands) 7248570
Live births (thousands) 135601
GHE cause categoryGHE code
68 7. Trachea, bronchus, lung cancers 1636037
69 8. Melanoma and other skin cancers 96642
70 9. Breast cancer 561334
71 10. Cervix uteri cancer 316850
72 11. Corpus uteri cancer 89274
73 12. Ovary cancer 164069
74 13. Prostate cancer 328982
75 14. Bladder cancer 191347
76 15. Lymphomas, multiple myeloma 360307
77 16. Leukaemia 302648
78 Other malignant neoplasms 1170825
79 B. Other neoplasms 210203
80 C. Diabetes mellitus 1555609
81 D. Endocrine, blood, immune disorders 532630
82 E. Mental and behavioral disorders 246731
83 1. Unipolar depressive disorders 3939
84 2. Bipolar disorder 671
85 3. Schizophrenia 20829
86 4. Alcohol use disorders 106155
87 5. Drug use disorders 87045
88 6. Anxiety disorders 66
89 7. Eating disorders 4826
90 8. Pervasive developmental disorders 0
91 9. Childhood behavioural disorders 0
92 10. Idiopathic intellectual disability 1679
93 11. Other mental and behavioural disorders 21521
94 F. Neurological conditions 1383440
95 1. Alzheimer's disease and other dementias 685121
96 2. Parkinson's disease 119639
97 3. Epilepsy 202897
98 4. Multiple sclerosis 18737
Female
0-4 years 5-14 years 15-29 years 30-49 years 50-69 years 70+ years Total
311548 592385 870333 971978 625684 220832 3592760
7 26 1005 36084 214044 270018 521184
6 11 955 4566 13729 21827 41095
1 4 3955 117839 262102 177433 561334
1 0 14584 78152 154246 69867 316850
0 2 308 8607 42108 38250 89274
4 22 4048 25232 77502 57260 164069
0 0 0 0 0 0 0
3 2 176 2197 12133 33358 47869
1708 4454 7572 17519 51428 73028 155711
5409 8229 13820 19971 37727 47605 132760
10243 6255 9559 73753 194647 212529 506986
1775 1613 2514 12041 27194 55413 100550
3566 3859 12075 47620 297994 489399 854513
33008 27899 29347 31368 57939 120188 299750
97 1258 8405 18568 23892 22852 75071
1 0 20 144 341 1989 2495
0 0 4 27 124 259 414
0 0 606 2735 3274 3856 10472
0 0 777 5955 11002 3184 20919
0 997 6058 8443 6859 4757 27115
0 0 0 2 4 11 17
0 132 690 587 459 932 2800
0 0 0 0 0 0 0
0 0 0 0 0 0 0
8 24 59 162 272 227 752
87 104 192 512 1556 7637 10087
22177 23613 37715 46947 94197 579382 804031
103 1164 1041 1598 15285 437804 456995
3 0 352 635 5363 48039 54391
11994 14478 21318 17336 12168 13133 90428
0 4 443 2413 5467 3196 11524
Global Health Estimates (GHE) 2013: Deaths by age, sex and causeRegion: WorldYear: 2015
Sex Both sexes
Age group Total
Population (thousands) 7248570
Live births (thousands) 135601
GHE cause categoryGHE code
99 5. Migraine 15
100 6. Non-migraine headache 0
101 7. Other neurological conditions 357032
102 G. Sense organ diseases 1030
103 1. Glaucoma 52
104 2. Cataracts 9
105 3. Refractive errors 0
106 4. Macular degeneration 0
107 5. Other vision loss 0
108 6. Other hearing loss 5
109 7. other sense organ disorders 964
110 H. Cardiovascular diseases 17866561
111 1. Rheumatic heart disease 370745
112 2. Hypertensive heart disease 1136930
113 3. Ischaemic heart disease 7593875
114 4. Stroke 6699717
115 5. Cardiomyopathy, myocarditis, endocarditis 481720
116 6. Other circulatory diseases 1583574
117 I. Respiratory diseases 4234135
118 1. Chronic obstructive pulmonary disease 3216606
119 2. Asthma 430337
120 3. Other respiratory diseases 587192
121 J. Digestive diseases 2311317
122 1. Peptic ulcer disease 273521
123 2. Cirrhosis of the liver 1028242
124 3. Appendicitis 41981
125 Other digestive diseases 967573
126 K. Genitourinary diseases 1179442
127 1. Kidney diseases 871434
128 2. Hyperplasia of prostate 6577
129 3. Urolithiasis 27757
Female
0-4 years 5-14 years 15-29 years 30-49 years 50-69 years 70+ years Total
311548 592385 870333 971978 625684 220832 3592760
0 0 1 4 2 5 12
0 0 0 0 0 0 0
10077 7967 14560 24960 55913 77205 190682
2 3 81 17 118 360 582
0 0 0 0 1 26 28
0 0 0 0 0 4 4
0 0 0 0 0 0 0
0 0 0 0 0 0 0
0 0 0 0 0 0 0
0 0 0 0 0 2 2
2 3 81 17 117 328 548
33411 22113 91999 363613 1943122 6587855 9042112
1074 3746 13526 29132 65044 93225 205748
1540 994 4189 24633 139315 477379 648049
5062 3665 25588 122154 760150 2669823 3586443
12029 6058 25175 133498 811542 2551257 3539559
7020 3068 8939 19271 50618 114748 203664
6686 4582 14581 34925 116453 681422 858649
25384 7528 19898 61058 467348 1333871 1915088
8596 1358 6679 30157 361072 1050134 1457996
3344 2783 6007 18026 61935 100561 192656
13444 3387 7212 12876 44341 183176 264436
16400 18366 33432 103535 298430 478365 948528
1140 1580 4953 13165 35497 60399 116732
3982 4629 12055 56137 154389 116024 347216
1260 2164 1854 2359 4702 6591 18929
10018 9993 14570 31875 103843 295352 465650
13694 10292 26017 62335 156826 300800 569965
10606 8514 20006 47602 122830 211574 421132
0 0 0 0 0 0 0
0 239 338 1334 3255 5194 10360
Global Health Estimates (GHE) 2013: Deaths by age, sex and causeRegion: WorldYear: 2015
Sex Both sexes
Age group Total
Population (thousands) 7248570
Live births (thousands) 135601
GHE cause categoryGHE code
130 4. Other genitourinary diseases 264783
131 5. Infertility 0
132 6. Gynecological diseases 8890
133 L. Skin diseases 115446
134 M. Musculoskeletal diseases 208842
135 1. Rheumatoid arthritis 62348
136 2. Osteoarthritis 4389
137 3. Gout 545
138 4. Back and neck pain 3797
139 Other musculoskeletal disorders 137763
140 N. Congenital anomalies 615486
141 1. Neural tube defects 102392
142 2. Cleft lip and cleft palate 4984
143 3. Down's syndrome 22288
144 4. Congenital heart anomalies 240097
145 5. Other chromosomal anomalies 25213
146 6. Other congenital anomalies 220510
147 O. Oral conditions 1277
148 1. Dental caries 814
149 2. Periodontal disease 36
150 3. Edentulism 427
151 III. Injuries 5252329
152 A. Unintentional injuries 3864259
153 1. Road injury 1423355
154 2. Poisonings 192416
155 3. Falls 714161
156 4. Fire, heat and hot substances 272167
157 5. Drowning 362316
158 6. Exposure to forces of nature 0
159 7. Other unintentional injuries 899845
160 B. Intentional injuries 1388069
Female
0-4 years 5-14 years 15-29 years 30-49 years 50-69 years 70+ years Total
311548 592385 870333 971978 625684 220832 3592760
3089 1540 4452 10660 28376 81466 129582
0 0 0 0 0 0 0
0 0 1221 2738 2365 2565 8890
4617 1674 3043 4792 10868 34332 59326
91 2729 10286 15283 33466 72996 134852
1 869 1299 2895 10920 20633 36617
3 0 0 21 172 2921 3117
0 0 0 0 15 146 162
0 0 2 31 254 1499 1786
87 1860 8985 12335 22105 47797 93170
245068 14910 13430 6914 8122 11658 300102
48261 1719 977 429 302 438 52126
1514 1 1 0 1 1 1519
8422 783 744 766 1564 134 12414
87615 6330 8046 3611 2933 6965 115499
12836 521 410 177 255 119 14318
86419 5555 3253 1931 3067 4002 104227
3 1 9 32 216 468 728
3 1 9 32 56 362 463
0 0 0 0 3 10 13
0 0 0 0 157 96 252
139682 120658 314489 315004 345177 504414 1739423
131459 103231 178691 204373 266539 451090 1335383
22743 21815 68056 83238 93840 58361 348055
8418 5496 16038 19451 15919 10924 76247
10972 10317 11320 18946 60451 220411 332417
23044 17735 29349 23303 17199 21236 131867
23491 21823 18227 15600 18487 20210 117837
0 0 0 0 0 0 0
42790 26045 35700 43835 60641 119948 328959
8223 17427 135798 110631 78638 53323 404040

Global Health Estimates (GHE) 2013: Deaths by age, sex and causeRegion: WorldYear: 2015
Sex Both sexes
Age group Total
Population (thousands) 7248570
Live births (thousands) 135601
GHE cause categoryGHE code
161 1. Self-harm 836285
162 2. Interpersonal violence 492003
163 3. Collective violence and legal intervention 59782
Female
0-4 years 5-14 years 15-29 years 30-49 years 50-69 years 70+ years Total
311548 592385 870333 971978 625684 220832 3592760
3 7034 96644 79572 65286 45887 294425
7807 8550 35803 28720 12364 7189 100435
413 1842 3351 2339 988 248 9181
Global Health Estimates (GHE) 2013: Deaths by age, sex and causeRegion: WorldYear: 2030
Sex Both sexes Male
Age group Total 0-4 years 5-14 years 15-29 years 30-49 years 50-69 years 70+ years Total
Population (thousands) 8283372 326424 651433 947572 1158063 807490 279385 4170366
Live births (thousands) 131994
GHE cause category
0 All Causes 70103996 2689633 556993 1646093 3952697 10253438 17982894 37081749
1 I. 12015409 2104942 192158 287305 911706 869585 1659873 6025570
2 A. Infectious and parasitic diseases 5814070 576334 148533 222174 800110 599563 613320 2960034
3 1. Tuberculosis 595050 2633 936 15197 98749 174153 121992 413661
4 2. STDs excluding HIV 57384 21495 1286 539 811 967 1258 26356
5 a. Syphilis 52235 21495 1286 538 811 964 1251 26345
6 b. Chlamydia 1008 0 0 1 0 0 2 3
7 c. Gonorrhoea 758 0 0 0 0 2 4 6
8 d. Trichomoniasis 0 0 0 0 0 0 0 0
9 e. Other STDs 3382 0 0 0 0 1 1 2
10 3. HIV/AIDS 1793500 41671 45590 94745 552546 177204 29852 941608
11 4. Diarrhoeal diseases 1616713 162169 47303 45941 58930 108277 255986 678605
12 5. Childhood-cluster diseases 160957 65140 6092 1546 1410 1909 2124 78220
13 a. Whooping cough 49069 22820 608 246 149 133 6 23962
14 b. Diphtheria 1494 440 212 36 29 19 1 737
15 c. Measles 68852 26756 4779 840 289 298 38 33000
16 d. Tetanus 41543 15124 493 425 943 1459 2079 20522
17 6. Meningitis 279487 39777 13778 24152 22094 22372 23168 145342
18 7. Encephalitis 58128 7534 2291 3976 4702 4993 6195 29690
19 8. Acute hepatitis B 120026 1544 1318 5304 12885 25408 21328 67788
20 9. Acute hepatitis C 36496 1 117 421 2856 8451 6461 18308
21 10. Parasitic and vector diseases 585483 207409 21682 15912 19359 20295 18049 302707
22 a. Malaria 456946 202392 12838 5400 5699 3884 1743 231956
23 b. Trypanosomiasis 13740 161 1554 3204 1923 379 25 7247
24 c. Chagas disease 9368 1 2 24 343 1814 2910 5093
25 d. Schistosomiasis 23546 457 7 599 3044 3929 3316 11352
26 e. Leishmaniasis 32126 3046 3949 3917 4333 3774 2797 21816
27 f. Lymphatic filariasis 31 0 0 0 0 0 30 30
28 g. Onchocerciasis 0 0 0 0 0 0 0 0
29 h. Leprosy 6833 0 2 6 499 2103 1639 4249
30 i. Dengue 18770 478 527 835 1184 1949 3635 8609
GHE code
Communicable, maternal, perinatal and nutritional conditions
Global Health Estimates (GHE) 2013: Deaths by age, sex and causeRegion: WorldYear: 2030
Sex Both sexes Male
Age group Total 0-4 years 5-14 years 15-29 years 30-49 years 50-69 years 70+ years Total
Population (thousands) 8283372 326424 651433 947572 1158063 807490 279385 4170366
Live births (thousands) 131994
GHE cause categoryGHE code
31 j. Trachoma 1 0 0 0 0 1 0 1
32 k. Rabies 24121 872 2803 1927 2333 2463 1955 12353
33 11. Intestinal nematode infections 2008 272 98 27 55 225 337 1015
34 a. Ascariasis 2006 272 98 27 55 225 337 1014
35 b. Trichuriasis 0 0 0 0 0 0 0 0
36 c. Hookworm disease 2 0 0 1 0 0 0 1
37 12. Other infectious diseases 508839 26688 8043 14414 25712 55309 126569 256734
38 B. Respiratory infections 3543716 407784 31060 46310 90167 240537 954147 1770004
39 1. Lower respiratory infections 3535247 406686 30914 46137 89878 239917 952432 1765964
40 2. Upper respiratory infections 6141 575 68 95 191 463 1523 2916
41 3. Otitis media 2328 523 78 79 98 157 191 1125
42 C. Maternal conditions 200738 0 0 0 0 0 0 0
49 D. Neonatal conditions 1913574 1056365 38 34 17 25 20 1056500
50 1. Preterm birth complications 916817 494759 4 4 1 0 1 494768
51 2. Birth asphyxia and birth trauma 639252 363946 16 18 7 7 10 364004
52 3. Neonatal sepsis and infections 259727 144018 18 12 10 18 10 144086
53 4. Other neonatal conditions 97778 53642 0 0 0 0 0 53642
54 E. Nutritional deficiencies 543311 64459 12527 18786 21412 29461 92386 239032
55 1. Protein-energy malnutrition 447411 61625 10685 13253 16667 23602 71548 197380
56 2. Iodine deficiency 2364 45 40 464 229 96 208 1081
57 3. Vitamin A deficiency 22 0 0 0 0 0 0 0
58 4. Iron-deficiency anaemia 83316 2677 1773 4979 4329 5190 17197 36146
59 5. Other nutritional deficiencies 10197 111 29 90 188 573 3433 4424
60 II. Noncommunicable diseases 51791928 410853 173869 442288 1903940 8448857 15548794 26928602
61 A. Malignant neoplasms 12626378 23714 32016 85145 529929 2825225 3681002 7177031
62 1. Mouth and oropharynx cancers 508208 3 711 4159 48063 185346 120815 359097
63 2. Oesophagus cancer 680826 1 1 1253 31650 214816 229330 477051
64 3. Stomach cancer 1143343 4 6 3482 43204 293274 383007 722978
65 4. Colon and rectum cancers 1075233 3 12 4130 36287 192291 344889 577611
66 5. Liver cancer 1185908 65 723 10527 100596 364556 326752 803219
67 6. Pancreas cancer 456862 0 1 391 11104 89720 132231 233447
Global Health Estimates (GHE) 2013: Deaths by age, sex and causeRegion: WorldYear: 2030
Sex Both sexes Male
Age group Total 0-4 years 5-14 years 15-29 years 30-49 years 50-69 years 70+ years Total
Population (thousands) 8283372 326424 651433 947572 1158063 807490 279385 4170366
Live births (thousands) 131994
GHE cause categoryGHE code
68 7. Trachea, bronchus, lung cancers 2413401 6 14 1004 74176 731905 860622 1667727
69 8. Melanoma and other skin cancers 136175 4 8 981 5614 26412 46814 79833
70 9. Breast cancer 805116 0 0 0 0 0 0 0
71 10. Cervix uteri cancer 442926 0 0 0 0 0 0 0
72 11. Corpus uteri cancer 117505 0 0 0 0 0 0 0
73 12. Ovary cancer 217864 0 0 0 0 0 0 0
74 13. Prostate cancer 541242 2 1 1441 5518 103650 430629 541242
75 14. Bladder cancer 292463 3 3 325 5722 62706 153685 222444
76 15. Lymphomas, multiple myeloma 521800 4101 11578 12788 34936 103997 132946 300347
77 16. Leukaemia 387567 5886 10562 20983 24689 62898 95412 220431
78 Other malignant neoplasms 1699938 13635 8396 23681 108370 393653 423868 971603
79 B. Other neoplasms 308888 1840 2003 5350 12850 49488 92695 164225
80 C. Diabetes mellitus 2464252 4131 2724 12446 72187 418776 585511 1095774
81 D. Endocrine, blood, immune disorders 685522 24485 23160 25525 35524 68544 120682 297920
82 E. Mental and behavioral disorders 265547 238 1706 19591 58551 63748 36285 180120
83 1. Unipolar depressive disorders 5074 0 2 17 143 352 1365 1879
84 2. Bipolar disorder 807 0 0 22 27 94 166 308
85 3. Schizophrenia 24161 0 2 619 3112 3988 4059 11781
86 4. Alcohol use disorders 105505 0 0 2764 27483 41237 13086 84570
87 5. Drug use disorders 90001 0 1262 14833 25045 12855 6874 60869
88 6. Anxiety disorders 82 0 0 2 7 22 29 59
89 7. Eating disorders 6755 0 158 592 579 468 1063 2859
90 8. Pervasive developmental disorders 0 0 0 0 0 0 0 0
91 9. Childhood behavioural disorders 0 0 0 0 0 0 0 0
92 10. Idiopathic intellectual disability 1814 15 21 78 194 387 299 993
93 11. Other mental and behavioural disorders 31348 223 262 666 1961 4346 9343 16801
94 F. Neurological conditions 1838393 19680 28216 54514 64384 110547 489086 766427
95 1. Alzheimer's disease and other dementias 966271 175 1588 961 2200 18528 311590 335041
96 2. Parkinson's disease 170382 2 1 337 796 9377 83661 94174
97 3. Epilepsy 236994 11657 16571 33394 31506 20169 16737 130034
98 4. Multiple sclerosis 21386 0 2 273 1622 3657 2775 8329
Global Health Estimates (GHE) 2013: Deaths by age, sex and causeRegion: WorldYear: 2030
Sex Both sexes Male
Age group Total 0-4 years 5-14 years 15-29 years 30-49 years 50-69 years 70+ years Total
Population (thousands) 8283372 326424 651433 947572 1158063 807490 279385 4170366
Live births (thousands) 131994
GHE cause categoryGHE code
99 5. Migraine 18 0 0 1 0 2 2 5
100 6. Non-migraine headache 0 0 0 0 0 0 0 0
101 7. Other neurological conditions 443342 7847 10053 19548 28260 58815 74322 198845
102 G. Sense organ diseases 1380 8 2 4 19 144 423 600
103 1. Glaucoma 72 0 0 0 0 4 31 35
104 2. Cataracts 15 0 0 0 0 0 10 10
105 3. Refractive errors 0 0 0 0 0 0 0 0
106 4. Macular degeneration 0 0 0 0 0 0 0 0
107 5. Other vision loss 0 0 0 0 0 0 0 0
108 6. Other hearing loss 6 0 0 0 0 1 2 3
109 7. other sense organ disorders 1288 8 2 4 19 139 380 553
110 H. Cardiovascular diseases 22245271 33023 21893 111988 665894 3253805 6930112 11016715
111 1. Rheumatic heart disease 459991 738 2788 10629 34752 72488 90060 211454
112 2. Hypertensive heart disease 1457306 769 653 4736 33294 179009 407021 625483
113 3. Ischaemic heart disease 9245111 5411 4446 41091 325073 1553917 2927574 4857512
114 4. Stroke 8578124 13090 7471 29971 178910 1155135 2703310 4087888
115 5. Cardiomyopathy, myocarditis, endocarditis 575551 7579 3389 12418 47981 107933 147781 327081
116 6. Other circulatory diseases 1929188 5437 3144 13143 45883 185324 654366 907298
117 I. Respiratory diseases 5956734 31021 10715 27247 89846 761956 2412524 3333309
118 1. Chronic obstructive pulmonary disease 4568157 10636 2312 7623 44100 578003 1906202 2548875
119 2. Asthma 609594 4433 4885 10700 26028 103723 190514 340282
120 3. Other respiratory diseases 778984 15953 3518 8925 19718 80231 315808 444152
121 J. Digestive diseases 2818588 18048 17864 51616 271278 624952 644450 1628208
122 1. Peptic ulcer disease 355639 1024 1504 7181 26504 69345 95316 200875
123 2. Cirrhosis of the liver 1200605 4576 4937 18244 161426 376476 214484 780144
124 3. Appendicitis 52299 1808 2747 3259 4094 7693 8863 28466
125 Other digestive diseases 1210045 10639 8676 22932 79253 171438 325786 618723
126 K. Genitourinary diseases 1565663 16852 11554 27979 78499 220096 443926 798905
127 1. Kidney diseases 1151509 11683 9294 22535 63822 169715 308846 585894
128 2. Hyperplasia of prostate 9974 0 0 1 8 696 9269 9974
129 3. Urolithiasis 36934 0 314 467 1809 6764 13479 22834
Global Health Estimates (GHE) 2013: Deaths by age, sex and causeRegion: WorldYear: 2030
Sex Both sexes Male
Age group Total 0-4 years 5-14 years 15-29 years 30-49 years 50-69 years 70+ years Total
Population (thousands) 8283372 326424 651433 947572 1158063 807490 279385 4170366
Live births (thousands) 131994
GHE cause categoryGHE code
130 4. Other genitourinary diseases 356736 5169 1945 4976 12860 42920 112332 180203
131 5. Infertility 0 0 0 0 0 0 0 0
132 6. Gynecological diseases 10510 0 0 0 0 0 0 0
133 L. Skin diseases 159994 5541 2070 3702 8416 17373 39284 76387
134 M. Musculoskeletal diseases 270982 70 1990 5028 8702 24225 58846 98862
135 1. Rheumatoid arthritis 82570 0 681 1287 2606 9354 20655 34583
136 2. Osteoarthritis 6249 2 0 2 17 168 1703 1893
137 3. Gout 747 0 0 2 37 144 337 520
138 4. Back and neck pain 5201 0 0 6 64 501 2215 2786
139 Other musculoskeletal disorders 176215 68 1309 3730 5978 14059 33935 59079
140 N. Congenital anomalies 582630 232199 17955 12140 7823 9781 13492 293391
141 1. Neural tube defects 91832 40389 1883 786 502 398 471 44430
142 2. Cleft lip and cleft palate 4320 2902 0 0 0 0 3 2905
143 3. Down's syndrome 21915 5791 695 654 772 1557 123 9592
144 4. Congenital heart anomalies 221717 84691 7217 7040 3662 3578 6934 113122
145 5. Other chromosomal anomalies 23004 8599 422 256 147 203 105 9732
146 6. Other congenital anomalies 219842 89827 7738 3404 2740 4046 5855 113610
147 O. Oral conditions 1706 2 1 13 38 197 479 729
148 1. Dental caries 1085 2 1 13 36 91 325 469
149 2. Periodontal disease 49 0 0 0 1 16 15 32
150 3. Edentulism 573 0 0 0 0 90 138 228
151 III. Injuries 6296659 173838 190965 916500 1137052 934996 774227 4127578
152 A. Unintentional injuries 4740269 164835 165369 588370 754189 711982 649015 3033761
153 1. Road injury 1853581 46023 45668 356659 430290 338880 158320 1375840
154 2. Poisonings 197712 8810 5347 21979 33683 29003 19139 117961
155 3. Falls 976270 14007 16366 32234 67041 122551 244933 497133
156 4. Fire, heat and hot substances 305155 27179 20647 23784 30005 26890 28061 156566
157 5. Drowning 376519 28534 37562 53007 51334 46206 33241 249884
158 6. Exposure to forces of nature 0 0 0 0 0 0 0 0
159 7. Other unintentional injuries 1031032 40283 39778 100707 141836 148452 165321 636377
160 B. Intentional injuries 1556391 9003 25596 328130 382863 223014 125212 1093817
Global Health Estimates (GHE) 2013: Deaths by age, sex and causeRegion: WorldYear: 2030
Sex Both sexes Male
Age group Total 0-4 years 5-14 years 15-29 years 30-49 years 50-69 years 70+ years Total
Population (thousands) 8283372 326424 651433 947572 1158063 807490 279385 4170366
Live births (thousands) 131994
GHE cause categoryGHE code
161 1. Self-harm 1007387 13 8794 156934 221124 170787 111825 669476
162 2. Interpersonal violence 485828 8562 12595 148242 142570 47415 12427 371813
163 3. Collective violence and legal intervention 63175 428 4207 22953 19169 4811 959 52527
Global Health Estimates (GHE) 2013: Deaths by age, sex and causeRegion: WorldYear: 2030
Sex Both sexes
Age group Total
Population (thousands) 8283372
Live births (thousands) 131994
GHE cause category
0 All Causes 70103996
1 I. 12015409
2 A. Infectious and parasitic diseases 5814070
3 1. Tuberculosis 595050
4 2. STDs excluding HIV 57384
5 a. Syphilis 52235
6 b. Chlamydia 1008
7 c. Gonorrhoea 758
8 d. Trichomoniasis 0
9 e. Other STDs 3382
10 3. HIV/AIDS 1793500
11 4. Diarrhoeal diseases 1616713
12 5. Childhood-cluster diseases 160957
13 a. Whooping cough 49069
14 b. Diphtheria 1494
15 c. Measles 68852
16 d. Tetanus 41543
17 6. Meningitis 279487
18 7. Encephalitis 58128
19 8. Acute hepatitis B 120026
20 9. Acute hepatitis C 36496
21 10. Parasitic and vector diseases 585483
22 a. Malaria 456946
23 b. Trypanosomiasis 13740
24 c. Chagas disease 9368
25 d. Schistosomiasis 23546
26 e. Leishmaniasis 32126
27 f. Lymphatic filariasis 31
28 g. Onchocerciasis 0
29 h. Leprosy 6833
30 i. Dengue 18770
GHE code
Communicable, maternal, perinatal and nutritional conditions
Female
0-4 years 5-14 years 15-29 years 30-49 years 50-69 years 70+ years Total
308399 614397 888961 1108208 832174 360867 4113006
2373216 512241 1034705 2550347 7038912 19512826 33022247
1834231 218270 393539 866291 673725 2003784 5989840
559763 168783 237333 672870 448507 766781 2854036
2208 1014 13587 45465 67279 51836 181389
23471 1767 868 1247 1179 2495 31028
23459 1636 45 67 218 466 25890
4 31 189 254 200 329 1006
0 22 141 192 144 252 752
0 0 0 0 0 0 0
9 79 493 733 618 1448 3380
40548 41608 121088 505279 131128 12240 851892
161741 59942 53605 61459 137136 464226 938108
68023 9232 1694 943 1450 1395 82736
24036 696 158 120 94 3 25107
430 265 27 20 14 2 757
26241 7883 1120 287 246 74 35852
17316 388 389 516 1096 1316 21021
38775 15883 15595 14995 20417 28480 134145
7670 2921 3059 2974 4661 7153 28438
1222 1451 2536 6064 17220 23747 52239
4 135 315 1512 5651 10571 18188
193383 25479 12525 15083 17361 18945 282777
190100 16520 6222 6084 3945 2117 224989
173 1970 2243 1639 436 33 6493
0 1 12 161 1199 2902 4275
264 13 351 2714 4197 4656 12195
1497 2214 1597 1618 1721 1663 10309
0 0 0 0 1 0 1
0 0 0 0 0 0 0
4 12 31 219 1138 1179 2584
499 591 673 1143 2534 4722 10161

Global Health Estimates (GHE) 2013: Deaths by age, sex and causeRegion: WorldYear: 2030
Sex Both sexes
Age group Total
Population (thousands) 8283372
Live births (thousands) 131994
GHE cause categoryGHE code
31 j. Trachoma 1
32 k. Rabies 24121
33 11. Intestinal nematode infections 2008
34 a. Ascariasis 2006
35 b. Trichuriasis 0
36 c. Hookworm disease 2
37 12. Other infectious diseases 508839
38 B. Respiratory infections 3543716
39 1. Lower respiratory infections 3535247
40 2. Upper respiratory infections 6141
41 3. Otitis media 2328
42 C. Maternal conditions 200738
49 D. Neonatal conditions 1913574
50 1. Preterm birth complications 916817
51 2. Birth asphyxia and birth trauma 639252
52 3. Neonatal sepsis and infections 259727
53 4. Other neonatal conditions 97778
54 E. Nutritional deficiencies 543311
55 1. Protein-energy malnutrition 447411
56 2. Iodine deficiency 2364
57 3. Vitamin A deficiency 22
58 4. Iron-deficiency anaemia 83316
59 5. Other nutritional deficiencies 10197
60 II. Noncommunicable diseases 51791928
61 A. Malignant neoplasms 12626378
62 1. Mouth and oropharynx cancers 508208
63 2. Oesophagus cancer 680826
64 3. Stomach cancer 1143343
65 4. Colon and rectum cancers 1075233
66 5. Liver cancer 1185908
67 6. Pancreas cancer 456862
Female
0-4 years 5-14 years 15-29 years 30-49 years 50-69 years 70+ years Total
308399 614397 888961 1108208 832174 360867 4113006
0 0 0 0 0 0 0
843 4158 1397 1505 2190 1673 11768
225 117 23 55 179 395 993
225 117 23 54 179 395 992
0 0 0 0 0 0 0
0 0 0 1 0 0 1
22493 9236 12439 17794 44844 145298 252104
355499 33155 41467 63906 188550 1091135 1773712
354484 32998 41328 63696 188028 1088750 1769283
477 67 76 116 360 2128 3225
538 90 63 94 162 256 1203
0 21 95347 105332 31 7 200738
856969 27 15 9 12 43 857074
422046 2 1 0 0 1 422049
275217 10 7 3 3 8 275248
115571 15 7 5 9 34 115641
44136 0 0 0 0 0 44136
62000 16284 19377 24174 36625 145820 304279
59425 13881 13523 19059 29843 114300 250032
39 56 533 256 100 298 1283
0 0 0 0 3 19 22
2433 2319 5228 4697 6178 26316 47170
103 27 92 162 501 4888 5773
399675 170264 340367 1334793 5915961 16702267 24863326
19621 22240 69578 574383 2054939 2708586 5449346
8 351 1901 17624 64682 64544 149110
0 1 1421 12191 82648 107515 203775
2 8 2713 29286 138204 250153 420365
1 8 2471 29872 140583 324687 497621
47 356 3579 25937 145964 206807 382689
1 4 428 7203 64286 151494 223415
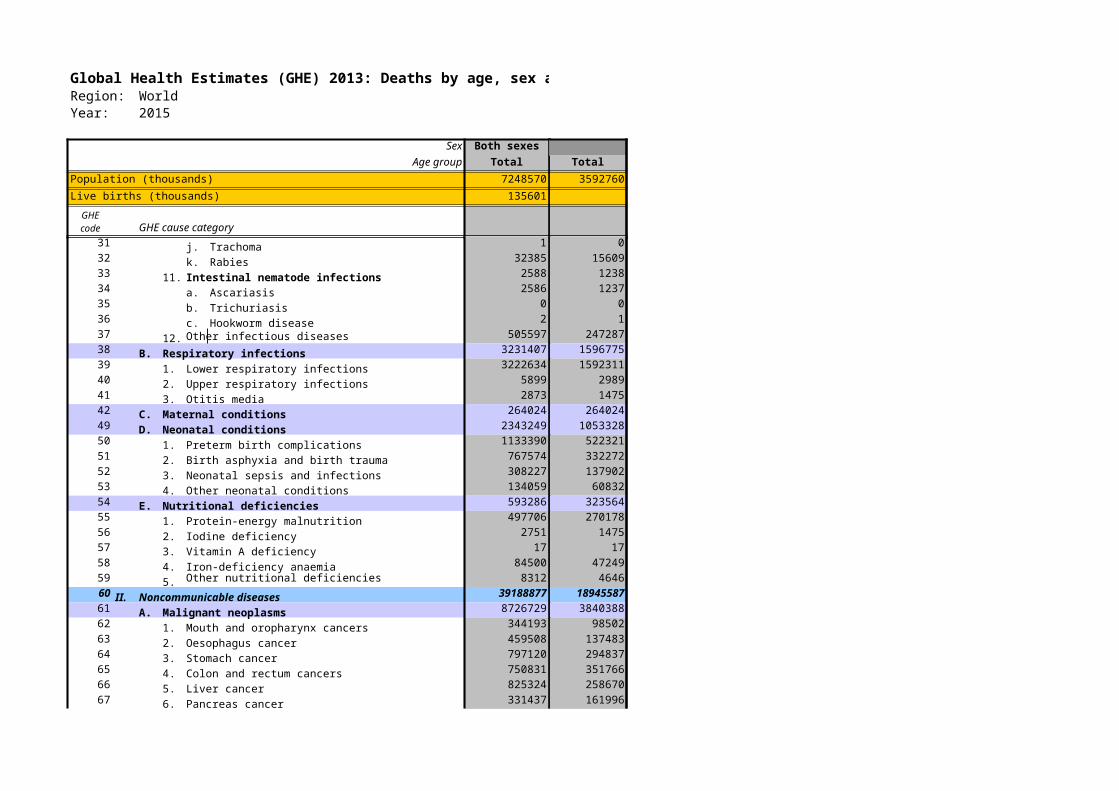
Global Health Estimates (GHE) 2013: Deaths by age, sex and causeRegion: WorldYear: 2030
Sex Both sexes
Age group Total
Population (thousands) 8283372
Live births (thousands) 131994
GHE cause categoryGHE code
68 7. Trachea, bronchus, lung cancers 2413401
69 8. Melanoma and other skin cancers 136175
70 9. Breast cancer 805116
71 10. Cervix uteri cancer 442926
72 11. Corpus uteri cancer 117505
73 12. Ovary cancer 217864
74 13. Prostate cancer 541242
75 14. Bladder cancer 292463
76 15. Lymphomas, multiple myeloma 521800
77 16. Leukaemia 387567
78 Other malignant neoplasms 1699938
79 B. Other neoplasms 308888
80 C. Diabetes mellitus 2464252
81 D. Endocrine, blood, immune disorders 685522
82 E. Mental and behavioral disorders 265547
83 1. Unipolar depressive disorders 5074
84 2. Bipolar disorder 807
85 3. Schizophrenia 24161
86 4. Alcohol use disorders 105505
87 5. Drug use disorders 90001
88 6. Anxiety disorders 82
89 7. Eating disorders 6755
90 8. Pervasive developmental disorders 0
91 9. Childhood behavioural disorders 0
92 10. Idiopathic intellectual disability 1814
93 11. Other mental and behavioural disorders 31348
94 F. Neurological conditions 1838393
95 1. Alzheimer's disease and other dementias 966271
96 2. Parkinson's disease 170382
97 3. Epilepsy 236994
98 4. Multiple sclerosis 21386
Female
0-4 years 5-14 years 15-29 years 30-49 years 50-69 years 70+ years Total
308399 614397 888961 1108208 832174 360867 4113006
4 14 517 38796 279750 426593 745674
4 8 863 4631 16257 34579 56342
1 4 4229 151533 370854 278494 805116
1 0 15746 90851 211749 124580 442926
0 1 217 7372 50117 59797 117505
3 16 4155 28182 94882 90626 217864
0 0 0 0 0 0 0
2 1 215 2692 15778 51332 70019
2798 6567 8644 20736 68138 114570 221453
4890 8031 12578 20736 47543 73359 167136
11859 6870 9900 86741 263507 349458 728335
1779 2097 2661 13803 35558 88764 144663
3808 4718 13206 57752 449826 839167 1368478
33210 33050 31084 33627 68511 188121 387603
97 1348 7508 17910 24444 34120 85427
1 0 17 131 369 2676 3195
0 0 3 25 124 348 499
0 0 433 2413 3644 5890 12380
0 0 636 5541 10259 4500 20935
0 1061 5438 8317 6996 7320 29131
0 0 0 2 4 17 23
0 151 730 734 667 1614 3895
0 0 0 0 0 0 0
0 0 0 0 0 0 0
7 21 52 149 271 321 821
89 116 199 598 2110 11434 14547
22461 26349 37376 50109 112640 823030 1071966
92 1324 972 1574 17509 609760 631231
3 0 328 656 6526 68696 76208
13490 16865 22463 19476 14665 20003 106961
0 3 391 2376 5646 4641 13057
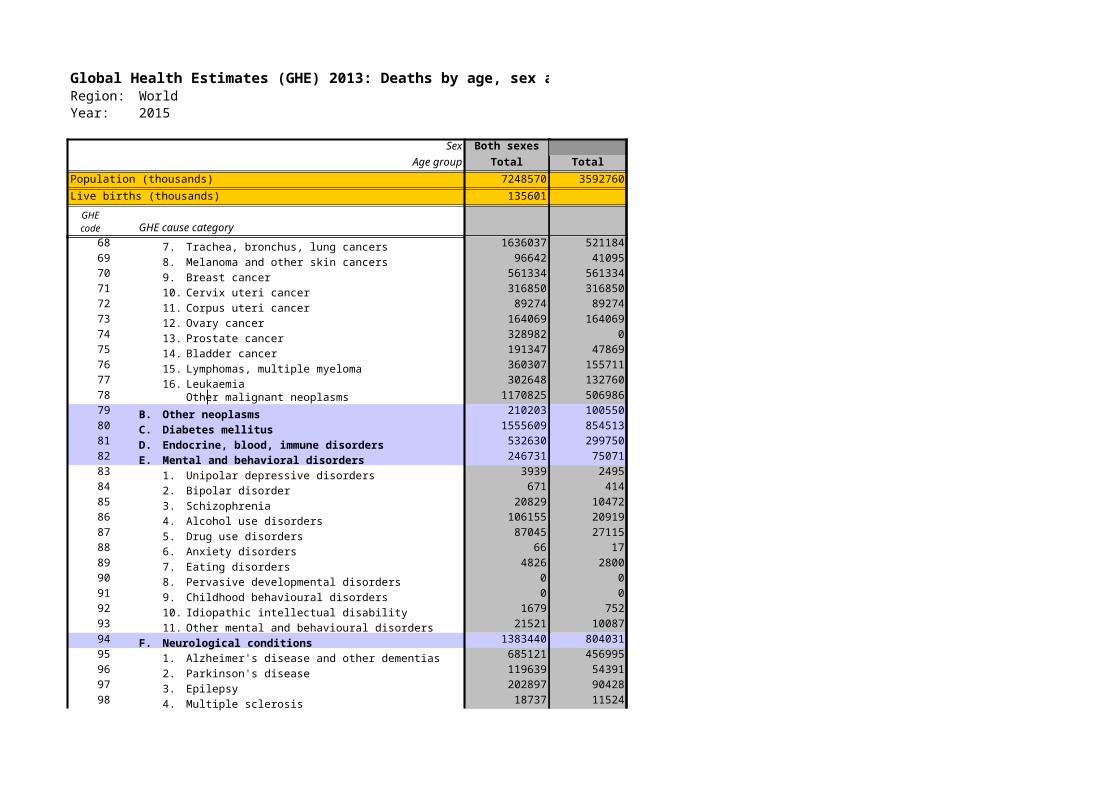
Global Health Estimates (GHE) 2013: Deaths by age, sex and causeRegion: WorldYear: 2030
Sex Both sexes
Age group Total
Population (thousands) 8283372
Live births (thousands) 131994
GHE cause categoryGHE code
99 5. Migraine 18
100 6. Non-migraine headache 0
101 7. Other neurological conditions 443342
102 G. Sense organ diseases 1380
103 1. Glaucoma 72
104 2. Cataracts 15
105 3. Refractive errors 0
106 4. Macular degeneration 0
107 5. Other vision loss 0
108 6. Other hearing loss 6
109 7. other sense organ disorders 1288
110 H. Cardiovascular diseases 22245271
111 1. Rheumatic heart disease 459991
112 2. Hypertensive heart disease 1457306
113 3. Ischaemic heart disease 9245111
114 4. Stroke 8578124
115 5. Cardiomyopathy, myocarditis, endocarditis 575551
116 6. Other circulatory diseases 1929188
117 I. Respiratory diseases 5956734
118 1. Chronic obstructive pulmonary disease 4568157
119 2. Asthma 609594
120 3. Other respiratory diseases 778984
121 J. Digestive diseases 2818588
122 1. Peptic ulcer disease 355639
123 2. Cirrhosis of the liver 1200605
124 3. Appendicitis 52299
125 Other digestive diseases 1210045
126 K. Genitourinary diseases 1565663
127 1. Kidney diseases 1151509
128 2. Hyperplasia of prostate 9974
129 3. Urolithiasis 36934
Female
0-4 years 5-14 years 15-29 years 30-49 years 50-69 years 70+ years Total
308399 614397 888961 1108208 832174 360867 4113006
0 0 1 4 1 7 13
0 0 0 0 0 0 0
8877 8157 13222 26024 68294 119924 244497
2 2 69 16 137 555 780
0 0 0 0 2 36 38
0 0 0 0 0 5 5
0 0 0 0 0 0 0
0 0 0 0 0 0 0
0 0 0 0 0 0 0
0 0 0 0 0 3 3
2 2 69 16 135 511 735
32231 23776 82574 340219 2037223 8712534 11228556
1103 4174 12757 27996 67436 135070 248537
1571 1140 3888 23909 148524 652791 831823
4963 3913 22724 116662 814953 3424385 4387599
11479 6685 23129 122367 836106 3490472 4490237
6769 3264 7859 18741 53091 158746 248470
6347 4600 12216 30543 117113 851071 1021890
25450 8351 18970 58249 546993 1965412 2623425
8246 1478 5971 27215 419730 1556641 2019281
3338 3159 5963 18566 77452 160834 269312
13866 3715 7035 12468 49811 247936 334831
14543 16940 28394 98626 335343 696535 1190380
997 1417 3949 13064 42823 92514 154763
3512 4227 10725 53266 171043 177688 420461
1278 2460 1886 2542 5725 9942 23833
8756 8836 11834 29754 115752 416391 591323
13532 11158 24356 63457 193133 461122 766758
10679 9338 18880 48866 152454 325398 565615
0 0 0 0 0 0 0
0 228 294 1320 4016 8242 14100

Global Health Estimates (GHE) 2013: Deaths by age, sex and causeRegion: WorldYear: 2030
Sex Both sexes
Age group Total
Population (thousands) 8283372
Live births (thousands) 131994
GHE cause categoryGHE code
130 4. Other genitourinary diseases 356736
131 5. Infertility 0
132 6. Gynecological diseases 10510
133 L. Skin diseases 159994
134 M. Musculoskeletal diseases 270982
135 1. Rheumatoid arthritis 82570
136 2. Osteoarthritis 6249
137 3. Gout 747
138 4. Back and neck pain 5201
139 Other musculoskeletal disorders 176215
140 N. Congenital anomalies 582630
141 1. Neural tube defects 91832
142 2. Cleft lip and cleft palate 4320
143 3. Down's syndrome 21915
144 4. Congenital heart anomalies 221717
145 5. Other chromosomal anomalies 23004
146 6. Other congenital anomalies 219842
147 O. Oral conditions 1706
148 1. Dental caries 1085
149 2. Periodontal disease 49
150 3. Edentulism 573
151 III. Injuries 6296659
152 A. Unintentional injuries 4740269
153 1. Road injury 1853581
154 2. Poisonings 197712
155 3. Falls 976270
156 4. Fire, heat and hot substances 305155
157 5. Drowning 376519
158 6. Exposure to forces of nature 0
159 7. Other unintentional injuries 1031032
160 B. Intentional injuries 1556391
Female
0-4 years 5-14 years 15-29 years 30-49 years 50-69 years 70+ years Total
308399 614397 888961 1108208 832174 360867 4113006
2854 1592 4132 10639 33922 123394 176534
0 0 0 0 0 0 0
0 0 1050 2632 2740 4088 10510
4917 1942 3310 5623 13568 54248 83607
74 3065 9468 14461 33815 111238 172120
1 1058 1440 3092 11066 31330 47986
2 0 0 20 198 4137 4357
0 0 0 0 16 209 226
0 0 2 29 273 2111 2415
71 2006 8025 11320 22261 73452 117136
227946 15227 11807 6531 9578 18150 289239
43218 1748 936 436 393 671 47403
1410 1 1 0 1 2 1415
8235 820 714 741 1619 193 12322
78270 6140 6464 3207 3580 10933 108594
11746 521 355 154 311 184 13271
85067 5997 3338 1993 3673 6166 106233
2 1 8 28 253 685 977
2 1 8 28 65 512 616
0 0 0 0 4 13 17
0 0 0 0 184 160 345
139310 123708 300799 349264 449226 806775 2169082
130233 104551 181952 222625 343366 723781 1706508
31119 26918 84692 101378 134366 99269 477742
7621 5229 13448 18655 17355 17443 79751
10374 9859 9767 19463 75619 354054 479137
23147 18083 26540 24950 21452 34418 148589
19555 19599 15501 15299 23016 33664 126635
0 0 0 0 0 0 0
38417 24863 32003 42880 71558 184933 394655
9077 19158 118847 126638 105860 82994 462574
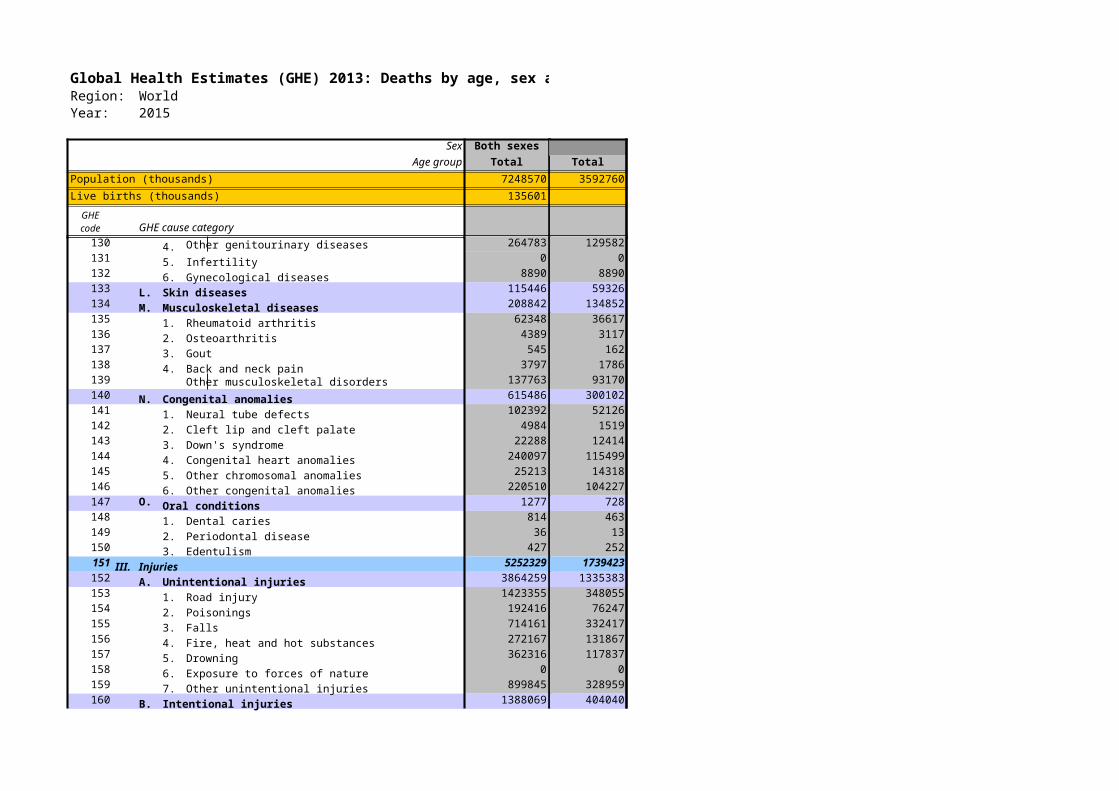
Global Health Estimates (GHE) 2013: Deaths by age, sex and causeRegion: WorldYear: 2030
Sex Both sexes
Age group Total
Population (thousands) 8283372
Live births (thousands) 131994
GHE cause categoryGHE code
161 1. Self-harm 1007387
162 2. Interpersonal violence 485828
163 3. Collective violence and legal intervention 63175
Female
0-4 years 5-14 years 15-29 years 30-49 years 50-69 years 70+ years Total
308399 614397 888961 1108208 832174 360867 4113006
2 6902 77634 90514 90243 72617 337911
8642 10218 37585 33231 14321 10018 114015
433 2038 3628 2893 1297 360 10648


![[Translated by Rai Bahadur Srisa Chandra Vasu] Ghe(BookZZ.org)](https://img.pdfslide.us/doc/110x75/577c79101a28abe054914704/translated-by-rai-bahadur-srisa-chandra-vasu-ghebookzzorg.jpg)