Embed Size (px)
Citation preview
GGELS – Evaluation of the livestock´s
sector contribution to the EU GHG
emissions
European Commission
DG Agriculture and Rural Development
GGELS – Evaluation of the livestock´s sector contribution to the EU greenhouse gas emissions 2
Starting point
18%18%
GGELS – Evaluation of the livestock´s sector contribution to the EU greenhouse gas emissions 3
GGELS (1)
• Objective: Provide estimate of the net GHG emissions of the livestock sector
in EU27.
• Animal species: Beef and dairy cattle, small ruminants (sheep and goats) ,
pigs and poultry.
•Products: Meat (beef, pork, poultry, sheep and goats), milk (cow, sheep and
goats) and eggs.
•Livestock systems: BOMILK (dairy cattle), BOMEAT (meat from bovine),
POUFAT (meat from poultry), LAHENS (egg production), SHGOAT (meat &
milk from sheep and goat) and PORCIN (pig production)
•Food chain aproach (cradle to farm gate) – Spacial detail NUTS2
GGELS – Evaluation of the livestock´s sector contribution to the EU greenhouse gas emissions 4
GGELS (2)
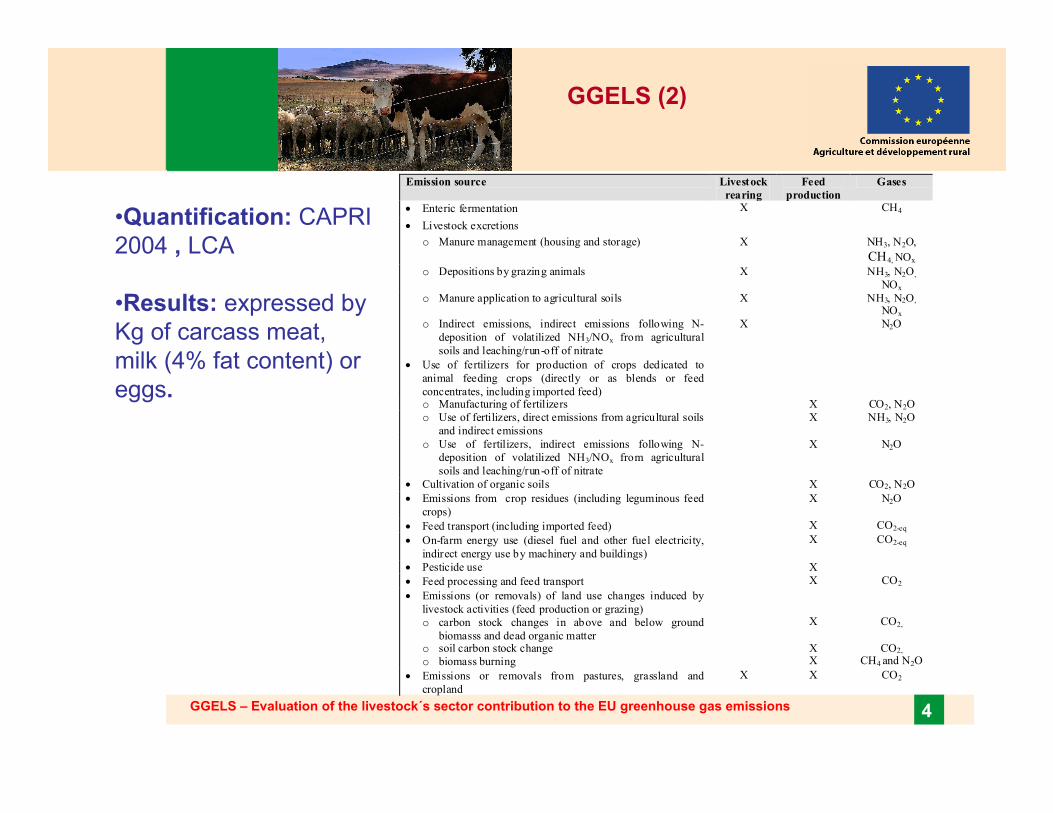
•Quantification: CAPRI
2004 , LCA
•Results: expressed by
Kg of carcass meat,
milk (4% fat content) or
eggs.
Emission source Livestock
rearing
Feed
production
Gases
• Enteric fermentation X CH4
• Livestock excretions
o Manure management (housing and storage) X NH3, N2O,
CH4, NOx
o Depositions by grazing animals X NH3, N2O,
NOx
o Manure application to agricultural soils X NH3, N2O,
NOx
o Indirect emissions, indirect emissions following N-
deposition of volatilized NH3/NOx from agricultural
soils and leaching/run-off of nitrate
X N2O
• Use of fertilizers for production of crops dedicated to
animal feeding crops (directly or as blends or feed
concentrates, including imported feed)
o Manufacturing of fertilizers X CO2, N2O
o Use of fertilizers, direct emissions from agricultural soils
and indirect emissions
X NH3, N2O
o Use of fertilizers, indirect emissions following N-
deposition of volatilized NH3/NOx from agricultural
soils and leaching/run-off of nitrate
X N2O
• Cultivation of organic soils X CO2, N2O
• Emissions from crop residues (including leguminous feed
crops)
X N2O
• Feed transport (including imported feed) X CO2-eq
• On-farm energy use (diesel fuel and other fuel electricity,
indirect energy use by machinery and buildings)
X CO2-eq
• Pesticide use X
• Feed processing and feed transport X CO2
• Emissions (or removals) of land use changes induced by
livestock activities (feed production or grazing)
o carbon stock changes in above and below ground
biomasss and dead organic matter o soil carbon stock change
o biomass burning
X
X X
CO2,
CO2,
CH4 and N2O
• Emissions or removals from pastures, grassland and
cropland
X X CO2
GGELS – Evaluation of the livestock´s sector contribution to the EU greenhouse gas emissions 5
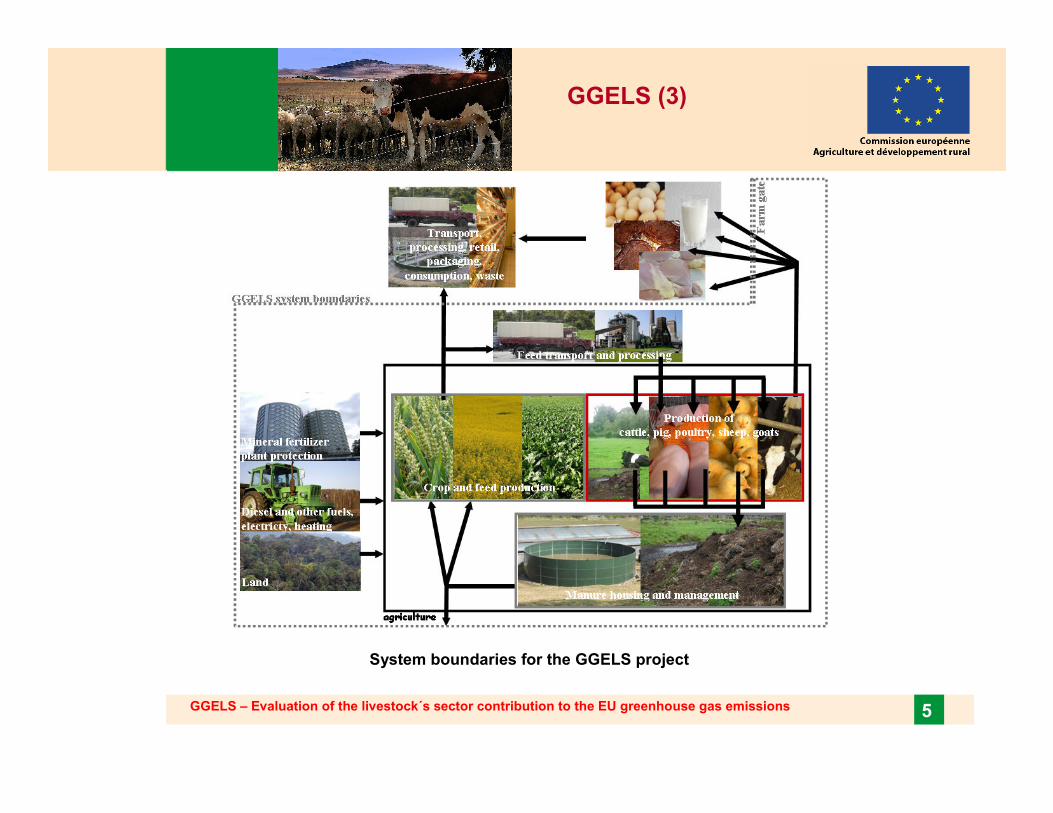
GGELS (3)
System boundaries for the GGELS project
GGELS – Evaluation of the livestock´s sector contribution to the EU greenhouse gas emissions 6
Limitations
• Assesment of animal production systems in Europe, not considering
from a consumer´s perspective.
•Brief assesment of GHG emissions of the most important imported animal products
(bovine and chicken meat Brazil, sheepmeat from NZ)
•Dificult to provide a realistic quantification of emission abatement
potentials – technological reduction measures / policy mitigation options
•Nevertheless, policy options and reduction measures where explored
•Environmental effects other than GHG and NH3 emissions and
biodiversity under present conditions where not considered
•Uncertainty of the estimates
GGELS – Evaluation of the livestock´s sector contribution to the EU greenhouse gas emissions 7
Structure
• Overview of the EU livestock sector
•Typology of livestock production systems in Europe
•Methodology for quantification of GHG and ammonia from the sector
•Comparison of emissions CAPRI / National inventories
•Quantification of GHG emissions / LCA
•Technological abatement measures
•Prospective overview of EU livestock emissions
1st phase
2nd phase
GGELS – Evaluation of the livestock´s sector contribution to the EU greenhouse gas emissions 8
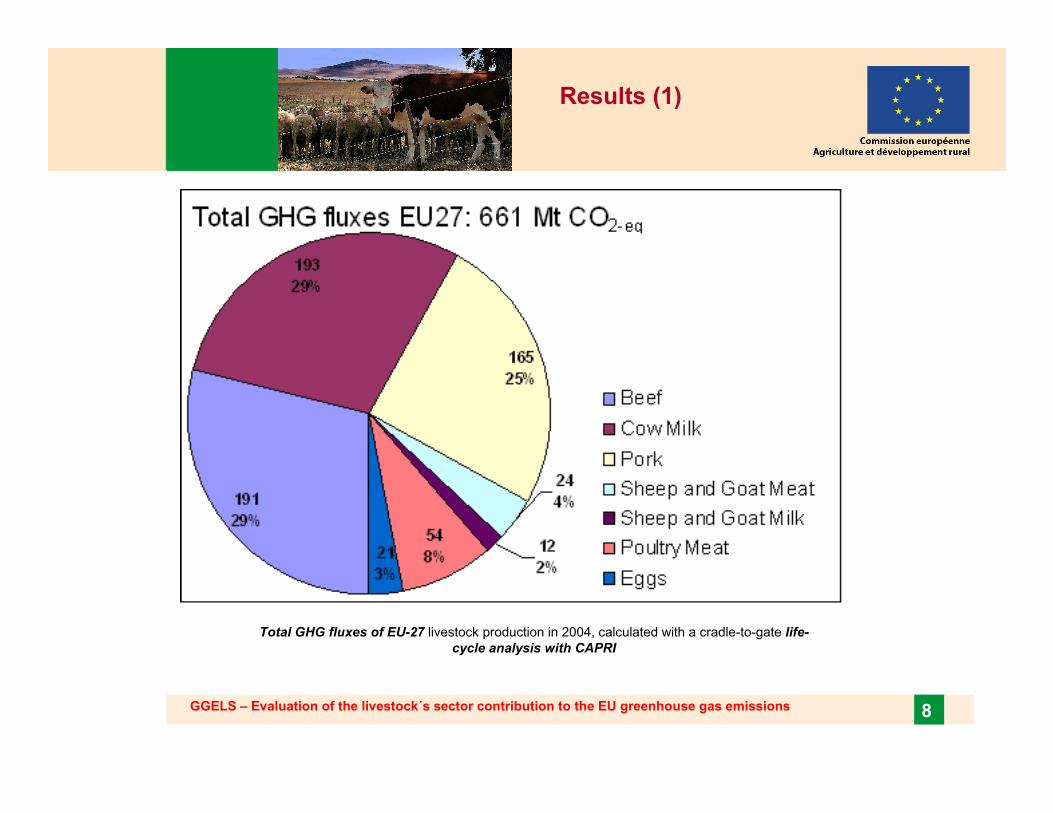
Results (1)
Total GHG fluxes of EU-27 livestock production in 2004, calculated with a cradle-to-gate life-
cycle analysis with CAPRI
GGELS – Evaluation of the livestock´s sector contribution to the EU greenhouse gas emissions 9
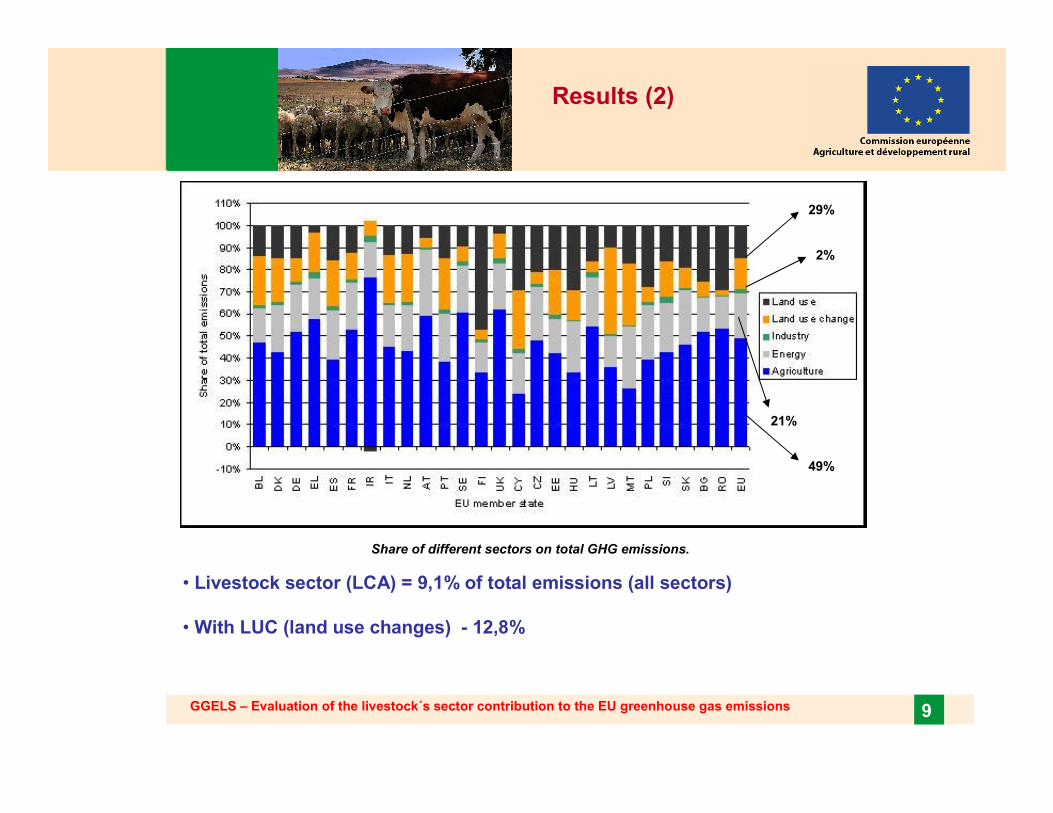
Results (2)
Share of different sectors on total GHG emissions.
49%
21%
2%
29%
• Livestock sector (LCA) = 9,1% of total emissions (all sectors)
• With LUC (land use changes) - 12,8%
GGELS – Evaluation of the livestock´s sector contribution to the EU greenhouse gas emissions 10
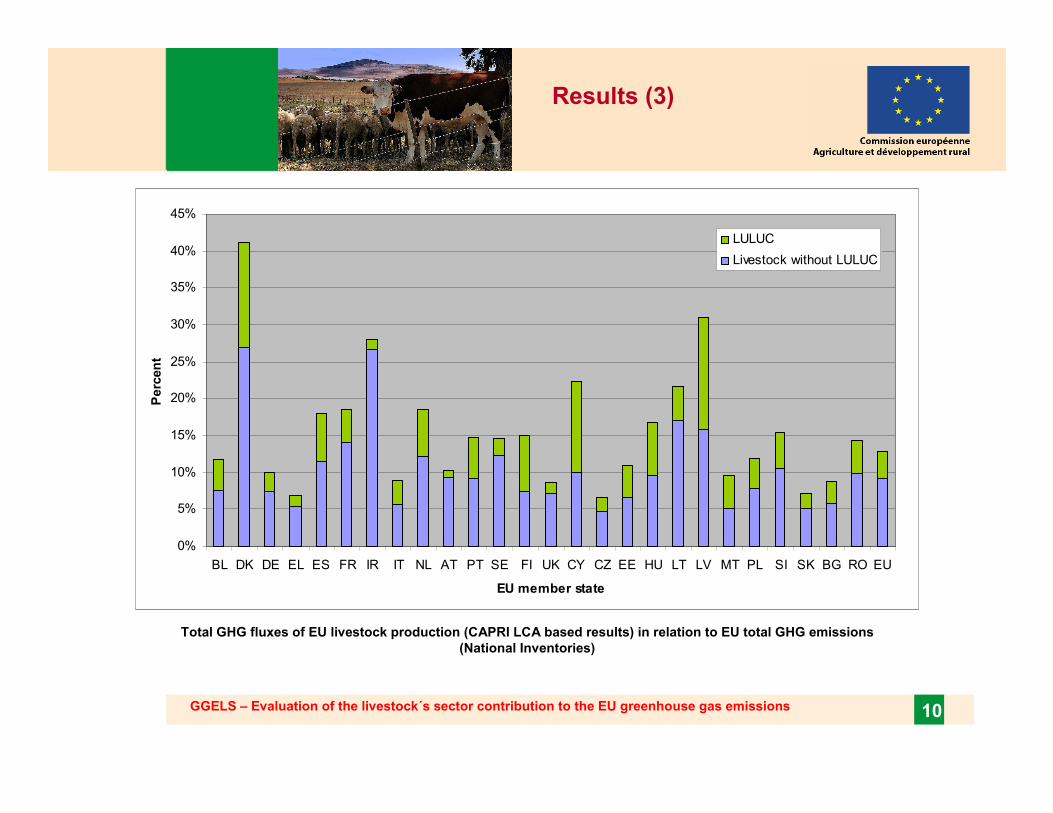
Results (3)
0%
5%
10%
15%
20%
25%
30%
35%
40%
45%
BL DK DE EL ES FR IR IT NL AT PT SE FI UK CY CZ EE HU LT LV MT PL SI SK BG RO EU
EU member state
Percent
LULUC
Livestock without LULUC
Total GHG fluxes of EU livestock production (CAPRI LCA based results) in relation to EU total GHG emissions
(National Inventories)
GGELS – Evaluation of the livestock´s sector contribution to the EU greenhouse gas emissions 11
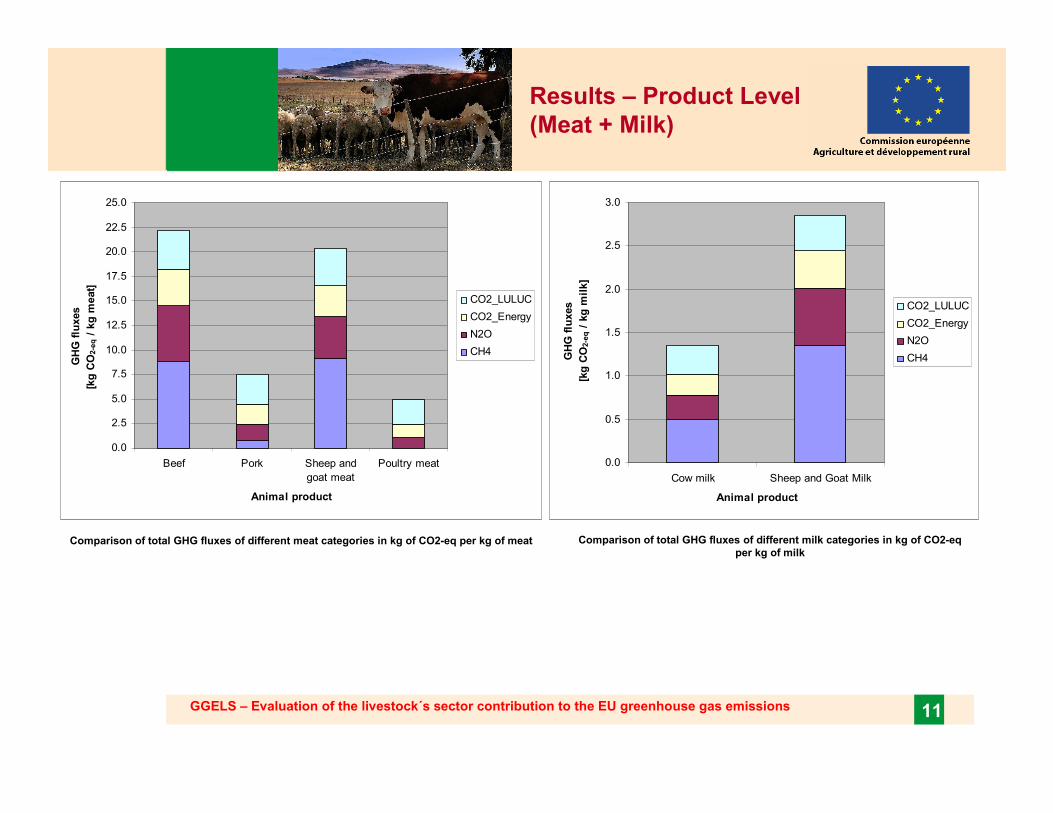
Results – Product Level
(Meat + Milk)
0.0
0.5
1.0
1.5
2.0
2.5
3.0
Cow milk Sheep and Goat Milk
Animal product
CO2_LULUC
CO2_Energy
N2O
CH4GHG fluxes
[kg CO2-eq / kg milk]
Comparison of total GHG fluxes of different milk categories in kg of CO2-eq
per kg of milk
0.0
2.5
5.0
7.5
10.0
12.5
15.0
17.5
20.0
22.5
25.0
Beef Pork Sheep and
goat meat
Poultry meat
Animal product
CO2_LULUC
CO2_Energy
N2O
CH4
GHG fluxes
[kg CO2-eq / kg m
eat]
Comparison of total GHG fluxes of different meat categories in kg of CO2-eq per kg of meat
GGELS – Evaluation of the livestock´s sector contribution to the EU greenhouse gas emissions 12
Technological abatement
measures (1)
• Based on literature data review:
•estimated reduction potential of 55-70 Mt CO2-eq
(15-19% of current GHG emissions)
•However:
•Large uncertainties
•Results depending in baseline climates, soil types, farm production systems
•Limited number of studies
•High variability in systems and management practices
GGELS – Evaluation of the livestock´s sector contribution to the EU greenhouse gas emissions 13
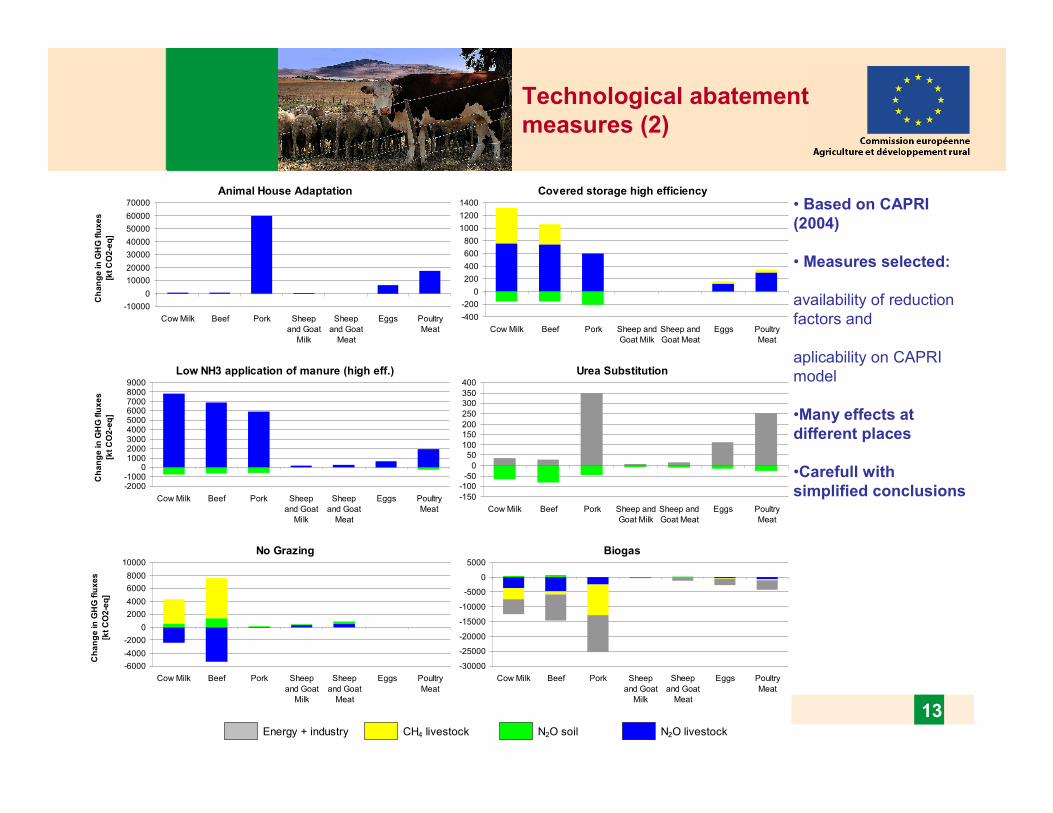
Technological abatement
measures (2)
• Based on CAPRI
(2004)
• Measures selected:
availability of reduction
factors and
aplicability on CAPRI
model
•Many effects at
different places
•Carefull with
simplified conclusions
Animal House Adaptation
-10000
0
10000
20000
30000
40000
50000
60000
70000
Cow Milk Beef Pork Sheep
and Goat
Milk
Sheep
and Goat
Meat
Eggs Poultry
Meat
Covered storage high efficiency
-400
-200
0
200
400
600
800
1000
1200
1400
Cow Milk Beef Pork Sheep and
Goat Milk
Sheep and
Goat Meat
Eggs Poultry
Meat
Low NH3 application of manure (high eff.)
-2000-1000
0100020003000400050006000700080009000
Cow Milk Beef Pork Sheep
and Goat
Milk
Sheep
and Goat
Meat
Eggs Poultry
Meat
Urea Substitution
-150
-100
-50
0
50
100
150
200
250
300
350
400
Cow Milk Beef Pork Sheep and
Goat Milk
Sheep and
Goat Meat
Eggs Poultry
Meat
No Grazing
-6000
-4000
-2000
0
2000
4000
6000
8000
10000
Cow Milk Beef Pork Sheep
and Goat
Milk
Sheep
and Goat
Meat
Eggs Poultry
Meat
Biogas
-30000
-25000
-20000
-15000
-10000
-5000
0
5000
Cow Milk Beef Pork Sheep
and Goat
Milk
Sheep
and Goat
Meat
Eggs Poultry
Meat
Energy + industry CH4 livestock N2O soil N2O livestock
Change in GHG fluxes
[kt CO2-eq]
Change in GHG fluxes
[kt CO2-eq]
Change in GHG fluxes
[kt CO2-eq]
GGELS – Evaluation of the livestock´s sector contribution to the EU greenhouse gas emissions 14
Prpospective overview/
Exploratory aproach (1)
• Set of policy scenarios:connstrained by the target of 20% emissions reduction in 2020
•Reference or Baseline Scenario (REF) - takes into account the most likely
developments of agricultural markets, including the full implementation of the Health Check.
•Emission Standard Scenario (STD) - linked to an emission abatement standard
homogenous across MS.
•Emission Standard Scenario according to a specific Effort Sharing
Agreement for Agriculture (ESAA)
•Livestock Tax Scenario (LTAX) - which introduces regionally homogenous taxes per
ruminants.
•Tradable Emission Permits Scenario according to an Emission Trading
Scheme for Agriculture (ETSA): - This scenario is linked to a regionally homogenous
emission 'cap' set on total GHG emissions in MS. According to this 'cap' tradable emission
permits are issued to farmers and trade of emission permits is allowed at regional and EU-
wide level.
GGELS – Evaluation of the livestock´s sector contribution to the EU greenhouse gas emissions 15
Prpospective overview/
Exploratory aproach (2)
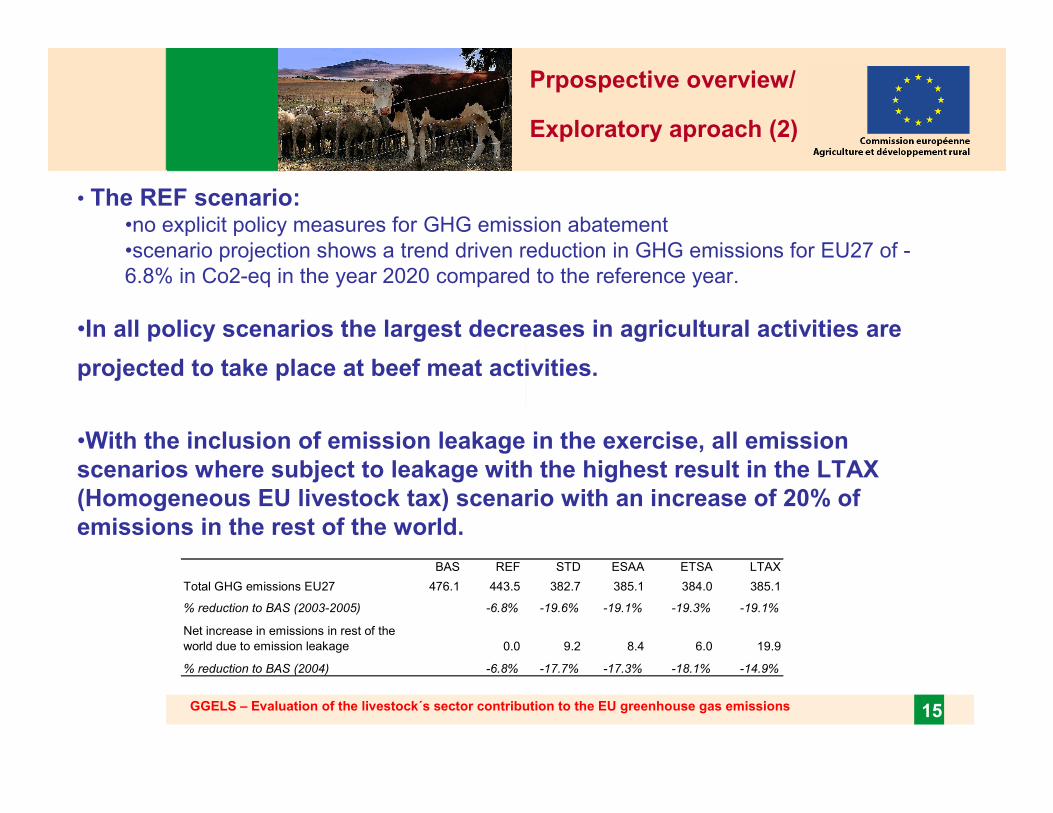
• The REF scenario:•no explicit policy measures for GHG emission abatement
•scenario projection shows a trend driven reduction in GHG emissions for EU27 of -
6.8% in Co2-eq in the year 2020 compared to the reference year.
•In all policy scenarios the largest decreases in agricultural activities are
projected to take place at beef meat activities.
•With the inclusion of emission leakage in the exercise, all emission
scenarios where subject to leakage with the highest result in the LTAX
(Homogeneous EU livestock tax) scenario with an increase of 20% of
emissions in the rest of the world.
BAS REF STD ESAA ETSA LTAX
Total GHG emissions EU27 476.1 443.5 382.7 385.1 384.0 385.1
% reduction to BAS (2003-2005) -6.8% -19.6% -19.1% -19.3% -19.1%
Net increase in emissions in rest of the
world due to emission leakage 0.0 9.2 8.4 6.0 19.9
% reduction to BAS (2004) -6.8% -17.7% -17.3% -18.1% -14.9%
GGELS – Evaluation of the livestock´s sector contribution to the EU greenhouse gas emissions 16
Estimation emissions
imported products
•Emissions from major imported animal products were calculated:
•Beef and poultry meat from Brazil and Sheepmeat from New Zealand
•with a different methodology
•Therefore, not directly comparable with other results of the study.
•33 kg CO2-eq/kg where estimated for sheep meat from New Zealand
•80 or 48 kg CO2-eq/kg for beef from Brazil (with or without LUC)
•1.2 kg CO2-eql/kg for chicken from Brazil.
•However, the estimate LUC emissions is highly uncertain and must be used
with caution.
•The reason for the higher GHG emissions from Brazilian beef (even without
considering LUC emissions) is the lower productivity and also lower
digestibility of the feed and thus higher CH4 emissions.
GGELS – Evaluation of the livestock´s sector contribution to the EU greenhouse gas emissions 17
Conclusions – EU approach
to livestock emissions
► EU commitment to reduce GHG emissions
► EU climate policy instruments not sector specific
► MS to decide how to achieve reduction obligation in the non-trading sectors
► EU policy promotes healthy diets and has legislation to ensure food safety - No role in dictating what people should eat
► Fact based information about the GHG impact of different production methods is better than scare-mongering about meat eating
GGELS – Evaluation of the livestock´s sector contribution to the EU greenhouse gas emissions 18
Thank you !
Report available in:
http://ec.europa.eu/agriculture/analysis/external/livestock-gas/index_en.htm