Embed Size (px)
Citation preview
SAP BusinessObjects Business Intelligence Suite2014-11-06
Getting Started with SAP BusinessObjects Web Intelligence
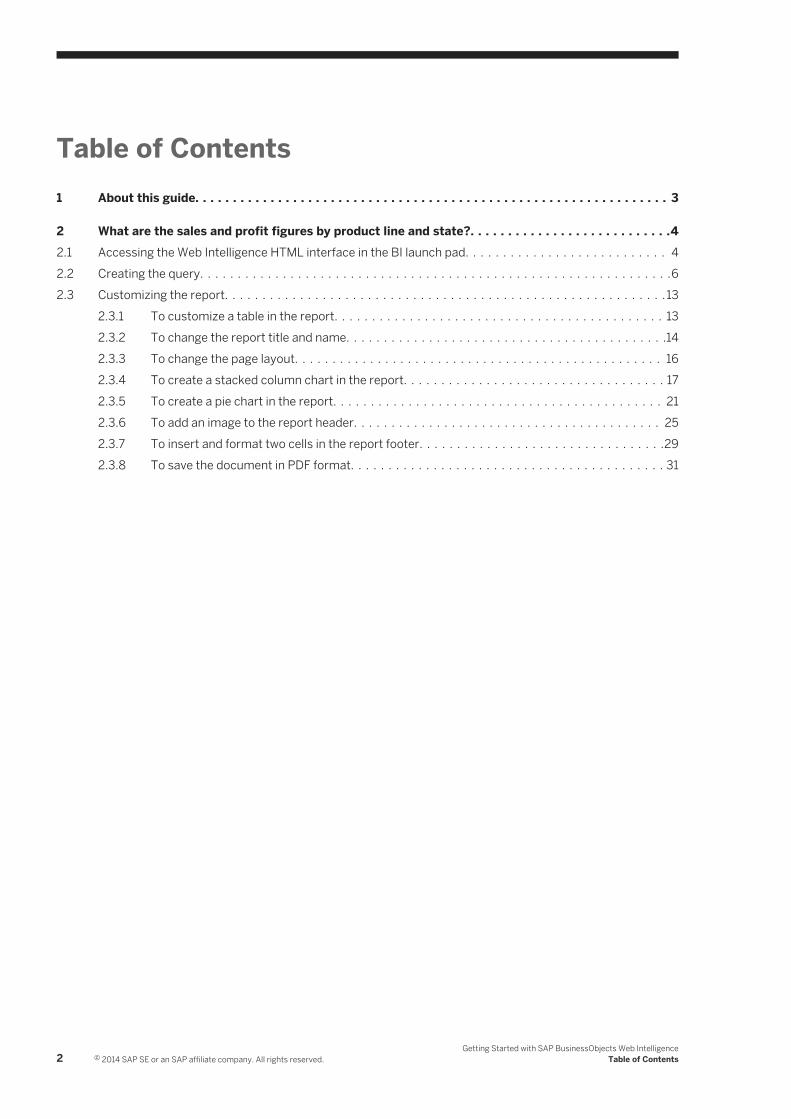
Table of Contents1 About this guide. . . . . . . . . . . . . . . . . . . . . . . . . . . . . . . . . . . . . . . . . . . . . . . . . . . . . . . . . . . . . . . 3
2 What are the sales and profit figures by product line and state?. . . . . . . . . . . . . . . . . . . . . . . . . . .42.1 Accessing the Web Intelligence HTML interface in the BI launch pad. . . . . . . . . . . . . . . . . . . . . . . . . . . 42.2 Creating the query. . . . . . . . . . . . . . . . . . . . . . . . . . . . . . . . . . . . . . . . . . . . . . . . . . . . . . . . . . . . . . .62.3 Customizing the report. . . . . . . . . . . . . . . . . . . . . . . . . . . . . . . . . . . . . . . . . . . . . . . . . . . . . . . . . . .13
2.3.1 To customize a table in the report. . . . . . . . . . . . . . . . . . . . . . . . . . . . . . . . . . . . . . . . . . . . 132.3.2 To change the report title and name. . . . . . . . . . . . . . . . . . . . . . . . . . . . . . . . . . . . . . . . . . .142.3.3 To change the page layout. . . . . . . . . . . . . . . . . . . . . . . . . . . . . . . . . . . . . . . . . . . . . . . . . 162.3.4 To create a stacked column chart in the report. . . . . . . . . . . . . . . . . . . . . . . . . . . . . . . . . . . 172.3.5 To create a pie chart in the report. . . . . . . . . . . . . . . . . . . . . . . . . . . . . . . . . . . . . . . . . . . . 212.3.6 To add an image to the report header. . . . . . . . . . . . . . . . . . . . . . . . . . . . . . . . . . . . . . . . . 252.3.7 To insert and format two cells in the report footer. . . . . . . . . . . . . . . . . . . . . . . . . . . . . . . . .292.3.8 To save the document in PDF format. . . . . . . . . . . . . . . . . . . . . . . . . . . . . . . . . . . . . . . . . . 31
2 © 2014 SAP SE or an SAP affiliate company. All rights reserved.Getting Started with SAP BusinessObjects Web Intelligence
Table of Contents
1 About this guideThis guide shows you how to use the core features of SAP BusinessObjects Web Intelligence to handle a typical business scenario..
Audience
This guide is intended for business users who are using the Web Intelligence HTML interface for the first time. This scenario can also be completed in the Web Intelligence Applet and Rich Client interfaces, however you will encounter slight differences in user interface elements.
What you need to complete the scenario
To do the scenario in this tutorial, you need:
● an Internet browser installed on your PC● a URL to the BI launch pad server at your company or group● your login name and password for the BI launch pad● security rights to use the full Web Intelligence feature set and to access the eFashion universe
NoteYour BI administrator needs to copy the eFashion universe and data source onto the BI platform server and configure your user profile appropriately.
Getting Started with SAP BusinessObjects Web IntelligenceAbout this guide © 2014 SAP SE or an SAP affiliate company. All rights reserved. 3
2 What are the sales and profit figures by product line and state?As a Business Analyst in the Sales Management office of eFashion, you will create a report that shows the sales and profit figures for the eFashion product lines.
eFashion is a national retail store eFashion that sells fashion merchandise in 11 US cities. In the eFashion information system, there is data that you can use to answer your business question. This data is available to you in a universe.
What is a universe? A universe is an abstraction of a data source that presents data to you in non-technical terms. A universe contains dimensions and measures that you combine using a query. This query generates for you a document containing one or more reports.
What is a dimension? A dimension ( ) is collection of related data members, which represents one aspect of a business; for example, products or sales.
What is a measure? In a universe ( ), a measure value, most commonly numerical, is derived from one or more dimensions, for example, sales revenue or profit margin.
In this tutorial, you will do the following:
● Select dimensions and measures to create a query on the eFashion universe.● Use the dimensions and measure you selected in the query to create:
○ A table of data showing the important numbers by state○ A stacked column chart with the sales revenue by product lines per quarter○ A pie chart with the revenue by state
● Format the appearance of the report.
2.1 Accessing the Web Intelligence HTML interface in the BI launch pad
Before building your document in Web Intelligence, you need to log into the BI launch pad. You also need to be sure that the Web Intelligence HTML interface opens when you launch Web Intelligence in the BI launch pad.
Procedure
1. Go to the SAP BI launch pad web site.2. Enter your user name and password, and click Log On.
The BI launch pad opens.
4 © 2014 SAP SE or an SAP affiliate company. All rights reserved.Getting Started with SAP BusinessObjects Web Intelligence
What are the sales and profit figures by product line and state?
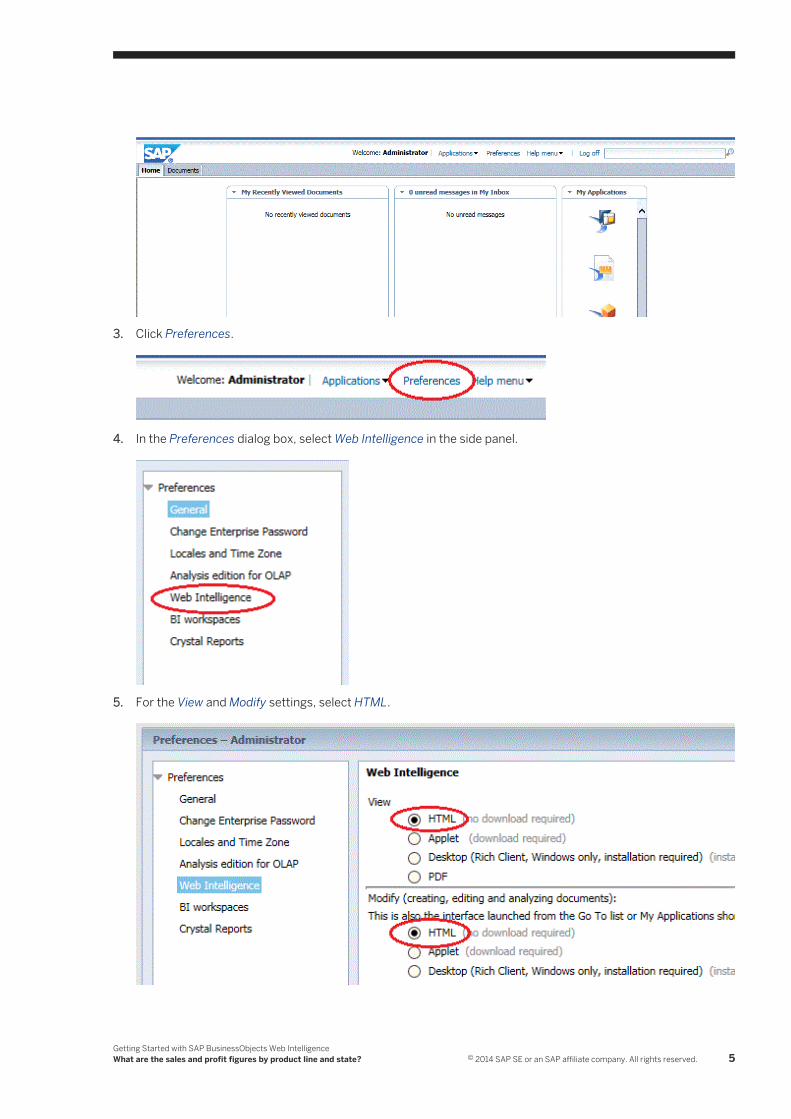
3. Click Preferences.
4. In the Preferences dialog box, select Web Intelligence in the side panel.
5. For the View and Modify settings, select HTML.
Getting Started with SAP BusinessObjects Web IntelligenceWhat are the sales and profit figures by product line and state? © 2014 SAP SE or an SAP affiliate company. All rights reserved. 5
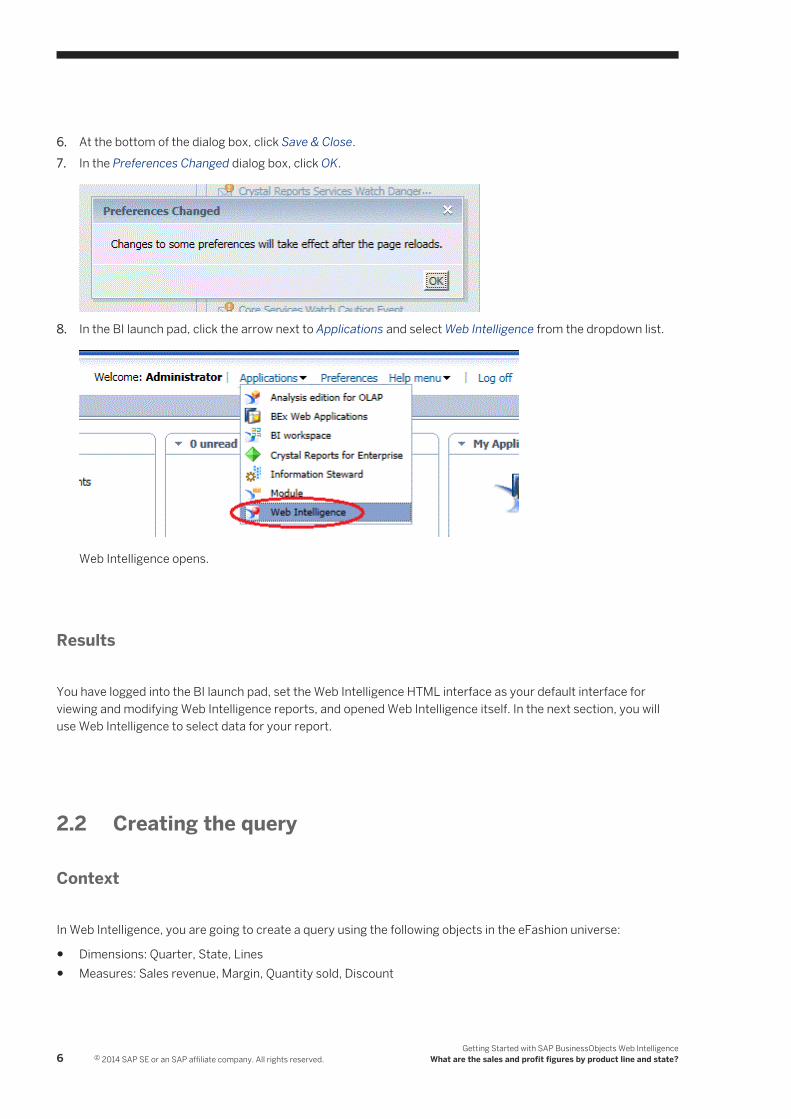
6. At the bottom of the dialog box, click Save & Close.7. In the Preferences Changed dialog box, click OK.
8. In the BI launch pad, click the arrow next to Applications and select Web Intelligence from the dropdown list.
Web Intelligence opens.
Results
You have logged into the BI launch pad, set the Web Intelligence HTML interface as your default interface for viewing and modifying Web Intelligence reports, and opened Web Intelligence itself. In the next section, you will use Web Intelligence to select data for your report.
2.2 Creating the query
Context
In Web Intelligence, you are going to create a query using the following objects in the eFashion universe:
● Dimensions: Quarter, State, Lines● Measures: Sales revenue, Margin, Quantity sold, Discount
6 © 2014 SAP SE or an SAP affiliate company. All rights reserved.Getting Started with SAP BusinessObjects Web Intelligence
What are the sales and profit figures by product line and state?
Procedure
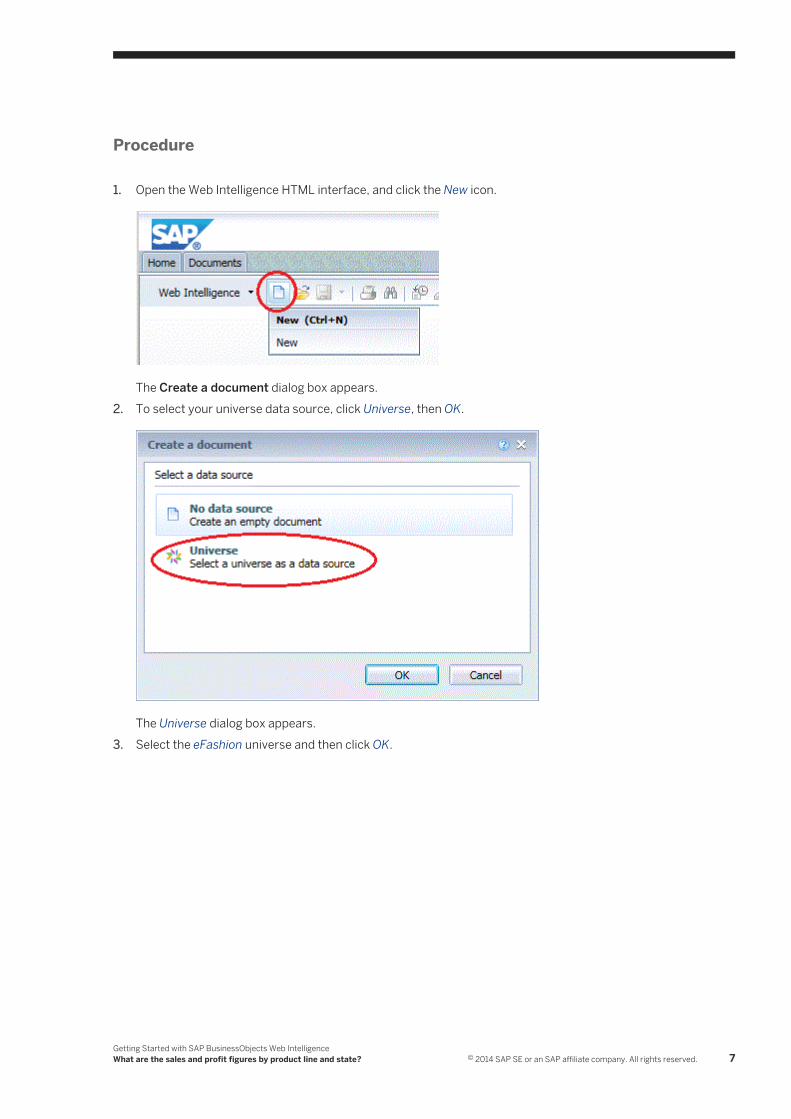
1. Open the Web Intelligence HTML interface, and click the New icon.
The Create a document dialog box appears.2. To select your universe data source, click Universe, then OK.
The Universe dialog box appears.3. Select the eFashion universe and then click OK.
Getting Started with SAP BusinessObjects Web IntelligenceWhat are the sales and profit figures by product line and state? © 2014 SAP SE or an SAP affiliate company. All rights reserved. 7
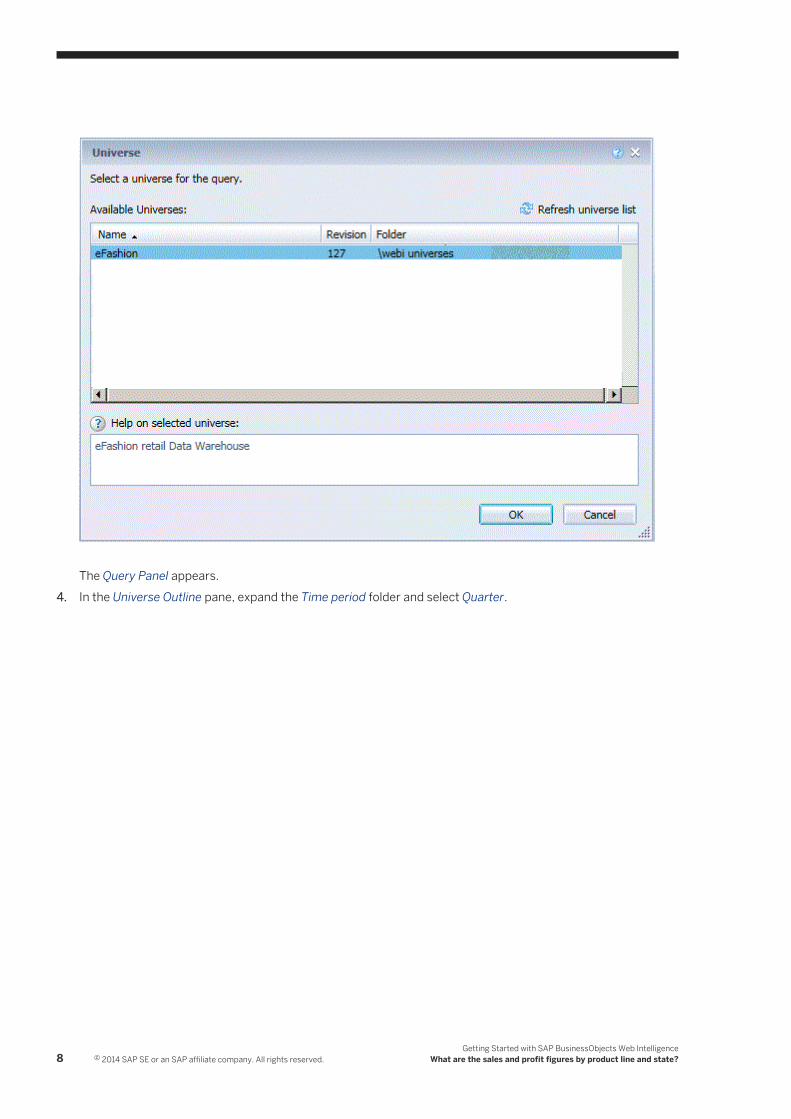
The Query Panel appears.4. In the Universe Outline pane, expand the Time period folder and select Quarter.
8 © 2014 SAP SE or an SAP affiliate company. All rights reserved.Getting Started with SAP BusinessObjects Web Intelligence
What are the sales and profit figures by product line and state?
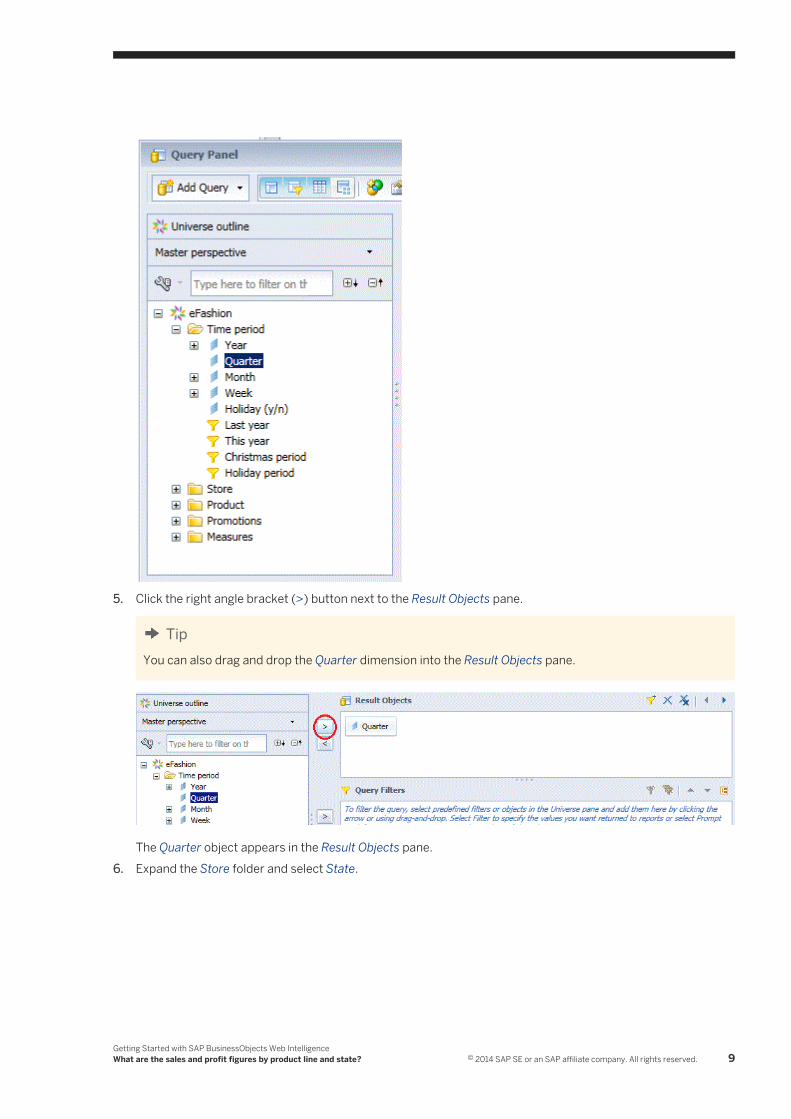
5. Click the right angle bracket (>) button next to the Result Objects pane.
TipYou can also drag and drop the Quarter dimension into the Result Objects pane.
The Quarter object appears in the Result Objects pane.6. Expand the Store folder and select State.
Getting Started with SAP BusinessObjects Web IntelligenceWhat are the sales and profit figures by product line and state? © 2014 SAP SE or an SAP affiliate company. All rights reserved. 9
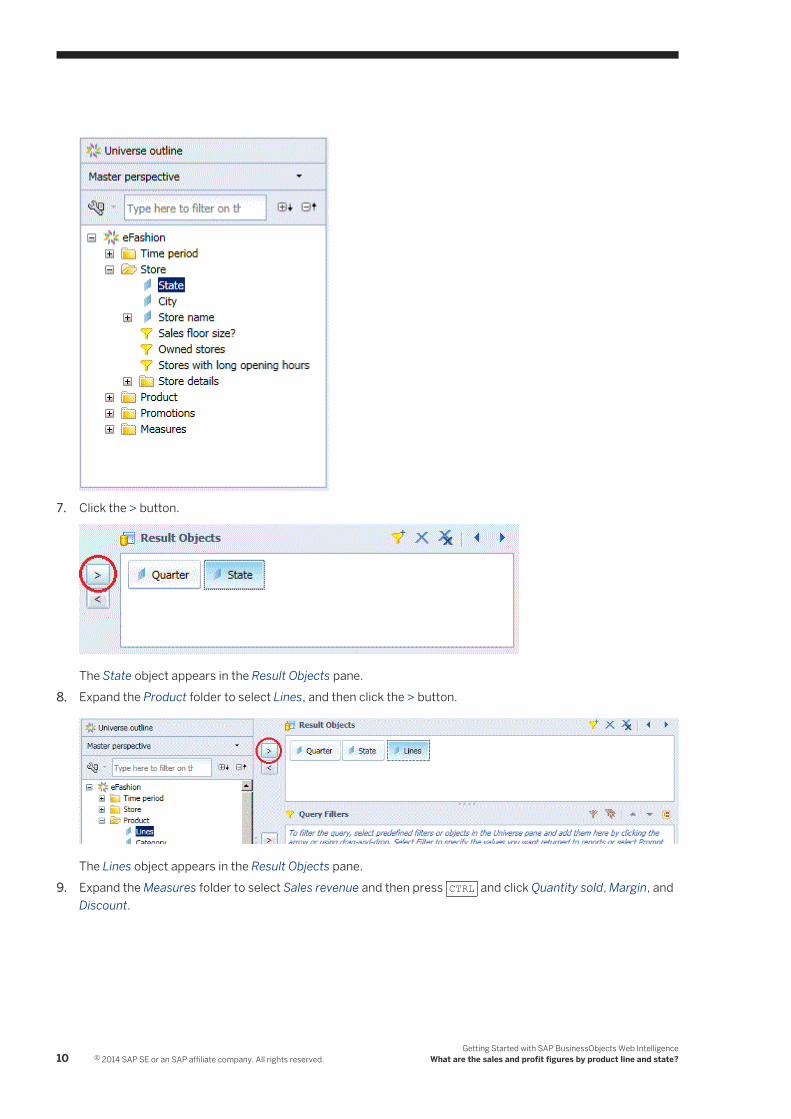
7. Click the > button.
The State object appears in the Result Objects pane.8. Expand the Product folder to select Lines, and then click the > button.
The Lines object appears in the Result Objects pane.9. Expand the Measures folder to select Sales revenue and then press CTRL and click Quantity sold, Margin, and
Discount.
10 © 2014 SAP SE or an SAP affiliate company. All rights reserved.Getting Started with SAP BusinessObjects Web Intelligence
What are the sales and profit figures by product line and state?
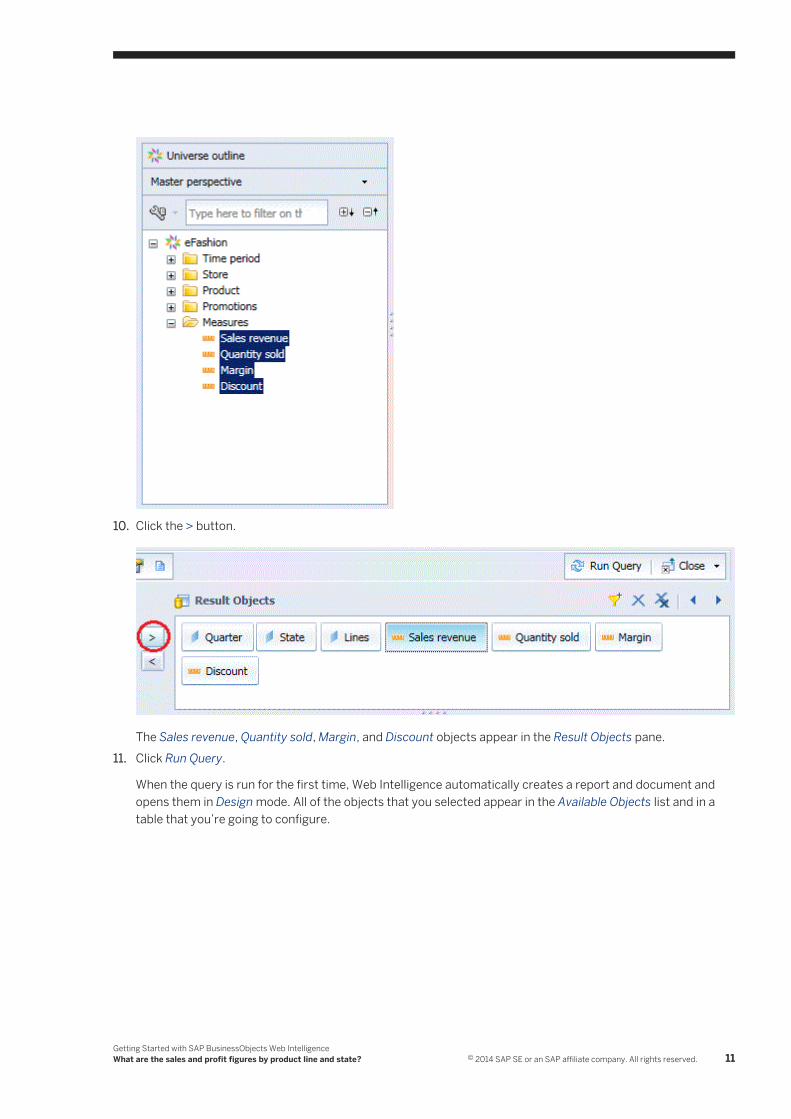
10. Click the > button.
The Sales revenue, Quantity sold, Margin, and Discount objects appear in the Result Objects pane.11. Click Run Query.
When the query is run for the first time, Web Intelligence automatically creates a report and document and opens them in Design mode. All of the objects that you selected appear in the Available Objects list and in a table that you’re going to configure.
Getting Started with SAP BusinessObjects Web IntelligenceWhat are the sales and profit figures by product line and state? © 2014 SAP SE or an SAP affiliate company. All rights reserved. 11
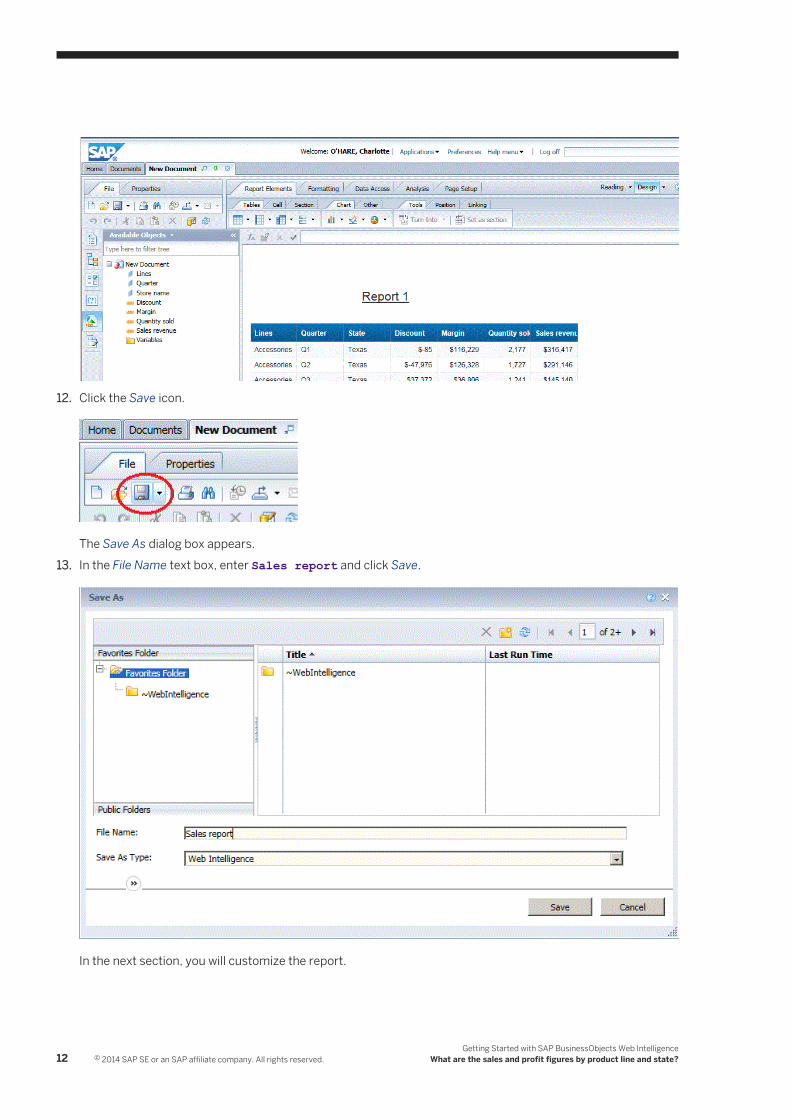
12. Click the Save icon.
The Save As dialog box appears.13. In the File Name text box, enter Sales report and click Save.
In the next section, you will customize the report.
12 © 2014 SAP SE or an SAP affiliate company. All rights reserved.Getting Started with SAP BusinessObjects Web Intelligence
What are the sales and profit figures by product line and state?
2.3 Customizing the report
When you run a query for the first time, a report appears with all of your data in one table.
1. In the report, you want to customize the table to show only the data you need.2. Also, you want to create pie and column charts that show sales revenues by state and product line.3. Finally, you want to add a few formatting elements to the reports.
2.3.1 To customize a table in the report
Context
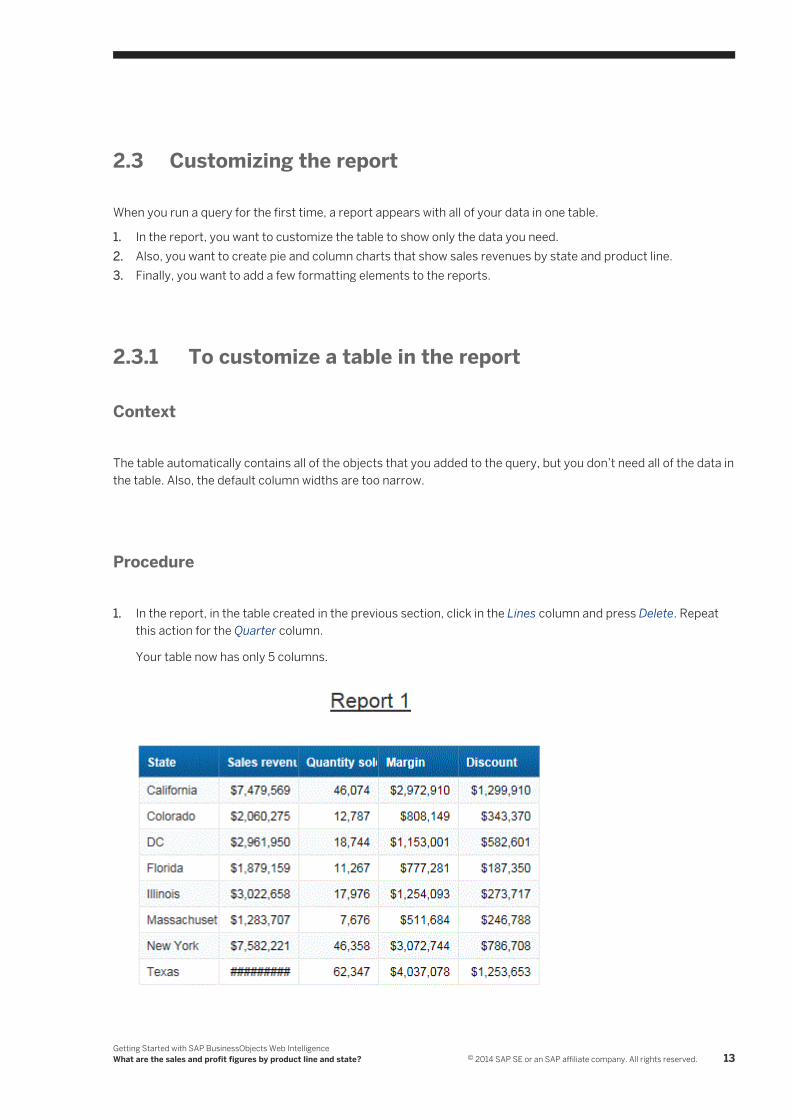
The table automatically contains all of the objects that you added to the query, but you don’t need all of the data in the table. Also, the default column widths are too narrow.
Procedure
1. In the report, in the table created in the previous section, click in the Lines column and press Delete. Repeat this action for the Quarter column.
Your table now has only 5 columns.
Getting Started with SAP BusinessObjects Web IntelligenceWhat are the sales and profit figures by product line and state? © 2014 SAP SE or an SAP affiliate company. All rights reserved. 13
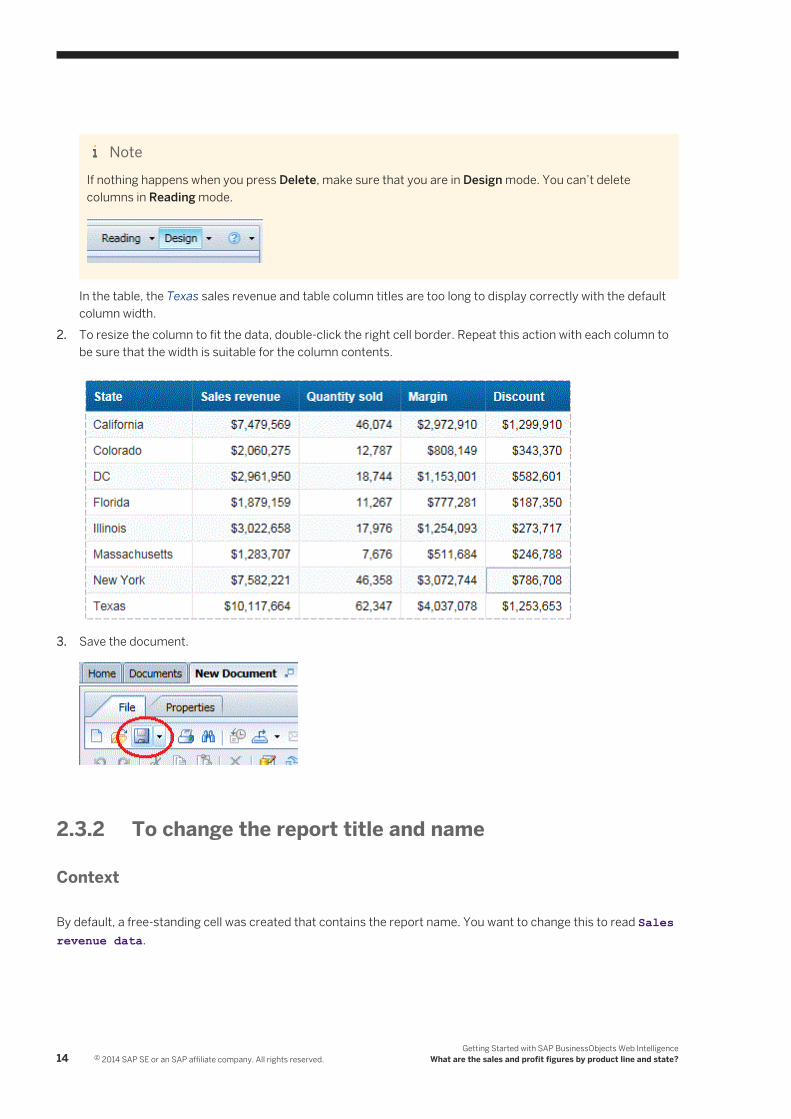
NoteIf nothing happens when you press Delete, make sure that you are in Design mode. You can’t delete columns in Reading mode.
In the table, the Texas sales revenue and table column titles are too long to display correctly with the default column width.
2. To resize the column to fit the data, double-click the right cell border. Repeat this action with each column to be sure that the width is suitable for the column contents.
3. Save the document.
2.3.2 To change the report title and name
Context
By default, a free-standing cell was created that contains the report name. You want to change this to read Sales revenue data.
14 © 2014 SAP SE or an SAP affiliate company. All rights reserved.Getting Started with SAP BusinessObjects Web Intelligence
What are the sales and profit figures by product line and state?
Procedure
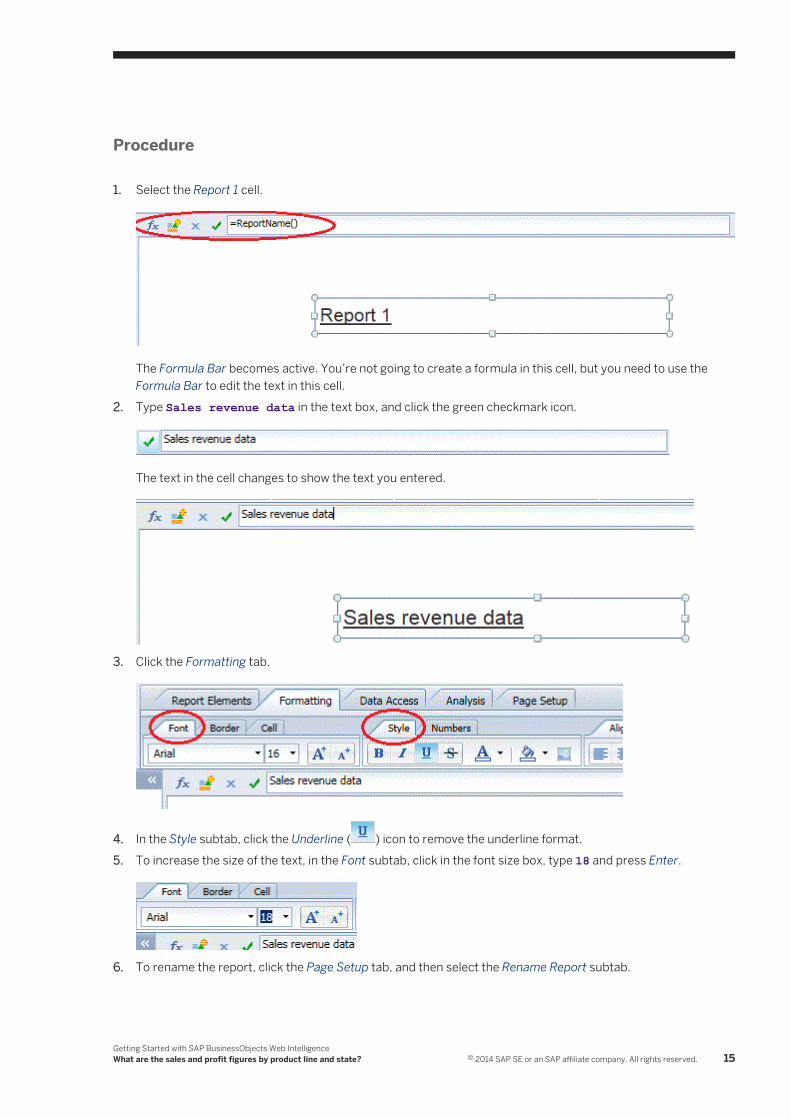
1. Select the Report 1 cell.
The Formula Bar becomes active. You’re not going to create a formula in this cell, but you need to use the Formula Bar to edit the text in this cell.
2. Type Sales revenue data in the text box, and click the green checkmark icon.
The text in the cell changes to show the text you entered.
3. Click the Formatting tab.
4. In the Style subtab, click the Underline ( ) icon to remove the underline format.5. To increase the size of the text, in the Font subtab, click in the font size box, type 18 and press Enter.
6. To rename the report, click the Page Setup tab, and then select the Rename Report subtab.
Getting Started with SAP BusinessObjects Web IntelligenceWhat are the sales and profit figures by product line and state? © 2014 SAP SE or an SAP affiliate company. All rights reserved. 15
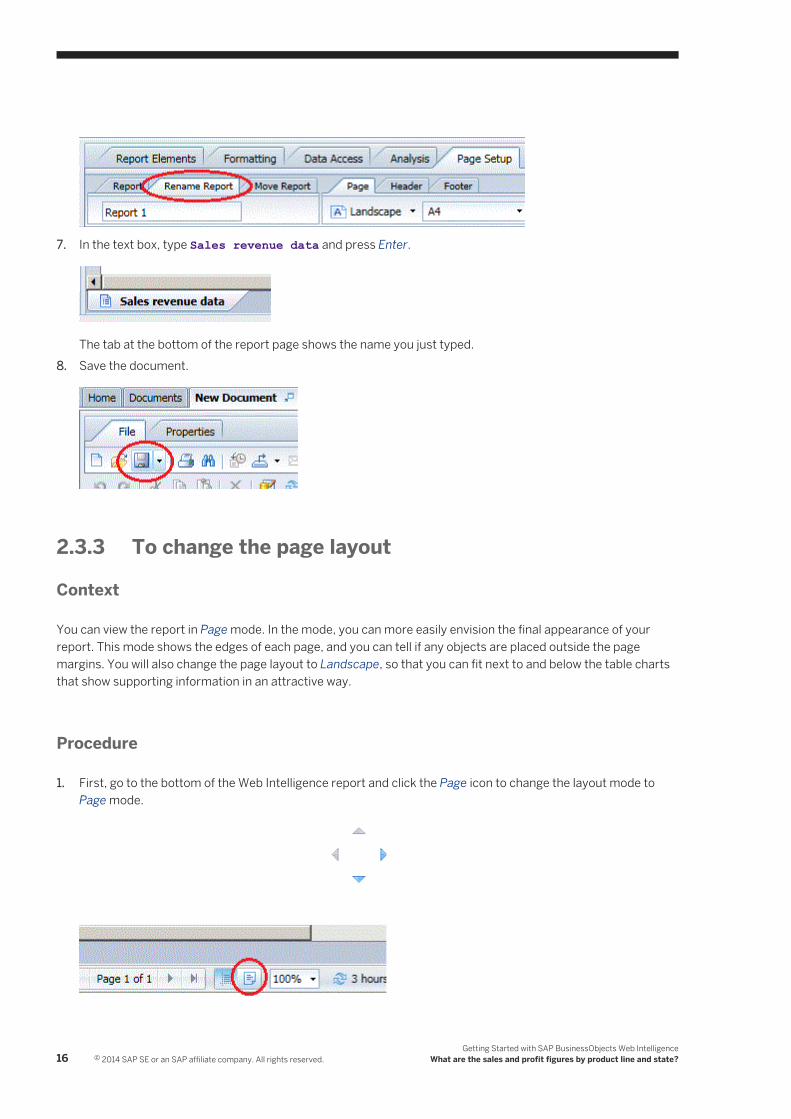
7. In the text box, type Sales revenue data and press Enter.
The tab at the bottom of the report page shows the name you just typed.8. Save the document.
2.3.3 To change the page layout
Context
You can view the report in Page mode. In the mode, you can more easily envision the final appearance of your report. This mode shows the edges of each page, and you can tell if any objects are placed outside the page margins. You will also change the page layout to Landscape, so that you can fit next to and below the table charts that show supporting information in an attractive way.
Procedure
1. First, go to the bottom of the Web Intelligence report and click the Page icon to change the layout mode to Page mode.
16 © 2014 SAP SE or an SAP affiliate company. All rights reserved.Getting Started with SAP BusinessObjects Web Intelligence
What are the sales and profit figures by product line and state?
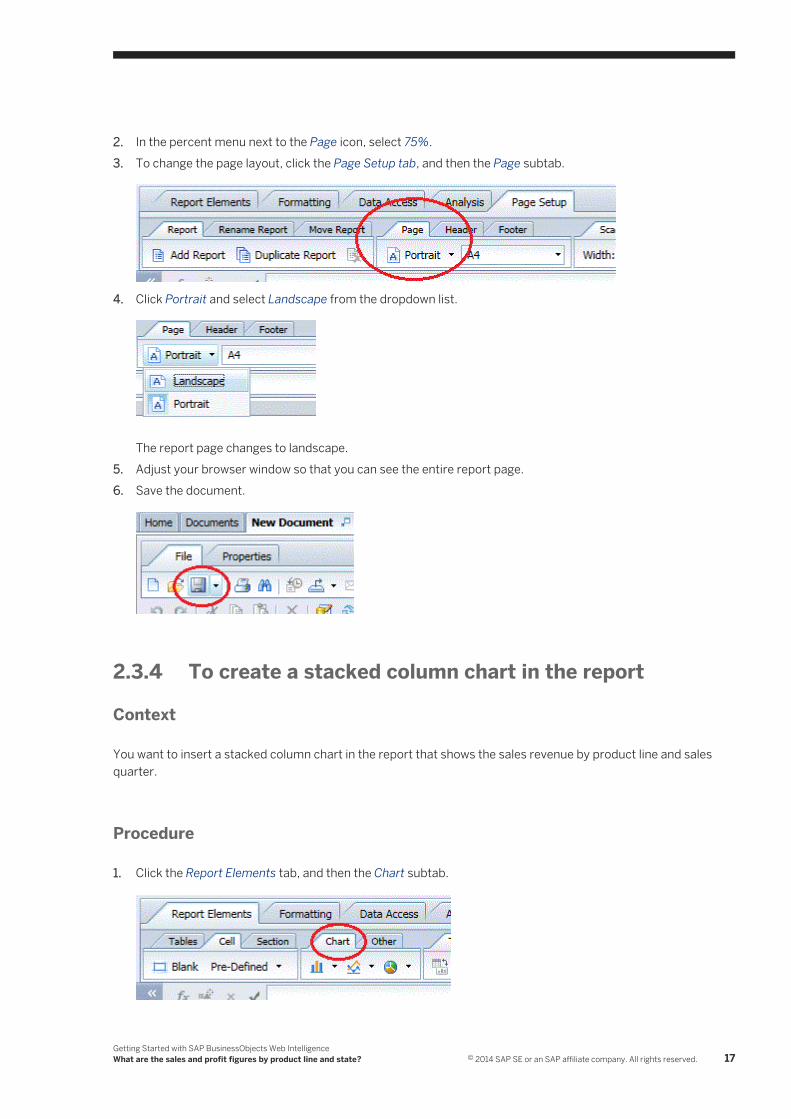
2. In the percent menu next to the Page icon, select 75%.3. To change the page layout, click the Page Setup tab, and then the Page subtab.
4. Click Portrait and select Landscape from the dropdown list.
The report page changes to landscape.5. Adjust your browser window so that you can see the entire report page.6. Save the document.
2.3.4 To create a stacked column chart in the report
Context
You want to insert a stacked column chart in the report that shows the sales revenue by product line and sales quarter.
Procedure
1. Click the Report Elements tab, and then the Chart subtab.
Getting Started with SAP BusinessObjects Web IntelligenceWhat are the sales and profit figures by product line and state? © 2014 SAP SE or an SAP affiliate company. All rights reserved. 17
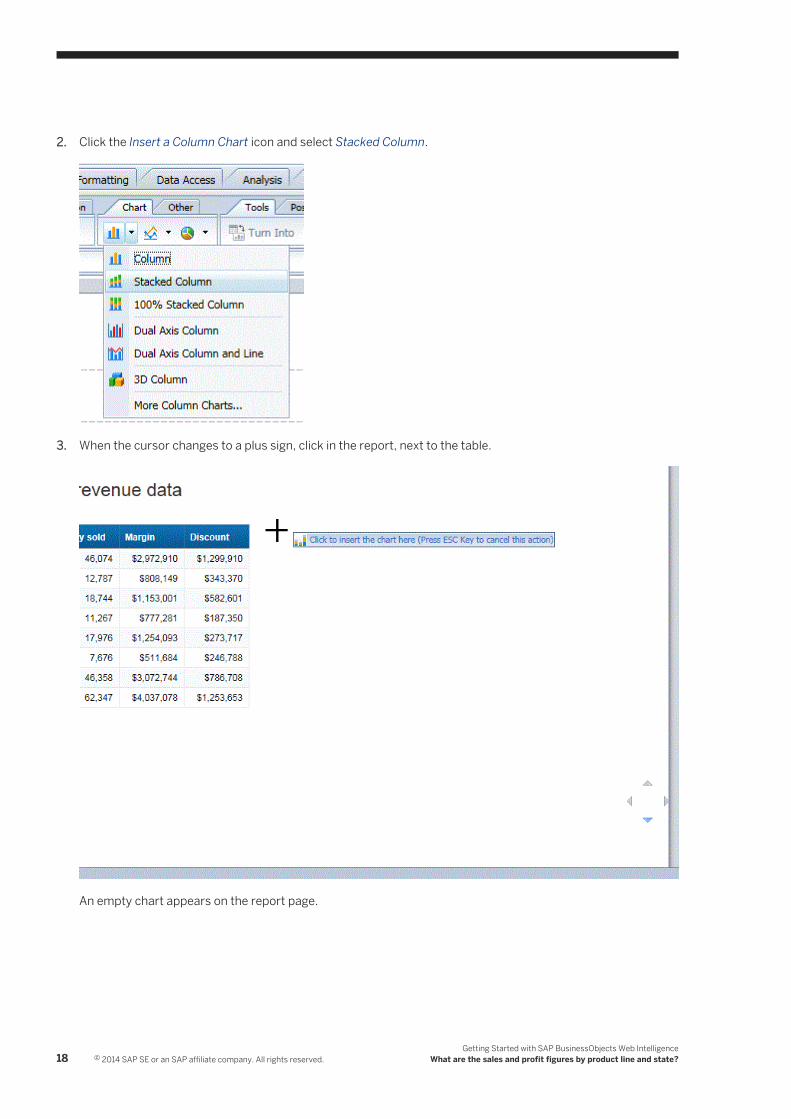
2. Click the Insert a Column Chart icon and select Stacked Column.
3. When the cursor changes to a plus sign, click in the report, next to the table.
An empty chart appears on the report page.
18 © 2014 SAP SE or an SAP affiliate company. All rights reserved.Getting Started with SAP BusinessObjects Web Intelligence
What are the sales and profit figures by product line and state?
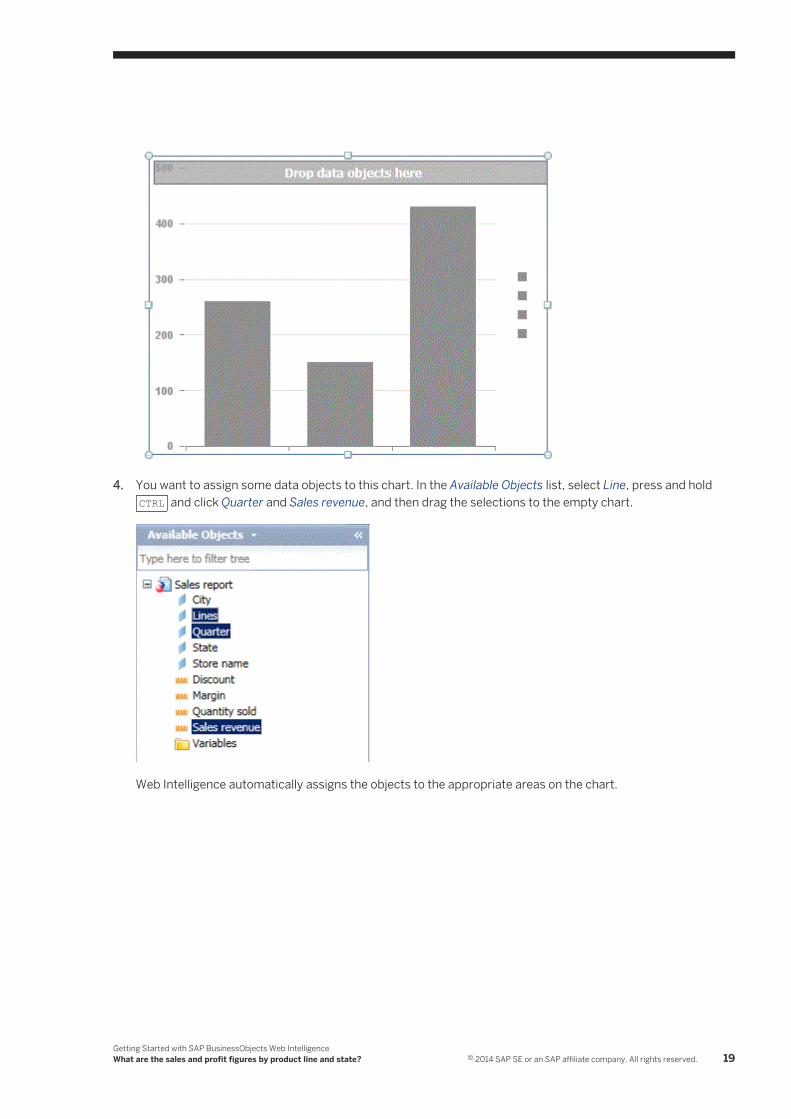
4. You want to assign some data objects to this chart. In the Available Objects list, select Line, press and hold CTRL and click Quarter and Sales revenue, and then drag the selections to the empty chart.
Web Intelligence automatically assigns the objects to the appropriate areas on the chart.
Getting Started with SAP BusinessObjects Web IntelligenceWhat are the sales and profit figures by product line and state? © 2014 SAP SE or an SAP affiliate company. All rights reserved. 19
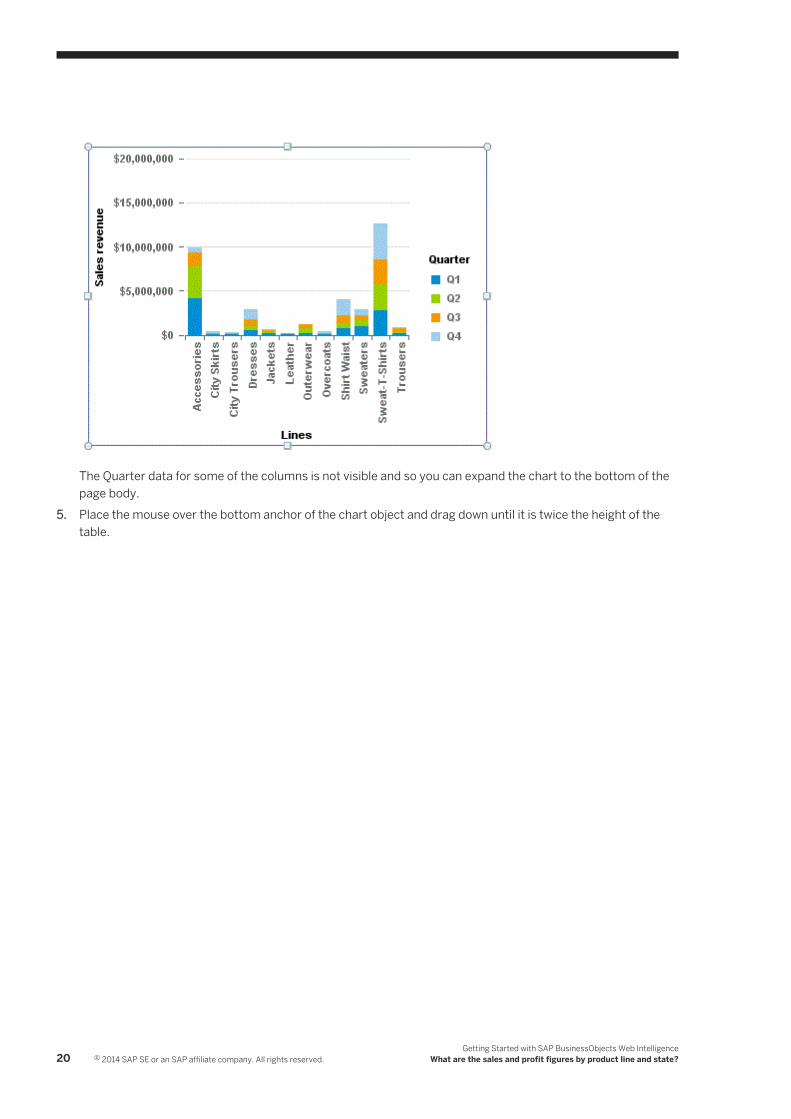
The Quarter data for some of the columns is not visible and so you can expand the chart to the bottom of the page body.
5. Place the mouse over the bottom anchor of the chart object and drag down until it is twice the height of the table.
20 © 2014 SAP SE or an SAP affiliate company. All rights reserved.Getting Started with SAP BusinessObjects Web Intelligence
What are the sales and profit figures by product line and state?
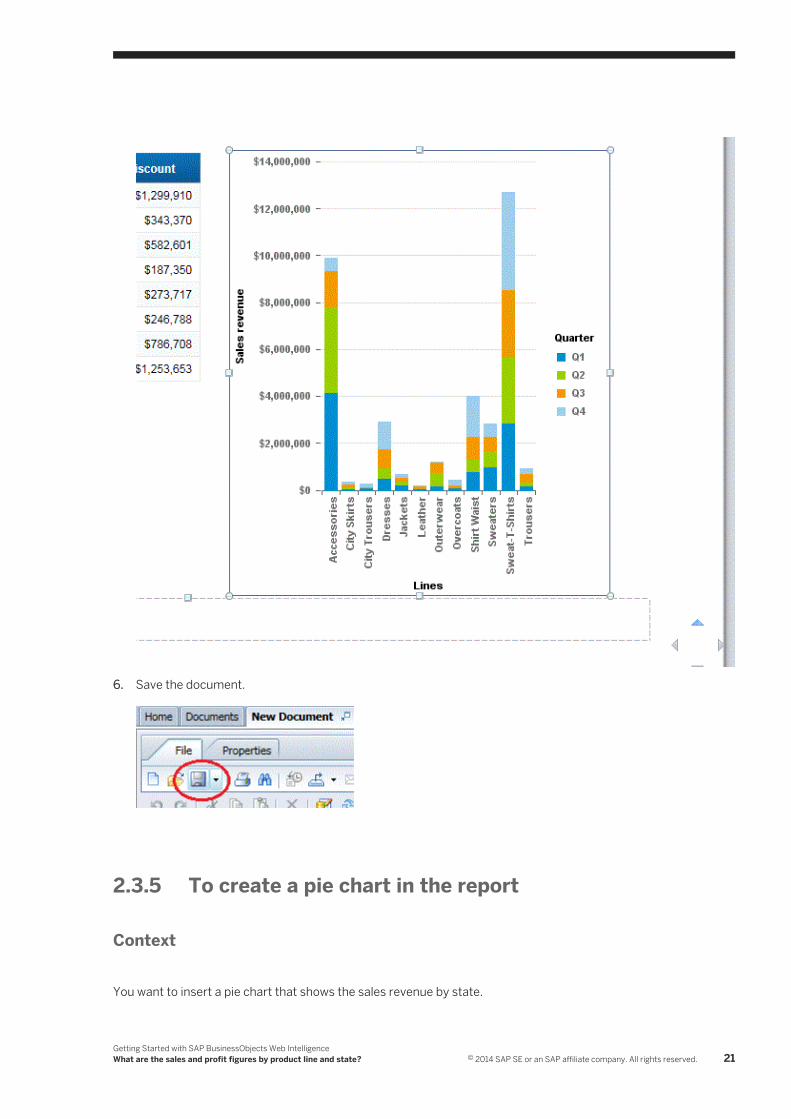
6. Save the document.
2.3.5 To create a pie chart in the report
Context
You want to insert a pie chart that shows the sales revenue by state.
Getting Started with SAP BusinessObjects Web IntelligenceWhat are the sales and profit figures by product line and state? © 2014 SAP SE or an SAP affiliate company. All rights reserved. 21
Procedure
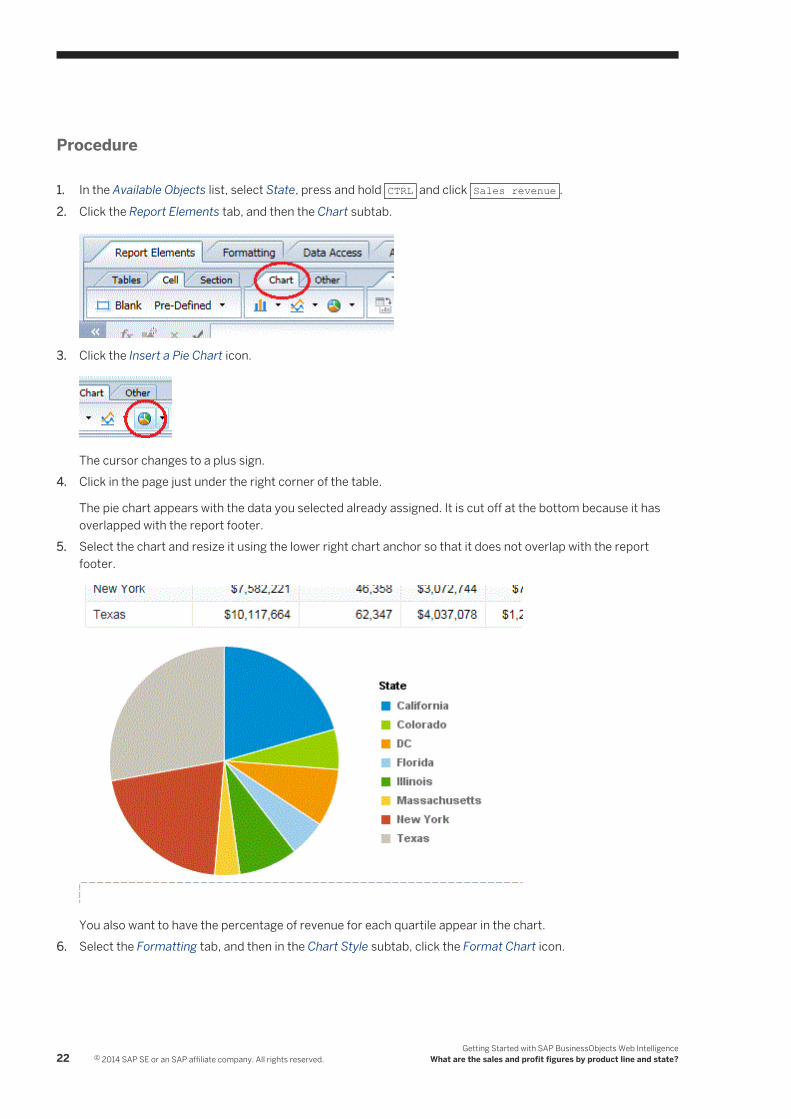
1. In the Available Objects list, select State, press and hold CTRL and click Sales revenue .
2. Click the Report Elements tab, and then the Chart subtab.
3. Click the Insert a Pie Chart icon.
The cursor changes to a plus sign.4. Click in the page just under the right corner of the table.
The pie chart appears with the data you selected already assigned. It is cut off at the bottom because it has overlapped with the report footer.
5. Select the chart and resize it using the lower right chart anchor so that it does not overlap with the report footer.
You also want to have the percentage of revenue for each quartile appear in the chart.6. Select the Formatting tab, and then in the Chart Style subtab, click the Format Chart icon.
22 © 2014 SAP SE or an SAP affiliate company. All rights reserved.Getting Started with SAP BusinessObjects Web Intelligence
What are the sales and profit figures by product line and state?
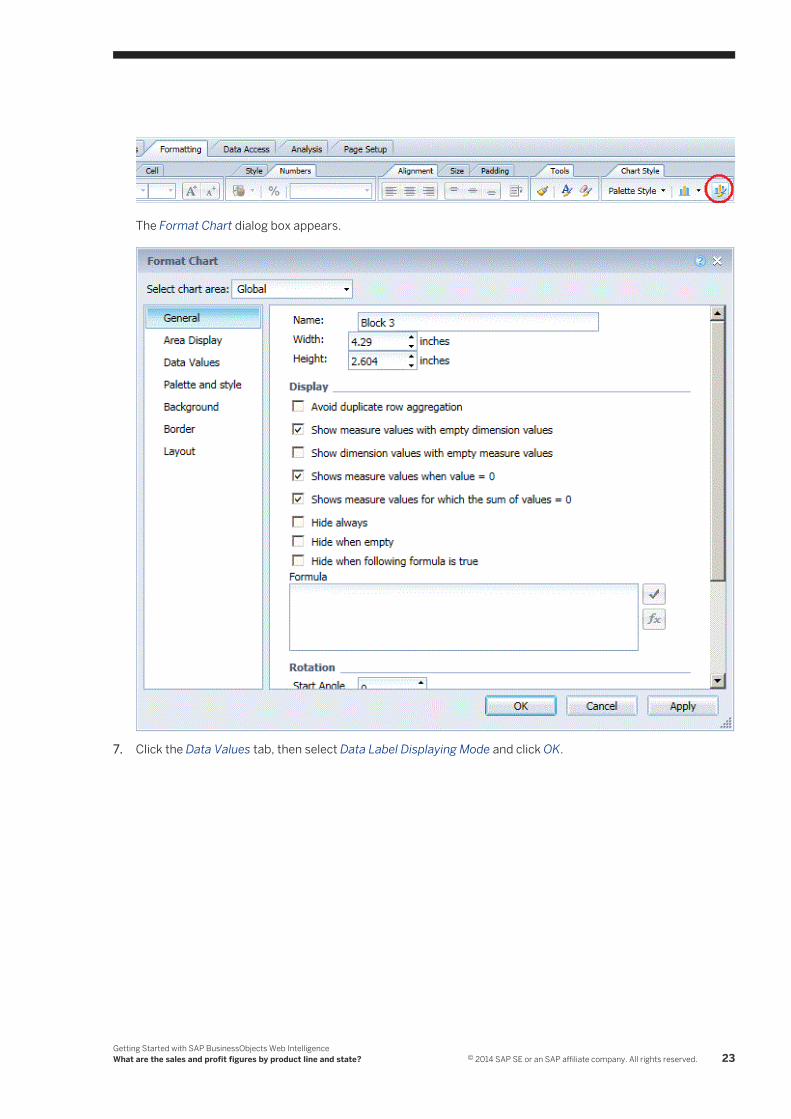
The Format Chart dialog box appears.
7. Click the Data Values tab, then select Data Label Displaying Mode and click OK.
Getting Started with SAP BusinessObjects Web IntelligenceWhat are the sales and profit figures by product line and state? © 2014 SAP SE or an SAP affiliate company. All rights reserved. 23
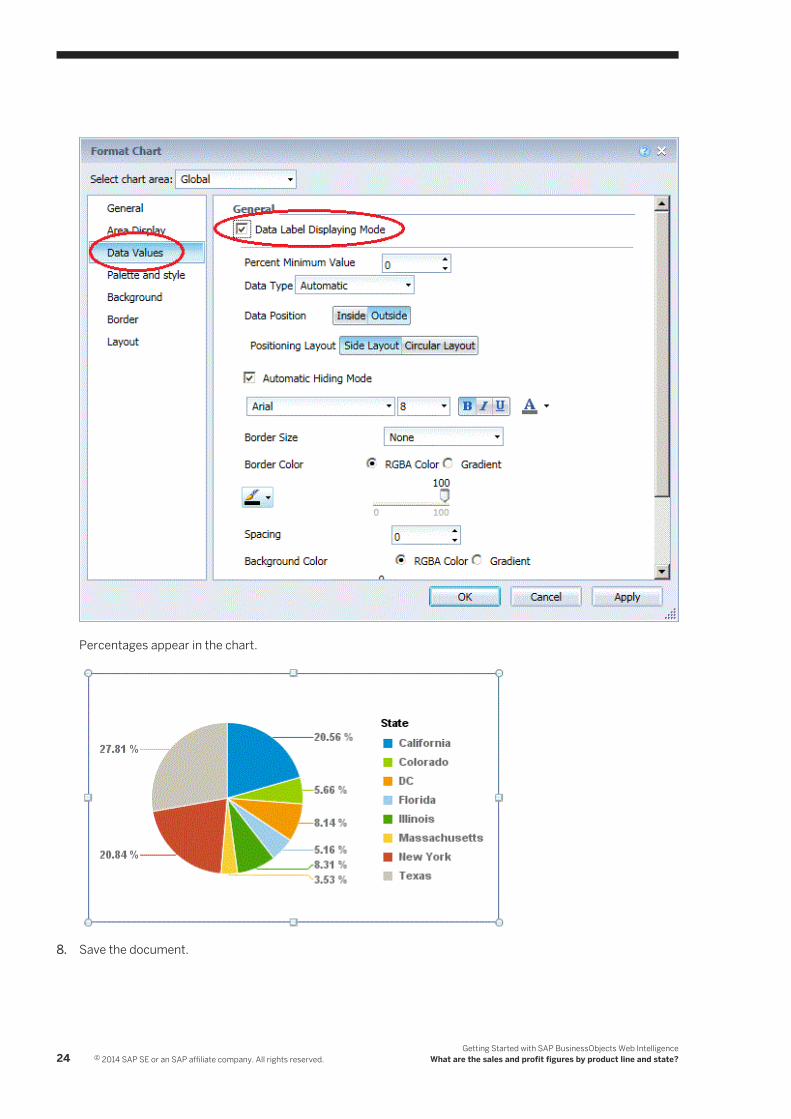
Percentages appear in the chart.
8. Save the document.
24 © 2014 SAP SE or an SAP affiliate company. All rights reserved.Getting Started with SAP BusinessObjects Web Intelligence
What are the sales and profit figures by product line and state?
2.3.6 To add an image to the report header
Context
You want to add an image that says "Confidential" to the header report element.
Procedure
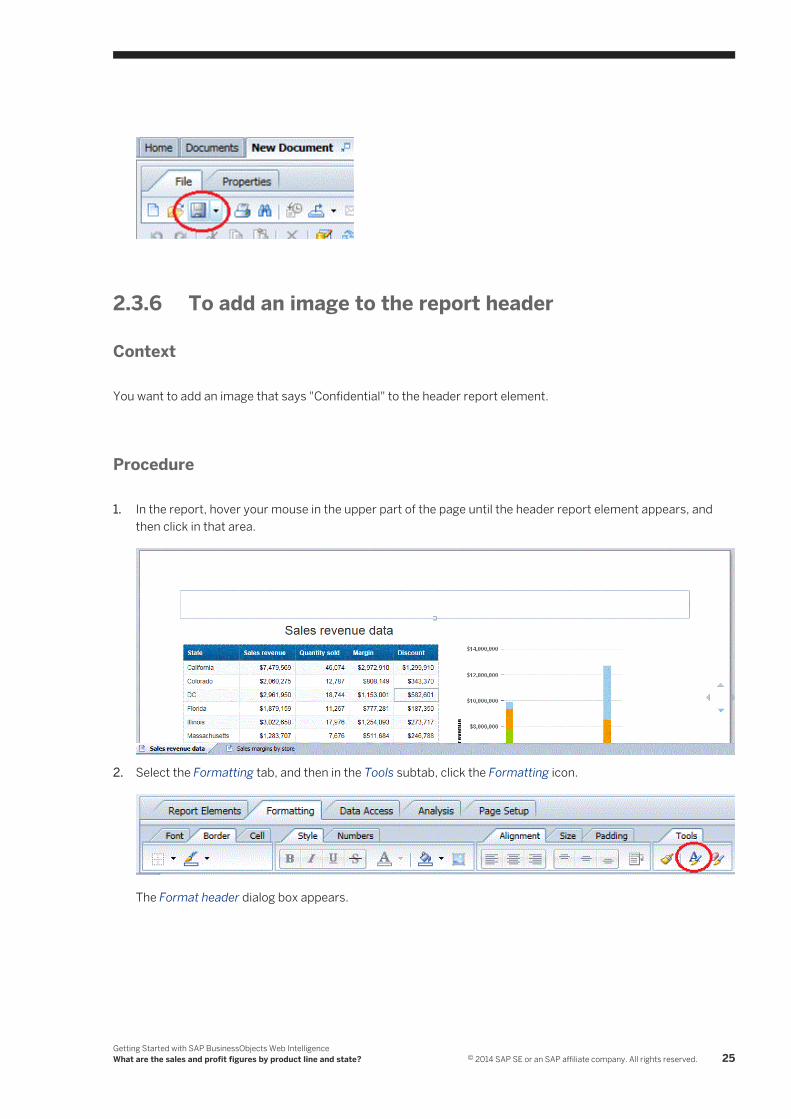
1. In the report, hover your mouse in the upper part of the page until the header report element appears, and then click in that area.
2. Select the Formatting tab, and then in the Tools subtab, click the Formatting icon.
The Format header dialog box appears.
Getting Started with SAP BusinessObjects Web IntelligenceWhat are the sales and profit figures by product line and state? © 2014 SAP SE or an SAP affiliate company. All rights reserved. 25
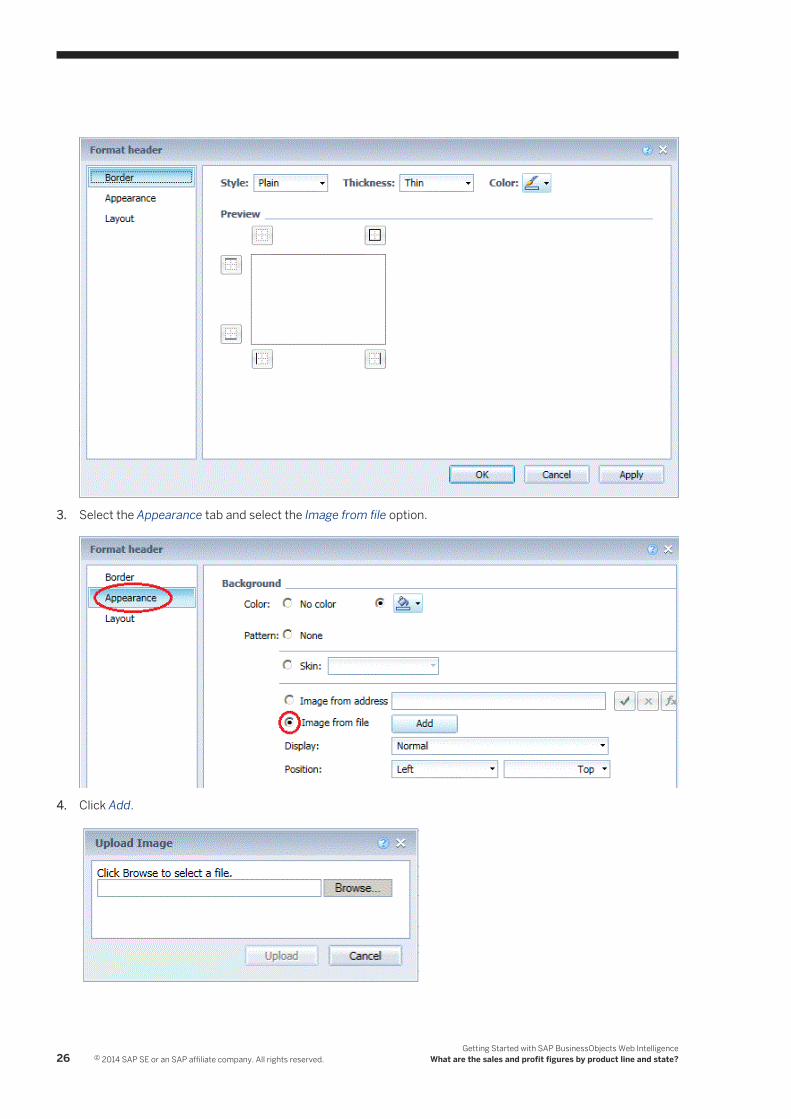
3. Select the Appearance tab and select the Image from file option.
4. Click Add.
26 © 2014 SAP SE or an SAP affiliate company. All rights reserved.Getting Started with SAP BusinessObjects Web Intelligence
What are the sales and profit figures by product line and state?
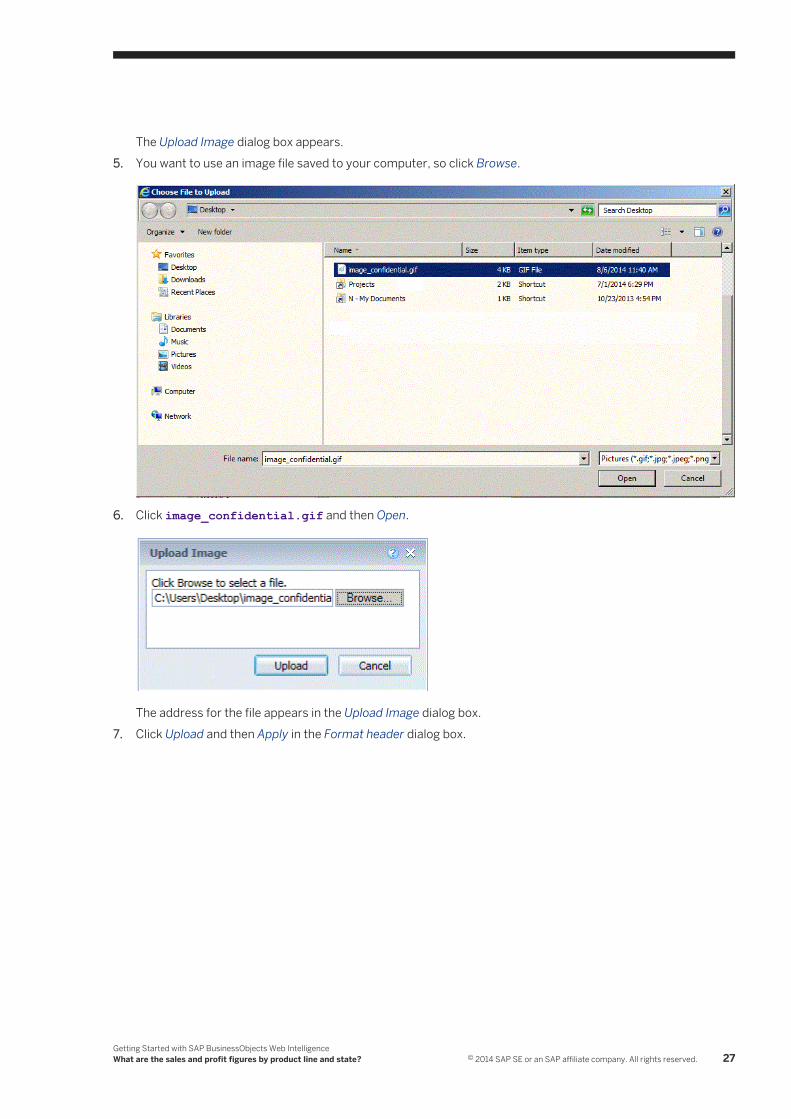
The Upload Image dialog box appears.5. You want to use an image file saved to your computer, so click Browse.
6. Click image_confidential.gif and then Open.
The address for the file appears in the Upload Image dialog box.7. Click Upload and then Apply in the Format header dialog box.
Getting Started with SAP BusinessObjects Web IntelligenceWhat are the sales and profit figures by product line and state? © 2014 SAP SE or an SAP affiliate company. All rights reserved. 27
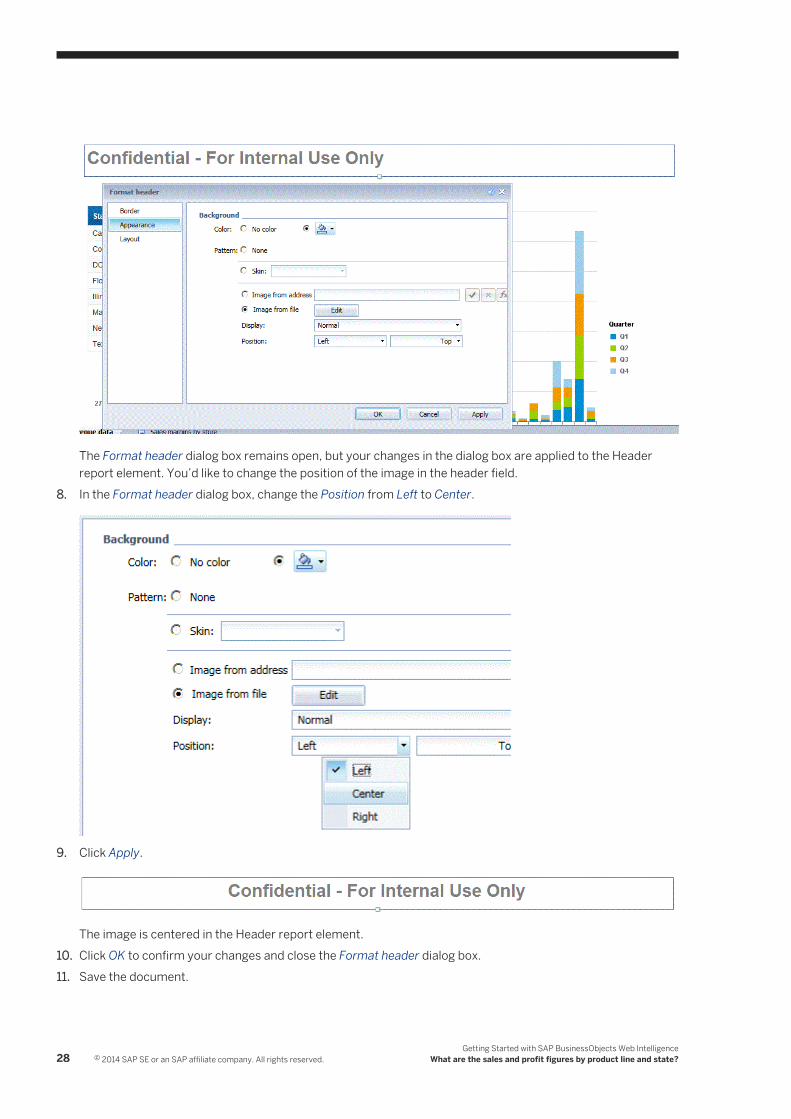
The Format header dialog box remains open, but your changes in the dialog box are applied to the Header report element. You’d like to change the position of the image in the header field.
8. In the Format header dialog box, change the Position from Left to Center.
9. Click Apply.
The image is centered in the Header report element.10. Click OK to confirm your changes and close the Format header dialog box.11. Save the document.
28 © 2014 SAP SE or an SAP affiliate company. All rights reserved.Getting Started with SAP BusinessObjects Web Intelligence
What are the sales and profit figures by product line and state?
2.3.7 To insert and format two cells in the report footer
Context
You want the date of the last time the report was refreshed to appear in the report footer element.
Procedure
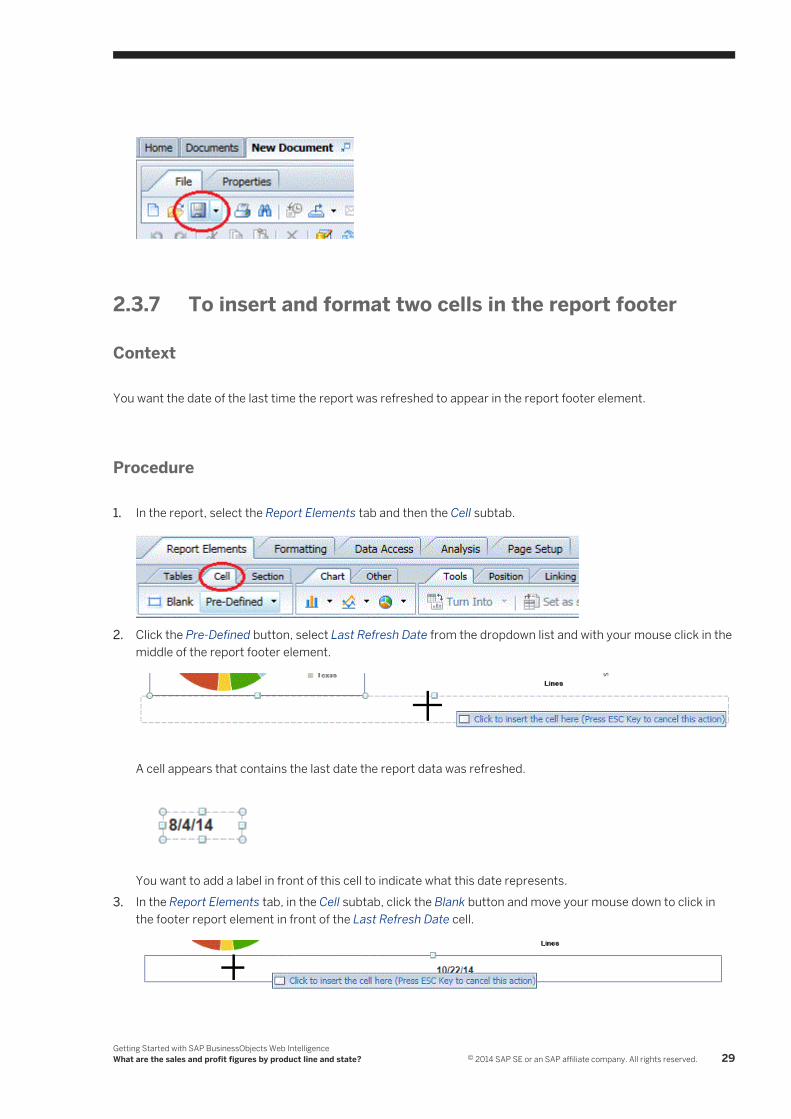
1. In the report, select the Report Elements tab and then the Cell subtab.
2. Click the Pre-Defined button, select Last Refresh Date from the dropdown list and with your mouse click in the middle of the report footer element.
A cell appears that contains the last date the report data was refreshed.
You want to add a label in front of this cell to indicate what this date represents.3. In the Report Elements tab, in the Cell subtab, click the Blank button and move your mouse down to click in
the footer report element in front of the Last Refresh Date cell.
Getting Started with SAP BusinessObjects Web IntelligenceWhat are the sales and profit figures by product line and state? © 2014 SAP SE or an SAP affiliate company. All rights reserved. 29
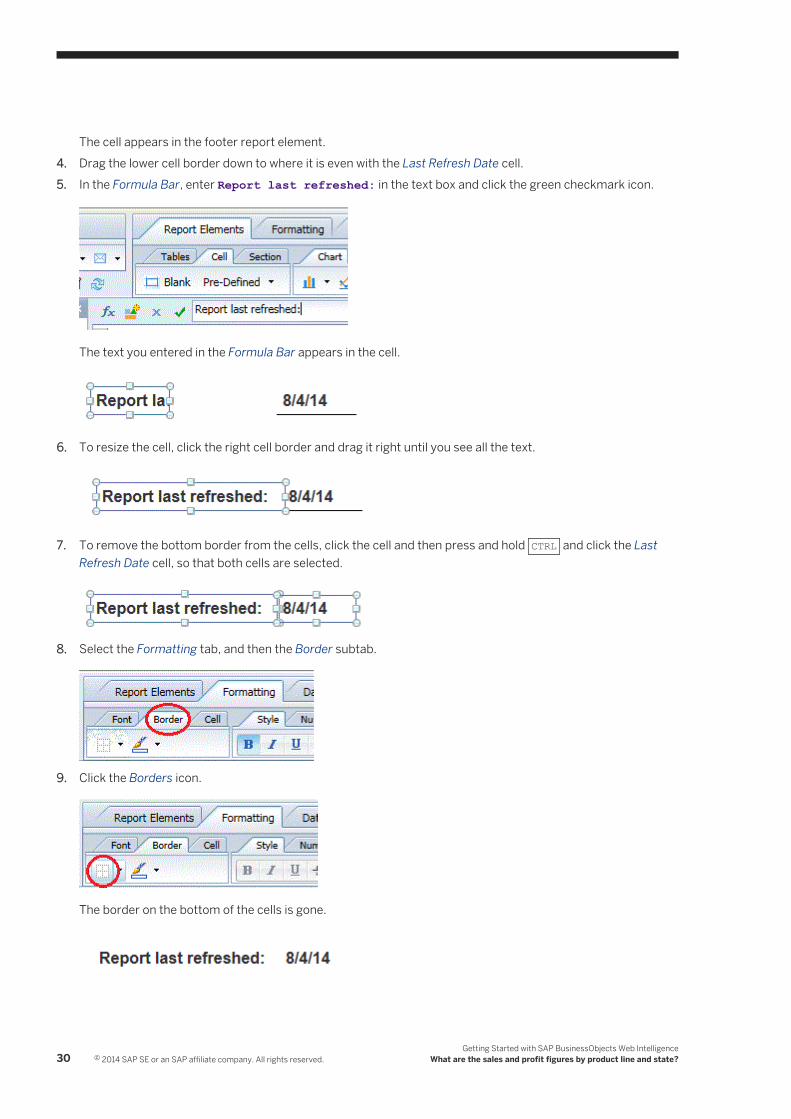
The cell appears in the footer report element.4. Drag the lower cell border down to where it is even with the Last Refresh Date cell.5. In the Formula Bar, enter Report last refreshed: in the text box and click the green checkmark icon.
The text you entered in the Formula Bar appears in the cell.
6. To resize the cell, click the right cell border and drag it right until you see all the text.
7. To remove the bottom border from the cells, click the cell and then press and hold CTRL and click the Last Refresh Date cell, so that both cells are selected.
8. Select the Formatting tab, and then the Border subtab.
9. Click the Borders icon.
The border on the bottom of the cells is gone.
30 © 2014 SAP SE or an SAP affiliate company. All rights reserved.Getting Started with SAP BusinessObjects Web Intelligence
What are the sales and profit figures by product line and state?
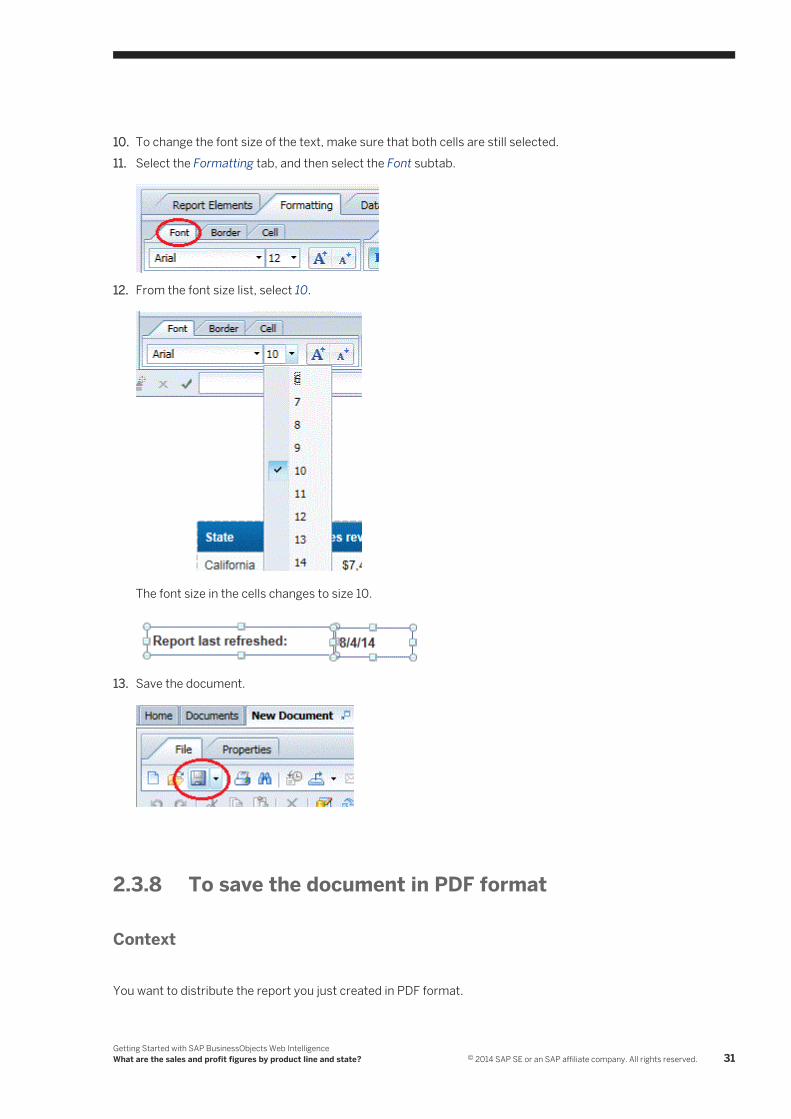
10. To change the font size of the text, make sure that both cells are still selected.11. Select the Formatting tab, and then select the Font subtab.
12. From the font size list, select 10.
The font size in the cells changes to size 10.
13. Save the document.
2.3.8 To save the document in PDF format
Context
You want to distribute the report you just created in PDF format.
Getting Started with SAP BusinessObjects Web IntelligenceWhat are the sales and profit figures by product line and state? © 2014 SAP SE or an SAP affiliate company. All rights reserved. 31
Procedure
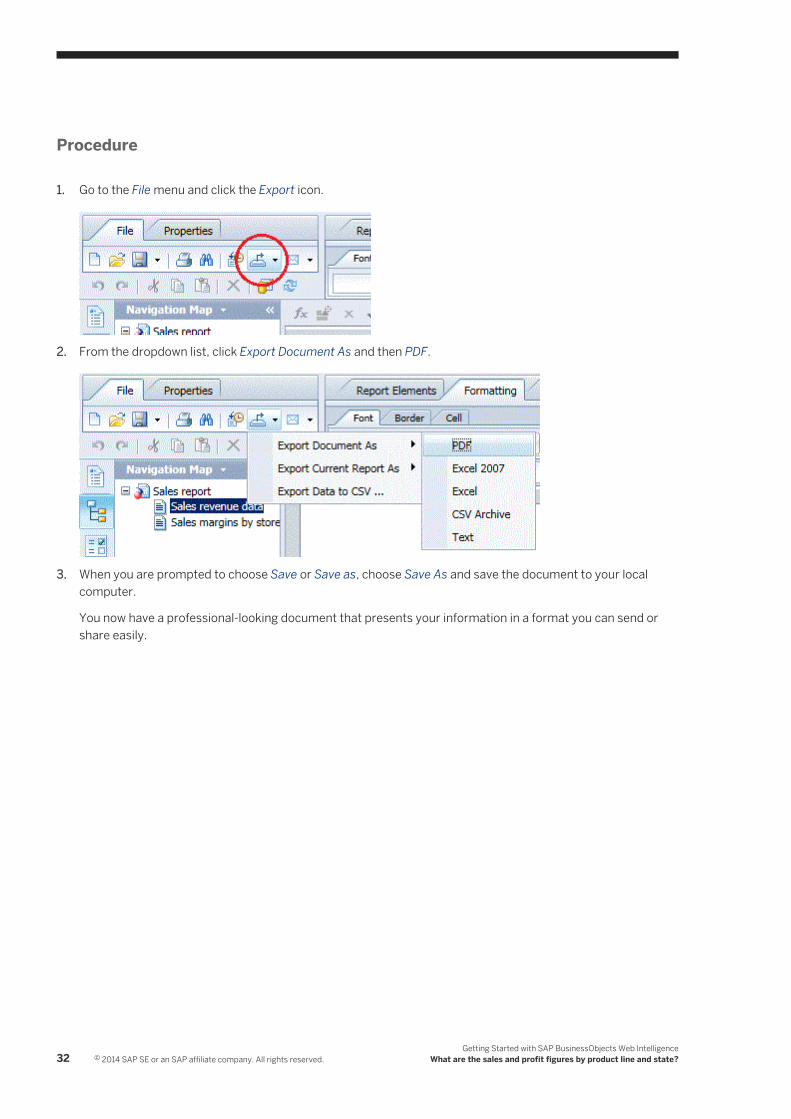
1. Go to the File menu and click the Export icon.
2. From the dropdown list, click Export Document As and then PDF.
3. When you are prompted to choose Save or Save as, choose Save As and save the document to your local computer.
You now have a professional-looking document that presents your information in a format you can send or share easily.
32 © 2014 SAP SE or an SAP affiliate company. All rights reserved.Getting Started with SAP BusinessObjects Web Intelligence
What are the sales and profit figures by product line and state?
Important Disclaimers and Legal Information
Coding SamplesAny software coding and/or code lines / strings ("Code") included in this documentation are only examples and are not intended to be used in a productive system environment. The Code is only intended to better explain and visualize the syntax and phrasing rules of certain coding. SAP does not warrant the correctness and completeness of the Code given herein, and SAP shall not be liable for errors or damages caused by the usage of the Code, unless damages were caused by SAP intentionally or by SAP's gross negligence.
AccessibilityThe information contained in the SAP documentation represents SAP's current view of accessibility criteria as of the date of publication; it is in no way intended to be a binding guideline on how to ensure accessibility of software products. SAP in particular disclaims any liability in relation to this document. This disclaimer, however, does not apply in cases of wilful misconduct or gross negligence of SAP. Furthermore, this document does not result in any direct or indirect contractual obligations of SAP.
Gender-Neutral LanguageAs far as possible, SAP documentation is gender neutral. Depending on the context, the reader is addressed directly with "you", or a gender-neutral noun (such as "sales person" or "working days") is used. If when referring to members of both sexes, however, the third-person singular cannot be avoided or a gender-neutral noun does not exist, SAP reserves the right to use the masculine form of the noun and pronoun. This is to ensure that the documentation remains comprehensible.
Internet HyperlinksThe SAP documentation may contain hyperlinks to the Internet. These hyperlinks are intended to serve as a hint about where to find related information. SAP does not warrant the availability and correctness of this related information or the ability of this information to serve a particular purpose. SAP shall not be liable for any damages caused by the use of related information unless damages have been caused by SAP's gross negligence or willful misconduct. All links are categorized for transparency (see: http://help.sap.com/disclaimer).
Getting Started with SAP BusinessObjects Web IntelligenceImportant Disclaimers and Legal Information © 2014 SAP SE or an SAP affiliate company. All rights reserved. 33

www.sap.com/contactsap
© 2014 SAP SE or an SAP affiliate company. All rights reserved.No part of this publication may be reproduced or transmitted in any form or for any purpose without the express permission of SAP SE or an SAP affiliate company. The information contained herein may be changed without prior notice.Some software products marketed by SAP SE and its distributors contain proprietary software components of other software vendors. National product specifications may vary.These materials are provided by SAP SE or an SAP affiliate company for informational purposes only, without representation or warranty of any kind, and SAP or its affiliated companies shall not be liable for errors or omissions with respect to the materials. The only warranties for SAP or SAP affiliate company products and services are those that are set forth in the express warranty statements accompanying such products and services, if any. Nothing herein should be construed as constituting an additional warranty.SAP and other SAP products and services mentioned herein as well as their respective logos are trademarks or registered trademarks of SAP SE (or an SAP affiliate company) in Germany and other countries. All other product and service names mentioned are the trademarks of their respective companies.Please see http://www.sap.com/corporate-en/legal/copyright/index.epx for additional trademark information and notices.