Embed Size (px)
Citation preview

German Mittelstand-Bonds.
A role model for Poland?
An exploration of SME bond-funding in Germany
compared to Poland.
Bachelor of Arts Thesis Dissertation submitted as partial fulfilment for the award of Bachelor of Honours in
International Business by:
SID: 0904436
Supervisor: Clive Puttock
May 2013
Lord Ashcroft International Business School
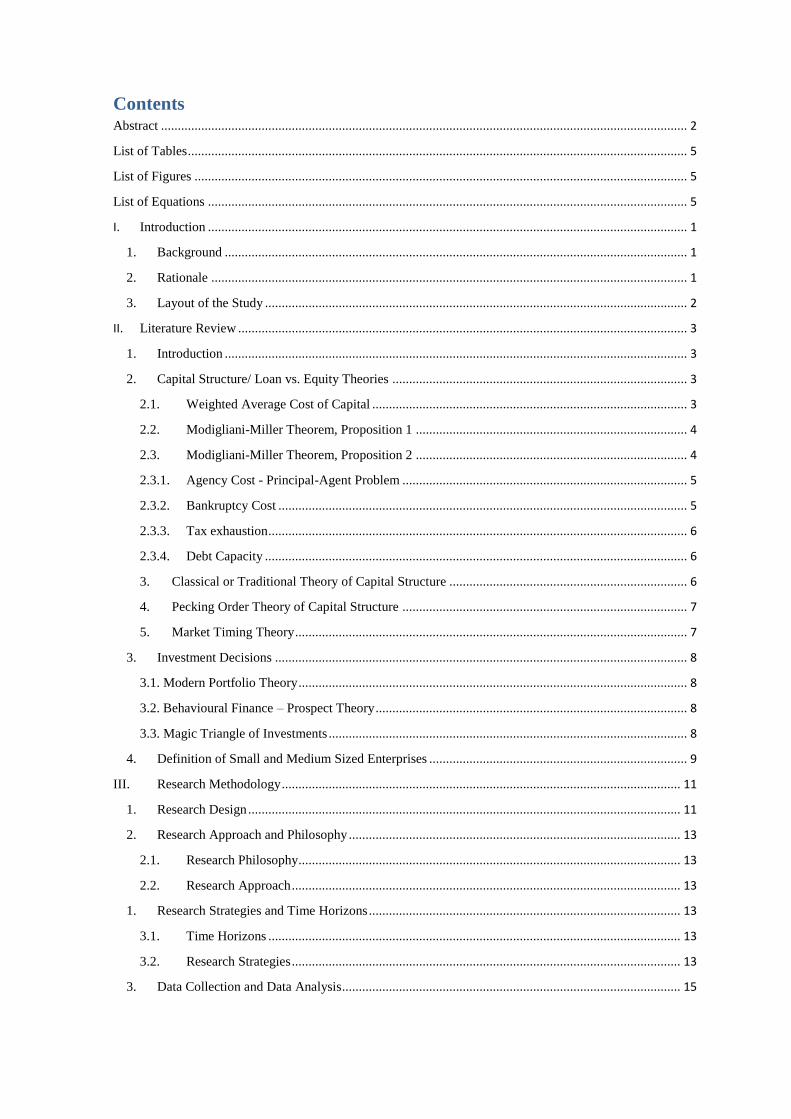
Abstract This Dissertation provides an extensive analysis of the German and Polish SME-sectors, derives
their characteristics and their features in general terms and in terms of funding. The main difference
between the respective SME-sectors is based in the structure of the economies of the two countries.
Germany can be characterized as a developed market with a highly-developed structure of medium
to large and a relatively low number of micro and small enterprises. The Polish economy is
characterized by a bi-polar structure. On the one end a low productive micro and small businesses,
on the other, EU 27 over performing middle-sized and large enterprises. Both German and Polish
SMEs show a distinctive preference towards internal funding. Externally, loan funding from banks
has still got a predominant position, albeit slowly decreasing in importance, based on the trend of
diversification of funding amongst SMEs.
Since 2010 German Mittelstand has got the opportunity to issue bonds on specific segments of
stock exchanges. The study has analysed the M-Bond market and compared it to Poland’s main
corporate bond market, named ‘Catalyst’. The comparison showed that both markets show
characteristics attributed to bond markets of emerging markets, being underdeveloped especially in
terms of liquidity and transparency. Both markets face severe criticism based on insufficient quality
matters of the placed instruments. However, both markets look back at an impressive development
since their establishment and are still expected to grow rapidly, even if on different fundamentals.
The study came to the conclusion, that withdrawing bank- and ‘classical’ corporate bonds from
Catalyst, the German M-Segments are already exceeding in scale. Additionally the segments are
already of higher maturity, which makes a transfer of M-Bond segments to Poland impractical. As
up to date there is no foreign literature on the Polish corporate bond sector available, this
Dissertation represents a distinct contribution to current literature.
Contents Abstract ............................................................................................................................................................. 2
List of Tables ..................................................................................................................................................... 5
List of Figures ................................................................................................................................................... 5
List of Equations ............................................................................................................................................... 5
I. Introduction ............................................................................................................................................... 1
1. Background .......................................................................................................................................... 1
2. Rationale .............................................................................................................................................. 1
3. Layout of the Study .............................................................................................................................. 2
II. Literature Review ...................................................................................................................................... 3
1. Introduction .......................................................................................................................................... 3
2. Capital Structure/ Loan vs. Equity Theories ........................................................................................ 3
2.1. Weighted Average Cost of Capital .............................................................................................. 3
2.2. Modigliani-Miller Theorem, Proposition 1 ................................................................................. 4
2.3. Modigliani-Miller Theorem, Proposition 2 ................................................................................. 4
2.3.1. Agency Cost - Principal-Agent Problem ..................................................................................... 5
2.3.2. Bankruptcy Cost .......................................................................................................................... 5
2.3.3. Tax exhaustion ............................................................................................................................. 6
2.3.4. Debt Capacity .............................................................................................................................. 6
3. Classical or Traditional Theory of Capital Structure ....................................................................... 6
4. Pecking Order Theory of Capital Structure ..................................................................................... 7
5. Market Timing Theory ..................................................................................................................... 7
3. Investment Decisions ........................................................................................................................... 8
3.1. Modern Portfolio Theory .................................................................................................................... 8
3.2. Behavioural Finance – Prospect Theory ............................................................................................. 8
3.3. Magic Triangle of Investments ........................................................................................................... 8
4. Definition of Small and Medium Sized Enterprises ............................................................................. 9
III. Research Methodology ....................................................................................................................... 11
1. Research Design ................................................................................................................................. 11
2. Research Approach and Philosophy ................................................................................................... 13
2.1. Research Philosophy .................................................................................................................. 13
2.2. Research Approach .................................................................................................................... 13
1. Research Strategies and Time Horizons ............................................................................................. 13
3.1. Time Horizons ........................................................................................................................... 13
3.2. Research Strategies .................................................................................................................... 13
3. Data Collection and Data Analysis ..................................................................................................... 15
3.1. Data Collection .......................................................................................................................... 15
3.2. Data Analysis ............................................................................................................................. 15
4. Summary ............................................................................................................................................ 16
IV. Findings .............................................................................................................................................. 18
1. Introduction ........................................................................................................................................ 18
2. Structural analysis of SMEs in Germany and Poland ......................................................................... 18
1. Introduction .................................................................................................................................... 18
2. Profile of the SME-sector in Germany ........................................................................................... 18
3. Profile of the SME-sector in Poland .............................................................................................. 19
4. Characteristics of the German SME-sector .................................................................................... 19
5. Characteristics of the Polish SME-sector ....................................................................................... 20
6. Summary - Comparison ................................................................................................................. 21
3. Analysis of funding of German and Polish SMEs .............................................................................. 21
1. Sources of Finance of German SMEs ............................................................................................ 21
2. Sources of Finance of the Polish SMEs ......................................................................................... 22
3. Summary – Comparison ................................................................................................................ 23
4. Analysis of the M-Bond market in Germany ..................................................................................... 24
1. Introduction .................................................................................................................................... 24
2. Market Profile ................................................................................................................................ 25
3. Market development ...................................................................................................................... 25
4. Typical Instrument ......................................................................................................................... 27
5. Capital market viability .................................................................................................................. 27
6. Placement-Process ......................................................................................................................... 28
7. Issuers ............................................................................................................................................ 29
8. Investors ......................................................................................................................................... 29
9. Market Outlook .............................................................................................................................. 31
5. Polish Corporate Debt Capital Market .................................................................................................... 31
1. Market Profile ................................................................................................................................ 31
2. Market Development ..................................................................................................................... 32
3. Typical Instrument ......................................................................................................................... 33
4. Issuers ............................................................................................................................................ 33
5. Investors ......................................................................................................................................... 34
6. Outlook .......................................................................................................................................... 35
7. Summary - Comparison ................................................................................................................. 36
V. Discussion and Conclusion ................................................................................................................ 38
1. Discussion .......................................................................................................................................... 38
2. Conclusion .......................................................................................................................................... 39
Bibliography and References .......................................................................................................................... 41
APPENDICES ................................................................................................................................................. 46
List of Tables
Table 1 SME Definition German Banking Industry (2012) .............................................................................. 9
Table 2 SME Definition Institute for Mittelstand-Research (2012) .................................................................. 9
Table 3 SME Definition European Commission (2012) ................................................................................. 10
Table 4 Industry allocation of Mittelstand, adopted from KfW (2012) ........................................................... 20
Table 5 Summary RQ 1, Author’s development ............................................................................................. 21
Table 6 Source of new Investments, Author’s development adapted from Polska Agencja Rozwoju
Przedsiebiorczosci (2012) ............................................................................................................................... 23
Table 7 Summary RQ 2, Author’s development ............................................................................................. 24
Table 8 Summary M-Bond Segments, Author’s development adapted from Hoppe & Lais (2012) ............... 25
Table 9 Transaction/Placement Process, won adapted from Achtleitner, et al. (2012) ................................... 28
Table 10 Summary RQ 3 and RQ 4, Author’s development ........................................................................... 37
List of Figures
Figure 1 Layout of the Study, Author’s development ....................................................................................... 2
Figure 2 Modigliani-Miller Theorem, Kaplan Financial Knowledge (2010) .................................................... 4
Figure 3 Classical Theory of Capital Structure, Author’s development ............................................................ 6
Figure 4 Research Design, Author’s Development ......................................................................................... 12
Figure 5 Typical Qualitative Research, University of Coimbra (2010) ........................................................... 15
Figure 6 Research Onion, Author’s development, adapted from Saunders, M et al. (2010) ........................... 16
Figure 7 SBA Fact Sheet Germany, Author’s development, adapted from European Commission (2012) .... 18
Figure 8 SBA Fact Sheet Poland, Author’s development, adapted from European Commission (2012) ........ 19
Figure 9 Study Summary, Magical Triangle of Investment, Author's Development adapted from FH Muenster
(2012) .............................................................................................................................................................. 30
Figure 10 Development of Catalyst, GrandThornton (2012)........................................................................... 32
Figure 11 Investor Base of Catalyst, Fitch (2012) ........................................................................................... 35
Figure 12 The value of bonds issued by companies and financial institutions in relation to GDP,
GrandThornton (2012)..................................................................................................................................... 36
List of Equations
Equation 1 WACC ............................................................................................................................................. 3
I. Introduction
This chapter has the aim of introducing the research problem and enlightening the purpose and
relevance of this research.
1. Background
Based on the bilateral trade volume of EUR 75.9bn in 2011 Poland is Germany´s most important
economic partner in Eastern Europe and tenth overall (Deutsche Botschaft Warschau, 2012). In
turn, Germany is distinctively Poland’s most important partner in terms of imports, exports, direct
investments and other areas. During the two decades after the economic turnover Poland’s
economy has experienced a dynamical development, which was grounded on a “rapid formation of
a Polish equivalent of Germany’s Mittelstand” (Cienski, 2012). Added the long-term success of
German companies, it is not a coincidence that in Poland the German economy is perceived as a
role model.
Although Poland looks back at 21 years of continuous economical growth, it had to wait for
Europe’s full attention until 2009, being the only EU-member to avoid a recession (Polska Agencja
Rozwoju Przedsiębiorczości, 2012). Alongside with the economic growth, Poland has developed
the largest capital market in Central and Eastern Europe, which was enlarged in 2009 by a new
segment for the trade of bonds- Catalyst. In the following year Germany has experienced a
comparable novelty, namely the introduction of stock exchange segments available purely for
bonds of Mittelstand companies: Mittelstand-Bonds or M-Bonds.
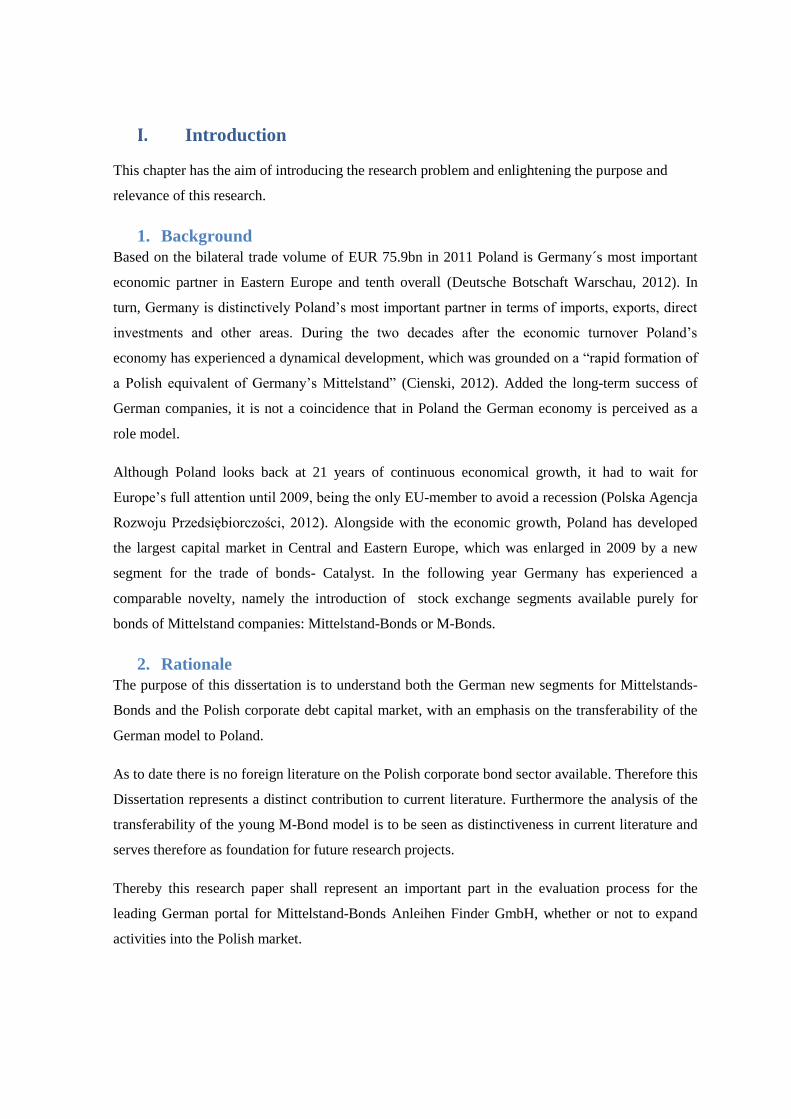
2. Rationale
The purpose of this dissertation is to understand both the German new segments for Mittelstands-
Bonds and the Polish corporate debt capital market, with an emphasis on the transferability of the
German model to Poland.
As to date there is no foreign literature on the Polish corporate bond sector available. Therefore this
Dissertation represents a distinct contribution to current literature. Furthermore the analysis of the
transferability of the young M-Bond model is to be seen as distinctiveness in current literature and
serves therefore as foundation for future research projects.
Thereby this research paper shall represent an important part in the evaluation process for the
leading German portal for Mittelstand-Bonds Anleihen Finder GmbH, whether or not to expand
activities into the Polish market.
3. Layout of the Study
The basis for the achievement of the purpose of this Dissertation is an extensive analysis in the
respective fields. For this purpose the following research question were chosen:
RQ 1: What are the structural differences, if any, between German and Polish
SMEs?
RQ 2: What are the differences, if any, in fund-raising of German and Polish
SMEs?
RQ 3: What are the characteristics of the German M-Bond model?
RQ 4: What are the characteristics of the Polish corporate bond market?
The study will exclusively analise M-Bonds and the corporate bonds traded in Poland. Neither
equity-instruments, nor other debt instruments will be content of the study.
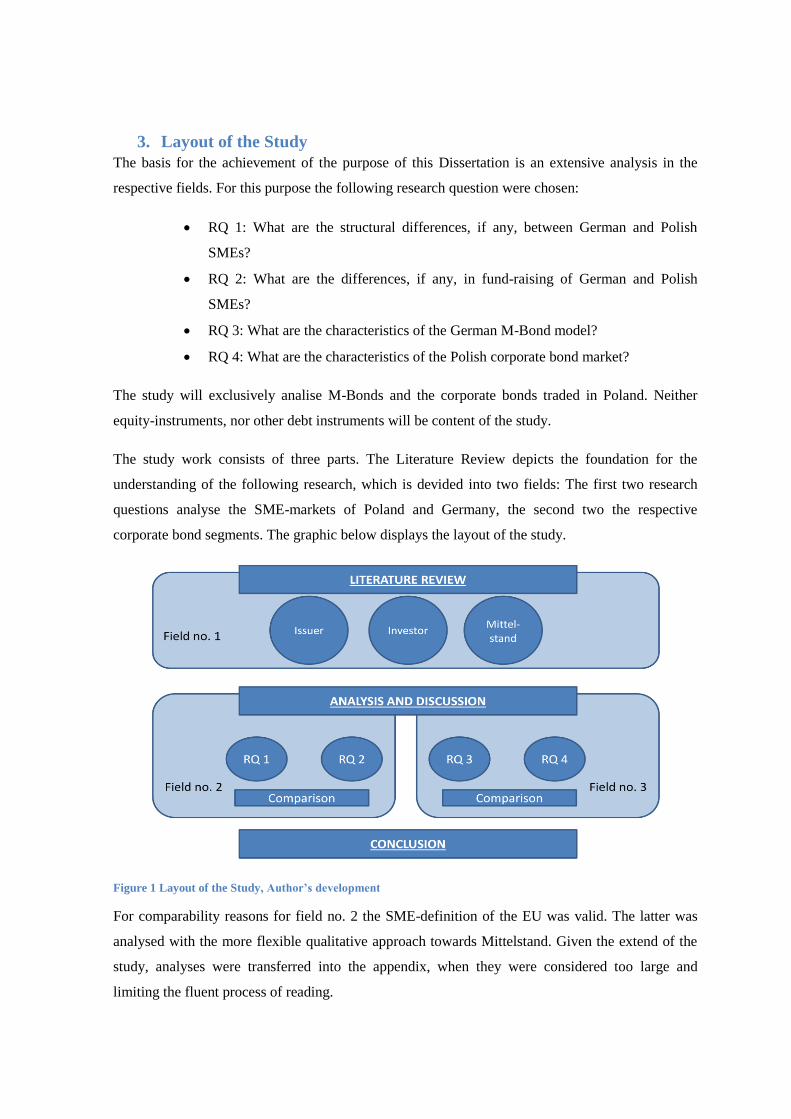
The study work consists of three parts. The Literature Review depicts the foundation for the
understanding of the following research, which is devided into two fields: The first two research
questions analyse the SME-markets of Poland and Germany, the second two the respective
corporate bond segments. The graphic below displays the layout of the study.
Figure 1 Layout of the Study, Author’s development
For comparability reasons for field no. 2 the SME-definition of the EU was valid. The latter was
analysed with the more flexible qualitative approach towards Mittelstand. Given the extend of the
study, analyses were transferred into the appendix, when they were considered too large and
limiting the fluent process of reading.
For an authentic basis for comparison, the study has adopted the exchange rate of EUR/PLN 4.1, a
level, which was generally maintained over the period of the study. Also new bond placements
after 01.04.2013 have not been taken into account.
II. Literature Review
1. Introduction
Managers of companies have to evaluate risks and chances every potential project bears in order to
be able to make an appropriate business decision. The financial decision on the source of funding
of the company and its business activities is not of minor importance.
The following chapter aims to establish a theoretical foundation for the understanding of the crucial
decisions making companies have to face when deciding on sources of funding. Then using two
opposing investment decision theories the investor’s perspective will be examined, which will be
followed by a short explanation of the Magical Triangle of Investment. The Literature Review will
be finished by the development of the definition of Mittelstand.
2. Capital Structure/ Loan vs. Equity Theories
Corporations can decide to fund the company through own capital or to borrow funds. Loan finance
is available in a multitude of possibilities and is therefore summarised in the generic term ‘debt
capital’. “Debt capital is characterized by a contractually predetermined rate of return, a
contractually fixed time of repayment and a preferential treatment over equity in terms of
repayment” (Lumby & Jones, 2011, p. 263). This leads to the core difference in comparison to
equity: Investors do not become part-owner of the business, they become purely creditors.
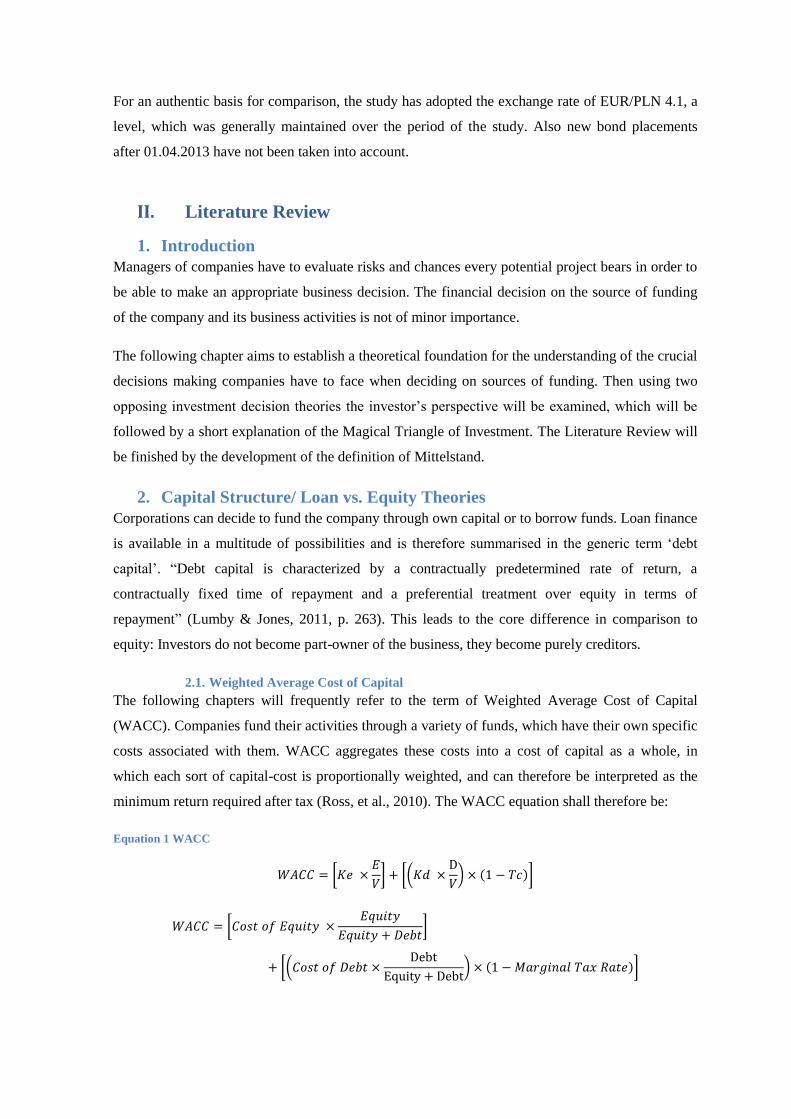
2.1. Weighted Average Cost of Capital
The following chapters will frequently refer to the term of Weighted Average Cost of Capital
(WACC). Companies fund their activities through a variety of funds, which have their own specific
costs associated with them. WACC aggregates these costs into a cost of capital as a whole, in
which each sort of capital-cost is proportionally weighted, and can therefore be interpreted as the
minimum return required after tax (Ross, et al., 2010). The WACC equation shall therefore be:
Equation 1 WACC
2.2. Modigliani-Miller Theorem, Proposition 1
The Modigliani-Miller Theorem (1958) forms the basis for ‘modern’ thinking on capital structure.
Dependent on the assumption of a perfect economy without taxes, an increase in gearing would
have two effects:
Advantage:
Based on the lower risk and preferential payout and lower return requirements, debt is
cheaper than equity.
Disadvantage:
Gearing increases financial risk held by equity and so forces up the required expected
return (in other words: fixed commitment paid before equity = finance risk).
The gained advantage has got a positive influence on the firm’s value, whereas the disadvantage
leads to a decrease of the value. Consequently, the changes cross one another out, so the WACC
and the value of the firm remains the same. Therefore the gearing and the structure of the firm’s
capital are irrelevant.
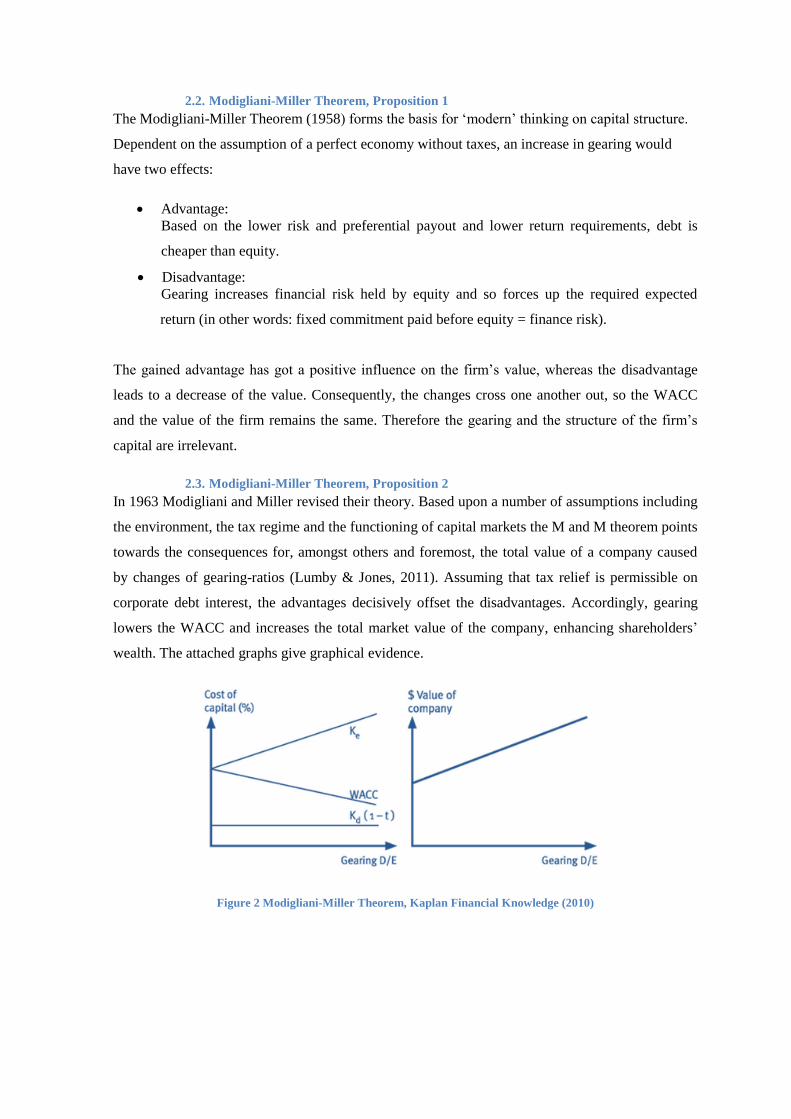
2.3. Modigliani-Miller Theorem, Proposition 2
In 1963 Modigliani and Miller revised their theory. Based upon a number of assumptions including
the environment, the tax regime and the functioning of capital markets the M and M theorem points
towards the consequences for, amongst others and foremost, the total value of a company caused
by changes of gearing-ratios (Lumby & Jones, 2011). Assuming that tax relief is permissible on
corporate debt interest, the advantages decisively offset the disadvantages. Accordingly, gearing
lowers the WACC and increases the total market value of the company, enhancing shareholders’
wealth. The attached graphs give graphical evidence.
Figure 2 Modigliani-Miller Theorem, Kaplan Financial Knowledge (2010)
For that reason the M and M Theory suggests to managers who aspire to maximize their company’s
shareholder wealth, to gear the company to a maximum magnitude, at which it would almost
entirely consist of debt, with an extremely low level of equity capital (Brooks, 2013).
The theory does not withstand the transition into real economy, largely because of the non-
consideration of hidden factors, which are also known as “Limits to the Use of Debt” (Hillier, et
al., 2013) :
Agency cost
Bankruptcy cost/ Cost of financial distress
Tax exhaustion
Debt capacity
2.3.1. Agency Cost - Principal-Agent Problem
Agency costs of leverage are part of the Principal-Agent Problem, “the problem of external control
of management by the suppliers of company finance” (Lumby & Jones, 2011, p. 455). Suppliers of
funding (the principals) face the risk of receiving misleading or insufficient information from the
recipient of funding (the agent), also referred to as asymmetric information.
Principals aim to minimise their risks and impose “restrictive conditions”, e.g. covenants, on debt
agreements that pose limitations to the company’s freedom in business activities (Marney &
Tarbert, 2011). The restraints imposed are known as agency costs. The higher the principal’s
contribution is, the higher his risk potentially is and the higher are the limitations he would possibly
set.
Ross, et al., (2010) indicate, that agents may make decisions that benefit shareholders but harm the
firm’s creditors and lower the total value of the firm, as well as try to diminish the limitations
imposed by the principals. Hence the agents might limit the level of a company’s gearing, affecting
the firm’s optimal capital structure choice contrary to M and M’s Theory.
2.3.2. Bankruptcy Cost
M and M assume no bankruptcy cost, which means that a company forced into bankruptcy, could
be liquidated at no cost. Consequently, the threat of bankruptcy would have no negative adverse
effect on the total value of the company (Lumby & Jones, 2011).
In the real world the costs of bankruptcy, composed of legal costs and write offs, are considerable.
As future cash flows are uncertain, disposable funds for the repayment of liabilities are uncertain.
Consequently every stakeholder, in particular shareholder, faces additional implicit risk of the
increasing level of bankruptcy, which goes along with an increasing level of gearing.
2.3.3. Tax exhaustion
Increasing gearing leads to increasing interest payments and eventually to an increasing tax relief.
Tax exhaustion refers to a situation, where the company has not sufficient tax liability to take
advantage of all the relief that it has available (Marney & Tarbert, 2011). Accordingly further
intake of debt is of decreasing appeal.
2.3.4. Debt Capacity
Suppliers of funding require collaterals for securitisation of their capital outlay. Most of debt
capital is secured against assets of the borrowing company. If the company fails to repay its
liabilities, the counterparty, can dispose of the security to recover its claims out of the sale proceed.
Once a company has reached its capacity to provide securities, it is unlikely to receive any further
debt, which would exceed its qualified value of assets. (Titman, et al., 2011)
Every single of the above mentioned aspects represents an explanation, why in the real world there
is no company of a nearly-100% gearing-ratio as suggested by Modigliani and Miller.
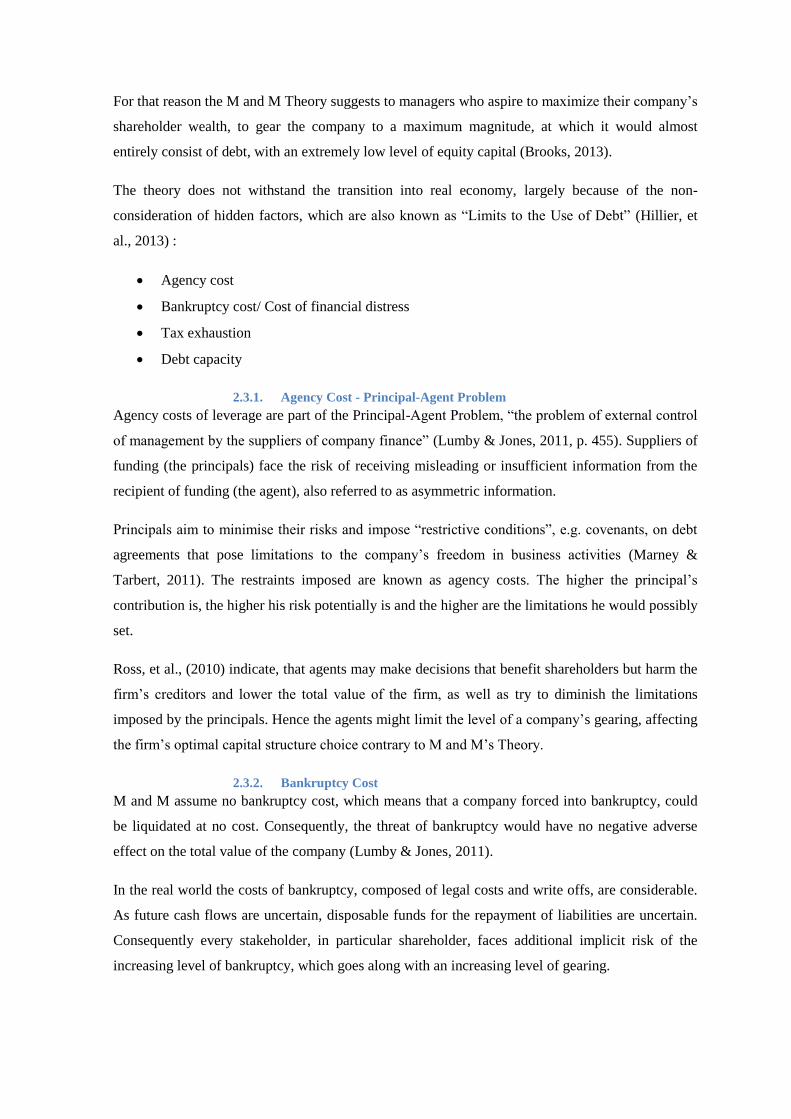
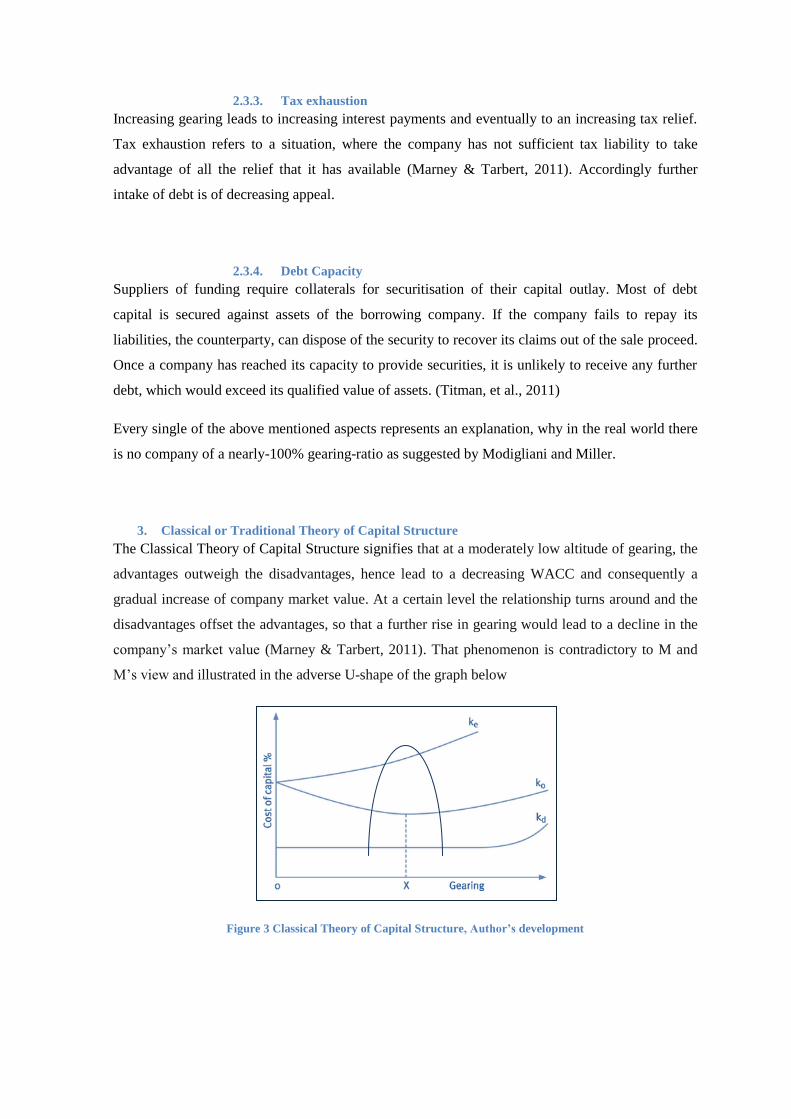
3. Classical or Traditional Theory of Capital Structure
The Classical Theory of Capital Structure signifies that at a moderately low altitude of gearing, the
advantages outweigh the disadvantages, hence lead to a decreasing WACC and consequently a
gradual increase of company market value. At a certain level the relationship turns around and the
disadvantages offset the advantages, so that a further rise in gearing would lead to a decline in the
company’s market value (Marney & Tarbert, 2011). That phenomenon is contradictory to M and
M’s view and illustrated in the adverse U-shape of the graph below
Figure 3 Classical Theory of Capital Structure, Author’s development
When the WACC is at its low point and the market value of assets are maximized, an optimal
structure of capital occurs (Hillier, et al., 2013), which is in M and M’s view located at the highest
gearing point possible.
The theory does not precisely explain the correlation of a company’s gearing level, the respective
costs of capital or the market value in real-life. But it makes clear that the capital structure of a
company can have both, unfavourable and advantageous effects on its WACC and total market
value. Therefore “gearing can be a double-edged sword and hence should always be treated with
caution.” (Lumby & Jones, 2011, p. 464)
4. Pecking Order Theory of Capital Structure
The Pecking Order Theory (Donaldson 1961, Myers & Mailuf 1984) is to be seen as contradictory
to the orthodox capital structures theories described above. Correspondingly “companies make
their decision on the source of funding out of cost-, transparency- and ownership-considerations,
[...] resulting in the preference of internal equity funding, extended by external debt funding and
then at the last stage with external equity funding” (Hillier, et al., 2013, p. 453). External equity
funding means the issue of new shares, which consequently leads to a change in ownership-
structure. The asymmetric information between managers and external shareholders leads
managers to prefer the issue debt before equity, whenever it is possible to do so.
As the theories discussed above focus exclusively on the examination of debt vs. equity, the
Pecking Order Theory adds new aspects into the considerations of funding. However, the theory
does not specify the order of further instruments within the respective categories. (Marney &
Tarbert, 2011)
5. Market Timing Theory
Baker & Wurgler (2002) analysed in “The Journal of Finance”, that leverage-ratios “have nothing o
do” with pecking order or optimal capital structure. The discrepancy between book and market
valuations influences the capital structure levels in enterprises. This means that if a firm requires
funding during a period when its book to market value (accounting value/ market capitalisation) is
high, it is more likely to raise equity, and vice versa (Baker & Wurgler, 2002).
The Market Timing Theory considers asymmetric information as irrelevant, indicating that
“Managers simply take advantage of market conditions when they decide to raise capital” (Hillier,
et al., 2013, p. 456).Therefore there is no optimal capital structure, as market timing financing
decisions are accumulated over a period of time into the capital structure outcome (Baker &
Wurgler, 2002).
3. Investment Decisions
3.1. Modern Portfolio Theory
The Modern Portfolio Theory (1952) is a theoretical model, which uses certain assumptions to
describe how capital markets operate. In consequent years it has been further developed, i.e. the
Single-Index Model, Capital Asset Pricing Model and specifically the Arbitrage Pricing Theory
(Pike & Neale, 2009). However, the Modern Portfolio Theory is purely descriptive, basing
prognoses on historical data, and therefore the theory is not usable for the design of portfolios,
being increasingly displaced by behavioural theories (Curtis, 2004).
The Portfolio Theory indicates that “investing your funds in two or more assets, that is to say, a
portfolio, it is almost always possible to improve return relative to the risk being taken, and vice
versa” (Marney & Tarbert, 2011, p. 160). Markowitz emphasized that the correlation of securities
with each other offset the sole number of different securities in the portfolio. For example, prices of
shares develop differently from prices of bonds, which eventually will lead to lower cumulative
risk, in other words, maximise the return relative to risk (Marney & Tarbert, 2011). Markowitz
defined risk as standard deviation of return. According to the theory by combining different assets,
if they are not perfectly positively correlated, the total variance of the portfolio return reduces and
hence the return of a portfolio is the weighted combination of the assets' returns (Lumby & Jones,
2011).
3.2. Behavioural Finance – Prospect Theory
Kahneman and Tversky (1979) presented in the Prospect Theory a descriptive model of decision
making under risk. In contradiction to Markowitz’s rationality assumption, they evaluated how
investment decisions are made, rather than how they should be (Curtis, 2004).
Among others, the theory describes the asymmetry of human choices, known as the certainty
effect. It describes “the risk aversion in choices involving sure gains and to risk seeking in choices
involving sure losses” resulting in “underweight outcomes that are merely probable in comparison
with outcomes that are obtained with certainty” (Kahneman & Tversky, 1979, p. 263).
Consequently the choices would lead to irrational decisions according to the MPT approach, but
eventually lead to satisfaction of deeper emotional needs.
3.3. Magic Triangle of Investments
The Magic Triangle of Investments is a theory, which is widely used in the German financial
advisory industry. It explains the negative correlation between return, risk and liquidity. A
graphical display can be found in section V.4.5.
4. Definition of Small and Medium Sized Enterprises
Traditionally the German SME-sector is referred to as “Mittelstand”, a well-known term also
outside of Germany. Due to various customary approaches, a binding definition of Mittelstand does
not exist.
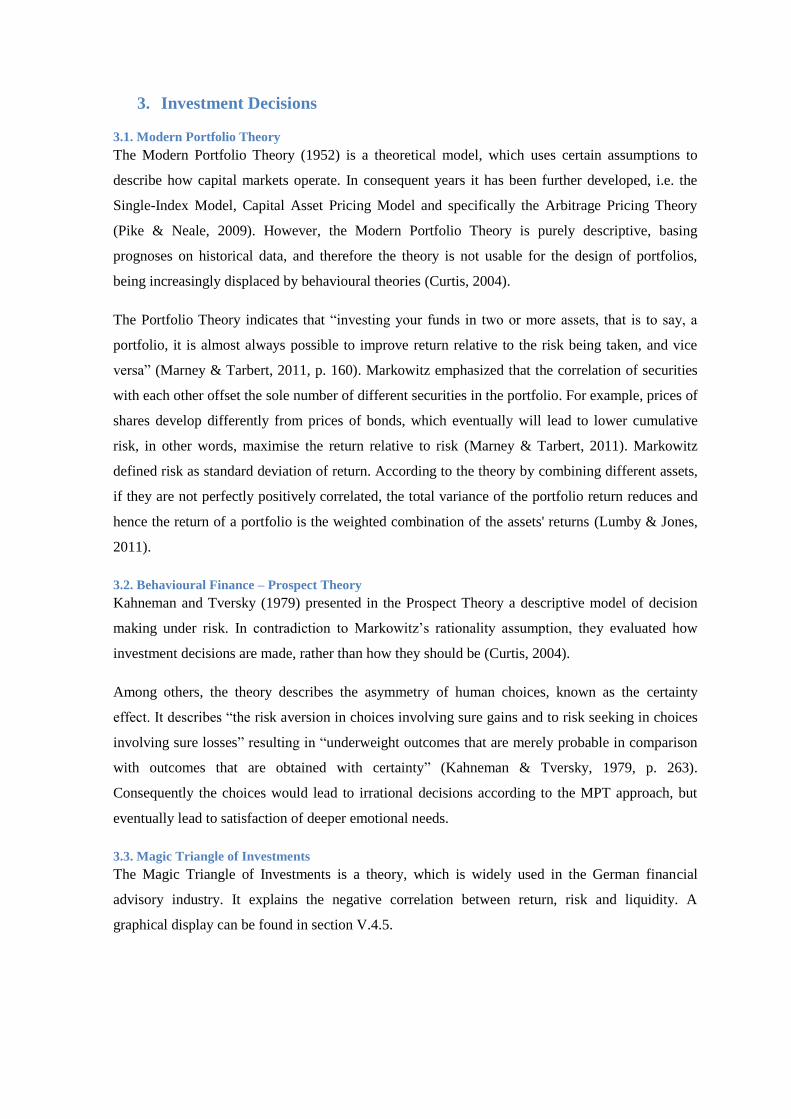
Looking at quantitative criteria the German Banking Industry Committee subdivides Mittelstand
into the following categories, dependent on annual turnovers (IHK Berlin, 2012):
Table 1 SME Definition German Banking Industry (2012)
Category Turnover
Small ≤ € 500k
Medium-sized ≤ € 50m
Large ≤ € 500m
The German government uses the most common quantitative definition issued by the Institute for
Mittelstand-Research (IfM).
Table 2 SME Definition Institute for Mittelstand-Research (2012)
Category Turnover Employees
Small < € 1m < 9
Medium-sized ≤ € 50m < 500
For a thorough understanding of Mittelstand, qualitative criteria have to be taken into account.
Mittelstand is “much more pronounced by its attitude in the socio-economical and political
process” (Institut für Mittelstandsforschung, 2012, p. 2) and plays therefore a crucial role in the
German social market economy. As a consequence Mittelstand is not to be seen as simple
superscription for SMEs, but expresses a special responsibility and mindset in the union of leader-
and ownership of the enterprise (Bundesverband der Deutschen Industrie, 2012)- typically found in
family-owned businesses. Hence the IfM uses the term Mittelstand as a synonymous for family-
owned enterprises (Institut für Mittelstandsforschung, 2012).
As in the latest report about the biggest family-owned enterprises in Germany the IfM identified
more than 4,400 family-owned enterprises with annual turnovers of over EUR 50m (Institut für
Mittelstandsforschung, 2013), this equalisation might appear not comprehensible in terms of SME.
However, the overlay of family-owned businesses and ‘statistical’ SMEs is very high. Additionally
only 0.5% of Mittelstand has got annual turnovers of more than EUR 50m (KfW, 2012). The
extended application of the term Mittelstand appears therefore justifiable.
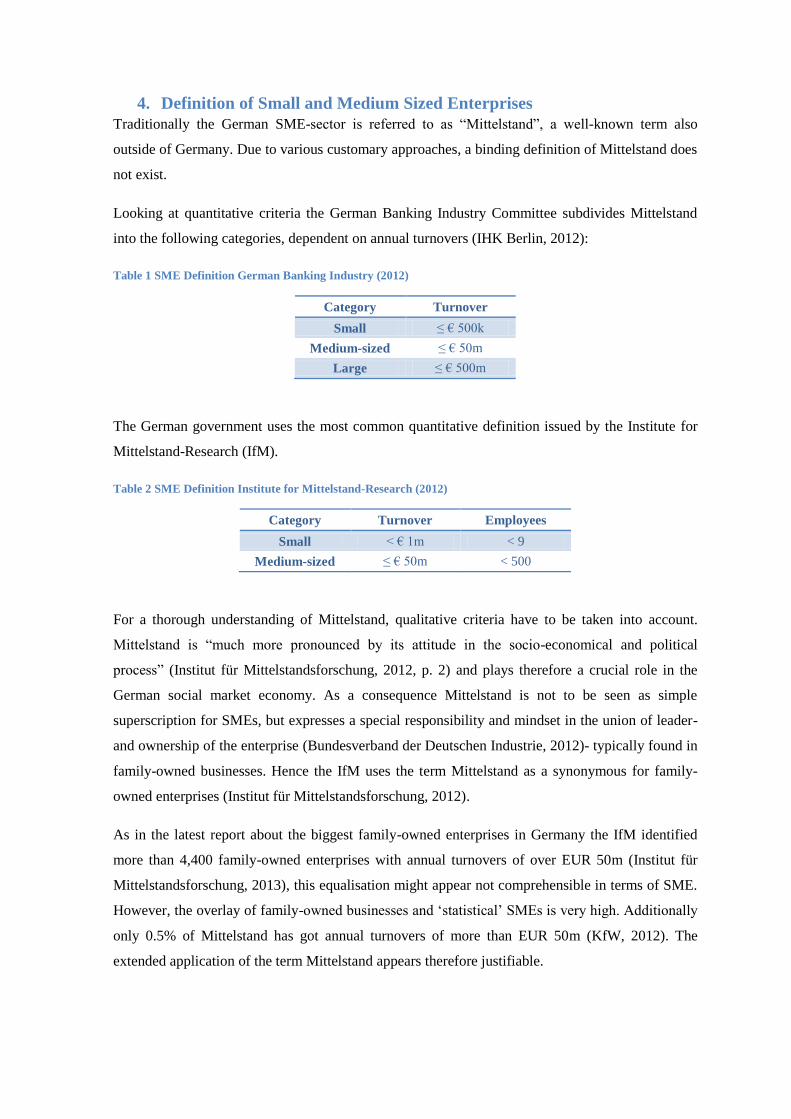
The definition of SMEs in Poland is less sophisticated. Based on the relatively young market
economy, Poland has adopted the segmentation criteria of the European Commission (Polska
Agencja Rozwoju Przedsiębiorczości, 2013). The updated criteria came into force in June 2005 as a
basis for programs, policies and statistics, etc. that the EC and other official bodies apply for SMEs
(European Commission, 2005). To guarantee the comparability between the SME sectors in Poland
and Germany the following definition of the European Commission will be applied.
Table 3 SME Definition European Commission (2012)
Category Turnover OR Balance sheet total Employees
Micro ≤ € 2 m ≤ € 2 m < 10
Small ≤ € 10 m ≤ € 10 m < 50
Medium-sized ≤ € 50 m ≤ € 43 m < 250

III. Research Methodology
“Research methodology is a set of structured guidelines or activities to assist in generating valid
and reliable research results” (Mingers, 2011).
The Research Methodology chapter aims to illustrate and explain the design, data collection and
approaches used in this study. The research methodology will be explained with the help of the
following sections.
1. Research Design
The basis for any research project is the identification of the purpose of the study. As the purpose
of this study is to evaluate the applicability of the German SME bond-funding model to Poland, the
analysis will be taken out on four levels: The German and the Polish SME-markets, thus the
German and Polish corporate debt capital markets.
In order to achieve the outcome of the purpose of the study, the respective topics have to be
compared against one another, which represents the research objective. The foundation for the
comparison is displayed in the following research questions:
RQ 1: What are the structural differences, if any, between German and Polish
SMEs?
RQ 2: What are the differences, if any, in fund-raising of German and Polish
SMEs?
RQ 3: What are the characteristics of the German M-Bond model?
RQ 4: What are the characteristics of the Polish corporate bond market?
RQ 1 and RQ 2 refer to a complex of themes connected to SMEs, whereas RQ 3 and RQ 4 aim to
increase the understanding of the respective debt capital markets (DCM).
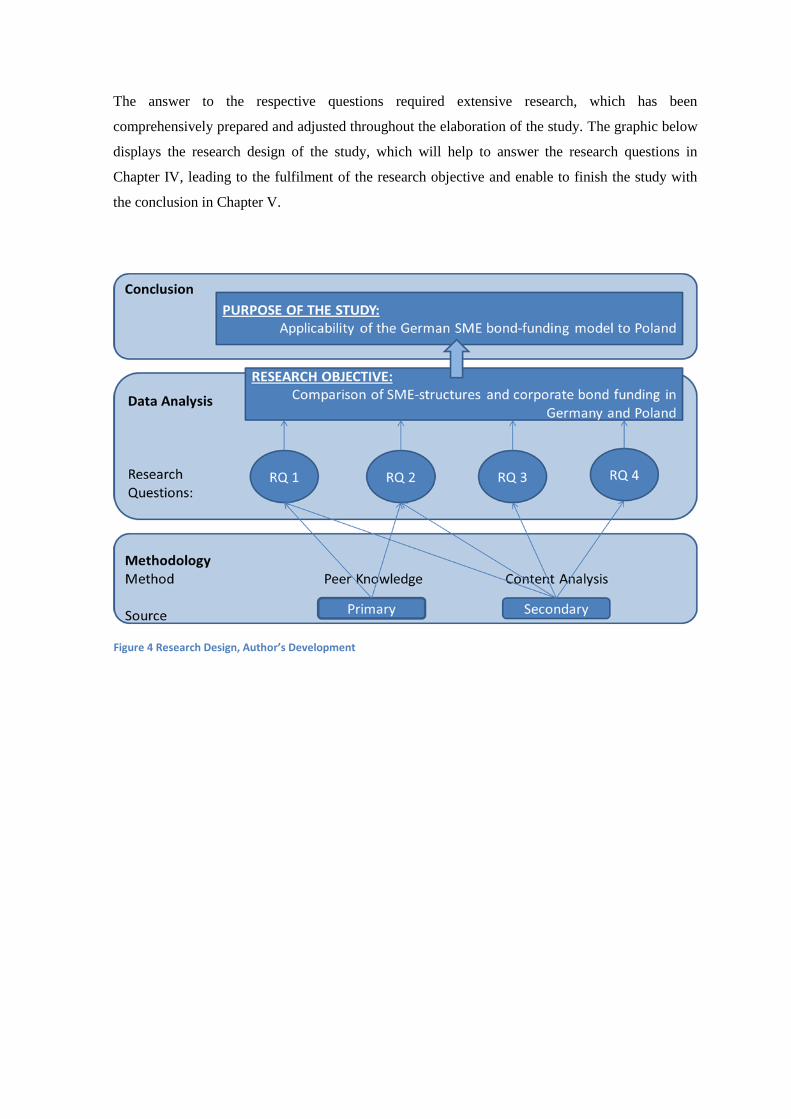
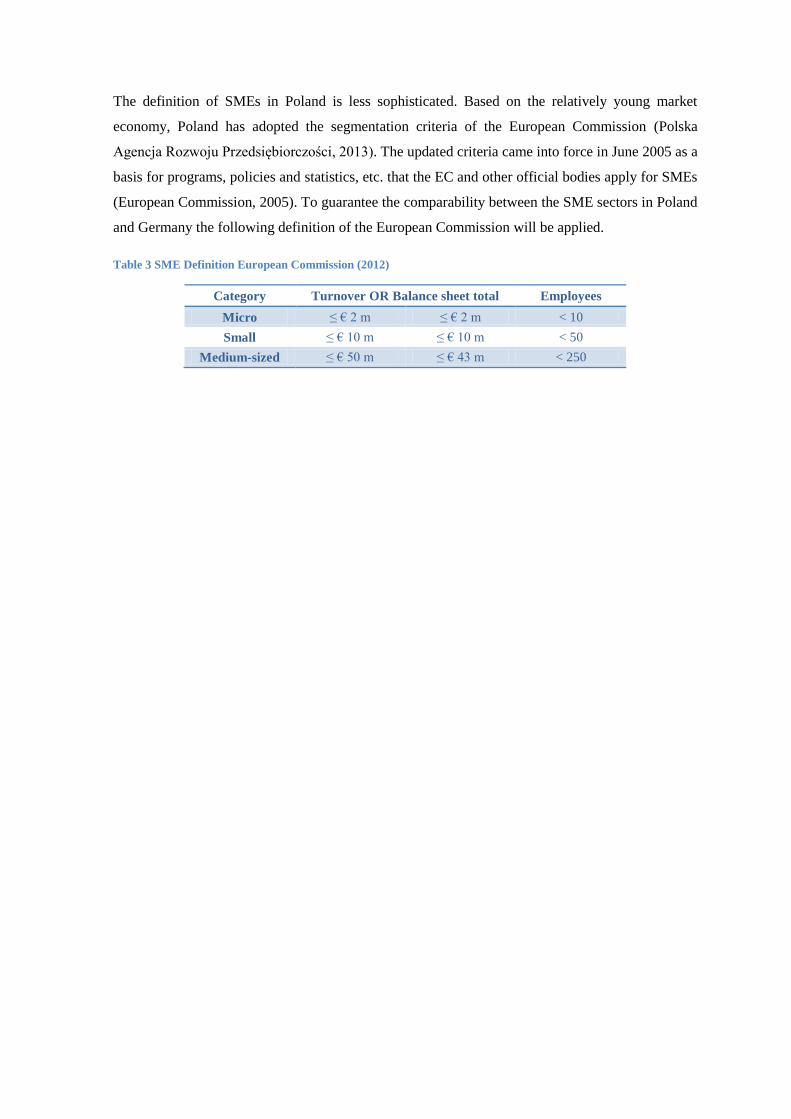
The answer to the respective questions required extensive research, which has been
comprehensively prepared and adjusted throughout the elaboration of the study. The graphic below
displays the research design of the study, which will help to answer the research questions in
Chapter IV, leading to the fulfilment of the research objective and enable to finish the study with
the conclusion in Chapter V.
Figure 4 Research Design, Author’s Development
2. Research Approach and Philosophy
2.1. Research Philosophy
The layout of the questions leads to a descriptio-explanatory nature of the study. Saunders, et al.,
(2012) refer to Bhaskar (1989) who says that “researchers will only be able to understand what is
going on [...] if we understand the [...] structures that have given the rise to the phenomena that we
are trying to understand” and add “critical realists, on the other hand, would recognise the
importance of multilevel study [...]. Each of these levels has the capacity to change the researcher’s
understanding of that which is being studied” (Saunders, et al., 2012, p. 136f.) Therefore the
research is deemed to follow the “Critical Realism” philosophy, which will establish the basis to
interconnect the specifics of the four research questions, derive related topics and evolve
throughout the research process.
2.2. Research Approach
To answer the research questions, data has been collected to explore similarities and differences
between Germany and Poland. Following it has been summarised to generalise patterns, which in
turn were aimed to be tested against literature and subsequent data. Due to lack of literature in the
field of comparison of SME bond-funding between the Poland and Germany, the aim of the
research shall be the generation of a self-developed conclusion, rather than the verification or
falsification of an already existing theory. That approach characterises the inductive research
approach.
3. Research Strategies and Time Horizons
3.1. Time Horizons
Given the actuality of the matter and the establishment of the German M-Bond market in 2010 and
Polish Catalyst in 2009, the possibility of a longitudinal study is rather limited. The paper is
therefore a cross-sectional study, defined as “the study of a particular phenomenon (or phenomena)
at a particular time” (Saunders, et al., 2012, p. 190), yet taking into consideration data over a
broader period of time.
3.2. Research Strategies
The author of this study looks back at more than six years of private and commercial banking work
experience, largely connected to German and fractionally to Polish SMEs. That fact had a
significant influence on the research design and strategy. The research benefited distinctively from
good access to both secondary data, in terms of reports and analyses not widely accessible to
general public, and primary data, in terms of admission to specialists mainly in the fields of SME
and DCM. The research paper does not contradict with any confidentiality matters.
Given the broad study field of this paper and good access to solid secondary research, a reliable
primary research appeared too sophisticated and exceeding the resources of an undergraduate
research project. Therefore the author’s experience gained through vocational training and
informal, semi-structured conversations with colleagues serve as primary source, mainly used for
RQ 1 and 2.
Based on a high quantity and quality of secondary sources, secondary research was at the core of
this research study. It was based on a variety of resources, specifically:
RQ 1 and 2: specialist reports and analyses from the financial industry and
institutions specialised on SMEs, books, newspaper articles and official data from
governments and the EU. The latter have been used largely as basis for direct
comparison between the two analysed countries.
RQ 3 and 4: specialist reports and analyses from the financial industry and
institutions specialised on corporate debt markets, M-Bonds and investments, and
a large amount of (specialist) magazines and newspapers, which included articles,
interviews and discussions.
The high share of secondary data finds criticism in a variety of literature (compare Saunders, et al.,
2012; Ghauri & Gronhaug, 2010; Yin, 2009). However, the actuality and proximity to the sources
and the process of data analysis proves a high reliability. Additonally, as can be seen in Figure 4,
the author adds his knowledge as primary source.
As in the respective sources various groups of interests are represented, the study puts emphasis on
diversification of sources, in order to maintain an objective approach. As a consequence data
accessed through the author’s professional channels, which tended to be in favour of certain
approaches, have been enlarged by further field research to either confirm or disapprove the
analysed outcome. Therefore the study also follows also a comparative approach (Wilson, 2010).
For the structures and characteristics of the M-Bond market in RQ 3 and mainly for the corporate
bond market in Poland for RQ 4, quantitative research had to be added to the research
methodologies. Therefore the research strategy of this paper is to be described as mixed method
research (Mingers, 2011, p. 165), however with a high contribution of qualitative research, which
in turn characterises the inductive approach (Yin, 2009).
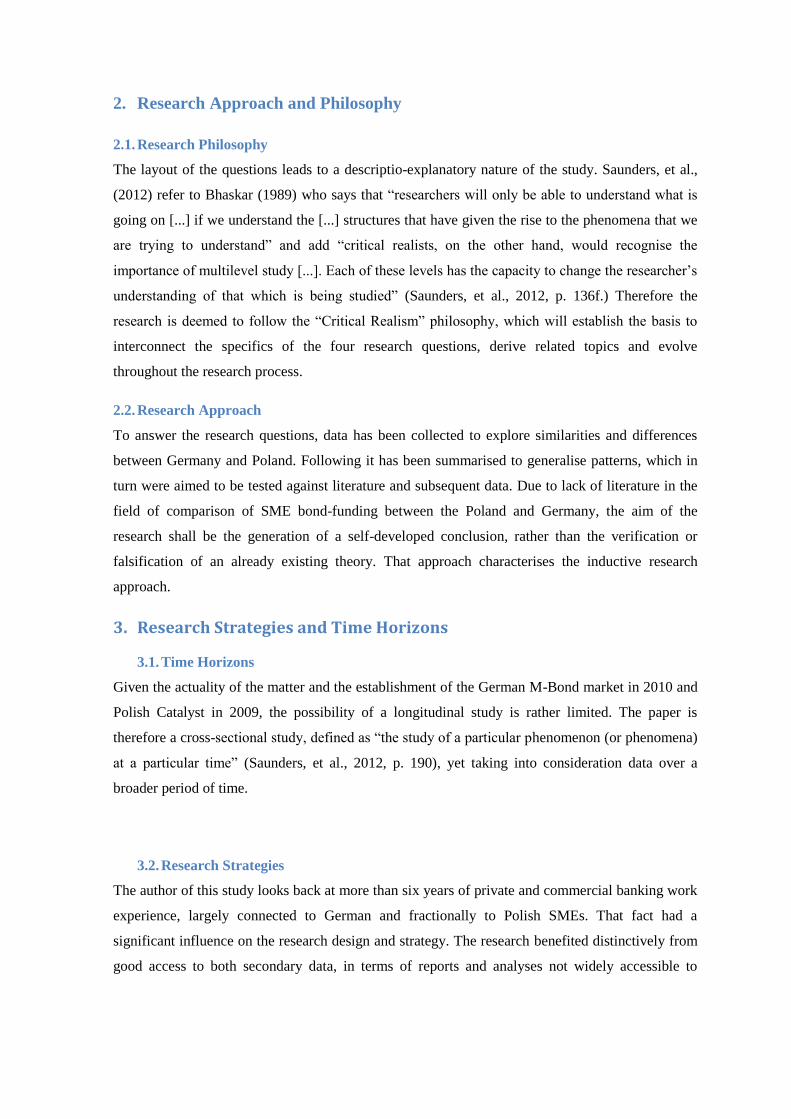
4. Data Collection and Data Analysis
Figure 5 - Typical Qualitative Research, University of Coimbra (2010)
4.1. Data Collection
The graphic indicates a typical process of the qualitative research approach, characterised by
recurring flows of research. The structure and the connections of the respective topics are
dependent on the research objectives, structure and design (Saunders, et al., 2012; Wilson, 2010;
Yin, 2009), nevertheless they point towards the fact that an accomplished stage of research leads
automatically to another. As displayed above, the study is based on various sources of secondary
data, which has been assessed following the ongoing comparison approach.
4.2. Data Analysis
To quantify qualitative data Hair, et al., (2003) suggest to make use of content analysis, which
“obtains data by observing and analyzing the content or message of written text” (Hair, et al., 2003,
p. 126). The study followed the generic approaches to analysis, which are not specified in only one
theory, but consist of a variety of techniques. The study followed partly a structure, which has been
described by Saunders, et al., (2012) as follows:
1. Identifying categories or codes that allow you to comprehend the data;
2. Attaching data from disparate sources to appropraite categories or codes to to integrate
these data;
3. Developing analytical categories further to identify relationships and patterns;
4. Developing testable propositions;
5. Drawing and verifiying conlcuions.
A big part of that process was ‘unitising’ data, withdrawing data from various reports and bringing
it together under one topic to further recognise relationships. Sometimes the proces of forming
patterns, drew attention to a topic which has not been analysed, but seemed like ‘the missing bit’.
Thus the research had to start again at a different stage, like indicated in the Figure 5. The research
conducted was pretty time-consuming, reflective and intensive. That lead at times to very broad
results of research, which then faced the problem of abstraction and actual use in the study. At
other times, however, that strategy lead the researcher with little new information. Saunders, et al.
see these characteristics mirrored in the Grounded Theory Method, which according to Ghauri &
Gronhaug (2010) requires a high level of competence and good access to data.
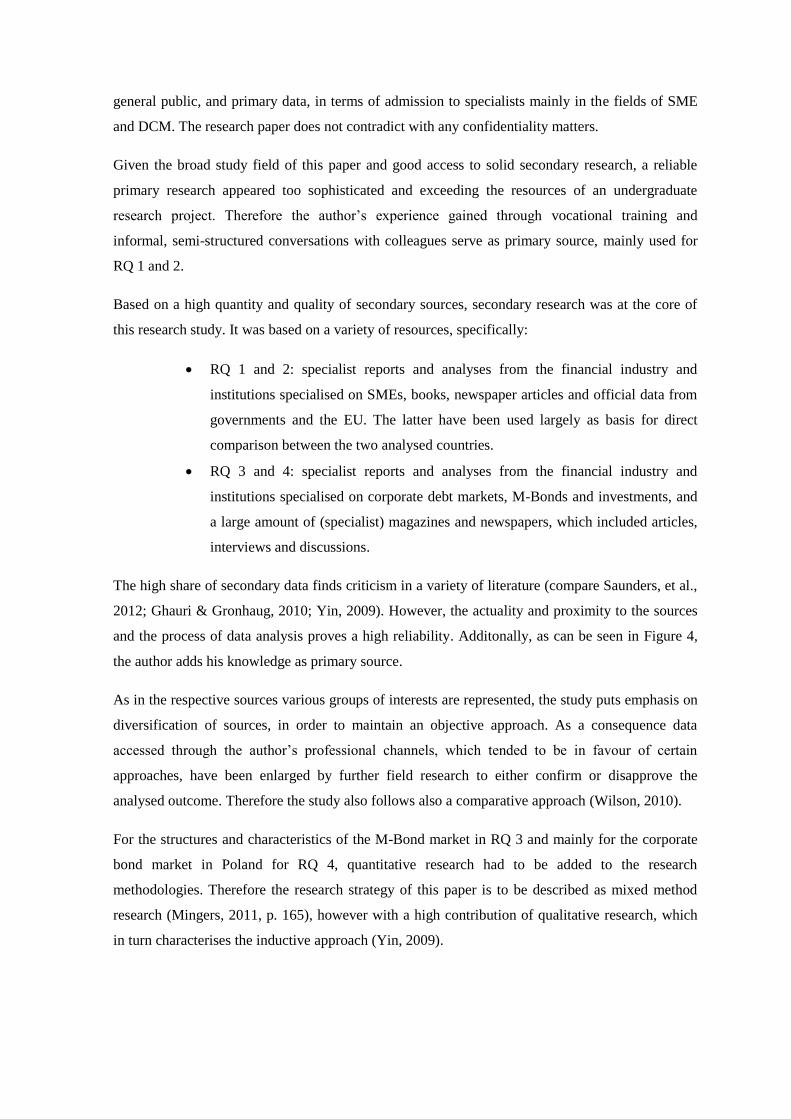
5. Summary
The research study is designed to derive causal relationships between variables within the
respective fields of analysis, which were established out of the four research questions. Following
the patterns of the Grounded Theory Method the study developed comprehensive answers to the
research questions. The following graphic uses Saunder’s research onion to summarise the research
methodology.
Concluding, the access to resources has to be highlighted as a core strength of this paper. Highly
reliable and in parts restrictively accessible data has been used to create an unprecedented
comparison of two developing bond markets in Germany and Poland. That fact enlarged by the
author’s work experience distinguishes this undergraduate research project.
However, the time frame for this paper was scarce as well as the resources given to a undergraduate
reserach project, embodying a real obstacle to the work’s debth of expertise.
Secondary Data
Cross-Sectional
Mixed Methods Research
Induction
Critical Realism
Figure 6 Research Onion, Author’s development, adapted from Saunders, M et al. (2010)
Furthermore the research study also faced country-specific limitations. A comprehensive
comparison of Germany and Poland faced limitations based on the different scales and levels of
maturity of the economies, correspondingly accessibility of data.
Additionally the higher maturity of the German economy leads to different priorities in the media.
The media attention for both SMEs and (SME-) corporate bonds in Germany is distinctively higher
than in Poland, leading to an imbalance of access to resources. As a result research for the Polish
sections was more effortful.
Also it has to be added that to fully analyse the extend of SME-funding, especially in Germany,
neighbouring foreign countries, e.g. Luxembourg, would have to be included in the research,
displaying a geographical limitation to the study.

IV. Findings
1. Introduction The following chapters will analyse the German and Polish SME-market and their funding
preferences in order to derive characteristics. This will be followed by an analysis of applicable
corporate debt capital markets of both countries.
2. Structural analysis of SMEs in Germany and Poland
1. Introduction
“Small and Medium-sized Enterprises are the backbone of the European economy” (Roland Berger
Strategy Consultants, 2012). 99.8% of all businesses in 27 countries of the European Union are
counted among the SME-sector, being responsible for 67.4% of total employment in the single
economic area (European Commission, 2013). Therefore SMEs capture special attention of
European policy-makers. The following chapter will analyse the German and the Polish SME-
market.
To guarantee the comparability between the two economies, the following chapters will be based
on the SBA (Small Business Act) Fact Sheet of the European Commission, which “represents a
comprehensive source of information on the performance of SMEs in Europe and uses a wide
range of success indicators” (European Commission, 2012).
2. Profile of the SME-sector in Germany
According to the latest SBA-Fact Sheet Germany hosts Europe’s best performing SME sector in
terms of total figures for jobs and value added. Europe’s largest economy has got a significantly
lower share of micro-enterprises than the EU average, which reflects in the considerably higher rate
of small and medium-sized companies. Additionally the sector of large companies ranks
distinctively above EU average in respect of number of enterprises, employment and value added.
These figures largely relate to the size of the German economy and indicate a high degree of
maturity (IHK Berlin, 2012).
Number Share Share Number Share Share Billion € Share Share
Micro 1.745.39
8
83,30% 92,20% 4.753.024 19,20% 29,60% 207 15,00% 21,20%
Small 286.970 13,70% 6,50% 5.667.339 22,90% 20,60% 254 18,40% 18,50%
Medium-sized 54.300 2,60% 1,10% 5.102.403 20,60% 17,20% 284 20,60% 18,40%
SMEs 2.086.66
8
99,50% 99,80% 15.522.76
6
62,70% 67,40% 745 53,90% 58,10%
Large 9.647 0,50% 0,20% 9.228.272 37,30% 32,60% 636 46,10% 41,90%
Total 2.096.31
5
100,00
%
100,00% 24.751.03
8
100,00
%
100,00
%
1.38
1
100,00
%
100,00
%
Figure 7 SBA Fact Sheet Germany, Author’s development, adapted from European Commission (2012)
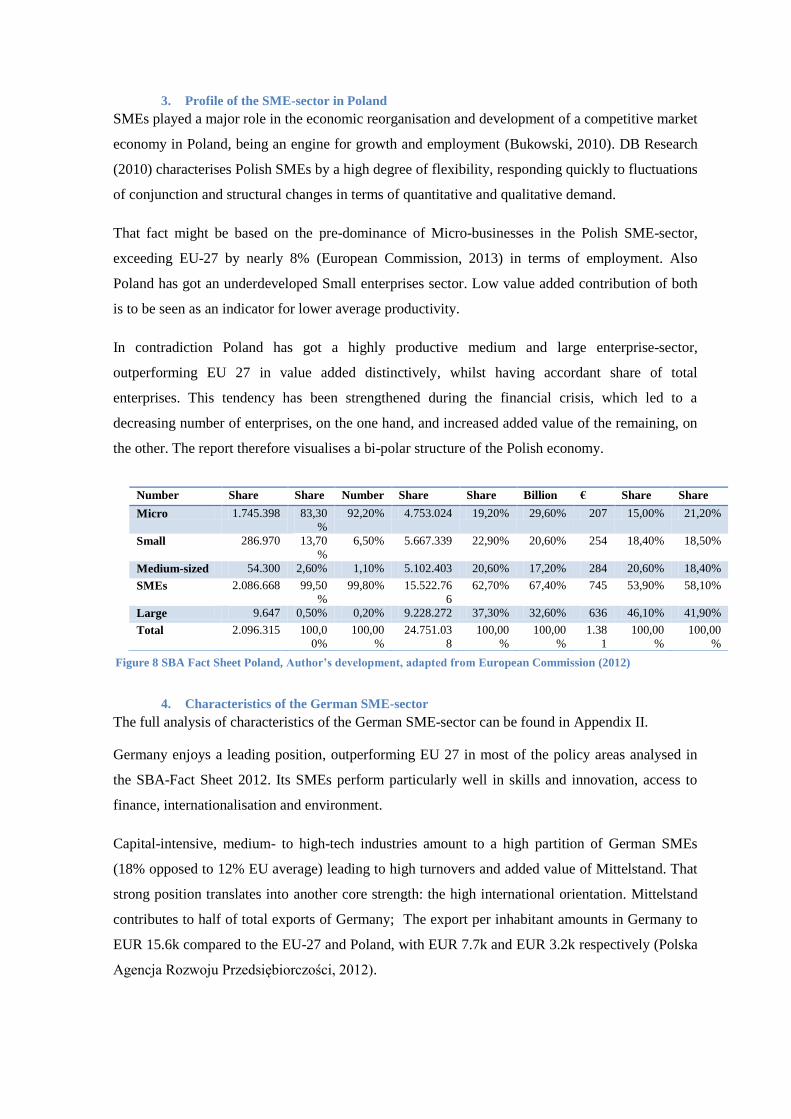
3. Profile of the SME-sector in Poland
SMEs played a major role in the economic reorganisation and development of a competitive market
economy in Poland, being an engine for growth and employment (Bukowski, 2010). DB Research
(2010) characterises Polish SMEs by a high degree of flexibility, responding quickly to fluctuations
of conjunction and structural changes in terms of quantitative and qualitative demand.
That fact might be based on the pre-dominance of Micro-businesses in the Polish SME-sector,
exceeding EU-27 by nearly 8% (European Commission, 2013) in terms of employment. Also
Poland has got an underdeveloped Small enterprises sector. Low value added contribution of both
is to be seen as an indicator for lower average productivity.
In contradiction Poland has got a highly productive medium and large enterprise-sector,
outperforming EU 27 in value added distinctively, whilst having accordant share of total
enterprises. This tendency has been strengthened during the financial crisis, which led to a
decreasing number of enterprises, on the one hand, and increased added value of the remaining, on
the other. The report therefore visualises a bi-polar structure of the Polish economy.
4. Characteristics of the German SME-sector
The full analysis of characteristics of the German SME-sector can be found in Appendix II.
Germany enjoys a leading position, outperforming EU 27 in most of the policy areas analysed in
the SBA-Fact Sheet 2012. Its SMEs perform particularly well in skills and innovation, access to
finance, internationalisation and environment.
Capital-intensive, medium- to high-tech industries amount to a high partition of German SMEs
(18% opposed to 12% EU average) leading to high turnovers and added value of Mittelstand. That
strong position translates into another core strength: the high international orientation. Mittelstand
contributes to half of total exports of Germany; The export per inhabitant amounts in Germany to
EUR 15.6k compared to the EU-27 and Poland, with EUR 7.7k and EUR 3.2k respectively (Polska
Agencja Rozwoju Przedsiębiorczości, 2012).
Number Share Share Number Share Share Billion € Share Share
Micro 1.745.398 83,30
%
92,20% 4.753.024 19,20% 29,60% 207 15,00% 21,20%
Small 286.970 13,70
%
6,50% 5.667.339 22,90% 20,60% 254 18,40% 18,50%
Medium-sized 54.300 2,60% 1,10% 5.102.403 20,60% 17,20% 284 20,60% 18,40%
SMEs 2.086.668 99,50
%
99,80% 15.522.76
6
62,70% 67,40% 745 53,90% 58,10%
Large 9.647 0,50% 0,20% 9.228.272 37,30% 32,60% 636 46,10% 41,90%
Total 2.096.315 100,0
0%
100,00
%
24.751.03
8
100,00
%
100,00
%
1.38
1
100,00
%
100,00
%
Figure 8 SBA Fact Sheet Poland, Author’s development, adapted from European Commission (2012)
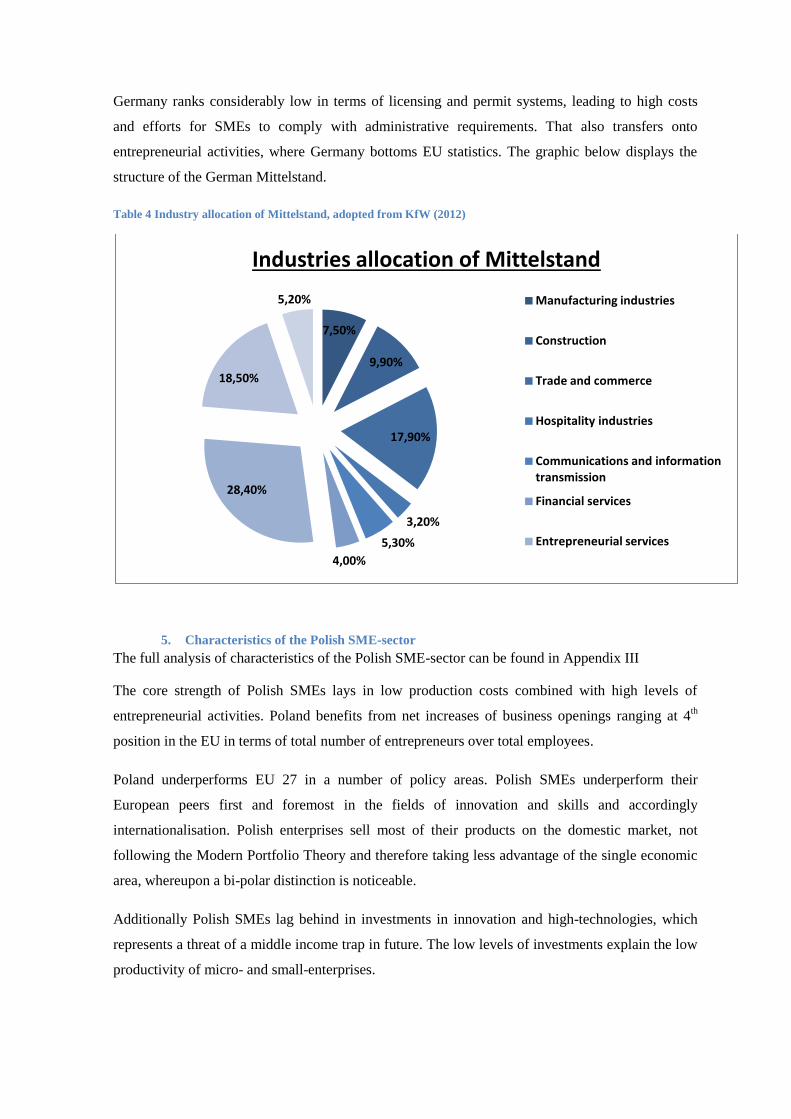
Germany ranks considerably low in terms of licensing and permit systems, leading to high costs
and efforts for SMEs to comply with administrative requirements. That also transfers onto
entrepreneurial activities, where Germany bottoms EU statistics. The graphic below displays the
structure of the German Mittelstand.
Table 4 Industry allocation of Mittelstand, adopted from KfW (2012)
5. Characteristics of the Polish SME-sector
The full analysis of characteristics of the Polish SME-sector can be found in Appendix III
The core strength of Polish SMEs lays in low production costs combined with high levels of
entrepreneurial activities. Poland benefits from net increases of business openings ranging at 4th
position in the EU in terms of total number of entrepreneurs over total employees.
Poland underperforms EU 27 in a number of policy areas. Polish SMEs underperform their
European peers first and foremost in the fields of innovation and skills and accordingly
internationalisation. Polish enterprises sell most of their products on the domestic market, not
following the Modern Portfolio Theory and therefore taking less advantage of the single economic
area, whereupon a bi-polar distinction is noticeable.
Additionally Polish SMEs lag behind in investments in innovation and high-technologies, which
represents a threat of a middle income trap in future. The low levels of investments explain the low
productivity of micro- and small-enterprises.
7,50%
9,90%
17,90%
3,20%
5,30%
4,00%
28,40%
18,50%
5,20%
Industries allocation of Mittelstand
Manufacturing industries
Construction
Trade and commerce
Hospitality industries
Communications and information transmission
Financial services
Entrepreneurial services
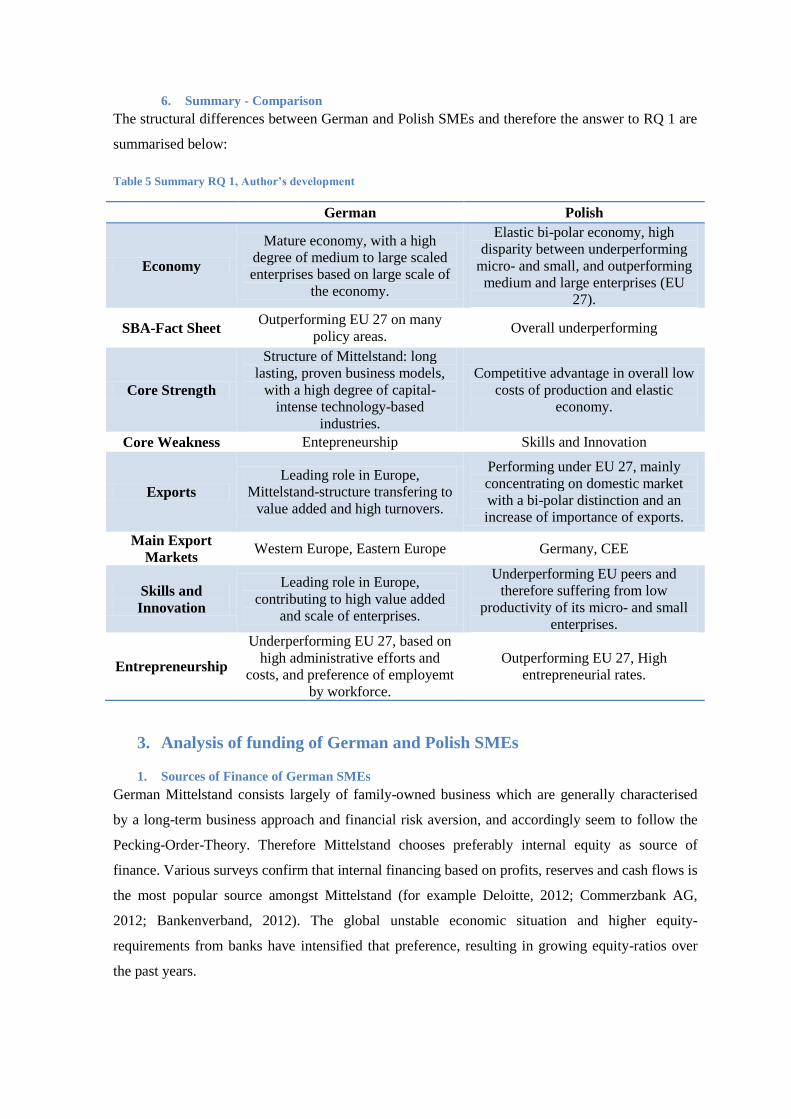
6. Summary - Comparison
The structural differences between German and Polish SMEs and therefore the answer to RQ 1 are
summarised below:
Table 5 Summary RQ 1, Author’s development
German Polish
Economy
Mature economy, with a high
degree of medium to large scaled
enterprises based on large scale of
the economy.
Elastic bi-polar economy, high
disparity between underperforming
micro- and small, and outperforming
medium and large enterprises (EU
27).
SBA-Fact Sheet Outperforming EU 27 on many
policy areas. Overall underperforming
Core Strength
Structure of Mittelstand: long
lasting, proven business models,
with a high degree of capital-
intense technology-based
industries.
Competitive advantage in overall low
costs of production and elastic
economy.
Core Weakness Entepreneurship Skills and Innovation
Exports
Leading role in Europe,
Mittelstand-structure transfering to
value added and high turnovers.
Performing under EU 27, mainly
concentrating on domestic market
with a bi-polar distinction and an
increase of importance of exports.
Main Export
Markets Western Europe, Eastern Europe Germany, CEE
Skills and
Innovation
Leading role in Europe,
contributing to high value added
and scale of enterprises.
Underperforming EU peers and
therefore suffering from low
productivity of its micro- and small
enterprises.
Entrepreneurship
Underperforming EU 27, based on
high administrative efforts and
costs, and preference of employemt
by workforce.
Outperforming EU 27, High
entrepreneurial rates.
3. Analysis of funding of German and Polish SMEs
1. Sources of Finance of German SMEs
German Mittelstand consists largely of family-owned business which are generally characterised
by a long-term business approach and financial risk aversion, and accordingly seem to follow the
Pecking-Order-Theory. Therefore Mittelstand chooses preferably internal equity as source of
finance. Various surveys confirm that internal financing based on profits, reserves and cash flows is
the most popular source amongst Mittelstand (for example Deloitte, 2012; Commerzbank AG,
2012; Bankenverband, 2012). The global unstable economic situation and higher equity-
requirements from banks have intensified that preference, resulting in growing equity-ratios over
the past years.
Further demand for capital is predominantly pleased by traditional bank debt. Bank loans are
considered to be of high strategic importance and rank considerably above leasing, shareholder
loans and further ways of external financing (Commerzbank AG, 2012). That fact is also based on
the historically grown model of ‘house-banks’; banks being the main banking relationship of
Mittelstand-companies not infrequently over generations. Based on the lending-relationship, banks
then provide crucial services and products Mittelstand requires for a variety of business activities,
like hedging of foreign trade. In a survey amongst 209 Mittelstand-companies 88% responded to
follow the house-bank principle, resulting in an average share of bank liabilities amounting to 26%
of the balance sheet total (Deloitte, 2012).
Given the imposed requirements on the banking industry, most of all Basel II and III, companies
also expect to face higher requirements in respect to resilient balance sheet ratios, reliable reporting
and collaterals, respectively (Deloitte, 2012).
Although the majority of companies emphasises the importance of their core bank, a distinct trend
towards diversification of financial sources is noticeable in the increased demand for alternative
ways of debt finance, like M-Bonds, Schuldschein and in particular Factoring (Der Betrieb, 2012).
Yet, the usage of the respective instruments is still underdeveloped.
Based on the current low level of interest rates, Mittelstand benefits from low cost of debt.
Additionally large banks, like Commerzbank and Deutsche Bank, have set up dedicated funds for
SME funding. However, Bankenverband states that the good access to funding has not been utilised
by Mittelstand in 2012 (Bankenverband, 2012). Amongst other factors, that might be also seen as
indicator, that the trend for diversification of funding is sustainable.
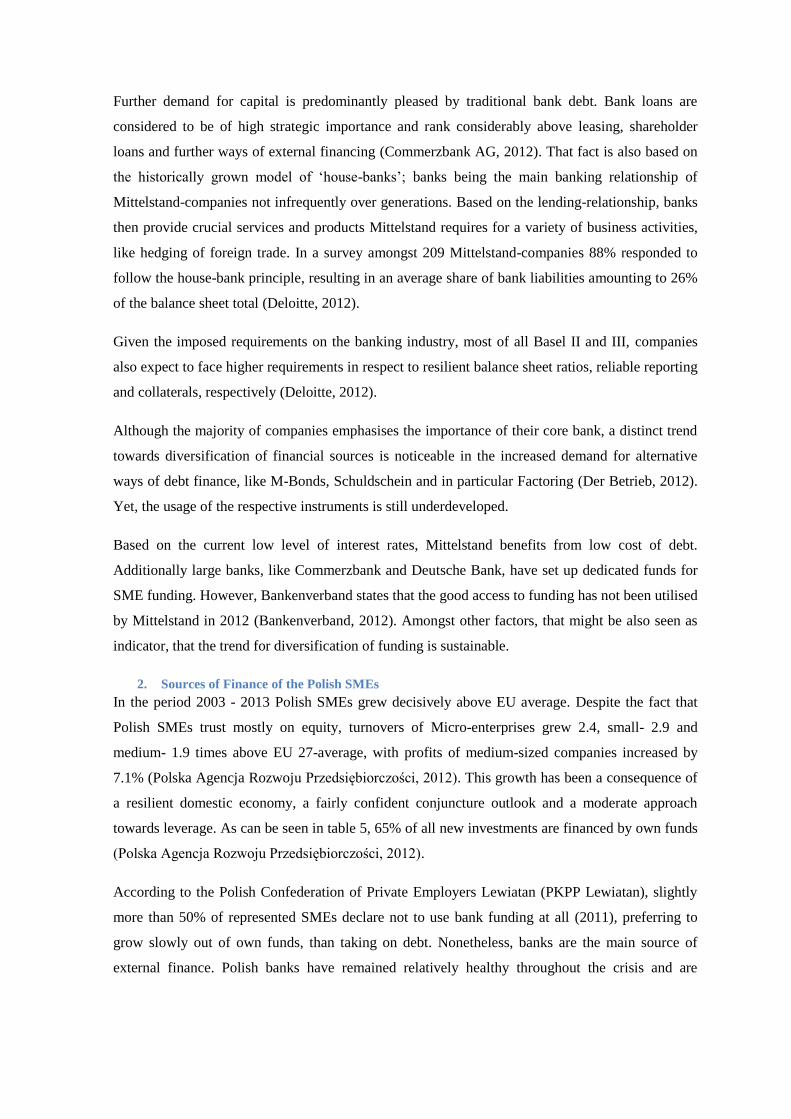
2. Sources of Finance of the Polish SMEs
In the period 2003 - 2013 Polish SMEs grew decisively above EU average. Despite the fact that
Polish SMEs trust mostly on equity, turnovers of Micro-enterprises grew 2.4, small- 2.9 and
medium- 1.9 times above EU 27-average, with profits of medium-sized companies increased by
7.1% (Polska Agencja Rozwoju Przedsiębiorczości, 2012). This growth has been a consequence of
a resilient domestic economy, a fairly confident conjuncture outlook and a moderate approach
towards leverage. As can be seen in table 5, 65% of all new investments are financed by own funds
(Polska Agencja Rozwoju Przedsiębiorczości, 2012).
According to the Polish Confederation of Private Employers Lewiatan (PKPP Lewiatan), slightly
more than 50% of represented SMEs declare not to use bank funding at all (2011), preferring to
grow slowly out of own funds, than taking on debt. Nonetheless, banks are the main source of
external finance. Polish banks have remained relatively healthy throughout the crisis and are
willing to provide finance, especially from small enterprises onwards, albeit on more conservative
terms than previously (FitchRatings, 2012).
That good access to funding has been also proven in empirical studies (European Commission,
2013) and surveys among enterprises (Starczewska-Krzysztoszek, 2011; Misztak-Kowalska, 2012;
Polska Agencja Rozwoju Przedsiębiorczości, 2012). However, the economic downturn in Europe
led to increasing numbers of business closures and lower business expectations, and consequently
to a more cautious approach towards loans of both, banks and enterprises. That circumstance
intensified the tendency of diversification of sources of funding, which is taking place since 2006,
mainly to the detriment of traditional bank loans (Starczewska-Krzysztoszek, 2011).
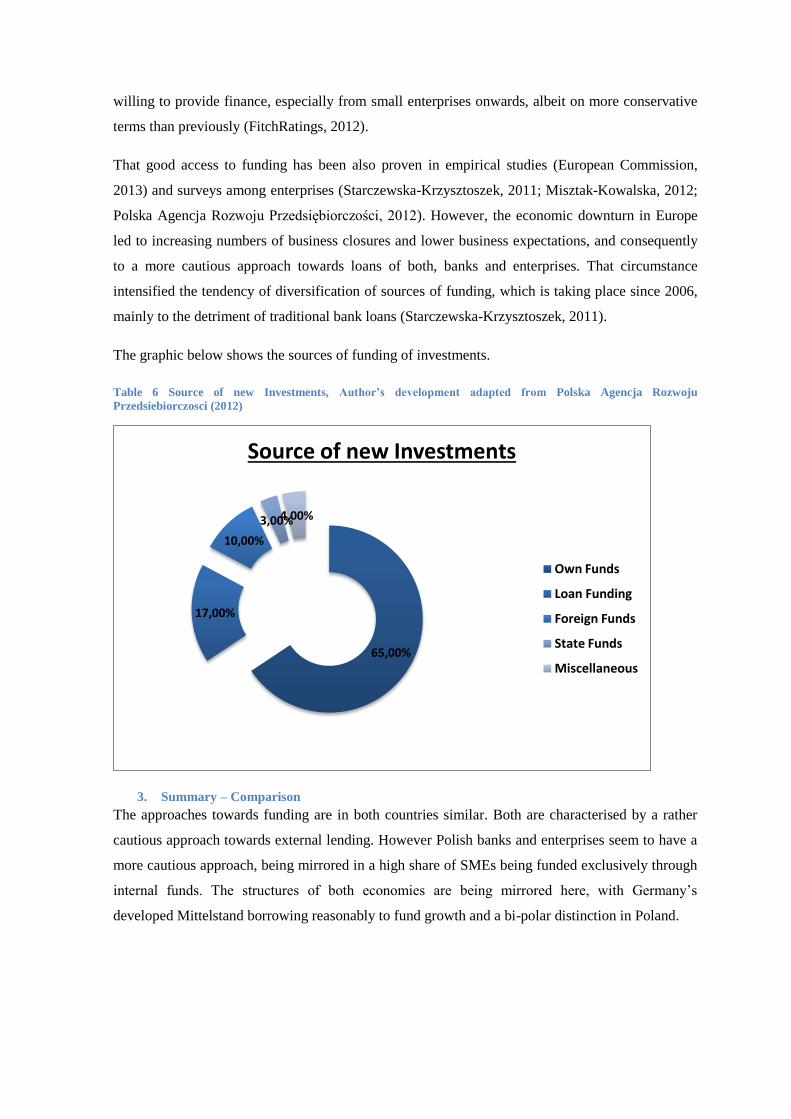
The graphic below shows the sources of funding of investments.
Table 6 Source of new Investments, Author’s development adapted from Polska Agencja Rozwoju
Przedsiebiorczosci (2012)
3. Summary – Comparison
The approaches towards funding are in both countries similar. Both are characterised by a rather
cautious approach towards external lending. However Polish banks and enterprises seem to have a
more cautious approach, being mirrored in a high share of SMEs being funded exclusively through
internal funds. The structures of both economies are being mirrored here, with Germany’s
developed Mittelstand borrowing reasonably to fund growth and a bi-polar distinction in Poland.
65,00%
17,00%
10,00%
3,00% 4,00%
Source of new Investments
Own Funds
Loan Funding
Foreign Funds
State Funds
Miscellaneous
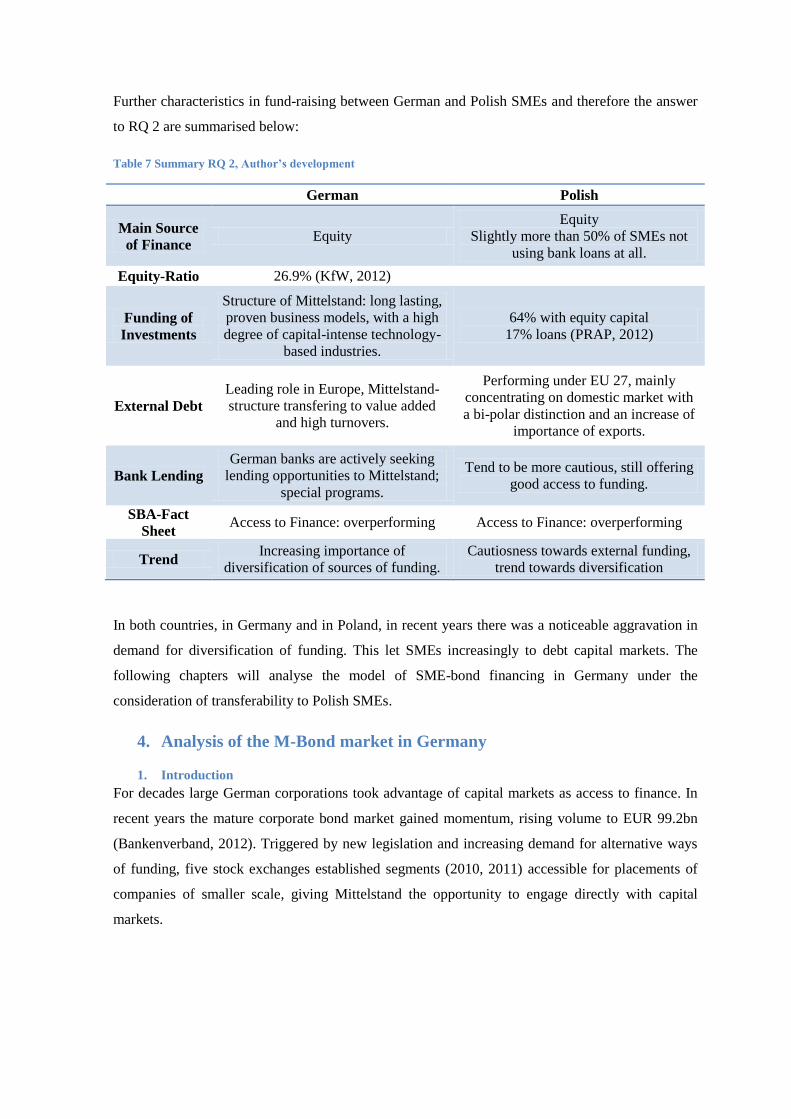
Further characteristics in fund-raising between German and Polish SMEs and therefore the answer
to RQ 2 are summarised below:
Table 7 Summary RQ 2, Author’s development
German Polish
Main Source
of Finance Equity
Equity
Slightly more than 50% of SMEs not
using bank loans at all.
Equity-Ratio 26.9% (KfW, 2012)
Funding of
Investments
Structure of Mittelstand: long lasting,
proven business models, with a high
degree of capital-intense technology-
based industries.
64% with equity capital
17% loans (PRAP, 2012)
External Debt
Leading role in Europe, Mittelstand-
structure transfering to value added
and high turnovers.
Performing under EU 27, mainly
concentrating on domestic market with
a bi-polar distinction and an increase of
importance of exports.
Bank Lending
German banks are actively seeking
lending opportunities to Mittelstand;
special programs.
Tend to be more cautious, still offering
good access to funding.
SBA-Fact
Sheet Access to Finance: overperforming Access to Finance: overperforming
Trend Increasing importance of
diversification of sources of funding.
Cautiosness towards external funding,
trend towards diversification
In both countries, in Germany and in Poland, in recent years there was a noticeable aggravation in
demand for diversification of funding. This let SMEs increasingly to debt capital markets. The
following chapters will analyse the model of SME-bond financing in Germany under the
consideration of transferability to Polish SMEs.
4. Analysis of the M-Bond market in Germany
1. Introduction
For decades large German corporations took advantage of capital markets as access to finance. In
recent years the mature corporate bond market gained momentum, rising volume to EUR 99.2bn
(Bankenverband, 2012). Triggered by new legislation and increasing demand for alternative ways
of funding, five stock exchanges established segments (2010, 2011) accessible for placements of
companies of smaller scale, giving Mittelstand the opportunity to engage directly with capital
markets.
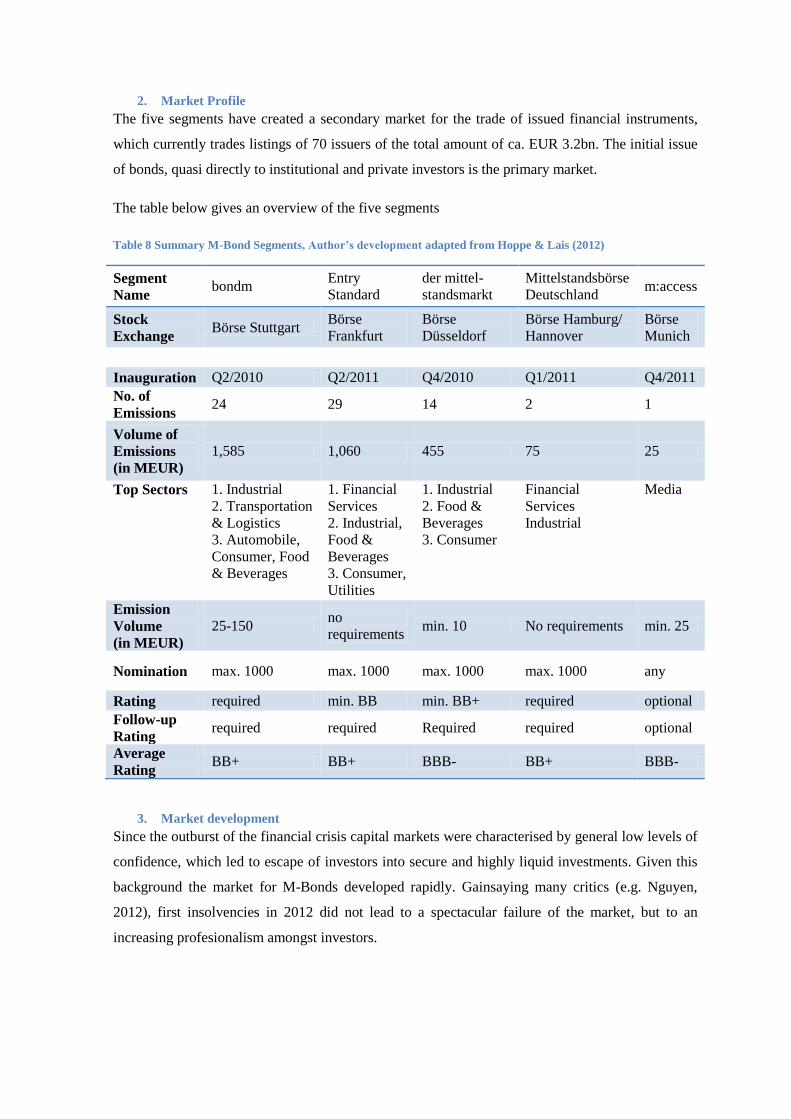
2. Market Profile
The five segments have created a secondary market for the trade of issued financial instruments,
which currently trades listings of 70 issuers of the total amount of ca. EUR 3.2bn. The initial issue
of bonds, quasi directly to institutional and private investors is the primary market.
The table below gives an overview of the five segments
Table 8 Summary M-Bond Segments, Author’s development adapted from Hoppe & Lais (2012)
Segment
Name bondm
Entry
Standard
der mittel-
standsmarkt
Mittelstandsbörse
Deutschland m:access
Stock
Exchange Börse Stuttgart
Börse
Frankfurt
Börse
Düsseldorf
Börse Hamburg/
Hannover
Börse
Munich
Inauguration Q2/2010 Q2/2011 Q4/2010 Q1/2011 Q4/2011
No. of
Emissions 24 29 14 2 1
Volume of
Emissions
(in MEUR)
1,585 1,060 455 75 25
Top Sectors 1. Industrial
2. Transportation
& Logistics
3. Automobile,
Consumer, Food
& Beverages
1. Financial
Services
2. Industrial,
Food &
Beverages
3. Consumer,
Utilities
1. Industrial
2. Food &
Beverages
3. Consumer
Financial
Services
Industrial
Media
Emission
Volume
(in MEUR)
25-150 no
requirements min. 10 No requirements min. 25
Nomination max. 1000 max. 1000 max. 1000 max. 1000 any
Rating required min. BB min. BB+ required optional
Follow-up
Rating required required Required required optional
Average
Rating BB+ BB+ BBB- BB+ BBB-
3. Market development
Since the outburst of the financial crisis capital markets were characterised by general low levels of
confidence, which led to escape of investors into secure and highly liquid investments. Given this
background the market for M-Bonds developed rapidly. Gainsaying many critics (e.g. Nguyen,
2012), first insolvencies in 2012 did not lead to a spectacular failure of the market, but to an
increasing profesionalism amongst investors.
The defaults led to an increased risk-awareness, especially amongst private investors. Consequently
investors scaled up expectations in respect to quality, emphasizing e.g. ratings and covenant-
structures (Schilling-Schön, 2012) and therefore improving the quality of instruments.
Furthermore, the market shows general tendencies towards ‘classical’ capital markets.
A rise of turnovers and liquidity in the secondary market is observable, which in turn attracts
broader fields of investors. Investment funds show increasing interest in M-Bonds, so far
exclusively as addition to portfolios of their funds, as the still low liquidity of the market and low
levels of trade make M-Bonds not suitable to be the sole subject of funds.
Another indicator for the professionalization of the market is the development of three indices, as
these serve as an underlayment for further capital market products, like credit default swaps and
certificates, which in turn could further accelerate the development of the M-Bond market (Hoppe
& Lais, 2013).
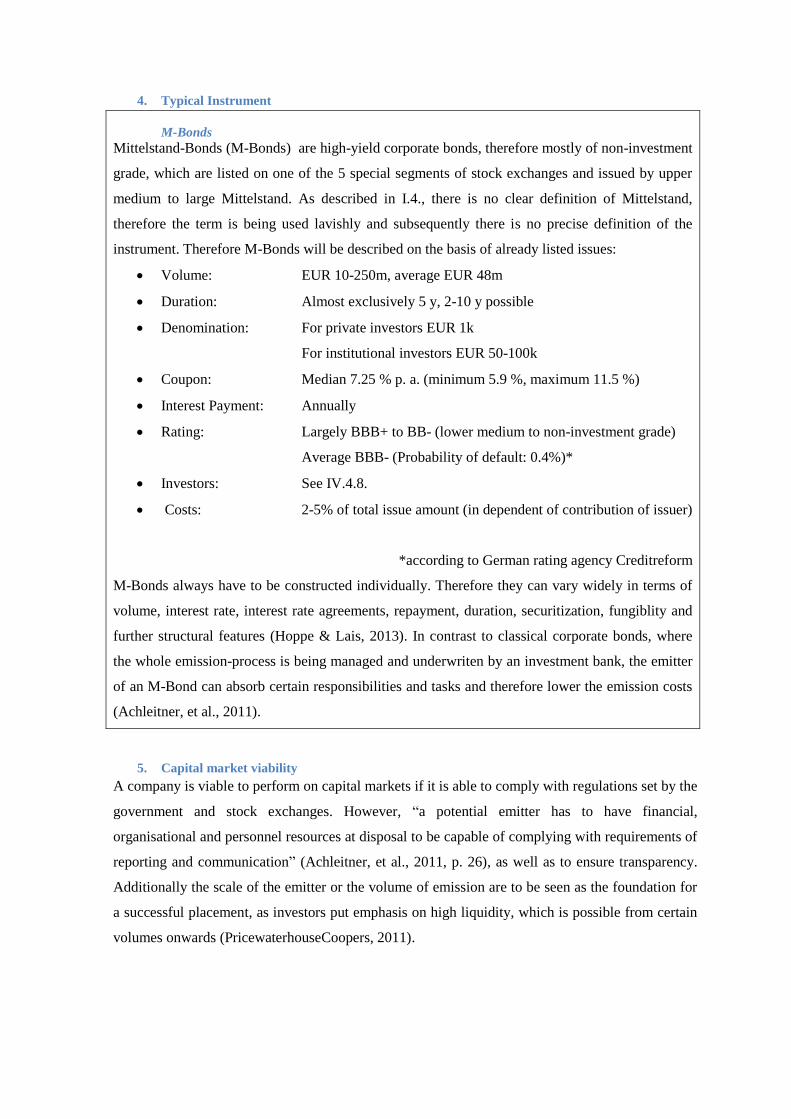
4. Typical Instrument
M-Bonds
Mittelstand-Bonds (M-Bonds) are high-yield corporate bonds, therefore mostly of non-investment
grade, which are listed on one of the 5 special segments of stock exchanges and issued by upper
medium to large Mittelstand. As described in I.4., there is no clear definition of Mittelstand,
therefore the term is being used lavishly and subsequently there is no precise definition of the
instrument. Therefore M-Bonds will be described on the basis of already listed issues:
Volume: EUR 10-250m, average EUR 48m
Duration: Almost exclusively 5 y, 2-10 y possible
Denomination: For private investors EUR 1k
For institutional investors EUR 50-100k
Coupon: Median 7.25 % p. a. (minimum 5.9 %, maximum 11.5 %)
Interest Payment: Annually
Rating: Largely BBB+ to BB- (lower medium to non-investment grade)
Average BBB- (Probability of default: 0.4%)*
Investors: See IV.4.8.
Costs: 2-5% of total issue amount (in dependent of contribution of issuer)
*according to German rating agency Creditreform
M-Bonds always have to be constructed individually. Therefore they can vary widely in terms of
volume, interest rate, interest rate agreements, repayment, duration, securitization, fungiblity and
further structural features (Hoppe & Lais, 2013). In contrast to classical corporate bonds, where
the whole emission-process is being managed and underwriten by an investment bank, the emitter
of an M-Bond can absorb certain responsibilities and tasks and therefore lower the emission costs
(Achleitner, et al., 2011).
5. Capital market viability
A company is viable to perform on capital markets if it is able to comply with regulations set by the
government and stock exchanges. However, “a potential emitter has to have financial,
organisational and personnel resources at disposal to be capable of complying with requirements of
reporting and communication” (Achleitner, et al., 2011, p. 26), as well as to ensure transparency.
Additionally the scale of the emitter or the volume of emission are to be seen as the foundation for
a successful placement, as investors put emphasis on high liquidity, which is possible from certain
volumes onwards (PricewaterhouseCoopers, 2011).
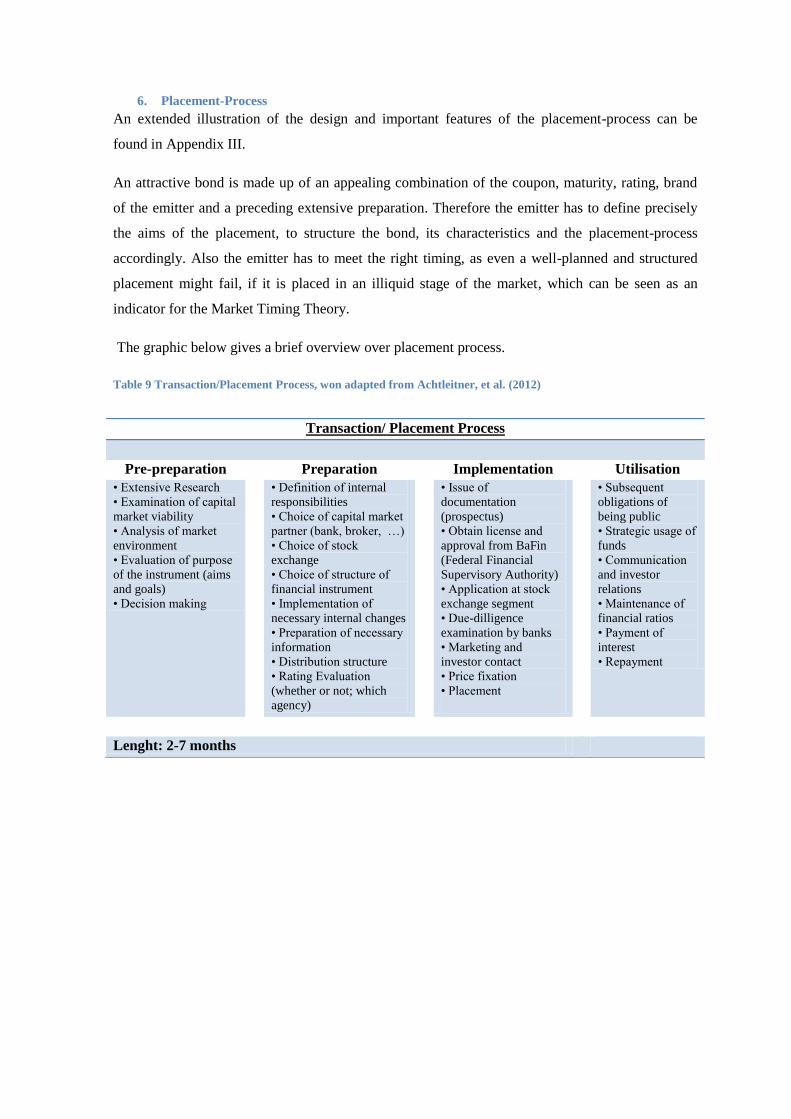
6. Placement-Process
An extended illustration of the design and important features of the placement-process can be
found in Appendix III.
An attractive bond is made up of an appealing combination of the coupon, maturity, rating, brand
of the emitter and a preceding extensive preparation. Therefore the emitter has to define precisely
the aims of the placement, to structure the bond, its characteristics and the placement-process
accordingly. Also the emitter has to meet the right timing, as even a well-planned and structured
placement might fail, if it is placed in an illiquid stage of the market, which can be seen as an
indicator for the Market Timing Theory.
The graphic below gives a brief overview over placement process.
Table 9 Transaction/Placement Process, won adapted from Achtleitner, et al. (2012)
Transaction/ Placement Process
Pre-preparation Preparation Implementation Utilisation
• Extensive Research
• Examination of capital
market viability
• Analysis of market
environment
• Evaluation of purpose
of the instrument (aims
and goals)
• Decision making
• Definition of internal
responsibilities
• Choice of capital market
partner (bank, broker, …)
• Choice of stock
exchange
• Choice of structure of
financial instrument
• Implementation of
necessary internal changes
• Preparation of necessary
information
• Distribution structure
• Rating Evaluation
(whether or not; which
agency)
• Issue of
documentation
(prospectus)
• Obtain license and
approval from BaFin
(Federal Financial
Supervisory Authority)
• Application at stock
exchange segment
• Due-dilligence
examination by banks
• Marketing and
investor contact
• Price fixation
• Placement
• Subsequent
obligations of
being public
• Strategic usage of
funds
• Communication
and investor
relations
• Maintenance of
financial ratios
• Payment of
interest
• Repayment
Lenght: 2-7 months
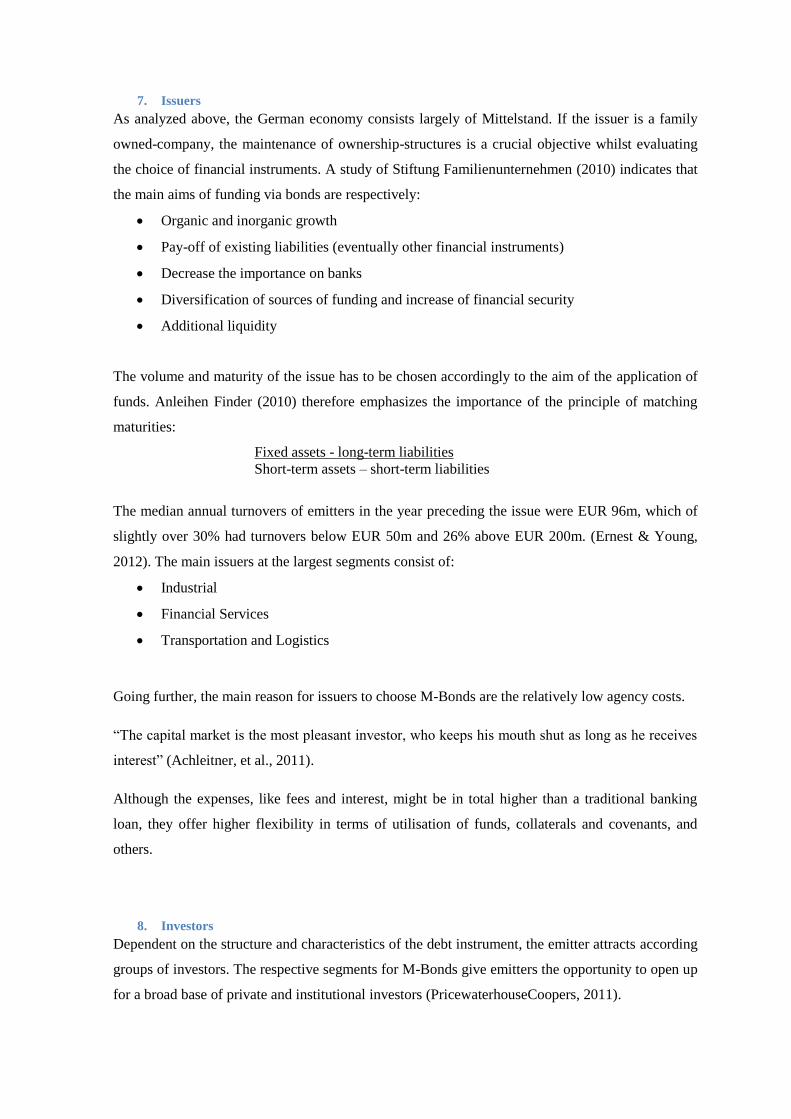
7. Issuers
As analyzed above, the German economy consists largely of Mittelstand. If the issuer is a family
owned-company, the maintenance of ownership-structures is a crucial objective whilst evaluating
the choice of financial instruments. A study of Stiftung Familienunternehmen (2010) indicates that
the main aims of funding via bonds are respectively:
Organic and inorganic growth
Pay-off of existing liabilities (eventually other financial instruments)
Decrease the importance on banks
Diversification of sources of funding and increase of financial security
Additional liquidity
The volume and maturity of the issue has to be chosen accordingly to the aim of the application of
funds. Anleihen Finder (2010) therefore emphasizes the importance of the principle of matching
maturities:
Fixed assets - long-term liabilities
Short-term assets – short-term liabilities
The median annual turnovers of emitters in the year preceding the issue were EUR 96m, which of
slightly over 30% had turnovers below EUR 50m and 26% above EUR 200m. (Ernest & Young,
2012). The main issuers at the largest segments consist of:
Industrial
Financial Services
Transportation and Logistics
Going further, the main reason for issuers to choose M-Bonds are the relatively low agency costs.
“The capital market is the most pleasant investor, who keeps his mouth shut as long as he receives
interest” (Achleitner, et al., 2011).
Although the expenses, like fees and interest, might be in total higher than a traditional banking
loan, they offer higher flexibility in terms of utilisation of funds, collaterals and covenants, and
others.
8. Investors
Dependent on the structure and characteristics of the debt instrument, the emitter attracts according
groups of investors. The respective segments for M-Bonds give emitters the opportunity to open up
for a broad base of private and institutional investors (PricewaterhouseCoopers, 2011).
Institutional investors have usually high amounts of disposable funds, therefore being a substantial
factor for successful bond issues. They tend to have short-term investment strategies, benefiting
from price movements and therefore they are more likely to act on the market actively, paying high
attention to trade volumes and a liquid secondary market. If both are low, single buying- or selling-
orders are likely to lead to price fluctuations (FH Muenster; Boerse Stuttgart; Deloitte, 2012).
Au contraire, private investors tend to follow a buy-and-hold strategy. That means that they are less
sensitive to price fluctuations and therefore act as a stabilising factor (Achleitner, et al., 2011).
Albeit a high share of private investors tends to have a negative impact on the liquidity of the
market. As a consequence, most of the emitters prefer a levelled mixture of investors.
Generally investors pay attention to the following aspects:
Cash flow
Scale of the issuer
Credit worthiness
Communication
Publicity
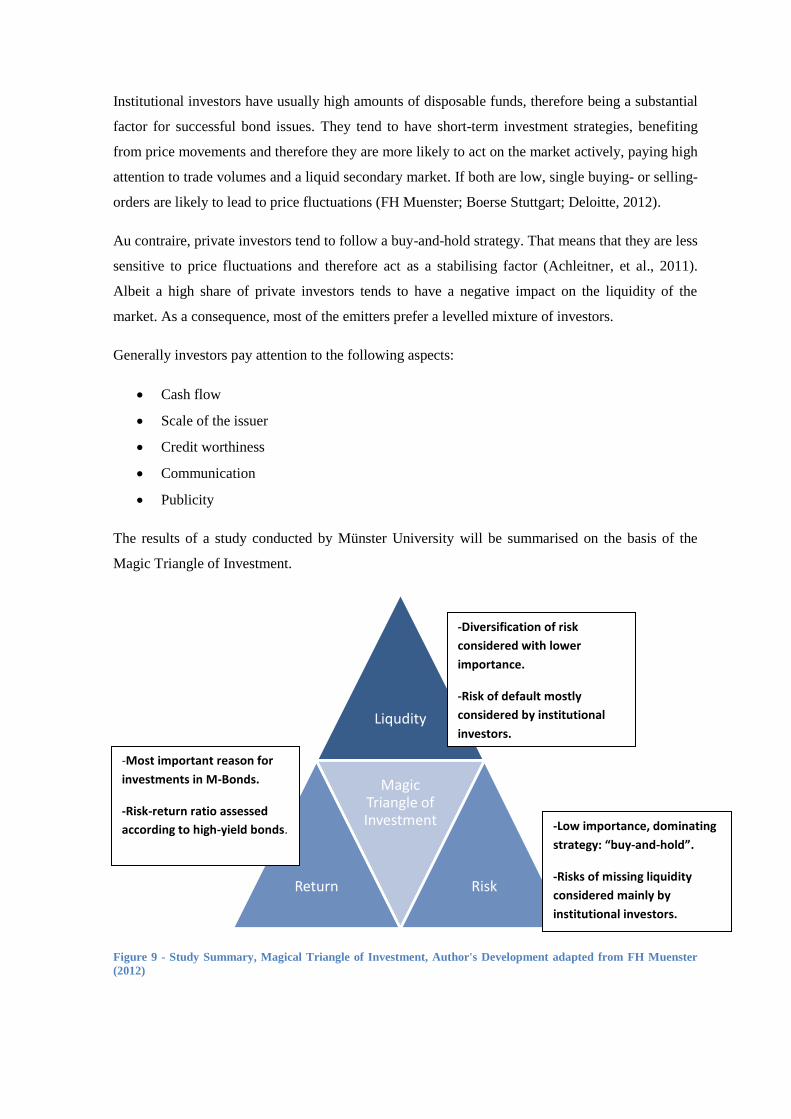
The results of a study conducted by Münster University will be summarised on the basis of the
Magic Triangle of Investment.
Figure 9 - Study Summary, Magical Triangle of Investment, Author's Development adapted from FH Muenster
(2012)
Liqudity
Return
Magic Triangle of Investment
Risk
-Most important reason for
investments in M-Bonds.
-Risk-return ratio assessed
according to high-yield bonds. -Low importance, dominating
strategy: “buy-and-hold”.
-Risks of missing liquidity
considered mainly by
institutional investors.
Reception more pos
-Diversification of risk
considered with lower
importance.
-Risk of default mostly
considered by institutional
investors.
-Risks of missing liquidity
considered mainly by
institutional investors.
Reception more pos
9. Market Outlook
In 2006-2008 various Mezzanine-programs amounting to EUR 5bn have been placed, with a peak
of maturites in 2013, making consequently Mittelstand face a necessity for refinancing of ca. EUR
1.6bn. (Hoppe & Lais, 2013). Additionally German Mittelstand´s faith in their traditional
borrowers, banks, decreased during the crisis significantly, making companies intensify their
efforts for diversification of their financial structures. Thereto regulatory restrictions, especially
Basel III, will complicate long-term borrowing for banks and expectedly complicate access to
external funding for Mittelstand.
The financial crisis caused a lack of investment opportunities, which are expected to continue
shifting investor’s demand towards M-Bonds, especially if the trend towards professionalization
will continue.
Summarizing the growing trend towards alternative funding, especially M-Bonds, is expected to
continue driving a share of, at a guess by Führ (2012), around 10,000 capital market viable
Mittelstand-companies onto capital markets.
5. Polish Corporate Debt Capital Market
1. Market Profile
Poland’s organised debt instrument market takes place on the segment ‘Catalyst’ of the Warsaw
Stock Exchange. Before the market has been established in September 2009, the trade of bonds was
held on a minor scale, mainly on the non-regulated interbank market with small shares of corporate
bonds (Brzyska, Agata, 2012).
Catalyst is the largest bond segment in CEE and is available to corporate, communal and sovereign
issuers. It has low minimum requirements, e.g. once a company is already publicly listed on a stock
exchange, it is already considered as having met the criteria. (Catalyst, 2011)
The total market value of Catalyst amounts to PLN 584bn (ca. EUR 142bn). 92% are represented
by sovereign bonds, leaving the segment of corporate bonds behind in a subordinated role. The
corporate bond segment is made up by 121 corporations listing bonds of the amount of PLN 45bn
(ca. EUR 11bn). Withdrawing bank bonds, the market will have value of PLN 11bn (ca. EUR
2.6bn). Subtracting the three largest bonds (Energa, PKNiN and PKN Orlen), the market value is
left at PLN 6.7bn (ca. EUR 1.63bn).
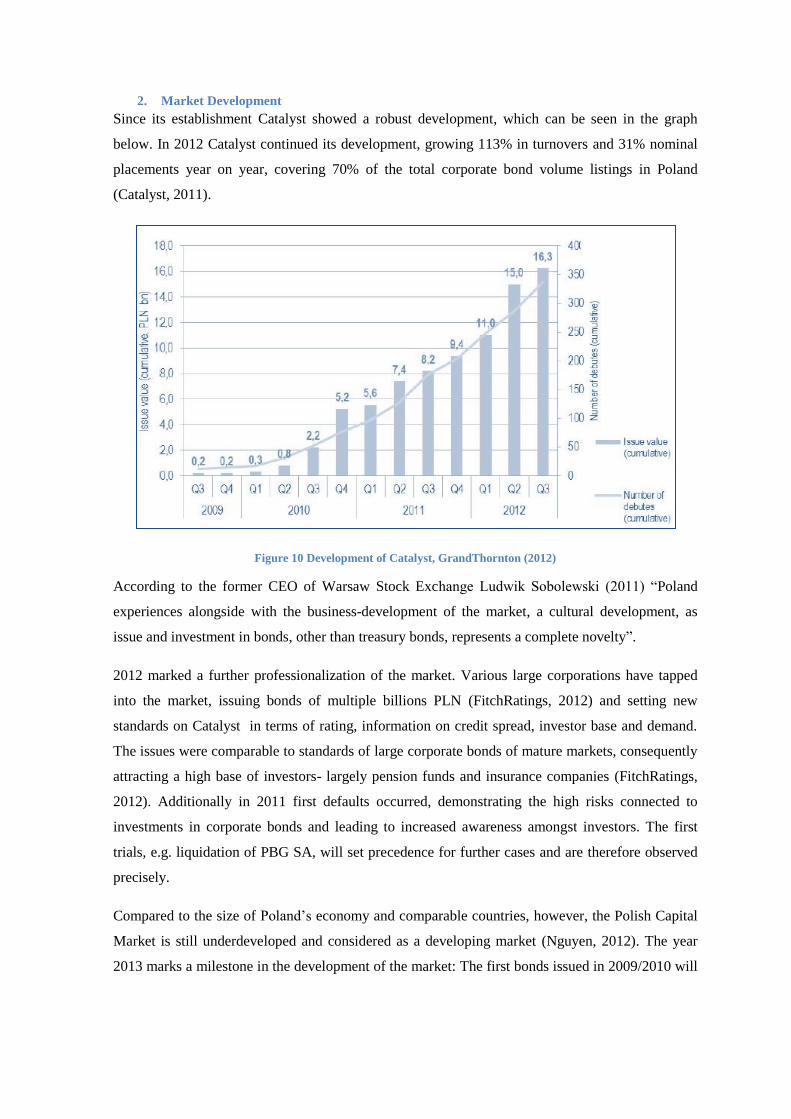
2. Market Development
Since its establishment Catalyst showed a robust development, which can be seen in the graph
below. In 2012 Catalyst continued its development, growing 113% in turnovers and 31% nominal
placements year on year, covering 70% of the total corporate bond volume listings in Poland
(Catalyst, 2011).
Figure 10 Development of Catalyst, GrandThornton (2012)
According to the former CEO of Warsaw Stock Exchange Ludwik Sobolewski (2011) “Poland
experiences alongside with the business-development of the market, a cultural development, as
issue and investment in bonds, other than treasury bonds, represents a complete novelty”.
2012 marked a further professionalization of the market. Various large corporations have tapped
into the market, issuing bonds of multiple billions PLN (FitchRatings, 2012) and setting new
standards on Catalyst in terms of rating, information on credit spread, investor base and demand.
The issues were comparable to standards of large corporate bonds of mature markets, consequently
attracting a high base of investors- largely pension funds and insurance companies (FitchRatings,
2012). Additionally in 2011 first defaults occurred, demonstrating the high risks connected to
investments in corporate bonds and leading to increased awareness amongst investors. The first
trials, e.g. liquidation of PBG SA, will set precedence for further cases and are therefore observed
precisely.
Compared to the size of Poland’s economy and comparable countries, however, the Polish Capital
Market is still underdeveloped and considered as a developing market (Nguyen, 2012). The year
2013 marks a milestone in the development of the market: The first bonds issued in 2009/2010 will
acquire maturity (Polcan, 2013). The degree of payback of the total value of PLN 2,7bn (ca. EUR
658m) will have crucial importance for the further progress of the young market.
3. Typical Instrument
Bonds listed on Catalyst offer a mixture of characteristics of both, emerging and mature markets.
81% of bonds listed on Catalyst pay floating interests based on WIBOR 6M + spread, which is
dependent on the issuers creditworthiness and connected collaterals (Grant Thornton, 2012). 42%
of bonds issued were not collateralized, and if, they usually are secured with real estates
(Korpoobligacje, 2013). A trend towards fixed interest is noticeable. Another tendency is the
tendency towards long maturity periods.
Volume: PLN 420k-2.5bn
Duration: Average 6.5y
Denomination: Mainly PLN 1k, followed by PLN 100k
Coupon: Median 10.25 % p. a. (minimum 4.8 %, maximum 18 %)
Interest payment: Semi-annually
Rating: Not needed
Defaults: 0.23%
Investors: See 5.4.
The mean value of issues of corporate bonds amounted to over PLN 48m, whereas the median
value was significantly lower, valued PLN 10m. The discrepancy between the mean and the
median value was largely affected by bond issues by large companies, like PGNiG´s issue of PLN
2.5bn. (Tucholska, 2012). It is noteworthy, that 75% of issues had a value lower than PLN 30m.
Amongst these were four issues even below PLN 1m, like GPF Causa with PLN 420k (Catalyst,
2011). Issues of such low volumes are likely to be issues based on low credit standing, rather than
diversification of funding.
4. Issuers
Corporate bonds have become an important source of capital for various companies, which when
searching for diversification, do not want to rely on banks or that have limited credit standing at
banks (Atroszczak, 2012). Additionally emitters appreciate the flexibility of bonds in their design,
as well as in the disposition of funds. According to a study by Grant Thornton (2012) the majority
of issuers (31%) have used the funds originated from issues to finance new investments and 17% as
a cash injection for current activities.
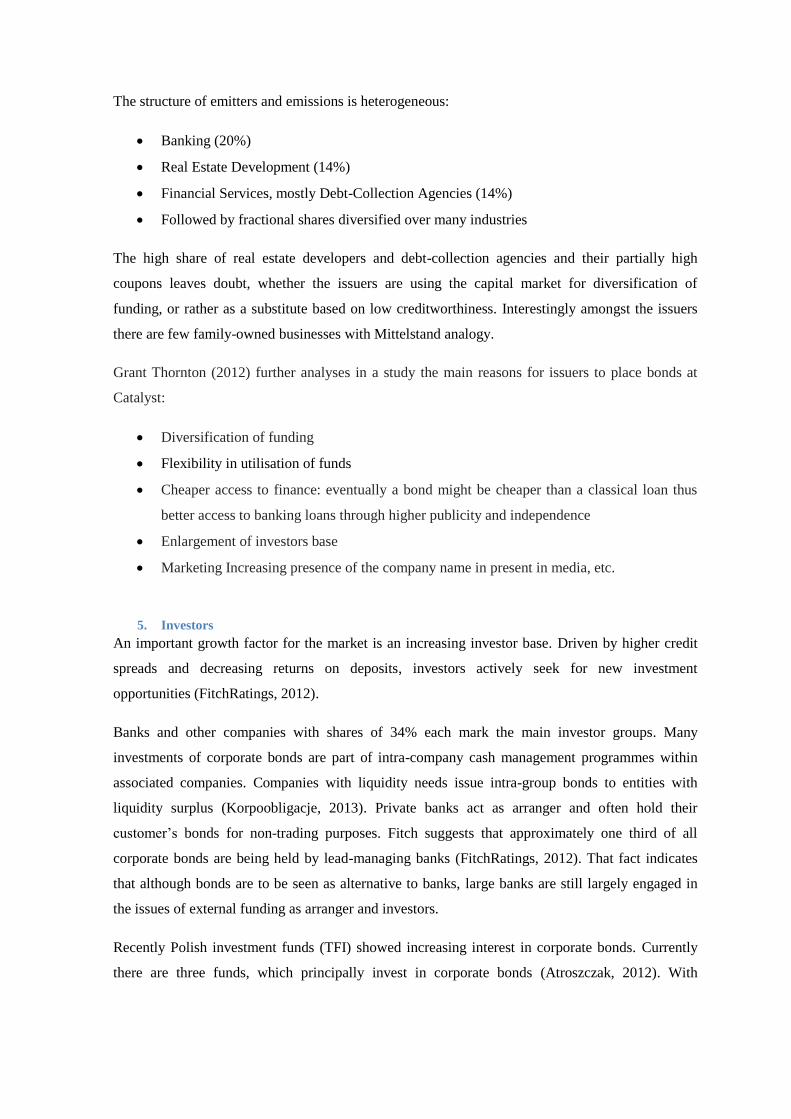
The structure of emitters and emissions is heterogeneous:
Banking (20%)
Real Estate Development (14%)
Financial Services, mostly Debt-Collection Agencies (14%)
Followed by fractional shares diversified over many industries
The high share of real estate developers and debt-collection agencies and their partially high
coupons leaves doubt, whether the issuers are using the capital market for diversification of
funding, or rather as a substitute based on low creditworthiness. Interestingly amongst the issuers
there are few family-owned businesses with Mittelstand analogy.
Grant Thornton (2012) further analyses in a study the main reasons for issuers to place bonds at
Catalyst:
Diversification of funding
Flexibility in utilisation of funds
Cheaper access to finance: eventually a bond might be cheaper than a classical loan thus
better access to banking loans through higher publicity and independence
Enlargement of investors base
Marketing Increasing presence of the company name in present in media, etc.
5. Investors
An important growth factor for the market is an increasing investor base. Driven by higher credit
spreads and decreasing returns on deposits, investors actively seek for new investment
opportunities (FitchRatings, 2012).
Banks and other companies with shares of 34% each mark the main investor groups. Many
investments of corporate bonds are part of intra-company cash management programmes within
associated companies. Companies with liquidity needs issue intra-group bonds to entities with
liquidity surplus (Korpoobligacje, 2013). Private banks act as arranger and often hold their
customer’s bonds for non-trading purposes. Fitch suggests that approximately one third of all
corporate bonds are being held by lead-managing banks (FitchRatings, 2012). That fact indicates
that although bonds are to be seen as alternative to banks, large banks are still largely engaged in
the issues of external funding as arranger and investors.
Recently Polish investment funds (TFI) showed increasing interest in corporate bonds. Currently
there are three funds, which principally invest in corporate bonds (Atroszczak, 2012). With
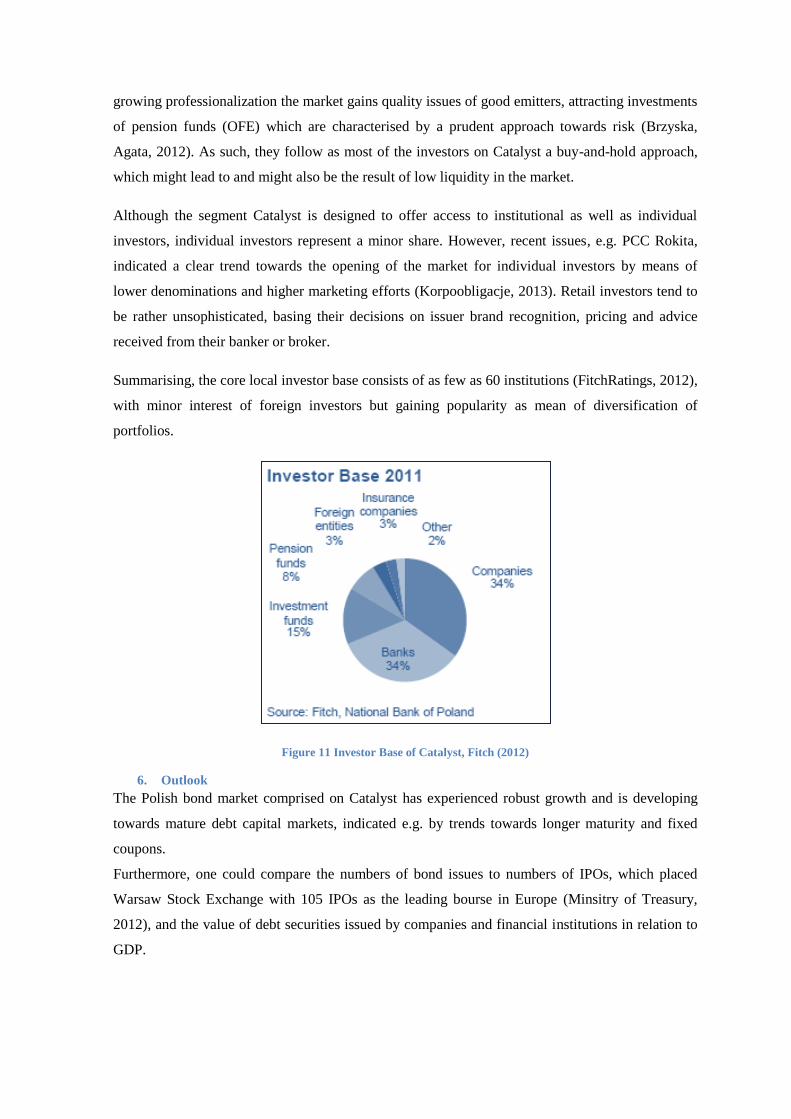
growing professionalization the market gains quality issues of good emitters, attracting investments
of pension funds (OFE) which are characterised by a prudent approach towards risk (Brzyska,
Agata, 2012). As such, they follow as most of the investors on Catalyst a buy-and-hold approach,
which might lead to and might also be the result of low liquidity in the market.
Although the segment Catalyst is designed to offer access to institutional as well as individual
investors, individual investors represent a minor share. However, recent issues, e.g. PCC Rokita,
indicated a clear trend towards the opening of the market for individual investors by means of
lower denominations and higher marketing efforts (Korpoobligacje, 2013). Retail investors tend to
be rather unsophisticated, basing their decisions on issuer brand recognition, pricing and advice
received from their banker or broker.
Summarising, the core local investor base consists of as few as 60 institutions (FitchRatings, 2012),
with minor interest of foreign investors but gaining popularity as mean of diversification of
portfolios.
Figure 11 Investor Base of Catalyst, Fitch (2012)
6. Outlook
The Polish bond market comprised on Catalyst has experienced robust growth and is developing
towards mature debt capital markets, indicated e.g. by trends towards longer maturity and fixed
coupons.
Furthermore, one could compare the numbers of bond issues to numbers of IPOs, which placed
Warsaw Stock Exchange with 105 IPOs as the leading bourse in Europe (Minsitry of Treasury,
2012), and the value of debt securities issued by companies and financial institutions in relation to
GDP.
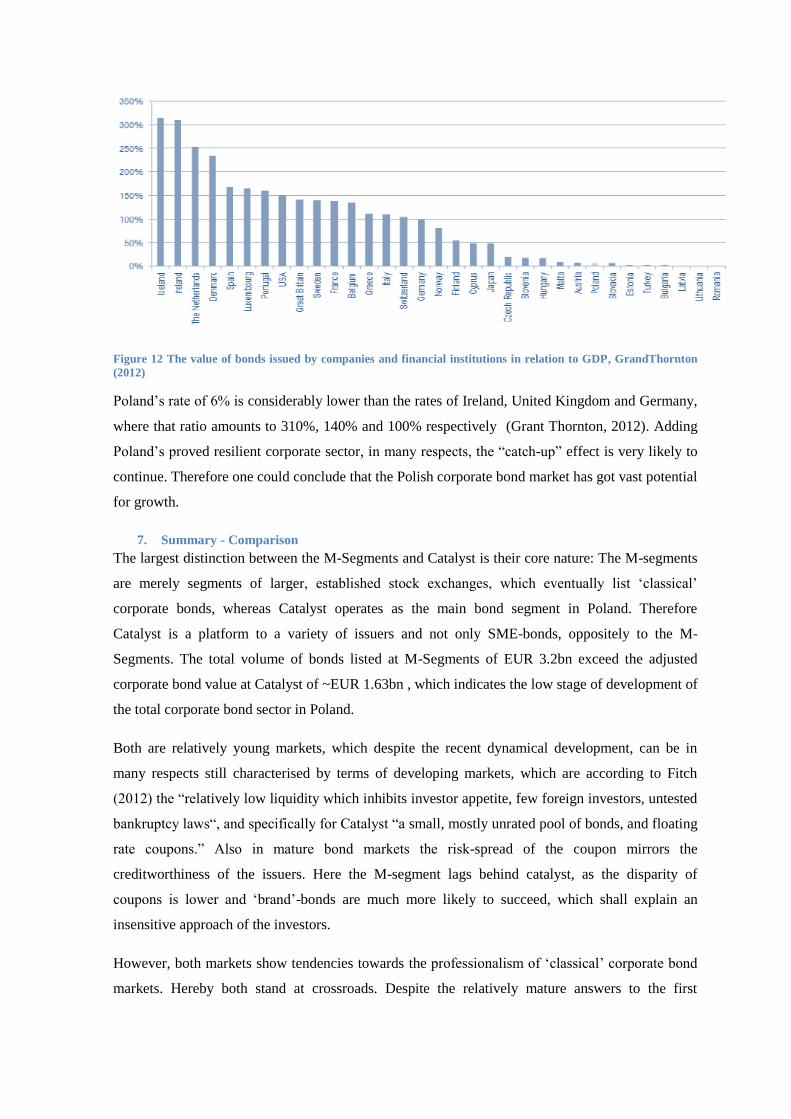
Figure 12 The value of bonds issued by companies and financial institutions in relation to GDP, GrandThornton
(2012)
Poland’s rate of 6% is considerably lower than the rates of Ireland, United Kingdom and Germany,
where that ratio amounts to 310%, 140% and 100% respectively (Grant Thornton, 2012). Adding
Poland’s proved resilient corporate sector, in many respects, the “catch-up” effect is very likely to
continue. Therefore one could conclude that the Polish corporate bond market has got vast potential
for growth.
7. Summary - Comparison
The largest distinction between the M-Segments and Catalyst is their core nature: The M-segments
are merely segments of larger, established stock exchanges, which eventually list ‘classical’
corporate bonds, whereas Catalyst operates as the main bond segment in Poland. Therefore
Catalyst is a platform to a variety of issuers and not only SME-bonds, oppositely to the M-
Segments. The total volume of bonds listed at M-Segments of EUR 3.2bn exceed the adjusted
corporate bond value at Catalyst of ~EUR 1.63bn , which indicates the low stage of development of
the total corporate bond sector in Poland.
Both are relatively young markets, which despite the recent dynamical development, can be in
many respects still characterised by terms of developing markets, which are according to Fitch
(2012) the “relatively low liquidity which inhibits investor appetite, few foreign investors, untested
bankruptcy laws“, and specifically for Catalyst “a small, mostly unrated pool of bonds, and floating
rate coupons.” Also in mature bond markets the risk-spread of the coupon mirrors the
creditworthiness of the issuers. Here the M-segment lags behind catalyst, as the disparity of
coupons is lower and ‘brand’-bonds are much more likely to succeed, which shall explain an
insensitive approach of the investors.
However, both markets show tendencies towards the professionalism of ‘classical’ corporate bond
markets. Hereby both stand at crossroads. Despite the relatively mature answers to the first
defaults, M-Segments have still to prove that these were just problems of individual issuers, rather
than a systematic problem. Catalyst faces the first wave of repayments of bonds which have gained
maturity of in total PLN 2,7bn (ca. EUR 658m). The degree of repayments will have critical
influence on the further development of the promising market.
The further analysis of the German M-Bond Segments and Catalyst can be summarised as follows:
Table 10 Summary RQ 3 and RQ 4, Author’s development
M-Segments Catalyst
Profile Sub-segments of established stock-
exchanges Main bond-market
Market Size
EUR 3.2bn
total corporate PLN 11bn/ ~EUR
2.6bn
equivalent PLN 6.7bn/~EUR 1.63bn
(adjusted by ≥ PLN 1bn listings)
Role of Banks Minor, large corporate banks reluctand Still in central position as arranger
and main investor
Issuers
1. Industrial
2. Financial Services
3. Transportation & Logistics
1. Banking
2. Real Estate Development
3. Financial Services
avg. Issue EUR 48m PLN 48m/ EUR ~11.7m
PLN 10m/ EUR ~2.4m median
avg. Rating BBB-
(lower mediuem grade)
not complusory, hence not used
(except large caps)
Coupon Fixed Floating
Coupon Rate Median 7.25 % p. a.
(minimum 5.9 %, maximum 11.5 %)
Median 10.25 % p. a.
(minimum 4.8 %, maximum 18 %)
Coupon
Payment Annually semi-annually
Investors institutional and private institutional, private marginal
Investment
approach short-term and buy-and-hold buy-and-hold
Investment
funds 1 ETF 3 TFI with focus corporate bonds
Indices 3 0
First Defaults 2011 2011
Probability of
Default 0.4% (Creditreform) 0.23% (historically, GrantThornton)
V. Discussion and Conclusion
1. Discussion
The German economy consists to a high extend of Mittelstand, which is to some extend
pronounced by highly-developed capital-intensive industries and a high contribution to exports.
Poland is characterized by a bi-polar economy with a distinct share of unproductive companies,
opposed to a rapidly developing medium and large sector. The successful development of the latter
in recent years seems to lead to a catch-up to the German role-model. Based on the imbalance of
media attention in this respect, an evaluation whether Polish middle-sized companies fit the
qualitative definition of German Mittelstand (compare II.2.4.) was limited. However, the analysed
tendency of Polish middle-sized enterprises to have increasing export rates and larger investments
in innovation with scale seems to follow that pattern.
In respect of funding SMEs of both countries seem to be pretty homogenous. Both are following a
risk-aversive approach, by not taking on too much debt. Internal funding is considered by both as
the main source of finance, with a large share of companies, mainly Polish, not taking advantage of
loan funding at all. Here German SMEs tend to be more assertive by profiting of the positive
influences of debt, as described in the M and M Theory and Classical Theory of Capital Structure.
That aversion towards gearing saved many Polish businesses throughout the crisis, might however
oppose a threat to further development. Further capital demand is largely contributed by banks,
which albeit lost reputation during the crisis and which are facing stricter capital-requirements, i.e.
out of Basel III. Both factors shall strengthen the trend in both countries towards a diversification
of funding, especially in Germany drawing the attention to capital markets instruments. Given the
“catch-up” factor in Poland, the low agency costs and orther, this trend is to be seen as sustainable.
The dynamical development of the five M-Segments and Catalyst since their establishment do not
hide the fact that the segments face serious issues. Based on the low or even insufficient degree of
granularity and liquidity investors cannot rely on the satisfaction of their orders in the secondary
market. The limited flexibility leads important investor groups, like large scaled investment funds
or hedge funds to hold back in investments. Based on the low level of liquidity, in Poland investors
are to some extend limited to follow a buy-and-hold approach. To counteract the segments work
together with liquidity partners, guarantees, etc. to increase the secondary-market liquidity. As M-
Bonds, as well as the corporate bonds placed on Catalyst, are high-yield bonds often of non-
investment grade, they bare a high risk for investors, leading to high requirements for information

disclosure. In Germany emitters responded to increasing quality requirements by the increasing
application of collaterals and covenants into bond structures.
However, information about e.g. placement successes, are not fully accessible, leading especially
private investors to rely on ratings. As ratings are not compulsory at every segment and rating
agencies have been accused of certifying too positive ratings, the market faces an intense problem
of a low degree of transparency. The segments attempt to counteract, e.g. Boerse Stuttgart
introducing obligatory ratings, on top of own weekly risk assessments with following risk-
classifications. On the contrary, Catalyst does not require ratings and sets very low entry
requirements, which allow a very high flexibility of market participants. Generally one can say that
Catalyst sets very low quality requirements, which attract issuers of low creditworthiness and in
turn higher risk for investors.
The higher the risk is, the higher the reward has to be. The high interest spreads for issues of
volumes of even under PLN 1m indicate that several issuers of low creditworthiness use corporate
bonds for funding, as banking loans would be either too expensive, or not accessible. In this respect
mostly real estates developers at Catalyst and solar-energy issuers on the M-Segments risk of
default. The low creditworthiness of many issuers is a point, which keeps many potential issuers
away. Creditworthy, risk-averse medium-sized companies do not have problems to receive loan
funding. However, a more restrictive loan policy combined with the professionalization of Catalyst
might amplify the positive trend of corporate bonds in Poland, which is dominated by service-
sectors. The three large issuers of PLN ≥1bn bonds have set role models of bond-issues, which
could serve as guidance for future issues at Catalyst.
2. Conclusion
In order to analyse the applicability of the German M-Bond model to Poland, this study paper has
accomplished extensive research to point out the characteristics of Polish SMEs compared to
Germany. Following the commonalities and distinctions of sources of funding of both SME-
markets have been exposed, transitioning to corporate debt markets. Finally out of the analysis of
the M-Bond segments and Catalyst, the study paper derived a comparison to enable the final
conclusion.
Throughout the study it has increasingly become clear, that Central and Eastern Europe’s largest
corporate bond market is at the beginning of its development and therefore not sufficiently
developed to establish a separate segment for upper medium-sized companies. The market shows
various features, which characterise debt capital markets of emerging markets and slowly attracts
attention of companies outside of the service sector, which so far observe the development of the
market. However, it is recommendable to the Polish corporate bond market to evaluate and

possibly adapt features of the recently developed models set by the M-Bonds segments. Catalyst
should most of all focus on solutions to increase liquidity, reporting requirements and the initial
issue.
Hence international research studies about Polish bonds were so far exclusively limited to
sovereign and municipal bonds, this research study is to be highlighted as unprecedented. The
comparison to the German M-Bond market is a further enrichment to the study and contributes to a
broader significance of the research paper. Furthermore, the study could serve as reference for
further fields of future research studies. Which of should include:
Analysis, whether Polish medium-sized to large enterprises are developing towards a
Polish Mittelstand-equivalent.
Analysis of industry-specific bond-funding emerged out of the high market shares at
Catalyst.
Analysis of the total bond-funding potential amongst Polish medium-sized to large
enterprises.
o Changes in the potentials under quality-requirements set by respective M-
Segments.
The study was to a certain extend affected by limitations set by the different development stages of
the German and Polish economies, which found reflection in the access to official data, as well as
the imbalance of media attention.
Bibliography and References Achleitner, A.-K., Kaserer, C., Günther, N. & Volk, S., 2011. Die Kapitalmarktfähigkeit von
Familienunternehmen, Munich: Stiftung Familienunternehmen.
Anleihen Finder, 2011. Kosten der Kapitalmarktfinanzierung. [Online]
Available at: http://www.anleihen-finder.de/wissen/kurzleitfaden/kosten-der-kapitalmarktfinanzierung
[Accessed 26 April 2013].
AnleihenFinder, 2010. Emissionsverfahren - Arten von Emissionsverfahren. [Online]
Available at: http://www.anleihen-finder.de/wissen/Kurzleitfaden/emissionsverfahren
[Accessed 25 April 2013].
Atroszczak, D., 2012. Catalyst Report- devlopment brief, Warsaw: Grant Thornton, Warsaw Stock Exchange.
Baker, M. & Wurgler, J., 2002. Market Timing and Capital Structure. [Online]
Available at: http://people.stern.nyu.edu/jwurgler/papers/capstruct.pdf
[Accessed 28 April 2013].
Bankenverband, 2012. Alternativen zum Kredit, Berlin: Bundesverband deutscher Banken e.V..
Barzdo, T., 2012. Precedens na Catalyst – firma skupuje własne obligacje. [Online]
Available at:
http://biznes.gazetaprawna.pl/artykuly/641918,precedens_na_catalyst_firma_skupuje_wlasne_obligacje.html
[Accessed 22 April 2013].
Brooks, R., 2013. Financial Management. 2nd Edition ed. Harlow: Pearson Education Ltd. .
Brzyska, Agata, 2012. Catalyst Report- a development brief, Warsaw: Grant Thornton and Warsaw Stock
Exchange.
Bukowski, M., 2010. Mittelstand in Polen, Frankfurt am Main: Deutsche Bank Research.
Bundesverband der Deutschen Industrie, 2012. Mittelstand. [Online]
Available at: http://www.bdi.eu/Mittelstand.htm
[Accessed 05 April 2013].
Catalyst, 2011. Corporate bonds on Catalyst, Warsaw: GPW Catalyst.
CATALYST, 2011. Corporate bonds on Catalyst, Warsaw: GPW Catalyst.
Centrum Badań Marketingowych INDICATOR, Warszawski Instytut Bankowości, 2013. Małe firmy o
usługach bankowych 2013, Warsaw: Warszawski Instytut Bankowości.
Cienski, J., 2012. Poland's growth defies eurozone crisis. [Online]
Available at: http://www.ft.com/cms/s/0/99bb5b68-c13d-11e1-8eca-00144feabdc0.html#axzz2R1VMLiTD
[Accessed 10 December 2012].
Commerzbank AG, 2012. Gute Schulden, schlechte Schulden: Unternehmertum in unsicheren Zeiten,
Frankfurt am Main: Commerzbank AG.
Commission, E., 2012. Small and medium-sized enterprises (SMEs), Sme performance review. [Online]
Available at: http://ec.europa.eu/enterprise/policies/sme/facts-figures-analysis/performance-review/
[Accessed 03 March 2013].
Curtis, G., 2004. Modern Portfolio Theory and Behavioral Finance. The Journal of Wealth Management,
Fall, pp. 16-22.
DB Research, 2010. Der polnische Mittelstand, Frankfurt am Main: Deutsche Bank AG.
Deloitte, 2012. Finanzierung im Mittelstand, Düsseldorf: Deloitte & Touche
Wirtschaftsprüfungsgesellschaft.
Der Betrieb, 2012. Mittelstandsfinanzierung: Unternehmen sind gut gerüstet, Düsseldorf: Der Betrieb.
Deutsche Botschaft Warschau, 2012. Bilaterale Wirtschaftsbeziehungen. [Online]
Available at: http://www.warschau.diplo.de/Vertretung/warschau/de/05-Wirtschaft/Bilaterales/0-
bilaterale_20Wirtschaftsbeziehungen.html
[Accessed 20 April 2013].
Ernest & Young, 2012. Unternehmensfinanzierung ueber Mittelstandsanleihen, Eschborn: Ernst & Young
GmbH .
Essec Business School, 2012. Analyse Mittelstand - Erfolgsfaktoren für Wachstum in Europa, London: GE
Capital.
European Commission, 2005. The new SME definition. User guide and model definition, Brussels: Enterprise
and Industry Publications.
European Commission, 2013. SBA Factsheet 2012, Brussels: Europea Commission.
European Commission, 2013. SBA Factsheet 2012 Germany, Brussels: Europea Commission.
European Commission, 2013. SBA Factsheet Poland, Brussels: European Commission.
FH Muenster; Boerse Stuttgart; Deloitte, 2012. Mittelstandsanleihen - eine echte Anlagealternative!?,
Munich & Stuttgart: Deloitte & Touche GmbH & Boerse Stuttgart AG.
FitchRatings, 2012. Poland: Corporate Bond Market Growth to continue, Warsaw: FitchRatings.
Führ, J., 2012. Der Markt für M-Bonds hat Kinderkrankheiten [Interview] (01 Juli 2012).
Germa, K., 2011. Rozwój Catalyst nabiera tempa. [Online]
Available at: http://www.stockwatch.pl/artykuly/post/2011/02/12/Rozwoj-Catalyst-nabiera-tempa.aspx
[Accessed 22 April 2013].
Ghauri, P. & Gronhaug, K., 2010. Research Methods in Business Studies. 4th Edition ed. Harlow: Pearson
Education Limited.
GPW, 2013. Rocznik Gieldowy 2013, Warsaw: Gielda Papierow Wartosciowych w Warszawie.
Grant Thornton, 2012. Catalyst Report- Development Brief, Warsaw: Grant Thornton and Warsaw Stock
Exchange.
Hair, J. F., Babin, B., Money, A. M. & Samouel, P., 2003. Essentials of Business Research Methods. Minion:
Leyh Publishing LLC.
Hillier, D. et al., 2013. Corporate Finance. 2nd European Edition ed. Maidenhead: McGraw-Hill Education.
Hinz, C., 2012. Mittelstandsanleihen, Düsseldorf: Börsen-Zeitung Verlag.

Hinz, H. C., 2012. Mittelstandsanleihen durchlaufen einen Maturierungsprozess. In: Boersen-Zeitung, ed.
Mittelstandsanleihen. Frankfurt am Main: Herausgebergemeinschaft WERTPAPIER-MITTEILUNGEN
Keppler, Lehmann GmbH & Co. KG, pp. 4-5.
Hoppe, C. & Lais, M., 2013. Mittelstandsanleihen – Finanzierungsalternative fuer den Mittelstand?. In: O.
Everling & R. Langen, eds. Basel III - Auswirkungen des neuen Bankenaufsichtsrechts auf den Mittelstand.
Cologne: Banken-Verlag gmbH, pp. 147-166.
Hoppe, C. & Lais, M., 2013. Mittelstandsanleihen – Finanzierungsalternative fuer den Mittelstand?. In:
s.l.:s.n., pp. 147-166.
IHK Berlin, 2012. Definition Mittelstand. [Online]
Available at: http://www.ihk-
berlin.de/standortpolitik/mittelstand/818844/Mittelstand_Definitionen.html;jsessionid=9076AC1187804D7B
B521398674315758.repl1
[Accessed 16 March 2013].
Institut für Mittelstandsforschung, 2012. Mittelstandsdefinition. [Online]
Available at: http://www.ifm-bonn.org/mittelstandsdefinition/
[Accessed 05 April 2013].
Institut für Mittelstandsforschung, 2013. Die größten Familienunternehmen in Deutschland, Berlin and
Frankfurt: Bundesverband der Deutschen Industrie e.V. and Deutsche Bank AG.
Kahneman, D. & Tversky, A., 1979. Prospect Theory: An Analysis of Decision under Risk. Econometrica,
March, pp. 263-292.
KfW, 2012. Internationalisierung im Mittelstand, Frankfurt am Main: KfW Bankengruppe.
KfW, 2012. Steckbrief Mittelstand, Frankfurt am Main: KfW Bankengruppe.
Korpoobligacje, 2013. Obligacje korporacyjne w Polsce. [Online]
Available at: http://www.korpoobligacje.pl
[Accessed 21 April 2013].
Kuciński, T., 2011. Poradnik inwestowania na rynku Catalyst: wybierz swoją obligację. [Online]
Available at:
http://forsal.pl/artykuly/571957,poradnik_inwestowania_na_rynku_catalyst_wybierz_swoja_obligacje.html#
[Accessed 22 April 2013].
Lumby, S. & Jones, C., 2011. Corporate Finance. 8th Edition ed. Andover: Cengage Learning EMEA.
Marney, J.-P. & Tarbert, H., 2011. Corporate Finance for Businesses. 1st ed. Oxford: Oxford University
Press.
Mingers, J., 2011. Combining IS Research Methods: Towards a Pluralist Economy. In: INFORMS, ed.
Information Systems Research. n.k.: INFORMS, pp. 240-259.
Minsitry of Treasury, 2012. Macroeconomic Analysis of Polish economy. [Online]
Available at: http://msp.gov.pl/portal/en/87/4013/Macroeconomic_Analysis_of_Polish_economy.html
[Accessed 26 April 2013].
Misztak-Kowalska, M., 2012. Polish experience in SMEs development, Warsaw: Polska Agencja Rozwoju
Przedsiębiorczości.
Nguyen, F., 2012. Mittelstandsbonds [Interview] (28 November 2012).
Ollrog, M.-C., 2013. Mittelstandsbonds: High-Yield-Risiken bei EInheitsverzinsung. [Online]
Available at: http://www.finance-magazin.de/geld-liquiditaet/kredite-und-anleihen/mittelstandsbonds-high-
yield-risiken-bei-einheitsverzinsung/
[Accessed 27 April 2013].
Pike, R. & Neale, B., 2009. Corporate Finanse and Investment. 6th Edition ed. Harlo: Pearson Education
Limited.
Polcan, 2013. Rok testu dla Catalyst czyli uroki inwestowania w obligacje. [Online]
Available at: http://polakcandwa.blogspot.co.uk/2013/01/rok-testu-dla-catalyst-czyli-uroki.html
[Accessed 22 April 2013].
Polska Agencja Rozwoju Przedsiębiorczości, 2012. Raport o stanie sektora malych i srednich
przedsiebiorstw w Polsce, Warsaw: Polska Agencja Rozwoju Przedsiębiorczości.
Polska Agencja Rozwoju Przedsiębiorczości, 2013. Kwalifiaktor MSP. [Online]
Available at: http://www.parp.gov.pl/index/index/1408
[Accessed 05 April 2013].
PricewaterhouseCoopers, 2011. Die Kapitalmarktfähigkeit von Familienunternehmen, Munich: Stiftung
Familienunternehmen.
Roland Berger Strategy Consultants, 2012. SME financing, Hamburg: Roland Berger Startegy Consultants
GmbH.
Ross, S., Westerfield, R. & Jordan, B., 2010. Fundamentals of Corporate Finance. 9th Edition ed. New
York: McGraw Hill.
Saunders, M., Lewis, P. & Thornhill, A., 2012. Research Methods for Business Students. 6th Edition ed.
Harlow: Pearson Education Limited.
Schilling-Schön, J., 2012. Paradigmenwechsel statt Eintagsfliege [Interview] (28 June 2012).
Simon, P. H., 2012. Erfolgsrezepte der Klassenbesten. [Online]
Available at: http://www.manager-magazin.de/politik/weltwirtschaft/0,2828,855164,00.html
[Accessed 08 April 2013].
Starczewska-Krzysztoszek, M., 2011. Mocne i Slabe strony MSP, Warsaw: PKPP Lewiatan .
Stftung Familienunternehmen, 2011. Kapitalmarktfähigkeit von Familienunternehmen, Munich: Stidtung
Familienunternehmen.
Teuber, F., 2012. Mittelstandsanleihen, Düsseldorf: Börsen-Zeitung Verlag.
Titman, S., Keown, A. J. & Martin, J. D., 2011. Financial Management. 9th Edition ed. Boston: Prentice
Hall.
Tucholska, A., 2012. Catalyst Report - development brief, Warsaw: GrantThornton.
Waldecker, P., 2012. Die Zukunft eines neuen Kapitalmarktkonzeptes hat begonnen. In: Börsen-Zeitung, ed.
Mittelstandsanleihen. Frankfurt am Main: Herausgebergemeinschaft WERTPAPIER-MITTEILUNGEN
Keppler, Lehmann GmbH & Co. KG, p. 6.
Wilson, J., 2010. Essentials of Business Research. Los Angeles, California: London: SAGE.

World Bank, 2012. Doing Business, Washington D.C.: World Bank.
Yin, R. K., 2009. Case Study Research: Design and Methods. 4th Edition ed. California: Thousand Oaks:
Sage.
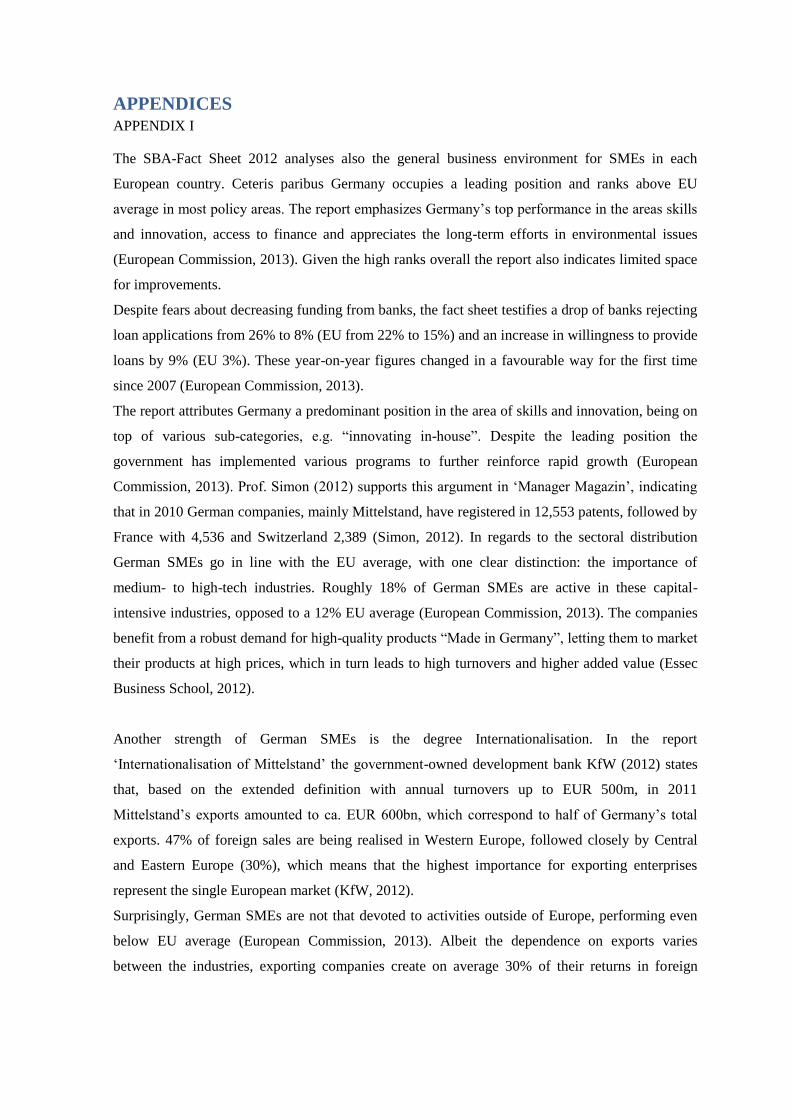
APPENDICES APPENDIX I
The SBA-Fact Sheet 2012 analyses also the general business environment for SMEs in each
European country. Ceteris paribus Germany occupies a leading position and ranks above EU
average in most policy areas. The report emphasizes Germany’s top performance in the areas skills
and innovation, access to finance and appreciates the long-term efforts in environmental issues
(European Commission, 2013). Given the high ranks overall the report also indicates limited space
for improvements.
Despite fears about decreasing funding from banks, the fact sheet testifies a drop of banks rejecting
loan applications from 26% to 8% (EU from 22% to 15%) and an increase in willingness to provide
loans by 9% (EU 3%). These year-on-year figures changed in a favourable way for the first time
since 2007 (European Commission, 2013).
The report attributes Germany a predominant position in the area of skills and innovation, being on
top of various sub-categories, e.g. “innovating in-house”. Despite the leading position the
government has implemented various programs to further reinforce rapid growth (European
Commission, 2013). Prof. Simon (2012) supports this argument in ‘Manager Magazin’, indicating
that in 2010 German companies, mainly Mittelstand, have registered in 12,553 patents, followed by
France with 4,536 and Switzerland 2,389 (Simon, 2012). In regards to the sectoral distribution
German SMEs go in line with the EU average, with one clear distinction: the importance of
medium- to high-tech industries. Roughly 18% of German SMEs are active in these capital-
intensive industries, opposed to a 12% EU average (European Commission, 2013). The companies
benefit from a robust demand for high-quality products “Made in Germany”, letting them to market
their products at high prices, which in turn leads to high turnovers and higher added value (Essec
Business School, 2012).
Another strength of German SMEs is the degree Internationalisation. In the report
‘Internationalisation of Mittelstand’ the government-owned development bank KfW (2012) states
that, based on the extended definition with annual turnovers up to EUR 500m, in 2011
Mittelstand’s exports amounted to ca. EUR 600bn, which correspond to half of Germany’s total
exports. 47% of foreign sales are being realised in Western Europe, followed closely by Central
and Eastern Europe (30%), which means that the highest importance for exporting enterprises
represent the single European market (KfW, 2012).
Surprisingly, German SMEs are not that devoted to activities outside of Europe, performing even
below EU average (European Commission, 2013). Albeit the dependence on exports varies
between the industries, exporting companies create on average 30% of their returns in foreign
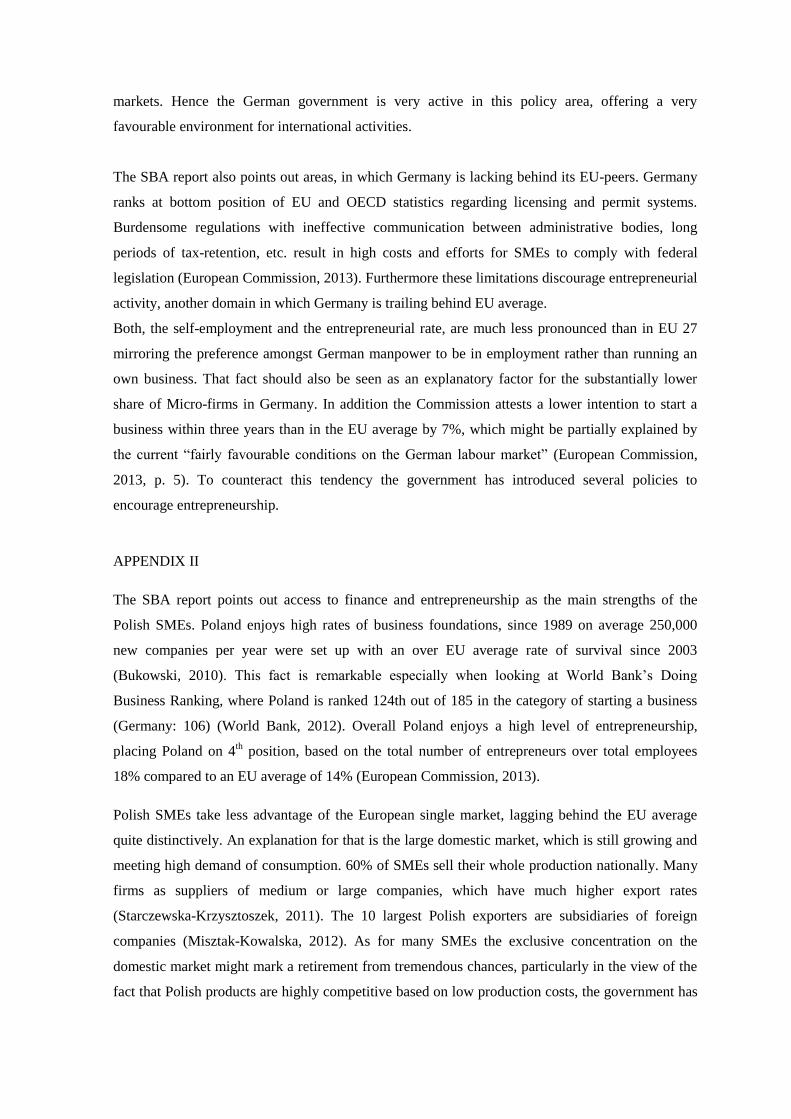
markets. Hence the German government is very active in this policy area, offering a very
favourable environment for international activities.
The SBA report also points out areas, in which Germany is lacking behind its EU-peers. Germany
ranks at bottom position of EU and OECD statistics regarding licensing and permit systems.
Burdensome regulations with ineffective communication between administrative bodies, long
periods of tax-retention, etc. result in high costs and efforts for SMEs to comply with federal
legislation (European Commission, 2013). Furthermore these limitations discourage entrepreneurial
activity, another domain in which Germany is trailing behind EU average.
Both, the self-employment and the entrepreneurial rate, are much less pronounced than in EU 27
mirroring the preference amongst German manpower to be in employment rather than running an
own business. That fact should also be seen as an explanatory factor for the substantially lower
share of Micro-firms in Germany. In addition the Commission attests a lower intention to start a
business within three years than in the EU average by 7%, which might be partially explained by
the current “fairly favourable conditions on the German labour market” (European Commission,
2013, p. 5). To counteract this tendency the government has introduced several policies to
encourage entrepreneurship.
APPENDIX II
The SBA report points out access to finance and entrepreneurship as the main strengths of the
Polish SMEs. Poland enjoys high rates of business foundations, since 1989 on average 250,000
new companies per year were set up with an over EU average rate of survival since 2003
(Bukowski, 2010). This fact is remarkable especially when looking at World Bank’s Doing
Business Ranking, where Poland is ranked 124th out of 185 in the category of starting a business
(Germany: 106) (World Bank, 2012). Overall Poland enjoys a high level of entrepreneurship,
placing Poland on 4th position, based on the total number of entrepreneurs over total employees
18% compared to an EU average of 14% (European Commission, 2013).
Polish SMEs take less advantage of the European single market, lagging behind the EU average
quite distinctively. An explanation for that is the large domestic market, which is still growing and
meeting high demand of consumption. 60% of SMEs sell their whole production nationally. Many
firms as suppliers of medium or large companies, which have much higher export rates
(Starczewska-Krzysztoszek, 2011). The 10 largest Polish exporters are subsidiaries of foreign
companies (Misztak-Kowalska, 2012). As for many SMEs the exclusive concentration on the
domestic market might mark a retirement from tremendous chances, particularly in the view of the
fact that Polish products are highly competitive based on low production costs, the government has
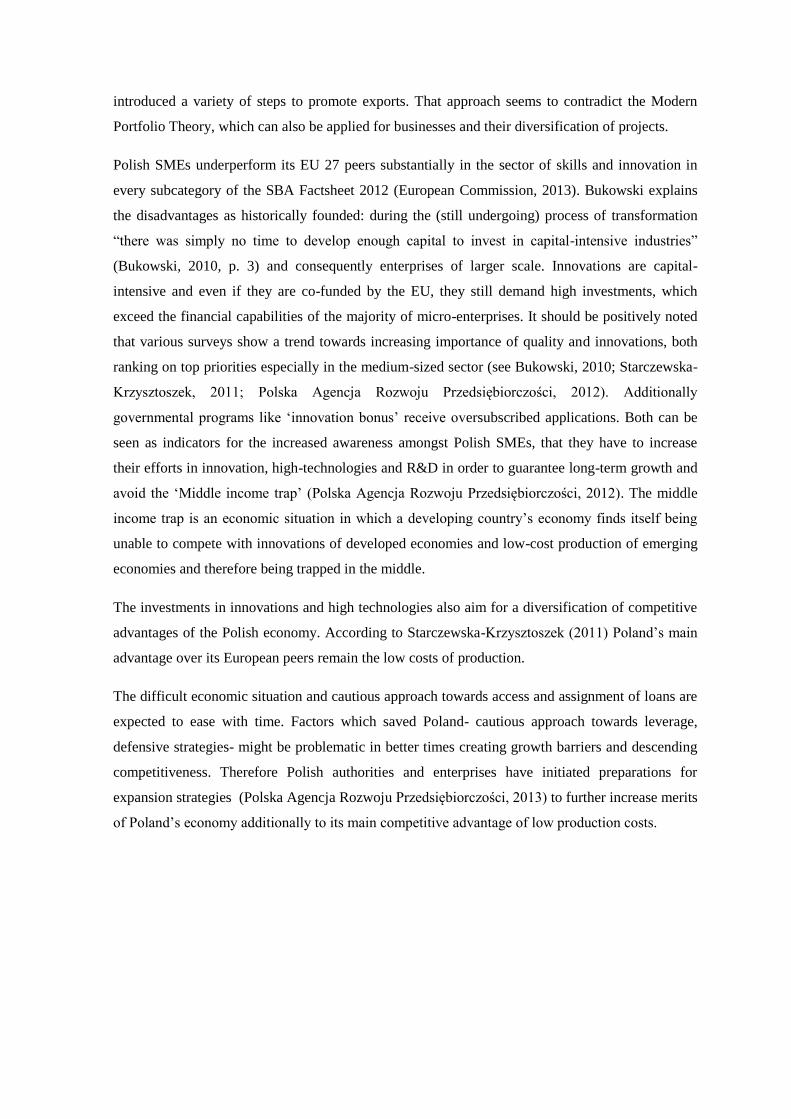
introduced a variety of steps to promote exports. That approach seems to contradict the Modern
Portfolio Theory, which can also be applied for businesses and their diversification of projects.
Polish SMEs underperform its EU 27 peers substantially in the sector of skills and innovation in
every subcategory of the SBA Factsheet 2012 (European Commission, 2013). Bukowski explains
the disadvantages as historically founded: during the (still undergoing) process of transformation
“there was simply no time to develop enough capital to invest in capital-intensive industries”
(Bukowski, 2010, p. 3) and consequently enterprises of larger scale. Innovations are capital-
intensive and even if they are co-funded by the EU, they still demand high investments, which
exceed the financial capabilities of the majority of micro-enterprises. It should be positively noted
that various surveys show a trend towards increasing importance of quality and innovations, both
ranking on top priorities especially in the medium-sized sector (see Bukowski, 2010; Starczewska-
Krzysztoszek, 2011; Polska Agencja Rozwoju Przedsiębiorczości, 2012). Additionally
governmental programs like ‘innovation bonus’ receive oversubscribed applications. Both can be
seen as indicators for the increased awareness amongst Polish SMEs, that they have to increase
their efforts in innovation, high-technologies and R&D in order to guarantee long-term growth and
avoid the ‘Middle income trap’ (Polska Agencja Rozwoju Przedsiębiorczości, 2012). The middle
income trap is an economic situation in which a developing country’s economy finds itself being
unable to compete with innovations of developed economies and low-cost production of emerging
economies and therefore being trapped in the middle.
The investments in innovations and high technologies also aim for a diversification of competitive
advantages of the Polish economy. According to Starczewska-Krzysztoszek (2011) Poland’s main
advantage over its European peers remain the low costs of production.
The difficult economic situation and cautious approach towards access and assignment of loans are
expected to ease with time. Factors which saved Poland- cautious approach towards leverage,
defensive strategies- might be problematic in better times creating growth barriers and descending
competitiveness. Therefore Polish authorities and enterprises have initiated preparations for
expansion strategies (Polska Agencja Rozwoju Przedsiębiorczości, 2013) to further increase merits
of Poland’s economy additionally to its main competitive advantage of low production costs.
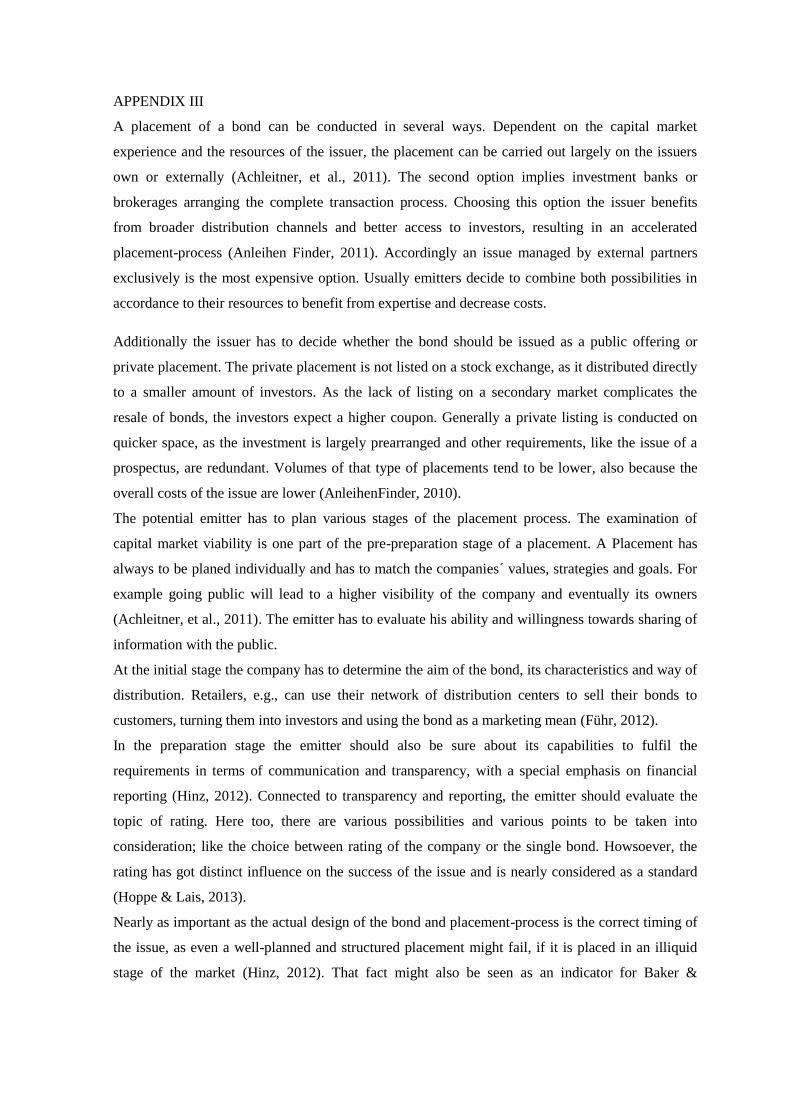
APPENDIX III
A placement of a bond can be conducted in several ways. Dependent on the capital market
experience and the resources of the issuer, the placement can be carried out largely on the issuers
own or externally (Achleitner, et al., 2011). The second option implies investment banks or
brokerages arranging the complete transaction process. Choosing this option the issuer benefits
from broader distribution channels and better access to investors, resulting in an accelerated
placement-process (Anleihen Finder, 2011). Accordingly an issue managed by external partners
exclusively is the most expensive option. Usually emitters decide to combine both possibilities in
accordance to their resources to benefit from expertise and decrease costs.
Additionally the issuer has to decide whether the bond should be issued as a public offering or
private placement. The private placement is not listed on a stock exchange, as it distributed directly
to a smaller amount of investors. As the lack of listing on a secondary market complicates the
resale of bonds, the investors expect a higher coupon. Generally a private listing is conducted on
quicker space, as the investment is largely prearranged and other requirements, like the issue of a
prospectus, are redundant. Volumes of that type of placements tend to be lower, also because the
overall costs of the issue are lower (AnleihenFinder, 2010).
The potential emitter has to plan various stages of the placement process. The examination of
capital market viability is one part of the pre-preparation stage of a placement. A Placement has
always to be planed individually and has to match the companies´ values, strategies and goals. For
example going public will lead to a higher visibility of the company and eventually its owners
(Achleitner, et al., 2011). The emitter has to evaluate his ability and willingness towards sharing of
information with the public.
At the initial stage the company has to determine the aim of the bond, its characteristics and way of
distribution. Retailers, e.g., can use their network of distribution centers to sell their bonds to
customers, turning them into investors and using the bond as a marketing mean (Führ, 2012).
In the preparation stage the emitter should also be sure about its capabilities to fulfil the
requirements in terms of communication and transparency, with a special emphasis on financial
reporting (Hinz, 2012). Connected to transparency and reporting, the emitter should evaluate the
topic of rating. Here too, there are various possibilities and various points to be taken into
consideration; like the choice between rating of the company or the single bond. Howsoever, the
rating has got distinct influence on the success of the issue and is nearly considered as a standard
(Hoppe & Lais, 2013).
Nearly as important as the actual design of the bond and placement-process is the correct timing of
the issue, as even a well-planned and structured placement might fail, if it is placed in an illiquid
stage of the market (Hinz, 2012). That fact might also be seen as an indicator for Baker &

Wurgler’s Market Timing Theory, which was discussed above and indicated that “Managers
simply take advantage of market conditions when they decide to raise capital” (Hillier, et al., 2013,
p. 456).