Embed Size (px)
Citation preview

GEOTHERMAL TRAINING PROGRAMME Reports 2001Orkustofnun, Grensásvegur 9, Number 10IS-108 Reykjavík, Iceland
213
GEOTHERMAL DISTRICT HEATING MODELLING,NOWOGARD TOWN, POLAND
Rafal PiwowarskiDepartment of Heat Engineering,Technical University of Szczecin,Al. Piastow 19, 70-310 Szczecin,
ABSTRACT
Nowogard town is located in northwest Poland, near the Baltic Sea and the Germanborder. The town borders good geothermal water resources in Poland. Watertemperature in the Nowogard’s aquifer is estimated to be close to 80/C with a flowrate of up to 80 l/s. Nowogard has no district heating system. Presently, 84 boilerssupply heat for local customers. The majority of the boilers are coal boilers causinghuge air pollution. Modelling based on a totally new district heating design gives alotof interesting results. Simulations of a district heating operation seem reliable andcould be a good starting point for a real project.
1. INTRODUCTION
The heating demand in Poland is much higher than present geothermal exploitation. However, availablegeothermal resources are much greater than what is utilized. Recently a number of efforts have been madeto develop a technology for the utilization of low-enthalpy geothermal resources for district heating. Now4 plants are in operation, all of which provide sufficient energy to their customers. There have been nomajor problems in plant operations due to insufficient technical solutions for possible difficulties basedon underground properties. Observed problems are mainly failures in the district heating system, thesurface installation of the plant or at the subsurface water pumps. There still exists a great potential fornew geothermal investments. Town like Nowogard, with good geothermal conditions and huge airpollution caused by coal boilers, are common in Poland. So there is still much to do, to providegeothermal energy and its benefits to customers. This project is a small step, towards starting geothermalinvestment in Nowogard Town, but hopefully this step will lead to others.
2. NOWOGARD TOWN
Nowogard is a small town with 17,000 inhabitants located in NW-Poland (Figure 1). It lies near toSzczecin City and also near the German border and Baltic Sea, and has thus a large tourist aspiration. It

Piwowarski Report 10214
FIGURE 1: Map of Polandshowing Nowogard town
FIGURE 2: The Szczecinsko-Lodzkie sinclinorium,a large source of geothermal energy
is a town of mainly agricultural activities and someconsumer industry. A district heating system does not existin Nowogard town. Many individual coal fired boilers heatbuildings. They consume a large amount of coal, and are thereason for substantial air pollution.
The intensified degradation of the human naturalenvironment has roused a growing anxiety. The problem isrecognized more and more clearly in the local society of thetown. To correspond with those facts, the local council hasstarted ecological investments. One of them is a project ofa wind power station. They also plan to replace localboilers with a new ecological heat source. It could be ageothermal heat plant.
2.1 Population trends
When a new district heating system is designed it is expected to be in operation for a number of years.Therefore it is necessary to study how the population of the district has developed in the past to be betterable to forecast future developments as the design of some major components of the system such as asupply mains and distribution trunk lines are often based on 15-20 years projected future needs. On astatistical research basis, the population is expected to remain rather steady in number in Nowogard, butfor the next 10 years there is a predicted 10% growth rate. These factors must be taken into considerationwhen a district heating system is being designed.
2.2 Geothermal conditions
The northwest part of Poland, the Szczecin region, has good conditions for using geothermal water forheating purposes. Geothermalwater occurs there at a depth of1600-2200 m and withtemperature of 50-90/C. Thesestrata consist of grey sandstonewith high porosity and thicknessup to 200 m (the so-called liasformations). Each squarekilometre of the terrain containsat depth about 4.3×10⁶ m3 ofgeothermal water. Thecorresponding energy may becompared to about 160,000 tonsof coal.
The Szczecin region withNowogard town is a part of thelarge Szczecinsko-Lodzkiesinclinorium, considered one ofthe best geothermal water sourcesin Poland (Figure 2). Thesinclinorium area is about 67,000km2. The estimated recoverablevolume of sub-artesian andartesian geothermal water is 2854

Report 10 Piwowarski215
FIGURE 3: Air temperature, Nowogard, Poland
km3 amounting to 18,812 millions toe (tons oil equivalent). On average it amounts to 42 million m3 ofwater or 280,800 toe per square kilometre.
Pyrzyce town is located on the borders of the same sinclinorium, very close to Nowogard town. A fewyears ago the situation there was similar, with many local boilers and good geothermal conditions addinga similar number of inhabitants. Pyrzyce is a good example of professional progress. Coal boilers werethe main source of air pollution in the city. One of the most important criteria in choosing an ecologicalheat source was the aspiration of the local government to limit the emission of damaging combustionproducts. They chose an ecological heat source, building a geothermal heat plant assisted by gas boilers.The task of the geothermal heat plant in Pyrzyce and the district-heating network, which was built at thesame time, was to replace 68 local coal boilers in use and increase efficiency.
Since 1997 they have operated a modern 50 MWt heat plant, utilizing 340 m3/hr of 68/C geothermal fluidas a base load, adding two 10 MWt heat pumps to heat the fluid for the customers to 90/C. As anemergency and peak heat source they use 22 MWt gas boilers. The main effect of the operating plant isextreme limitations of pollutant emissions. The objective was attained - a trail was blazed (Meyer andKozlowski,1995).
From geological and geophysical surveys, and existing wells in the Szczecin basin area, one can estimatethe following data for geothermal fluid accessible in the Nowogard area:
• Temperature of geothermal fluid: TMAX = 75/C;• Aquifer depth: D = 1.5 - 2.0 km;• Flow rate: VGmax = 150 m3/hr and VGmin = 50 m3/hr;• Average density of geothermal fluid: DG = 1.08 kg/m3;• Average specific heat at the constant pressure of geothermal fluid: cpG – 3.8 kJ /kgK.
On the basis of operation of the Pyrzyce geothermal heat plant, and a chemical survey it is known that thegeothermal water from the Szczecin Basin is very aggressive. The reason for this is high mineralization– high content of salts (with NaCl-type water and mineral content of 112 g/l). This fact should be takeninto consideration during selection of specific materials and devices. For example, the main plate heatexchangers should have a surface covered with palladium or titanium as well as the main pumps, used forpumping water from the well or the heat pumps.
Also it is worthwhile to note that there could be another danger called microbiological corrosion. Salt andhot geothermal water can be a good environment for bacterial growth. The bacteria if injected into thebedrock can silt it up (stick up) making the flow impossible. Therefore, one should avoid contact of thegeothermal water with atmospheric air.
2.3 Weather data
Nowogard’s location - Northwest Poland - is characterized by a mild climate. There are no cold wintersand 84% of the days in a year enjoy temperatures above zero (Figure 3). Minus 15/C was the coldest

Piwowarski Report 10216
FIGURE 4: Sun radiation in Nowogard, Poland
FIGURE 5: Sun radiation and average air temperature, Nowogard, Poland
temperature measured during the last 20 years. Because air temperature affects indoor climate throughheat conduction in the outer walls and windows, this factor needs to be taken into consideration in adistrict heating study. Sun radiation (Figures 4 and 5) is also an important factor, influencing indoorclimate in a house. For the heat dynamics of buildings, it is important to distinguish between direct anddiffuse radiation, since the angle of incidence is needed to calculate the amount of penetrating radiationat any orientation of the windows (Emeish, 2001).
3. THERMAL POWER DEMAND STUDY
3.1 Present situation
At present there are 84 working boilers, providing heat and tap water for Nowogard town. There is noexisting district heating system. Each boiler provides heat and tap water to consumers by it own pipesystem. Most of these pipe systems are in very bad condition, and it is necessary to replace them asquickly as possible.
The total thermal power of all working boilers in Nowogard is about 56,202 MWt. Also it is worthmentioning, that the boilers have very different installed thermal power capacity, from 22 kW to 4480 kW(Table 1).
During the last few years, some of boilers have been modernized, more efficient gas boilers replacing coalboilers. But this only applies for some small capacity boilers and most of the big coal boilers are still inoperation. These boilers, in most cases, operate with low efficiency because of over estimation of heatrequirements.

Report 10 Piwowarski217
TABLE 1: Number and type of boilers in Nowogard
Thermal powercapacity
FuelCoal/coke
Naturalgas Oil Firewood
Up to 100 kW 4 9 4 1101 - 200 kW 3 13 3 2201 - 500 kW 8 2 4 -501 - 1000 kW 7 1 - -Above 1000 kW 15 5 2 1Altogether 37 30 13 4
TABLE 2: Different fuel type participation in thermal power production in Nowogard City
FuelCoal/coke
Naturalgas
Oil Firewood
Heat production [MW] 38,444 11,664 4,551 1,543Percentage [%] 68.40 20.75 8.10 2.75
The result of coal and coke providing nearly 70% of the heat production (Table 2) is a huge emission ofair pollutants. It is estimated that the coal and coke boilers in Nowogard emit into the atmosphere, relativeto the total emission:
• 97% of SO2;• 89% of N2O5;• 99% of CO; and• 95% of the ashes.
Taking these numbers into consideration, and with no existing district heating system, it is necessary tothink about a new, clean, and economical heat source for the town.
3.2 Heat requirements
The heat requirement estimation methods can include
• Cataloguing existing boilers. Very quick but error abound, as some of the boilers are over estimated;• Cataloguing building data. Heat requirement estimates for actual building data, and for buildings
after thermo modernization.
A more accurate heat requirement estimation method is to collect data for all the building and population.In this work, data from Hydro-Sanitary Enterprise in Nowogard town was used. They catalogued thefollowing data:
• Number of flats;• Number of inhabitants;• Number of industrial plants;• Living space;• Construction year;• Wall type;

Piwowarski Report 10218
• Building type;• Thermal modernization at present and in the future;• Predicted building development.
Primarily, the heat requirement for each building was determined by using the norms of Polish NationalAgency of Energy Savings (Table 3). These norms did not take into consideration building types, so itwas decided to also use German norms, specified for East Germany (Table 4).
TABLE 3: Heat requirement according to the norms of Polish National Agency of Energy Savings
Year built Before 1967 1967 - 1985 1986 - 1992 1993 - 1997 Since 1998Min Max Min Max Min Max Min Max Min Max
Heat requirement [kWh/m2a] 240 350 240 280 160 200 120 160 90 120
TABLE 4: Heat requirement according to German norm
Year built No. of floors/stories
Building type Code type Heat requirement[kWh/m2a]From To
0
- 1918 1 - 2 Detached house BWJ A 325- 1918 1 - 2 Detached house BWJ B 325
1919 1945 1 - 2 Detached house BWJ C 2501946 - 1 - 2 Detached house BWJ D 2501961 1970 1 - 2 Detached house BWJ E 2501971 1980 1 - 2 Detached house BWJ F 1801981 1985 1 - 2 Detached house BWJ G 1801986 1990 1 - 2 Detached house BWJ H 1801991 1999 1 - 2 Detached house BWJ 140 (*110)
- 1918 3 - 4 Small terrace house BMW A 200- 1918 3 - 4 Small terrace house BMW B 180
1919 1945 3 - 4 Small terrace house BMW C 1801946 1960 3 - 4 Small terrace house BMW D 1801961 1990 3 - 4 Small terrace house BMW E-H 1801991 1999 3 - 4 Small terrace house BMW I 110
- 1918 5 - 8 Big terrace house BDW A-B 1901919 1945 5 - 8 Big terrace house BDW C 1901946 1960 5 - 8 Big terrace house BDW D 1451961 1970 5 - 8 Big terrace house BDW E 2001971 1980 5 - 8 Big terrace house BDW F 1701981 1990 5 - 8 Big terrace house BDW G-H 1601991 1999 5 - 8 Big terrace house BDW I 1101961 1970 9 - 99 Tower block BW E 1501961 1970 9 - 99 Tower block BP E 1301971 1990 9 - 99 Tower block BW F 1301971 1990 9 - 99 Tower block BP F-H 1101991 1999 9 - 99 Tower block BP I 110
To calculate thermal power demand for each flat, it is necessary to multiply a specific norm coefficientof heat requirement by flat area - obviously taking into consideration the type of building. Calculationswere done according to Polish and German norms. In the case where some thermal modernization hadbeen done (or will be done) the results of thermal power demand were modified by a specific coefficient,according to Polish National Agency of Energy Savings norm (Table 5).

Report 10 Piwowarski219
TABLE 5: Reduction of heat demand relative to initial state after thermal modernization
Reduction of heat demandrelative to initial state
Modernization of thermal centres + weather automation 5 - 10%New pipe isolation + thermostatic valves 15 - 20%Installation of heat meters Up to 10%Installation of screens behind the radiators Up to 5%Windows and door sealing 3 - 5%Installation of 3-partition windows 10 - 15%Wall insulation 10 - 25%
Thermal power demand for tap water preparation, was calculated by multiplying the number of tenantsin each flat by a special coefficient according to Polish and German norms. The coefficient value is 0.5MWha/person.
Total heat demand due to heating and tap water preparation was obtained by adding all the componentresults (heat requirements for each flat, building, and industrial plant). Results are presented in Table 6.
TABLE 6: Thermal power demand according to German and Polish norms
East Germannorm (D)
Polish normmin (PL min)
Polish normmax (PL max)
For preparing tap water [MWh/a] 12,750 12,750 12,750For space heating [MWh/a] 83,167 98,416 127,124Total thermal power demand [MWh/a] 95,917 111,166 139,874Poland/Germany ratio (PL/D) - 116% 146%
Analysing the data in Table 6, it is ease to notice that total thermal power demand calculated accordingto the Polish norm is almost 16% greater than the German norm in the minimum heat requirement case,and nearly 46% greater according to maximum heat requirement.
Table 7 includes results of comparing necessary total thermal power, calculated according to the norm,and related to present installed thermal power. Calculations were made with the following assumptions:
• Tap water requirements – 365 days/a, 8760 hours/a;• Heat for space heating requirements – 182 days/a, 4368 hours/a;• Transmission of heat energy, average efficiency – 65%;• Conversion energy, average efficiency – 80%;• Presently installed thermal power – 56,202 MW.
TABLE 7: Presently installed total thermal power related to calculated thermal poweraccording to norms
East Germannorm (D)
Polish normmin (PL min)
Polish normmax (PL max)
Necessary thermal power to prepare tap water [MW] 1,456 1,456 1,456Necessary thermal power for space heating [MW] 19,040 22,531 29,103Total necessary thermal power [MW] 20,496 23,987 30,559Total necessary thermal power [MW] with transmission efficiency 65%
31,532 36,903 47,014
Total necessary thermal power [MW] with conversion efficiency 80%
39,415 46,129 58,767
Comparison with installed thermal power [%] 143% 122% 96%

Piwowarski Report 10220
The deficit of about 4% of installed thermal power relative to the maximum heat requirement case is inreality covered by heat sources not included in this study. It is also worth mentioning the large over-sizingof actual working heat sources. Compared to the German norm, there is 43% more thermal powerinstalled in the town than needed. This is due to various reasons. Thermal energy saving operations havebeen carried out in East Germany for the past 20 years. Installing pre-insulated pipes in district heatingsystems, insulation of external walls, montage of good windows and doors, all these facts have aninfluence on thermal power demand. It is clear that similar steps need to be undertaken in Nowogard.There already exists a Polish energetic law, and several legal acts standardizing building parameters (Table8). Due to these it can be supposed, that in the near future buildings and piping heat losses will be reducedand the total thermal power demand for the town decreased.
TABLE 8: Building normative parameters
Date ofintroduction
Norm no.valid from date
Heat transfercoefficient, k for
external walls
Thermal powerdemand for
space heating, E
Thermal powerdemand for
space heating, Eo
[W /m2K] [kWh/m2a] [kWh/m3a]Up to 1966 No norm - 240 - 400 -
1967-85
PN-64/B-03404since 01.01.1966 1.16 240 - 280 -PN-74/B-03404since 1.1.1976
1986-92 PN-82 B-02020since 1.1.1983 0.75 160 - 200 -
Since 1993 PN-92 B-02020since 1.1.1992 0.55 120 - 160 37.4 - 49.6
Since 1998
PN-98 B-02025PN-EN ISO 6946PN-EB ISO 10211-1since 29.04.1998
0.45 90 -120 29.0 - 37.4
4. THE NETWORK
4.1 Network design based on the town plan
A geothermal district heating system is defined as the use of one or more production fields as sources ofheat to supply thermal energy to a group of buildings. Services available from a district heating systemare space heating, domestic water heating, space cooling and industrial process heat. A district heatingsystem is not limited to a particular type of heat source. Heat sources that could be used for a districtheating system include co-generating power plants, conventional boilers, municipal incinerators, solarcollectors, heat pumps, industrial waste heat sources and geothermal fields. Depending on the temperatureof the geothermal fields, it may be advantageous to develop a hybrid system including, in addition togeothermal, a heat pump and/or conventional boiler for peaking purposes. A geothermal district heatingsystem comprises three major components, as shown in Figure 6.
• The first is heat production, which includes the geothermal production and recharge fields,conventional fuelled peaking station and wellhead heat exchanger (Lienau, 1981).
• The second is the transmission/distribution system, which delivers the geothermal fluid or heatedwater to the consumers.
• The third includes central pumping stations and in-building equipment. Geothermal fluids may bepumped to a central pumping station/heat exchanger. Thermal storage tanks may be used to meetvariations in demand.

Report 10 Piwowarski221
Wellhead Heat
Exchange
PeakingProduction
Injection wells
Heat Exchange
Pump
1. Geothermal fields 2. Transmission & Distribution 3. Central pumping & in building equipment
FIGURE 6: District heating system for Nowogard town
FIGURE 7: District heating system for Nowogard town
A sketch of a new districtheating system was made on atown plan or street map ofNowogard (Figure 7). Duringi t s c r e a t i o n , s e v e r a lsimplifications were made.The customers were groupedaccording to street, and forevery street the heat demandwas summarized. A pipesystem was made only tosupply heat for every street;there is no return system.There are no storage tanks andexpansion devices. It mightbe mentioned that the createdsketch of the district-heatingsystem is not a professionaldesign. It has been designedfor simulation, and calculationof main district heatingparameters and pipe costs. Ageothermal heat plant is the central point of a district heating system. On Figure 7 it is indicated by apentagon. No wells exist in Nowogard town, so the orientation of the geothermal heat plant is made onan assumption basis.
The designed district heating system was used to establish the location of all streets according to thelocation of the central point (heat plant) of the system. Knowledge of the location of every characteristicpoint of the system was used to prepare input files for calculation of all district heating parameters.
5. SIMULATION
To simulate operation of a district heating system, the software “Pipelab” was created under Matlab – TheLanguage of Technical Computing. To start the simulation it was necessary to create two input files. Thefirst one with xyz coordinates of every node (based on the district heating design, Figure 7), the second

Piwowarski Report 10222
FIGURE 8: Sketch of a district heating netcreated in Pipelab software
FIGURE 9: Pipe diameter histogram
with length, diameter, roughness and heatloss of every pipe in the system. Thesecond part of this file includes necessarywater flow to every part of the systemand the pressure head at the starting pointof the system. The files can be seen intwo appendices at the end of the report.Based on these two files, the drawing ofthe distribution network (Figure 8) wasdone and all the calculations carried out.The method for the calculations is foundin Valdimarsson (1993).
Necessary water flow was calculated onthe basis of a 40/C radiator gradientassumption and heat requirements foreach street. To cover all the heatrequirements of the town an additionalheat source is needed. Estimated possibledischarge from the Nowogard aquifer isabout 40 kg/s of 75/C geothermal water.So it is clear that the rest of the neededwater must be prepared with the aid of aboiler or a heat pump.
5.1 District heating main parameters
The Pipelab software gives a lot of district heating parameter results. Below are presented the main resultsof Nowogard district heating simulation. During calculation of the optimized basis, some pipe diameterselection was made. Specifications of the diameter of every pipe used in the system can be found in theAppendix II. Figure 9 shows the results in plot format. Because optimisation was done on the norm pipediameter, the system includes only standard pipes. The biggest diameter used in the system is 0.4 m, andthis is pipe directly fromthe geothermal heat plant.
Figure 10 shows the pipehead gradient. A two bargradient in a majority ofthe pipes is acceptable.
The pipe head gradient inthe whole system isshown in Figure 11.Head difference ofaround 2 bar between thehighest and lowest user isa good result. Straightproportional decreasingof a head gradient in thewhole system is a goodresult.

Report 10 Piwowarski223
FIGURE 10: Pipe head gradient
FIGURE 11: Pipe head gradient in the whole system
The largest group ofcustomers are served witha pressure head at 6.5-7bars, as seen by analysingFigure 12. Diameters ofthe longest pipes used inthe net are between 0.05and 0.15 m (Figure 13).Velocity of 0.2-0.5 m/soccurs in the majority ofthe pipes (Figure 14). It isquite logical, because themajority of the pipes arethe pipes to the consumers,with the smallest fixeddiameter of 0.02 m.
5.2 Estimated cost of the new system
Estimation of the new system’s costs were done on the Dutch market basis. Specification of every pipeused in the system, length of these and prices are part of the Pipelab database. After designing a newsystem for Nowogard town and running simulation, there was available a roughly estimated price of allthe pipes used in the system. In the case of Nowogard, the approximate total costs of the new system(only supply net) is 2.4 million US dollars (Table 9).

Piwowarski Report 10224
FIGURE 12: Distribution of consumer head
FIGURE 13: Length and diameters of pipes used in the network
FIGURE 14: Pipe velocity vs. number of pipes
Report 10 Piwowarski225
Qfield
File
d H
eat
Condenser
Evaporator
Engine Consumers
Heat Pump
mp Tg
Td T2
T1 ms
Tcon
Tev Qin
Qout
Qengine
W
Ts
Tr
COP
FIGURE 15: Additional heat provided by heat pump
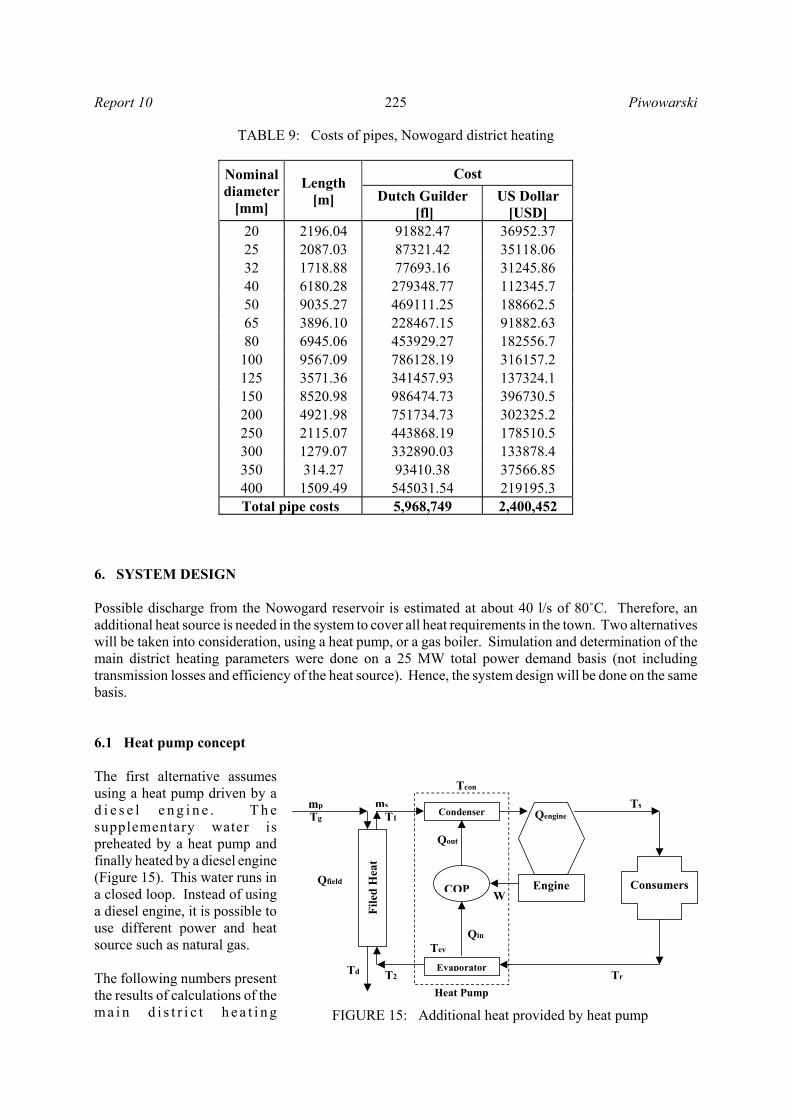
TABLE 9: Costs of pipes, Nowogard district heating
Nominaldiameter
[mm]
Length[m]
CostDutch Guilder
[fl]US Dollar
[USD]20 2196.04 91882.47 36952.3725 2087.03 87321.42 35118.0632 1718.88 77693.16 31245.8640 6180.28 279348.77 112345.750 9035.27 469111.25 188662.565 3896.10 228467.15 91882.6380 6945.06 453929.27 182556.7
100 9567.09 786128.19 316157.2125 3571.36 341457.93 137324.1150 8520.98 986474.73 396730.5200 4921.98 751734.73 302325.2250 2115.07 443868.19 178510.5300 1279.07 332890.03 133878.4350 314.27 93410.38 37566.85400 1509.49 545031.54 219195.3Total pipe costs 5,968,749 2,400,452
6. SYSTEM DESIGN
Possible discharge from the Nowogard reservoir is estimated at about 40 l/s of 80/C. Therefore, anadditional heat source is needed in the system to cover all heat requirements in the town. Two alternativeswill be taken into consideration, using a heat pump, or a gas boiler. Simulation and determination of themain district heating parameters were done on a 25 MW total power demand basis (not includingtransmission losses and efficiency of the heat source). Hence, the system design will be done on the samebasis.
6.1 Heat pump concept
The first alternative assumesusing a heat pump driven by ad i e s e l e n g i n e . T h esupplementary water ispreheated by a heat pump andfinally heated by a diesel engine(Figure 15). This water runs ina closed loop. Instead of usinga diesel engine, it is possible touse different power and heatsource such as natural gas.
The following numbers presentthe results of calculations of them a i n d i s t r i c t h e a t i n g

Piwowarski Report 10226
File
d H
eat
Consumers
Gas Boiler
mp Tg
TdTr
TsT1
ms
Qboiler
Qfield
FIGURE 16: Additional heat provided by a gas boiler
parameters. These values only give a rough idea of the possible operation of the Nowogard’s districtheating system.
Tg = 80/C - geothermal water temperature;Td = 8/C - discharge (reinjected) water temperaure;T1 = 24/C - temperature of water from heat exchanger;T2 = 5/C - temperature of water to heat exchanger;TCON = 77/C - condenser temperature;TEV = 2/C - evaporator temperature;Tr = 45/C - return temperature;TS = 85/C - supply temperature;mp = 40 l/s - preliminary flow, geothermal water;ms = 149 l/s - secondary flow, water to town;W = 6.7 MW - engine work;COP = 4.65 - coefficient of performance;Qengine = 6.7 MW;Qin = 25 MW;Qout = 31 MW;Qfield = 12 MW;Consumers, Q = 25 MW.
6.2 Gas boiler concept
Another approach to theproblem could be the useof a gas boiler as anadditional heat source(F igu re16) . Thesupplementary water canbe preheated with the aidof geothermal energy andfinally heated by a gasboiler.
The following presented values are the results of the calculations:
Tg = 80/C - geothermal water temperature;Td = 8/C - discharge (reinjected) water temperature;T1 = 64/C - temperature of water from heat exchanger;Tr = T2 = 45/C - temperature of water to heat exchanger;TS = 85/C - supply temperature;mp = 40 l/s - preliminary flow, geothermal water;ms = 149 l/s - secondary flow, water to town;Qboiler= 13 MW;Qfield = 12 MW;Consumers, Q = 25 MW.
6.3 Engine driven vapour compression heat pump
The great majority of heat pumps work on the principle of a vapour compression cycle. The maincomponents in such a heat pump system are the compressor, the expansion valve and two heat exchangersreferred to as the evaporator and the condenser. The components are connected to form a closed circuit.
Report 10 Piwowarski227
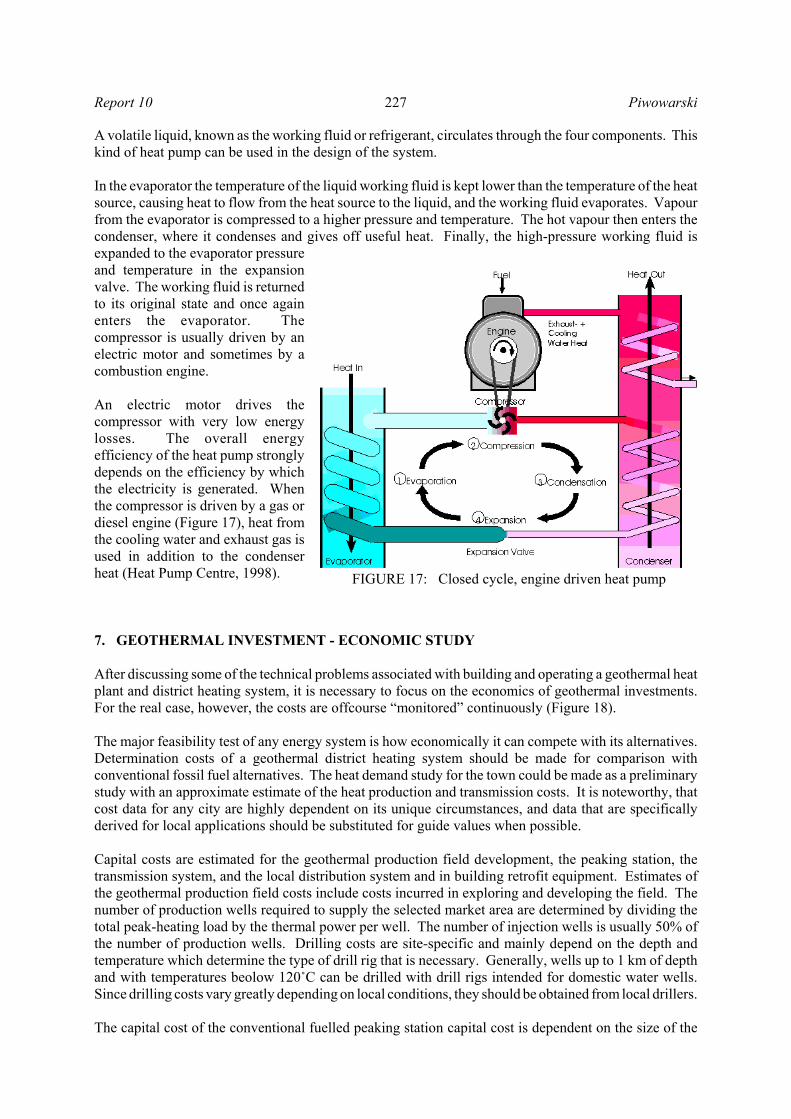
FIGURE 17: Closed cycle, engine driven heat pump
A volatile liquid, known as the working fluid or refrigerant, circulates through the four components. Thiskind of heat pump can be used in the design of the system.
In the evaporator the temperature of the liquid working fluid is kept lower than the temperature of the heatsource, causing heat to flow from the heat source to the liquid, and the working fluid evaporates. Vapourfrom the evaporator is compressed to a higher pressure and temperature. The hot vapour then enters thecondenser, where it condenses and gives off useful heat. Finally, the high-pressure working fluid isexpanded to the evaporator pressureand temperature in the expansionvalve. The working fluid is returnedto its original state and once againenters the evaporator. Thecompressor is usually driven by anelectric motor and sometimes by acombustion engine.
An electric motor drives thecompressor with very low energylosses. The overall energyefficiency of the heat pump stronglydepends on the efficiency by whichthe electricity is generated. Whenthe compressor is driven by a gas ordiesel engine (Figure 17), heat fromthe cooling water and exhaust gas isused in addition to the condenserheat (Heat Pump Centre, 1998).
7. GEOTHERMAL INVESTMENT - ECONOMIC STUDY
After discussing some of the technical problems associated with building and operating a geothermal heatplant and district heating system, it is necessary to focus on the economics of geothermal investments.For the real case, however, the costs are offcourse “monitored” continuously (Figure 18).
The major feasibility test of any energy system is how economically it can compete with its alternatives.Determination costs of a geothermal district heating system should be made for comparison withconventional fossil fuel alternatives. The heat demand study for the town could be made as a preliminarystudy with an approximate estimate of the heat production and transmission costs. It is noteworthy, thatcost data for any city are highly dependent on its unique circumstances, and data that are specificallyderived for local applications should be substituted for guide values when possible.
Capital costs are estimated for the geothermal production field development, the peaking station, thetransmission system, and the local distribution system and in building retrofit equipment. Estimates ofthe geothermal production field costs include costs incurred in exploring and developing the field. Thenumber of production wells required to supply the selected market area are determined by dividing thetotal peak-heating load by the thermal power per well. The number of injection wells is usually 50% ofthe number of production wells. Drilling costs are site-specific and mainly depend on the depth andtemperature which determine the type of drill rig that is necessary. Generally, wells up to 1 km of depthand with temperatures beolow 120/C can be drilled with drill rigs intended for domestic water wells.Since drilling costs vary greatly depending on local conditions, they should be obtained from local drillers.
The capital cost of the conventional fuelled peaking station capital cost is dependent on the size of the

Piwowarski Report 10228
Literature
Preliminary Feasibility Study
Decision
Decision
Geology
Geochemistry
Geophysical
Temperature Gradient Hole
Conceptual Model of Resource
GO Oil/Gas
Detailed Feasibility Study
DecisionGO
Oil/Gas
Drill Test well(s)
Well Testing
Drill Injection Wells
Well Completion
Drill Production Wells
Decision
Build System
GO Oil/Gas
Decision
Evaluate Data
COST
FIGURE 18: Geothermal production fielddevelopment cost schedule
boiler. The size is determinedfrom the heat load durationcurve, which gives thecontribution of the buildings’heat loss in the district that is tobe supplied by the peakingstation.
Local distribution costs includethe pipes and accompanyingequipment needed to conveyhot water from the transmissionpipes to street hook-ups ofindividual buildings. Becausethe distribution piping must besized to service maximumenergy demands, the cost of thedistribution system is dependenton the peak heating load, size ofthe market area, and a factorthat takes into account thethermal density and type ofpiping. Transmission costsdepend mainly on
• Thermal demand densitywithin the market area;
• Distance between marketperimeter or centralpumping station andgeothermal productionfield.
An alternative is to expresstransmission costs as aproportion of local distributioncosts.
The profitability of building ageothermal heat plant is notalways clear. The investorsreally want to know when theyget their money back, and howmuch the net profit could be.They are also interested in howthe operation of geothermal
heat plant will affect local economies and what benefits are provided to the consumers.
Investment costs of building a geothermal plant depend
- on some components that are depend on the size of the geothermal heat plant;- but also on components that only partly are dependent on the geothermal heat plant size.

Report 10 Piwowarski229
0
2
4
6
8
10
12
14
60 65 70 75 80 85 90 95 100Geothermal water temperature [°C]
Inve
stm
ents
cos
ts [
mili
ons
USD
]2 wells 3 wells 4 wells 5 wells
FIGURE 19: Investment costs depend on number of wellsand geothermal water temperature
Components included in investment costs of building a geothermal heat plant are:
• Drilling and reinforcement of wells – half and linear dependence on depth, total dependence onnumber of wells;
• Geothermal pipes – half and non-linear dependence on number of wells;• Buildings, roads, infrastructure – partly dependent on plant size;• Technical infrastructure – partly dependent on plant size;• Heat pumps + reinforcement – linear dependence on number of pumps;• Peak gas boilers – depend on total peak heat requirements, not covered by geothermal.
Drilling depth is linearlydependent on the temperature ofthe aquifer. So investmentcosts of the plant are dependenton well depths and watertemperature. Geological workand drill work (survey, drilling,wells reinforcement) are also animportant part of the total plantcost (Figure 19). In general, itis more than 60% of the totalplant value (Maliszewski,1996).
Analysing Figure 19 shows thatin the 5 well case, an additional30/C of geothermal water costsadditional 2.5 million USD.Often it is more economical toinstall heat pumps or peak gas boilers instead of drilling deeper.
7.2 Cost of alternative systems
Heat provision for a district heating system could be realised with many other systems than geothermal.There are solar energy systems, biomass systems, and fossil fuel systems. Specific energy provision costswere calculated on the basis of monetary value for the year 1999 (Germany) with no inflation taken intoconsideration. The results for each district heating system are shown in Table 10. According to the tablethe heat provision costs of different options vary significantly. The provision of heat with a system basedon the use of fossil energy is the cheapest option. Notable is the heat provision from biomass andgeothermal energy extracted from deep underground. The system using geothermal energy has highinvestment costs.
TABLE 10: Comparison of costs in i/GJ
Dwelling house Small districtheating system
Large districtheating system
Solar energy 21.0 28Biomass 14.4 18.2 17.8Geothermal energy Soil & groundwater 11.9-13.1 Deep wells 17.6-18.6 Hydroth. resources 16.0-20.7Fossil energy 12-12.5 13.6-14.3 12.1-12.8

Piwowarski Report 10230
For a biomass based heat provision system in this capacity range, a highly sophisticated combustiontechnology is used in most cases to meet the legal environmental standards. Additionally, a person isneeded to run the plant. Fairly high costs are the result. Costs could only be reduced if the biomassfeedstock was available at very low costs. Compared to such a system, heat provision from solar energy(solar thermal energy and a seasonal heat storage system) is much more expensive.
Compared to fossil fuels, proucing heat from geothermal is still much more expensive. But if onlysystems for heat provision based on renewable energies are compared to each other, the use of geothermalenergy can easily compete.
Costs for heat provision with deep wells are shown in Table 11. It shows two possibilities, one based ona new well, and the other assumes that there is a well already available due to exploration of oil or gas.
TABLE 11: Costs if heat is provided with deep wells (in 1,000 i),the share of geothermal energy is assumed to be 71%
New well Existing wellInvestment costsHeat source 1800 1.250Heat pump 200 200Peak load system 220 220Building, others 220 200District Heating System 450 450Sum 2.890 2.320Operation & mainten. costsEnergy costs 80 80Maintenance 90 90Sum 170 170Heat provision costs (at plant gate /at consumer)In i/GJ 16.0/18.6 15.5/17.6In i-cent/kWh 5.8/6.7 5.4/6.4
To sum up, the use of geothermal energy for covering a given heat demand can easily compete with otherrenewable energy sources and under certain circumstances also with the use of fossil energy. But in mostcases, use of geothermal energy for the provision of heat in Poland and in most places in Europe is moreexpensive than the use of oil and gas. If, therefore, such options should be used due to environmental orother reasons, administrative and/or legal measures must be applied to make these options economicallyfeasible (Kaltschmitt, 2000).
7.2 Legal requirements
At present in Poland some thermal waters, specified by law, are considered minerals. This means that anapplicant intending to explore and exploit them must follow all the rules of the Geological and mining actof February 4, 1994 (to get exploration concessions, confirmation of geological documentation, andexploitation concessions). An applicant’s mining activity will be considered as an operation of a miningplant. Other thermal waters are not considered minerals and may be exploited according to the rules ofthe Water act of October 24, 1974. Exploitation of heat pumps should follow the rules of the Constructionact of 9 July and, in only some cases, of the Water act. This situation may result in large and unjustifieddifferences for particular investors, depending on the kind of thermal water available (Lipinski, 1996).
Note: There already exist new changed laws about the utilisation of geothermal water, concessions andpermissions in Poland. The author of this study unfortunately has had no access to those acts.

Report 10 Piwowarski231
8. CONCLUSIONS
• After analysing the thermal power demand for Nowogard town and the geothermal resources in thearea, one can say that with an additional heat source such as a gas boiler or heat pump, sufficientgeothermal energy can be provided for the town.
• With no existing district heating system in Nowogard, the bad conditions of all pipes, the majorityof coal and coke boilers working at low efficiency, and the huge air pollution – the one and onlyright conclusion is that Nowogard needs a new clean heat source and a district heating system.
• Analysing simulation results of a modelled geothermal district heating system, and taking intoconsideration system costs, and alternative system costs, one can say that the utilisation ofgeothermal energy in Nowogard is economically justified.
• The successful operation of the Pyrzyce geothermal heat plant, located near Nowogard with similarconditions, is one more convincing reason for starting the utilisation of geothermal energy inNowogard.
ACKNOWLEDGEMENTS
I would like very much to thank Dr. Ingvar B. Fridleifsson for giving me the chance to come to Icelandand take part in the Geothermal Training Programme. Many thanks to Mr. Lúdvík S. Georgsson and Ms.Gudrún Bjarnadóttir for wonderful assistance and help during my work at Orkustofnun. Sincere thanksto my supervisor, Dr. Páll Valdimarson, for his patience and for sharing with me all his great knowledge.Finally, thanks to my friend, co-fellow of the Geothermal Training Programme, Mr. Jaroslaw Jako Kotyza,for his sense of humour and great companionship.
A very important part of these acknowledgements are dedicated to my scientific supervisor in Poland, Mr.Roman Sobanski. Thanks to him, I met Dr. Fridleifsson, and came to Iceland. Unfortunately, during mystay here, Mr. Sobanski died. All that I have learned in Iceland, this report and my future activity ingeothermal business, I dedicate to him.
REFERENCES
Emeish, M.E., 2001: Simulation of heating systems in Jordanian buildings. University of Iceland, M.Sc.thesis, UNU Geothermal Training Programme, Iceland, report 1, 91 pp.
Heat Pump Centre, 1998: Closed cycle, engine-driven vapour compression heat pump. Web pagehttp://www.heatpumpcentre.org .
Kaltschmitt, M., 2000: Heat provision cost from geothermal energy in comparison to other sources ofenergy. Proceedings of the World Geothermal Congress 2000, Kyushu-Tohuku, Japan, 627-632.
Lienau, J., 1981: Geothermal district heating analysis guide. Oregon Institute of Technology, Geo HeatCenter, Klamath Falls, Or, 75 pp.
Lipinski, A., 1996: Some legal problems of the utilisation of geothermal energy (in Polish). PolishGeothermal School, scientific course material, Krakow, 129-145.

Piwowarski Report 10232
Maliszewski, N., 1996: Geothermal investment - economic analysis (in Polish). Polish GeothermalSchool, scientific course material, Krakow, 207-227.
Meyer, Z., and Kozlowski, J.,1995: Pyrzyce - first geothermal heating system in Poland. Proceedingsof the World Geothermal Congress 1995, Florence, Italy, 3,2269-2272.
Valdimarsson, P., 1993: Modelling of geothermal district heating systems. University of Iceland, Ph.D.thesis, 315 pp.
APPENDIX I: Simulation input files
Input files
File 1Node Node nr X coordinate Y coordinate Z coordinate node 1 0 0 0 node 2 -1111 111 0 node 3 -1056 389 0 node 4 -1333 278 0 node 5 -944 111 0 ………node 154 6389 -3444 0
File 2Pipe from node to node length [m] diameter[m] roughness heat loss pipe 1 2 1116.653 0.416057 0.00004600 16.8000pipe 2 3 283.279 0.197210 0.00004600 16.8000pipe 2 7 392.837 0.392584 0.00004600 16.8000pipe 3 4 299.176 0.121556 0.00004600 16.8000pipe 3 5 299.176 0.078444 0.00004600 16.8000………pipe 29 32 351.364 0.007953 0.00004600 16.8000
Flow node discharge[kg/s] head [m]flow 58 -7.350000 80.000000flow 61 -4.220000 80.000000flow 55 -0.090000 80.000000flow 57 -0.070000 80.000000flow 53 -0.250000 80.000000………flow 72 -1.890000 80.000000
Head node head[m] head[m]Head 1 80 80
Report 10 Piwowarski233
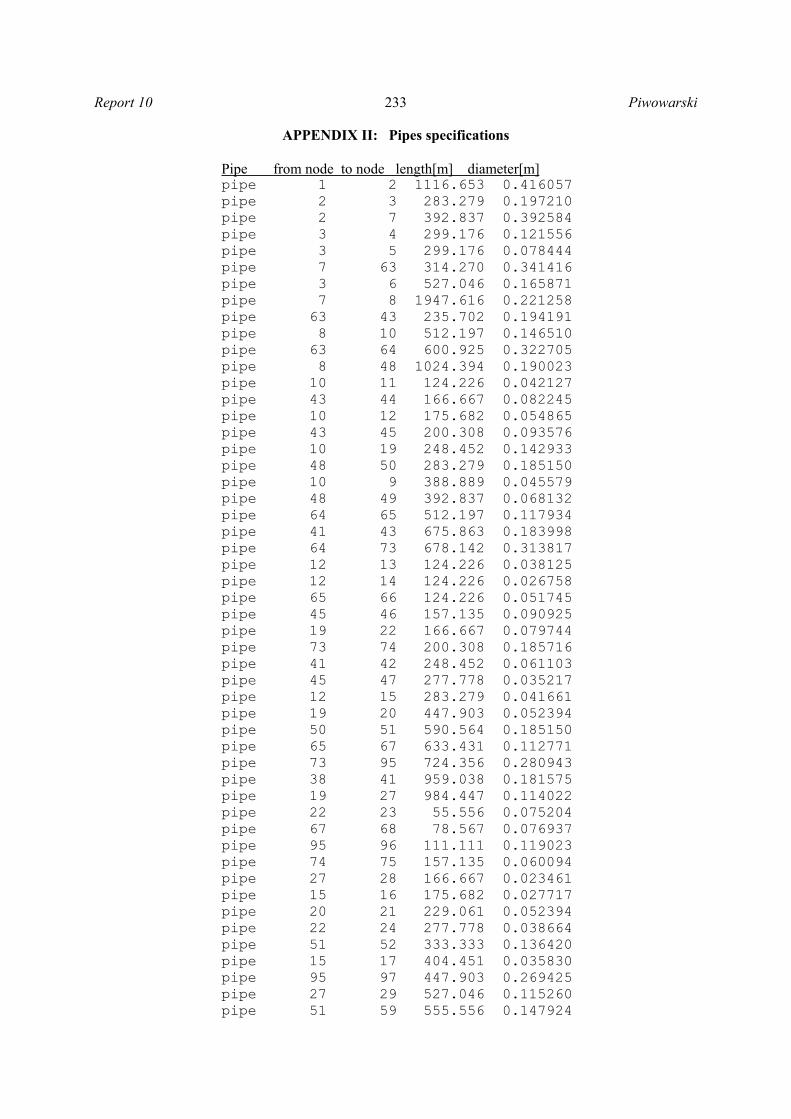
APPENDIX II: Pipes specifications
Pipe from node to node length[m] diameter[m]pipe 1 2 1116.653 0.416057 pipe 2 3 283.279 0.197210 pipe 2 7 392.837 0.392584 pipe 3 4 299.176 0.121556 pipe 3 5 299.176 0.078444 pipe 7 63 314.270 0.341416 pipe 3 6 527.046 0.165871 pipe 7 8 1947.616 0.221258 pipe 63 43 235.702 0.194191 pipe 8 10 512.197 0.146510 pipe 63 64 600.925 0.322705 pipe 8 48 1024.394 0.190023 pipe 10 11 124.226 0.042127 pipe 43 44 166.667 0.082245 pipe 10 12 175.682 0.054865 pipe 43 45 200.308 0.093576 pipe 10 19 248.452 0.142933 pipe 48 50 283.279 0.185150 pipe 10 9 388.889 0.045579 pipe 48 49 392.837 0.068132 pipe 64 65 512.197 0.117934 pipe 41 43 675.863 0.183998 pipe 64 73 678.142 0.313817 pipe 12 13 124.226 0.038125 pipe 12 14 124.226 0.026758 pipe 65 66 124.226 0.051745 pipe 45 46 157.135 0.090925 pipe 19 22 166.667 0.079744 pipe 73 74 200.308 0.185716 pipe 41 42 248.452 0.061103 pipe 45 47 277.778 0.035217 pipe 12 15 283.279 0.041661 pipe 19 20 447.903 0.052394 pipe 50 51 590.564 0.185150 pipe 65 67 633.431 0.112771 pipe 73 95 724.356 0.280943 pipe 38 41 959.038 0.181575 pipe 19 27 984.447 0.114022 pipe 22 23 55.556 0.075204 pipe 67 68 78.567 0.076937 pipe 95 96 111.111 0.119023 pipe 74 75 157.135 0.060094 pipe 27 28 166.667 0.023461 pipe 15 16 175.682 0.027717 pipe 20 21 229.061 0.052394 pipe 22 24 277.778 0.038664 pipe 51 52 333.333 0.136420 pipe 15 17 404.451 0.035830 pipe 95 97 447.903 0.269425 pipe 27 29 527.046 0.115260 pipe 51 59 555.556 0.147924

Piwowarski Report 10234
pipe 74 76 668.977 0.182116 pipe 38 39 724.356 0.162926 pipe 38 40 724.356 0.058792 pipe 67 69 724.356 0.095156 pipe 32 38 773.799 0.104063 pipe 76 77 55.556 0.066651 pipe 69 70 78.567 0.065336 pipe 69 71 157.135 0.080064 pipe 97 98 157.135 0.090275 pipe 17 18 175.682 0.035830 pipe 52 53 175.682 0.037573 pipe 29 30 229.061 0.022168 pipe 32 33 248.452 0.070161 pipe 32 34 248.452 0.091183 pipe 24 25 283.279 0.033259 pipe 52 54 351.364 0.134740 pipe 24 26 355.729 0.025738 pipe 76 78 392.837 0.177186 pipe 29 31 423.099 0.110837 pipe 97 101 942.809 0.263595 pipe 59 60 982.878 0.147924 pipe 34 35 166.667 0.082700 pipe 34 36 175.682 0.052394 pipe 54 55 175.682 0.025738 pipe 54 56 229.061 0.134126 pipe 98 99 235.702 0.084335 pipe 101 102 277.778 0.128314 pipe 78 79 323.942 0.147573 pipe 98 100 333.333 0.045981 pipe 101 103 458.123 0.189440 pipe 101 104 524.110 0.191296 pipe 78 81 647.884 0.123145 pipe 60 62 702.728 0.118856 pipe 60 61 1199.280 0.108363 pipe 71 72 1648.980 0.080064 pipe 56 57 124.226 0.023461 pipe 79 80 124.226 0.147573 pipe 36 37 175.682 0.052394 pipe 104 105 248.452 0.187156 pipe 81 82 299.176 0.065336 pipe 56 58 400.617 0.133646 pipe 104 147 820.268 0.064435 pipe 81 85 993.808 0.113942 pipe 82 83 157.135 0.061351 pipe 147 148 229.061 0.046377 pipe 82 84 277.778 0.032562 pipe 105 106 404.451 0.177229 pipe 85 86 650.261 0.113942 pipe 105 113 747.424 0.087457 pipe 147 152 1470.911 0.052713 pipe 106 107 175.682 0.060854 pipe 86 88 222.222 0.095753 pipe 106 108 229.061 0.092706 pipe 106 109 248.452 0.159788

Report 10 Piwowarski235
pipe 148 149 283.279 0.042584 pipe 148 150 299.176 0.025738 pipe 86 87 477.907 0.078279 pipe 113 114 503.077 0.025738 pipe 113 116 512.197 0.056603 pipe 113 115 671.280 0.074312 pipe 152 153 2786.652 0.052713 pipe 88 89 111.111 0.091568 pipe 150 151 175.682 0.025738 pipe 88 90 283.279 0.042127 pipe 109 117 423.099 0.158024 pipe 153 154 671.280 0.052713 pipe 109 110 1809.611 0.042127 pipe 117 121 124.226 0.154124 pipe 117 118 166.667 0.056034 pipe 90 91 337.931 0.042127 pipe 90 92 337.931 NaN pipe 110 112 355.729 NaN pipe 110 111 668.977 0.042127 pipe 118 119 124.226 0.045171 pipe 118 120 124.226 0.041187 pipe 121 122 166.667 0.083598 pipe 121 123 175.682 0.141770 pipe 92 94 229.061 NaN pipe 92 93 277.778 NaN pipe 123 125 248.452 0.137675 pipe 123 124 283.279 0.053343 pipe 125 127 111.111 0.135011 pipe 125 126 283.279 0.044757 pipe 127 128 124.226 0.081477 pipe 127 134 248.452 0.120341 pipe 128 129 124.226 NaN pipe 134 135 283.279 0.071525 pipe 128 130 351.364 0.081477 pipe 134 136 351.364 0.107877 pipe 130 131 124.226 0.061842 pipe 136 137 283.279 0.107877 pipe 130 132 337.931 0.063745 pipe 132 133 175.682 0.063745 pipe 137 138 423.099 0.043910 pipe 137 139 474.667 0.104056 pipe 139 141 404.451 0.083151 pipe 139 140 650.261 0.076937 pipe 141 142 229.061 0.064662 pipe 141 146 248.452 0.063512 pipe 142 143 229.061 0.052071 pipe 142 144 283.279 0.047532 pipe 144 145 200.308 0.047532 pipe 29 32 351.364 0.007953
NaN – NO FLOW, diameter 0