Embed Size (px)
Citation preview
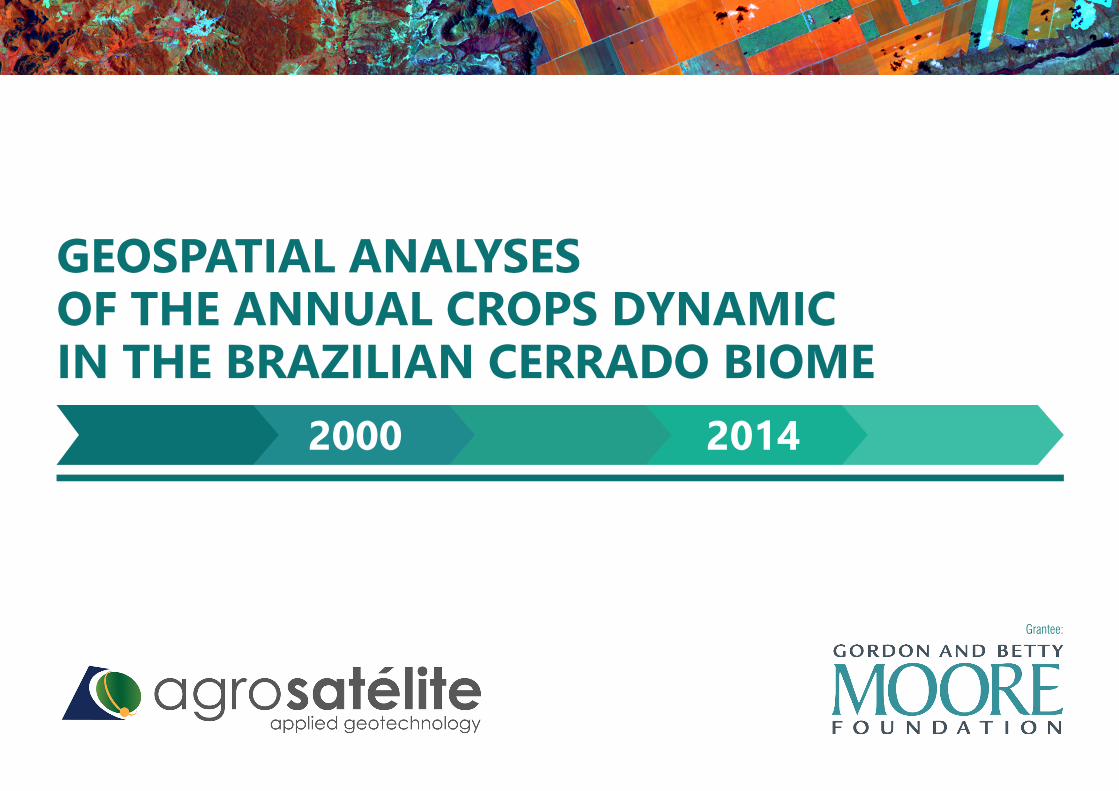
GEOSPATIAL ANALYSES OF THE ANNUAL CROPS DYNAMIC IN THE BRAZILIAN CERRADO BIOME
2000 2014
Grantee:
General CoordinatorBernardo Rudorff
Technical CoordinatorJoel Risso
Senior Team Daniel AguiarFabio GonçalvesMoisés Salgado
Analist TeamJair PerrutLuciana OliveiraMarco Virtuoso
Collaborative TeamBruno MontibellerCharles BaldiGabriela RabaçaHelber de PaulaJessica GerenteMurilo de AlmeidaRenata BernardoSmyllei CúrcioVicente LopesVinícius Chagas
Administrative SupportWilson de Morais Jr.Dêmick Garcia Filho
Institutional SupportAgroconsult Consultoria e Projetos
Graphic Design and PublishingMedia Eyes Comunicação Integradawww.mediaeyes.com.br
December, 2015
Agrosatélite Applied Geotechnology Ltd.Geospatial Analyses of the Annual Crops Dynamic in the Brazilian Cerrado Biome: 2000 to 2014 / Rudorff, B.; Risso, J. et al., 2015 - Florianópolis, Santa Catarina, Brazil, 2015. 28 p. Summary Report.biomas.agrosatelite.com.br
Executive Summary1. Introduction2. Study Area3. Remote Sensing Data4. Agricultural Dynamics from 2000/01 to 2013/145. Land-use and land-cover change during the periods 2000/01 - 2006/07 and 2006/07 - 2013/146. Agricultural capacity in the Cerrado biome
6.1 Agricultural capacity of current native vegetation areas6.2 Agricultural capacity of previously disturbed areas
7. Considerations and Recommendations
05
GEOSPATIAL ANALYSES OF THE ANNUAL CROPS DYNAMIC IN THE BRAZILIAN CERRADO BIOME: 2000 TO 2014
CONTENTS
07
16
22
26
0605
04
Figure 1 - Schematic illustration of the study design and outcomes.Figure 2 - Geographic location of the Cerrado biome in Brazil.Figure 3 - Cultivated area of 1st crop season of soybean, corn and cotton for the Cerrado biome, the states outside of the MATOPIBA region (other states), and the states included in the MATOPIBA region in the crop years 2000/01, 2006/07, and 2013/14. Figure 4 - Cultivated area of 1st crop season of soybean, corn, and cotton by state and for the Federal District in the crop years 2000/01, 2006/07, and 2013/14. Figure 5 - Map of the cultivated area of 1st crop season of soybean, corn, and cotton in the Cerrado biome in the crop year 2000/01.
FIGURE CONTENTS
TABLE CONTENTSFigure 6 - Map of the cultivated area of 1st crop season of soybean, corn, and cotton in the Cerrado biome in the crop year 2006/07.Figure 7 - Map of the cultivated area of 1st crop season of soybean, corn, and cotton in the Cerrado biome in the crop year 2013/14.Figure 8 - Main land-use and land-cover changes in the Cerrado biome as a whole (A and B), in the states outside of the MATOPIBA region (C and D), and in the MATOPIBA region (E and F), in the periods 2000/01 - 2006/07 (left) and 2006/07 - 2013/14 (right). Figure 9 - Land-use and land-cover change by state in the period 2000/01 – 2006/07.Figure 10 - Land-use and land-cover change by state in the period 2006/07 – 2013/14.Figure 11 - Land stock with high, medium and low agricultural capacity for annual crops in states outside of the MATOPIBA region (other states), and in the MATOPIBA region, in areas of native vegetation remnants (NVR).Figure 12 - Land stock with high, medium and low agricultural capacity for annual crops outside the MATOPIBA region (other states), and within the MATOPIBA region, in previously disturbed areas. Figure 13 - Overview of the results achieved in this study in terms of agriculture capacity of the Cerrado in 2014. The different sizes and colors of the elements in this figure represent the proportional area of each agricultural capacity class in relation to the entire Cerrado.
Table 1 - Cultivated area of 1st crop season of soybean, corn, and cotton in the Cerrado biome in the crop year 2000/01.Table 2 - Cultivated area of 1st crop season of soybean, corn, and cotton in the Cerrado biome in the crop year 2006/07.Table 3 - Cultivated area of 1st crop season of soybean, corn, and cotton in the Cerrado biome in the crop year 2013/14.Table 4 - Main land-use and land-cover changes observed in the period 2000/01 - 2006/07 in the portion of the Cerrado biome in each state and in the Federal District.Table 5 - Main land-use and land-cover changes observed in the period 2006/07 - 2013/14 in the portion of the Cerrado biome in each state and in the Federal District.Table 6 - Land stock of previously disturbed areas (A) and of native vegetation remnants (NVR) for the 13 classes of agricultural capacity in private properties and in special areas (indigenous lands IL’s, and conservation units of integral protection – CU-IP –, and sustainable use CU-SU).
22
06
11
12
13
14
15
17
20
20
22
23
25
18
19
24
08
08
09
10
21
GEOSPATIAL ANALYSES OF THE ANNUAL CROPS DYNAMIC IN THE BRAZILIAN CERRADO BIOME: 2000 TO 201404
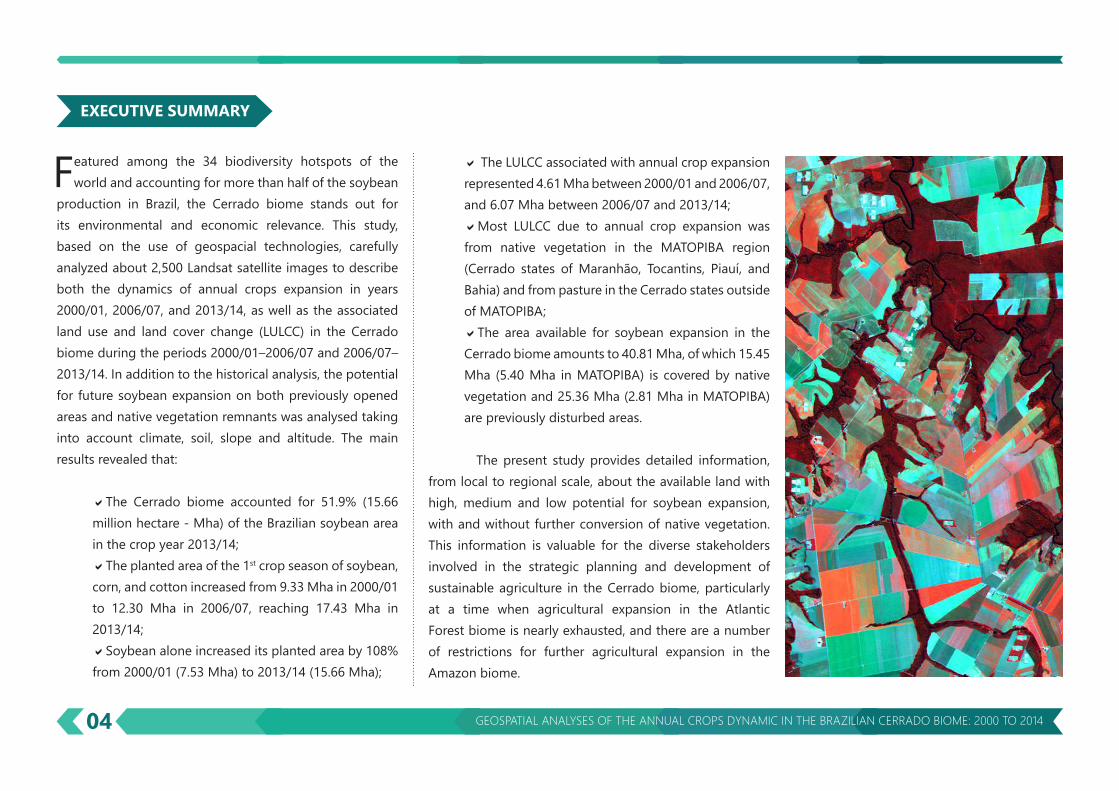
Featured among the 34 biodiversity hotspots of the world and accounting for more than half of the soybean
production in Brazil, the Cerrado biome stands out for its environmental and economic relevance. This study, based on the use of geospacial technologies, carefully analyzed about 2,500 Landsat satellite images to describe both the dynamics of annual crops expansion in years 2000/01, 2006/07, and 2013/14, as well as the associated land use and land cover change (LULCC) in the Cerrado biome during the periods 2000/01–2006/07 and 2006/07–2013/14. In addition to the historical analysis, the potential for future soybean expansion on both previously opened areas and native vegetation remnants was analysed taking into account climate, soil, slope and altitude. The main results revealed that:
aThe Cerrado biome accounted for 51.9% (15.66 million hectare - Mha) of the Brazilian soybean area in the crop year 2013/14;aThe planted area of the 1st crop season of soybean, corn, and cotton increased from 9.33 Mha in 2000/01 to 12.30 Mha in 2006/07, reaching 17.43 Mha in 2013/14; aSoybean alone increased its planted area by 108% from 2000/01 (7.53 Mha) to 2013/14 (15.66 Mha);
a The LULCC associated with annual crop expansion represented 4.61 Mha between 2000/01 and 2006/07, and 6.07 Mha between 2006/07 and 2013/14; aMost LULCC due to annual crop expansion was from native vegetation in the MATOPIBA region (Cerrado states of Maranhão, Tocantins, Piauí, and Bahia) and from pasture in the Cerrado states outside of MATOPIBA;aThe area available for soybean expansion in the Cerrado biome amounts to 40.81 Mha, of which 15.45 Mha (5.40 Mha in MATOPIBA) is covered by native vegetation and 25.36 Mha (2.81 Mha in MATOPIBA) are previously disturbed areas.
The present study provides detailed information, from local to regional scale, about the available land with high, medium and low potential for soybean expansion, with and without further conversion of native vegetation. This information is valuable for the diverse stakeholders involved in the strategic planning and development of sustainable agriculture in the Cerrado biome, particularly at a time when agricultural expansion in the Atlantic Forest biome is nearly exhausted, and there are a number of restrictions for further agricultural expansion in the Amazon biome.
EXECUTIVE SUMMARY
05
1. INTRODUCTION
The Cerrado is the second largest biome in Brazil, with an area of 204 million hectares, representing approximately ¼ of the Brazilian territory, and spanning
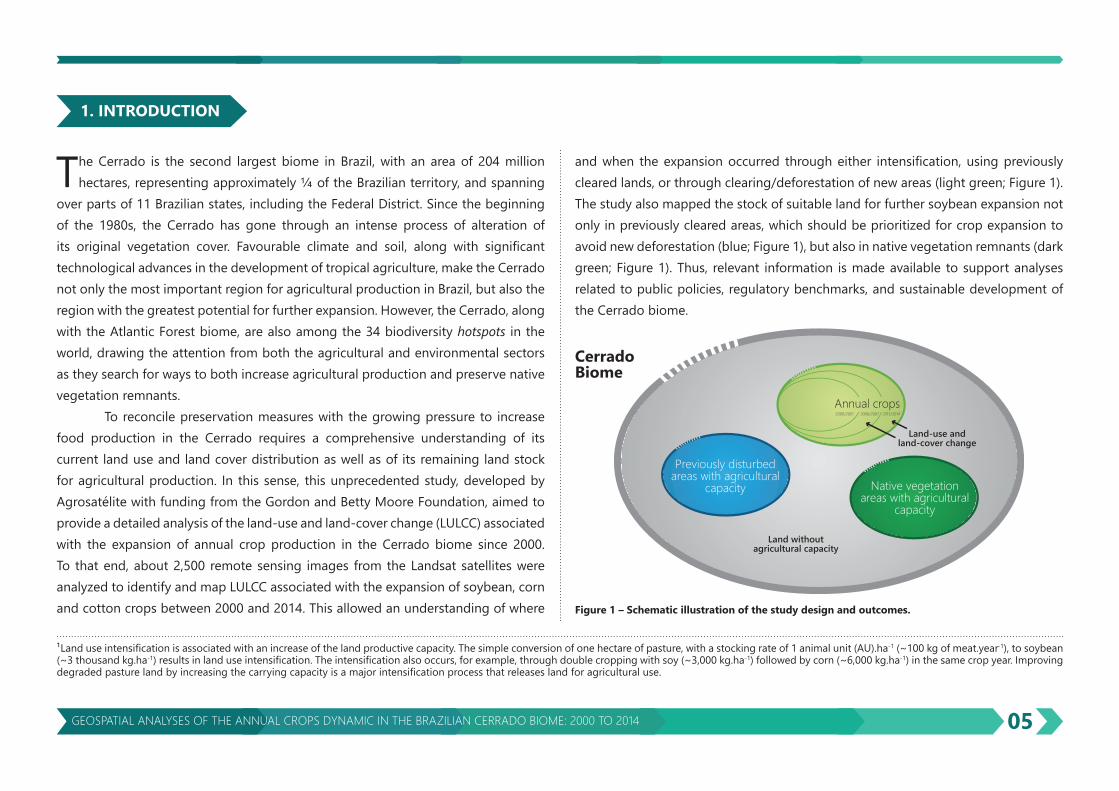
over parts of 11 Brazilian states, including the Federal District. Since the beginning of the 1980s, the Cerrado has gone through an intense process of alteration of its original vegetation cover. Favourable climate and soil, along with significant technological advances in the development of tropical agriculture, make the Cerrado not only the most important region for agricultural production in Brazil, but also the region with the greatest potential for further expansion. However, the Cerrado, along with the Atlantic Forest biome, are also among the 34 biodiversity hotspots in the world, drawing the attention from both the agricultural and environmental sectors as they search for ways to both increase agricultural production and preserve native vegetation remnants. To reconcile preservation measures with the growing pressure to increase food production in the Cerrado requires a comprehensive understanding of its current land use and land cover distribution as well as of its remaining land stock for agricultural production. In this sense, this unprecedented study, developed by Agrosatélite with funding from the Gordon and Betty Moore Foundation, aimed to provide a detailed analysis of the land-use and land-cover change (LULCC) associated with the expansion of annual crop production in the Cerrado biome since 2000. To that end, about 2,500 remote sensing images from the Landsat satellites were analyzed to identify and map LULCC associated with the expansion of soybean, corn and cotton crops between 2000 and 2014. This allowed an understanding of where
and when the expansion occurred through either intensification, using previously cleared lands, or through clearing/deforestation of new areas (light green; Figure 1). The study also mapped the stock of suitable land for further soybean expansion not only in previously cleared areas, which should be prioritized for crop expansion to avoid new deforestation (blue; Figure 1), but also in native vegetation remnants (dark green; Figure 1). Thus, relevant information is made available to support analyses related to public policies, regulatory benchmarks, and sustainable development of the Cerrado biome.
¹Land use intensification is associated with an increase of the land productive capacity. The simple conversion of one hectare of pasture, with a stocking rate of 1 animal unit (AU).ha-1 (~100 kg of meat.year-1), to soybean (~3 thousand kg.ha-1) results in land use intensification. The intensification also occurs, for example, through double cropping with soy (~3,000 kg.ha-1) followed by corn (~6,000 kg.ha-1) in the same crop year. Improving degraded pasture land by increasing the carrying capacity is a major intensification process that releases land for agricultural use.
Figure 1 – Schematic illustration of the study design and outcomes.
Cerrado Biome
Annual crops
Previously disturbed areas with agricultural
capacity Native vegetation areas with agricultural
capacity
2000/2001 2006/2007 2013/2014
Land-use and land-cover change
Land without
agricultural capacity
GEOSPATIAL ANALYSES OF THE ANNUAL CROPS DYNAMIC IN THE BRAZILIAN CERRADO BIOME: 2000 TO 2014
06
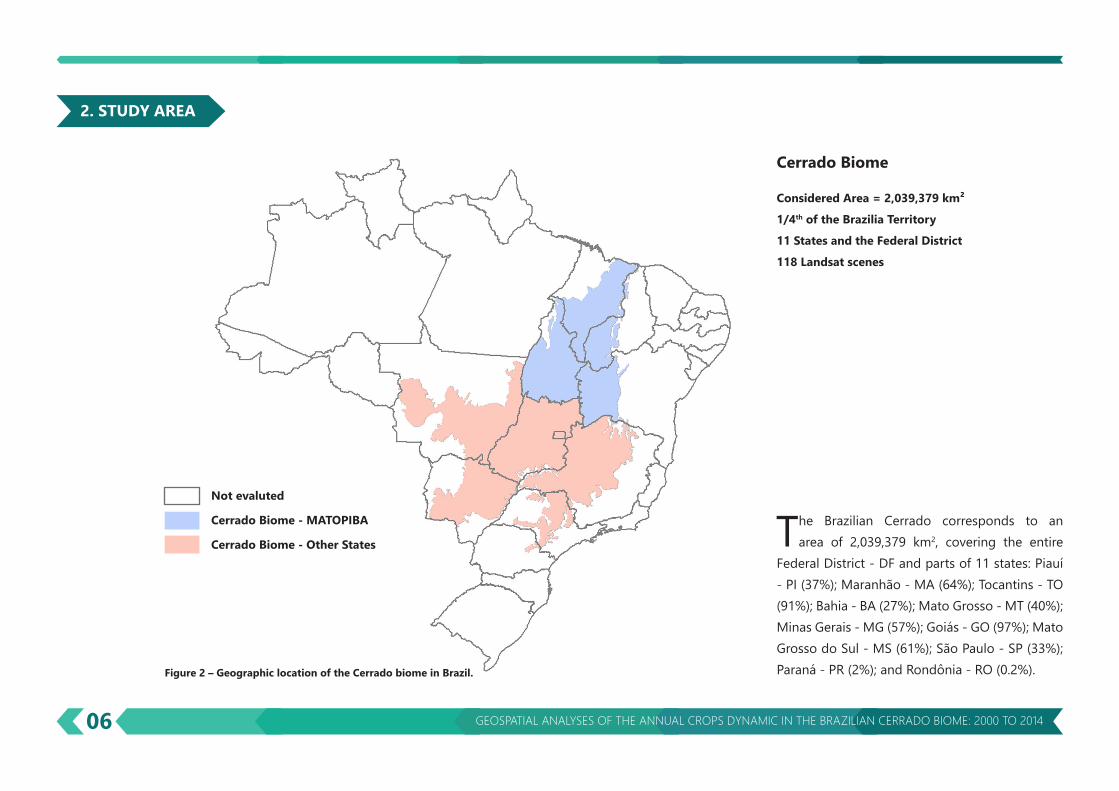
The Brazilian Cerrado corresponds to an area of 2,039,379 km2, covering the entire
Federal District - DF and parts of 11 states: Piauí - PI (37%); Maranhão - MA (64%); Tocantins - TO (91%); Bahia - BA (27%); Mato Grosso - MT (40%); Minas Gerais - MG (57%); Goiás - GO (97%); Mato Grosso do Sul - MS (61%); São Paulo - SP (33%); Paraná - PR (2%); and Rondônia - RO (0.2%).
2. STUDY AREA
Figure 2 – Geographic location of the Cerrado biome in Brazil.
Not evaluted
Cerrado Biome - MATOPIBA
Cerrado Biome - Other States
Considered Area = 2,039,379 km²
1/4th of the Brazilia Territory
11 States and the Federal District
118 Landsat scenes
Cerrado Biome
GEOSPATIAL ANALYSES OF THE ANNUAL CROPS DYNAMIC IN THE BRAZILIAN CERRADO BIOME: 2000 TO 2014
07
3. REMOTE SENSING DATA
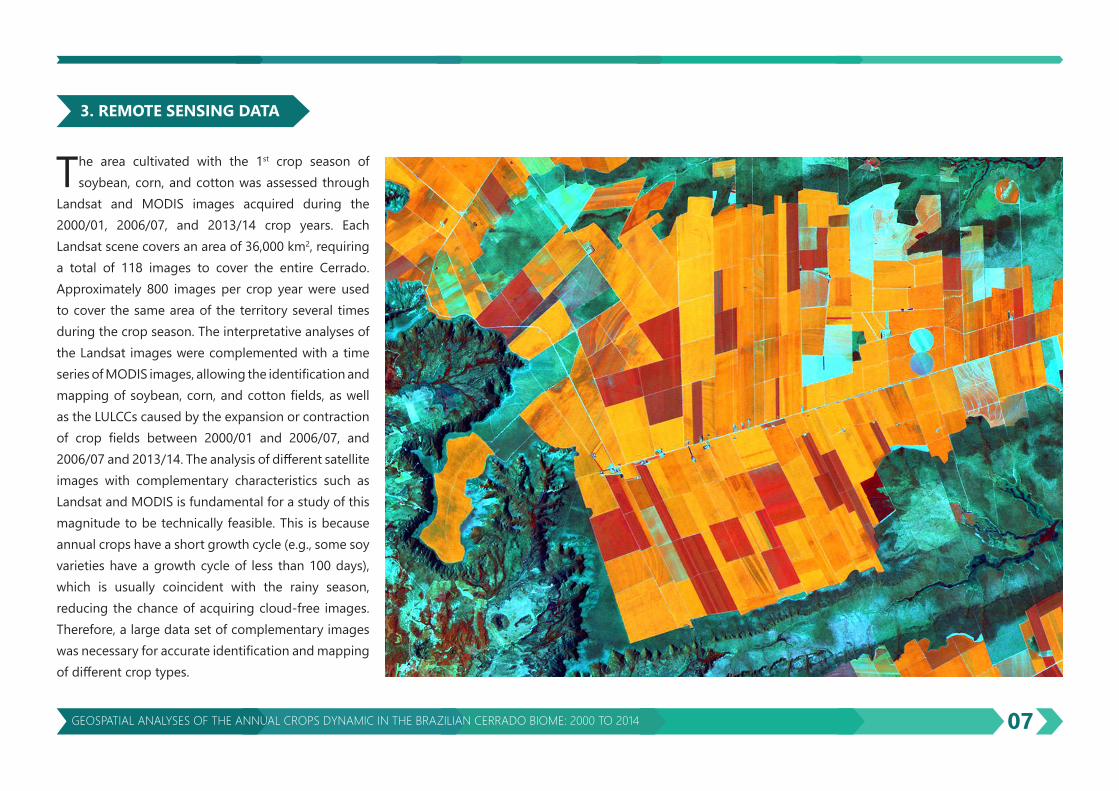
The area cultivated with the 1st crop season of soybean, corn, and cotton was assessed through
Landsat and MODIS images acquired during the 2000/01, 2006/07, and 2013/14 crop years. Each Landsat scene covers an area of 36,000 km2, requiring a total of 118 images to cover the entire Cerrado. Approximately 800 images per crop year were used to cover the same area of the territory several times during the crop season. The interpretative analyses of the Landsat images were complemented with a time series of MODIS images, allowing the identification and mapping of soybean, corn, and cotton fields, as well as the LULCCs caused by the expansion or contraction of crop fields between 2000/01 and 2006/07, and 2006/07 and 2013/14. The analysis of different satellite images with complementary characteristics such as Landsat and MODIS is fundamental for a study of this magnitude to be technically feasible. This is because annual crops have a short growth cycle (e.g., some soy varieties have a growth cycle of less than 100 days), which is usually coincident with the rainy season, reducing the chance of acquiring cloud-free images. Therefore, a large data set of complementary images was necessary for accurate identification and mapping of different crop types.
GEOSPATIAL ANALYSES OF THE ANNUAL CROPS DYNAMIC IN THE BRAZILIAN CERRADO BIOME: 2000 TO 2014
08
4. AGRICULTURAL DYNAMICS FROM 2000/01 TO 2013/14
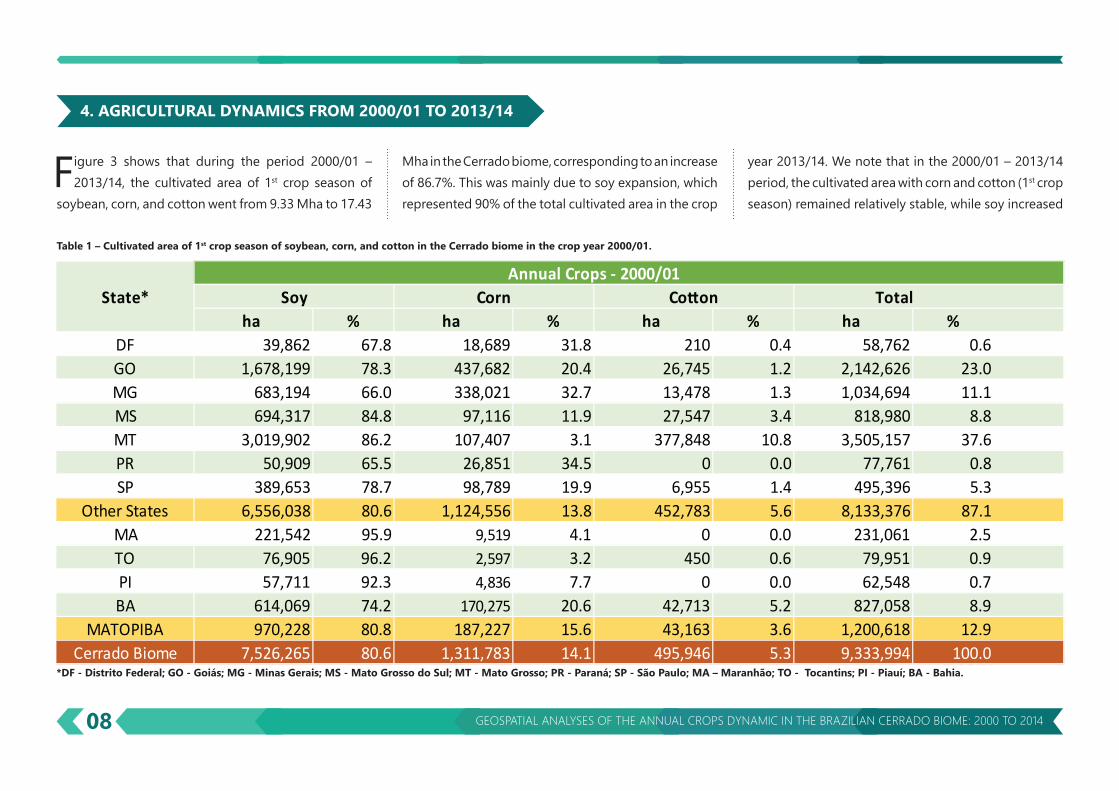
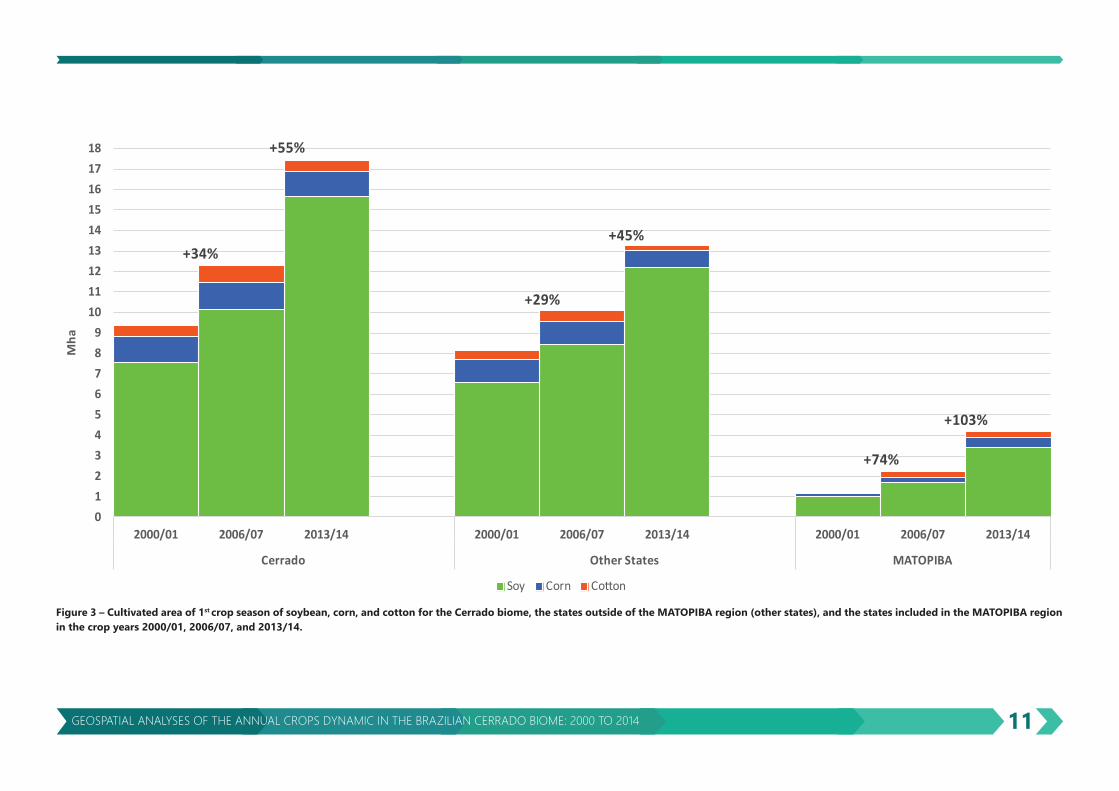
Figure 3 shows that during the period 2000/01 – 2013/14, the cultivated area of 1st crop season of
soybean, corn, and cotton went from 9.33 Mha to 17.43
Mha in the Cerrado biome, corresponding to an increase of 86.7%. This was mainly due to soy expansion, which represented 90% of the total cultivated area in the crop
year 2013/14. We note that in the 2000/01 – 2013/14 period, the cultivated area with corn and cotton (1st crop season) remained relatively stable, while soy increased
Table 1 – Cultivated area of 1st crop season of soybean, corn, and cotton in the Cerrado biome in the crop year 2000/01.
State*ha % ha % ha % ha %
DF 39,862 67.8 18,689 31.8 210 0.4 58,762 0.6GO 1,678,199 78.3 437,682 20.4 26,745 1.2 2,142,626 23.0MG 683,194 66.0 338,021 32.7 13,478 1.3 1,034,694 11.1MS 694,317 84.8 97,116 11.9 27,547 3.4 818,980 8.8MT 3,019,902 86.2 107,407 3.1 377,848 10.8 3,505,157 37.6PR 50,909 65.5 26,851 34.5 0 0.0 77,761 0.8SP 389,653 78.7 98,789 19.9 6,955 1.4 495,396 5.3
Other States 6,556,038 80.6 1,124,556 13.8 452,783 5.6 8,133,376 87.1MA 221,542 95.9 9,519 4.1 0 0.0 231,061 2.5TO 76,905 96.2 2,597 3.2 450 0.6 79,951 0.9PI 57,711 92.3 4,836 7.7 0 0.0 62,548 0.7BA 614,069 74.2 170,275 20.6 42,713 5.2 827,058 8.9
MATOPIBA 970,228 80.8 187,227 15.6 43,163 3.6 1,200,618 12.9Cerrado Biome 7,526,265 80.6 1,311,783 14.1 495,946 5.3 9,333,994 100.0
Annual Crops - 2000/01Soy Corn Cotton Total
GEOSPATIAL ANALYSES OF THE ANNUAL CROPS DYNAMIC IN THE BRAZILIAN CERRADO BIOME: 2000 TO 2014
*DF - Distrito Federal; GO - Goiás; MG - Minas Gerais; MS - Mato Grosso do Sul; MT - Mato Grosso; PR - Paraná; SP - São Paulo; MA – Maranhão; TO - Tocantins; PI - Piauí; BA - Bahia.
09
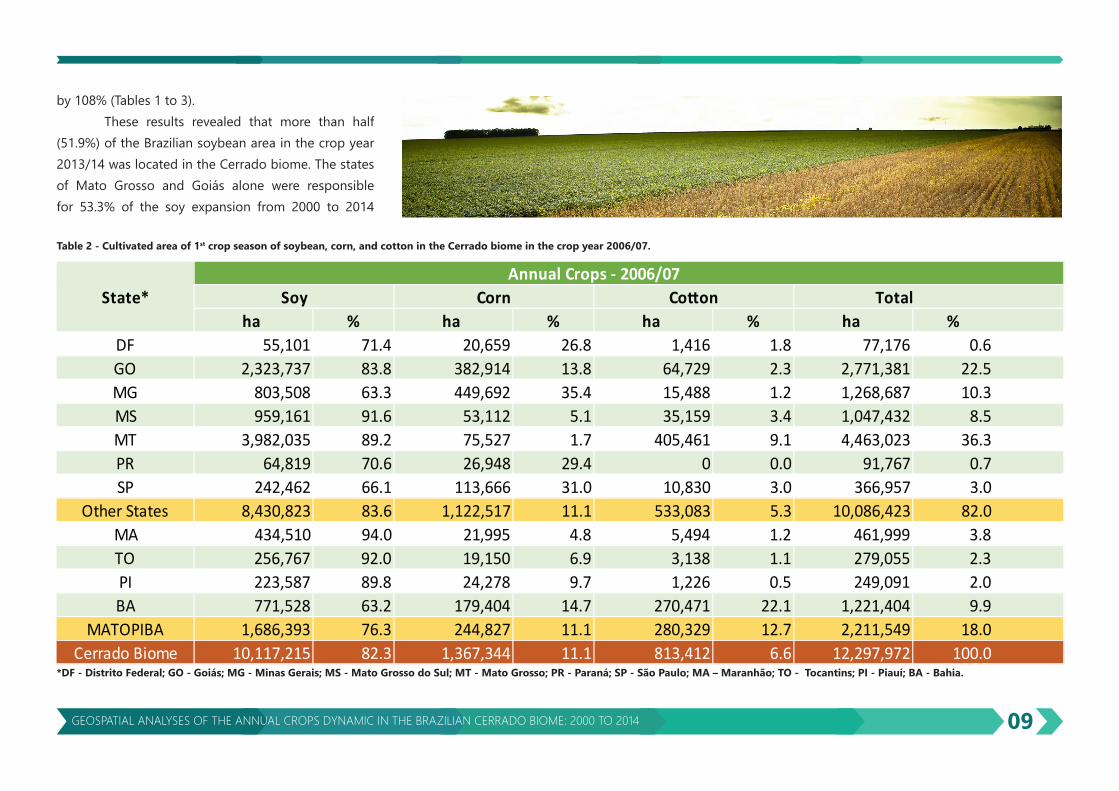
by 108% (Tables 1 to 3). These results revealed that more than half (51.9%) of the Brazilian soybean area in the crop year 2013/14 was located in the Cerrado biome. The states of Mato Grosso and Goiás alone were responsible for 53.3% of the soy expansion from 2000 to 2014
Table 2 - Cultivated area of 1st crop season of soybean, corn, and cotton in the Cerrado biome in the crop year 2006/07.
State*ha % ha % ha % ha %
DF 55,101 71.4 20,659 26.8 1,416 1.8 77,176 0.6GO 2,323,737 83.8 382,914 13.8 64,729 2.3 2,771,381 22.5MG 803,508 63.3 449,692 35.4 15,488 1.2 1,268,687 10.3MS 959,161 91.6 53,112 5.1 35,159 3.4 1,047,432 8.5MT 3,982,035 89.2 75,527 1.7 405,461 9.1 4,463,023 36.3PR 64,819 70.6 26,948 29.4 0 0.0 91,767 0.7SP 242,462 66.1 113,666 31.0 10,830 3.0 366,957 3.0
Other States 8,430,823 83.6 1,122,517 11.1 533,083 5.3 10,086,423 82.0MA 434,510 94.0 21,995 4.8 5,494 1.2 461,999 3.8TO 256,767 92.0 19,150 6.9 3,138 1.1 279,055 2.3PI 223,587 89.8 24,278 9.7 1,226 0.5 249,091 2.0BA 771,528 63.2 179,404 14.7 270,471 22.1 1,221,404 9.9
MATOPIBA 1,686,393 76.3 244,827 11.1 280,329 12.7 2,211,549 18.0Cerrado Biome 10,117,215 82.3 1,367,344 11.1 813,412 6.6 12,297,972 100.0
Soy Corn Cotton TotalAnnual Crops - 2006/07
GEOSPATIAL ANALYSES OF THE ANNUAL CROPS DYNAMIC IN THE BRAZILIAN CERRADO BIOME: 2000 TO 2014
*DF - Distrito Federal; GO - Goiás; MG - Minas Gerais; MS - Mato Grosso do Sul; MT - Mato Grosso; PR - Paraná; SP - São Paulo; MA – Maranhão; TO - Tocantins; PI - Piauí; BA - Bahia.
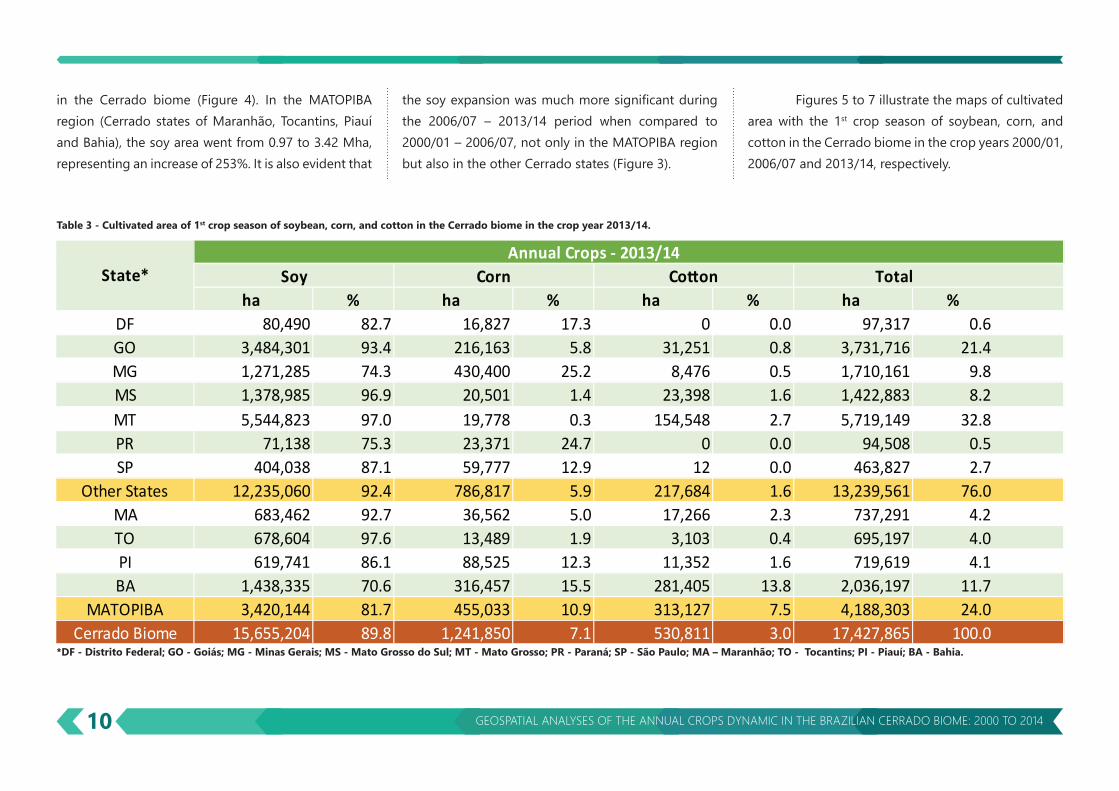
10
in the Cerrado biome (Figure 4). In the MATOPIBA region (Cerrado states of Maranhão, Tocantins, Piauí and Bahia), the soy area went from 0.97 to 3.42 Mha, representing an increase of 253%. It is also evident that
the soy expansion was much more significant during the 2006/07 – 2013/14 period when compared to 2000/01 – 2006/07, not only in the MATOPIBA region but also in the other Cerrado states (Figure 3).
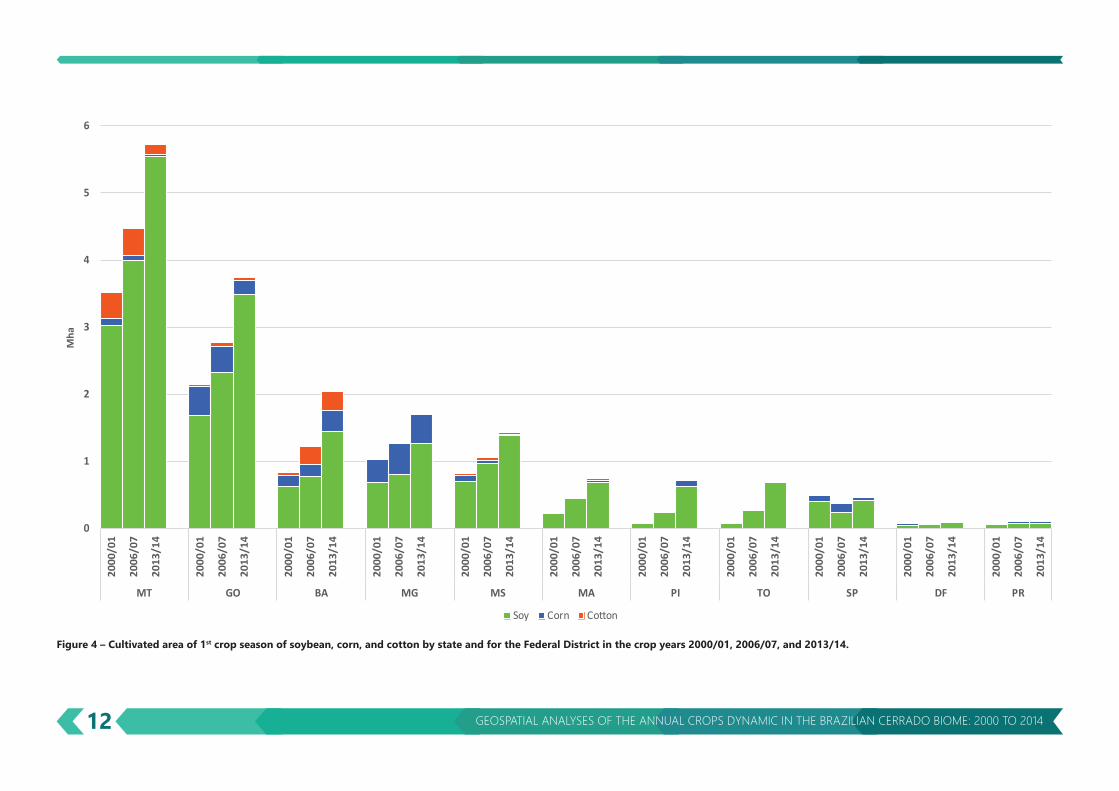
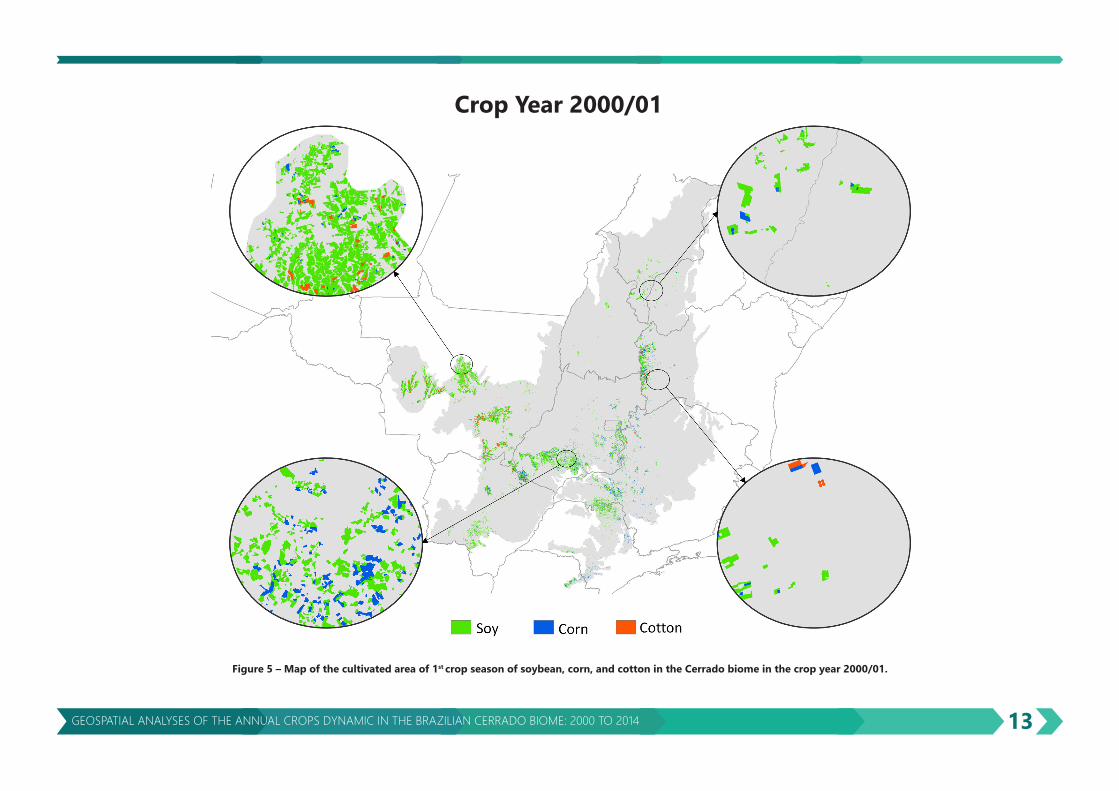
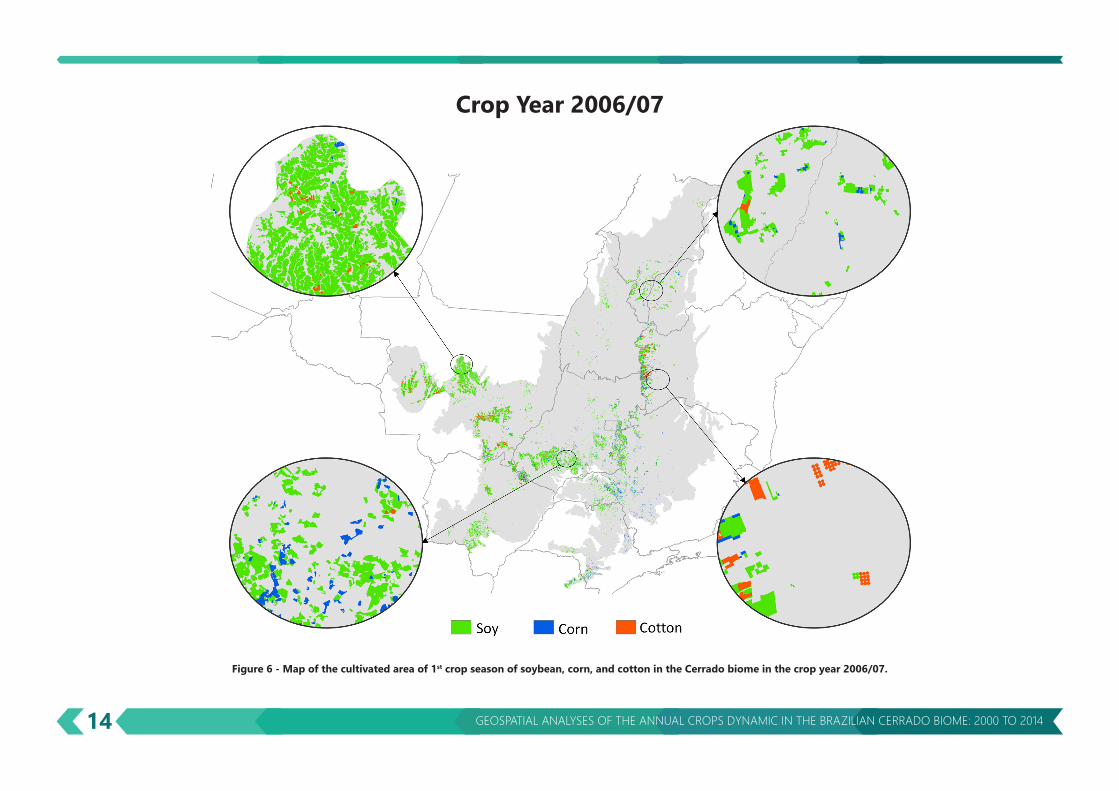
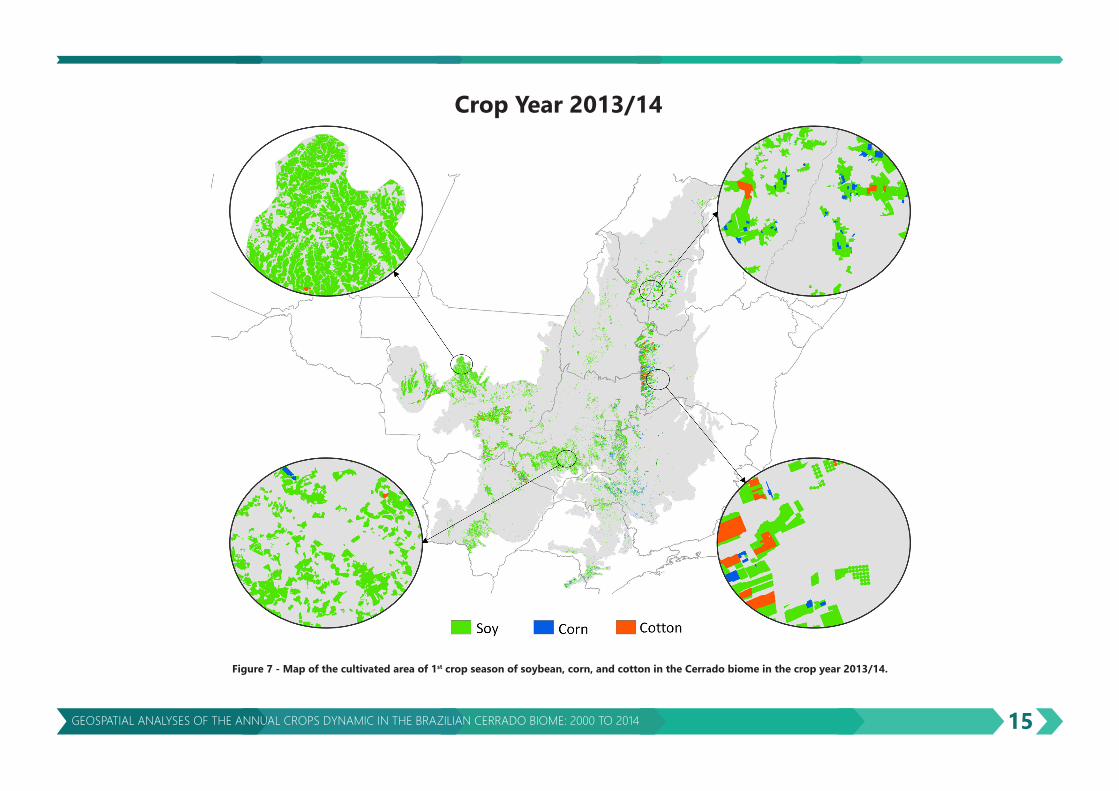
Figures 5 to 7 illustrate the maps of cultivated area with the 1st crop season of soybean, corn, and cotton in the Cerrado biome in the crop years 2000/01, 2006/07 and 2013/14, respectively.
ha % ha % ha % ha %DF 80,490 82.7 16,827 17.3 0 0.0 97,317 0.6GO 3,484,301 93.4 216,163 5.8 31,251 0.8 3,731,716 21.4MG 1,271,285 74.3 430,400 25.2 8,476 0.5 1,710,161 9.8MS 1,378,985 96.9 20,501 1.4 23,398 1.6 1,422,883 8.2MT 5,544,823 97.0 19,778 0.3 154,548 2.7 5,719,149 32.8PR 71,138 75.3 23,371 24.7 0 0.0 94,508 0.5SP 404,038 87.1 59,777 12.9 12 0.0 463,827 2.7
Other States 12,235,060 92.4 786,817 5.9 217,684 1.6 13,239,561 76.0MA 683,462 92.7 36,562 5.0 17,266 2.3 737,291 4.2TO 678,604 97.6 13,489 1.9 3,103 0.4 695,197 4.0PI 619,741 86.1 88,525 12.3 11,352 1.6 719,619 4.1BA 1,438,335 70.6 316,457 15.5 281,405 13.8 2,036,197 11.7
MATOPIBA 3,420,144 81.7 455,033 10.9 313,127 7.5 4,188,303 24.0Cerrado Biome 15,655,204 89.8 1,241,850 7.1 530,811 3.0 17,427,865 100.0
Cotton TotalAnnual Crops - 2013/14
State* Soy Corn
Table 3 - Cultivated area of 1st crop season of soybean, corn, and cotton in the Cerrado biome in the crop year 2013/14.
GEOSPATIAL ANALYSES OF THE ANNUAL CROPS DYNAMIC IN THE BRAZILIAN CERRADO BIOME: 2000 TO 2014
*DF - Distrito Federal; GO - Goiás; MG - Minas Gerais; MS - Mato Grosso do Sul; MT - Mato Grosso; PR - Paraná; SP - São Paulo; MA – Maranhão; TO - Tocantins; PI - Piauí; BA - Bahia.
11
Figure 3 – Cultivated area of 1st crop season of soybean, corn, and cotton for the Cerrado biome, the states outside of the MATOPIBA region (other states), and the states included in the MATOPIBA region in the crop years 2000/01, 2006/07, and 2013/14.
0123456789
101112131415161718
2000/01 2006/07 2013/14 2000/01 2006/07 2013/14 2000/01 2006/07 2013/14
Cerrado Other States MATOPIBA
Mha
Soy Corn Cotton
+34%
+55%
+29%
+45%
+74%
+103%
GEOSPATIAL ANALYSES OF THE ANNUAL CROPS DYNAMIC IN THE BRAZILIAN CERRADO BIOME: 2000 TO 2014
0
1
2
3
4
5
620
00/0
1
2006
/07
2013
/14
2000
/01
2006
/07
2013
/14
2000
/01
2006
/07
2013
/14
2000
/01
2006
/07
2013
/14
2000
/01
2006
/07
2013
/14
2000
/01
2006
/07
2013
/14
2000
/01
2006
/07
2013
/14
2000
/01
2006
/07
2013
/14
2000
/01
2006
/07
2013
/14
2000
/01
2006
/07
2013
/14
2000
/01
2006
/07
2013
/14
MT GO BA MG MS MA PI TO SP DF PR
Mha
Soy Corn Cotton
12
Figure 4 – Cultivated area of 1st crop season of soybean, corn, and cotton by state and for the Federal District in the crop years 2000/01, 2006/07, and 2013/14.
GEOSPATIAL ANALYSES OF THE ANNUAL CROPS DYNAMIC IN THE BRAZILIAN CERRADO BIOME: 2000 TO 2014
13
Figure 5 – Map of the cultivated area of 1st crop season of soybean, corn, and cotton in the Cerrado biome in the crop year 2000/01.
Crop Year 2000/01
GEOSPATIAL ANALYSES OF THE ANNUAL CROPS DYNAMIC IN THE BRAZILIAN CERRADO BIOME: 2000 TO 2014
14
Figure 6 - Map of the cultivated area of 1st crop season of soybean, corn, and cotton in the Cerrado biome in the crop year 2006/07.
Crop Year 2006/07
GEOSPATIAL ANALYSES OF THE ANNUAL CROPS DYNAMIC IN THE BRAZILIAN CERRADO BIOME: 2000 TO 2014
15
Figure 7 - Map of the cultivated area of 1st crop season of soybean, corn, and cotton in the Cerrado biome in the crop year 2013/14.
GEOSPATIAL ANALYSES OF THE ANNUAL CROPS DYNAMIC IN THE BRAZILIAN CERRADO BIOME: 2000 TO 2014
Crop Year 2013/14
16
5. LAND-USE AND LAND-COVER CHANGE DURING THE PERIODS 2000/01 - 2006/07 AND 2006/07 - 2013/14
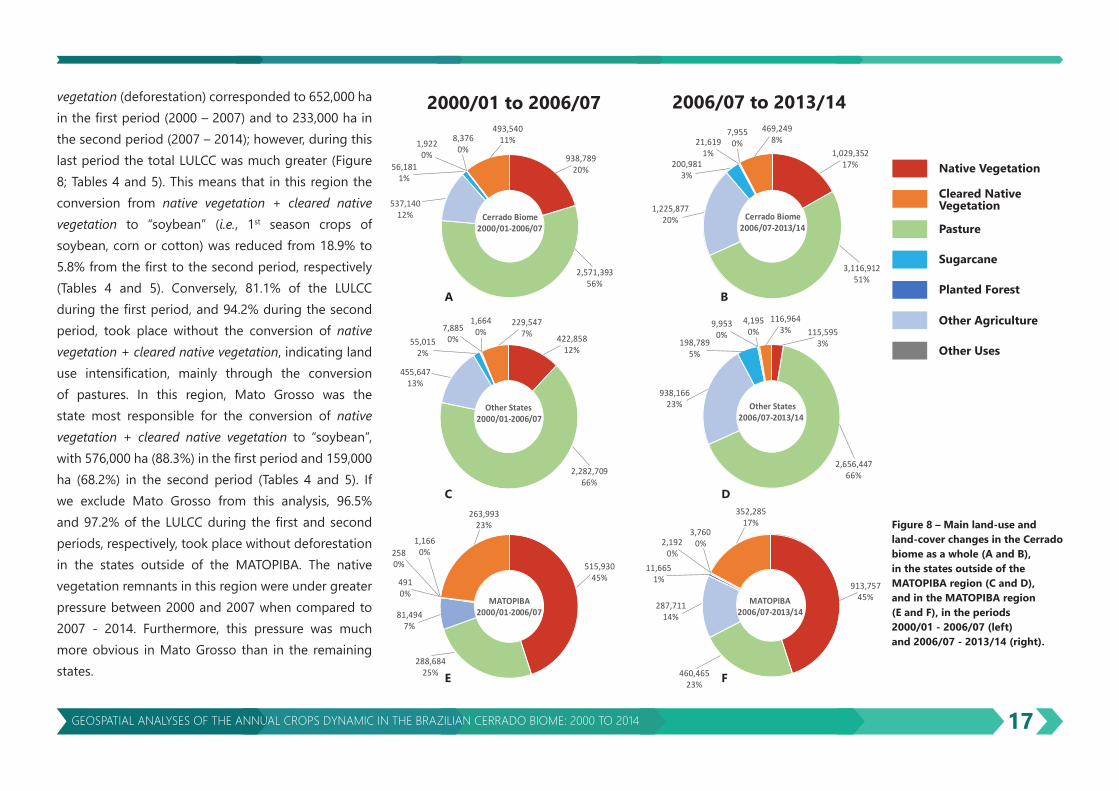
The land-use and land-cover change (LULCC) mapped in this study refers to the changes that
occurred as a result of the expansion of the 1st crop season of soybean, corn and cotton in the Cerrado biome. As previously observed, the increase of these annual crops between 2000 and 2014 was essentially due to the expansion of soy (8.13 Mha), given that the area of the 1st crop season of corn and cotton remained virtually the same. However, the LULCC occurred over 10.68 Mha, with 4.61 Mha being altered in the first period (2000 – 2007; Table 4) and 6.07 Mha in the second period (2007 – 2014; Table 5). This means that during the 2000 – 2014 period, in addition to the 8.13 Mha expansion of soybean, there were another 2.55 Mha of LULCC associated with more diverse transitions involving the 1st season crops of soybean, corn, and cotton. We highlight as an example the significant sugarcane expansion for ethanol production, as observed in the Cerrado since 2003. In this case, the expansion of sugarcane that occurred over degraded pastures may have gone through an intermediary condition of one or two years of soybean crop to improve the physical conditions of the soil. Another example is the use of soybean in a crop rotation process to renew old sugarcane fields. Still, the fact
that the cultivated area of 1st season crops of corn and cotton did not alter between 2000 and 2014 does not mean that they did not cause LULCC. For example, corn fields could have been substituted by soybean or even abandoned, migrating to new areas (see Figures 5, 6 and 7). The following classes of LULCC, which correspond to the changes caused by the 1st season crops of soy, corn, and cotton, were identified in the Landsat images and used in this study: native vegetation; pasture (cultivated); other agriculture (rice, fallow etc.); sugarcane; planted forest; cleared native vegetation (newly-cleared native vegetation); and other uses (urban, mining etc.). When comparing the LULCC in the two analyzed periods, we note that the classes pasture and other agriculture accounted for about 70% of the changes in the Cerrado biome (Figure 8). However, while in the
states outside of MATOPIBA these classes accounted for 80 to 89% of the expansion, in the MATOPIBA region the conversion of pasture + other agriculture was only 32 to 37% (Figure 8). This demonstrates that the MATOPIBA region has unique LULCC characteristics that have to be taken into account. For this reason, we divided the Cerrado biome into two separate regions for the analysis: 1) states outside of MATOPIBA, and 2) MATOPIBA. In the states outside the MATOPIBA, the LULCC resulting from native vegetation + cleared native
GEOSPATIAL ANALYSES OF THE ANNUAL CROPS DYNAMIC IN THE BRAZILIAN CERRADO BIOME: 2000 TO 2014
115,5953%
2,656,44766%
938,16623%
198,7895%
9,9530%
4,1950%
116,9643%
Other States2006/07-2013/14
913,75745%
460,46523%
287,71114%
2,1920%
11,6651%
3,7600%
352,28517%
MATOPIBA2006/07-2013/14
1,029,35217%
3,116,91251%
1,225,87720%
200,9813%
21,6191%
7,9550%
469,2498%
Cerrado Biome 2006/07-2013/14
422,85812%
2,282,70966%
455,64713%
55,0152%
7,8850%
1,6640%
229,5477%
Other States2000/01-2006/07
515,93045%
288,68425%
81,4947%
1,1660%
4910%
2580%
263,99323%
MATOPIBA2000/01-2006/07
938,78920%
2,571,39356%
537,14012%
56,1811%
8,3760%1,922
0%
493,54011%
Cerrado Biome 2000/01-2006/07
17
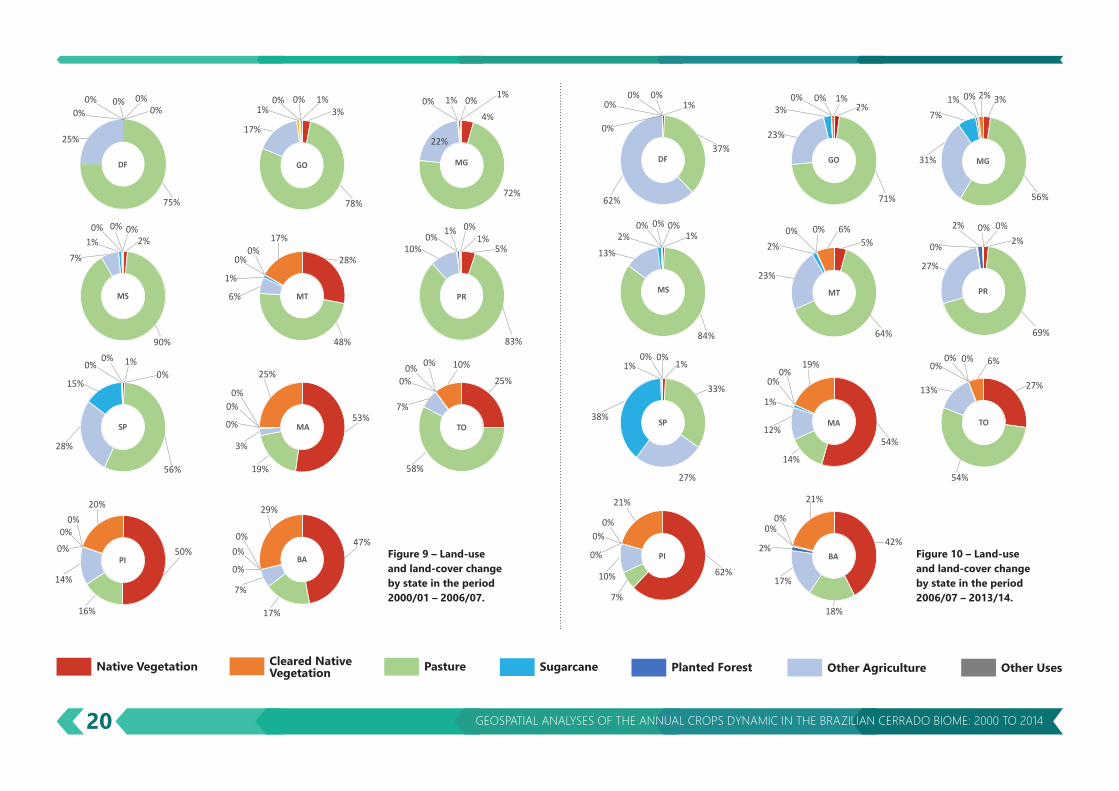
vegetation (deforestation) corresponded to 652,000 ha in the first period (2000 – 2007) and to 233,000 ha in the second period (2007 – 2014); however, during this last period the total LULCC was much greater (Figure 8; Tables 4 and 5). This means that in this region the conversion from native vegetation + cleared native vegetation to “soybean” (i.e., 1st season crops of soybean, corn or cotton) was reduced from 18.9% to 5.8% from the first to the second period, respectively (Tables 4 and 5). Conversely, 81.1% of the LULCC during the first period, and 94.2% during the second period, took place without the conversion of native vegetation + cleared native vegetation, indicating land use intensification, mainly through the conversion of pastures. In this region, Mato Grosso was the state most responsible for the conversion of native vegetation + cleared native vegetation to “soybean”, with 576,000 ha (88.3%) in the first period and 159,000 ha (68.2%) in the second period (Tables 4 and 5). If we exclude Mato Grosso from this analysis, 96.5% and 97.2% of the LULCC during the first and second periods, respectively, took place without deforestation in the states outside of the MATOPIBA. The native vegetation remnants in this region were under greater pressure between 2000 and 2007 when compared to 2007 - 2014. Furthermore, this pressure was much more obvious in Mato Grosso than in the remaining states.
2000/01 to 2006/07 2006/07 to 2013/14
Figure 8 – Main land-use and land-cover changes in the Cerrado biome as a whole (A and B), in the states outside of the MATOPIBA region (C and D), and in the MATOPIBA region (E and F), in the periods 2000/01 - 2006/07 (left) and 2006/07 - 2013/14 (right).
Native Vegetation
Sugarcane
Cleared Native Vegetation
Pasture
Planted Forest
Other Agriculture
Other Uses
A B
C D
E F
GEOSPATIAL ANALYSES OF THE ANNUAL CROPS DYNAMIC IN THE BRAZILIAN CERRADO BIOME: 2000 TO 2014
18
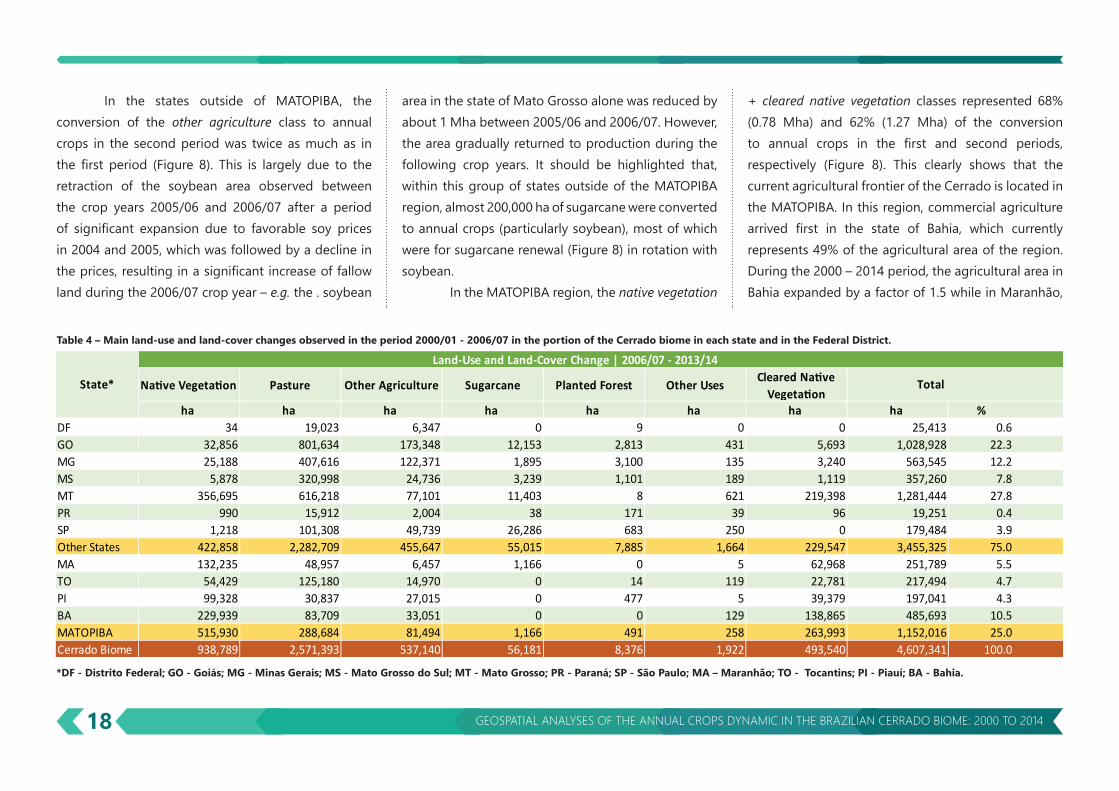
In the states outside of MATOPIBA, the conversion of the other agriculture class to annual crops in the second period was twice as much as in the first period (Figure 8). This is largely due to the retraction of the soybean area observed between the crop years 2005/06 and 2006/07 after a period of significant expansion due to favorable soy prices in 2004 and 2005, which was followed by a decline in the prices, resulting in a significant increase of fallow land during the 2006/07 crop year – e.g. the . soybean
area in the state of Mato Grosso alone was reduced by about 1 Mha between 2005/06 and 2006/07. However, the area gradually returned to production during the following crop years. It should be highlighted that, within this group of states outside of the MATOPIBA region, almost 200,000 ha of sugarcane were converted to annual crops (particularly soybean), most of which were for sugarcane renewal (Figure 8) in rotation with soybean. In the MATOPIBA region, the native vegetation
+ cleared native vegetation classes represented 68% (0.78 Mha) and 62% (1.27 Mha) of the conversion to annual crops in the first and second periods, respectively (Figure 8). This clearly shows that the current agricultural frontier of the Cerrado is located in the MATOPIBA. In this region, commercial agriculture arrived first in the state of Bahia, which currently represents 49% of the agricultural area of the region. During the 2000 – 2014 period, the agricultural area in Bahia expanded by a factor of 1.5 while in Maranhão,
Table 4 – Main land-use and land-cover changes observed in the period 2000/01 - 2006/07 in the portion of the Cerrado biome in each state and in the Federal District.
Native Vegetation Pasture Other Agriculture Sugarcane Planted Forest Other Uses Cleared Native Vegetation
ha ha ha ha ha ha ha ha %DF 34 19,023 6,347 0 9 0 0 25,413 0.6GO 32,856 801,634 173,348 12,153 2,813 431 5,693 1,028,928 22.3MG 25,188 407,616 122,371 1,895 3,100 135 3,240 563,545 12.2MS 5,878 320,998 24,736 3,239 1,101 189 1,119 357,260 7.8MT 356,695 616,218 77,101 11,403 8 621 219,398 1,281,444 27.8PR 990 15,912 2,004 38 171 39 96 19,251 0.4SP 1,218 101,308 49,739 26,286 683 250 0 179,484 3.9Other States 422,858 2,282,709 455,647 55,015 7,885 1,664 229,547 3,455,325 75.0MA 132,235 48,957 6,457 1,166 0 5 62,968 251,789 5.5TO 54,429 125,180 14,970 0 14 119 22,781 217,494 4.7PI 99,328 30,837 27,015 0 477 5 39,379 197,041 4.3BA 229,939 83,709 33,051 0 0 129 138,865 485,693 10.5MATOPIBA 515,930 288,684 81,494 1,166 491 258 263,993 1,152,016 25.0Cerrado Biome 938,789 2,571,393 537,140 56,181 8,376 1,922 493,540 4,607,341 100.0
State*
Land-Use and Land-Cover Change | 2006/07 - 2013/14
Total
GEOSPATIAL ANALYSES OF THE ANNUAL CROPS DYNAMIC IN THE BRAZILIAN CERRADO BIOME: 2000 TO 2014
*DF - Distrito Federal; GO - Goiás; MG - Minas Gerais; MS - Mato Grosso do Sul; MT - Mato Grosso; PR - Paraná; SP - São Paulo; MA – Maranhão; TO - Tocantins; PI - Piauí; BA - Bahia.
19
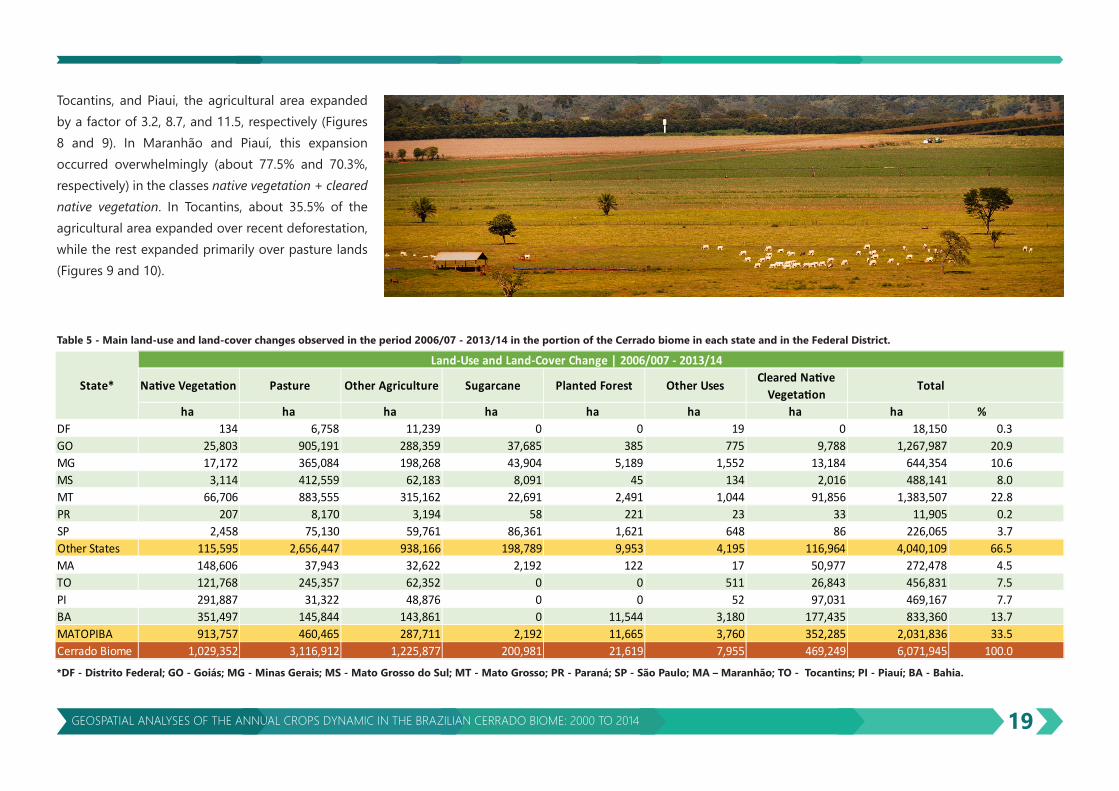
Table 5 - Main land-use and land-cover changes observed in the period 2006/07 - 2013/14 in the portion of the Cerrado biome in each state and in the Federal District.
Native Vegetation Pasture Other Agriculture Sugarcane Planted Forest Other Uses Cleared Native Vegetation
ha ha ha ha ha ha ha ha %DF 134 6,758 11,239 0 0 19 0 18,150 0.3GO 25,803 905,191 288,359 37,685 385 775 9,788 1,267,987 20.9MG 17,172 365,084 198,268 43,904 5,189 1,552 13,184 644,354 10.6MS 3,114 412,559 62,183 8,091 45 134 2,016 488,141 8.0MT 66,706 883,555 315,162 22,691 2,491 1,044 91,856 1,383,507 22.8PR 207 8,170 3,194 58 221 23 33 11,905 0.2SP 2,458 75,130 59,761 86,361 1,621 648 86 226,065 3.7Other States 115,595 2,656,447 938,166 198,789 9,953 4,195 116,964 4,040,109 66.5MA 148,606 37,943 32,622 2,192 122 17 50,977 272,478 4.5TO 121,768 245,357 62,352 0 0 511 26,843 456,831 7.5PI 291,887 31,322 48,876 0 0 52 97,031 469,167 7.7BA 351,497 145,844 143,861 0 11,544 3,180 177,435 833,360 13.7MATOPIBA 913,757 460,465 287,711 2,192 11,665 3,760 352,285 2,031,836 33.5Cerrado Biome 1,029,352 3,116,912 1,225,877 200,981 21,619 7,955 469,249 6,071,945 100.0
State*
Land-Use and Land-Cover Change | 2006/007 - 2013/14
Total
Tocantins, and Piaui, the agricultural area expanded by a factor of 3.2, 8.7, and 11.5, respectively (Figures 8 and 9). In Maranhão and Piauí, this expansion occurred overwhelmingly (about 77.5% and 70.3%, respectively) in the classes native vegetation + cleared native vegetation. In Tocantins, about 35.5% of the agricultural area expanded over recent deforestation, while the rest expanded primarily over pasture lands (Figures 9 and 10).
GEOSPATIAL ANALYSES OF THE ANNUAL CROPS DYNAMIC IN THE BRAZILIAN CERRADO BIOME: 2000 TO 2014
*DF - Distrito Federal; GO - Goiás; MG - Minas Gerais; MS - Mato Grosso do Sul; MT - Mato Grosso; PR - Paraná; SP - São Paulo; MA – Maranhão; TO - Tocantins; PI - Piauí; BA - Bahia.
20
2%
90%
7%1%
0% 0% 0%
MS
0%
75%
25%
0%0%
0%0%
DF
28%
48%
6%
1%
0%0%
17%
MT
3%
78%
17%
1%0% 0% 1%
GO
5%
83%
10%0%
1% 0%1%
PR
4%
72%
22%
0% 1% 0%1%
MG
1%
56%
28%
15%
0%0%
0%
SP53%
19%
3%
0%
0%
0%
25%
MA
25%
58%
7%
0%0%
0% 10%
TO
50%
16%
14%
0%
0%0%
20%
PI
47%
17%
7%
0%0%
0%
29%
BA
Native Vegetation SugarcaneCleared NativeVegetation Pasture Planted Forest Other Agriculture Other Uses
1%
84%
13%
2%0% 0% 0%
MS
1%
37%
62%
0%0%0%
0%
DF
5%
64%
23%
2%0% 0% 6%
MT
2%
71%
23%
3%0% 0% 1%
GO
2%
69%
27%
0%
2% 0% 0%
PR
3%
56%
31%
7%1% 0% 2%
MG
1%
33%
27%
38%
1%0% 0%
SP
54%
14%
12%
1%
0%0%
19%
MA
27%
54%
13%
0%0% 0% 6%
TO
62%
7%
10%
0%
0%0%
21%
PI42%
18%
17%
0%
2%
0%
21%
BAFigure 9 – Land-use and land-cover change by state in the period 2000/01 – 2006/07.
Figure 10 – Land-use and land-cover change by state in the period 2006/07 – 2013/14.
GEOSPATIAL ANALYSES OF THE ANNUAL CROPS DYNAMIC IN THE BRAZILIAN CERRADO BIOME: 2000 TO 2014
21
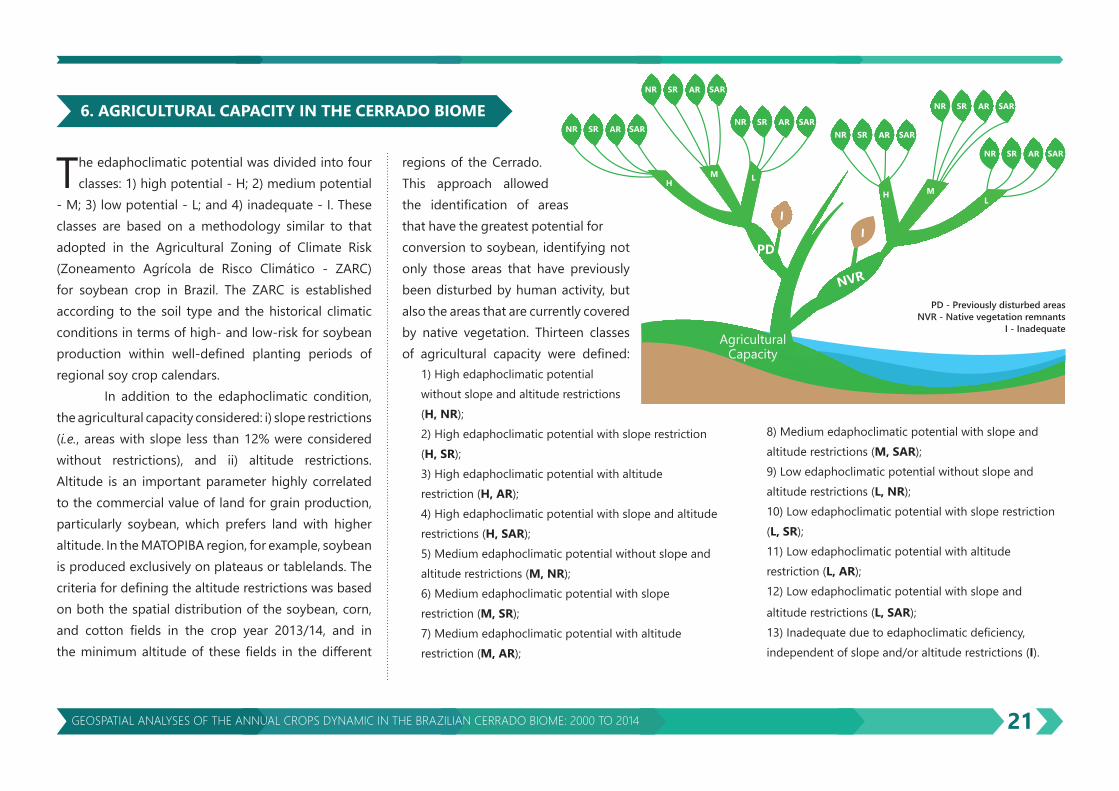
6. AGRICULTURAL CAPACITY IN THE CERRADO BIOME
The edaphoclimatic potential was divided into four classes: 1) high potential - H; 2) medium potential
- M; 3) low potential - L; and 4) inadequate - I. These classes are based on a methodology similar to that adopted in the Agricultural Zoning of Climate Risk (Zoneamento Agrícola de Risco Climático - ZARC) for soybean crop in Brazil. The ZARC is established according to the soil type and the historical climatic conditions in terms of high- and low-risk for soybean production within well-defined planting periods of regional soy crop calendars. In addition to the edaphoclimatic condition, the agricultural capacity considered: i) slope restrictions (i.e., areas with slope less than 12% were considered without restrictions), and ii) altitude restrictions. Altitude is an important parameter highly correlated to the commercial value of land for grain production, particularly soybean, which prefers land with higher altitude. In the MATOPIBA region, for example, soybean is produced exclusively on plateaus or tablelands. The criteria for defining the altitude restrictions was based on both the spatial distribution of the soybean, corn, and cotton fields in the crop year 2013/14, and in the minimum altitude of these fields in the different
regions of the Cerrado. This approach allowed the identification of areas that have the greatest potential for conversion to soybean, identifying not only those areas that have previously been disturbed by human activity, but also the areas that are currently covered by native vegetation. Thirteen classes of agricultural capacity were defined:
1) High edaphoclimatic potential without slope and altitude restrictions (H, NR);2) High edaphoclimatic potential with slope restriction (H, SR);3) High edaphoclimatic potential with altitude restriction (H, AR);4) High edaphoclimatic potential with slope and altitude restrictions (H, SAR);5) Medium edaphoclimatic potential without slope and altitude restrictions (M, NR);6) Medium edaphoclimatic potential with slope restriction (M, SR);7) Medium edaphoclimatic potential with altitude restriction (M, AR);
8) Medium edaphoclimatic potential with slope and altitude restrictions (M, SAR);9) Low edaphoclimatic potential without slope and altitude restrictions (L, NR);10) Low edaphoclimatic potential with slope restriction (L, SR);11) Low edaphoclimatic potential with altitude restriction (L, AR);12) Low edaphoclimatic potential with slope and
altitude restrictions (L, SAR);13) Inadequate due to edaphoclimatic deficiency, independent of slope and/or altitude restrictions (I).
NR
I
PD
NVR
PD - Previously disturbed areasNVR - Native vegetation remnants
I - Inadequate
I
SR AR SAR
HM L
LM
NR SR AR SAR
NR SR AR SARNR SR AR SAR
NR SR AR SAR
NR SR AR SAR
GEOSPATIAL ANALYSES OF THE ANNUAL CROPS DYNAMIC IN THE BRAZILIAN CERRADO BIOME: 2000 TO 2014
AgriculturalCapacity
H
22
Based on the 13 classes, we verified that 81.5% of the 1st crop season of soybean, corn, and cotton in the crop year 2013/14 were found in the class of high edaphoclimatic potential without slope and altitude restrictions (H, NR), which are the areas of greatest commercial value for agriculture. The class of medium edaphoclimatic potential without slope and altitude restrictions (M, NR) ranked in second place, representing 11.0% of the area of these annual crops. Therefore, more than 90% of the current fields were found in only two classes of edaphoclimatic potential (high and medium), both without slope and altitude restrictions.
6.1. AGRICULTURAL CAPACITY OF CURRENT NATIVE VEGETATION AREAS
Figure 11 illustrates the land stock with high, medium and low agricultural capacity for production of annual crops, and without slope and altitude restrictions, which are currently covered by native vegetation in the states outside of the MATOPIBA region (other states) and within the MATOPIBA region. The current area of native vegetation with high agricultural capacity and without slope or altitude restrictions represents 8.4% (10.05 Mha) and 8.1% (5.40 Mha)
of the total area of the states outside of MATOPIBA and within the MATOPIBA, respectively. This indicates that, in relative terms, the native vegetation land stock with high agricultural capacity is as exhausted in the MATOPIBA region as it is in the other states. Of the 36.7 Mha of Cerrado land inadequate for agricultural use, 24.7 Mha are covered by native vegetation remnants (NVR), while 12.1 Mha were previously disturbed by human activity (Table 7). The region outside of MATOPIBA (other states)
contains similar amounts of agriculturally inadequate land with and without NVR, being 6.53 and 6.03 Mha, respectively. Of the agriculturally inadequate land within the MATOPIBA region, the area with NVR is almost three times larger (18.1 Mha) than the area without NVR (6.0 Mha).
6.2. AGRICULTURAL CAPACITY OF PREVIOUSLY DISTURBED AREAS
Figure 12 illustrates the land stock with high, medium and low agricultural capacity for annual crops, and without slope and altitude restrictions in areas previously disturbed by human activity in the states outside of the MATOPIBA region (other states) and in the MATOPIBA region. We note that the available land with high agricultural capacity without slope and altitude restrictions in the states outside the MATOPIBA
Figure 11 – Land stock with high (H), medium (M) and low (L) agricultural capacity, without slope and altitude restrictions (NR) for annual crops in states outside of the MATOPIBA region (other states), and in the MATOPIBA region, in areas of native vegetation remnants (NVR).
10,049,81852%
1,452,0407%
1,438,9857%
6,530,85834%
OtherStates
5,398,27320%
2,021,1447%
1,763,4997%
18,139,65366%
MATOPIBA
NVR, H, NR NVR, M, NR NVR, L, NR NVR, I
GEOSPATIAL ANALYSES OF THE ANNUAL CROPS DYNAMIC IN THE BRAZILIAN CERRADO BIOME: 2000 TO 2014
23
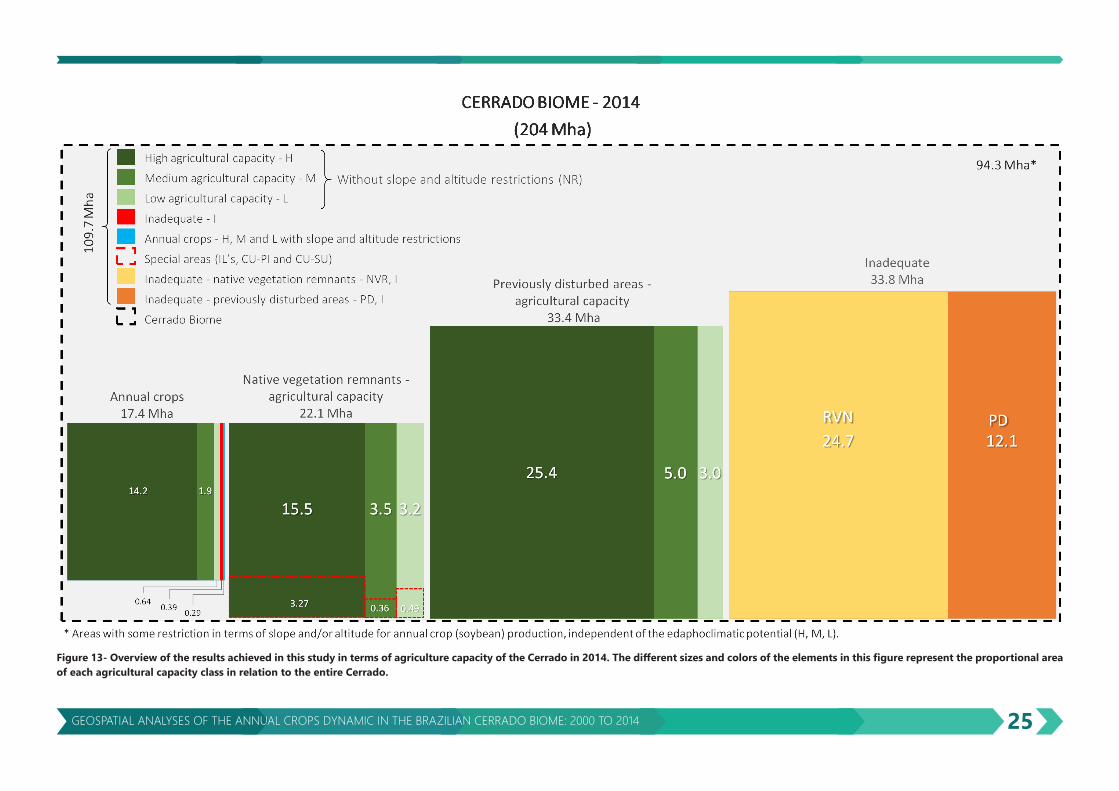
region corresponds to 18.9% (22.55 Mha), while this land stock within the MATOPIBA region amounts to only 4.2% (2.81 Mha). When considering the entire Cerrado biome, this land stock represents 25.4 Mha (Figure 13), around 5 Mha of which are cultivated with sugarcane, and the remaining area is primarily pasture. Considering that the pasture is a less demanding land use with respect to edaphoclimatic conditions, and is also less restrictive in terms of slope and altitude, there is still an enormous stock of disturbed land whose use can be prioritized for the intensification process of cattle ranching in the Cerrado biome. Figure 13 presents an overview of the results achieved in this study in terms of agriculture capacity of the Cerrado. The different sizes and colors of the elements in this figure represent the proportional area of each agricultural capacity class in relation to the Cerrado as a whole. The gray area in Figure 13 represents the 94.3 Mha that have some restriction in terms of slope and/or altitude for annual crop (soybean) production, independent of the edaphoclimatic potential. Areas inadequate for annual crop production due to their edaphoclimatic condition correspond to 36.8 Mha. Of that total 24.7 Mha are covered by native vegetation (yellow; Figure 13), and 21.1 Mha were previously disturbed by human activity (orange; Figure 13). The current land stock of native vegetation cover with agricultural capacity for annual
crop production, without slope and altitude restrictions, amounts 12.1 Mha, of which there are 4.1 Mha located in special areas (indigenous lands or conservation units; Figure 13). Most important for annual crop expansion in the Cerrado biome are the 33.4 Mha of previously disturbed areas with high, medium and low agricultural capacity without slope and altitude restrictions, of which 25.36 Mha (76%) have high agricultural capacity (Figure 13). These areas are the ones that should be prioritized for the Brazilian soy expansion. Figure 13 also illustrates the 17.4 Mha that were occupied by annual crops under different agricultural capacity conditions in the crop year 2013/14. It should be highlighted that the previously disturbed land with high agricultural capacity for annual crop production is very important for the Brazilian soybean expansion because the Atlantic Forest biome has almost exhausted its potential for expansion, and there are restrictions for expansion in the Amazon biome (due to the Soy Moratorium and other measures to contain deforestation). For example, during the period 2006/07 - 2013/14, the Brazilian
soybean area increased by 9.5 Mha. Of that total, 5.5 Mha (58%) were in the Cerrado biome; approximately 2 Mha (21%) were in the Amazon biome; and the other 2 Mha (21%) were mainly in traditional soy production regions in the Atlantic Forest biome, where the stock of land for expansion has been continuously declining. Finally, we must emphasize that the present study provides detailed information from the local to the regional scale, about the agricultural capacity associated not only to slope and/or altitude restrictions, but also to current land use and land cover for the entire Cerrado biome.
Figure 12 – Land stock with high (H), medium (M) and low (L) agricultural capacity, without slope and altitude restrictions (NR) for annual crops outside the MATOPIBA region (other states), and within the MATOPIBA region, in previously disturbed areas (PD).
22,549,98164%
4,243,45512%
2,373,0557%
6,028,34817%
OtherStates
2,813,70427%
771,5488%
645,7266%
6,033,60559%
MATOPIBA
PD, H, NR PD, M, NR PD, L, NR PD, I
GEOSPATIAL ANALYSES OF THE ANNUAL CROPS DYNAMIC IN THE BRAZILIAN CERRADO BIOME: 2000 TO 2014
24
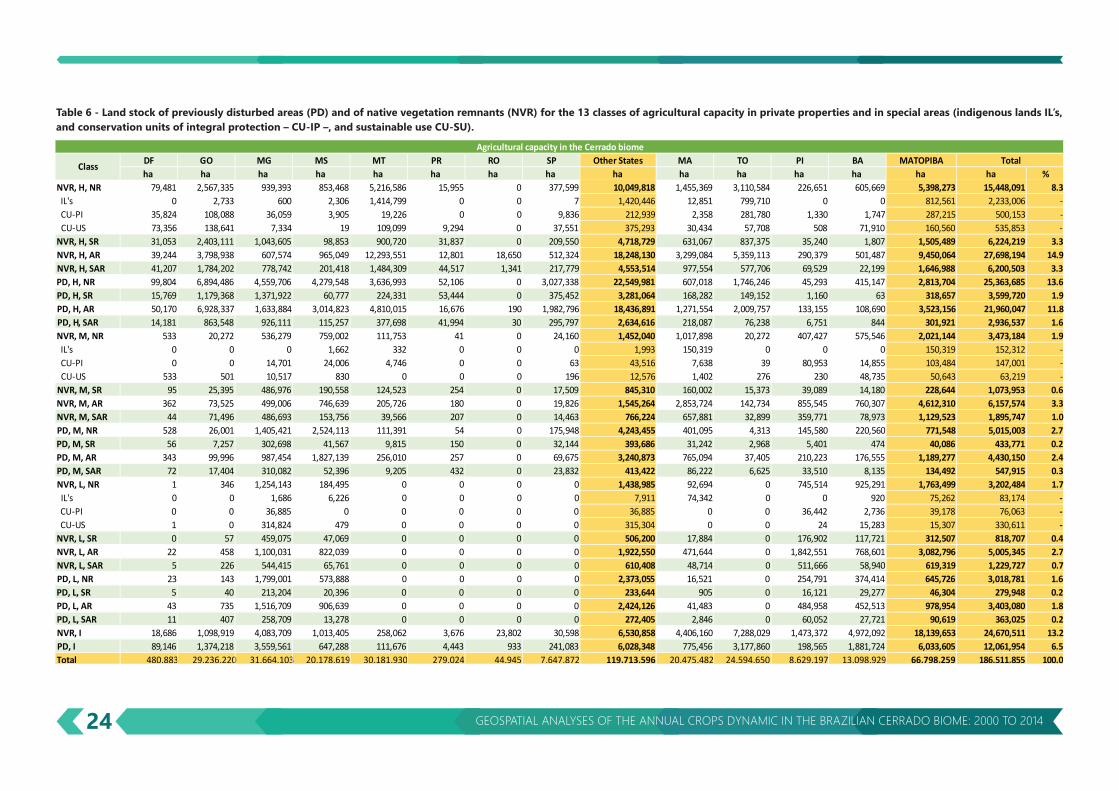
Table 6 - Land stock of previously disturbed areas (PD) and of native vegetation remnants (NVR) for the 13 classes of agricultural capacity in private properties and in special areas (indigenous lands IL’s, and conservation units of integral protection – CU-IP –, and sustainable use CU-SU).
DF GO MG MS MT PR RO SP Other States MA TO PI BA MATOPIBAha ha ha ha ha ha ha ha ha ha ha ha ha ha ha %
NVR, H, NR 79,481 2,567,335 939,393 853,468 5,216,586 15,955 0 377,599 10,049,818 1,455,369 3,110,584 226,651 605,669 5,398,273 15,448,091 8.3 IL's 0 2,733 600 2,306 1,414,799 0 0 7 1,420,446 12,851 799,710 0 0 812,561 2,233,006 - CU-PI 35,824 108,088 36,059 3,905 19,226 0 0 9,836 212,939 2,358 281,780 1,330 1,747 287,215 500,153 - CU-US 73,356 138,641 7,334 19 109,099 9,294 0 37,551 375,293 30,434 57,708 508 71,910 160,560 535,853 -NVR, H, SR 31,053 2,403,111 1,043,605 98,853 900,720 31,837 0 209,550 4,718,729 631,067 837,375 35,240 1,807 1,505,489 6,224,219 3.3NVR, H, AR 39,244 3,798,938 607,574 965,049 12,293,551 12,801 18,650 512,324 18,248,130 3,299,084 5,359,113 290,379 501,487 9,450,064 27,698,194 14.9NVR, H, SAR 41,207 1,784,202 778,742 201,418 1,484,309 44,517 1,341 217,779 4,553,514 977,554 577,706 69,529 22,199 1,646,988 6,200,503 3.3PD, H, NR 99,804 6,894,486 4,559,706 4,279,548 3,636,993 52,106 0 3,027,338 22,549,981 607,018 1,746,246 45,293 415,147 2,813,704 25,363,685 13.6PD, H, SR 15,769 1,179,368 1,371,922 60,777 224,331 53,444 0 375,452 3,281,064 168,282 149,152 1,160 63 318,657 3,599,720 1.9PD, H, AR 50,170 6,928,337 1,633,884 3,014,823 4,810,015 16,676 190 1,982,796 18,436,891 1,271,554 2,009,757 133,155 108,690 3,523,156 21,960,047 11.8PD, H, SAR 14,181 863,548 926,111 115,257 377,698 41,994 30 295,797 2,634,616 218,087 76,238 6,751 844 301,921 2,936,537 1.6NVR, M, NR 533 20,272 536,279 759,002 111,753 41 0 24,160 1,452,040 1,017,898 20,272 407,427 575,546 2,021,144 3,473,184 1.9 IL's 0 0 0 1,662 332 0 0 0 1,993 150,319 0 0 0 150,319 152,312 - CU-PI 0 0 14,701 24,006 4,746 0 0 63 43,516 7,638 39 80,953 14,855 103,484 147,001 - CU-US 533 501 10,517 830 0 0 0 196 12,576 1,402 276 230 48,735 50,643 63,219 -NVR, M, SR 95 25,395 486,976 190,558 124,523 254 0 17,509 845,310 160,002 15,373 39,089 14,180 228,644 1,073,953 0.6NVR, M, AR 362 73,525 499,006 746,639 205,726 180 0 19,826 1,545,264 2,853,724 142,734 855,545 760,307 4,612,310 6,157,574 3.3NVR, M, SAR 44 71,496 486,693 153,756 39,566 207 0 14,463 766,224 657,881 32,899 359,771 78,973 1,129,523 1,895,747 1.0PD, M, NR 528 26,001 1,405,421 2,524,113 111,391 54 0 175,948 4,243,455 401,095 4,313 145,580 220,560 771,548 5,015,003 2.7PD, M, SR 56 7,257 302,698 41,567 9,815 150 0 32,144 393,686 31,242 2,968 5,401 474 40,086 433,771 0.2PD, M, AR 343 99,996 987,454 1,827,139 256,010 257 0 69,675 3,240,873 765,094 37,405 210,223 176,555 1,189,277 4,430,150 2.4PD, M, SAR 72 17,404 310,082 52,396 9,205 432 0 23,832 413,422 86,222 6,625 33,510 8,135 134,492 547,915 0.3NVR, L, NR 1 346 1,254,143 184,495 0 0 0 0 1,438,985 92,694 0 745,514 925,291 1,763,499 3,202,484 1.7 IL's 0 0 1,686 6,226 0 0 0 0 7,911 74,342 0 0 920 75,262 83,174 - CU-PI 0 0 36,885 0 0 0 0 0 36,885 0 0 36,442 2,736 39,178 76,063 - CU-US 1 0 314,824 479 0 0 0 0 315,304 0 0 24 15,283 15,307 330,611 -NVR, L, SR 0 57 459,075 47,069 0 0 0 0 506,200 17,884 0 176,902 117,721 312,507 818,707 0.4NVR, L, AR 22 458 1,100,031 822,039 0 0 0 0 1,922,550 471,644 0 1,842,551 768,601 3,082,796 5,005,345 2.7NVR, L, SAR 5 226 544,415 65,761 0 0 0 0 610,408 48,714 0 511,666 58,940 619,319 1,229,727 0.7PD, L, NR 23 143 1,799,001 573,888 0 0 0 0 2,373,055 16,521 0 254,791 374,414 645,726 3,018,781 1.6PD, L, SR 5 40 213,204 20,396 0 0 0 0 233,644 905 0 16,121 29,277 46,304 279,948 0.2PD, L, AR 43 735 1,516,709 906,639 0 0 0 0 2,424,126 41,483 0 484,958 452,513 978,954 3,403,080 1.8PD, L, SAR 11 407 258,709 13,278 0 0 0 0 272,405 2,846 0 60,052 27,721 90,619 363,025 0.2NVR, I 18,686 1,098,919 4,083,709 1,013,405 258,062 3,676 23,802 30,598 6,530,858 4,406,160 7,288,029 1,473,372 4,972,092 18,139,653 24,670,511 13.2PD, I 89,146 1,374,218 3,559,561 647,288 111,676 4,443 933 241,083 6,028,348 775,456 3,177,860 198,565 1,881,724 6,033,605 12,061,954 6.5Total 480,883 29,236,220 31,664,103 20,178,619 30,181,930 279,024 44,945 7,647,872 119,713,596 20,475,482 24,594,650 8,629,197 13,098,929 66,798,259 186,511,855 100.0
TotalClass
Agricultural capacity in the Cerrado biome
GEOSPATIAL ANALYSES OF THE ANNUAL CROPS DYNAMIC IN THE BRAZILIAN CERRADO BIOME: 2000 TO 2014
25
Figure 13- Overview of the results achieved in this study in terms of agriculture capacity of the Cerrado in 2014. The different sizes and colors of the elements in this figure represent the proportional area of each agricultural capacity class in relation to the entire Cerrado.
GEOSPATIAL ANALYSES OF THE ANNUAL CROPS DYNAMIC IN THE BRAZILIAN CERRADO BIOME: 2000 TO 2014
26
7. CONSIDERATIONS AND RECOMMENDATIONS
The study presents a detailed analysis of the annual crops expansion dynamic in the Brazilian Cerrado
between 2000 and 2014, with strong emphasis on soy. Nonetheless, there is an established process of land-use intensification with double cropping of corn and cotton, which certainly has diminished the pressure on the opening of new areas and, consequently, saving millions of hectares of native vegetation. In this sense, this study creates an opportunity for a complementary analysis that describes the intensification dynamic of agricultural land use in the Cerrado biome. The study revealed that from 2000 to 2014 more than 5.6 Mha of pasture were converted to soybean. The hypothesis that most of this pasture is degraded should be tested and validated based on
historical satellite images. As the pasture area in the Cerrado biome has been decreasing in recent years, while cattle herd increased by around 15% between 2000 and 2014, there is also evidence of an intensification process in cattle ranching. The understanding of how this intensification process occurs in different parts of the Cerrado biome, with a focus on the assessment of the quality of the pastures and the adoption of practices such as crop-livestock integration or crop-livestock-forest integration also demands further study. As a result of this broad analysis of the agricultural expansion in the Cerrado biome, it was possible to evaluate the degree of activity in the agricultural frontier, as well as to identify the most
suitable areas for future agricultural expansion without deforestation. However, the crop expansion process is also related to aspects such as the land cost, proximity to agricultural clusters, logistical infrastructure, among others that should be considered in future studies to better understand and model the crop expansion in the agricultural frontier in this biome. The study revealed that the Cerrado biome possesses approximately 103.1 Mha (50.5%) of native vegetation remnants, of which 15.5 Mha have high agricultural capacity for soybean production. However, this area needs to be better understood in terms of biodiversity, land-ownership structure and conformity with the Forest Code, among others.
GEOSPATIAL ANALYSES OF THE ANNUAL CROPS DYNAMIC IN THE BRAZILIAN CERRADO BIOME: 2000 TO 2014
Grantee:
4850, Km 5, SC 401 Highway - Store E-23/30 | Zip Code 88032-005 Florianópolis | Santa Catarina | Brazil
Telephone: +55 (48) 3209-1650