Embed Size (px)
Citation preview

1
Geophysical and Geodetical Investigation of A Landslide Area 1
(Koyulhisar-Sivas, Turkey) 2
Sevda Özel1, Demet Över2, Kemal Ö. Hastaoğlu3 3
1,2Department of Geophysical Engineering, Cumhuriyet University, 58140, Sivas, Turkey 4 3Department of Geomatics Engineering, Cumhuriyet University, 58140, Sivas, Turkey 5
Correspondence to: Sevda Özel ([email protected].) 6
Abstract. The study area is in the last section in the close south of Koyulhisar (Sivas) landslide site and the 7
study area is in the most active location where the landslide’s displacement amount is the highest. The landslide 8
site was examined with geophysical (SRT-seismic refraction tomography, GPR-ground penetrating radar) and 9
geodesic (GNSS-global navigation satellite system) methods. According to the geophysical results, within ~20 m 10
of investigation depth, three layers with the average seismic P-wave velocities (VP) of 0.30, 1.00 and 2.00 km/s 11
have been identified. It was determined that the thickness of the first two layers of these layers from top to the 12
bottom is approximately 3 and 6.5 m, and the last layer with Vp>2.0 km/s is the bedrock. Furthermore, in 13
geophysical sections, it was determined that the depth of the sliding surface which is the upper limit of the 14
bedrock varies between ~7-10 m. The geophysical results permitted to identify the landslide type as planar 15
sliding, with the sliding direction in S-SE, and the tilt of the layer being orientated in the same direction as the 16
topography slope (mostly bigger than 5°). In addition, according to geophysics and geodetical results, it was 17
observed that the deformations in the landslide mass have occurred from the geological unit, the layer or 18
topography slope, and precipitation. Therefore, it was thought that landslide activity may continue in the study 19
area. These results were showed that precipitation and deformations within the layer can be effective in 20
triggering the landslide in the future. Therefore, the study area contains the risk and the natural hazards, and 21
these threaten the settlement area and the buildings and other constructions there. 22
1 Introduction 23
A landslide is a mass movement and can occur in the different forms. Koyulhisar landslide area, the subject of 24
this article, is one of the largest landslide areas that significantly lead to serious loss of lives and property as in 25
throughout Turkey. Three of the most destructive of these landslides occurred in Koyulhisar (Sivas) on 19 26
August 1998, 20 July 2000 and 17 March 2005. The Koyulhisar landslide area is one of the most important large 27
landslide areas in the country and mass movements there typically occurs in the form of debris or mudflow 28
(Tatar et al., 2007; Duman et al., 2005). In addition, Koyulhisar is an active landslide area and for the past 17 29
years, there has been observed an increase in landslide activity (Tatar et al., 2007; Över, 2015). The large and 30
small landslides in Koyulhisar landslide area have mostly occurred due to natural causes until today. Artificial 31
causes mainly constitute the landslides caused by human interventions (blasting, drilling, improper planting, 32
loading, loss of vegetation cover, etc.). The last large landslide occurred with the flow of mud in the north of 33
Koyulhisar landslide area in March 2005. Duman et al. (2005) determined that this landslide was in the 34
excessively fast (6 m/sec) class. Demirel vd. (2016), for the landslide in 2000 year revealed an average of 2.5-7.4 35
mm/year slip rate. In addition, researchers have stated that these landslides usually have a mechanism involving 36
a circular rotation, this old landslide mass maintains its activity and partial landslides occur on the groundmass 37
(Sendir and Yılmaz, 2001; Duman et al., 2005). Therefore, Koyulhisar district center is on an old landslide that 38

2
occurred in the form of circular rotation. The front of this landslide mass is open, it is always active, activity is 39
not massive and usually in the form of local landslides occurring on the groundmass (Sendir and Yılmaz, 2001). 40
The triggering mechanisms of landslides are often complex and further understanding is needed to 41
facilitate the prediction of mobilizations as well as adequate stabilization and remediation measures. Therefore, it 42
is important to investigate the reasons that affect the formation mechanisms and the formation of landslides. 43
Different engineering (geology, geophysics, geodetic, etc.) disciplines have great role and importance especially 44
in decreasing the landslide effects. They can help to prevent damage by prediction and early warning. In this 45
context, Koyulhisar landslide area was examined in a wide area with detailed GNSS (Global Navigation Satellite 46
System) methods and the studies of other disciplines (geology, chemistry, seismology, meteorology, remote 47
sensing) (Sendir and Yılmaz, 2002; Tatar et al., 2007; Hatiboğlu, 2009; Hastaoğlu and Şanlı, 2011; Yılmaz, 48
2009; Hastaoğlu, 2013; Türk, 2013; Topal and Hatiboğlu, 2015; Hastaoğlu, 2016). The annual sliding velocity, 49
sliding direction, displacement amounts and natural disaster risk of the landslide have been identified by these 50
studies. It has been determined that the displacement amounts of the landslide velocity vary between 1-8.6 51
cm/year by topography and geological bedding and that the landslide direction is usually S-SE oriented. In terms 52
of geology, some researchers have carried out geological studies on many issues such as geological, tectonic, 53
geotechnical, geochemical and geomorphological studies at the local and regional scale in which the features of 54
the faults, water, hot water, soil and rock on the NAFZ (North Anatolian Fault Zone) and in the region were 55
investigated. These studies are in geology, tectonics (Toprak, 1989; Uysal, 1995; Sendir and Yılmaz, 2001; 56
Sendir and Yılmaz, 2002; Yılmaz et al., 2005; Gökçeoğlu et al., 2005b; Demirel et al., 2016; Demir, 2018), and 57
geotechnics, geomatics/remote sensing, geochemistry and geomorphology (Toprak, 1989; Uysal, 1995; Duman 58
et al., 2005; Ulusay et al., 2007; Hatiboğlu, 2009; Yılmaz, 2009; Demirel et al., 2016; Demir, 2018). The results 59
of all these studies have been associated with geophysical results at the interpretation stage in this article and the 60
geophysical studies were carried out for a limited area being the subject of this article and had the distinction of 61
being the first geophysical studies. 62
In the geophysical study, the hazards that would be caused by the landslide geometry of the last section in 63
the close south of Koyulhisar landslide area and would affect the settlement area were investigated (Fig. 2 and 64
9). The geophysical study was also carried out in this area which is the most active area of the landslide site 65
because Hatipoğlu (2009) identified a movement of about 8.6 cm/year in this area. The SRT (Seismic Refraction 66
Tomography) method determining the seismic P-wave velocities (VP) for seismic applications and the GPR 67
(Ground Penetrating Radar) method for electromagnetic (EM) applications were used in the geophysical data 68
collection in the area. In particular, seismic tomography (SRT, MASW) and ground penetrating radar (GPR) 69
applications are preferred methods in landslide studies. The structural geometry of the landslide area was 70
delineated based on an interpretation of the collected geophysical data. These are the seismic VP velocities, 71
thickness, tilt and direction of the layers. Thus, other features such as the sliding surface depth of the landslide, 72
landslide type, advancement direction and the risk situation were also revealed, and geophysical and other study 73
results were shown to be compatible with each other. The studies carried out by McCann and Forster (1990), 74
Demirağ (1991), Hack (2000), Perrone et al. (2004), Göktürkler et al. (2008), Hu and Shan (2016), Su et al. 75
(2016) and (Popescu et al. 2016) are important in this regard. In addition, Bichler et al. (2004) carried out multi-76
methodical geophysical studies containing electrical resistivity, GPR and seismic methods in the landslide 77
studies. Otto and Sass (2006) and Ristic et al. (2012) also carried out similar studies on landslide investigation. 78

3
In these studies, the sliding surface of the landslides and the flow direction properties of the landslide material 79
were generally determined by 2D (two-dimension) and 3D (three-dimension) geophysical sections. 80
It has been observed that the use of the SRT and GPR methods in landslide studies has increased 81
significantly especially in recent years (Ristić et al., 2012; Timothy et al., 2013; Lissak et al., 2015; Hu and 82
Shan, 2016; Popescu et al., 2016; Su et al., 2016). The parameters which define the landslide such as landslide 83
geometries and bedrock depth or sliding surface depth have been determined in these studies. Regarding the 84
GPR method, significant studies have been carried out by Davis and Annan (1989) on revealing the soil 85
stratigraphy, by Aldaş et al. (2003), Slater and Niemi (2003) and Green et al. (2003) on the mapping of faults, 86
fractures and cracks and by Benson (1995), Harari (1996), Bano et al. (2000) and Bubeck et al. (2015) on the 87
determination of groundwater levels. However, the accurate determination of the landslide type is also very 88
important as well as landslide elements. Joint studies with geophysics and other disciplines are commonly 89
carried out in determining the landslide type and for different contributions. In addition to these, the 90
seismological history, morphological and topographical features and meteorological data of the study area are 91
always taken into account in the landslide analysis. They are largely used in such studies especially for their 92
contribution to interpretation. In this article, the information obtained from all these data was used in order to 93
make contributions to the geophysical results. For, landslides may develop under various geological, 94
morphological, topographical and physical reasons. Thus, through multi-discipline studies, the landslide type can 95
be determined most accurately by determining different sliding behaviors (such as the velocity and direction of 96
the landslide, annual amount of displacement) varying from region to region. The landslides, which generally 97
occur in the form of sliding, may occur with the movements of falling, sliding and flowing or with the 98
combination of a few of these. Therefore, accurate determination of the landslide type/kind and the selection of 99
the methods used in the study is very important. It may be possible to perform an accurate landslide analysis 100
only if these requirements are met. In this article, these issues were examined and discussed separately and 101
together with geophysical and geodetic results. 102
2 Geology 103
The study area is about 180 km away from Sivas city center and is in the west of Koyulhisar district center which 104
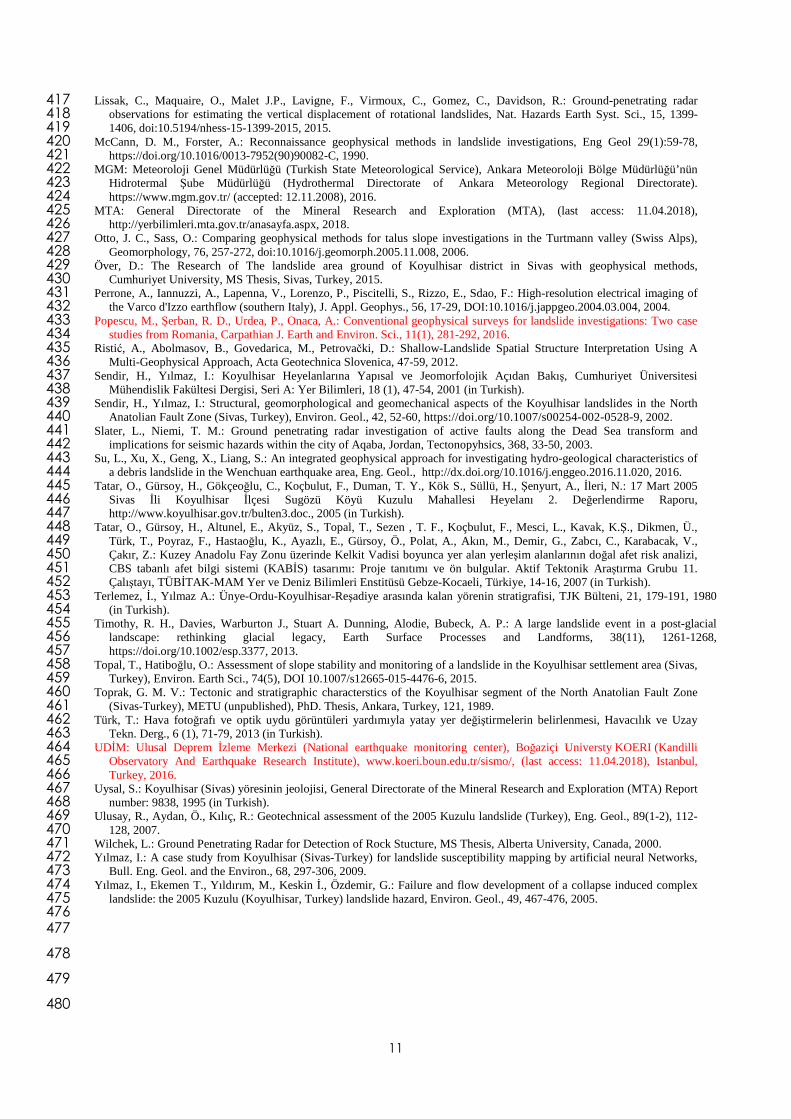
is located in the north of the NAFZ (Fig. 1 and 9). The rocks in the region usually have fractures and 105
discontinuities and are crushed because of the NAFZ which is tectonically active in south of the study area 106
(Tatar et al., 2005). There are also many old and new landslides in the study area depending on the high tilted 107
topography. For these reasons, the directions of movement of the landslides generally threaten the settlement 108
areas (Sendir and Yılmaz, 2001). The geological investigation of Koyulhisar has been carried out regionally or 109
locally by various researchers (Terlemez and Yılmaz, 1980; Toprak, 1989; Uysal, 1995; Sendir and Yılmaz, 110
2002; Duman et al., 2005; Hatiboğlu, 2009). According to these studies, the Plio-Quaternary aged Koyulhisar 111
Formation is the youngest unit in the region. It was stated that the youngest unit consisted of the talus (slope or 112
deposit) and fluvial conglomerates and was seen along the strike-slip faults (Toprak, 1989). 113
Toprak (1989) divided the NAFZ which is represented by a right lateral strike-slip fault zone into five 114
fault sets including the North Anatolian Main Fault, Koyulhisar fault sets, Kelkit fault set, Şıhlar fault set and 115
Kuruçay fault set. But, the Şıhlar fault sets affect Koyulhisar district center at the nearest (Fig. 1). Toprak (1989) 116
stated that Koyulhisar section of the NAFZ is still active and a right lateral strike-slip fault zone due to the 117
morphotectonic structures and seismic activities in the region (Fig. 1). As it is seen in Fig. 1, the faults closely 118

4
concerning Koyulhisar are the NAFZ, which is the main fault extending in the northwest-southeast direction and 119
approximately 2-2.5 km away, in the south, and the Çamlıyaka Fault, which is approximately north-south-120
oriented, in the west. This fault which is the closest one to the study area extends perpendicular to the NAFZ in 121
the south. It was also reported by Tatar et al. (2007) that large and old landslide masses in Koyulhisar landslide 122
area have lower Miocene-aged clay and gypsum levels, Eocene-aged clayey levels and Plio-Quaternary aged 123
sediments. However, Hatiboğlu (2009) and Hastaoğlu et al. (2015) generally observed two geological units in 124
the drillings in the study area. They observed that the upper unit was silty sandy clay and sand interbedded silty 125
clay in some places up to about 10 m, and advanced as sand interbedded silty clay and sand interbedded clay in 126
some places towards deeper than 10 m. The first unit consists of light-dark brown colored, medium-very stiff, 127
low-high plasticity, silty clay. The second unit consists of light-yellow white colored, low-high plasticity, silty 128
sandy clay interbedded with sand (Hastaoğlu et al., 2015). When the drilling logs are examined, there is 129
generally the second unit in east of study area (Hastaoğlu et al., 2015). Furthermore, it was observed that the 130
content of the second geological unit did not change even if the depth of the drilling increased. Therefore, the 131
second geological unit was taken into consideration in the interpretation of geophysical sections. 132
3 Methods 133
3.1 Geophysical surveys 134
The SRT and GPR methods which are applied in tomography format were used in the geophysical study. The 135
high-frequency electromagnetic waves can reach deeper in the environments with low conductivity like sand. 136
However, the conductive units such as clay and shale decrease the penetration depth of the signal transmitted and 137
lead to absorption (Annan et al., 1988; Davis and Annan, 1989). Firstly, SRT and GPR data were collected along 138
multiple transects in two different areas of the study area named A and C (see Fig. 2). Then, the geophysical 139
profiles were processed to the satellite map according to the coordinates along with the topographical elevation 140
curves and GNSS measurement locations for the ease of interpretation (Fig. 2a). Geophysical measurements 141
were taken as both NE-SW and NW-SE oriented due to the geologic bedding and topographic features (Fig. 2b-142
c). However, SRT12-GPR12 profiles were selected as about E-W oriented due to rugged topography in area C. 143
The profile lengths usually range from 40 to 60 m according to the method applied. The profile shooting 144
technique in the field, hammer and iron plate of 8 kg weight as the source P geophone of 14 Hz (the total number 145
of geophones is 12) and Geometrics branded seismic device as the receiver Geometrics branded seismic device 146
as the receiver was used while collecting the SRT data. In all profiles, the geophone interval was 5 m, offset 147
distance was 2.5 m, sampling interval was 256 ms and the record length was 512 ms. The geophones were 148
respectively fixed on the ground within the selected geophone range and their connections with the seismic 149
device were made. Then, seismic measurements were recorded by starting from the offset distance of 2.5 m, 150
reducing to sledgehammer plate and making at least 5 times shots between each geophone, respectively. In the 151
evaluation of the SRT data collected in the field, SeisImager program was used for displaying, processing and 152
evaluation of the seismic refraction waves. The marking of the first arrivals of the SRT data was performed using 153
Pickwin, and the evaluation of the first arrival data was performed using Plotrefa module. 154
The GPR data collected on the SRT profiles only in the areas A and C were collected by Ramac2 device 155
using a closed antenna of 250 MHz. The GPR data were processed in Reflexw program. In order to collect the 156
GPR data, other parameters were selected 512 ns-number of samples, 16-number of stacking and 0.1 m-trace 157
interval. 2D GPR data processing, it includes Static correction, Muting, Bandpass filter, Gain and Migration 158

5
steps. The migration was made to show up small vertical structures invisible during data processing. Thus, very 159
large hyperballs with strong reflections may limit the display of non-migrated GPR data. Moreover, the peak 160
points of hyperbolas observed in GPR cross-sections show the reflection surface of the electromagnetic wave. 161
During data processing, velocity analysis was performed on the reflection surfaces through the hyperbola 162
superposition method and EM wave propagation velocity was calculated in all GPR cross sections. The 163
topographic corrections were made by selecting the “Correct for two layers” option in Static Correction/Muting 164
in the Reflex program. The height values collected in the study area were manually entered and saved in 165
“Correct for two layers” option. Thus, the models were converted from m to ns and the GPR sections were 166
prepared for interpretation. 167
SRT profiles and on these seismic profiles GPR profiles in the area defined by A in Fig. 2b are 168
approximately in the NE-SW (SRT2, SRT4, GPR2, GPR4)) and NW-SE (SRT3, SRT5, GPR3, GPR5) directions 169
(Fig. 2b). In area C and in the west of this area, SRT10-SRT11 profiles and on these profiles GPR10-GPR11 170
profiles are approximately in the E-W directions. In the same area, SRT9-SRT14 profiles and on these profiles 171
GPR9-GPR14 profiles are approximately in the NE-SW direction (Fig. 2c). Similiarly, in the east in Fig. 2c, 172
SRT12-GPR12 profiles are in the E-W directions and SRT13-GPR13 profiles are approximately in the NE-SW 173
directions. In addition, geomorphologically the landslide cracks on the surface, displacement traces, and 174
structural damages in the study area and its immediate surroundings can be monitored clearly by field 175
observations and visibly the damaging effects of still active or old landslides on residences, roads, walls can 176
easily be observed (Fig. 3). All damaged structures across the region cannot be used. Therefore, new landslide 177
cracks will emerge over time both on the ground and the existing structures in the region which active in terms 178
of landslide and seismicity, and the formation of new landslides will continue in the area. 179
3.2 Results and interpretation 180
The time-depth sections which were ready for interpretation were obtained by increasing the signal/noise ratios 181
of the signals in the data processing. The geophysical sections were prepared by also making a topographic 182
correction in the inversion operation due to the variability of the topography. Thus, the collected geophysical 183
data were converted into 2D (two-dimension) height-distance and depth-distance sections by being assessed in 184
the appropriate software. Geophysical interpretations were made according to these sections and compared with 185
the results of the other studies. 186
SRT: 2D (two-dimension) seismic cross-sections giving seismic VP-depth information are presented in 187
Fig. 4 and 5. In the seismic data evaluation, the coincidence was provided with RMS (Root Mean Square) errors 188
ranging between 3.4-4.5% in 2D (two-dimension) inversion operation. According to 2D (two-dimension) 189
seismic cross-sections, two or three layers were identified at about 20 m depth. It was understood that the tilts of 190
these layers were southeast oriented, and their tilt was greater than 500. According to seismic velocities (VP) 191
calculated, three layers with the layer velocities of 0.30, 1.00 and 2.00 km/s on average were defined from top to 192
bottom. VP values of these layers increase towards the deep. Layer thicknesses range between 3 m and 6.5 m on 193
average from top to bottom due to topographical differences. It was understood that the depth of the sliding 194
surface varied between about 7-10 m, and these depths were the upper bound of the third layer. This area was 195
considered to have a risk of dislocation due to these loose units, rainfall and tilt conditions. Therefore, the layers 196
with an average of VP1=0.3 km/s and VP2=1.00 km/s over these depths were defined as the layers with the risk of 197
dislocation. The layer with a seismic velocity of greater than VP3>2.00 km/s at the lowermost was understood to 198

6
be the basement layer. The investigation depth was further calculated from the SRT sections compared to the 199
GPR sections due to the differences of geophysical methods in the application. Because GPR sections were 200
obtained in well-resolution for about the first 10 m depth after inversion processing of the GPR data (Fig. 6 and 201
7). Therefore, it could be said that the GPR and SRT sections are compatible for the first 10 m depth. Besides, 202
the profile lengths of the GPR3 and GPR5 sections in Fig. 7 were evaluated as about 25-35 m. 203
GPR: The GPR sections, it was obtained in high-resolution for about the first 10 m depth. It is clearly 204
observed that the strong reflections are within 10 m depth in Fig. 6 and 7. These strong reflections seen in black 205
dashed ellipses are interpreted as deformation areas in the layer. In a similar manner, these areas being 206
interpreted as deformations were also observed in the studies of Bubeck et al. (2015), Hu and Shan (2016), Su et 207
al. (2016) and Popescu et al. (2016). The strong reflected wave signal shows distinctive characteristics, 208
presenting a low-frequency high-amplitude sync-phase axis, which can be inferred as the sliding surface in Fig. 6 209
and 7. Furthermore, in Fig. 6 and 7, there is a layer with a varying thickness of about 3 mm at the uppermost. It 210
is seen that the second layer under this layer proceeds until about 7-10 m depth. In other words, two layers were 211
identified in GPR sections. These layers are weak, loose, cracked, moved and also have lost their tightness, and 212
their seismic velocities are low. Therefore, in Fig. 6 and 7, it was thought that deformations developed on the 213
sliding surfaces due to the geology of the study area in A and C area. Because the first geological unit is 214
medium-very stiff, low-high plasticity, silty sandy clay. The deformation structures as sliding surfaces, landslide 215
furrows, scarps, collapsed zones, and cracks were observed in the GPR cross-sections (Fig. 6 and 7). However, 216
three layers were identified in seismic sections, and their seismic velocity was observed to increase towards the 217
depth (0.30<1.00<2.00<… km/s). Accordingly, in GPR sections, the fact that the problems seen in the first two 218
layers decreased and ended towards deeper layers (>7-10 m) is understood from the increase in seismic 219
velocities (>2.00 km/s). Furthermore, the electromagnetic wave velocity in the GPR sections was calculated. In 220
Fig. 8, the EM wave velocity calculated for the reflection surface in GPR5 cross-section -representing the GPR 221
profiles- was shown as an example. The picks were exported with the attribute of two-way travel time, and the 222
velocity of propagation of the wave, in this case, appears to be about 0.1 m/ns (Fig. 8). This value is generally 223
observed in dry or wet soil, dry or wet clay and sandy environments (Wilchek, 2000; Cardomina, 2002). 224
Therefore, it was thought that this velocity value was compatible with the geological units and electromagnetic 225
waves led to rapid absorption due to the silty sandy clay layer. In other words, the geological unit, the layer or 226
topography slope and precipitation cause deformations in the loose upper unit. Therefore, these structures may 227
develop or occur in the landslide mass, as shown in Fig. 6 and 7. 228
3.3 Seismological and meteorological data and results 229
The study area is located in an active area in terms of seismicity. The seismological history, the magnitude (M) 230
of which is greater than 2.5, of the examined area and its surrounding between 1900-2015 were investigated for 231
this article (Fig. 9). The map in Fig. 9 was prepared with the seismological data between 1900-2015 (UDİM, 232
2016). Particular attention was paid to the earthquakes before 2005 in the seismological interpretation. This is 233
because the largest and most recent landslide occurred in the area in 2005 and it was aimed to investigate its 234
relationship with displacements and previous landslides. The type of magnitude which is calculated from 235
seismological data is usually the local magnitude. The depths (d) of these earthquakes with higher M>2.5 vary 236
between approximately 5 and 80 km (Fig. 9). According to the seismic data of the years examined, Koyulhisar 237
and its surroundings have always been active seismically. It was observed that this frequency of earthquakes 238

7
usually occurred on the NAFZ in the south of the study area. Additionally, it has been analyzed the seismic 239
activity of the region at least for the last 112 (1904-2016) years by Demir (2018). In this study, he express that 240
the most notable is probably the relationships between the magnitude of the earthquake to the number of 241
landslides and the area affected by the landslides and between the magnitude and the maximum distance of 242
landslide observations from the epicenter in different geological, topographical, and climatic conditions (Demir, 243
2018). 244
Large earthquakes affecting Koyulhisar district also occurred in the region. These largest earthquakes are 245
in the south of the NAFZ or Suşehri district and a total of three large earthquakes with M≥5.6 occurred there 246
(Över, 2015). Among these, 1992 earthquake is closest to the study area with the least depth but the second 247
largest earthquake (Fig. 9). This earthquake is an earthquake with 6.1 magnitude that occurred 10 km below the 248
ground. The large earthquakes in the south of Suşehri district which is just 13 km away from the study area 249
occurred in 1909 and 1939. 1909 earthquake occurred 60 km below the ground and is the largest and deepest 250
earthquake with a magnitude of 6.3. 1939 earthquake is also deep and the third largest earthquake that occurred 251
50 km below the ground with a magnitude of 5.6 (Över, 2015). In addition, when Fig. 8 is analyzed, it is seen 252
that the magnitudes of the other earthquakes in the north of the NAFZ and the upper elevations of the landslide 253
generally vary between 2.5-4. Similarly, it is seen that the other earthquakes in the south of the landslide area are 254
the earthquakes with a magnitude of greater than 3.6. All these earthquakes may have triggered the landslide 255
mass from time to time in places where sliding surfaces, layers, and topography in the landslide area are more 256
inclined than 5-10 degrees (according to the geophysical cross-sections in this article, when it is considered that 257
there are loose units and deformations on the sliding surfaces). In particular, they further affected the landslide 258
mass along with the rain and caused large amounts of displacement in the landslide area. 259
The data regarding the rainfalls with the effects of triggering the landslides are presented in Table 1 and 260
Fig. 10 (MGM, 2016). With these data, the rainfall status of the study area and its surrounding was examined by 261
months as average annual rainfalls and the annual areal amount of rainfall. According to the data obtained 262
between 1950-2015 in Table 1, the rainy periods are generally between October-November-December and 263
January-February-March-April. The highest total daily amount of rainfall in the rainiest years was observed as 264
snowfall in 1950 (110 cm) and as rain in 1991 (55 kg/m2). 265
According to Fig. 10, the annual normal average rainfall value calculated for the years between 1981-266
2010 was calculated as over 483.4 mm. However, 1987-1988 and 1997-1998 were the rainiest years. It is seen 267
that the annual areal amount of rainfall exceeded the normal values and was higher than 550 mm in these rainy 268
years that took place in every 10 years. Similarly, it is also seen that there were high rainfalls for 3-4 years after 269
the years of 1985-1995-2005 with an interval of 10 years. Therefore, annual areal rainfalls were observed to be 270
more before some large landslides like the landslide in 1998. When geological features of the region are taken 271
into account, it is remarkable that the landslide in 1998 and 2000 occurred in the summer months after the winter 272
with a heavy fall of snow. However, the landslide in 2005 occurred during the rainy season. Therefore, rainfalls 273
have always been considered as a factor triggering these landslides in many studies and articles (Tatar et al., 274
2007; Hastaoğlu et al., 2015). Similarly, the authors of this article have always considered rainfalls as a 275
triggering factor in the formation of Koyulhisar landslides. As it is seen, the various studies and the results of 276
this article have proved that Koyulhisar landslides are generally caused by the known reasons that trigger the 277

8
landslide. Therefore, these conditions mentioned in the landslide area have shown that the landslides could be 278
triggered there. 279
3.4 Geodetic surveys and results 280
GNSS studies and multi-disciplinary studies have carried out for many years (about 6 years) to determine the 281
deformation and annual sliding amounts especially after the landslides in 1998-2000-2005 (Hastaoğlu et al., 282
2015). It was determined that the tension cracks that occurred in the landslides in 1998 and 2000 in the region 283
were filled with the waters consisting of melting snow and rain waters which are the most important component 284
of the hydrological cycle, lakes were formed in the buttress of each sliding mass, and the changes in the 285
groundwater level were the main causes of deformation (Sendir and Yılmaz, 2001; Topal and Hatiboğlu, 2015; 286
Hastaoğlu et al., 2015). The seismological and meteorological data, which were updated by the geodetic (GNSS 287
(DH), geological (IDH (Inclinometer Drilling Holes)) and meteorological data collected in the local study of 288
Hastaoğlu et al. (2015), were reorganized and evaluated. Fig. 2, 10, 11 and Table 1 which were reprepared for 289
the study which is the subject of this article were associated with the results of GNSS studies (studies made by 290
Hastaoğlu et al. (2015)) (Fig. 11). Then, they were compared with geophysical results in interpretation. 291
The monthly and annual meteorological data should certainly be evaluated particularly within the scope of 292
monitoring activities because the area which is the subject of the study is a landslide area. Hastaoğlu et al. (2015) 293
performed monitoring in IDH wells in the area in 2013-2014 (Fig. 11). If Fig. 2 is examined, there are seven 294
IDH point in the nearest of the geophysical profiles. The graphics in Fig. 11 were prepared from the combined 295
data (unpublished data in the project) and the temperature (0C), precipitation (m3) and soil moisture content (cm) 296
were compared in these graphics. Accordingly, the temperature and precipitation were observed to be inversely 297
proportional during the summer months called as a dry period. It is seen that the soil moisture is changeable 298
apart from the rainy period and has very high water content during the rainy periods. The soil moisture is very 299
high (average 150 cm) in winter, summer, autumn seasons (Fig. 11). In study area, the water contents in the 300
drilling data change from 24.6 % to 13.3 % at between 0-10 m depth and these values are also high (from 29.1 % 301
to 17.3 %) after 10 m (Hastaoğlu et al., 2015). Water generated from precipitation, melting snow and permafrost 302
melting is blocked by the impermeable layer when it infiltrates downward, and the local moisture content 303
increases (see Hu and Shan (2016)). Thus, the water infiltrates the interface between the permeable and 304
impermeable layer, can form a slip zone. The GPR results show that the moisture content of soils at the sliding 305
surface of the landslide mass is relatively high. The drilling data and soil moisture values also show very high 306
moisture content of the sliding surface of the landslide mass in the study area, which is completely consistent 307
with the results obtained from the GPR-SRT profiles, meteorological and geological results. On the other hand, 308
it was understood that the precipitation increased by the decrease in temperatures. It is also seen that the total 309
annual amount of rainfall increased about 2-fold in 2014 compared to 2013 (Fig. 10 and 11). According to all 310
results, rainfalls are considered to be effective in triggering of the landslide because the ground of this landslide 311
area, which is filled with loose units and old cracks, is supersaturated with water due to the rainfalls. 312
Besides, Hastaoğlu et al. (2015) determined that the groundwater level gets close to the surface for 4-6 m 313
on average at the end of the rainy period, to 10 m at the end of the rainy period and decreases up to 25 m in some 314
wells in the area where geophysical study area is also located, and the groundwater flow direction is SW. When 315
this information was associated with topography and in line with the field observations, it was understood that 316
the topography was inclined from the north of the study area towards south, the incline of slope decreased from 317

9
925 m to 840 m, there was an elevation difference of 85 m, and the amount of slope in the topography increased 318
from south to north (>50-100) (Fig. 2a). Therefore, it was seen that the geological bedding was compatible with 319
the topographical sloping and the groundwater was compatible with the direction of flow. The geological units 320
were observed in IDH wells in the geophysics study area. These are mostly silty sandy clay and they have 321
different characteristics above and below about 10 m in IDH well. Hastaoğlu et al. (2015) estimated with the 322
GPS measurements that the amounts of displacement varied between 1-8.6 cm/year. The geophysical data were 323
collected in the areas where the amount of displacement varied about 8.6 cm/year. The landslide direction was 324
determined to be in the S-SW and SE direction across Koyulhisar (Hastaoğlu et al., 2015). It was understood that 325
these directions were compatible with the geophysical sections which were prepared later and that the rainfalls 326
are among the reasons that trigger the landslide. 327
4 Conclusions 328
This study is the first geophysical study carried out in Koyulhisar landslide area. The information provided from 329
many studies (geodetic, geologic, morphologic, seismological, topographic and meteorological) carried out 330
across the region was compared with the geophysical results (SRT and GPR) and found to be compatible. The 331
bedding status of the landslide area, seismic P-wave velocity (VP) of the layers, the tilt, tilt direction of the 332
layers, depth of the sliding surface and sliding direction and the landslide type could be determined from the 333
geophysical sections. Accordingly, the study area was identified by the layers with the average seismic velocities 334
of 0.30 < 1.00 < 2.00 <… km/s (or 300, 1000 and 2000 m/sec). The seismic velocity of the landslide basement 335
was found to be higher than 2000 m/sec. According to the geophysical cross-sections, it was identified that the 336
depth of the sliding surface varied between 7-10 m due to the topographical differences. These depths are the 337
depths with low seismic velocities (the average VP, <0.30 and <1.00 km/s) and defined as loose units which were 338
also observed in geological drilling logs. It is determined that sliding surfaces, landslide furrows, collapsed 339
zones, scarps, cracks are observed in the GPR sections. Furthermore, it was understood that the layer tilt was 340
generally more than 50 in all geophysical sections and compatible with the geology and the flow direction of the 341
groundwater. It was understood that the landslide type in the area was planar sliding and the direction of sliding 342
was SE. 343
The geophysical and geodetic study results were found to be compatible because it is known that the 344
landslide direction across Koyulhisar is in S-SW and SE. Consequently, the fact that the depth of the sliding 345
surface over the units is loose, low seismic velocities of the upper layers and the excessive tilt show that there is 346
a new risk of landslide in the area. The other factors that trigger the landslide were found to be associated 347
especially with the fact that the area is seismically active, receives heavy rain and has a poor vegetation cover. 348
Furthermore, it was understood that there were deformations in the landslide mass and, observed the sliding 349
surfaces, landslide furrows, collapsed zones, scarps and cracks structures. It was understood that these structures 350
were occurred from the geological unit, the layer or topography slope, and precipitation. On the other hand, it 351
was thought that studies such as blasting and excavation performed by human intervention can trigger the 352
landslides due to the geologically loose unit and hence the landslide area can a potential area which is open to 353
natural/artificial hazards. As a result, according to all the results, there is still a high landslide hazard in the study 354
area and its surrounding, and this hazard will be also in the future. As a result, the identified risks and natural 355
hazards are also threatened the settlement area and the buildings and other constructions (e.g. roads, walls, parks 356
et al.) there. Therefore, it was understood from the geophysical and geological data obtained for the landslide 357

10
basement and the layer over it that new landslides may occur over time in the study area due to the tilt and 358
abrasion and transports during precipitation. 359
Acknowledgments: This study was supported by Cumhuriyet University Scientific Research Projects 360
Commission as CÜBAP Project numbered M-464. We would like to thank Project Coordinator Assoc. Dr. 361
Kemal Özgür Hastaoğlu and his research team, who allowed us to benefit from the results of TÜBİTAK 362
supported project numbered 111Y111, for their contributions. We would like to thank Dr. Çağrı Çaylak for his 363
contributions during the geophysical field measurements, Assoc. Dr. Fatih Poyraz for his contributions during 364
the process of geodetic field measurements and Assoc. Dr. Tarık Türk. We would like to thank Geological 365
Engineer Mehmet Demirel for his contributions to the Fig. 2. 366
References 367
Adlaş, G. U., Kadıoğlu, S., Ulugergerli, E. U.: The effects of concealed discontinuities in blast design Pattern, 4th Int. 368 Scientific and Technical Conference of Young Scientists and Specialists, St. Petersburg-RUSSIA, 6-7, 2003. 369
Annan, A. P., Davis, J.L., Gendzwill, D.: Radar Sounding in Potash Mines: Saskatchewan, Canada. Geophysics, 53, 1556-370 1564, 1988. 371
Bano, M., Marquis, G., Niviere, B., Maurin, J. C., Cushing, M.: Investigating alluvial and tectonic features with ground 372 penetrating radar and analyzing differactions paterns, J. Appl. Geophys., 43, 3-41, 2000. 373
Benson, A. K.: Applications of ground penetrating radar in assessing some geological hazards: Examples of groundwater 374 contaminants, faults, cavities, J. Appl. Geophys., 33, 177-193, https://doi.org/10.1016/0926-9851(95)90040-3, 1995. 375
Bichler, A., Bobrowsky, P., Best, M, Douma, M., Hunter, J., Calvert, T., Burns, R.: Three-dimensional mapping of a 376 landslide using a multi-geophysical approach: the Quesnel Forks landslide, Landslides, 1, 29-40, DOI 10.1007/s10346-377
003-0008-7, 2004. 378 Bubeck, A., Wilkinson, M., Roberts, G. P., Cowie, P. A., McCaffrey, K. J. W., Phillips, R., Sammonds, P.: The tectonic 379
geomorphology of bedrock scarps on active normal faults in the Italian Apenninesmapped using combined ground 380 penetrating radar and terrestrial laser scanning, Geomorphology, 237, 38-51, DOI:10.1016/j.geomorph.2014.03.011, 2015. 381
Cardimona, S.: Subsurface investigation using ground penetrating radar, Presented at the 2nd International Conference on the 382 Application of Geophysics and NDT Methodologies Transportation Facilities and Infrastructure, LosAngels, California, 383 2002. 384
Davis, J. L., Annan, A. P.: Ground-penetrating radar for high resolution mapping of soil and rock stratigraphy, Geophys. 385
Prosp., 37, 531-551, DOI: 10.1111/j.1365-2478.1989.tb02221.x, 1989. 386 Demir, G.: Landslide susceptibility mapping by using statistical analysis in the North Anatolian Fault Zone (NAFZ) on the 387
northern part of Suşehri Town, Turkey, Nat. Hazards, 92, 133-154, https://doi.org/10.1007/s11069-018-3195-1, 2018. 388 Demirağ, O.: Jeofizik yöntemlerle heyelan araştırmaları, TMMOB-JFMO (The Chamber of Geophysical Engineers of 389
Turkish) publications, Jeofizik, 5(1); 43-50, Ankara, Turkey, 1991 (in Turkish). 390 Demirel, M., Tatar, O., Koçbulut, F.: Kinematics of the faults around the Koyulhisar (Sivas) region on the North Anatolian 391
Fault Zone, Geol. Bull., Turkey, 59(3),357-370, 2016 (in Turkish). 392 Duman, T. Y., Nefeslioğlu, H., Gökçeoğlu, C., Sönmez, H.: 17/03/2005 Kuzulu (Sivas-Koyulhisar) heyelanı, Maden Tetkik 393
ve Arama Genel Müdürlüğü Jeoloji Etütleri Dairesi, Hacettepe Üniversitesi, 2005. 394 Gren, A., Gross, R., Holliger, K., Horstmeyer, H., Baldwin, J.: Results of 3D georadar surveying and trenching the San 395
Andreas fault near its northern landward limit, Tectonophysics, 368, 7-23, doi:10.1016/S0040-1951(03)00147-1, 2003. 396 Gökçeoğlu, C., Nefeslioğlu, H. A., Sönmez, H., Duman, T., Can, T.: The 17 March 2005 Kuzulu landslide (Sivas, Turkey) 397
and landslide-susceptibility map of its near vicinity, Eng. Geol., 81 (1), 65-83, DOI:10.1007/s00254-006-0322-1, 2005b. 398
Göktürkler, G., Baklaya, Ç., Erhan, Z.: Geophysical investigastion of landslide: The Altındağ landslide site, Izmir (western 399 Turkey), J. Appl. Geophys., 65, 84-96, https://doi.org/10.1016/j.jappgeo.2008.05.008, 2008. 400
Hack, R.: Geophysics for slope stability, Surv. Geophys., 21, 423-338, 2000. 401 Harrari, Z.: Ground penetrating radar (GPR) for imaging stratigrafic features and groundwater in sand dunes, J. Appl. 402
Geophys., 36, 43-52, https://doi.org/10.1016/S0926-9851(96)00031-6, 1996. 403 Hastaoğlu, K. O.: Investigation of the groundwater effect on slow-motion landslides by using dynamic Kalman filtering 404
method with GPS: Koyulhisar town center, Turkish J. Earth Sci., 1033-1046. DOI: 10.3906/yer-1210-10, 2013. 405 Hastaoglu, K. O.: Comparing the results of PSInSAR and GNSS on slow motion landslides, Koyulhisar, Turkey, Geomatics, 406
Nat. Hazards and Risk, 7, 2, 786-803, DOI: 10.1080/19475705.2014.978822, 2016. 407 Hastaoğlu, K. O., Şanlı, D. U.: Monitoring Koyulhisar landslide using rapid static GPS: a strategy to remove biases from 408
vertical velocities, Nat. Hazards, 58, 1275-1294, DOI:10.1007/s11069-011-9728-5, 2011. 409 Hastaoğlu, K. Ö., Türk, T., Koçbulut, F., Balık Şanlı, F., Poyraz, F.: “GNSS ve PS-InSAR Yöntemleri Kullanılarak 410
Heyelanların İzlenmesi ve Afet Bilgi Sistemi Tabanlı Risk Analizlerinin Gerçekleştirilmesi: Koyulhisar (Sivas) 411 Heyelanları” Final Report, TÜBİTAK Proje Number: 111Y111, www.tubitak.gov.tr, Turkey, 2015 (unpublished). 412
Hatiboğlu, O.: Investigation Of Koyulhisar (Sivas) Settlement Area In Terms of Slope Instability, Middle East Technical 413 University, MS Thesis, Ankara, Turkey, 2009. 414
Hu, Z., Shan, W.: Landslide investigations in the northwest section of the lesser Khingan range in China using combined 415 HDR and GPR methods, Bull. Eng.. Geol. Environ., 75, 591-603, DOI 10.1007/s10064-015-0805-y, 2016. 416
11
Lissak, C., Maquaire, O., Malet J.P., Lavigne, F., Virmoux, C., Gomez, C., Davidson, R.: Ground-penetrating radar 417 observations for estimating the vertical displacement of rotational landslides, Nat. Hazards Earth Syst. Sci., 15, 1399-418 1406, doi:10.5194/nhess-15-1399-2015, 2015. 419
McCann, D. M., Forster, A.: Reconnaissance geophysical methods in landslide investigations, Eng Geol 29(1):59-78, 420 https://doi.org/10.1016/0013-7952(90)90082-C, 1990. 421
MGM: Meteoroloji Genel Müdürlüğü (Turkish State Meteorological Service), Ankara Meteoroloji Bölge Müdürlüğü’nün 422 Hidrotermal Şube Müdürlüğü (Hydrothermal Directorate of Ankara Meteorology Regional Directorate). 423
https://www.mgm.gov.tr/ (accepted: 12.11.2008), 2016. 424 MTA: General Directorate of the Mineral Research and Exploration (MTA), (last access: 11.04.2018), 425
http://yerbilimleri.mta.gov.tr/anasayfa.aspx, 2018. 426 Otto, J. C., Sass, O.: Comparing geophysical methods for talus slope investigations in the Turtmann valley (Swiss Alps), 427
Geomorphology, 76, 257-272, doi:10.1016/j.geomorph.2005.11.008, 2006. 428 Över, D.: The Research of The landslide area ground of Koyulhisar district in Sivas with geophysical methods, 429
Cumhuriyet University, MS Thesis, Sivas, Turkey, 2015. 430 Perrone, A., Iannuzzi, A., Lapenna, V., Lorenzo, P., Piscitelli, S., Rizzo, E., Sdao, F.: High-resolution electrical imaging of 431
the Varco d'Izzo earthflow (southern Italy), J. Appl. Geophys., 56, 17-29, DOI:10.1016/j.jappgeo.2004.03.004, 2004. 432
Popescu, M., Șerban, R. D., Urdea, P., Onaca, A.: Conventional geophysical surveys for landslide investigations: Two case 433 studies from Romania, Carpathian J. Earth and Environ. Sci., 11(1), 281-292, 2016. 434
Ristić, A., Abolmasov, B., Govedarica, M., Petrovački, D.: Shallow-Landslide Spatial Structure Interpretation Using A 435 Multi-Geophysical Approach, Acta Geotechnica Slovenica, 47-59, 2012. 436
Sendir, H., Yılmaz, I.: Koyulhisar Heyelanlarına Yapısal ve Jeomorfolojik Açıdan Bakış, Cumhuriyet Üniversitesi 437 Mühendislik Fakültesi Dergisi, Seri A: Yer Bilimleri, 18 (1), 47-54, 2001 (in Turkish). 438
Sendir, H., Yılmaz, I.: Structural, geomorphological and geomechanical aspects of the Koyulhisar landslides in the North 439 Anatolian Fault Zone (Sivas, Turkey), Environ. Geol., 42, 52-60, https://doi.org/10.1007/s00254-002-0528-9, 2002. 440
Slater, L., Niemi, T. M.: Ground penetrating radar investigation of active faults along the Dead Sea transform and 441 implications for seismic hazards within the city of Aqaba, Jordan, Tectonopyhsics, 368, 33-50, 2003. 442
Su, L., Xu, X., Geng, X., Liang, S.: An integrated geophysical approach for investigating hydro-geological characteristics of 443 a debris landslide in the Wenchuan earthquake area, Eng. Geol., http://dx.doi.org/10.1016/j.enggeo.2016.11.020, 2016. 444
Tatar, O., Gürsoy, H., Gökçeoğlu, C., Koçbulut, F., Duman, T. Y., Kök S., Süllü, H., Şenyurt, A., İleri, N.: 17 Mart 2005 445 Sivas İli Koyulhisar İlçesi Sugözü Köyü Kuzulu Mahallesi Heyelanı 2. Değerlendirme Raporu, 446 http://www.koyulhisar.gov.tr/bulten3.doc., 2005 (in Turkish). 447
Tatar, O., Gürsoy, H., Altunel, E., Akyüz, S., Topal, T., Sezen , T. F., Koçbulut, F., Mesci, L., Kavak, K.Ş., Dikmen, Ü., 448
Türk, T., Poyraz, F., Hastaoğlu, K., Ayazlı, E., Gürsoy, Ö., Polat, A., Akın, M., Demir, G., Zabcı, C., Karabacak, V., 449 Çakır, Z.: Kuzey Anadolu Fay Zonu üzerinde Kelkit Vadisi boyunca yer alan yerleşim alanlarının doğal afet risk analizi, 450 CBS tabanlı afet bilgi sistemi (KABİS) tasarımı: Proje tanıtımı ve ön bulgular. Aktif Tektonik Araştırma Grubu 11. 451 Çalıştayı, TÜBİTAK-MAM Yer ve Deniz Bilimleri Enstitüsü Gebze-Kocaeli, Türkiye, 14-16, 2007 (in Turkish). 452
Terlemez, İ., Yılmaz A.: Ünye-Ordu-Koyulhisar-Reşadiye arasında kalan yörenin stratigrafisi, TJK Bülteni, 21, 179-191, 1980 453 (in Turkish). 454
Timothy, R. H., Davies, Warburton J., Stuart A. Dunning, Alodie, Bubeck, A. P.: A large landslide event in a post-glacial 455 landscape: rethinking glacial legacy, Earth Surface Processes and Landforms, 38(11), 1261-1268, 456
https://doi.org/10.1002/esp.3377, 2013. 457 Topal, T., Hatiboğlu, O.: Assessment of slope stability and monitoring of a landslide in the Koyulhisar settlement area (Sivas, 458
Turkey), Environ. Earth Sci., 74(5), DOI 10.1007/s12665-015-4476-6, 2015. 459 Toprak, G. M. V.: Tectonic and stratigraphic characterstics of the Koyulhisar segment of the North Anatolian Fault Zone 460
(Sivas-Turkey), METU (unpublished), PhD. Thesis, Ankara, Turkey, 121, 1989. 461 Türk, T.: Hava fotoğrafı ve optik uydu görüntüleri yardımıyla yatay yer değiştirmelerin belirlenmesi, Havacılık ve Uzay 462
Tekn. Derg., 6 (1), 71-79, 2013 (in Turkish). 463 UDİM: Ulusal Deprem İzleme Merkezi (National earthquake monitoring center), Boğaziçi Universty KOERI (Kandilli 464
Observatory And Earthquake Research Institute), www.koeri.boun.edu.tr/sismo/, (last access: 11.04.2018), Istanbul, 465
Turkey, 2016. 466 Uysal, S.: Koyulhisar (Sivas) yöresinin jeolojisi, General Directorate of the Mineral Research and Exploration (MTA) Report 467
number: 9838, 1995 (in Turkish). 468 Ulusay, R., Aydan, Ö., Kılıç, R.: Geotechnical assessment of the 2005 Kuzulu landslide (Turkey), Eng. Geol., 89(1-2), 112-469
128, 2007. 470 Wilchek, L.: Ground Penetrating Radar for Detection of Rock Stucture, MS Thesis, Alberta University, Canada, 2000. 471 Yılmaz, I.: A case study from Koyulhisar (Sivas-Turkey) for landslide susceptibility mapping by artificial neural Networks, 472
Bull. Eng. Geol. and the Environ., 68, 297-306, 2009. 473
Yılmaz, I., Ekemen T., Yıldırım, M., Keskin İ., Özdemir, G.: Failure and flow development of a collapse induced complex 474 landslide: the 2005 Kuzulu (Koyulhisar, Turkey) landslide hazard, Environ. Geol., 49, 467-476, 2005. 475
476
477
478
479
480

12
NHESS - Figures 481
Saytepe
398000 399000 400000 401000
Koyulhisar
Alluvium
Erdembaba Volcanics
Yeþilce Formation
Geophsical study area
Landslide
Fault
0 500 1000 m
N
SivasAnkara
T U R K E Y
Koyulhisar
N
482
Figure 1. Geological map of study area arranged from Sendir and Yılmaz (2002) and Hastaoğlu (2016). 483

13
484
Figure 2. (a) Geophysics and geodetic data collection locations in the study area. (b), (c) and (d) geophysics 485
profile details. 486
487
488
Figure 3. Landslide scene photos (landslide, lanslide cracks and constructional damages). 489

14
490 Figure 4. The seismic profiles of the area A. The uppermost boundary of the bedrock layer (VP3) on the SRT 491
images is aproximately GPR depth. The lower seismic velocity loose layers (consisting of soil and alluviums, the 492
average seismic VP1=0.3 km/s and VP2=1.0 km/s) are on the bedrock (the average seismic VP3>2.0 km/s). 493
494
495
496
497
498
499
500
501
502
503
504
505
506
507

15
508
509
510
Figure 5. The sismic profiles of the area C. The uppermost boundary of the bedrock layer (VP3) on the SRT 511
images is aproximately GPR depth. The lower seismic velocity loose layers (consisting of soil and alluviums, the 512
average seismic VP1=0.3 km/s and VP2=1.0 km/s) are on the bedrock (the average seismic VP3>2.0 km/s). 513
514
515
516
517
518
519
520

16
521
Figure 6. GPR profiles in A area and the deformations in the loose layers (the seismic VP1 and VP2 layers). 522
523
524

17
525
Figure 7. GPR profiles in the C-west area and the deformations in the loose layers (the seismic VP1 and VP2 526
layers). 527
528

18
529
Figure 7. (…contiune) GPR profiles in the C-east area and the deformations in the loose layers (the seismic VP1 530
and VP2 layers). 531
532
533
Figure 8. EM wave velocity calculated for reflection surface in GPR5 in the C-east area cross section as 534
representing all the GPR profiles. 535
536

19
537
Figure 9. Seismic activity of the study area and its surroundings by the data between 1900-2015 and the 538
landslide areas (UDIM, 2016; MTA, 2018). 539
540
541
Figure 10. Precipitation distribution in between 1981-2015 years of Sivas (MGM, 2016). 542
543
544
Figure 11. Average monthly temperature (T, 0C), rainfall (m3) and soil moisture content (cm) change graphics of 545
the study area and its surrounding for 2013-2014. It was prepared from the project data (Hastaoğlu et al., 2015). 546
547

20
Table 548
Table 1. The annual average meteorological values of Sivas by years between 1950-2015 (MGM, 2016). 549
SIVAS January February March April May June July August September October November December
The average tempreture (0C) -3.2 -2.0 2.9 9.1 13.5 17.2 20.2 20.2 16.2 10.8 4.6 -0.6
The average the highest tempreture (0C)
1.0 2.6 8.1 15.3 20.0 24.0 27.9 28.5 24.7 18.4 10.6 3.7
The average the lowest tempreture (0C)
-7.0 -6.2 -1.7 3.4 7.2 9.9 12.0 11.9 8.3 4.4 -0.2 -4.2
The average sunshine duration (hour)
2.3 3.3 4.5 6.2 8.1 10.4 12.1 11.4 9.4 6.3 4.1 2.3
The average number of rainy days
13.0 12.4 13.7 14.0 14.4 8.8 2.5 2.1 4.3 8.0 9.5 12.1
The average monthly total rainfall (kg/m 2)
42.0 40.3 46.0 59.1 60.7 34.8 8.5 5.9 16.9 32.9 41.0 44.2
The highest and the lowest values occurring over many years (1950-2015) The highest tempreture (0C) 14.6 18.1 25.2 29.0 32.0 35.5 40.0 39.4 35.7 30.5 22.8 19.4
The lowest tempreture (0C) -34.6 -34.4 -27.6 -10.9 -4.2 -0.3 3.4 3.2 -3.8 -8.1 -24.4 -27.0
Daily total the highest rainfall 2 May 1991 55.0
kg/m2 Daily the fastest wind 5 Jan. 1996 122.8
km/h The highest snow 2 Feb. 1950 110.0 cm
550