Embed Size (px)
Citation preview
COOPERATIVE GROUNDWATER REPORT 10
ILLINOIS STATE GEOLOGICAL SURVEYILLINOIS STATE WATER SURVEY
Champaign, Illinois 61820
In cooperation withUnited States Geological SurveyUrbana, Illinois 61801
GEOLOGY, HYDROLOGY, AND WATER QUALITY
OF THE CAMBRIAN AND ORDOVlClAN SYSTEMS
IN NORTHERN ILLINOIS
Adrian P. Visocky, Marvin G. Sherrill, and Keros Cartwright
1985
STATE OF ILLINOIS
DEPARTMENT OF ENERGY AND NATURAL RESOURCES
GEOLOGY, HYDROLOGY, AND WATER QUALITY
OF THE CAMBRIAN AND ORDOVICIAN SYSTEMS
IN NORTHERN ILLINOIS
Adrian P. Visocky, Marvin G. Sherrill, and Keros Cartwright
STATE WATER SURVEY STATE GEOLOGICAL SURVEY
U.S. GEOLOGICAL SURVEY
CHAMPAIGN, ILLINOIS 1985
STATE OF ILLINOISHON. JAMES R. THOMPSON, Governor
DEPARTMENT OF ENERGY AND NATURAL RESOURCESDON ETCHISON, Ph.D., Director
BOARD OF NATURAL RESOURCES AND CONSERVATION
Don Etchison, Ph.D., Chairman
Walter E. Hanson, M.S., Engineering
Laurence L. Sloss, Ph.D., Geology
H. S. Gutowsky, Ph.D., Chemistry
Lorin I. Nevling, Ph.D., Forestry
Robert L. Metcalf, Ph.D., Biology
Theodore L. Brown, Ph.D.University of Illinois
John C. Guyon, Ph.D.Southern Illinois University
STATE WATER SURVEY STATE GEOLOGICAL SURVEYStanley A. Changnon, Jr., M.S., Chief Morris W. Leighton, Ph.D., Chief
Printed by authority of the State of Illinois/5000/1985
Abstract . . . . . . . . . . . . . . . . . . . . . . . . . . . . . .
Introduction . . . . . . . . . . . . . . . . . . . . . . . . . . . .Physical Setting . . . . . . . . . . . . . . . . . . . . . . .Purpose and Scope . . . . . . . . . . . . . . . . . . . . . .Methodology . . . . . . . . . . . . . . . . . . . . . . . . . .Previous Reports and Related Work . . . . . . . . . . . . . . .Acknowledgments . . . . . . . . . . . . . . . . . . . . . . . .
1
3399
1112
Geology . . . . . . . . . . . . . . . . . . . . . . . . . . . . . .Introduction . . . . . . . . . . . . . . . . . . . . . . . . .Precambrian Surface . . . . . . . . . . . . . . . . . . . . . . .Cambrian and Ordovician Systems . . . . . . . . . . . . . . . .
Elmhurst-Mt. Simon Sandstone . . . . . . . . . . . . . . .Lombard and Proviso Members of Eau Claire Formation
(Basal Sandstone Confining Unit) . . . . . . . . . . .Ironton and Galesville Sandstones . . . . . . . . . . . .Knox Megagroup (Middle Confining Unit) . . . . . . . . . .
Franconia Formation . . . . . . . . . . . . . . . . .Potosi Dolomite . . . . . . . . . . . . . . . . . . .Eminence Formation. . . . . . . . . . . . . . . . . .Jordan Sandstone. . . . . . . . . . . . . . . . . . .Prairie du Chien Group . . . . . . . . . . . . . . .
Ancell Group . . . . . . . . . . . . . . . . . . . . . . .St. Peter Sandstone . . . . . . . . . . . . . . . . .Glenwood Formation . . . . . . . . . . . . . . . . .
Ottawa Limestone Megagroup . . . . . . . . . . . . . . . .Platteville Group . . . . . . . . . . . . . . . . . . .Galena Group . . . . . . . . . . . . . . . . . . . .
Maquoketa Shale Group . . . . . . . . . . . . . . . . . .Scales Shale . . . . . . . . . . . . . . . . . . . .Fort Atkinson Limestone . . . . . . . . . . . . . .Brainard Shale . . . . . . . . . . . . . . . . . . .Neda Formation . . . . . . . . . . . . . . . . . . .
Post-Ordovician Systems . . . . . . . . . . . . . . . . . . . .Silurian System . . . . . . . . . . . . . . . . . . . . .Devonian System . . . . . . . . . . . . . . . . . . . . .Carboniferous Systems . . . . . . . . . . . . . . . . . .Cretaceous and Tertiary Systems . . . . . . . . . . . . .Quaternary System . . . . . . . . . . . . . . . . . . . .
1313131516
18232427292929293034353536363842424242434345454647
Hydrogeology . . . . . . . . . . . . . . . . . . . . . . . . . . . . 51Introduction. . . . . . . . . . . . . . . . . . . . . . . . . 51Aquisystems and Aquigroups . . . . . . . . . . . . . . . . . . 51
Crystalline Rock Aquisystem . . . . . . . . . . . . . . . 51Indurated Rock Aquisystem . . . . . . . . . . . . . . . . . 51
Basal Bedrock Aquigroup . . . . . . . . . . . . . . . 51
CONTENTS
Page
Concluded on next page
CONTENTS (Concluded)
Page
Midwest Bedrock Aquigroup . . . . . . . . . . . . . . 54Ironton-Galesville Aquifer . . . . . . . . . . . 55Middle Confining Unit. . . . . . . . . . . . . . 55Ancell Aquifer . . . . . . . . . . . . . . . . . 56Galena-Platteville Unit . . . . . . . . . . . . 56Maquoketa Confining Unit . . . . . . . . . . . . 56
Mississippi Valley Bedrock Aquigroup . . . . . . . . 57Upper Bedrock Aquigroup . . . . . . . . . . . . . . . 57
Non-indurated Rock Aquisystem . . . . . . . . . . . . . . 58Prairie Aquigroup . . . . . . . . . . . . . . . 58
Hydrology . . . . . . . . . . . . . . . . . . . . . . . . . . . . . . 59Hydraulic Properties . . . . . . . . . . . . . . . . . . . . . 59
Aquifer Tests . . . . . . . . . . . . . . . . . . . . . . 60Basal Bedrock Aquigroup . . . . . . . . . . . . . . . 60Midwest Bedrock Aquigroup . . . . . . . . . . . . . . 61Upper Bedrock Aquigroup . . . . . . . . . . . . . . . 63
Specific Capacity Analyses . . . . . . . . . . . . . . . . . 64Basal Bedrock Aquigroup . . . . . . . . . . . . . . . 65Midwest Bedrock Aquigroup . . . . . . . . . . . . . . 65Upper Bedrock Aquigroup . . . . . . . . . . . . . . . 65
Leakage Coefficient . . . . . . . . . . . . . . . . . . . 66Basal Bedrock Aquigroup Confining Unit . . . . . . . 66Midwest Bedrock Aquigroup Confining Unit . . . . . . 66
Piezometric Surface of Midwest Bedrock Aquigroup . . . . . . . 67Recharge and Movement of Groundwater . . . . . . . . . . . . . 74Historical Pumpage . . . . . . . . . . . . . . . . . . . . . . 79Potential Development of Midwest Bedrock Aquigroup . . . . . . 84
Practical Sustained Yield . . . . . . . . . . . . . . . . 84Well Yields . . . . . . . . . . . . . . . . . . . . . . . 85
Groundwater Quality . . . . . . . . . . . . . . . . . . . . . . . . 87Introduction . . . . . . . . . . . . . . . . . . . . . . . . . 87Water Quality of the "Unconfinedt" Area . . . . . . . . . . . . 89Water Quality of the Confined Area . . . . . . . . . . . . . . 95
Maquoketa Confining Unit . . . . . . . . . . . . . . . . . 97Galena-Platteville and Ancell Aquifers . . . . . . . . . . 97Ironton-Galesville Aquifer . . . . . . . . . . . . . . . . 99Basal Bedrock Aquigroup. . . . . . . . . . . . . . . . . . 99
Summary and Conclusions. . . . . . . . . . . . . . . . . . . . . . . 104
Selected Bibliography. . . . . . . . . . . . . . . . . . . . . . . . 107
AppendicesAppendix A - Data from Key Wells . . . . . . . . . . . . . . . 119Appendix B - Drilling and Testing . . . . . . . . . . . . . . . 131Appendix C - Selected Chemical Analyses . . . . . . . . . . . . 133
FIGURES
PageNumber
1
2
3
4
5
6
7
8
9 Thickness of the Basal Sandstone Confining Unit. . . . . . 21
IO Elevation (MSL) of the top of the Basal Sandstone
11
12
13
14
15
16
17
18
19
20
21
22
Location of study area . . . . . . . . . . . . . . . . . . 4
Physiographic divisions in Illinois. . . . . . . . . . . . 5
Mean January and July temperatures for Illinois. . . . . . 6
Average annual Illinois precipitation, in inches,derived from 1901-1944 data. . . . . . . . . . . . . . . . 7
Drainage map of Illinois . . . . . . . . . . . . . . . . . 8
Elevation (MSL) of the top of the Precambrian rocks. . . . 14
Thickness of the Elmhurst-Mt. Simon Sandstone. . . . . . . 17
Elevation (MSL) of the top of the Elmhurst-Mt. SimonSandstone. . . . . . . . . . . . . . . . . . . . . . . . . 19
Confining Unit . . . . . . . . . . . . . . . . . . . . . . 22
Thickness of the Ironton and Galesville Formations . . . . 25
Elevation (MSL) of the top of the Ironton Formation. . . . 26
Thickness of units between the base of the AncellGroup and the surface (top) of the Ironton Formation . . . 28
Thickness of the Ancell Group. . . . . . . . . . . . . . . 31
Elevation (MSL) of the top of the Ancell Group . . . . . . 32
Elevation (MSL) of the base of the Ancell Group. . . . . . 33
Thickness of the Galena and Platteville Groups . . . . . . 37
Elevation (MSL) of the top of the Galena Group . . . . . . 39
Thickness of the Maquoketa Shale Group . . . . . . . . . . 40
Elevation (MSL) of the top of the Maquoketa Shale Group. . 41
Bedrock geology of Illinois. . . . . . . . . . . . . . . . 44
Thickness of the Pleistocene deposits. . . . . . . . . . . 48
Continued on next page
Number
23
24
25
26
27
28
29
30
31
32
33
34
35
36
37
38 Cross section D-D' from Dubuque, Iowa, to Raritan,Illinois, showing geology, dominant anions, anddissolved solids concentration . . . . . . . . . . . . . . 94
Concluded on next page
FIGURES (Continued)
Page
Quaternary deposits of Illinois. . . . . . . . . . . . . . 50
Stratigraphy and water-yielding properties of the rocksand character of the groundwater in the study area . . . . 52
Regional transmissivities in the Midwest BedrockAquigroup. . . . . . . . . . . . . . . . . . . . . . . . . 62
Approximate piezometric surface (MSL) of the MidwestBedrock Aquigroup at the time of initial development . . . 68
Piezometric surface (MSL) of the Midwest BedrockAquigroup in October 1971. . . . . . . . . . . . . . . . . 69
Piezometric surface (MSL) of the Midwest BedrockAquigroup in October 1980. . . . . . . . . . . . . . . . . 70
Piezometric surface (MSL) of the Midwest BedrockAquigroup, October 1980, northeastern Illinois . . . . . . 71
Flow-net analysis using 1971 piezometric surface map . . . 76
Flow-net analysis using piezometric surface map forthe time of initial development. . . . . . . . . . . . . . 78
Pumpage growth in the Midwest Bedrock Aquigroup. . . . . . 82
Observed yields of wells in the Midwest BedrockAquigroup. . . . . . . . . . . . . . . . . . . . . . . . . 86
General changes in water type with increasing lengthof groundwater flow path . . . . . . . . . . . . . . . . . 88
Cross section A-A' from Dubuque, Iowa, to Zion,Illinois, showing geology, dominant anions, anddissolved solids concentration . . . . . . . . . . . . . . 91
Cross section B-B' from Fulton, Illinois, toChicago, Illinois, showing geology, dominant anions,and dissolved solids concentration . . . . . . . . . . . . 92
Cross section C-C' from South Beloit, Illinois, toMinonk, Illinois, showing geology, dominant anions,and dissolved solids concentration . . . . . . . . . . 93
FIGURES (Concluded)
Number
39
40
41
42
43
44
45 Temperature logs of two wells in northern Illinois . . . . 103
Page
Map of 500 mg/L isocons of dissolved solids formajor producing units. . . . . . . . . . . . . . . . . . . 96
Generalized concentrations of dissolved solids in theGalena-Platteville aquifer . . . . . . . . . . . . . . . . 98
Generalized concentrations of dissolved solids in theAncell aquifer . . . . . . . . . . . . . . . . . . . . . . 98
Generalized concentrations of dissolved solids in theIronton-Galesville aquifer . . . . . . . . . . . . . . . . 100
Generalized concentrations of dissolved solids in theupper part (200-300 feet) of the Basal Bedrock Aquigroup . 100
Concentration of chloride and dissolved solids versusaltitude in the Basal Bedrock Aquigroup. . . . . . . . . . 101
Number
1
2
3
4
5
6
TABLES
Page
Hydraulic properties in the Basal Bedrock Aquigroup. . . . 61
Storage coefficients of the Midwest Bedrock Aquigroup. . . 61
Units of Midwest Bedrock Aquigroup dewatered in majorpumping centers, Fall 1980 . . . . . . . . . . . . . . . . 74
Recharge rates in north-central Illinois in 1971 . . . . . 77
Average pumpage from the Cambrian and Ordovicianaquifers from 1861 through 1980 in mgd . . . . . . . . . . 80
Water-quality data from packer tests in Limback wellin Galena, Illinois. . . . . . . . . . . . . . . . . . . . 90
ABSTRACT
Cambrian and Ordovician strata provide much of the groundwater supply
for approximately 250 municipalities and 150 industries in the northern half
of Illinois. This report represents the cooperative effort of the Illinois
State Water Survey, Illinois State Geological Survey, and U.S. Geological
Survey to provide a current hydrogeologic evaluation of this water resource.
The Cambrian and Ordovician aquifers average approximately 1000 feet in
thickness. Although numerous alternating layers of sandstones, limestone,
and dolomites impart a heterogeneous character to them, these units are
hydraulically interconnected and behave as a single aquifer. Hydraulic
properties within the aquifers are generally affected by local or regional
changes in thickness of the Ancell and Ironton-Galesville aquifers. Recharge
occurs principally by vertical percolation of precipitation in areas where
the Galena-Platteville Unit is the uppermost bedrock. Additional recharge in
heavily pumped areas occurs through leakage across the Maquoketa Confining
Unit.
This report introduces formal hydrostratigraphic names in describing
major aquifers as divided into three aquisystems, each of which is subdivided
into aquigroups. The three aquisystems and their aquigroups are: 1) Non-
Indurated Rock Aquisystem, consisting of the Prairie Aquigroup - local and
intermediate flow systems in alluvium, glacial drift, and Cretaceous and
Tertiary sediments; 2) Indurated Rock Aquisystem, divided into a) Upper
Bedrock Aquigroup - local and intermediate flow systems with connection to
the Prairie Aquigroup, b) Mississippi Valley Bedrock Aquigroup - intermediate
and regional flow systems in indurated rock that are always confined by
indurated rock aquitards and whose base is the top of the Maquoketa Shale
Group, c) Midwest Bedrock Aquigroup - intermediate and regional flow systems
whose top is the top of the Maquoketa Shale Group or other confining units
and whose bottom is at the top of the Eau Claire Formation or stratigraph-
ically higher, and d) Basal Bedrock Aquigroup - intermediate and regional
flow systems below the shale units of the Eau Claire Formation and above the
crystalline basement rocks; and 3) Crystalline Rock Aquisystem, in which
there are no significant aquifers in Illinois. The Midwest Bedrock Aquigroup
1
is basically the same as the "Cambrian-Ordovician Aquifer" in northeastern
Illinois that has been previously described. It is the chief topic of
concern in this report.
The practical sustained yield of the Midwest Bedrock Aquigroup was
estimated to be 65 mgd (million gallons per day) in northeastern Illinois.
Pumpage has exceeded this amount since about 1958. In north-central and
northwestern Illinois, development has not exceeded the practical sustained
yield, which is probably at least as great as that for northeastern Illinois.
The practical sustained yield in western Illinois is limited by the amount of
lateral inflow that can be induced and also by poor water quality.
Individual wells in the Midwest Bedrock Aquigroup in northern Illinois
usually exceed 500 gpm (gallons per minute) in yield, but in western Illinois
typical well yields are smaller. Total withdrawals from deep wells between
1971 and 1980 averaged 278.6 mgd. The largest withdrawals occur in Cook,
DuPage, Kane, and Will Counties. Withdrawals have caused water levels to
decline as much as 900 feet in parts of Cook, DuPage, and Will Counties.
Dewatering of the upper aquifers in the Midwest Bedrock Aquigroup has begun
in portions of the above four counties.
Groundwater in the "unconfined" area of the Midwest Bedrock Aquigroup is
chemically homogeneous and low in total dissolved solids. However, signifi-
cant vertical and areal changes in the chemical character of groundwater
occur in the confined area. As water moves away from the recharge area to
the east and south, it increases in total dissolved solids.
2
INTRODUCTION
Physical Setting
The Cambrian and Ordovician aquifers described in this report underlie
most of the northern half of Illinois (fig. 1). The land surface configura-
tion of most of this part of the state is the result of glaciation, and the
physiographic features shown on figure 2 largely reflect this glaciation.
The study area is essentially a broad prairie plain, with the exception
of the Rock River Hill Country and the Wisconsin Driftless Section in the
northwest corner of the state (fig. 2). The soils are largely deep, black,
and rich in organic content and lime, have good moisture-retaining capa-
bilities, and form part of one of the richest agricultural belts in the
world.
Relief in the study area ranges from a high of 1235 feet above sea level
at Charles Mound in the northwest corner of the state (Jo Daviess County) to
about 580 feet above sea level at Lake Michigan and about 420 feet above sea
level at the juncture of the Illinois and Mississippi Rivers near Grafton
(Jersey County). The greatest differences in local relief are near major
valleys, particularly in the uplands of the northwest.
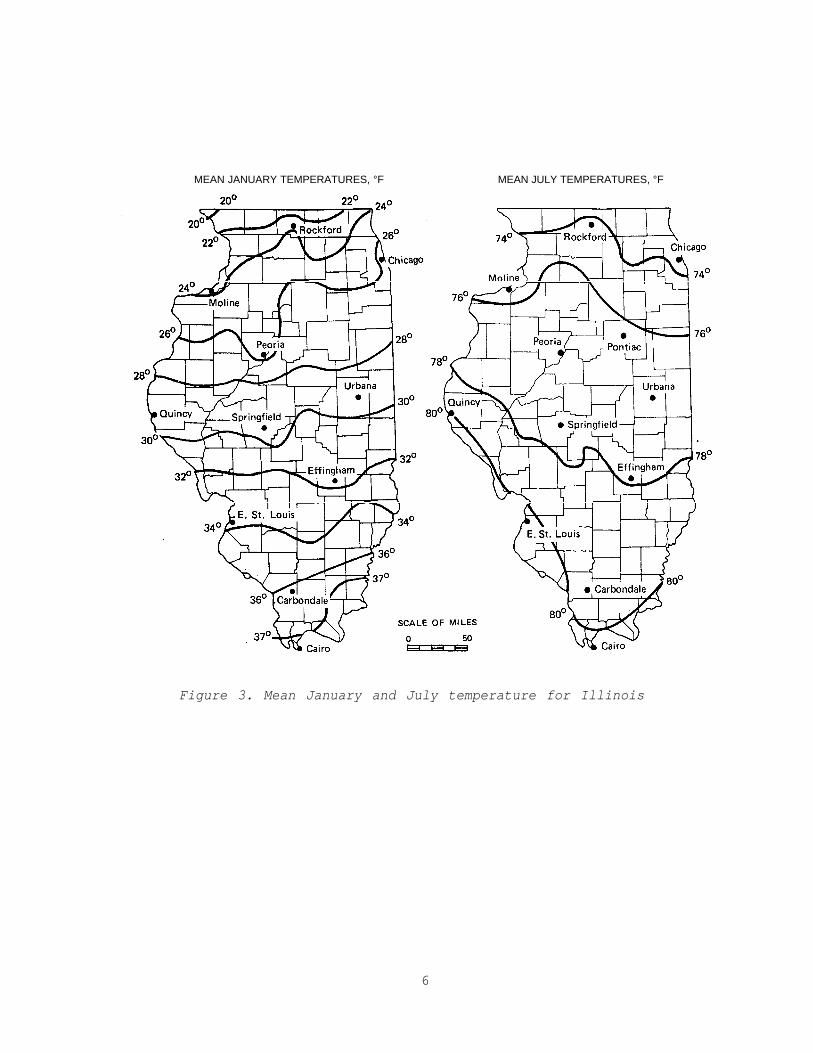
The climate in northern Illinois is continental, with warm summers and
cold winters (fig. 3). The mean January temperatures range from about 20°F
in the northwestern tip of the state (Jo Daviess County) to about 32°F near
the confluence of the Illinois and Mississippi Rivers. Mean temperatures in
July range from about 74°F to 80°F for the entire area. The length of the
growing season for most of the area is in the 160- to 180-day range.
Average annual precipitation, like temperature, generally increases from
north to south (fig. 4). The range of precipitation is from about 32 inches
per year near Lake Michigan to about 38 inches per year in the southern part
of the study area. February is normally the driest month, and June is the
wettest.
A drainage map of Illinois is shown in figure 5. The major drainage
ways are the Mississippi River and its tributaries along the western border
of the study area, and the Illinois River and its tributaries in most of the
central and eastern parts of the study area. In northeastern Illinois water
3
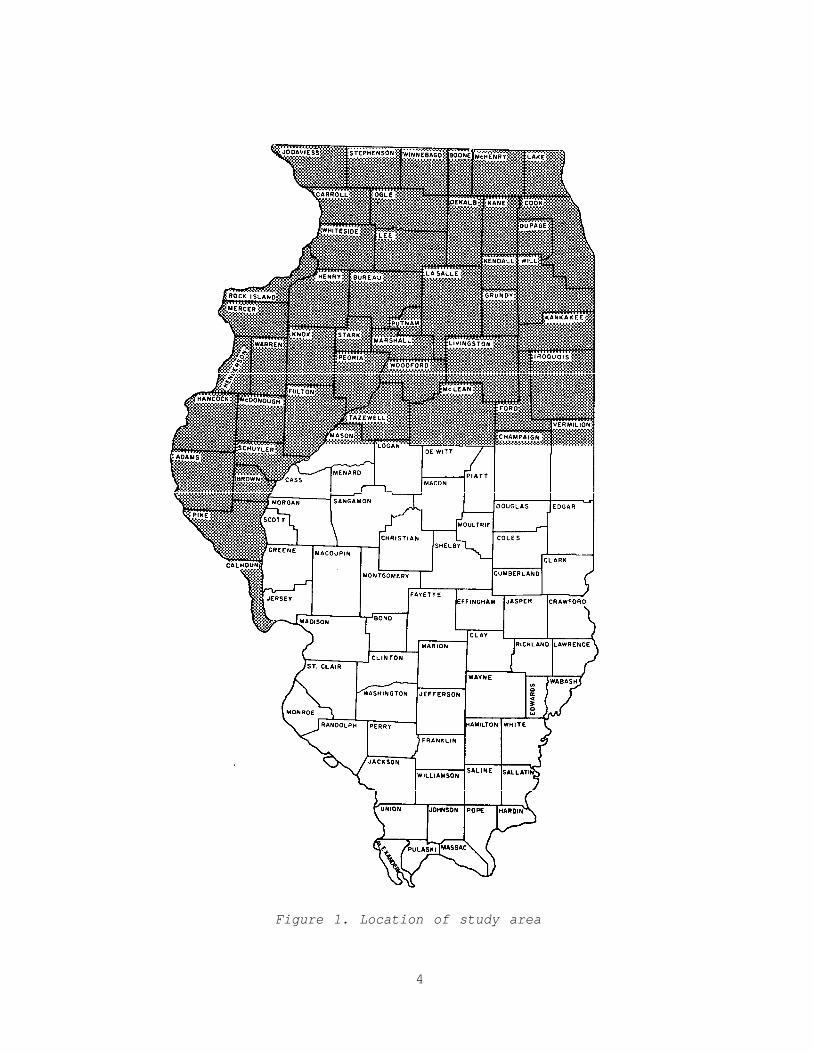
Figure 1. Location of study area
4
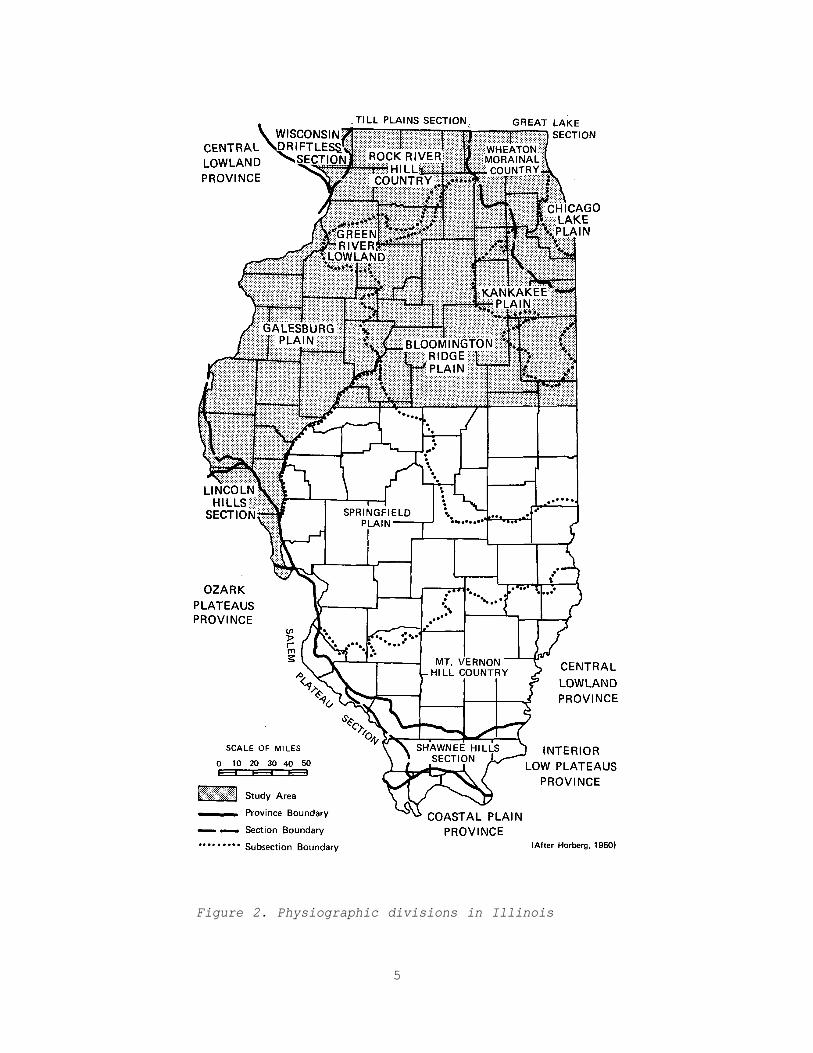
Figure 2. Physiographic divisions in Illinois
5
MEAN JANUARY TEMPERATURES, °F MEAN JULY TEMPERATURES, °F
Figure 3. Mean January and July temperature for Illinois
6
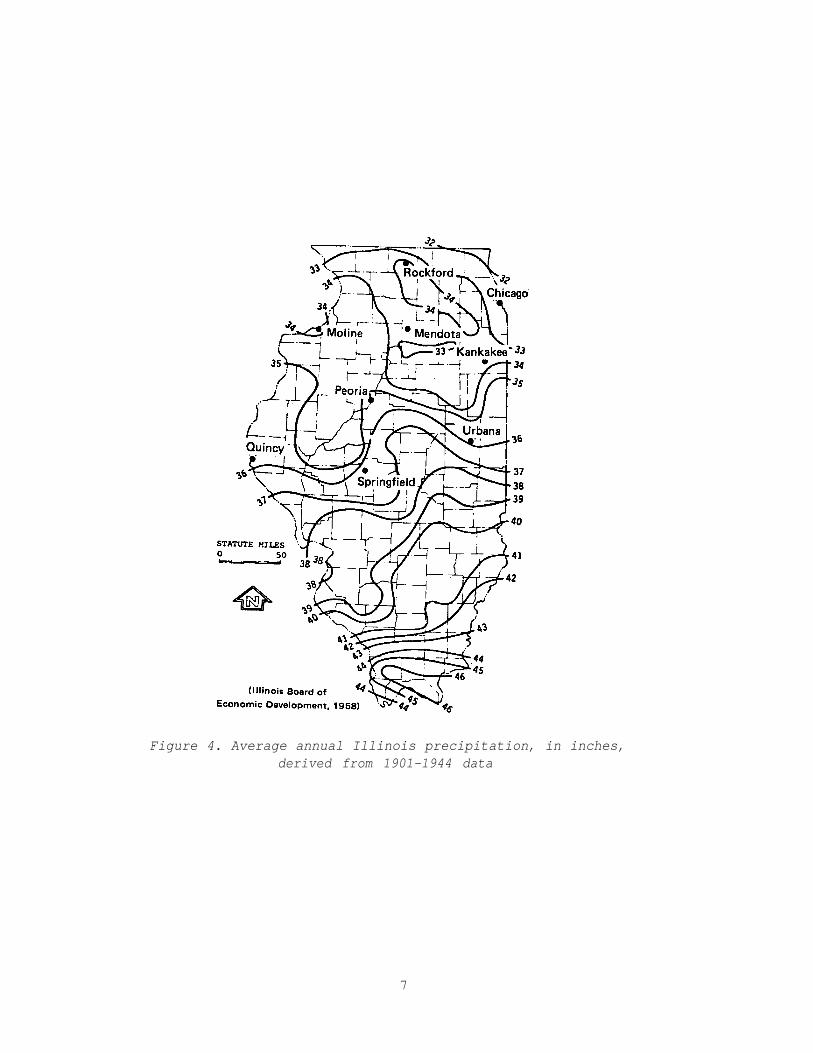
Figure 4. Average annual Illinois precipitation, in inches,derived from 1901-1944 data
7
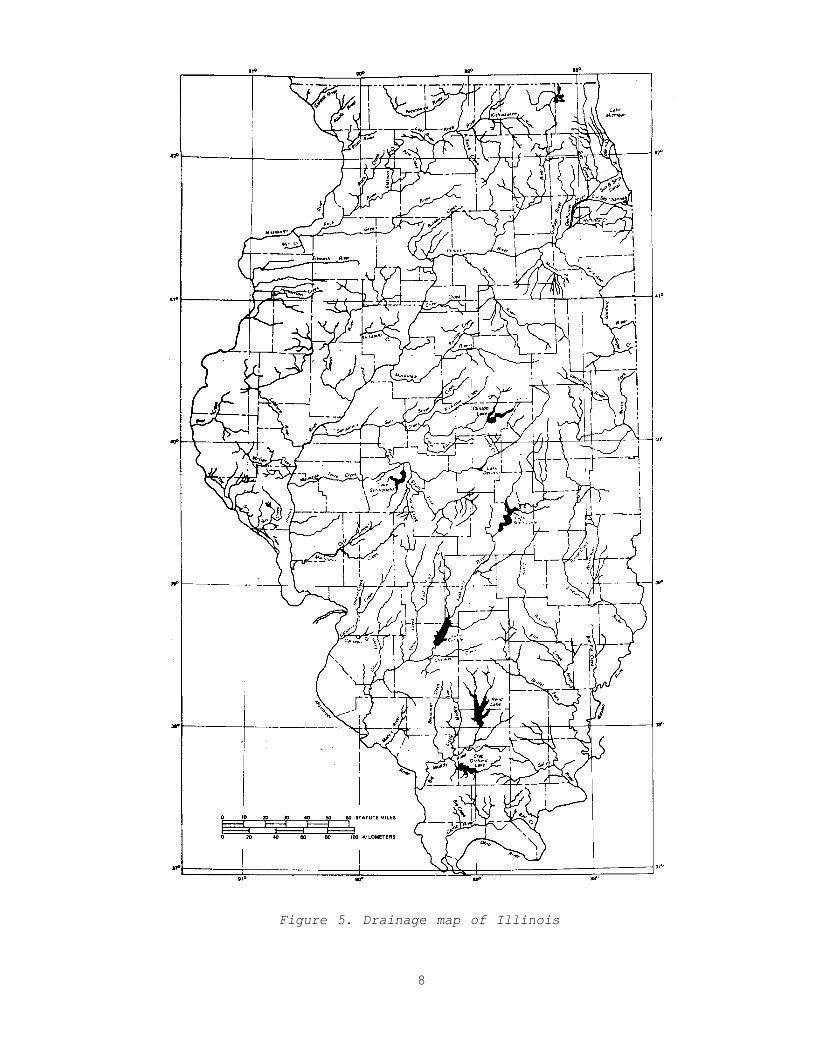
Figure 5. Drainage map of Illinois
8
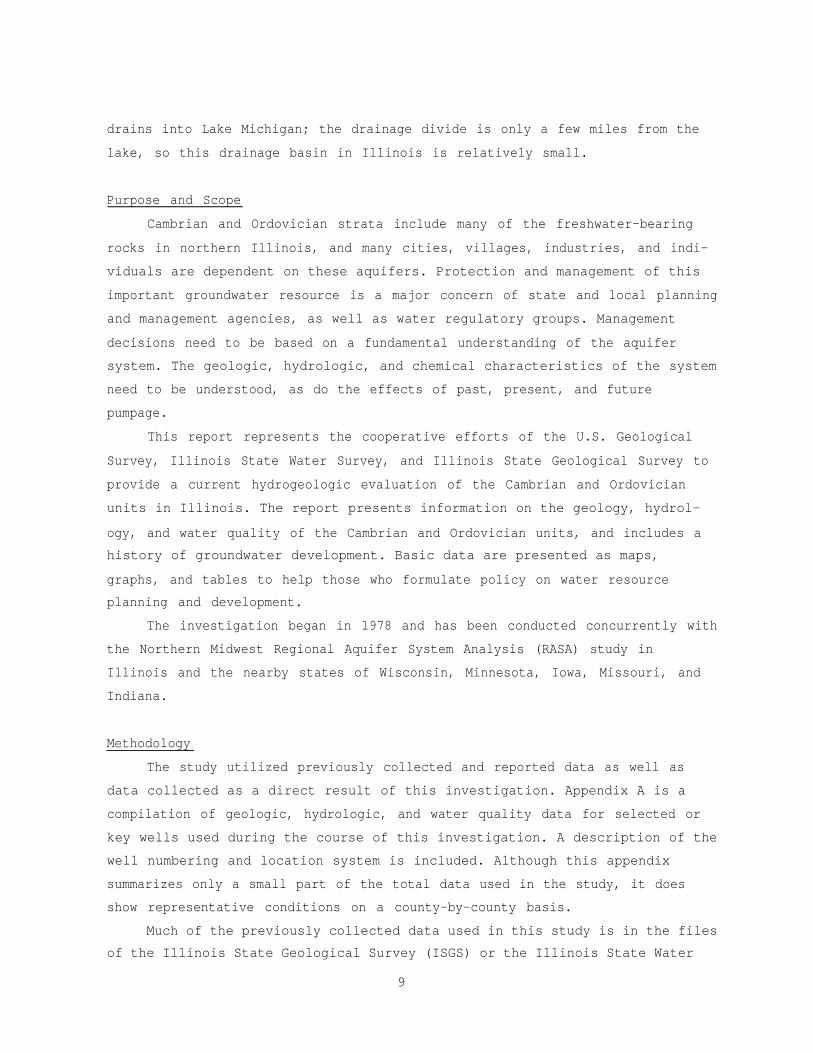
drains into Lake Michigan; the drainage divide is only a few miles from the
lake, so this drainage basin in Illinois is relatively small.
Purpose and Scope
Cambrian and Ordovician strata include many of the freshwater-bearing
rocks in northern Illinois, and many cities, villages, industries, and indi-
viduals are dependent on these aquifers. Protection and management of this
important groundwater resource is a major concern of state and local planning
and management agencies, as well as water regulatory groups. Management
decisions need to be based on a fundamental understanding of the aquifer
system. The geologic, hydrologic, and chemical characteristics of the system
need to be understood, as do the effects of past, present, and future
pumpage.
This report represents the cooperative efforts of the U.S. Geological
Survey, Illinois State Water Survey, and Illinois State Geological Survey to
provide a current hydrogeologic evaluation of the Cambrian and Ordovician
units in Illinois. The report presents information on the geology, hydrol-
ogy, and water quality of the Cambrian and Ordovician units, and includes a
history of groundwater development. Basic data are presented as maps,
graphs, and tables to help those who formulate policy on water resource
planning and development.
The investigation began in 1978 and has been conducted concurrently with
the Northern Midwest Regional Aquifer System Analysis (RASA) study in
Illinois and the nearby states of Wisconsin, Minnesota, Iowa, Missouri, and
Indiana.
Methodology
The study utilized previously collected and reported data as well as
data collected as a direct result of this investigation. Appendix A is a
compilation of geologic, hydrologic, and water quality data for selected or
key wells used during the course of this investigation. A description of the
well numbering and location system is included. Although this appendix
summarizes only a small part of the total data used in the study, it does
show representative conditions on a county-by-county basis.
Much of the previously collected data used in this study is in the files
of the Illinois State Geological Survey (ISGS) or the Illinois State Water
9
Survey (ISWS) or is contained in reports by these two agencies. Well drillers'
logs and sample cutting analyses were obtained from the ISGS files and evalu-
ated by ISGS and U.S. Geological Survey (USGS) personnel. Logs were utilized
to determine stratigraphic contacts from which structural contour and isopach
geologic maps were prepared or updated. Hydraulic data from ISWS files were
summarized and evaluated, and interpretive maps and tables were prepared.
Much of the data concerning water quality analyses, pumpage, and water level
information also came from ISWS files or from published reports.
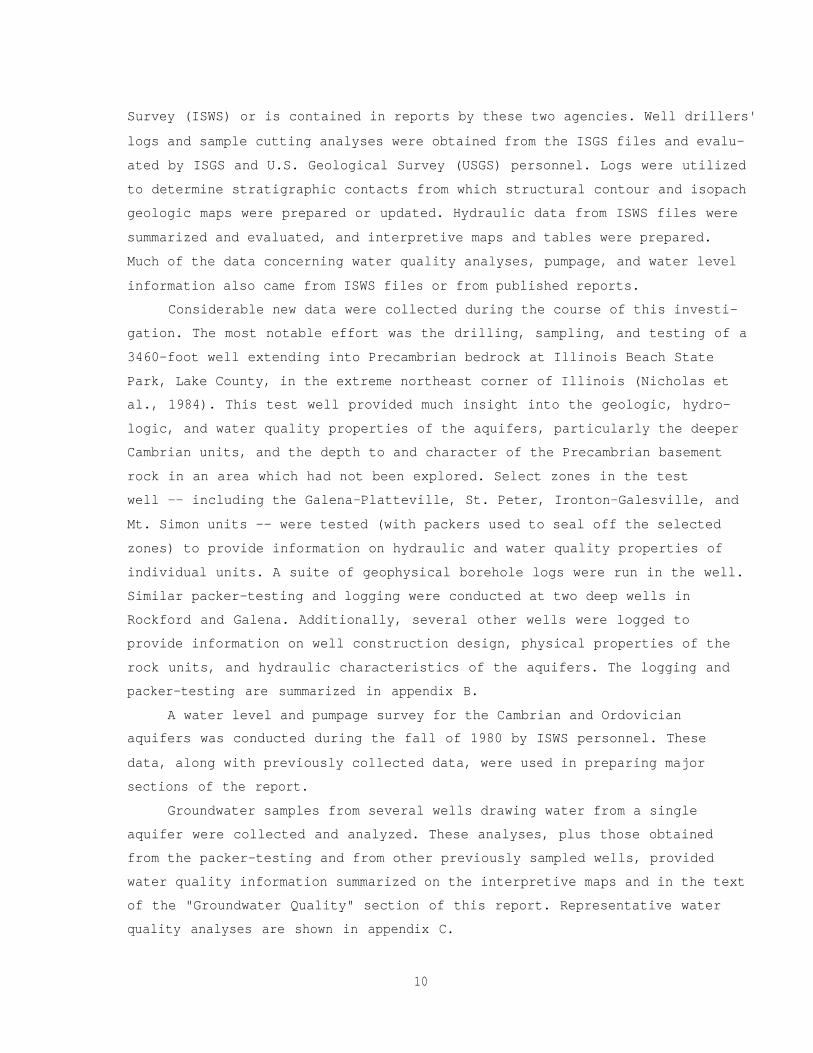
Considerable new data were collected during the course of this investi-
gation. The most notable effort was the drilling, sampling, and testing of a
3460-foot well extending into Precambrian bedrock at Illinois Beach State
Park, Lake County, in the extreme northeast corner of Illinois (Nicholas et
al., 1984). This test well provided much insight into the geologic, hydro-
logic, and water quality properties of the aquifers, particularly the deeper
Cambrian units, and the depth to and character of the Precambrian basement
rock in an area which had not been explored. Select zones in the test
well -- including the Galena-Platteville, St. Peter, Ironton-Galesville, and
Mt. Simon units -- were tested (with packers used to seal off the selected
zones) to provide information on hydraulic and water quality properties of
individual units. A suite of geophysical borehole logs were run in the well.
Similar packer-testing and logging were conducted at two deep wells in
Rockford and Galena. Additionally, several other wells were logged to
provide information on well construction design, physical properties of the
rock units, and hydraulic characteristics of the aquifers. The logging and
packer-testing are summarized in appendix B.
A water level and pumpage survey for the Cambrian and Ordovician
aquifers was conducted during the fall of 1980 by ISWS personnel. These
data, along with previously collected data, were used in preparing major
sections of the report.
Groundwater samples from several wells drawing water from a single
aquifer were collected and analyzed. These analyses, plus those obtained
from the packer-testing and from other previously sampled wells, provided
water quality information summarized on the interpretive maps and in the text
of the "Groundwater Quality" section of this report. Representative water
quality analyses are shown in appendix C.
10
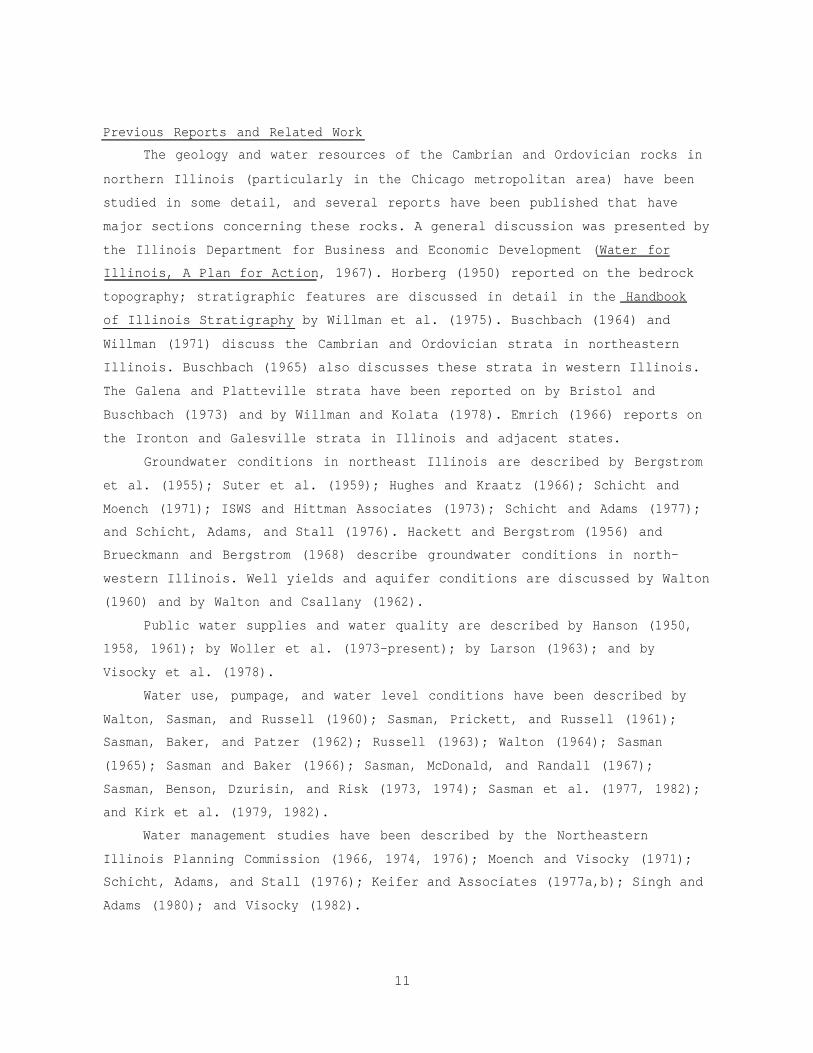
Previous Reports and Related Work
The geology and water resources of the Cambrian and Ordovician rocks in
northern Illinois (particularly in the Chicago metropolitan area) have been
studied in some detail, and several reports have been published that have
major sections concerning these rocks. A general discussion was presented by
the Illinois Department for Business and Economic Development (Water for
Illinois, A Plan for Action, 1967). Horberg (1950) reported on the bedrock
topography; stratigraphic features are discussed in detail in the Handbook
of Illinois Stratigraphy by Willman et al. (1975). Buschbach (1964) and
Willman (1971) discuss the Cambrian and Ordovician strata in northeastern
Illinois. Buschbach (1965) also discusses these strata in western Illinois.
The Galena and Platteville strata have been reported on by Bristol and
Buschbach (1973) and by Willman and Kolata (1978). Emrich (1966) reports on
the Ironton and Galesville strata in Illinois and adjacent states.
Groundwater conditions in northeast Illinois are described by Bergstrom
et al. (1955); Suter et al. (1959); Hughes and Kraatz (1966); Schicht and
Moench (1971); ISWS and Hittman Associates (1973); Schicht and Adams (1977);
and Schicht, Adams, and Stall (1976). Hackett and Bergstrom (1956) and
Brueckmann and Bergstrom (1968) describe groundwater conditions in north-
western Illinois. Well yields and aquifer conditions are discussed by Walton
(1960) and by Walton and Csallany (1962).
Public water supplies and water quality are described by Hanson (1950,
1958, 1961); by Woller et al. (1973-present); by Larson (1963); and by
Visocky et al. (1978).
Water use, pumpage, and water level conditions have been described by
Walton, Sasman, and Russell (1960); Sasman, Prickett, and Russell (1961);
Sasman, Baker, and Patzer (1962); Russell (1963); Walton (1964); Sasman
(1965); Sasman and Baker (1966); Sasman, McDonald, and Randall (1967);
Sasman, Benson, Dzurisin, and Risk (1973, 1974); Sasman et al. (1977, 1982);
and Kirk et al. (1979, 1982).
Water management studies have been described by the Northeastern
Illinois Planning Commission (1966, 1974, 1976); Moench and Visocky (1971);
Schicht, Adams, and Stall (1976); Keifer and Associates (1977a,b); Singh and
Adams (1980); and Visocky (1982).
11
Steinhilber and Young (1979) presented a plan for a regional study of
the Cambrian and Ordovician units. Kontis and Mandle (1980) developed a data
base for this same regional study.
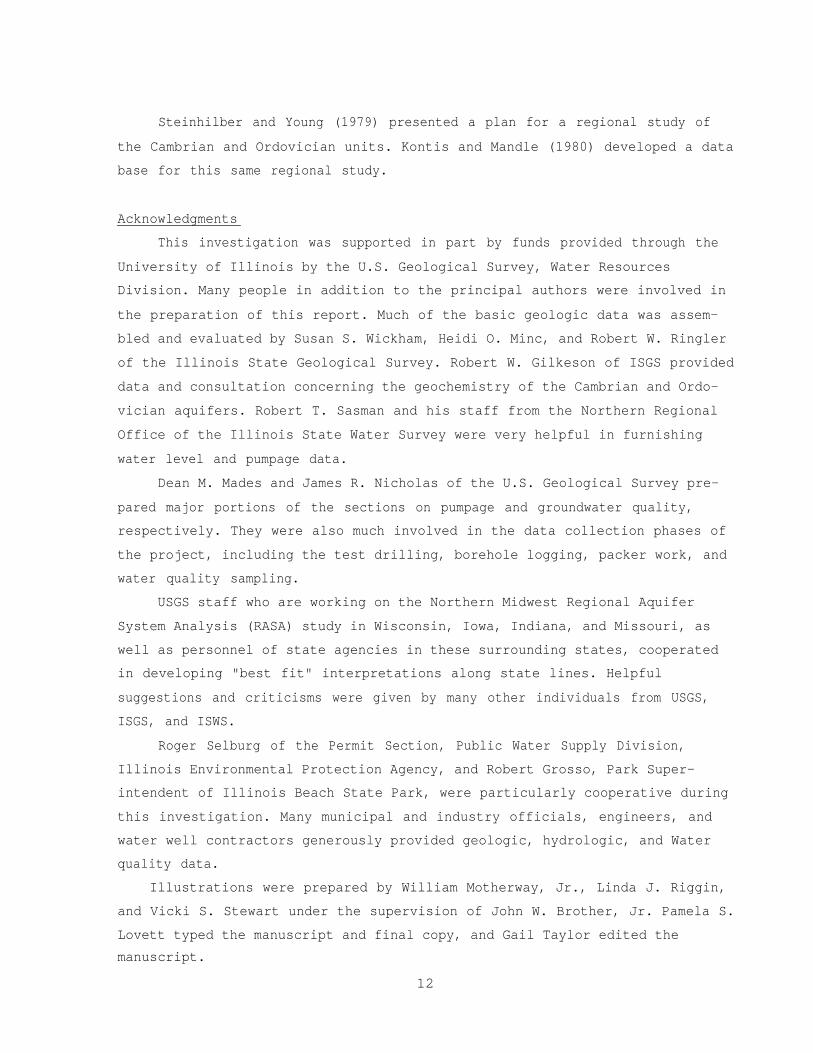
Acknowledgments
This investigation was supported in part by funds provided through the
University of Illinois by the U.S. Geological Survey, Water Resources
Division. Many people in addition to the principal authors were involved in
the preparation of this report. Much of the basic geologic data was assem-
bled and evaluated by Susan S. Wickham, Heidi O. Minc, and Robert W. Ringler
of the Illinois State Geological Survey. Robert W. Gilkeson of ISGS provided
data and consultation concerning the geochemistry of the Cambrian and Ordo-
vician aquifers. Robert T. Sasman and his staff from the Northern Regional
Office of the Illinois State Water Survey were very helpful in furnishing
water level and pumpage data.
Dean M. Mades and James R. Nicholas of the U.S. Geological Survey pre-
pared major portions of the sections on pumpage and groundwater quality,
respectively. They were also much involved in the data collection phases of
the project, including the test drilling, borehole logging, packer work, and
water quality sampling.
USGS staff who are working on the Northern Midwest Regional Aquifer
System Analysis (RASA) study in Wisconsin, Iowa, Indiana, and Missouri, as
well as personnel of state agencies in these surrounding states, cooperated
in developing "best fit" interpretations along state lines. Helpful
suggestions and criticisms were given by many other individuals from USGS,
ISGS, and ISWS.
Roger Selburg of the Permit Section, Public Water Supply Division,
Illinois Environmental Protection Agency, and Robert Grosso, Park Super-
intendent of Illinois Beach State Park, were particularly cooperative during
this investigation. Many municipal and industry officials, engineers, and
water well contractors generously provided geologic, hydrologic, and Water
quality data.
Illustrations were prepared by William Motherway, Jr., Linda J. Riggin,
and Vicki S. Stewart under the supervision of John W. Brother, Jr. Pamela S.
Lovett typed the manuscript and final copy, and Gail Taylor edited the
manuscript.
12
GEOLOGY
Introduction
A set of 15 maps of the thickness and surface configuration of the
bedrock units of the northern half of Illinois was prepared. The strati-
graphic correlation was coordinated with the other states which are a part of
the Northern Midwest Regional Aquifer System Analysis. Well records which
provided the data base for the maps were selected on the basis of 1) spacing
of at least one well per township; 2) wells penetrating at least the Galena
Group and, if possible, into the Ancell Group or Cambrian System; and
3) wells with samples or geophysical logs. In areas of dense well control,
key wells were designated by the following criteria:
1) The deepest wells possible
2) Wells with existing samples of well cuttings or geophysical logs
which could be studied
3) The most recently drilled wells
4) Wells with previous studies of well cuttings
The maps were then compared to maps from the adjacent states to insure that
transitions were smooth across state lines. Both published and unpublished
maps from Iowa, Missouri, Wisconsin, and Indiana were used to make final
adjustments along state lines.
All new data points selected for this study were field checked for
location and elevation and are considered accurate. Points used from pre-
vious studies were checked in the office but were not field verified. Any
seemingly anomalous points were double checked.
The maps of the Maquoketa and Galena surfaces are considered to be the
most accurate, since more data were available for them. The accuracy of the
maps diminishes as the Precambrian is approached, since fewer and fewer data
points are available for the map preparation.
Precambrian Surface
The map of the top of the Precambrian surface (fig. 6) is based on the
21 control points from wells within Illinois; data from wells in the border-
ing states of Iowa, Indiana, and Wisconsin; and interpretation of known
structural elements present within the state. The new map shows considerable
refinement from the map by Bell et al. (1964).
13
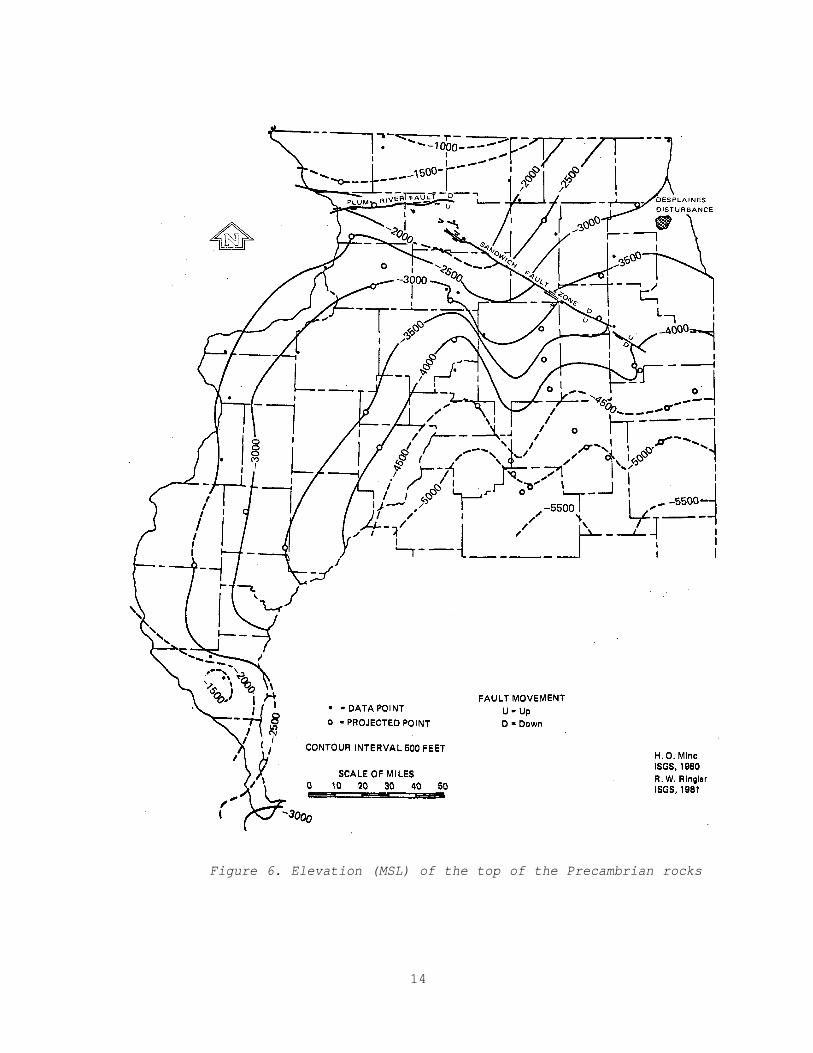
Figure 6. Elevation (MSL) of the top of the Precambrian rocks
14
Local relief of about 800 feet on the Precambrian surface is shown by
comparison of two granite test wells 8 miles apart in Pike County in western
Illinois. One well penetrated 440 feet of Eau Claire Formation and 444 feet
of Mt. Simon Sandstone before encountering the basement at 2488 feet below
mean sea level. The second well encountered only 74 feet of Eau Claire and
no Mt. Simon before encountering basement rocks at 1409 feet below mean sea
level. The rugged topography of the top of the Precambrian is also revealed
by outcrops in the St. Francois Mountains of Missouri. Relief away from
these localities, of course, is uncertain; buried Precambrian hills may
underlie some of the structural highs in overlying strata.
The Precambrian rocks in Illinois apparently do not have a zone of deep
weathering. Most wells encounter fresh-looking igneous rock. Also, the
feldspar grains in the arkose that commonly overlies the Precambrian have a
fresh appearance. Thus, any weathered material that developed on the base-
ment rocks in Illinois was apparently removed by erosion before deposition of
the Paleozoic sediments.
The basement rocks encountered in borings in and immediately adjacent to
Illinois are of granitic or closely related composition. Granite, encoun-
tered in 17 of the 22 Illinois wells and in the three Iowa wells, is by far
the most common rock type. Granodiorite, the next most abundant type, was
encountered in four wells, all in northern Illinois. Rhyolite and granophyre
were encountered in wells in south-central and southern Illinois. Bradbury
and Atherton (1965) describe the petrography of the Precambrian rocks pene-
trated by wells in Illinois.
Cambrian and Ordovician Systems
The Cambrian and Ordovician rocks can be grouped into seven units that
have hydrogeologic significance. These units are: 1) the Mt. Simon Sand-
stone and the Elmhurst Sandstone Member of the Eau Claire Formation;
2) Proviso and Lombard Members of the Eau Claire Formation that form a major
confining unit; 3) the Ironton and Galesville Sandstones; 4) Middle Confining
Unit, consisting of the units between the top of the Ironton and Galesville
Sandstones and the base of the Ancell Group (St. Peter Sandstone), which
include the Cambrian Franconia Formation, Eminence Formation, and Potosi
Dolomite, and the Ordovician Prairie du Chien Group; 5) the Ancell Group;
15
6) the Ottawa Limestone Megagroup, consisting of the Galena and Platteville
Groups; and 7) the Maquoketa Shale Group. A discussion of these units
follows.
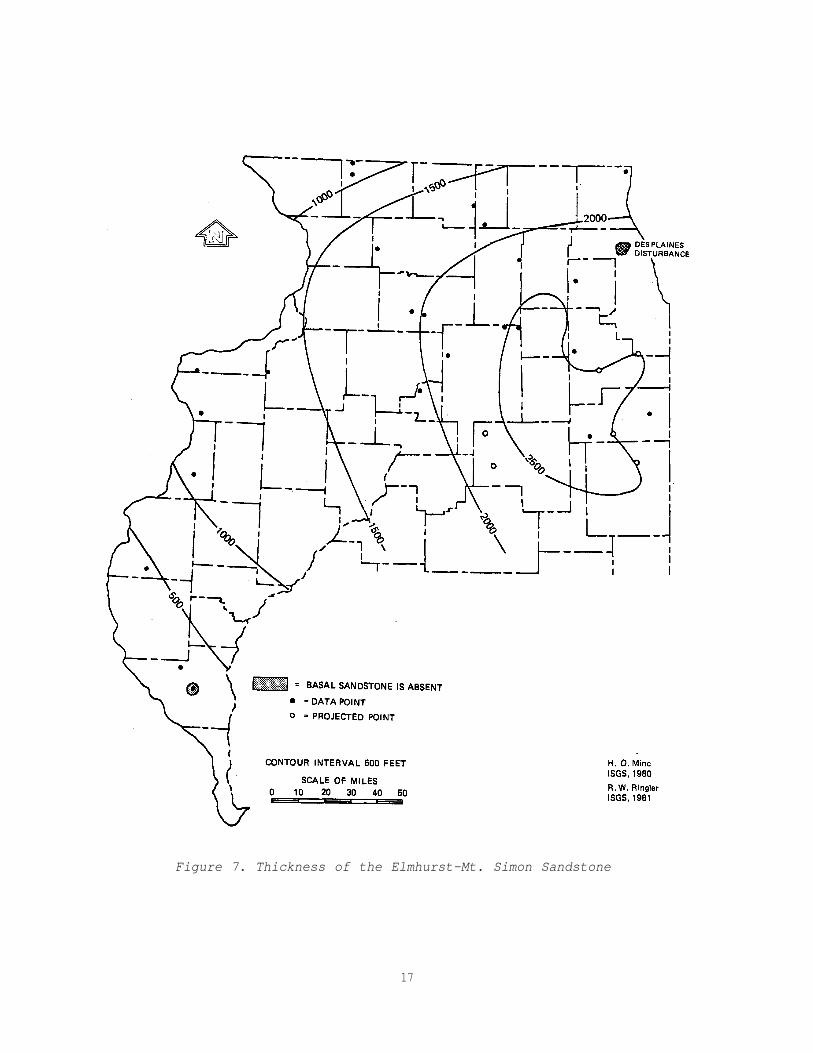
Elmhurst-Mt. Simon Sandstone
The Mt. Simon Sandstone, although not exposed, underlies all of Illinois
except in local areas where it failed to cover hills on the eroded Pre-
cambrian surface. It ranges in thickness from less than 500 feet in the
southwest part of the study area to over 2600 feet in northeastern Illinois
in Kendall, Grundy, eastern LaSalle, northeastern Livingston, western
Kankakee, and northern Ford and Iroquois Counties (fig. 7). In general, the
Mt. Simon consists of fine- to coarse-grained, partly pebbly, friable sand-
stone, most of which is coarser-grained, more angular, and’more poorly sorted
than younger Cambrian and Ordovician sandstones. It is dominantly white, but
can be pink, red, yellow, or light greenish-gray. A basal zone as much as
350 feet thick is strongly arkosic, and beds of red and green micaceous shale
occur locally in the upper 300 feet and lower 600 feet of the formation
(Buschbach, 1975).
In the Rock Island region of western Illinois, the Mt. Simon is fine- to
coarse-grained, poorly sorted, and generally friable, with some more compact
zones which are cemented by silica or hematite. It is essentially non-
dolomitic. The upper half contains interbedded red shale, and the lower half
is pink and arkosic, with the amount of feldspar increasing downward
(Buschbach, 1965).
In the vicinity of DeKalb County, the Mt. Simon contains zones of Well-
developed cross-bedding in the coarser beds. Beds of red, green, and dark
gray shale occur in the upper few hundred feet (Buschbach, 1970).
In the Chicago region, the sandstone is largely medium-grained, but some
coarse-grained beds occur, especially in the upper part of the formation.
The coarser beds are more abundant to the north, and granules up to 6 mm in
diameter are common. The color may be pink, yellow, or white. Red,
micaceous, hematitic beds also occur at some places in the northern counties.
The sands are generally incoherent to friable and may be arkosic in places
(Buschbach, 1964; Suter et al., 1959).
Near the Wisconsin border, the basal sand includes the basal member of
the Eau Claire Formation, the Elmhurst Sandstone. The Elmhurst Sandstone is
16
17
Figure 7. Thickness of the Elmhurst-Mt. Simon Sandstone
widely distributed in the northern half of Illinois and is 10 to 200 feet
thick. Most of it is fine- to medium-grained, fossiliferous gray sandstone
that contains various amounts of gray shale. Near the Wisconsin border, the
amount of shale greatly diminishes and the Elmhurst becomes a fairly Clean
sandstone (Willman et al., 1975).
The map of the surface configuration of the combined sandstones (fig. 8)
was compiled mainly by using projected points from overlying units. Only 122
wells which penetrated the top of the sand were available for compilation of
the map. Therefore, the accuracy of this map is limited, especially with
regard to the northernmost part of the area, where the overlying confining
unit contains interbedded sandstones.
The map of the thickness of the combined units (fig. 7) is based on even
more limited data; only 38 wells with reliable data were available for this
map. Much of this map was constructed by interpolation between the Pre-
cambrian surface map (fig. 6) and the sandstone surface map (fig. 8). The
sandstone is thickest in the eastern part of the study area and thins to the
west and south.
Lombard and Proviso Members of Eau Claire Formation(Basal Sandstone Confining Unit)
The Basal Sandstone Confining Unit consists of dolomite and dolomitic
sandstone, siltstone, and shale of the upper two members (Lombard and
Proviso) of the Eau Claire Formation. The confining unit overlies the rela-
tively clean Mt. Simon and Elmhurst Sandstones, and underlies the clean
Galesville Sandstone. The different lithologies grade laterally from one to
another within short distances. In northern and western Illinois, the Eau
Claire becomes predominantly a dolomitic, fine- to medium-grained, gray
sandstone, but it includes shaly siltstone and silty, sandy, glauconitic,
brownish-gray dolomite. The siltstone is grayish-orange, micaceous, and
compact; and the shale, which is most abundant near the middle of the forma-
tion, is silty, green to red, micaceous, and brittle. The Eau Claire
thickens and becomes more shaly to the southeast.
In central and eastern Illinois the Eau Claire is dominantly dolomitic,
orange to pinkish-gray siltstone and green, gray or red shale; but it also
includes light gray, glauconitic, partly oolitic limestone and dolomite
(Willman et al., 1975). In the DeKalb area, the Eau Claire consists of
light-gray, fine-grained sandstone, siltstone, shale, and dolomite. It
18

Figure 8. Elevation (MSL) of the top of the Elmhurst-Mt. Simon Sandstone
19
becomes sandier to the north, more shaly to the southeast, and more dolomitic
to the southwest (Buschbach, 1970). Glauconite is abundant, especially in
the Lombard Member.
In the Chicago region, the Lombard and Proviso Members are dolomitic,
micaceous, fine- to medium-grained, compact sandstone with variable amounts
of green to gray, sandy shale and siltstone and sandy brown dolomite.
Cemented sandstone predominates in the Lombard member, and glauconite is
common throughout the formation.
The thickness of the confining unit varies from less than 200 feet to
600 feet. The Eau Claire is much sandier in extreme northern Illinois, with
finer grained sediments that are generally thinner; therefore, the basal sand
confining unit is considerably thinner (fig. 9). Throughout the rest of the
study area, the Eau Claire is a fairly uniform 200 to 400 feet thick, except
for small areas in the southeastern and south-central parts of the study
area, where the maximum thickness is over 600 feet.
The surface of the Eau Claire Formation dips to the southeast at about
11 feet per mile and reflects the general structural trend of the Illinois
Basin and its surrounding positive features (fig. 10). The structurally
highest part of the formation is north of the Plum River Fault Zone on the
southern flank of the Wisconsin Arch. The Mississippi River Arch on the west
is another positive structural element. The surface generally becomes lower
to the south and southeast toward the deeper part of the basin. The major
exception to this general trend is the structural high along the LaSalle
Anticlinal Belt. This anticlinal belt is reflected as a structural high,
trending southeastward through LaSalle, Livingston, and Ford Counties. The
asymmetry of the belt is shown by the structural contours on the steep
eastern flank and the much gentler western slope.
About 210 wells were available for development of figure 10, the surface
of the Eau Claire Formation (the Basal Sandstone Confining Unit). Additional
interpretation was possible by projecting down from the surface of the
Ironton and Galesville Formations. Possible errors of a few feet up to a few
hundred feet may exist on this map over short distances. The error increases
where a facies change occurs from shale and dolomite to sandstone in northern
Illinois; however, farther south the accuracy increases. Differentiation
between the basal sandstone and the confining unit was based on the presence
of significant shale content.
20
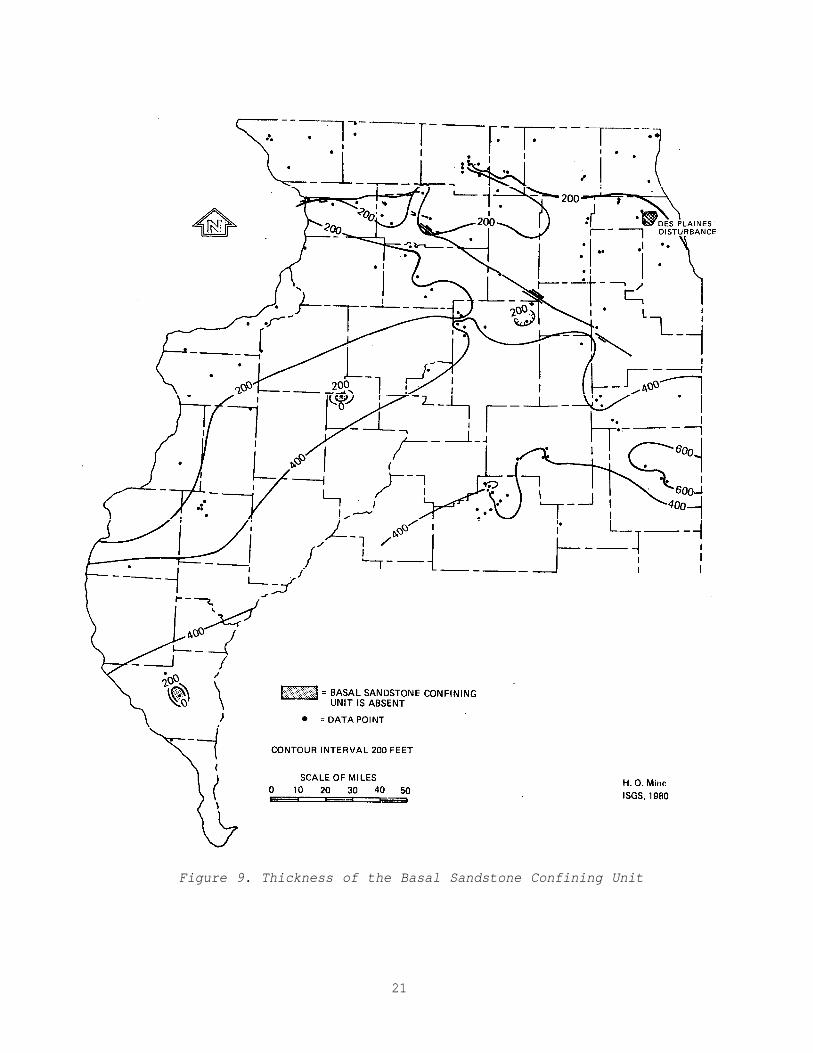
Figure 9. Thickness of the Basal Sandstone Confining Unit
21
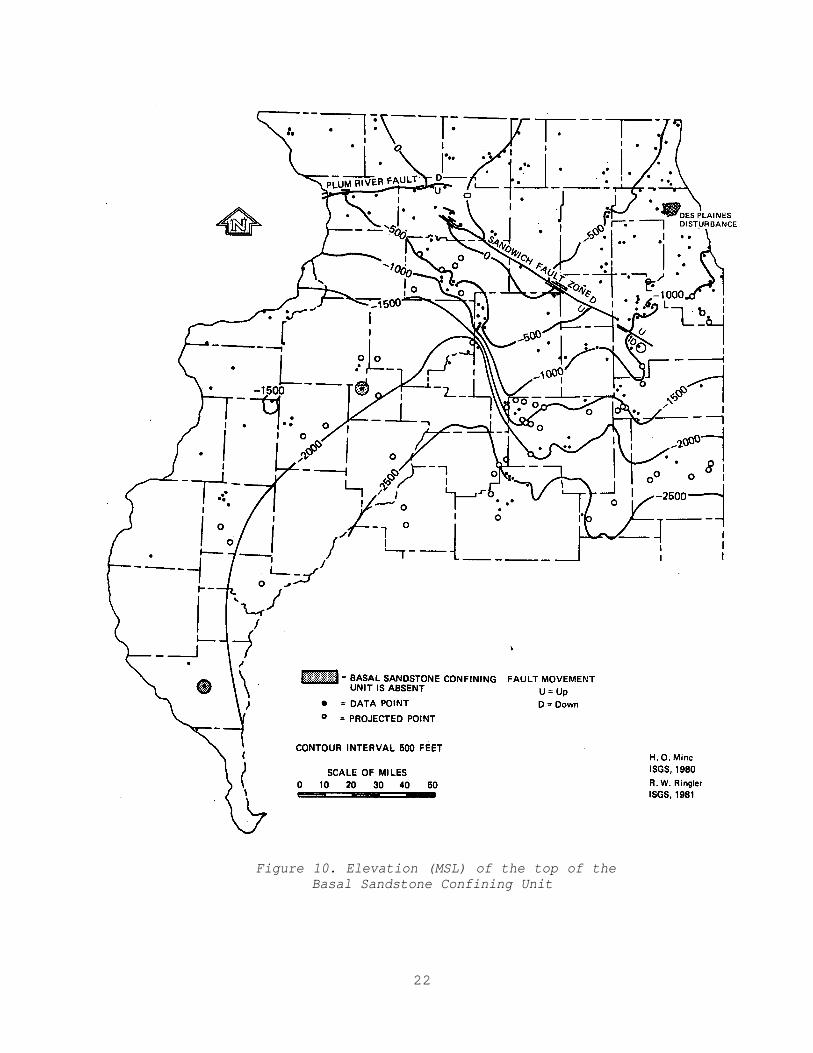
Figure 10. Elevation (MSL) of the top of theBasal Sandstone Confining Unit
22
The thickness of the Basal Sandstone Confining Unit was derived from 116
data points, limiting the accuracy of this map. A few areas may exist where
Precambrian hills are present and where units either were never deposited or
were eroded.
Ironton and Galesville Sandstones
The Ironton and Galesville Sandstones are thick and form an important
source of groundwater in northern Illinois. The sandstones are separated
mainly on the basis of texture and dolomite content. The Galesville Sand-
stone (Willman et al., 1975) is fine-grained, well-sorted sandstone, essen-
tially free from shale and glauconite, whereas the Ironton is medium-grained.
generally poorly-sorted, dolomitic sandstone. The Galesville occurs through-
out the northern half of Illinois but is not exposed. It is commonly 40 to
100 feet thick. At its southern margin, the Galesville grades laterally
through a 50-mile-wide zone from dolomitic sandstone to a non-sandy dolomite.
The name Galesville is applied as far south as the sandy zone can be iden-
tified. The Galesville Sandstone consists of white to light buff, clean to
locally silty, fine-grained, moderately well-sorted, friable, and generally
non-dolomitic sandstone (Buschbach, 1964). Locally, light buff to pink
dolomite is a cementing material. The Galesville appears to be conformable
with both the overlying and underlying formations.
The Ironton Sandstone is a relatively coarse-grained sandstone overlying
the finer-grained Galesville Sandstone and underlying the glauconitic, argil-
laceous sandstone of the Franconia Formation. It occurs throughout the
northern half of Illinois but is not exposed. The Ironton is commonly 50 to
100 feet thick, but it is thinner in northwestern Illinois. Near the
Wisconsin boundary, it is a medium-grained, poorly sorted, white sandstone
with coarse-grained beds near the top. It generally contains light pinkish-
buff dolomite as cementing material and as pebbles in conglomeratic layers.
Farther south it is more dolomitic and at its southern margin it grades into
sandy dolomite.
The carbonate content (all dolomite) of the Ironton and Galesville
Formations ranges from zero to over 80%. In northern Illinois, the amount of
dolomite increases gradually southward to the area of maximum thickness. The
increase is primarily in the Ironton, except in the southern part, where the
basal beds of the Galesville are also dolomitic. South of the area of
23
maximum thickness, the dolomite content of both formations increases rapidly
to a maximum at the southern limit of the formations. In eastern Illinois
and Indiana, the dolomite content is much higher than in western Illinois and
Iowa. Dolomite both cements sandstone and forms discrete beds in north,
east, and east-central Illinois.
In the Chicago area and southward, lenses of fine to very finely crys-
talline, dark brown dolomite with minor amounts of very fine-grained sand-
stone are present at the base of the Galesville Sandstone. These coalesce to
form one continuous unit with a maximum thickness of 50 feet in east-central
Illinois.
Over 250 data points were used to compile the Ironton-Galesville thick-
ness map (fig. 11). The Ironton-Galesville maintains a fairly uniform com-
bined thickness of 150 to 200 feet over most of the study area. It ranges
from a feather edge in the extreme southwest part to over 250 feet southwest
of Chicago in southeastern Grundy County. The formation thins over the
Wisconsin Arch, indicating that the arch actively influenced sedimentation
during deposition of the Ironton and Galesville sands. During Ironton time,
the inland sea over the Illinois Basin reached its farthest northward trans-
gression (Emrich, 1966).
Over 280 wells were available to compile the map of the surface of the
Ironton Formation (fig. 12). Additional points were also projected down from
the Ancell Group surface. However, these data points were not sufficient to
establish a 100-foot contour interval. The greatest accuracy exists in the
northern part of the study area.
Knox Megagroup (Middle Confining Unit)
The dolomitic part of the Knox Megagroup (Swann and Willman, 1961)
includes the strata between the base of the St. Peter Sandstone and the top
of the Ironton Sandstone. It underlies all of Illinois except small areas in
northern Illinois where an unconformity cuts entirely through the dolomitic
formations and the St. Peter Sandstone rests on the Franconia Formation or,
locally, on the Ironton Sandstone. Although dominantly dolomitic in the
northern part of the state, the megagroup contains some relatively thin
sandstones--the New Richmond and Gunter Sandstones, the Momence Sandstone
Member of the Eminence Formation, the Jordan Sandstone, and numerous thin
beds in the Shakopee Dolomite. The sandstones generally thin southward and
24
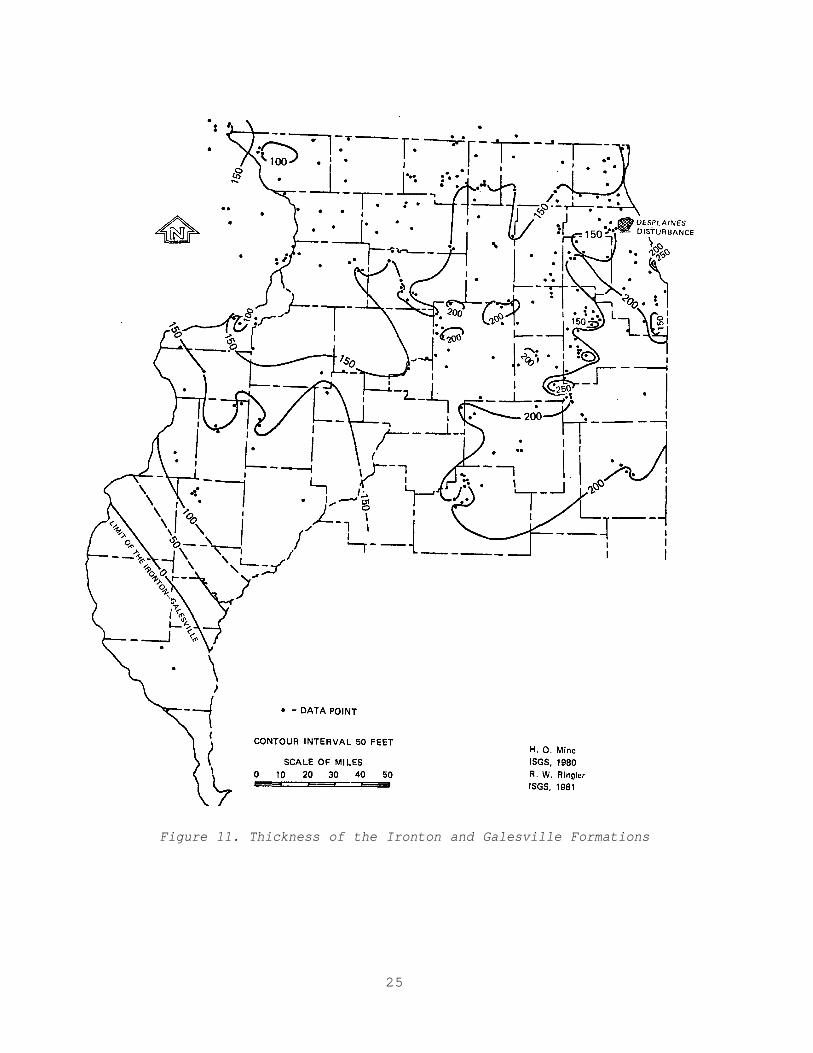
Figure 11. Thickness of the Ironton and Galesville Formations
25
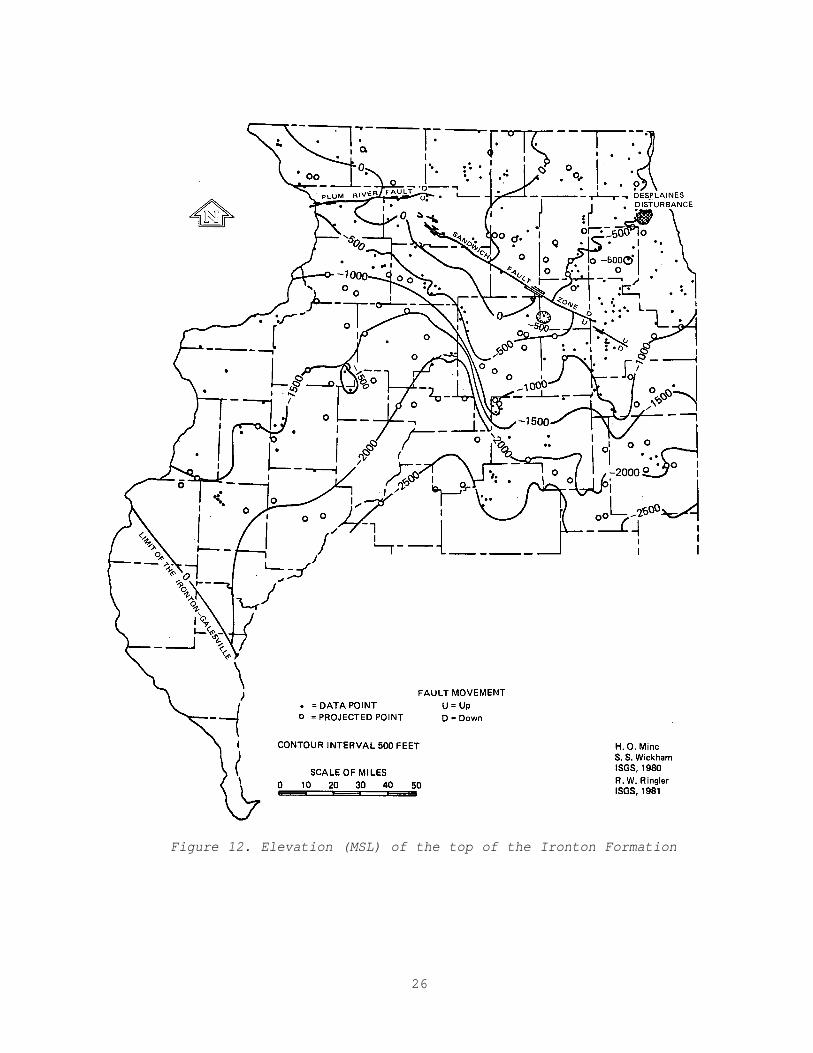
Figure 12. Elevation (MSL) of the top of the Ironton Formation
26
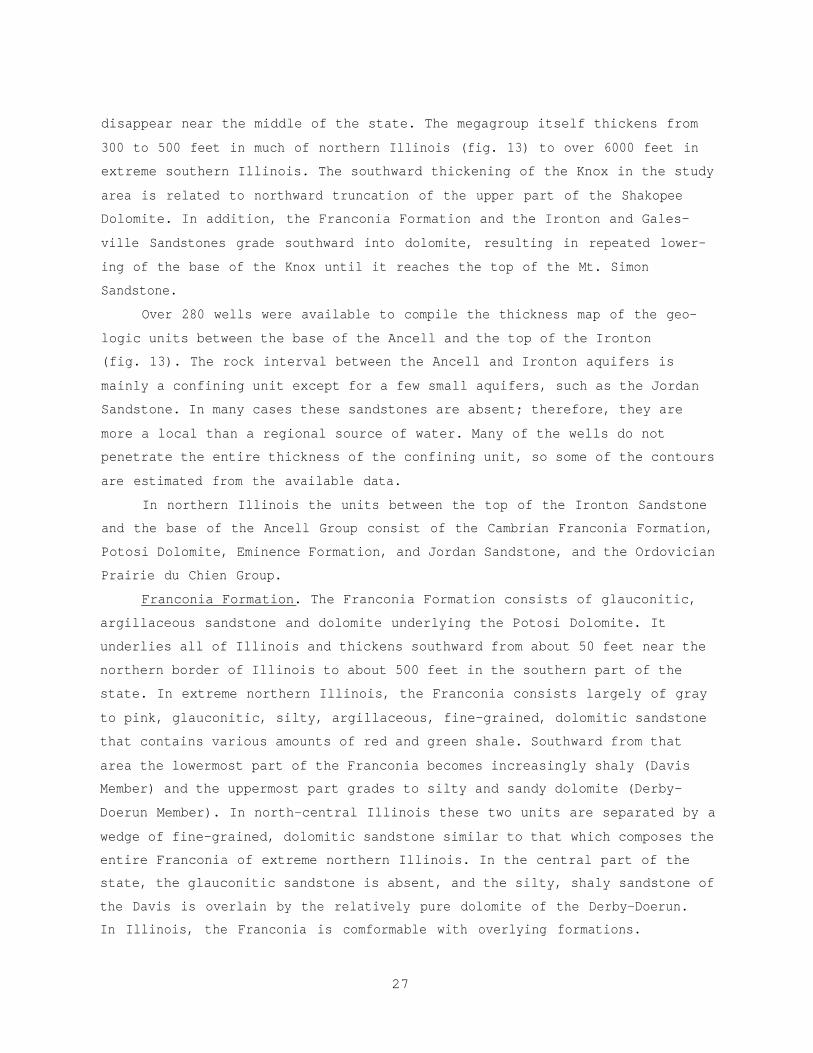
disappear near the middle of the state. The megagroup itself thickens from
300 to 500 feet in much of northern Illinois (fig. 13) to over 6000 feet in
extreme southern Illinois. The southward thickening of the Knox in the study
area is related to northward truncation of the upper part of the Shakopee
Dolomite. In addition, the Franconia Formation and the Ironton and Gales-
ville Sandstones grade southward into dolomite, resulting in repeated lower-
ing of the base of the Knox until it reaches the top of the Mt. Simon
Sandstone.
Over 280 wells were available to compile the thickness map of the geo-
logic units between the base of the Ancell and the top of the Ironton
(fig. 13). The rock interval between the Ancell and Ironton aquifers is
mainly a confining unit except for a few small aquifers, such as the Jordan
Sandstone. In many cases these sandstones are absent; therefore, they are
more a local than a regional source of water. Many of the wells do not
penetrate the entire thickness of the confining unit, so some of the contours
are estimated from the available data.
In northern Illinois the units between the top of the Ironton Sandstone
and the base of the Ancell Group consist of the Cambrian Franconia Formation,
Potosi Dolomite, Eminence Formation, and Jordan Sandstone, and the Ordovician
Prairie du Chien Group.
Franconia Formation. The Franconia Formation consists of glauconitic,
argillaceous sandstone and dolomite underlying the Potosi Dolomite. It
underlies all of Illinois and thickens southward from about 50 feet near the
northern border of Illinois to about 500 feet in the southern part of the
state. In extreme northern Illinois, the Franconia consists largely of gray
to pink, glauconitic, silty, argillaceous, fine-grained, dolomitic sandstone
that contains various amounts of red and green shale. Southward from that
area the lowermost part of the Franconia becomes increasingly shaly (Davis
Member) and the uppermost part grades to silty and sandy dolomite (Derby-
Doerun Member). In north-central Illinois these two units are separated by a
wedge of fine-grained, dolomitic sandstone similar to that which composes the
entire Franconia of extreme northern Illinois. In the central part of the
state, the glauconitic sandstone is absent, and the silty, shaly sandstone of
the Davis is overlain by the relatively pure dolomite of the Derby-Doerun.
In Illinois, the Franconia is comformable with overlying formations.
27
Figure 13. Thickness of units between the base of the Ancell Groupand the surface (top) of the Ironton Formation
28
Potosi Dolomite. The Potosi Dolomite is a relatively pure dolomite
overlying the Franconia Formation and underlying the Eminence Formation. The
Potosi underlies essentially all of Illinois except in parts of northern
Illinois where it is truncated by pre-St. Peter erosion. It consists of
finely crystalline, pure to slightly argillaceous, brown to pinkish-gray
dolomite that is very slightly glauconitic at the top and glauconitic and
sandy at the base. Drusy quartz covers the surfaces of small cavities in
most areas and characterizes the formation in both outcrop and well samples.
In wide areas of northern Illinois, it is unconformably overlain by the
St. Peter, but it is otherwise conformable with the Franconia below and the
Eminence above.
Eminence Formation. The Eminence Formation is a sandy dolomite overly-
ing the Potosi Formation. It underlies most of Illinois except in the
northern part where it is truncated by the unconformity at the base of the
St. Peter Sandstone. The Eminence is normally 50 to 250 feet thick where it
is overlain by the Gunter Sandstone or Oneota Dolomite of the Prairie
du Chien Group. It consists of light gray to brown or pink, sandy, fine- to
medium-grained dolomite that contains oolitic chert and thin sandstone
strata. The formation is generally conformable with overlying units, and in
extreme northwestern Illinois it grades laterally into the Jordan Sandstone.
Jordan Sandstone. The Jordan Sandstone is the uppermost Cambrian forma-
tion in the extreme northwestern part of Illinois. In Jo Daviess and Carroll
Counties it is a few to 75 feet thick, and in Iowa it becomes an important
aquifer. The formation is a white to yellowish-gray, partly iron stained
sandstone that is medium- to fine-grained at its base. In some places the
upper part is coarse to very coarse-grained. It varies from thin- to thick-
bedded, and cross-bedding is eommon.
Prairie du Chien Group. The Prairie du Chien Group, the youngest unit
of the Knox Megagroup, is present throughout much of Illinois. However, it
is almost entirely absent in the northern two tiers of counties and is
missing locally in the rest of the northern third of the state. It is also
absent in areas where Cambrian rocks crop out near the Sandwich Fault Zone
and structural highs. The group thickens southward, chiefly by the addition
29
of younger beds at the top. The group consists of cherty dolomite with some
interbedded sandstone. It is subdivided into the Gunter Sandstone (basal),
the Oneota Dolomite, the New Richmond Sandstone, and the Shakopee Dolomite.
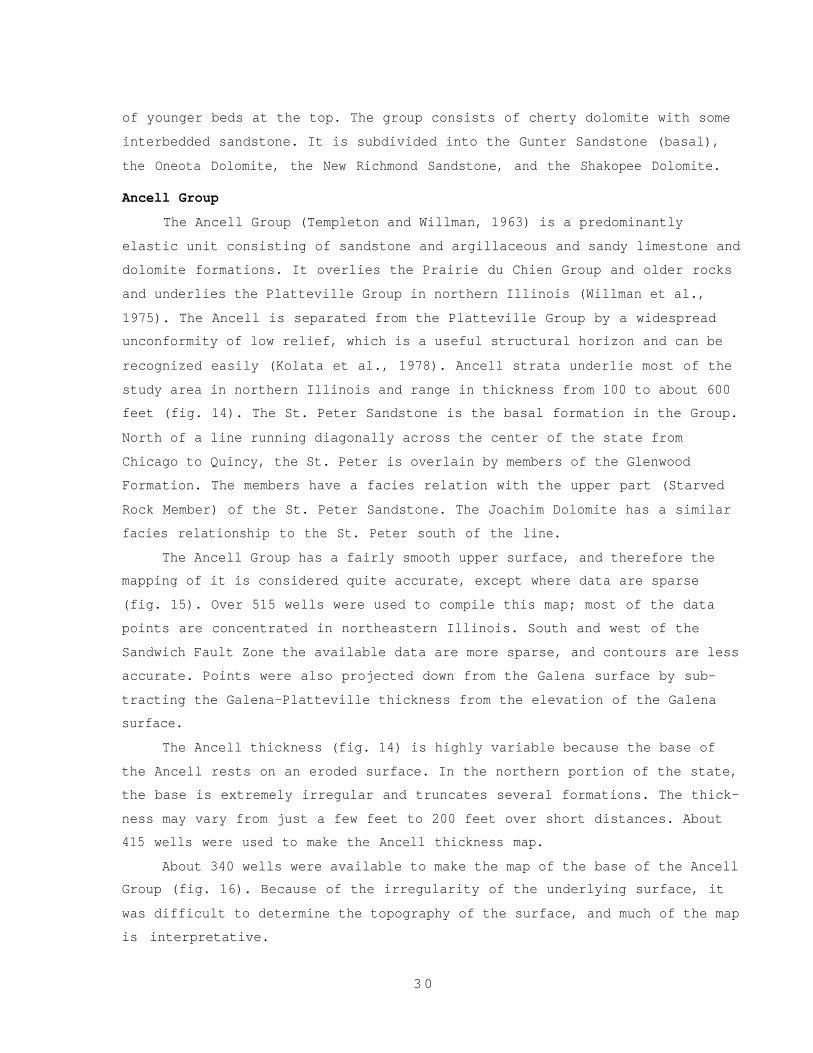
Ancell Group
The Ancell Group (Templeton and Willman, 1963) is a predominantly
elastic unit consisting of sandstone and argillaceous and sandy limestone and
dolomite formations. It overlies the Prairie du Chien Group and older rocks
and underlies the Platteville Group in northern Illinois (Willman et al.,
1975). The Ancell is separated from the Platteville Group by a widespread
unconformity of low relief, which is a useful structural horizon and can be
recognized easily (Kolata et al., 1978). Ancell strata underlie most of the
study area in northern Illinois and range in thickness from 100 to about 600
feet (fig. 14). The St. Peter Sandstone is the basal formation in the Group.
North of a line running diagonally across the center of the state from
Chicago to Quincy, the St. Peter is overlain by members of the Glenwood
Formation. The members have a facies relation with the upper part (Starved
Rock Member) of the St. Peter Sandstone. The Joachim Dolomite has a similar
facies relationship to the St. Peter south of the line.
The Ancell Group has a fairly smooth upper surface, and therefore the
mapping of it is considered quite accurate, except where data are sparse
(fig. 15). Over 515 wells were used to compile this map; most of the data
points are concentrated in northeastern Illinois. South and west of the
Sandwich Fault Zone the available data are more sparse, and contours are less
accurate. Points were also projected down from the Galena surface by sub-
tracting the Galena-Platteville thickness from the elevation of the Galena
surface.
The Ancell thickness (fig. 14) is highly variable because the base of
the Ancell rests on an eroded surface. In the northern portion of the state,
the base is extremely irregular and truncates several formations. The thick-
ness may vary from just a few feet to 200 feet over short distances. About
415 wells were used to make the Ancell thickness map.
About 340 wells were available to make the map of the base of the Ancell
Group (fig. 16). Because of the irregularity of the underlying surface, it
was difficult to determine the topography of the surface, and much of the map
is interpretative.
30
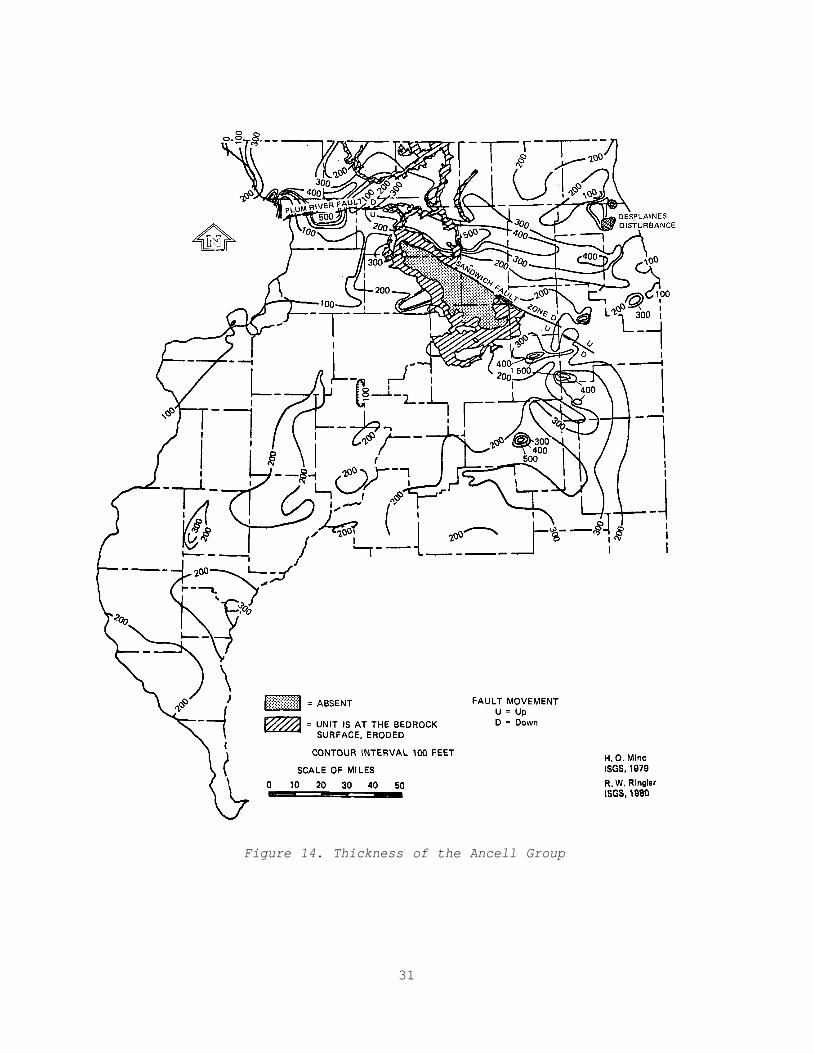
Figure 14. Thickness of the Ancell Group
31
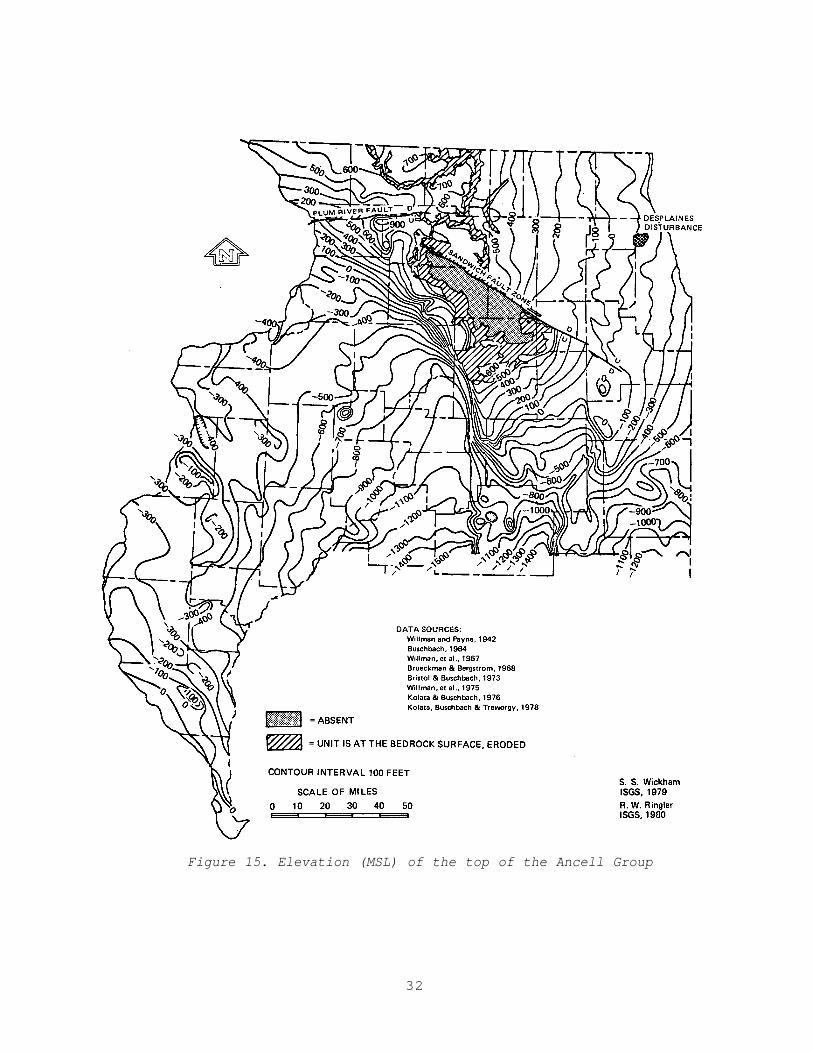
Figure 15. Elevation (MSL) of the top of the Ancell Group
32
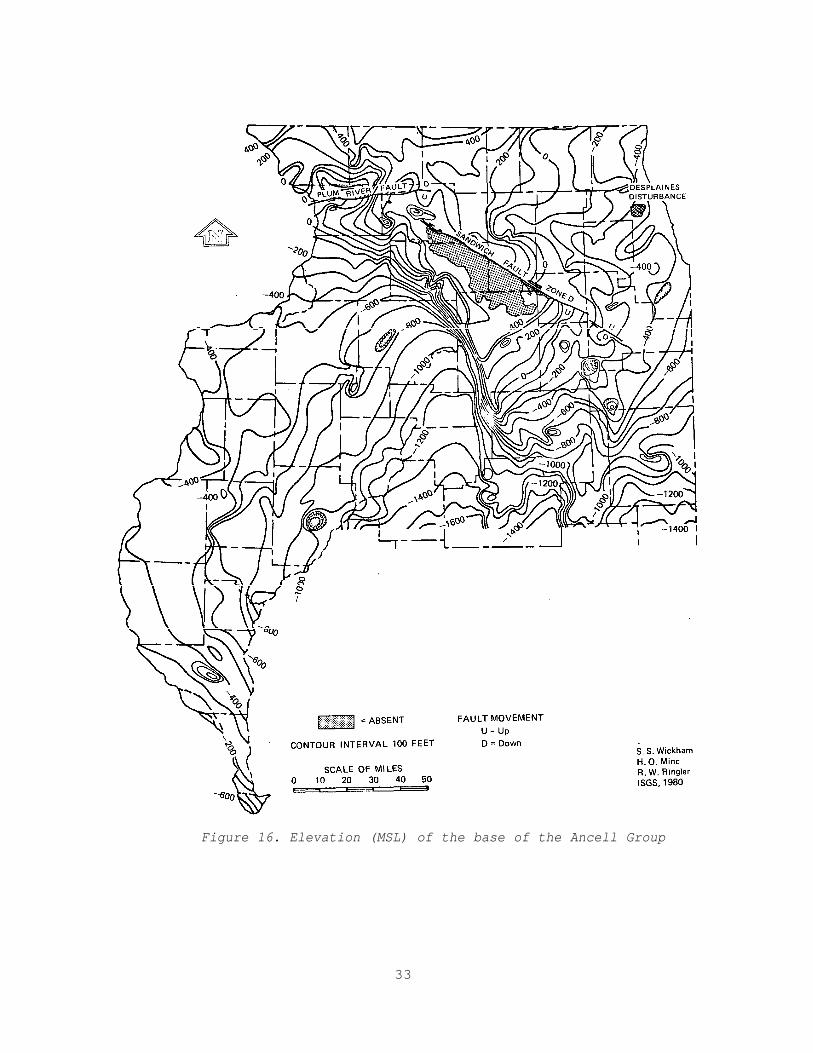
Figure 16. Elevation (MSL) of the base of the Ancell Group
33
St. Peter Sandstone. The St. Peter Sandstone is restricted to the
relatively pure sandstone present in most of Illinois below the Platteville
Group carbonates and the Glenwood Formation elastics and overlying the car-
bonates of the Knox Megagroup. Because of a major unconformity at its base,
the St. Peter truncates formations as old as the Franconia Formation
(Templeton and Willman, 1963; Buschbach, 1964).
The St. Peter is composed mainly of quartz sand that is normally pure
and very fine- to coarse-grained. It is chiefly fine- to medium-grained,
very well sorted, friable, and thick to very thick-bedded, with cross-bedding
common locally (Templeton and Willman, 1963; Buschbach, 1964). Its color is
normally white, but it may be pink, buff, or reddish brown. Most sand grains
are well rounded and frosted; the degree of rounding and frosting decreases
with decreasing grain size so that very fine grains are generally angular and
clear. The St. Peter commonly contains less than 2% silt and 1 to 3% dis-
seminated clay, but it is locally very silty in western Illinois. Its heavy
mineral suite is limited to the highly resistant minerals, tourmaline and
zircon.
The St. Peter fills irregularities on a complex surface which includes
both karst and erosional features. Where the sandstone is abnormally thick,
the underlying carbonates are reciprocally thinned (Buschbach, 1961). The
pattern of variation in thickness suggests deposition in previously eroded
channels and adjacent uplands (Suter et al., 1959). The St. Peter is 100 to
200 feet thick over most of northern Illinois except in a band 40 to 50 miles
wide north of the Sandwich Fault Zone, where thicknesses of 400 to 600 feet
are encountered. Where abnormal thicknesses are found, the lower section
(Kress Member) may consist of fine- to coarse-grained, pink to reddish-brown
sandstone with varying amounts of shale, chert, and dolomite fragments (Suter
et al., 1959).
From north-central Illinois to southeastern Missouri, the St. Peter
consists of a lower, fine-grained unit, the Tonti Sandstone Member, and an
upper, medium-grained unit, the Starved Rock Sandstone Member. The St. Peter
sands were derived chiefly from erosion of pre-existing sandstones, of which
the Cambrian Galesville Sandstone may be a chief source. From its area of
maximum thickness in north-central Illinois, the Starved Rock Member grades
northward into the Glenwood Formation and southward into the Joachim
Dolomite.
34
Glenwood Formation. The Glenwood Formation, the upper part of the
Ancell Group, is widely present in northern Illinois, with the same distribu-
tion as the St. Peter Sandstone. It underlies the Platteville Group, and is
separated from it by a widespread and sharp unconformity of minor relief.
The Glenwood is absent in some localities, especially near the Wisconsin
state line (Willman et al., 1975). The formation is generally 25 to 50 feet
thick and is characterized by abrupt and irregular variations in thickness.
It is thickest along its southern margin just north of where it grades into
the Starved Rock Member of the St. Peter Sandstone. Its maximum known thick-
ness is 150 feet at Galesburg in Knox County.
The Glenwood is composed primarily of sandstone possessing a distinctive
bimodal texture. Known as the Glenwood texture, it consists of medium to
coarse, well-rounded quartz grains of the St. Peter type in a matrix of very
fine sand and coarse silt. The sandstone is commonly dolomitic and has a
high silt and clay content and abundant accessory garnets and other heavy
minerals. The clay fraction contains illite and authigenic potassium
feldspar. Fine-grained, impure dolomite and light green shale are found in
the middle and upper portions of the formation. The northern distribution,
variable lithology, and general absence of normal marine fauna suggest that
the Glenwood sediments were derived from two different terrains and deposited
in brackish, muddy water of a shallow marine basin (Templeton and Willman,
1963).
Ottawa Limestone Megagroup
The Ottawa Limestone Megagroup (Swann and Willman, 1961) consists of the
dominantly carbonate rocks overlying the St. Peter Sandstone and underlying
the dominantly elastic rocks of the Maquoketa Shale Group. In northern
Illinois, it consists largely of the Galena and Platteville Groups, but
locally it includes carbonate members of overlying and underlying formations.
The Ottawa Megagroup underlies most of the state and thickens from about 300
feet in northern Illinois to 1300 feet in southern Illinois. In local areas
where the St. Peter Sandstone is absent, the Ottawa Megagroup rests on the
Knox Megagroup.
The Galena and Platteville Groups consist of a nearly continuous
sequence of carbonate rocks that are generally 250 to 450 feet thick in
northern and western Illinois, thickening southward into the Illinois Basin
35
(fig. 17). Over 470 data points were used to draw the Galena and Platteville
thickness map. The map provides a fairly accurate portrayal of the Galena
and Platteville thickness, except in the erosional areas where the thickness
may vary greatly due to the topographic relief. These groups form the bed-
rock surface and are widely exposed in an area of about 2900 square miles
(Willman and Kolata, 1978). Although largely dolomitic, both groups contain
limestone in parts of the area. The carbonates are relatively pure and
generally contain less than 10% impurities, mostly argillaceous material and
chert. The siliceous detrital minerals are finely disseminated in the lime-
stone and dolomite and consist largely of quartz in silt and sand-size grains
and a variety of silicates, mostly clay minerals, feldspar, and heavy
minerals.
Platteville Group. The Platteville Group (Templeton and Willman, 1963;
Willman and Kolata, 1978) includes the dominantly limestone formations that
overlie the Glenwood Formation of the Ancell Group and underlie the Spechts
Ferry or Guttenberg Formations of the Galena Group. Across central Illinois
it overlies the St. Peter Sandstone; farther south it overlies the Joachim
Dolomite. The group is only about 30 to 45 feet thick in extreme western and
northwestern Illinois, but it thickens to 135 feet in the Dixon area and
southward to over 600 feet in the extreme southern part of the state (Willman
et al., 1975).
In northern Illinois, the Platteville Group is largely blue-gray, litho-
graphic, partly dolomite-mottled limestone, but in some areas it is gray,
very fine-grained, cherty dolomite. It is divided into the Plattin Subgroup
(stratigraphically above) which is dominated by the typical limestone facies,
and the Pecatonica Formation, a persistent dolomite in the northern area.
Galena Group. The Galena Group (Templeton and Willman, 1963) consists
of limestone and dolomite formations overlying the Platteville Group and
underlying the Maquoketa Shale Group. The Galena Group is present in all of
Illinois except in the areas where older rocks are exposed in central-
northern Illinois, in Calhoun County, and in an area along the crest of the
LaSalle Anticlinal Belt where the Galena strata were eroded before deposition
of Pennsylvanian sediments. The Galena Group is 250 to 275 feet thick in the
northern outcrop area, but the upper part is truncated by the Maquoketa Shale
in central Illinois. The group is divided into two subgroups (Willman and
36
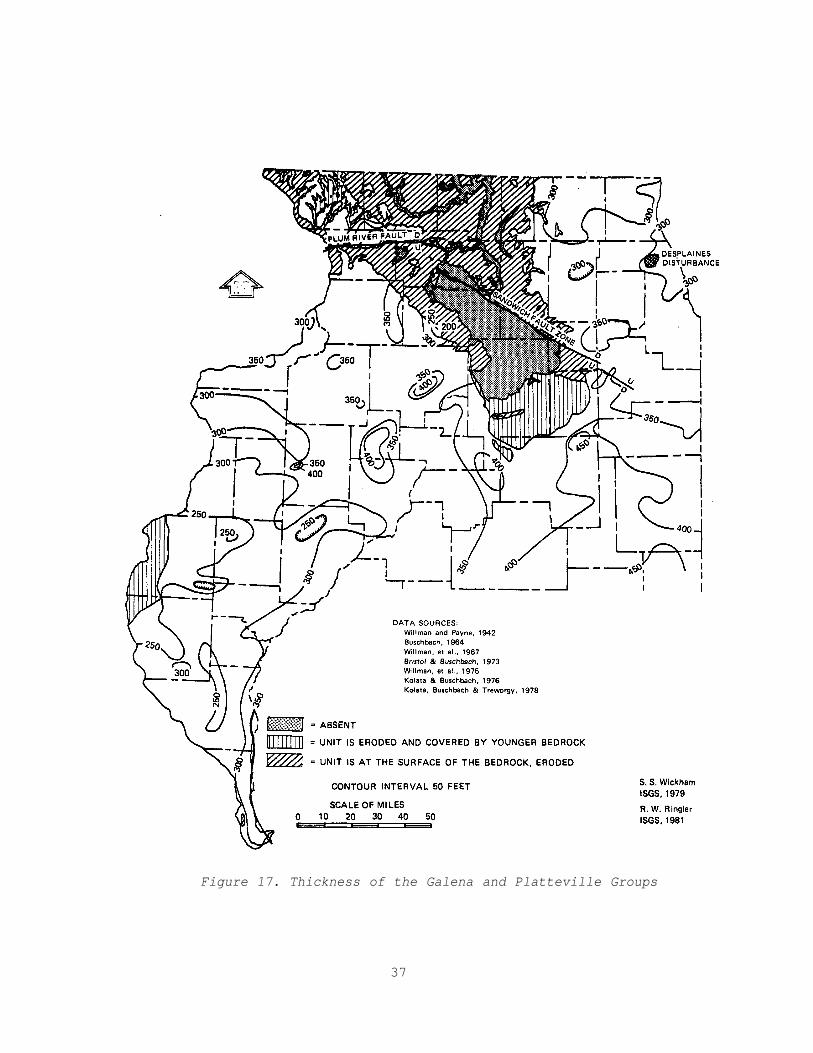
Figure 17. Thickness of the Galena and Platteville Groups
37
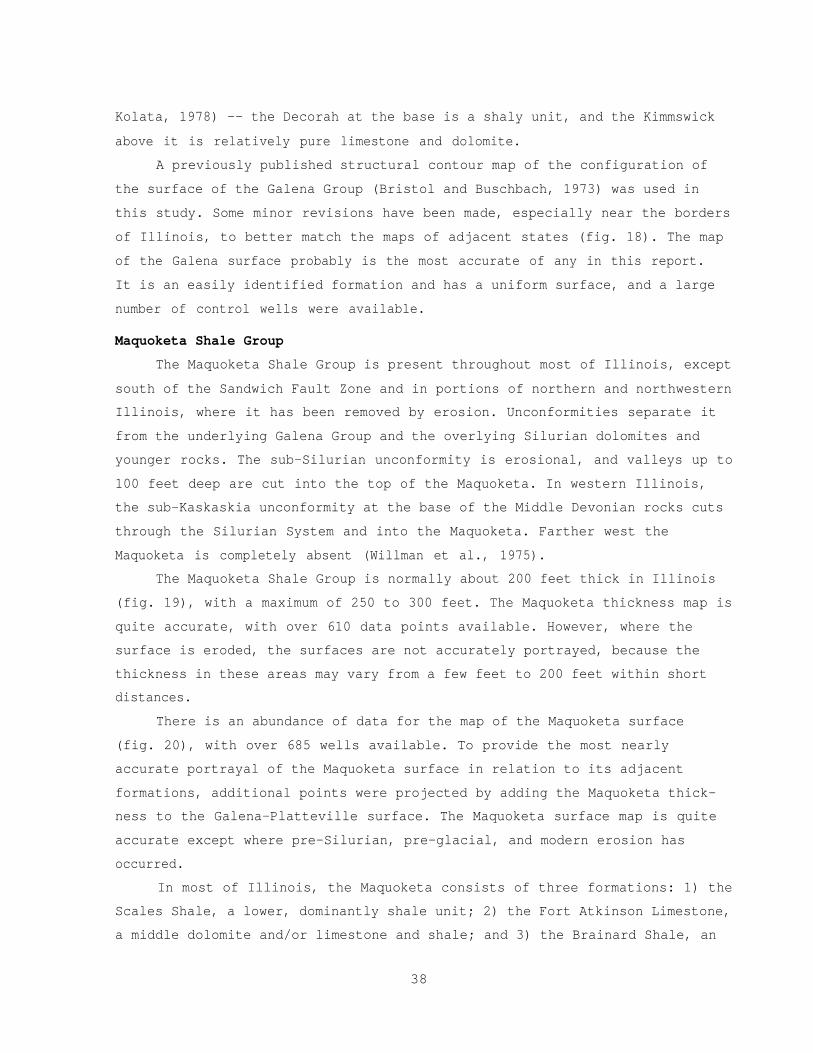
Kolata, 1978) -- the Decorah at the base is a shaly unit, and the Kimmswick
above it is relatively pure limestone and dolomite.
A previously published structural contour map of the configuration of
the surface of the Galena Group (Bristol and Buschbach, 1973) was used in
this study. Some minor revisions have been made, especially near the borders
of Illinois, to better match the maps of adjacent states (fig. 18). The map
of the Galena surface probably is the most accurate of any in this report.
It is an easily identified formation and has a uniform surface, and a large
number of control wells were available.
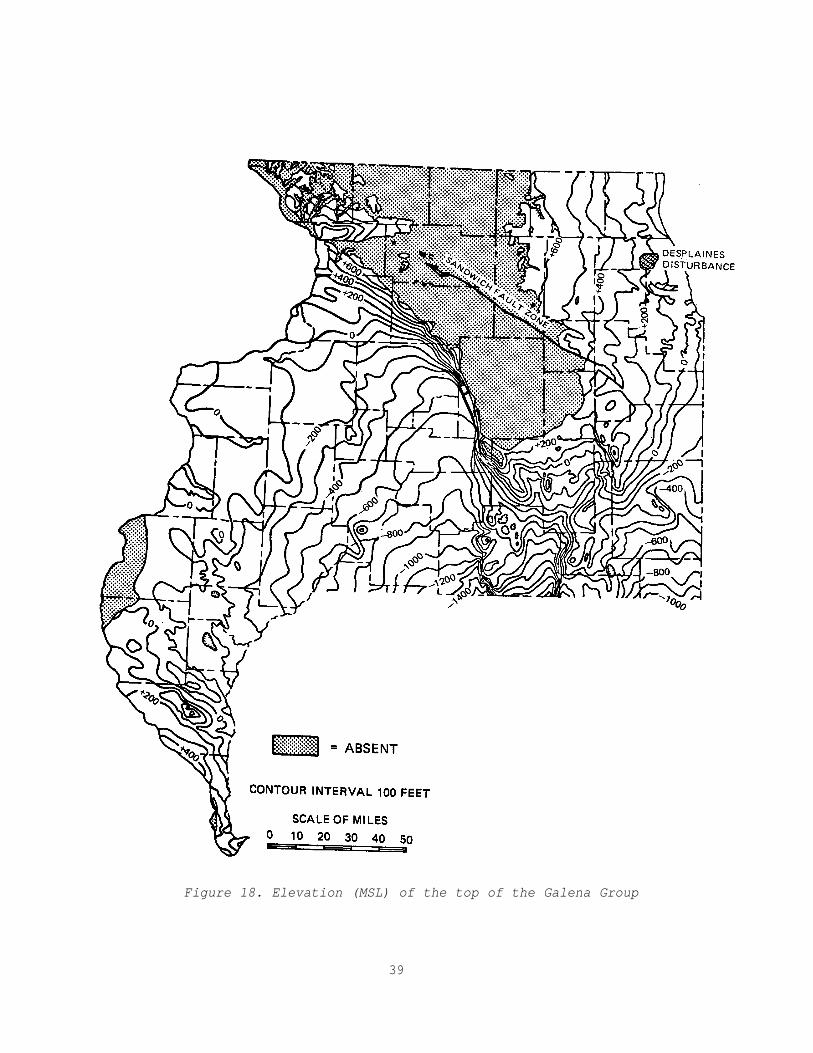
Maquoketa Shale Group
The Maquoketa Shale Group is present throughout most of Illinois, except
south of the Sandwich Fault Zone and in portions of northern and northwestern
Illinois, where it has been removed by erosion. Unconformities separate it
from the underlying Galena Group and the overlying Silurian dolomites and
younger rocks. The sub-Silurian unconformity is erosional, and valleys up to
100 feet deep are cut into the top of the Maquoketa. In western Illinois,
the sub-Kaskaskia unconformity at the base of the Middle Devonian rocks cuts
through the Silurian System and into the Maquoketa. Farther west the
Maquoketa is completely absent (Willman et al., 1975).
The Maquoketa Shale Group is normally about 200 feet thick in Illinois
(fig. 19), with a maximum of 250 to 300 feet. The Maquoketa thickness map is
quite accurate, with over 610 data points available. However, where the
surface is eroded, the surfaces are not accurately portrayed, because the
thickness in these areas may vary from a few feet to 200 feet within short
distances.
There is an abundance of data for the map of the Maquoketa surface
(fig. 20), with over 685 wells available. To provide the most nearly
accurate portrayal of the Maquoketa surface in relation to its adjacent
formations, additional points were projected by adding the Maquoketa thick-
ness to the Galena-Platteville surface. The Maquoketa surface map is quite
accurate except where pre-Silurian, pre-glacial, and modern erosion has
occurred.
In most of Illinois, the Maquoketa consists of three formations: 1) the
Scales Shale, a lower, dominantly shale unit; 2) the Fort Atkinson Limestone,
a middle dolomite and/or limestone and shale; and 3) the Brainard Shale, an
38
39
Figure 18. Elevation (MSL) of the top of the Galena Group
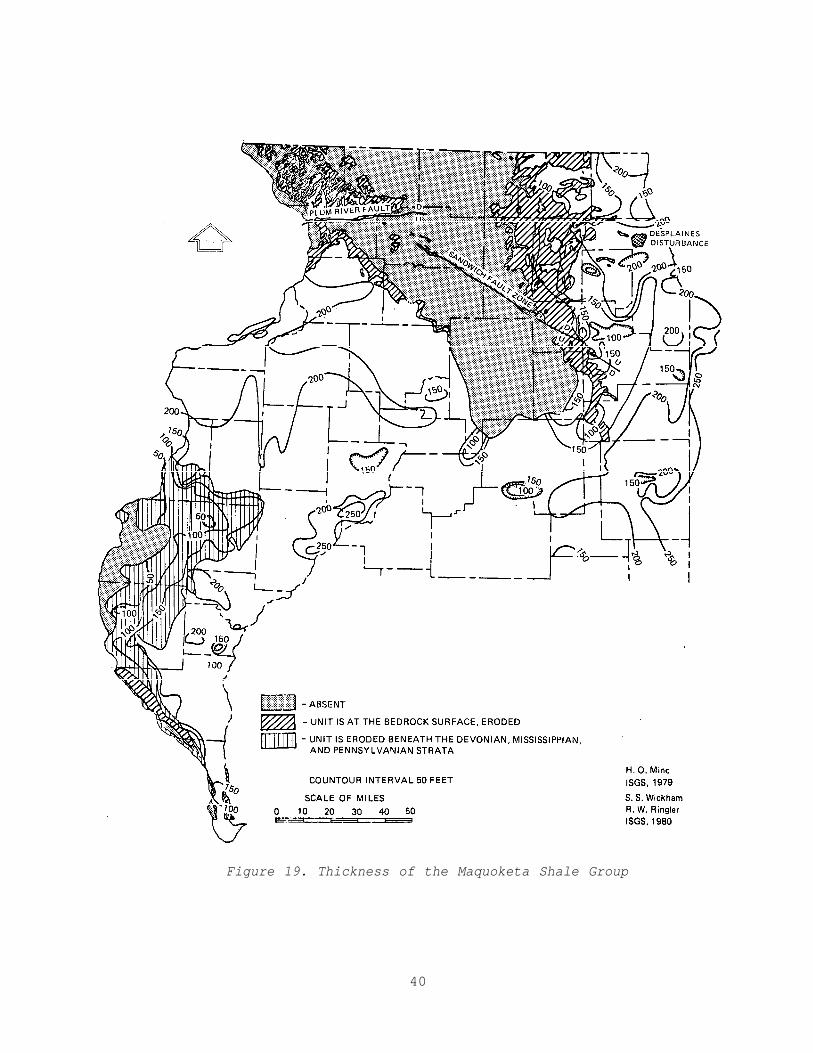
Figure 19. Thickness of the Maquoketa Shale Group
40
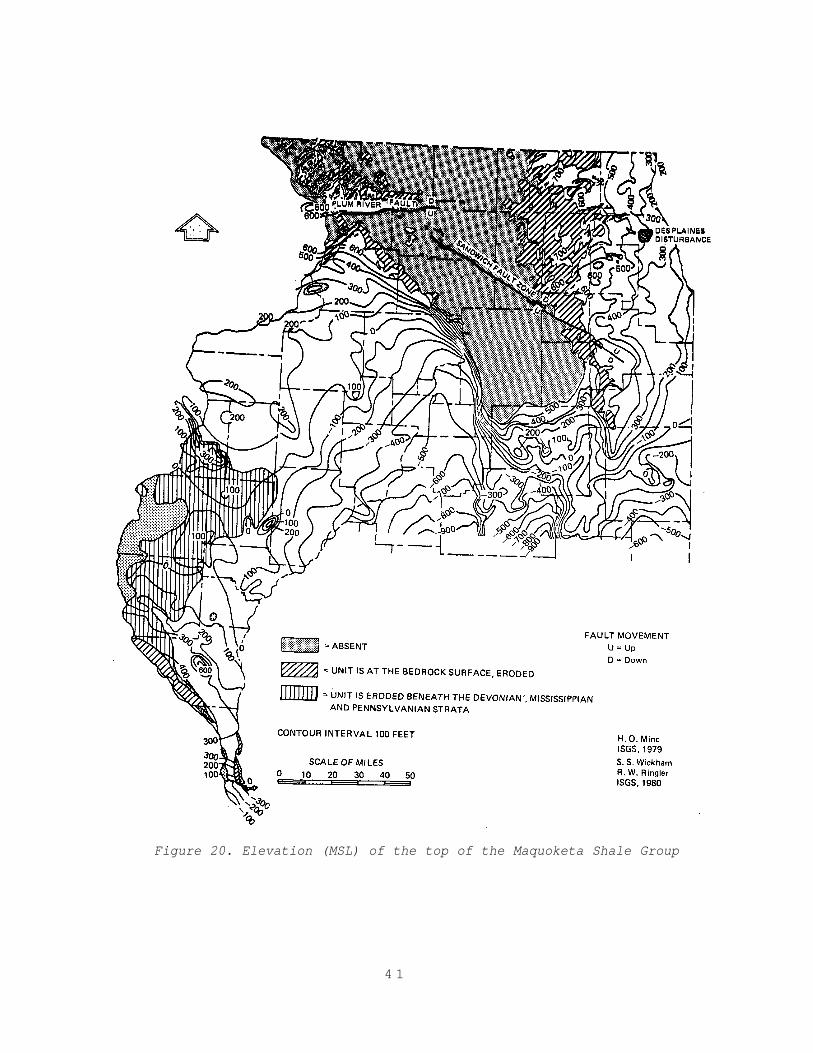
Figure 20. Elevation (MSL) of the top of the Maquoketa Shale Group
4 1
upper dolomitic shale. In northern Illinois, the Neda Formation, a red and
green shale and hematitic oolite, is locally present at the top of the group
(Suter et al., 1959; Willman et al., 1975).
Scales Shale. The Scales Shale (Templeton and Willman, 1963), the
lowermost unit of the Maquoketa Shale Group, is present throughout most of
the state except in north-central and extreme western Illinois, where it has
been removed by post-Ordovician erosion. Throughout the state, the Scales
Shale has a range of 50 to 150 feet, but it is generally 75 to 100 feet
thick. It is light olive gray to olive gray, weak to brittle, silty dolo-
mitic shale interbedded with layers of fine-grained, silty dolomite. Locally,
the shale is greenish-gray in its lower 5 to 10 feet (Buschbach, 1964).
Fort Atkinson Limestone. The middle unit of the Maquoketa Shale Group,
the Fort Atkinson Limestone (Willman et al., 1975), is widely distributed in
the subsurface of Illinois. It ranges from 15 to 20 feet thick near Rock
Island (Rock Island County) to 5 to 50 feet thick in the Chicago area (Cook
County). Its composition is highly variable. In northwestern Illinois it is
very shaly and is inseparable from the shales above and below. In other
areas it contains limestone that is laterally equivalent to shale elsewhere
in the formation. It changes over short distances from white or pink,
coarse-grained, crinoidal limestone to brown, fine-grained dolomite or gray,
argillaceous limestone. In some areas, the upper portion is limestone and
the lower is dolomite. The interbedded shale is generally green or brown and
silty, and dolomitic or calcitic. Its amount varies greatly.
Brainard Shale. The Brainard Shale occurs throughout the area of the
Maquoketa Group except where it has been truncated by unconformities. Where
it has not been affected by post-Ordovician erosion, it is normally about 75
to 100 feet thick (Willman et al., 1975). It is a silty, dolomitic, weak,
greenish-gray shale interbedded with varying amounts of silty, greenish-gray
dolomite and, less commonly, limestone. In extreme northeastern Illinois it
grades to partly silty dolomite that is light gray to light greenish-gray in
color, partly black speckled, fine- to coarse-grained, and commonly inter-
bedded with greenish-gray shale. The Brainard Shale is lighter colored and
softer than the Scales Shale, and is commonly fossiliferous.
Neda Formation. The Neda Formation, the uppermost unit of the Maquoketa
Shale Group, is present locally in northern Illinois, generally occurring
42

where the Maquoketa is thicker than 190 feet and the basal Silurian forma-
tions are thin or missing (Buschbach, 1964; Willman et al., 1975). It
consists largely of weak red or green shale that contains flattened, hema-
titic, goethitic or limonitic oolites and interbedded pink or green dolomite.
The Neda has a gradational contact with the underlying Brainard Shale and is
unconformably overlain by the Silurian System and younger rocks.
Post-Ordovician Systems
Post-Ordovician deposits are not a detailed part of this study; they are
described only briefly in the following sections.
Silurian System
The Silurian System underlies most of Illinois and makes up large
portions of the bedrock surface in northeastern and northwestern Illinois
(Willman et al., 1975). It is also exposed in the river bluffs at the con-
fluence of the Illinois and Mississippi Rivers in western Illinois (fig. 21).
The system has a maximum thickness of nearly 1000 feet at some pinnacle reefs
in the area east of East St. Louis; however, the system is more commonly 400
to 600 feet thick. The Silurian thins and has been completely removed by
erosion to the north and west. Preglacial erosion has produced deep valleys
in the bedrock surface, and the thickness of the upper unit may change
abruptly over short distances.
The Silurian rocks are almost entirely dolomite in the northern part of
the state (Willman, 1943, 1973). In the lower third of the system, the
frmations maintain distinctive characteristics and lateral continuity over
long distances. Where reefs are present in the upper part of the system, the
sediments have abrupt lateral variations in lithology, and few units can be
widely traced. The northern reefs, in the Racine Formation, are mainly pure
dolomite. The interreef rocks are generally less pure, varying from cherty,
silty dolomite to argillaceous dolomite. However, in northwestern Illinois,
the interreef rocks, except in local areas, are nearly pure dolomite, similar
in lithology to the reef rock.
The Silurian System is divided into three series: the Alexandrian
Series (Zeizel et al., 1962; Willman, 1973), and the overlying Niagaran and
Cayugan Series. Only the Alexandrian and Niagaran are present in northern
and western Illinois. The Silurian System unconformably overlies the
43
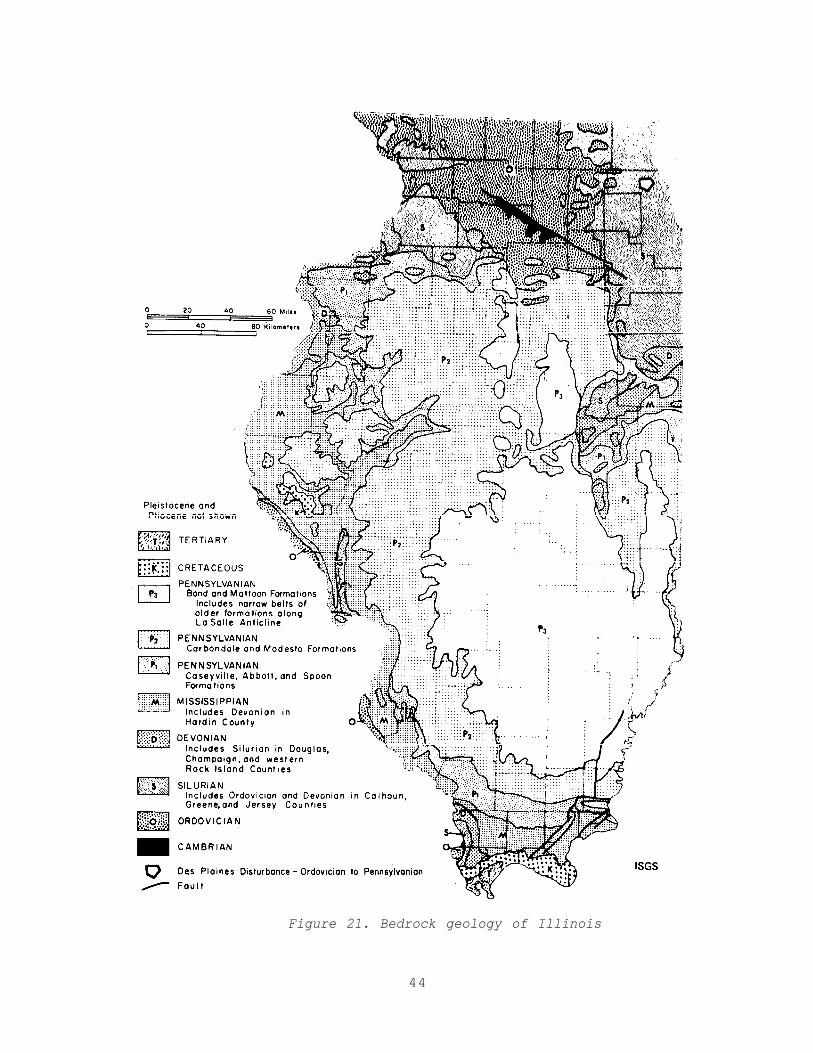
Figure 21. Bedrock geology of Illinois
44
Maquoketa Group, generally the eroded surface of the Brainard Shale. Locally
erosion has cut through the shale to the top of the Fort Atkinson Limestone.
There is also a major unconformity between the Silurian System and the over-
lying Middle Devonian System and younger rocks.
Devonian System
The Devonian System (Willman et al., 1975) may originally have covered
all of Illinois, but if so, it was eroded from the northern part of the
state, largely before Pennsylvanian time. It occurs in parts of the south-
eastern and most of the western portions of the area covered by this report.
The Devonian is less than 200 feet thick in large parts of central and
western Illinois, but thickens slightly toward the northwest and dramatically
toward the deep part of the basin to more than 1800 feet.
The Devonian System is divided into three series. The Lower Devonian
Series occurs only in southern Illinois and is not present within the area of
this report. The Middle Devonian Series is largely limestone and dolomite,
and the Upper Devonian Series is dominantly black, gray, and green shale,
although smaller amounts of limestone and siltstone are present.
Carboniferous Systems
The Carboniferous rocks in Illinois consist of two systems, the Missis-
sippian and Pennsylvanian, separated by a major angular unconformity. The
Mississippian System is dominantly carbonate, consisting of about 55% lime-
stone and dolomite, 35% shale and siltstone, and about 10% sandstone. The
Pennsylvanian System is dominated by shale, containing about 50% shale, 40%
sandstone and siltstone, 5% limestone, 1 to 2% coal, and minor amounts of
siderite and chert (Atherton and Palmer, 1979).
Mississippian rocks occur in the subsurface over the southern two-thirds
of the state (Willman et al., 1975), where they are overlain mostly by
Pennsylvanian rocks, except in the western part where they are overlain by
glacial till (fig. 21).
In Illinois, the Mississippian System is divided into three series. The
Kinderhookian Series at the base consists mainly of normal marine, fine-
grained, elastic, sedimentary rocks. The relatively thick Valmeyeran Series
in the middle includes biogenic limestone which outcrops along the outer
edges of the basin in western and northwestern Illinois. The thick,
45
Chesterian Series, at the top, is confined to the deeper part of the basin
and does not occur within the study area.
Strata of the Pennsylvanian System constitute the bedrock surface in
about two-thirds of Illinois (Willman et al., 1975). Throughout most of the
area in which they occur (fig. 21) they are covered by unconsolidated
Pleistocene deposits, but in many areas they have been exposed by stream
erosion. The maximum thickness of the Pennsylvanian in Illinois is about
2500 feet in the southeastern part of the state. The formations generally
thicken from northern and western Illinois toward the south and southeast.
In much of the Pennsylvanian area of western and northern Illinois, most of
the members of the three lowest formations are relatively thin or missing,
and in places along the LaSalle Anticlinal Belt, the base of the Carbondale
Formation rests directly on the Ordovician St. Peter Sandstone. However, in
the extreme northwest, in Rock Island and Mercer Counties, the three lowest
formations are all present.
The Pennsylvanian System is characterized by many vertical changes in
lithology, commonly abrupt, that produce more than 500 distinguishable units
of sandstone, siltstone, shale, limestone, coal, and clay (Kosanke et al.,
1960). Many of these units are laterally extensive, and even though they
vary lithologically, they can be correlated widely because of their positions
relative to continuous marker units, usually limestones, black fissile
shales, or coals. Shale (dominantly gray with smaller amounts of red, green,
and black) and underclay commonly form 65 to 70% of the sequence.
Cretaceous and Tertiary Systems
The Cretaceous System (Willman et al., 1975) is restricted to five
counties in extreme southern Illinois, and to areas in Pike and Adams
Counties in western Illinois (fig. 21). The Cretaceous rocks in western
Illinois (Frye et al., 1964) are elastic rocks, largely sand, and as much as
100 feet thick. They are the easternmost outliers of Cretaceous sediments
that formerly covered the region east of the Rocky Mountains and north of the
Ozarks.
The Tertiary System (Willman et al., 1975) is extensive in extreme
southern Illinois and also occurs in small, widely scattered areas in
western and northern Illinois (fig. 21). Tertiary deposits in northern and
46
western Illinois consist of scattered deposits of brown, chert gravel -- the
Grover Gravel of Pliocene age (Willman and Frye, 1970).
The existence of these scattered Cretaceous and Tertiary deposits has
little or no influence on groundwater conditions in the northern two-thirds
of Illinois. However, widespread erosion that took place during the long
interval between the end of the Pennsylvanian and into and during the
Quaternary has produced a bedrock surface that at least locally influences
groundwater movement and recharge to the bedrock aquifers.
Quaternary System
Surficial deposits assigned to the Quaternary System, Pleistocene
Series, blanket nearly all of Illinois. The thickness, lithology, and physi-
cal and mineralogical properties of these deposits, predominantly glacial in
origin, may have a significant effect on the chemistry, rate, and amount of
water entering the bedrock aquifers. There is evidence that continental
glaciation caused regional changes in the groundwater flow systems and
altered the chemistry of the groundwater in the bedrock (Gilkeson et al.,
1981).
Extensive studies have been conducted on these deposits; therefore, this
section will only briefly summarize the most pertinent aspects which must be
considered in relationship to the bedrock aquifers. Additional details on
these deposits may be obtained from published reports (e.g., Frye et al.,
1962, 1963, 1969; Willman et al., 1963; Willman and Frye, 1970; Willman,
1971 ; and Piskin and Bergstrom, 1975) and many unpublished reports, manu-
scripts, and data sources in the files of ISGS.
The principal Pleistocene surficial deposits are glacial materials
deposited during numerous ice advances and retreats which occurred over most
portions of the state. In some areas thick loess or valley fill sand and
gravel are the principal deposits. Only northwestern Illinois (mainly
Carroll and central Jo Daviess Counties), a small area of western Illinois
(Calhoun County and portions of Pike and Adams Counties), and the extreme
southern portion of the state have not been covered by glaciers. The thick-
ness of these deposits (Piskin and Bergstrom, 1975) ranges from zero to about
600 feet (fig. 22). Although these deposits, both glacial and interglacial,
have been assigned to the Nebraskan, Aftonian, Kansan, Yarmouthian,
47
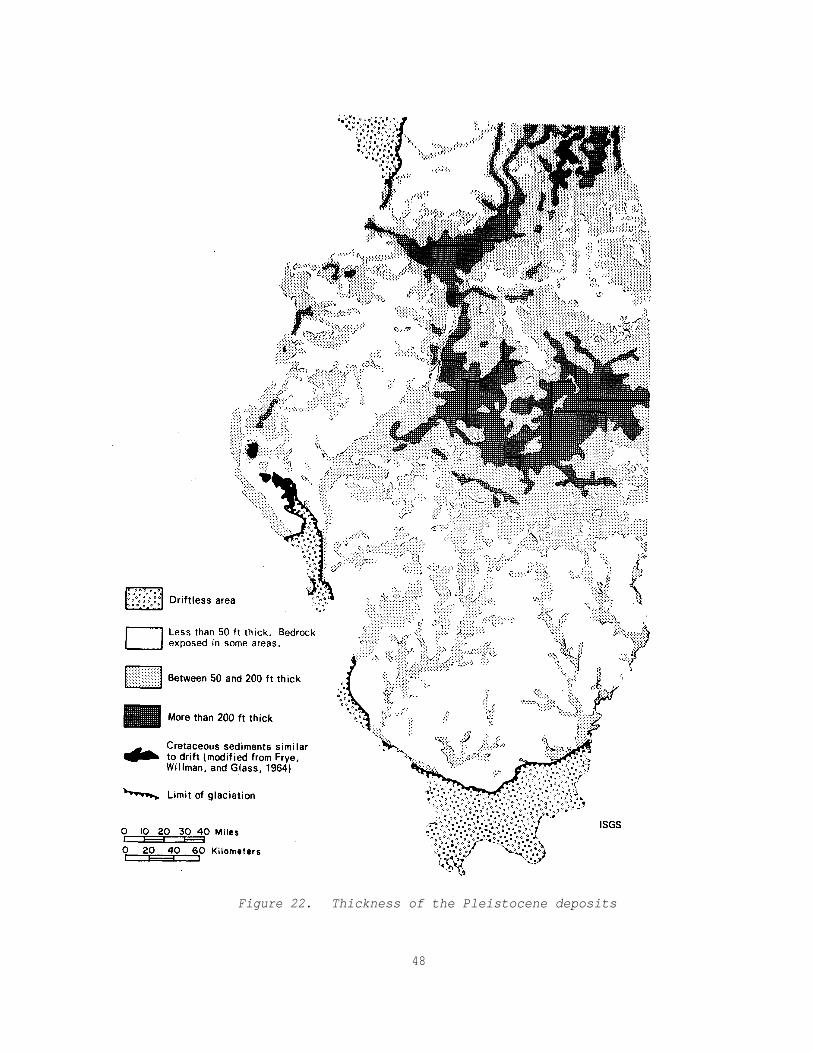
Figure 22. Thickness of the Pleistocene deposits
48
Illinoian, Sangamonian, Wisconsinan, and Holocene Stages, they have also been
included in numerous formations and members on the basis of their lithologic
characteristics and stratigraphic position.
The topography of the bedrock surface (Horberg, 1950; Willman and Frye,
1970) is characterized by a number of long, relatively wide and deep valleys,
significant portions of which are now completely or partially buried by
Quaternary glacial deposits. It is also characterized by extensive, rela-
tively flat upland surfaces developed on the Pennsylvanian rocks of the
central part of the state, and by relatively hilly, irregular topography
developed mainly on the older Paleozoic rocks in northern and western
Illinois. In these latter two areas, the bedrock valleys have locally been
eroded into and through two or more of the aquifer or nonaquifer systems.
Since the overlying Quaternary sediments blanket most of the state, covering
the bedrock uplands and at least partially filling the bedrock valleys, the
relationship between the bedrock topography and the distribution and thick-
ness of Quaternary materials is often both locally and regionally quite
obvious (fig. 22).
The distribution of the principal surficial Pleistocene deposits is
shown on figure 23. While pre-Illinoian deposits form the principal surface
materials in only a small portion of western Illinois (western Hancock,
Adams, and Pike Counties), they occur extensively in the subsurface in siz-
able areas of western Illinois (Enion, Wolf Creek and Alburnett Formations)
and central and east-central Illinois (Banner Formation). Scattered pre-
Illinoian deposits have also been reported in the subsurface of parts of
northern and south-central Illinois.
Two of the largest areas of surficial outwash, the Green River-Lower
Rock River Basin (Leighton, Ekblaw, and Horberg, 1948) and the Havana region
of the Illinois River (Walker et al., 1965), in northern and western
Illinois, respectively, contain sand and gravel deposits that are locally
continuous from land surface to bedrock; fine-grained Holocene alluvium
(Cahokia Alluvium) is also present along streams. Surficial glacial outwash
sand and gravel (Henry Formation) is present extensively in the form of
outwash plains, valley trains, and kames in McHenry and Kane Counties in
northeastern Illinois (Masters, 1978).
49
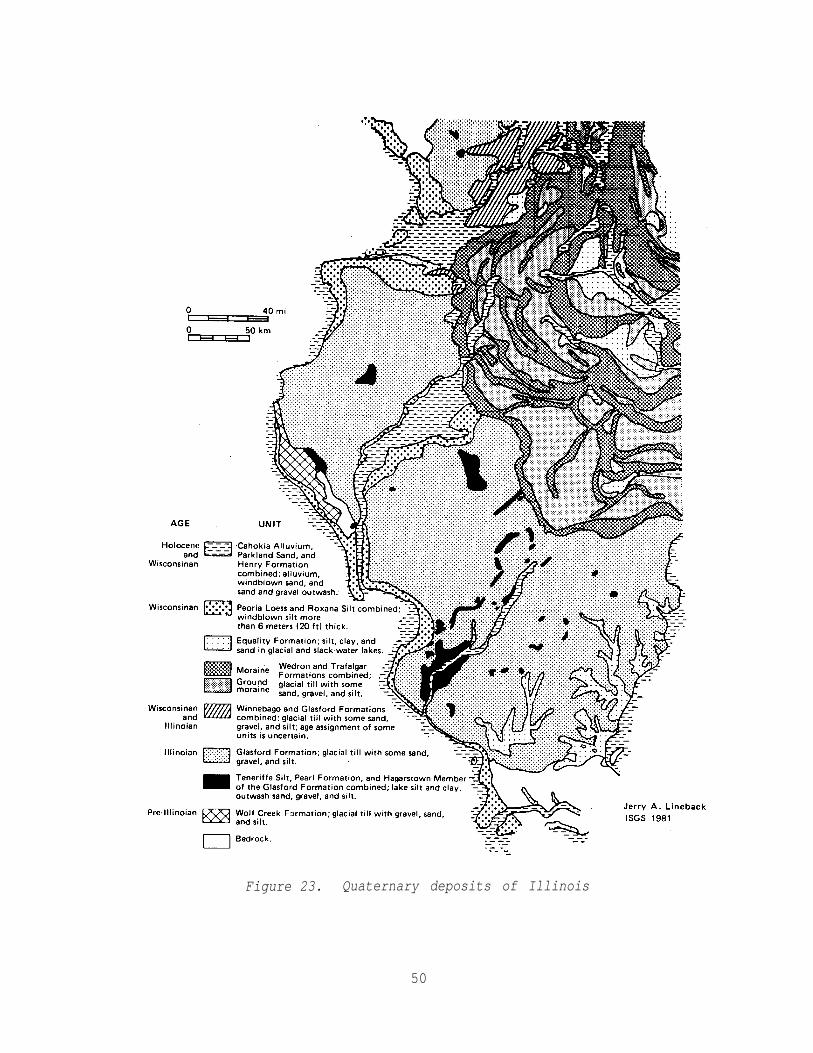
Figure 23. Quaternary deposits of Illinois
50
HYDROGEOLOGY
Introduction
Formal names of hydrostratigraphic units in Illinois are in the process
of change to reduce confusion with rock stratigraphic terminology. The
interim revised terminology for hydrostratigraphic units will be used in this
report. This terminology (Cartwright, 1983) divides the hydrogeologic units
into three major aquisystems, each of which is subdivided into aquigroups.
The aquigroups, also shown on figure 24, are defined and then described in
more detail in the following sections.
All aquisystems and aquigroups are present in the northern part of the
state. The Cambrian and Ordovician aquifers studied comprise the Basal
Bedrock and Midwest Bedrock Aquigroups, and in some areas are classified as
the Upper Bedrock Aquigroup. Detailed descriptions of all the geologic units
are given in the "Geology" section of this report.
Aquisystems and Aquigroups
Crystalline Rock Aquisystem
There are no significant aquifers within this aquisystem in Illinois.
Indurated Rock Aquisystem
Basal Bedrock Aquigroup. The Basal Bedrock Aquigroup is character-
ized by intermediate and regional groundwater flow systems in indurated rocks
and is always overlain by indurated rock confining units. This aquigroup
includes productive sandstone aquifers below thick, regionally extensive
shale of the Eau Claire Formation. This aquigroup is basically the same as
the "Mt. Simon Aquifer" previously defined in northeastern Illinois (Suter
et al., 1959).
The Basal Bedrock Aquigroup is comprised of the rocks of the Mt. Simon
Formation and the Elmhurst Sandstone Member of the Eau Claire Formation. The
sandstones lie on the Precambrian granite (fig. 6).
The aquigroup is more than 2500 feet thick in east-central Illinois and
northward and westward (fig. 7). The aquigroup varies from fine- to coarse-
grained sandstone. Shale beds, a few feet to several tens of feet thick, are
found throughout the aquigroup. The shale probably is lenticular in nature
and not continuous over large areas. Much of the sandstone is moderately
51
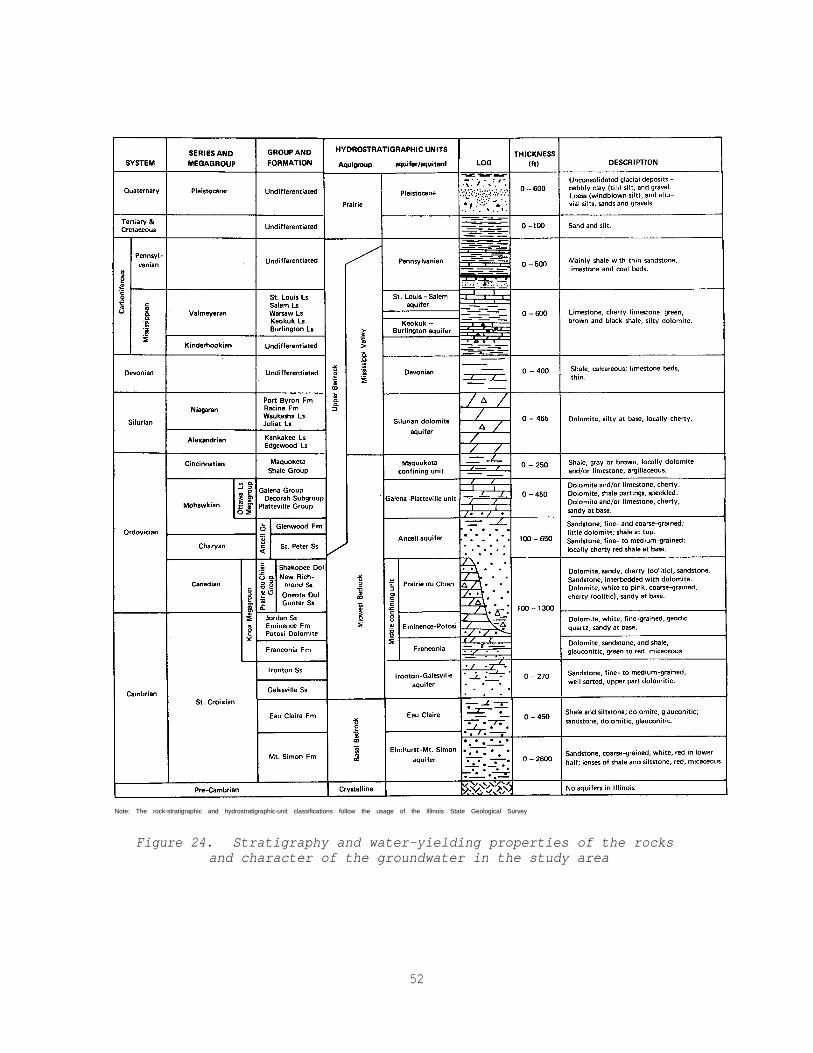
Note: The rock-stratigraphic and hydrostratigraphic-unit classifications follow the usage of the Illinois State Geological Survey
Figure 24. Stratigraphy and water-yielding properties of the rocksand character of the groundwater in the study area
52
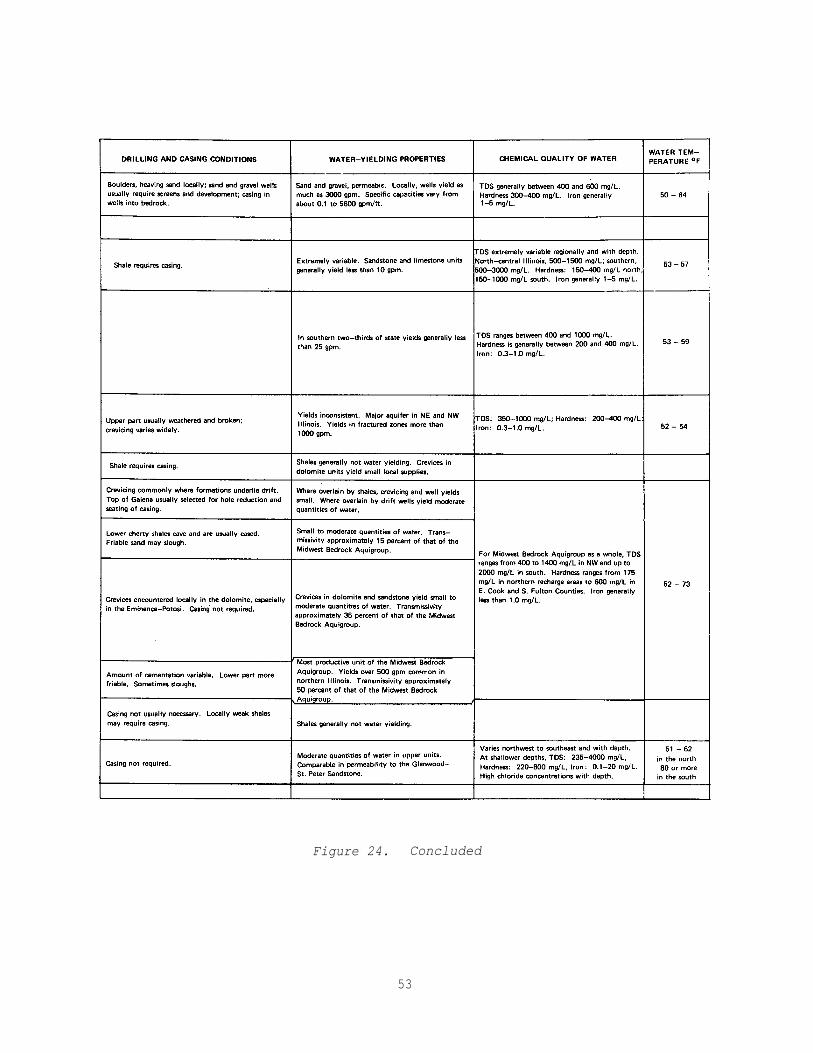
Figure 24. Concluded
53
well cemented and therefore has a relatively low hydraulic conductivity. The
upper 300 to 600 feet is generally friable, and several friable zones are
found in the unit. The degree of cementation decreases to the north toward
the Wisconsin state line and increases southward toward the Illinois Basin.
The sandy lower zones of the Eau Claire Formation increase in thickness
in relation to the total thickness of the formation. The shales become
thinner and probably become lenticular in character. When sandstone becomes
the predominant lithology, it yields significant water.
The Basal Bedrock Aquigroup is separated from the production zones of
the Midwest Bedrock Aquigroup by the shales of the Eau Claire Formation. The
confining unit is formed by the predominantly shaly upper part of the Eau
Claire Formation (fig. 9). The Eau Claire Formation gradually becomes
sandier to the north and west. However, the shale of the Proviso Siltstone
Member is quite persistent and forms a barrier between the aquifers of the
Basal Bedrock Aquigroup and the Ironton-Galesville aquifer of the Midwest
Bedrock Aquigroup above.
Wells near the Wisconsin border penetrate increasing amounts of sand-
stone interbedded with the shales. Detailed studies of wells in the northern
tier of counties show that 50 to 60% of the upper Eau Claire is sandstone.
Thus, wells which penetrate the confining unit may obtain moderate yields of
water from this zone. Nevertheless, the shales are laterally continuous, in
contrast to shales in the Elmhurst-Mt. Simon aquifer which are lenticular in
character. The sandstones in the Eau Claire confining unit may or may not be
continuous. Thus, despite the sandy character of the Eau Claire Formation,
the shales are persistent throughout the state and form a major aquitard.
Less is known about the confining unit in western Illinois. It appears
to become quite sandy, as in northern Illinois.
Midwest Bedrock Aquigroup. The Midwest Bedrock Aquigroup is character-
ized by intermediate and regional groundwater flow systems in indurated rock
that are overlain by indurated rock confining units. The top of the aqui-
group is defined as the top of the Maquoketa Shale Group or other confining
units where the Maquoketa is absent. The base of the aquigroup is at the top
of the Eau Claire Formation or stratigraphically higher where the Ironton and
Galesville Sandstones are absent. This aquigroup is basically the same as
the "Cambrian-Ordovician Aquifer" previously defined in northeastern Illinois
(Suter et al., 1959).
54
In northern Illinois the Midwest Bedrock Aquigroup consists of rock from
the base of the Galesville Sandstone up through the top of the Maquoketa
Shale Group. The Ironton-Calesville and Glenwood-St. Peter Sandstones are
the principal water-producing zonea in this region and are of principal
concern in this report. The lower boundary of the Midwest Bedrock Aquigroup
is at the base of the Galesville Sandstone in northern Illinois. Where the
Ironton-Galesville feathers out, the boundary rises along vertical cutoffs to
either the porous sandstone of the St. Peter or to the lowest productive
aquifer in the Knox Megagroup.
Ironton-Galesville Aquifer. The Ironton-Galesville aquifer is described
in detail in the "Geology" section. This sandstone (fig. 11) is the moat
uniform and productive zone in the Cambrian and Ordovician Systems in
Illinois north of the Illinois River.
South of the Illinois River the sandstone becomes finer, gradually
changing to a shale and then dolomite (in this Same stratigraphic position)
in the deeper parts of the Illinois Basin. This change is also reflected in
the water quality trends in the aquifer.
Middle Confining Unit. The strata between the top of the Ironton-
Galesville and St. Peter Sandstone (Ancell) are highly variable in thickness
(fig. 13) as a result of the erosion which took place before the deposition
of the St. Peter. This surface has been described both as a karat surface
and as one with deep valleys (Buschbach, 1961). While there is evidence to
support both hypotheses, it is clear that if karat did develop, there is no
remnant of the high permeability which must have existed.
The confining unit is mainly dolomite and shale with some sandstone.
The dolomite and sandstone contribute considerable quantities of water to
wells. Two of the sandstones are major aquifers in some regions. The Jordan
Sandstone, which is extensively used in Iowa, is present along the western
edge of the state in sufficient thickness to be productive; some wells in the
Rock Island-Moline area penetrate to the Jordan.
The New Richmond Sandstone is tapped by wells in parts of LaSalle and
Grundy Counties where it is relatively thick. In much of this area the
St. Peter is near the land surface and partly eroded, while the New Richmond
is confined and has considerable artesian head.
55
Ancell Aquifer. The St. Peter Sandstone, along with the overlying
Glenwood Sandstone when present (see "Geology" section), forms the second
principal aquifer of the Midwest Bedrock Aquigroup. This sandstone is wide-
spread in the north-central United States and is present under the entire
state, except where it has been eroded (fig. 15).
The thickness (fig. 14) averages about 200 feet; however, the thickness
varies greatly from less than 100 feet to over 600 feet. The thickening
reflects the irregular base of the formation; the surface is fairly regular.
The lower Kress member, which accounts for much of the increase in thickness,
frequently adds little to the yield of wells, being a rubble-like deposit in
a clay or shale matrix. Thus, the yield does not increase proportionally to
increases in thickness.
Galena-Platteville Unit. The Galena-Platteville Unit is found through-
out most of Illinois. It overlies the Ancell aquifer and sometimes forms
part of the confining unit for that aquifer, although it is locally produc-
tive. In northeastern Illinois and south of the Illinois River, the Galena-
Platteville Unit is overlain by the Maquoketa Shale Group or younger shales.
Although it yields some water in this situation, the yield generally is only
a small portion of the total water yielded to wells penetrating the deeper
sandstones as part of the Midwest Bedrock Aquigroup. Locally, larger
supplies are obtained from the Galena-Platteville. In northwestern Illinois
the Galena-Platteville Unit immediately underlies glacial deposits or is
exposed at the surface (fig. 17). The Maquoketa Shale Group is present above
the Galena-Platteville in small areas. In this region, the Galena-
Platteville dolomites become part of the Upper Bedrock Aquigroup.
Maquoketa Confining Unit. The Maquoketa Shale Group (fig. 19), where
present, forms the principal confining bed for the Midwest Bedrock Aquigroup
in northern and western Illinois. The Maquoketa Shale Group is described in
some detail in the "Geology" section of this report. Little water, if any,
is obtained from the shale. Where the Maquoketa directly underlies the
glacial deposits, limited amounts of water are obtained from joints and
fractures. Some dissolution has occurred in the Middle Fort Atkinson
Limestone, where it is overlain by Silurian and Quaternary deposits, and has
increased yields somewhat.
56
Mississippi Valley Bedrock Aquigroup. The Mississippi Valley Bedrock
Aquigroup is characterized by intermediate and regional groundwater flow
systems in indurated rock that are overlain by indurated rock confining
units. The base of this system is at the top of the Maquoketa Shale Group
(this is the only aquigroup boundary which cannot move stratigraphically).
The aquigroup consists of rocks from the Pennsylvanian System through the
Silurian System in the southern three-fourths of Illinois; the aquigroup is
not present in northern Illinois.
In the southwestern part of the region studied, where Mississippian and
Pennsylvanian rock are present, the shales confine several moderately produc-
tive aquifers. The primary water-yielding zones are dolomites of the
Devonian and Silurian Systems and sandstones and carbonates of the Missis-
sippian System. Some sandstones are also present in the Pennsylvanian, but
these generally have very low productivity.
Devonian and Pennsylvanian shales are present throughout most of the
area south of the Illinois River, and form the principal confining units
within the aquigroup. The upper boundary of the Mississippi Valley Bedrock
Aquigroup rises stratigraphically to include the uppermost aquifer confined
by indurated rocks and all the confining units below the Upper Bedrock
Aquigroup.
Upper Bedrock Aquigroup. This aquigroup consists of local and inter-
mediate flow systems in indurated sediments with open connection to the
Prairie Aquigroup so that water quality is related to that in the Prairie
Aquigroup. This aquigroup is basically the same as the "Shallow Dolomite
Aquifer" as previously defined in northern Illinois (Suter et al., 1959).
The Galena-Platteville Unit, the Maquoketa Confining Unit, and, locally,
the Ancell aquifer become part of the Upper Bedrock Aquigroup in north-
central Illinois, where they are exposed at the surface or overlain by
glacial deposits. These aquifers are moderately productive. In this region
dissolution of the rock by groundwater has occurred, enlarging the joints and
fractures in the rock and increasing its permeability. The degree of joint-
ing and fracturing and dissolution decreases with increasing depth of pene-
tration in the rock. Most of the water is obtained in the uppermost 100 feet
of rock.
The most significant and productive aquifer of the aquigroup is the
Silurian Dolomite aquifer, which underlies northeastern Illinois and a small
57
part of northwestern Illinois (fig. 21). In these areas, large yields are
sometimes obtained, reducing the dependence on the Cambrian- and Ordovician-
age aquifers.
The only other significant aquifers which make up the Upper Bedrock
Aquigroup in the region studied are the Mississippian carbonate rocks in the
southwestern part of the region (fig. 21).
Non-Indurated Rock Aquisystem
Prairie Aquigroup. This aquigroup consists of local and intermediate
flow systems in nonindurated geologic materials consisting of alluvium,
glacial drift, and Cretaceous and Tertiary sediments. The major component of
recharge to the system is local precipitation. The aquigroup is confined
locally by fine-grained nonindurated sediments (referred to as confining
units or aquitards). In some regions the Prairie Aquigroup is 400 to 500
feet thick, while in others it is 0 to 50 feet thick.
58
HYDROLOGY
Hydraulic Properties
The principal hydraulic properties which influence well yields and
water-level response to pumpage in the Cambrian and Ordovician aquifers are
transmissivity and storage coefficient. Regionally, the leakage coefficient
also plays an important role in influencing water levels. The capacity of an
aquifer to transmit groundwater is expressed by the transmissivity, which is
defined as the rate of flow of water through a unit width of the aquifer.
under a unit hydraulic gradient. The storage properties of an aquifer are
expressed by the storage coefficient, which is defined as the volume Of water
released from or taken into storage per unit surface area of the aquifer per
unit change in head normal to that surface.
For confined (artesian) conditions, in which water levels rise above the
top of the aquifer in wells penetrating the aquifer, water released from or
taken into storage is attributed solely to compressibility properties of the
aquifer and water. Such coefficients are usually very small. On the other
hand, where unconfined conditions (water table) prevail, in which water
levels in wells represent the top of the saturated thickness of the aquifer,
water released from or taken into storage is attributed almost entirely to
gravity drainage or refilling of the zone through which the change of the
water table takes place. A small portion of the water volume change comes
from the compressibility of the aquifer and water, as in the artesian case,
but this volume is proportionately nearly insignificant.
Most of the available data on hydraulic properties are from the Midwest
Aquigroup. The storage coefficients for the confined aquifer are generally
10-5 to 10-3. Water-table storage coefficient data for the Midwest Aquigroup
have never been obtained from tests, because until recently the aquifers have
remained under artesian conditions. Typical values of water-table storage
coefficients in unconsolidated material range from 0.01 to 0.3.
The rate of vertical leakage of groundwater through a confining bed in
response to a given vertical head gradient is dependent upon the vertical
hydraulic conductivity of the confining bed. In cases where the confining
bed is not well defined or is unknown, Hantush (1956) suggested the use of
the term leakage coefficient, which is the ratio of the vertical hydraulic
conductivity of the confining bed to its thickness. It is defined as the
59
quantity of water that crosses a unit area of the interface between an
aquifer and its confining bed divided by the head loss across the confining
bed.
Aquifer Tests
The hydraulic properties of aquifers and confining beds may be deter-
mined by means of aquifer tests wherein the effect of pumping a well at a
known constant rate is measured in the pumped well and in observation wells
penetrating the aquifer. Graphs of drawdown versus time or drawdown versus
distance from the pumped well are used to solve formulas which express the
relationship between the hydraulic properties of an aquifer and its confining
bed, if present, and the lowering of water levels (drawdown) in the vicinity
of a pumping well. Graphical analyses may utilize the leaky artesian formula
(Hantush and Jacob, 1955), the nonequilibrium formula (Theis, 1935), or the
modified nonequilibrium formula (Cooper and Jacob, 1946). Type-curve and
straight-line methods for graphical analysis were described by Walton (1962).
Test data collected under water-table conditions may be analyzed by methods
devised by Boulton (1963) and described by Prickett (1965). Where geohydro-
logic boundaries are known to exist, their effect on drawdown can be deter-
mined by means of image-well theory, described by Ferris (1959).
Basal Bedrock Aquigroup. Aquifer test data from the Basal Bedrock
Aquigroup were available from three long-term tests at gas storage project
sites (Illinois State Water Survey and Hittman Associates, 1973). The tests
were conducted at pumping rates of 80, 45, and 56 gpm for periods of 48, 40,
and 18 days, respectively. At least five observation wells were available at
each site; however, because of the partial penetration effects caused by the
great thickness of this aquifer system, data from distant (greater than 1.5
times the aquifer thickness) observation wells were given preference over
data from wells closer to the pumped well, in order to minimize distortions
caused by partial penetration of wells.
Data from the distant observation wells were analyzed by graphical
techniques described in the above references. The results are summarized in
table 1.
60
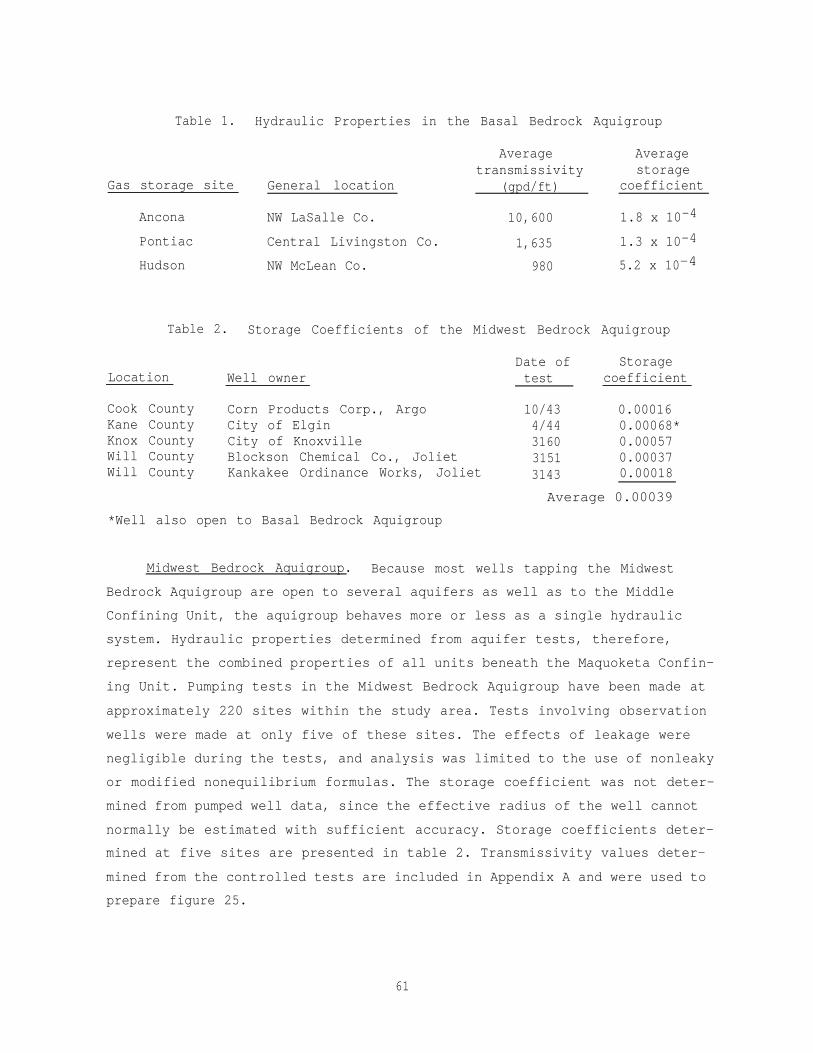
Table 1. Hydraulic Properties in the Basal Bedrock Aquigroup
Average Averagetransmissivity storage
Gas storage site General location (gpd/ft) coefficient
Ancona NW LaSalle Co. 10,600 1.8 x 10⁻⁴
Pontiac Central Livingston Co. 1,635 1.3 x 10⁻⁴
Hudson NW McLean Co. 980 5.2 x 10⁻⁴
Table 2. Storage Coefficients of the Midwest Bedrock Aquigroup
Location Well ownerDate of Storagetest coefficient
Cook County Corn Products Corp., Argo 10/43 0.00016Kane County City of Elgin 4/44 0.00068*Knox County City of Knoxville 3160 0.00057Will County Blockson Chemical Co., Joliet 3151 0.00037Will County Kankakee Ordinance Works, Joliet 3143 0.00018
Average 0.00039
*Well also open to Basal Bedrock Aquigroup
Midwest Bedrock Aquigroup. Because most wells tapping the Midwest
Bedrock Aquigroup are open to several aquifers as well as to the Middle
Confining Unit, the aquigroup behaves more or less as a single hydraulic
system. Hydraulic properties determined from aquifer tests, therefore,
represent the combined properties of all units beneath the Maquoketa Confin-
ing Unit. Pumping tests in the Midwest Bedrock Aquigroup have been made at
approximately 220 sites within the study area. Tests involving observation
wells were made at only five of these sites. The effects of leakage were
negligible during the tests, and analysis was limited to the use of nonleaky
or modified nonequilibrium formulas. The storage coefficient was not deter-
mined from pumped well data, since the effective radius of the well cannot
normally be estimated with sufficient accuracy. Storage coefficients deter-
mined at five sites are presented in table 2. Transmissivity values deter-
mined from the controlled tests are included in Appendix A and were used to
prepare figure 25.
61
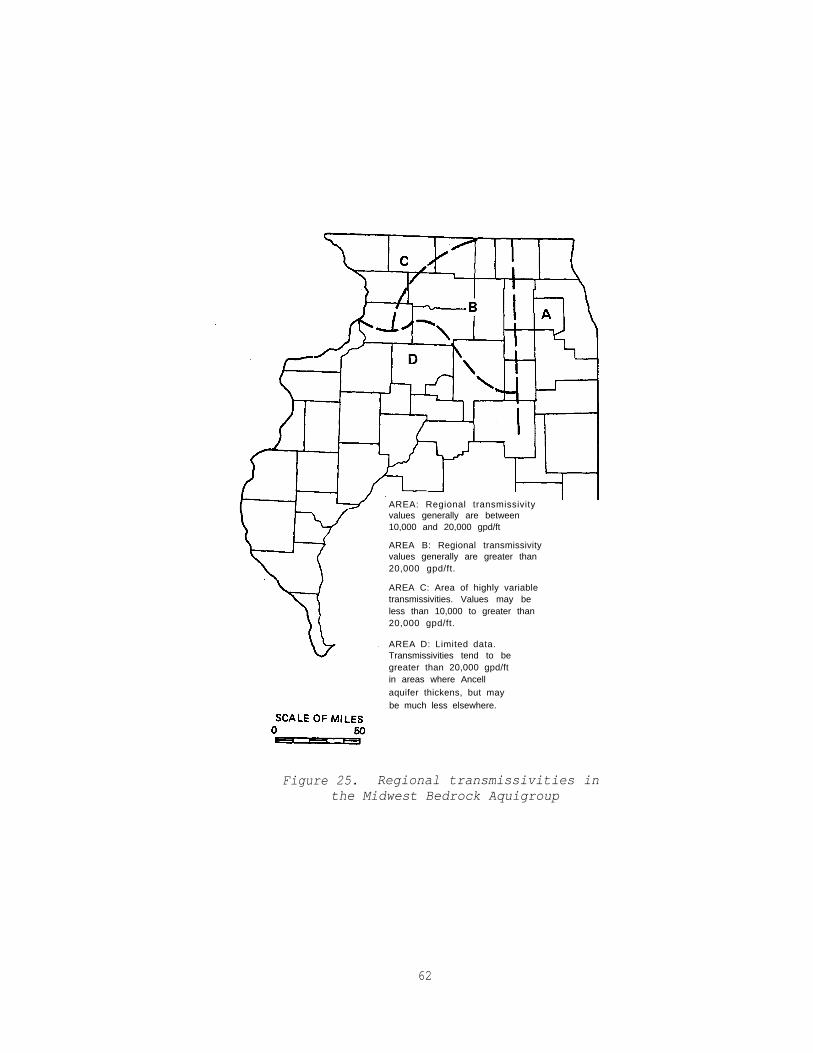
AREA: Regional transmissivityvalues generally are between10,000 and 20,000 gpd/ft
AREA B: Regional transmissivityvalues generally are greater than20,000 gpd/ft.
AREA C: Area of highly variabletransmissivities. Values may beless than 10,000 to greater than20,000 gpd/ft.
AREA D: Limited data.Transmissivities tend to begreater than 20,000 gpd/ftin areas where Ancell
aquifer thickens, but maybe much less elsewhere.
62
Figure 25. Regional transmissivities inthe Midwest Bedrock Aquigroup
Lithologic changes within the Ancell and Ironton-Galesville aquifers
appear to have an effect on transmissivities of the Midwest Bedrock Aqui-
group. The thickness of the Ironton-Galesville aquifer generally increases
from the northwest to the southeast (see fig. 11), while that of the Ancell
aquifer is highly variable locally (fig. 14). Transmissivities are generally
increased by local or regional thickening of these two formations. In
addition, the transmissivity of the Midwest Bedrock Aquigroup increases
significantly where the overlying Maquoketa Confining Unit is absent.
In Area A of figure 25, the aquifers of the Midwest Bedrock Aquigroup
are overlain by the Maquoketa Confining Unit, and regional values of trans-
missivity may vary from 10,000 to 20,000 gpd/ft. Locally, however, where the
Ancell aquifer thickens at the expense of underlying, less permeable, car-
bonate rocks, transmissivities may exceed 20,000 gpd/ft. In Areas B and C,
wells in the Midwest Aquigroup are often open to shallower aquifers which may
affect the transmissivities measured. In the recharge area to the west of
the Maquoketa Confining Unit border (Area B), transmissivities generally
exceed 20,000 gpd/ft. In Area C the Maquoketa and the Galena-Platteville
Unit are highly dissected by streams, and as a result, transmissivities vary
in this region from fewer than 10,000 to more than 20,000 gpd/ft. Another
factor which probably contributes regionally to the lower transmissivity
values is the thinner Ironton-Galesville section in this area. The higher
values of transmissivity are usually accounted for by the locally thicker
Ancell aquifer, as well as a local absence of the Maquoketa. Area D is a
region where transmissivity data are sparse and variable. The Midwest
Bedrock Aquigroup is confined under the Maquoketa Confining Unit and other
overlying rocks, as in northeastern Illinois. Transmissivities in this
region are as low as 5,000 gpd/ft, but may exceed 20,000 gpd/ft.
Upper Bedrock Aquigroup. Six aquifer tests were made at five sites in
DuPage County between 1955 and 1980. At this location the Upper Bedrock
Aquigroup is composed of dolomites of Silurian age. According to Zeizel
et al. (1962) the Upper Bedrock Aquigroup is highly fractured and in many
places is under leaky artesian conditions. Transmissivities and storage
coefficients are highly variable both regionally and among the various obser-
vation wells in aquifer tests. Values of transmissivity and storage coeffi-
cient ranged from 10,500 to 85,400 gpd/ft and from 9.0 x 10⁻⁵ to 3.5 x 10⁻⁴,
63
respectively. Data from other areas in Illinois are not available for the
Upper Bedrock Aquigroup.
Specific Capacity Analyses
One means of expressing the yield of a well is by use of the specific
capacity, which is defined as the yield of the well in gallons per minute per
foot of drawdown for a given pumping period and discharge rate. Walton
(1962) showed that the Theis nonequilibrium formula can be expressed in terms
of the theoretical specific capacity of a well discharging at a constant rate
in a homogeneous, isotropic, areally infinite, nonleaky aquifer.
The theoretical specific capacity of a well varies with the radius of
the well and the pumping period. For instance, a 30-inch diameter well has a
specific capacity about 13% greater than that of a 12-inch diameter well.
The theoretical specific capacity decreases with the length of the pumping
period, since drawdowh continuously increases with time.
Head losses within the well, known as well losses, must be accounted for
before drawdown data can be used in the specific capacity formula to estimate
hydraulic properties. Jacob (1947) and Rorabaugh (1953) described graphical
methods to compute the well loss coefficient from data collected during a
step-drawdown test in which the well pump is operated during several succes-
sive and equal time periods at constant fractions of the final pumping rate.
Where applicable, additional corrections must be made to drawdown data
for the effects of partial penetration and for decreases in saturated thick-
ness under water-table conditions. None of the specific capacity data for
the Midwest Bedrock Aquigroup were affected by water-table conditions. The
effects of partial penetration within the Midwest Bedrock Aquigroup could not
be assessed because of the heterogeneous character of the various hydrogeo-
logic units within the aquigroup. It is believed, however, that the majority
of wells penetrating the Midwest Bedrock Aquigroup generally receive ground-
water flow from the most productive units within the system and that the
effects of partial penetration are not significantly large. Partial penetra-
tion effects, likewise, are not considered significant in the Upper Bedrock
Aquigroup, since wells in that system generally penetrate its most productive
upper zones, which are more creviced than are those at depth. Data from the
Basal Bedrock Aquigroup are extremely limited. There is evidence that the
64
units within this system are stratified, and the effect of such stratifica-
tion in such a thick aquifer system cannot be evaluated at present.
All specific capacity data were corrected for well losses and adjusted
to a common well radius (0.5 foot) and a common pumping period (12 hours) for
purposes of comparison. From these data, values of aquifer transmissivity
were derived from the relationship between transmissivity and specific
capacity given by the modified nonequilibrium formula (Walton, 1962). TO
solve this formula the storage coefficient must be assumed, based upon
whether aquifer conditions are water table or artesian.
Basal Bedrock Aquigroup. Specific capacity data are available for just
one well open only to the Basal Bedrock Aquigroup. The well, located in
northern Cook County, had an adjusted specific capacity of 0.6 gpm/ft. The
effects of partial penetration in this well could be large, since the ratio
of vertical to horizontal hydraulic conductivity is believed to be about 0.3
to 0.4 (Illinois State Water Survey and Hittman Associates, 1973) and the
thickness of the aquigroup is approximately 2000 feet in northern Cook
County.
Midwest Bedrock Aquigroup. Specific capacity data were collected during
well production tests at approximately 570 sites. The transmissivity for
each data value was then obtained from the relationship between transmis-
Sivity and specific capacity described above. Transmissivity values
obtained from specific capacity were used to help prepare figure 25.
Upper Bedrock Aquigroup. Csallany and Walton (1963) ‘studied yields of
wells in the Upper Bedrock Aquigroup in northern Illinois. The massive
amounts of data (approximately 1000 production tests) available, however,
yielded specific capacity values which were extremely variable and inter-
pretatively intractable. Csallany and Walton solved this problem by treating
the data statistically, whereby adjusted specific capacities were divided by
the depths of penetration of the wells and plotted as frequency graphs. It
had been known that crevicing and depth of well strongly influence well
yields. Csallany and Walton’s study, however, also indicated a correlation
between well yields and bedrock upland areas and areas where sand and gravel
were present in the glacial drift immediately above the bedrock. The 50%
frequency value of unit specific capacity (yield per foot of penetration) for
bedrock upland areas, for example, was 0.24 gpm/ft/ft, whereas in bedrock
valleys the 50% frequency value was only 0.065 gpm/ft/ft. Where sand and
65
gravel in the drift overlaid the bedrock, the 50% value of unit specific
capacity was 0.26 gpm/ft/ft, whereas if the glacial drift material was till,
the 50% value was 0.06 gpm/tt/ft.
Leakage Coefficient
Values of the leakage coefficient of a confining layer are normally
determined by analysis of long period (24 hours or more) aquifer tests,
involving time-drawdown data from one or more observation wells. Such was
the case with the Upper Bedrock Aquigroup. Within the Basal and Midwest
Bedrock Aquigroups, however, leakage due to pumpage from a single well is too
small to be observed in a typical well test, and a regional analysis must be
made using flow-net and mass balance analyses.
Basal Bedrock Aquigroup Confining Unit. Schicht, Adams, and Stall
(1976) used flow-net analysis of earlier work by Walton (1960) to estimate
the average coefficient of vertical hydraulic conductivity for the confining
unit of the Basal Bedrock Aquigroup as 3.0 x 10⁻⁵ gpd/ft2. The leakage
coefficient for this confining unit can be estimated, therefore, by dividing
the vertical hydraulic conductivity at a given location by the thickness of
the confining unit. Figure 9 shows that the thickness of the confining unit
in the study area varies from 0 to 600 feet but is generally from 200 to 400
feet thick. The leakage coefficient, therefore, is estimated to be between
7.5 x 10⁻⁸ and 1.5 x 10⁻⁷ gpd/ft3 throughout much of the study area.
Midwest Bedrock Aquigroup Confining Unit. The Maquoketa Shale Group
forms the confining unit of the Midwest Aquigroup in large parts of north-
eastern Illinois and also in portions of northwestern Illinois. As shown in
figure 19, the Maquoketa Shale Group has a maximum thickness of about 200
feet in the Chicago area and thins to the north and west. The changes in
artesian pressure produced by pumping in the Midwest Aquigroup have been
pronounced and widespread and have caused large differentials in head above
and below the Maquoketa. As a result, appreciable quantities of water have
moved downward through the Maquoketa as leakage, as will be discussed in the
section, "Recharge and Movement of Groundwater."
Walton (1960) made a regional flow-net analysis of the Chicago area and
determined a leakage coefficient for the confining unit of 2.5 x 10⁻⁷
66
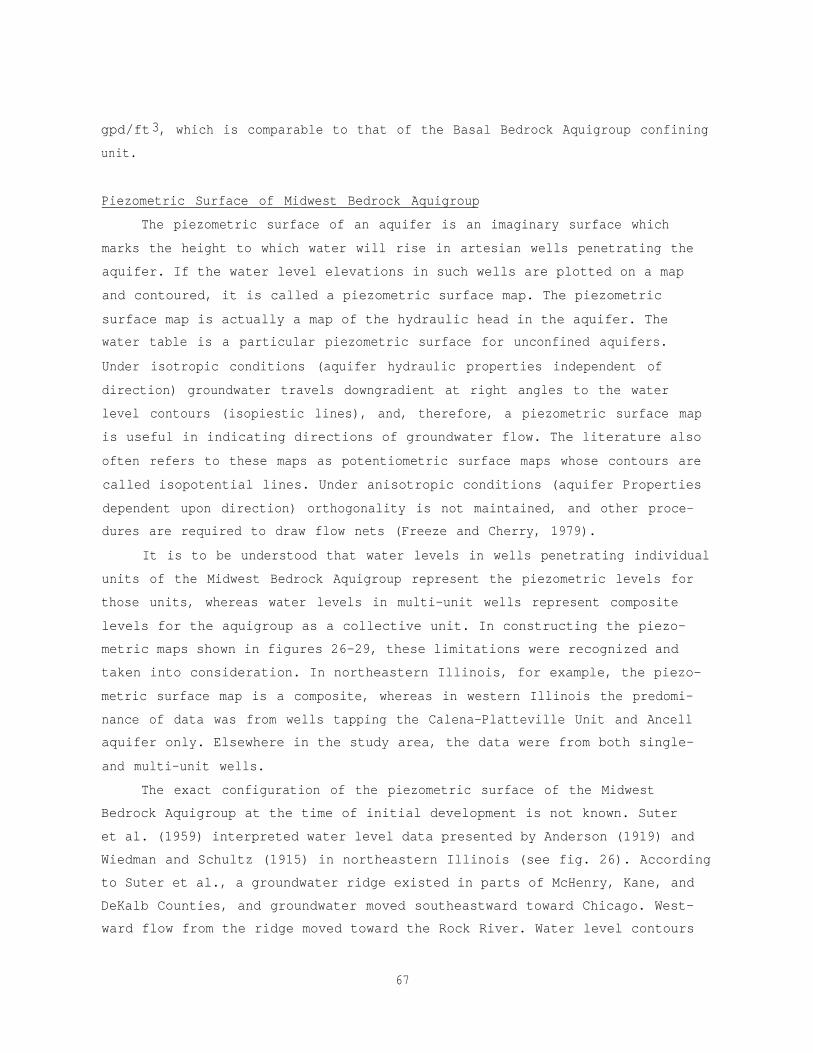
gpd/ft3, which is comparable to that of the Basal Bedrock Aquigroup confining
unit.
Piezometric Surface of Midwest Bedrock Aquigroup
The piezometric surface of an aquifer is an imaginary surface which
marks the height to which water will rise in artesian wells penetrating the
aquifer. If the water level elevations in such wells are plotted on a map
and contoured, it is called a piezometric surface map. The piezometric
surface map is actually a map of the hydraulic head in the aquifer. The
water table is a particular piezometric surface for unconfined aquifers.
Under isotropic conditions (aquifer hydraulic properties independent of
direction) groundwater travels downgradient at right angles to the water
level contours (isopiestic lines), and, therefore, a piezometric surface map
is useful in indicating directions of groundwater flow. The literature also
often refers to these maps as potentiometric surface maps whose contours are
called isopotential lines. Under anisotropic conditions (aquifer Properties
dependent upon direction) orthogonality is not maintained, and other proce-
dures are required to draw flow nets (Freeze and Cherry, 1979).
It is to be understood that water levels in wells penetrating individual
units of the Midwest Bedrock Aquigroup represent the piezometric levels for
those units, whereas water levels in multi-unit wells represent composite
levels for the aquigroup as a collective unit. In constructing the piezo-
metric maps shown in figures 26-29, these limitations were recognized and
taken into consideration. In northeastern Illinois, for example, the piezo-
metric surface map is a composite, whereas in western Illinois the predomi-
nance of data was from wells tapping the Calena-Platteville Unit and Ancell
aquifer only. Elsewhere in the study area, the data were from both single-
and multi-unit wells.
The exact configuration of the piezometric surface of the Midwest
Bedrock Aquigroup at the time of initial development is not known. Suter
et al. (1959) interpreted water level data presented by Anderson (1919) and
Wiedman and Schultz (1915) in northeastern Illinois (see fig. 26). According
to Suter et al., a groundwater ridge existed in parts of McHenry, Kane, and
DeKalb Counties, and groundwater moved southeastward toward Chicago. West-
ward flow from the ridge moved toward the Rock River. Water level contours
67
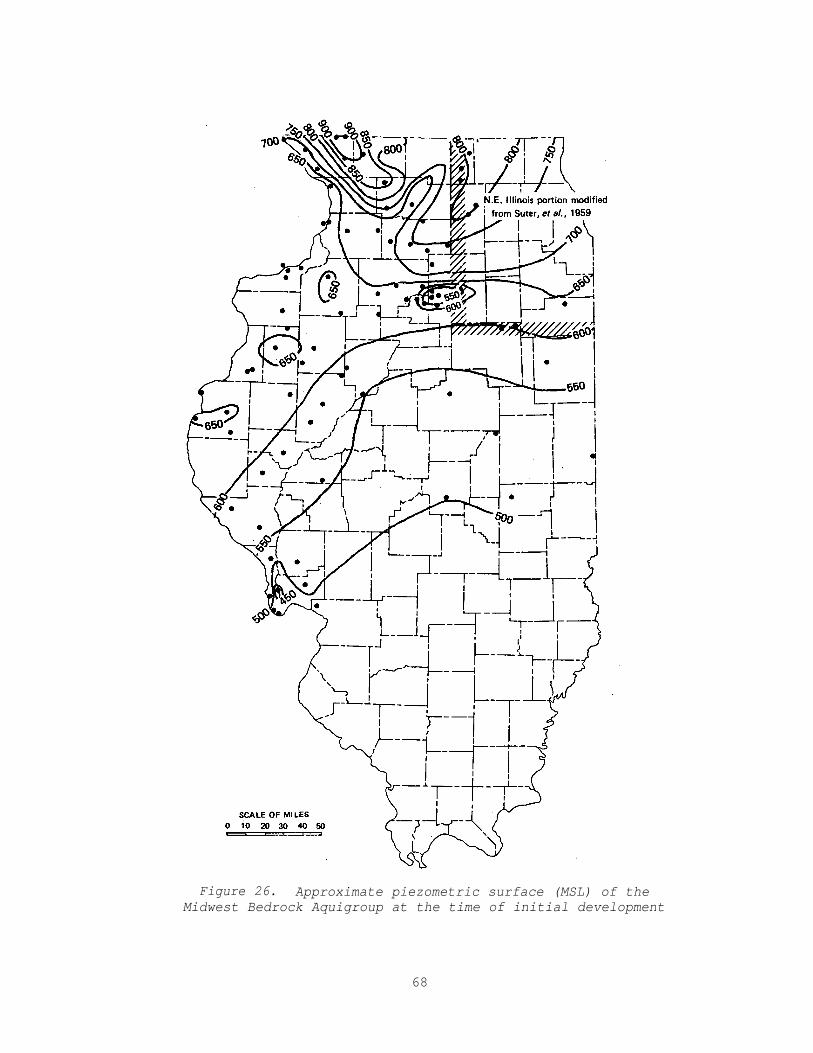
Figure 26. Approximate piezometric surface (MSL) of theMidwest Bedrock Aquigroup at the time of initial development
68
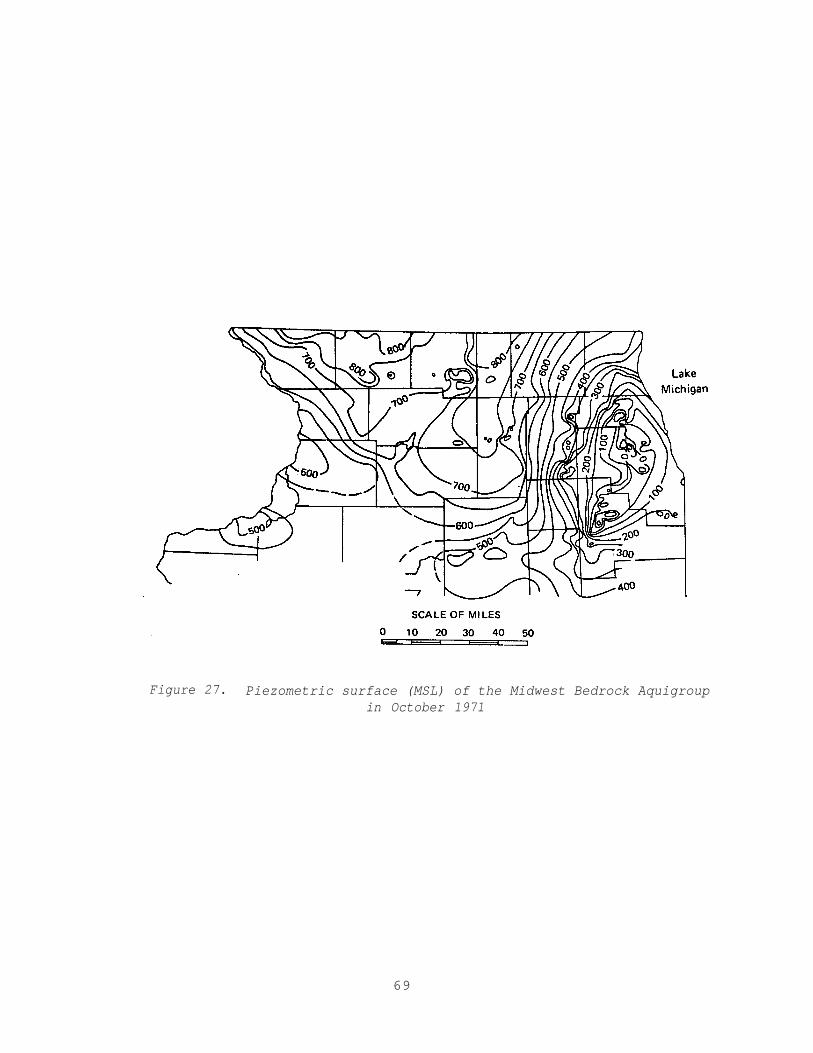
Figure 27. Piezometric surface (MSL) of the Midwest Bedrock Aquigroupin October 1971
69
H Area where Maquoketa Shale Groupis not present
Figure 28. Piezometric surface (MSL) of the Midwest Bedrock Aquigroupin October 1980
70
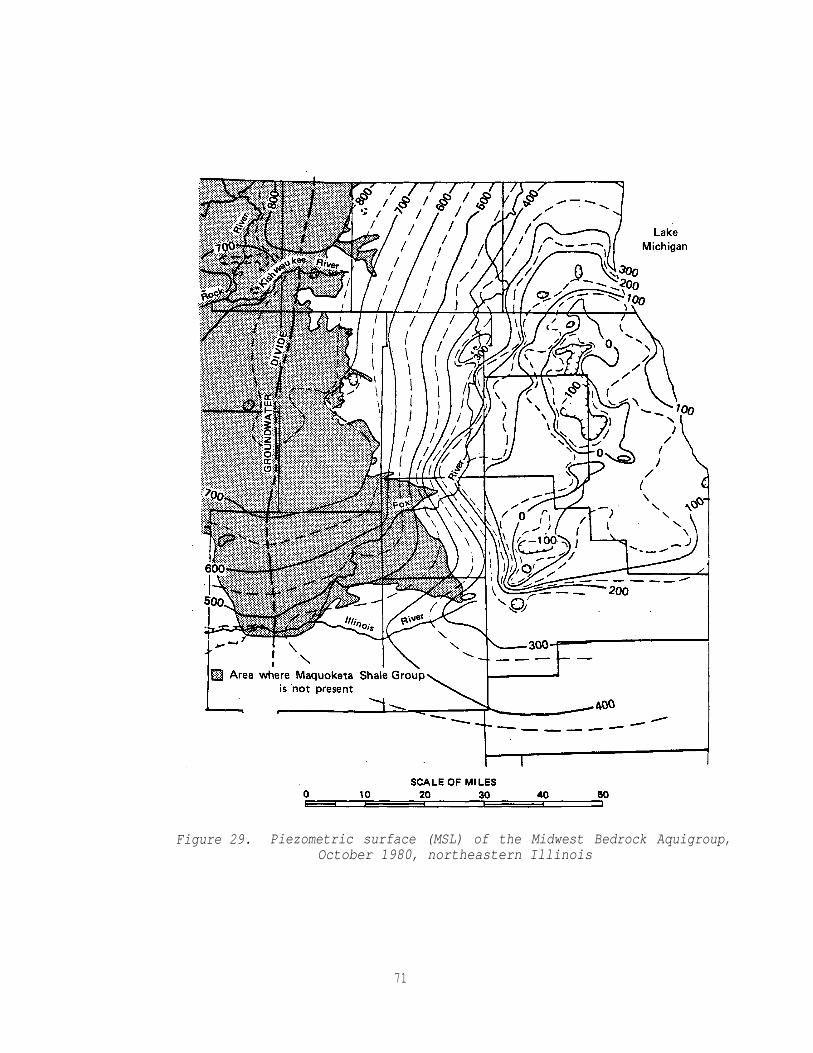
71
Figure 29. Piezometric surface (MSL) of the Midwest Bedrock Aquigroup,October 1980, northeastern Illinois
also indicate that groundwater moved toward discharge along the Illinois
River in Grundy and LaSalle Counties.
Water level measurements on file at the State Water Survey for the
northwestern, western, and southwestern portions of the study area in
Illinois (taken prior to any significant effects of deep groundwater develop-
ment) were used, along with geologic information, to construct water level
contours in those areas and, in effect, extend Suter’s piezometric surface
map (with minor modification) over the entire study area (fig. 26). The
contours indicate a groundwater ridge in portions of Jo Daviess, Stephenson,
Carroll, and Ogle Counties in northwestern Illinois, an area which topo-
graphically is the highest in the state. Stream incisement, which is pro-
nounced in the area, has exposed the Midwest Bedrock Aquigroup. Groundwater
movement toward the Mississippi and Pecatonica Rivers can be inferred from
the contours. Flow toward the other incised streams, such as the Galena and
Apple Rivers, cannot be inferred from the historical data. It is evident in
the 1980 data, however, and it is assumed to have occurred prior to signifi-
cant pumpage.
Water level data from western Illinois and eastern Iowa (Norton, 1897)
indicate that water flowed southeastward from Iowa under the Mississippi and
Illinois Rivers toward the Illinois Basin. There is some evidence of a low,
discontinuous groundwater ridge between the Mississippi and Illinois Rivers;
hydrologic and stratigraphic information suggest that no discharge to these
rivers occurs in western Illinois, except in the extreme southern portion of
the Illinois River in Calhoun and Jersey Counties. Here, erosion has brought
the aquifer close to the surface, and discharge takes place.
Suter et al. (1959) reported that hundreds of deep wells were drilled in
Chicago and Joliet after 1864, and, as a result of heavy pumpage, consider-
able changes in the piezometric surface were noted as early as 1895. The
700-foot isopiestic line had migrated in a northwesterly direction about 22
miles since 1864, while the 550-foot contour had moved northwestward from
northern Indiana and south of Kankakee, Illinois, to a position west of the
Chicago centers of pumpage. No such early data are available elsewhere, but
it is reported that the first high-capacity deep well in northwestern
Illinois was drilled in 1875 (Sasman and Baker, 1966). The rate of growth in
pumpage was not as rapid in northwestern Illinois, however, as in north-
eastern Illinois.
72
73
Although several piezometric surface maps were prepared for northeastern
Illinois (Suter et al., 1959; Sasman et al., 1961, 1962, and 1967), it was
not until 1971 that a comprehensive study was made of water levels in deep
aquifers across northern Illinois. Sasman et al. (1973) summarized deep
pumpage and prepared a 1971 piezometric surface map for a 20-county area
(fig. 27). The general pattern of groundwater flow in 1971 was toward the
deep cones of depression, primarily centered at Des Plaines, Elmhurst,
Bellwood, and Joliet. Other large pumping centers west of the Chicago
region, at Belvidere, Rockford, Rochelle, and DeKalb, were also diverting
flow. In the Chicago region the average water level decline since 1864 was
about 800 feet.
In the fall of 1980 water levels were measured in approximately 800
wells tapping the Midwest Bedrock Aquigroup. The area covered was northern
Illinois and western Illinois south to Calhoun County. This is the largest
area ever covered by a set of water level measurements in Illinois. Sasman
et al. (1982) prepared a piezometric surface map from the data points
(figs. 28 and 29). In the northeastern portion of the study area the cones
of depression had deepened and grown considerably since 1971, as can be
observed from a comparison of figures 27 and 29. Major growth of pumping
centers can be observed in eastern DuPage County, west-central and northern
Cook County, the Joliet area of Will County, and the Fox River valley centers
in eastern Kane County. Declines of water levels since 1971 were as much as
183 feet in the Joliet area, 220 feet in the upper Cook County suburbs, 200
feet in eastern DuPage County, and 190 feet in the Fox Valley. As a result .
of the rapid growth and deepening of the major pumping cones, large areas of
dewatering have occurred in the upper permeable units of the Midwest Bedrock
Aquigroup. The 1980 map was compared with the elevation of the tops of the
Galena-Platteville Unit and the Ancell aquifer (from Suter et al., 1959) at
several selected pumping centers to determine the amount of dewatering. The
results are shown in table 3. For the most part, the groundwater divide for
northeastern Illinois remained much the same as in 1971, moving slightly
westward in Boone county and nearly out of Grundy County into LaSalle
County.
Table 3. Units of Midwest Bedrock AquigroupDewatered in Major Pumping Centers, Fall 1980
Pumping Center Units Dewatered
Aurora More than 2/3 of the Galena-Platteville
Elgin More than 2/3 of the Galena-Platteville
E. DuPage-W. Cook Co. All of Galena-Platteville and less thah 1/4of Ancell
Joliet All of Galena-Platteville and nearly 1/4of Ancell
N. Cook Co. All of Galena-Platteville and more than 1/3of Ancell
Recharge and Movement of Groundwater
The predominant feature of the 1980 piezometric surface map of the
Midwest Bedrock Aquigroup is the major pumping cones in the Chicago area. A
second area of interest, however, is the recharge area of north-central and
northwestern Illinois. Sasman et al. (1982) superposed on the 1980 piezo-
metric surface map the major streams as well as the outline of the Maquoketa
and Pennsylvanian shales which rim the recharge area and act as confining
beds to the Midwest and Mississippi Valley Aquigroups. In the west, the
Mississippi Valley Aquigroup overlies the Midwest Bedrock Aquigroup. A
groundwater ridge along the major flow divide in north-central Illinois
roughly marks the center of the recharge area of the Midwest Bedrock Aqui-
group, with flow moving from the ridge principally to the east and south and,
to a lesser extent to the west, toward the Rock River.
Flow from a smaller groundwater high in Stephenson and Jo Daviess
Counties divides into a southwesterly direction toward the Mississippi River
and an east-southeasterly direction toward the Rock River. Water level
contours also indicate flow toward the Fox, Apple, Galena, and Pecatonica
Rivers. In areas where these major streams are underlain by drift and shale,
the streams are not incised into the productive units of the Midwest Bedrock
Aquigroup. Where the shales are missing, however, streams have cut into the
upper permeable units (Galena-Platteville Unit or Ancell aquifer), and in
these reaches of the streams groundwater discharge takes place.
In the southwestern part of the study area, the Midwest Bedrock Aqui-
group is buried beneath the Mississippi Valley Aquigroup. Because it is not
74
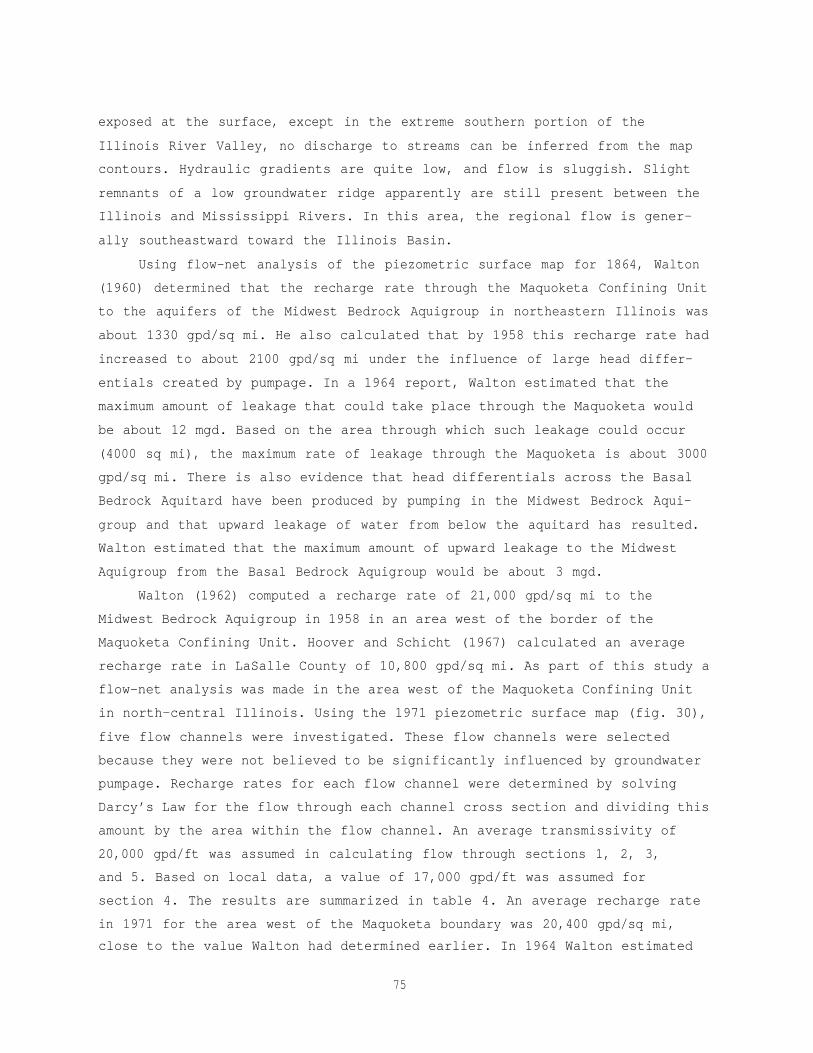
exposed at the surface, except in the extreme southern portion of the
Illinois River Valley, no discharge to streams can be inferred from the map
contours. Hydraulic gradients are quite low, and flow is sluggish. Slight
remnants of a low groundwater ridge apparently are still present between the
Illinois and Mississippi Rivers. In this area, the regional flow is gener-
ally southeastward toward the Illinois Basin.
Using flow-net analysis of the piezometric surface map for 1864, Walton
(1960) determined that the recharge rate through the Maquoketa Confining Unit
to the aquifers of the Midwest Bedrock Aquigroup in northeastern Illinois was
about 1330 gpd/sq mi. He also calculated that by 1958 this recharge rate had
increased to about 2100 gpd/sq mi under the influence of large head differ-
entials created by pumpage. In a 1964 report, Walton estimated that the
maximum amount of leakage that could take place through the Maquoketa would
be about 12 mgd. Based on the area through which such leakage could occur
(4000 sq mi), the maximum rate of leakage through the Maquoketa is about 3000
gpd/sq mi. There is also evidence that head differentials across the Basal
Bedrock Aquitard have been produced by pumping in the Midwest Bedrock Aqui-
group and that upward leakage of water from below the aquitard has resulted.
Walton estimated that the maximum amount of upward leakage to the Midwest
Aquigroup from the Basal Bedrock Aquigroup would be about 3 mgd.
Walton (1962) computed a recharge rate of 21,000 gpd/sq mi to the
Midwest Bedrock Aquigroup in 1958 in an area west of the border of the
Maquoketa Confining Unit. Hoover and Schicht (1967) calculated an average
recharge rate in LaSalle County of 10,800 gpd/sq mi. As part of this study a
flow-net analysis was made in the area west of the Maquoketa Confining Unit
in north-central Illinois. Using the 1971 piezometric surface map (fig. 30),
five flow channels were investigated. These flow channels were selected
because they were not believed to be significantly influenced by groundwater
pumpage. Recharge rates for each flow channel were determined by solving
Darcy’s Law for the flow through each channel cross section and dividing this
amount by the area within the flow channel. An average transmissivity of
20,000 gpd/ft was assumed in calculating flow through sections 1, 2, 3,
and 5. Based on local data, a value of 17,000 gpd/ft was assumed for
section 4. The results are summarized in table 4. An average recharge rate
in 1971 for the area west of the Maquoketa boundary was 20,400 gpd/sq mi,
close to the value Walton had determined earlier. In 1964 Walton estimated
75
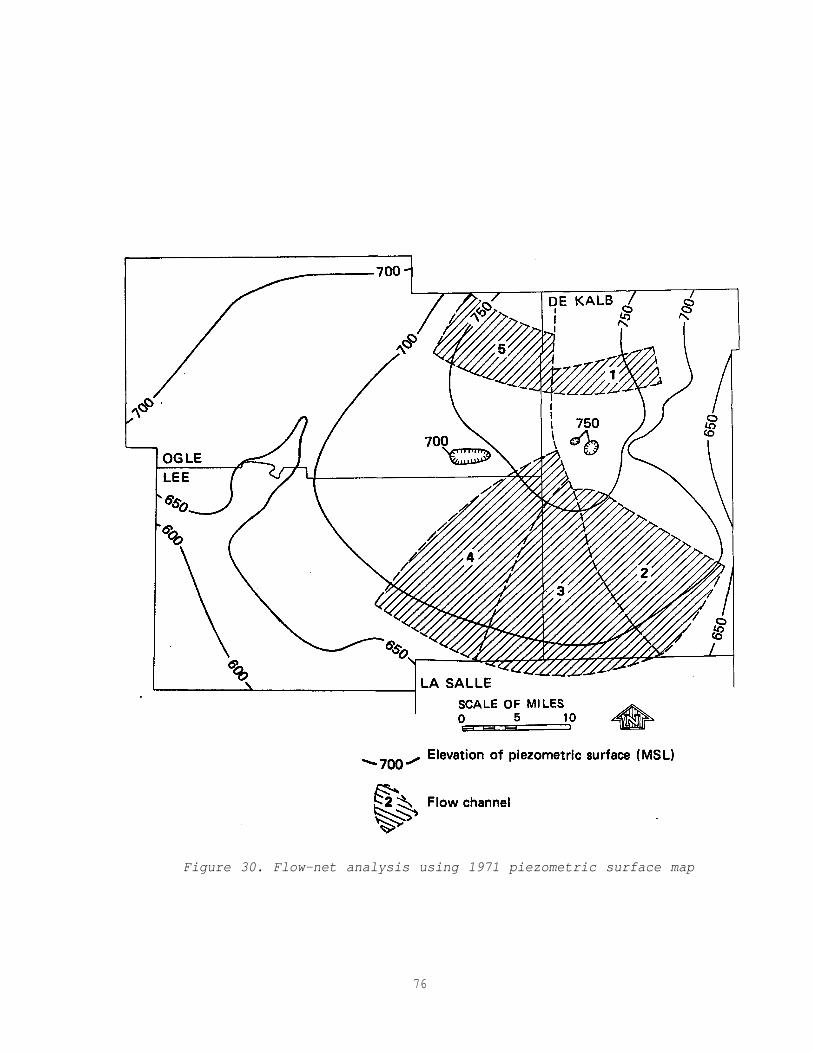
76
Figure 30. Flow-net analysis using 1971 piezometric surface map
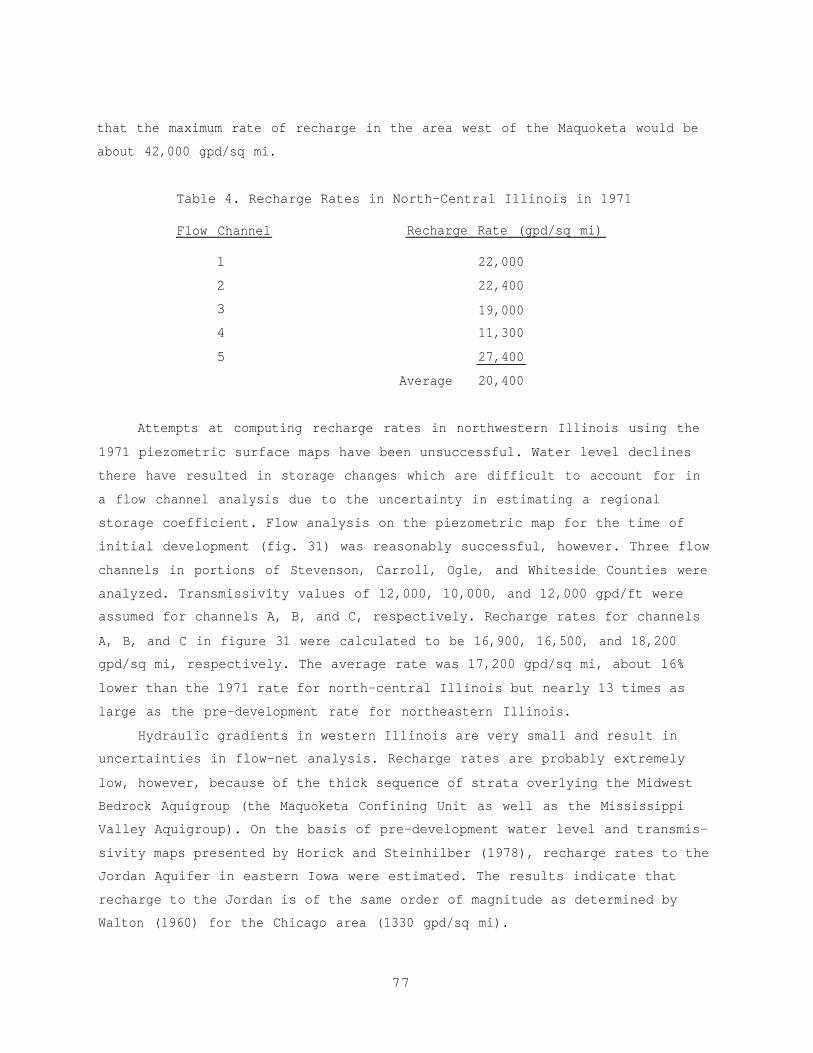
that the maximum rate of recharge in the area west of the Maquoketa would be
about 42,000 gpd/sq mi.
Table 4. Recharge Rates in North-Central Illinois in 1971
Flow Channel Recharge Rate (gpd/sq mi)
1 22,000
2 22,400
3
4 11,300
19,000
5 27,400
Average 20,400
Attempts at computing recharge rates in northwestern Illinois using the
1971 piezometric surface maps have been unsuccessful. Water level declines
there have resulted in storage changes which are difficult to account for in
a flow channel analysis due to the uncertainty in estimating a regional
storage coefficient. Flow analysis on the piezometric map for the time of
initial development (fig. 31) was reasonably successful, however. Three flow
channels in portions of Stevenson, Carroll, Ogle, and Whiteside Counties were
analyzed. Transmissivity values of 12,000, 10,000, and 12,000 gpd/ft were
assumed for channels A, B, and C, respectively. Recharge rates for channels
A, B, and C in figure 31 were calculated to be 16,900, 16,500, and 18,200
gpd/sq mi, respectively. The average rate was 17,200 gpd/sq mi, about 16%
lower than the 1971 rate for north-central Illinois but nearly 13 times as
large as the pre-development rate for northeastern Illinois.
Hydraulic gradients in western Illinois are very small and result in
uncertainties in flow-net analysis. Recharge rates are probably extremely
low, however, because of the thick sequence of strata overlying the Midwest
Bedrock Aquigroup (the Maquoketa Confining Unit as well as the Mississippi
Valley Aquigroup). On the basis of pre-development water level and transmis-
sivity maps presented by Horick and Steinhilber (1978), recharge rates to the
Jordan Aquifer in eastern Iowa were estimated. The results indicate that
recharge to the Jordan is of the same order of magnitude as determined by
Walton (1960) for the Chicago area (1330 gpd/sq mi).
77
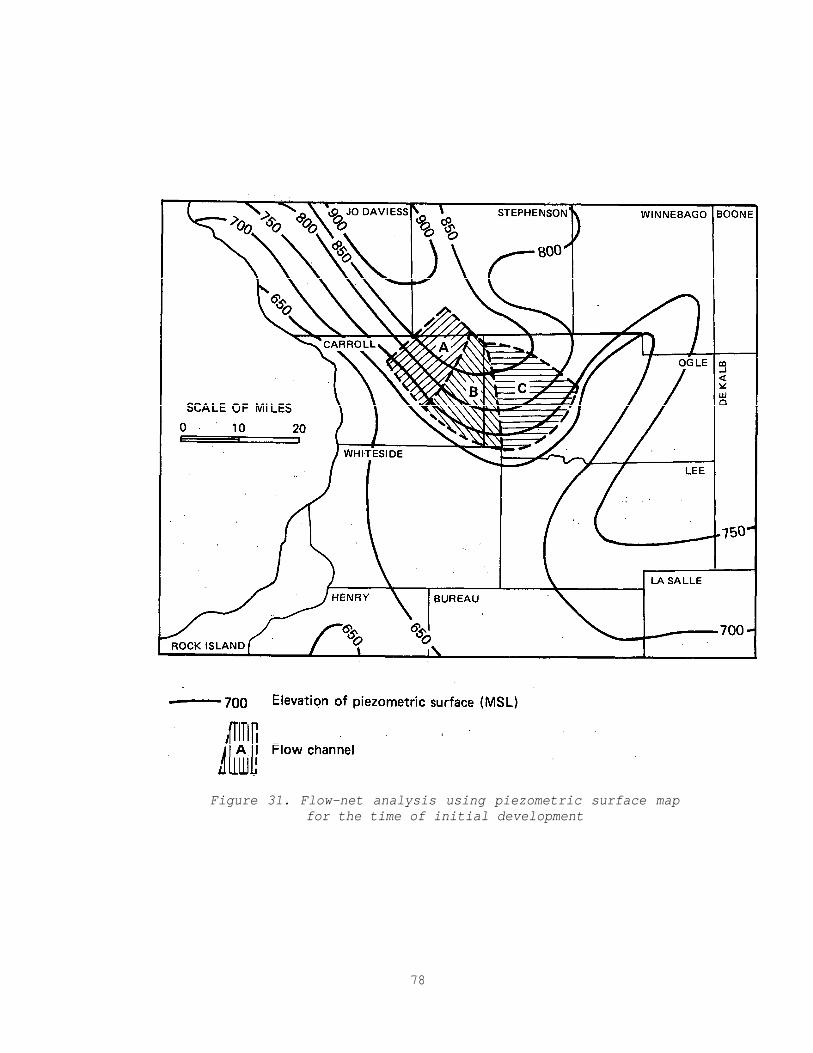
78
Figure 31. Flow-net analysis using piezometric surface mapfor the time of initial development
Historical Pumpage
Table 5 shows average groundwater pumpage from the Midwest Bedrock
Aquigroup by county for 10-year periods beginning in 1861 and ending with
1980. Figure 32 shows the average pumpage for the entire area for the same
10-year periods. It also presents three regional pumpage-time distributions,
aggregated from the data in table 5. All of the recorded pumpage from 1861
through 1880 was in Cook County. From 1881 through 1940 the 10-year average
pumpage increased 1.57 million gallons per day (mgd) per year. Average
pumpage continued to increase, at a rate of 2.90 mgd per year, from 1941
through 1960. The largest increase in pumpage was during 1961 through 1980
when average pumpage increased 6.15 mgd/yr. Total withdrawals from Cambrian
and Ordovician aquifers averaged 278.6 mgd between 1971 and 1980. By 1980,
however, the total had declined to 258.4 mgd, of which the largest
withdrawals--67.2 mgd, 28.4 mgd, 27.7 mgd, and 23.7 mgd--occurred in Cook,
DuPage, Kane, and Will Counties, respectively.
It should be noted that in the past, and to a lesser extent at present,
pumpage from deep wells in northern (especially northeastern) Illinois has
included pumpage from wells known to be open to both the Midwest Bedrock
Aquigroup and the Basal Bedrock Aquigroup (Schicht et al., 1976). Some wells
were also known to be open to both the Upper Bedrock Aquigroup and the
Midwest Bedrock Aquigroup. In addition, many deep wells were improperly
cased through the Upper Bedrock Aquigroup, and leakage down the well bore may
have been significant. Suter et al. (1959) estimated the contributions to
deep pumpage from these outside sources in northeastern Illinois to be as
much as 43% of the total in 1958. There is evidence to indicate that this
contribution declined to about 14% of the total in northeastern Illinois by
1975 (Visocky, 1982).
Most of the pumpage occurs in the northeast region, consisting of Cook,
DuPage, Grundy, Kane, Kendall, Lake, McHenry, and Will Counties. Average
pumpage has increased from 0.381 mgd during 1861 through 1870 to 165 mgd
during 1971 through 1980. Pumpage in the northeast region has averaged 59%
Of the total groundwater pumped from the Midwest Bedrock Aquigroup since
1881.
The data used in table 5 and figure 32 were compiled from several
sources. Suter et al. (1959) presented a detailed discussion of the areal
distribution of pumpage within the northeast region from 1864 through 1957.
79
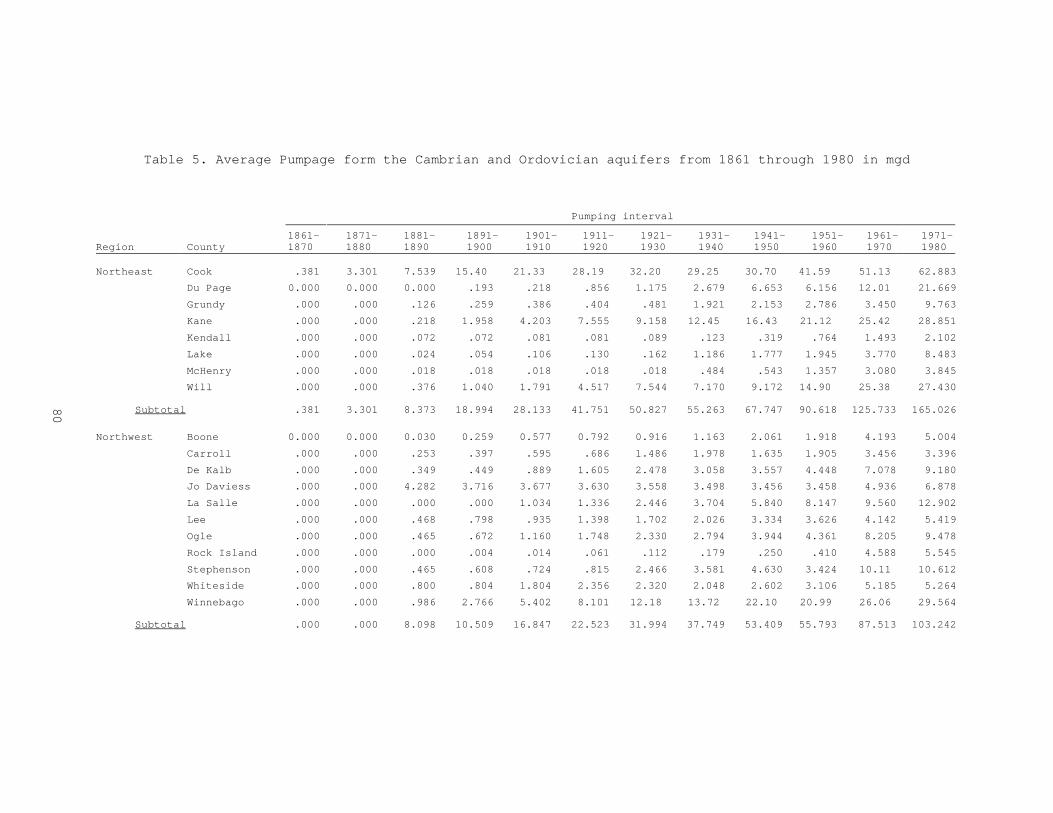
Table 5. Average Pumpage form the Cambrian and Ordovician aquifers from 1861 through 1980 in mgd
Pumping interval
Region County1861-1870
1871-1880
1881-1890
1891-1900
1901-1910
1911-1920
1921-1930
1931-1940
1941-1950
1951-1960
1961-1970
1971-1980
Northeast Cook .381 3.301 7.539 15.40 21.33 28.19 32.20 29.25 30.70 41.59 51.13 62.883
Du Page 0.000 0.000 0.000 .193 .218 .856 1.175 2.679 6.653 6.156 12.01 21.669
Grundy .000 .000 .126 .259 .386 .404 .481 1.921 2.153 2.786 3.450 9.763
Kane .000 .000 .218 1.958 4.203 7.555 9.158 12.45 16.43 21.12 25.42 28.851
Kendall .000 .000 .072 .072 .081 .081 .089 .123 .319 .764 1.493 2.102
Lake .000 .000 .024 .054 .106 .130 .162 1.186 1.777 1.945 3.770 8.483
McHenry .000 .000 .018 .018 .018 .018 .018 .484 .543 1.357 3.080 3.845
Will .000 .000 .376 1.040 1.791 4.517 7.544 7.170 9.172 14.90 25.38 27.430
Subtotal .381 3.301 8.373 18.994 28.133 41.751 50.827 55.263 67.747 90.618 125.733 165.026
Northwest Boone 0.000 0.000 0.030 0.259 0.577 0.792 0.916 1.163 2.061 1.918 4.193 5.004
Carroll .000 .000 .253 .397 .595 .686 1.486 1.978 1.635 1.905 3.456 3.396
De Kalb .000 .000 .349 .449 .889 1.605 2.478 3.058 3.557 4.448 7.078 9.180
Jo Daviess .000 .000 4.282 3.716 3.677 3.630 3.558 3.498 3.456 3.458 4.936 6.878
La Salle .000 .000 .000 .000 1.034 1.336 2.446 3.704 5.840 8.147 9.560 12.902
Lee .000 .000 .468 .798 .935 1.398 1.702 2.026 3.334 3.626 4.142 5.419
Ogle .000 .000 .465 .672 1.160 1.748 2.330 2.794 3.944 4.361 8.205 9.478
Rock Island .000 .000 .000 .004 .014 .061 .112 .179 .250 .410 4.588 5.545
Stephenson .000 .000 .465 .608 .724 .815 2.466 3.581 4.630 3.424 10.11 10.612
Whiteside .000 .000 .800 .804 1.804 2.356 2.320 2.048 2.602 3.106 5.185 5.264
Winnebago .000 .000 .986 2.766 5.402 8.101 12.18 13.72 22.10 20.99 26.06 29.564
Subtotal .000 .000 8.098 10.509 16.847 22.523 31.994 37.749 53.409 55.793 87.513 103.242
80
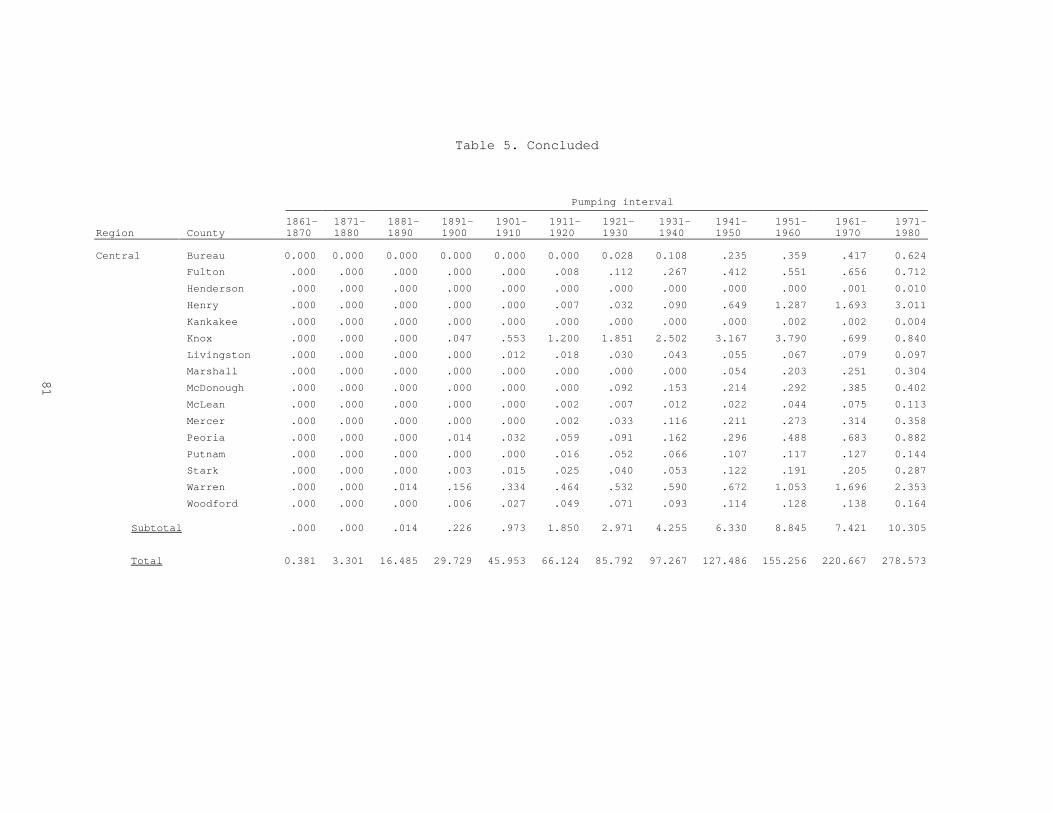
Table 5. Concluded
Pumping interval
Region County1861-1870
1871-1880
1881-1890
1891-1900
1901-1910
1911-1920
1921-1930
1931-1940
1941-1950
1951-1960
1961-1970
1971-1980
Central Bureau 0.000 0.000 0.000 0.000 0.000 0.000 0.028 0.108 .235 .359 .417 0.624
Fulton .000 .000 .000 .000 .000 .008 .112 .267 .412 .551 .656 0.712
Henderson .000 .000 .000 .000 .000 .000 .000 .000 .000 .000 .001 0.010
Henry .000 .000 .000 .000 .000 .007 .032 .090 .649 1.287 1.693 3.011
Kankakee .000 .000 .000 .000 .000 .000 .000 .000 .000 .002 .002 0.004
Knox .000 .000 .000 .047 .553 1.200 1.851 2.502 3.167 3.790 .699 0.840
Livingston .000 .000 .000 .000 .012 .018 .030 .043 .055 .067 .079 0.097
Marshall .000 .000 .000 .000 .000 .000 .000 .000 .054 .203 .251 0.304
McDonough .000 .000 .000 .000 .000 .000 .092 .153 .214 .292 .385 0.402
McLean .000 .000 .000 .000 .000 .002 .007 .012 .022 .044 .075 0.113
Mercer .000 .000 .000 .000 .000 .002 .033 .116 .211 .273 .314 0.358
Peoria .000 .000 .000 .014 .032 .059 .091 .162 .296 .488 .683 0.882
Putnam .000 .000 .000 .000 .000 .016 .052 .066 .107 .117 .127 0.144
Stark .000 .000 .000 .003 .015 .025 .040 .053 .122 .191 .205 0.287
Warren .000 .000 .014 .156 .334 .464 .532 .590 .672 1.053 1.696 2.353
Woodford .000 .000 .000 .006 .027 .049 .071 .093 .114 .128 .138 0.164
Subtotal .000 .000 .014 .226 .973 1.850 2.971 4.255 6.330 8.845 7.421 10.305
Total 0.381 3.301 16.485 29.729 45.953 66.124 85.792 97.267 127.486 155.256 220.667 278.573
81
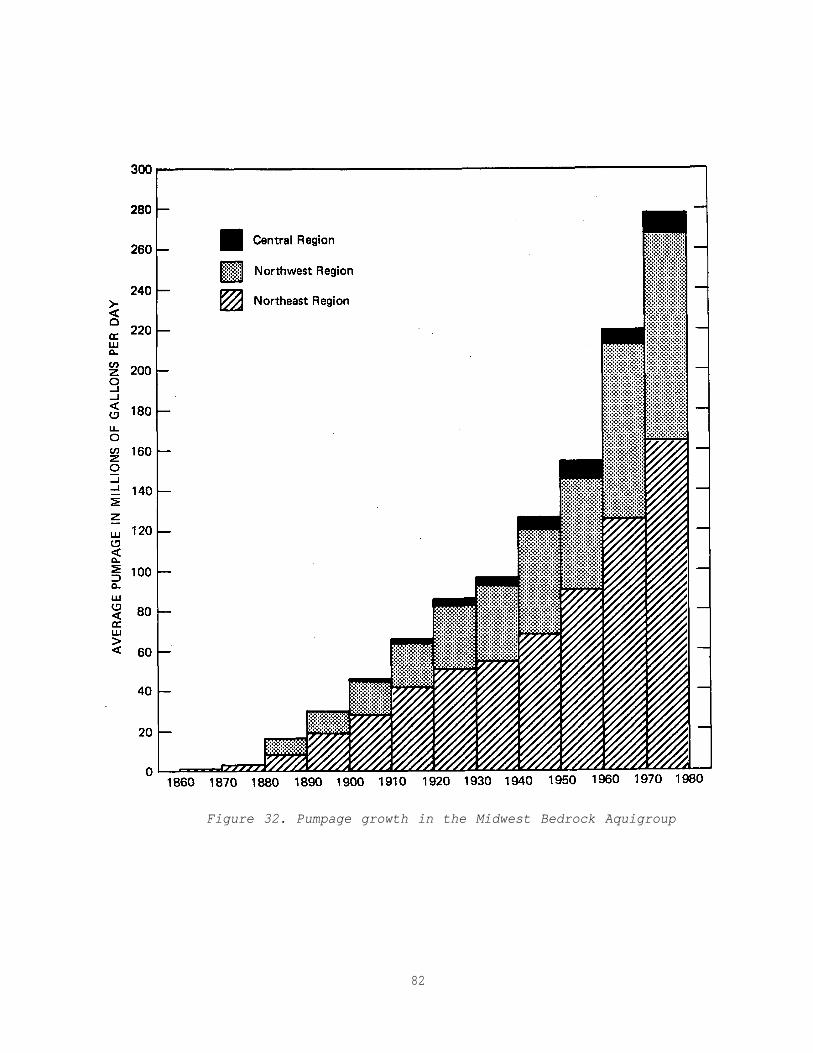
82
Figure 32. Pumpage growth in the Midwest Bedrock Aquigroup
They also classified pumpage in 1957 according to usage categories (public,
industrial, rural, and irrigation). Sasman (1965) also summarized historical
pumpages through 1962 for public, industrial, and domestic water supplies.
Annual pumpage data for 1960 through 1975 were summarized by Sasman et al.
(1967, 1973, 1974, 1977) and Schicht et al. (1976). The data are presented
on an areal basis and by water use. Pumpage data for 1978 and 1980 were
estimated from results of the Illinois Water Use Inventory presented by Kirk
et al. (1979 and 1982).
The first deep well in northern Illinois was drilled in Chicago in 1864.
The well was probably finished in the Galena and Platteville Groups (Suter
et al., 1959) and had an artesian flow estimated at 0.2 mgd. Cook County
pumpage was more than 60% of the total pumpage in the northeast region for
the period 1861 through 1930. Since 1930, the Cook County portion has
declined to 38% or 62.88 mgd during 1971 through 1980.
Pumpage in DuPage, Kane and Will Counties has increased at a consider-
able rate since 1891. The combined three-county pumpage averaged 3.19 mgd or
17% of the regional total from 1891 through 1900. During 1971 through 1980
the pumpage in this same area totaled 77.95 mgd or 47% of the northeast
region’s total.
Boone, Carroll, DeKalb, Jo Daviess, La Salle, Lee, Ogle, Rock Island,
Stephenson, Whiteside, and Winnebago Counties compose the northwest region.
As shown in table 5, average pumpage has increased from 8.10 mgd during 1881
through 1890 to 103 mgd during 1971 through 1980. Pumpage in the northwest
region has averaged 37% of the total pumpage from the Midwest Bedrock
Aquigroup since 1881. Historic pumpage from 1881 through 1971 has been
categorized on a county basis by water use in publications by Sasman and
Baker (1966) and Sasman et al. (1973 and 1974). More detailed historical
pumpage data for Winnebago and La Salle Counties have been published by Smith
and Larson (1948) and Hoover and Schicht (1967), respectively.
Pumpage in Winnebago County is concentrated in the Rockford area and has
been greater than twice the pumpage for any other county in the region except
Jo Daviess County since 1891. During 1931 through 1950, Winnebago County
accounted for more than 40% of the total regional pumpage. During the period
1971 through 1980, however, this amount decreased to 29% of the total.
Historically, pumpage has been distributed uniformly among the other
counties except Winnebago and Jo Daviess Counties. In Jo Daviess County,
83
more than 50% of the pre-1960 pumpage was for dewatering lead and zinc
mines in the Galena and Platteville Groups.
The total pumpage in the 16 counties that comprise the central region
(table 5) has averaged 3% of the total pumpage from the Cambrian and
Ordovician aquifers since 1881. Total pumpage in the central region has
increased uniformly from 0.014 mgd during 1881 through 1890 to 10.3 mgd
during 1971 through 1980. Historical pumpages were estimated from data
presented by Hanson (1950, 1958, and 1961) and Visocky et al. (1978). Addi-
tional information was obtained from publications by Woller et al. (1973 to
date).
Prior to 1961, more than 68% of the central region pumpage was concen-
trated in Henry, Knox, and Warren Counties. All counties except Knox County
have increased pumpages from the aquifers. Since 1961, Knox County has
increased pumpage from sand and gravel sources (the Prairie Aquigroup) and
decreased pumpage from the bedrock aquifers.
Potential Development of Midwest Bedrock Aquigroup
Practical Sustained Yield
Recharge to the Midwest Bedrock Aquigroup in northeastern Illinois,
while due in part to downward leakage through the Maquoketa Confining Unit
and upward leakage from the Basal Bedrock Aquigroup, comes primarily from
lateral flow eastward from the major recharge area toward large pumping
centers in Cook, DuPage, and Will Counties. Walton (1964) estimated that the
maximum amount of water which could be safely pumped from the aquifers in
northeastern Illinois (the practical sustained yield) consisted of three
elements: 1) the rate at which groundwater could be induced to move later-
ally under maximum head gradients (estimated to be 50 mgd); 2) downward
leakage from the Upper Bedrock Aquigroup (12 mgd); and 3) upward leakage
from the Basal Bedrock Aquigroup (3 mgd). Maximum hydraulic gradients would
occur when pumping levels reached the top of the Ironton-Galesville aquifer.
The practical sustained yield could reach a maximum of 65 mgd if the number
of pumping centers were increased, pumping centers were shifted westward, and
wells were spaced at greater distances to minimize interference.
The practical sustained yield in north-central and northwestern Illinois
is not as dependent on the establishment of large hydraulic gradients as is
the case in the Chicago area where vertical recharge is limited. Thus, even
84

if existing or new pumping centers in these areas were unable to develop
hydraulic gradients as large as those suggested by Walton (1964) for the
Chicago area, the substantially higher recharge rates west of the Maquoketa
Confining Unit border should allow pumpage of comparably large quantities of
water from the aquifers.
The practical sustained yield in western Illinois is limited by the same
constraints as in the Chicago area, i.e., by the amount of lateral ground-
water flow that can be induced toward pumping centers. Also, the Ironton-
Galesville is thinner or absent in western Illinois. Currently there are no
major pumping centers. In order to maximize the sustained yield in this
area, controlled development will be necessary, including judicious placement
of pumping centers in proximity to the recharge areas to the north and
spacing of wells to minimize interference.
Well Yields
Yields of wells developed in the Midwest Bedrock Aquigroup vary consid-
erably throughout the study area and depend upon the units penetrated as well
as the geographic location. Several hundred deep wells in northern Illinois
tap several units within the aquigroup. Walton (1962) concluded that the
yields of the Ancell aquifer; the Prairie du Chien, Eminence-Potosi, and
Franconia Formations; and the Ironton-Galesville aquifer constitute about 15,
35, and 50%, respectively, of the total yield of the Midwest Bedrock
Aquigroup. The Ironton-Galesville aquifer is the principal source of ground-
water for many municipal and industrial supplies because of its consistently
high yield. Figure 33 shows observed well yields for the Midwest Bedrock
Aquigroup in northern and western Illinois. Yields in northern Illinois
usually exceed 500 gpm and, depending on the depth of penetration, may exceed
1000 gpm. In western Illinois, typical well yields are smaller, because
wells in that area generally avoid the more mineralized units of the aqui-
group and produce mainly from the Ancell aquifer.
85
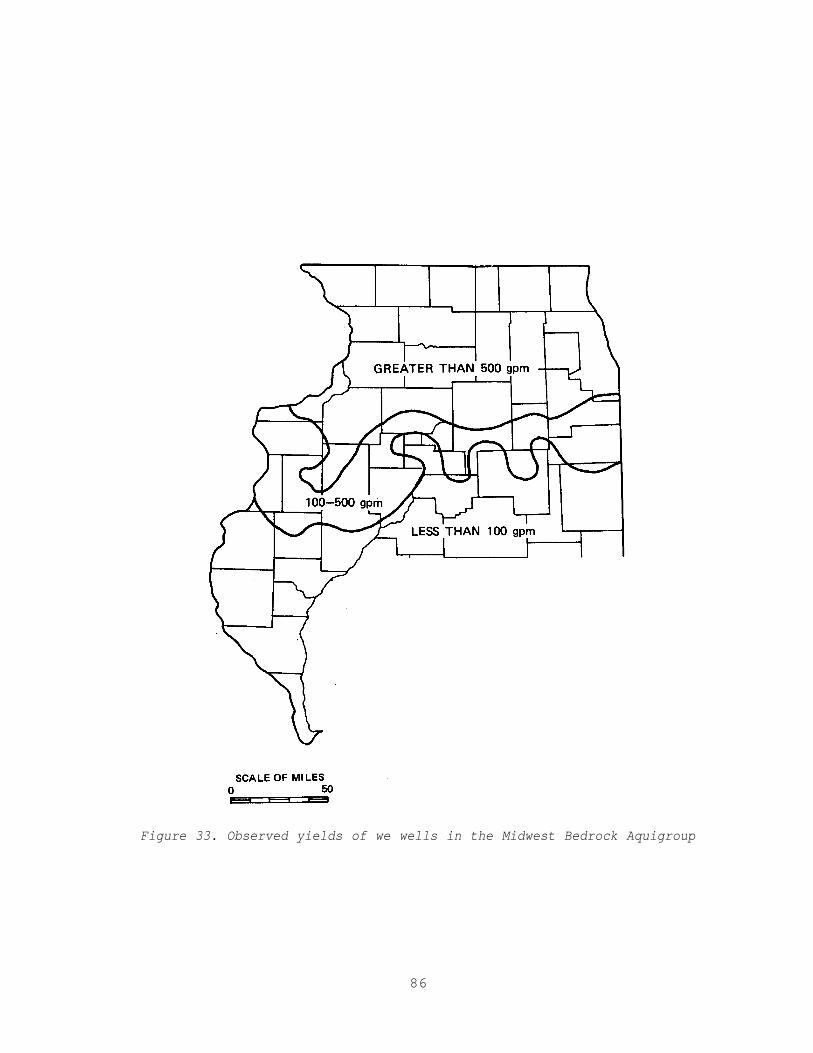
Figure 33. Observed yields of we wells in the Midwest Bedrock Aquigroup
86
GROUNDWATER QUALITY
Introduction
The water quality of the Cambrian and Ordovician aquifers was evaluated
relative to the groundwater flow and geologic units. Geologic and well
construction information for about 400 wells was obtained from ISGS and USGS
files. Water quality analyses for about 300 wells were obtained from
Illinois Environmental Protection Agency (IEPA) and ISWS files and from
published reports. USGS additionally collected about 25 single-aquifer-unit
water samples from individual wells or packer tests during the study. Four
geological cross sections were constructed and water quality data were over-
laid. (Cross sections are not necessarily oriented along present or past
flow paths.) Concentrations of chemical constituents in water from wells on
the cross sections were converted from milligrams per liter (mg/L) to percent
milliequivalents per liter (% meq/L) and then plotted on trilinear diagrams
(Hem, 1970) to show water types and changes (fig. 34).
It had become apparent during the study that groundwater quality within
the aquifers of the Cambrian and Ordovician Systems had both similarities and
differences that were related to regional flow systems. Therefore, the
intent of this portion of the study was to characterize the water quality of
individual aquifers (rather than of aquigroups) where possible. This
approach would also provide data that is essential to the regional modeling
of the Northern Midwest RASA, which is being carried out by the U.S.
Geological Survey as part of its overall RASA report. As a result, it was
decided that the most efficaceous manner of summarizing groundwater quality
was to divide the study area into two general subareas: 1) the portion of
north-central and northwestern Illinois in which the upper bedrock aquifers
(within the Cambrian and Ordovician Systems) are not confined by shales and
in which they become part of the Upper Bedrock Aquigroup (the stippled area
of figure 28), which will be designated the "unconfined" area; and 2) the
portions of northern and western Illinois that are confined by rocks of the
Maquoketa Shale Group and/or rocks of Pennsylvanian or Devonian age. In
these areas the upper aquifers of the Ordovician System are part of the
Midwest Bedrock Aquigroup. These areas will collectively be called the
confined area for purposes of this discussion.
87
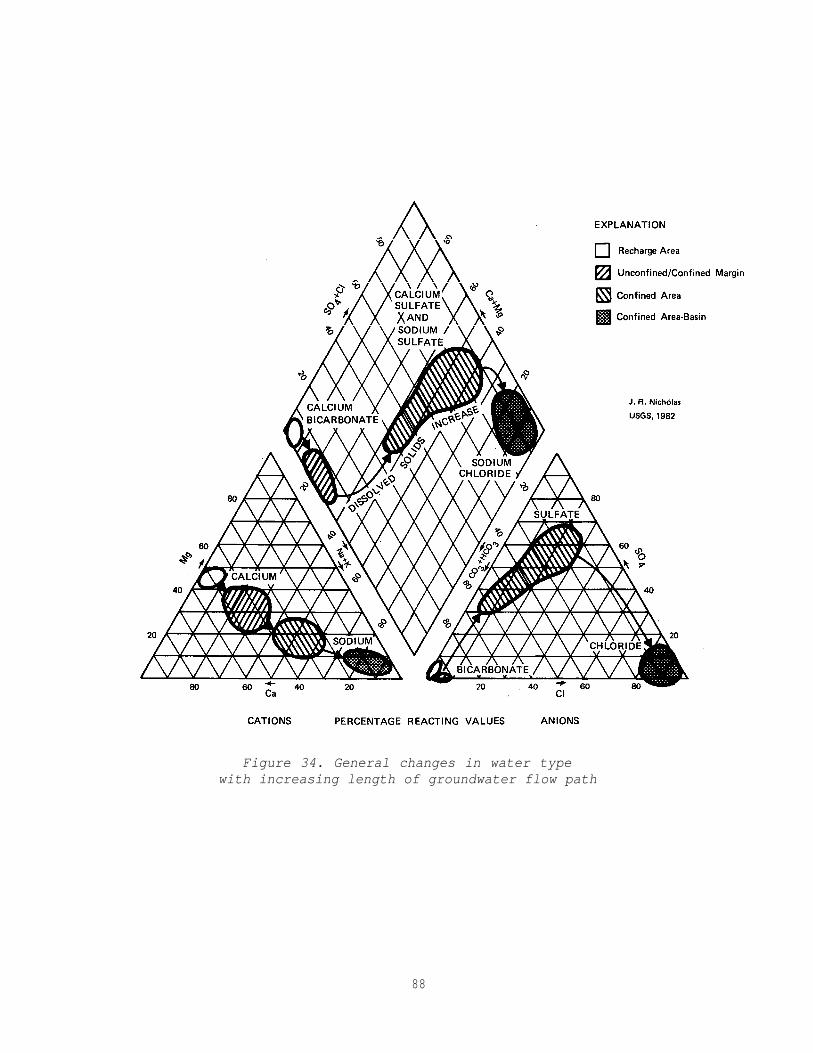
Figure 34. General changes in water typewith increasing length of groundwater flow path
88
Water Quality of the "Unconfined" Area
The "unconfined" area of the Cambrian and Ordovician aquifers includes a
large area of northern Illinois and represents a part of the recharge area of
both shallow and deep flow systems (fig. 34). Local confining conditions,
caused by fine-grained glacial deposits or dense strata of the Galena-
Platteville Unit, are present in the regional "unconfined" area. Principal
upper bedrock units are the Galena-Platteville Unit and the Ancell aquifer,
with some older Cambrian rocks occurring locally in uplifted areas such as
the Sandwich Fault Zone. The quality of groundwater in the "unconfined" area
is influenced by local, intermediate, and regional flow systems; strong
vertical gradients; and relatively rapid movement of groundwater. Faster
movement of groundwater reduces the contact time between rocks and water and
results in water with generally low concentrations of dissolved solids,
indicating that only moderate changes in water quality occur from points of
recharge. Flow systems contain water which is well-mixed vertically because
of the strong vertical components of flow. Groundwater from individual rock
Units in most of the "unconfined" area cannot be differentiated on the basis
of major ion chemistry. A relatively homogeneous chemical system, dominated
by calcium, magnesium, and bicarbonate ions, is present from the Basal
Bedrock Aquigroup up through the Galena-Platteville Unit. An example of this
vertical homogeneity in major ion chemistry is provided by a suite of
analyses from packer tests in a deep well in Galena, Illinois (table 6).
This well is a flowing well, situated in or near a discharge zone for a deep,
intermediate, or regional flow system.
In the "unconfined" area, concentrations of dissolved solids usually
range from 250 to 400 mg/L. The water is a calcium/magnesium bicarbonate
type (fig. 34 and Creston sample, appendix C). Calcium is the dominant
cation, representing greater than 50% meq/L (milliequivalents per liter).
Magnesium represents 30-50% meq/L and sodium represents less than 5% meq/L.
Bicarbonate is the dominant anion, representing 90% meq/L. Sulfate is gener-
ally less than 10% meq/L, and chloride represents less than 2% meq/L. The
horizontal and vertical variations in water types are depicted on four cross
sections (figs. 35 to 38).
89
Table 6. Water-Quality Data from the Packer Tests inLimback Well in Galena, Illinois
JDV 28N1W-24.2bElev. 600' above mslTotal depth 1489 feet
Flowing well
Concentrations(mg/L)
Sampled unit*
GPAN PEPF EMS81-346' 412-587' 691-882' 981-1489'
CalciumMagnesiumSodiumPotassiumChlorideSulfateAlkalinity
(as CaCO3)TDS
59 55 49 5030 29 27 261.8 1.7 1.3 1.32.3 2.7 2.5 2.81.8 1.3 3.2 1.321 8.4 8.7 5.9280 270 240 230
294 269 245 235
*GPAN - Galena-Platteville/AncellPEPF - Prairie du Chien/Eminence-Potosi/Franconia
IG - Ironton-GalesvilleEMS - Elmhurst/Mt. Simon
Although there is little vertical or areal variation in the water
quality of the "unconfined" area, there are two exceptions. The first occurs
along the eastern and southern edges of the "unconfined" area on sections
B-B' and C-C' (figs. 36 and 37). This area contains water with low concen-
trations of dissolved solids, usually less than 300 mg/L (appendix C).
Calcium is the dominant cation, ranging between 33 and 49% meq/L, but sodium
increases to about 33% meq/L as shown in figure 34. Bicarbonate is the
dominant anion and represents greater than 90% meq/L. Most significant is a
reduction in the concentration of sulfate. This anion does not exceed 2%
meq/L, with frequent zero values reported. On section B-B' (fig. 36) this
area in Ogle and DeKalb Counties corresponds to a local reducing zone. The
second exception to the general vertical and areal homogeneity of the "uncon-
fined" area is found along the southern edge of the "unconfined" area as
shown on section C-C' (fig. 37). Here, concentrations of dissolved solids
increase from younger to older units. The Ironton-Galesville and Elmhurst-
Mt. Simon aquifers contain water of higher dissolved solids concentrations
than do the waters of the younger aquifers. Faults which appear on cross
90
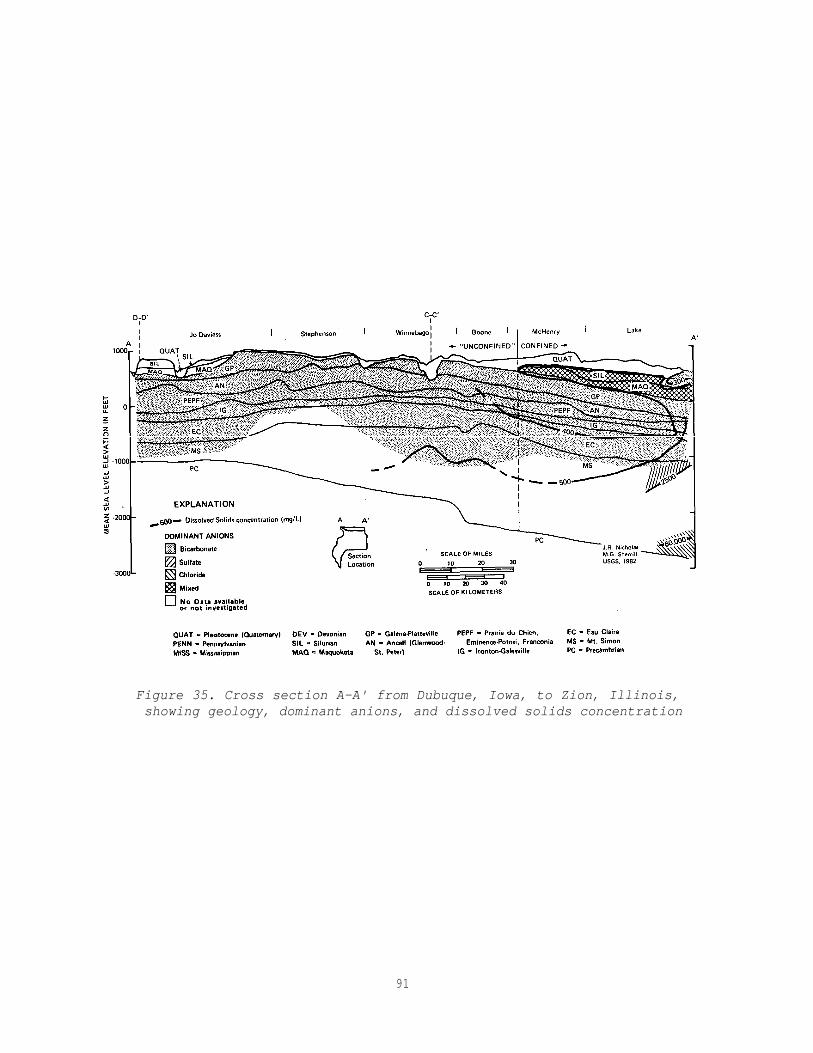
91
Figure 35. Cross section A-A' from Dubuque, Iowa, to Zion, Illinois,showing geology, dominant anions, and dissolved solids concentration
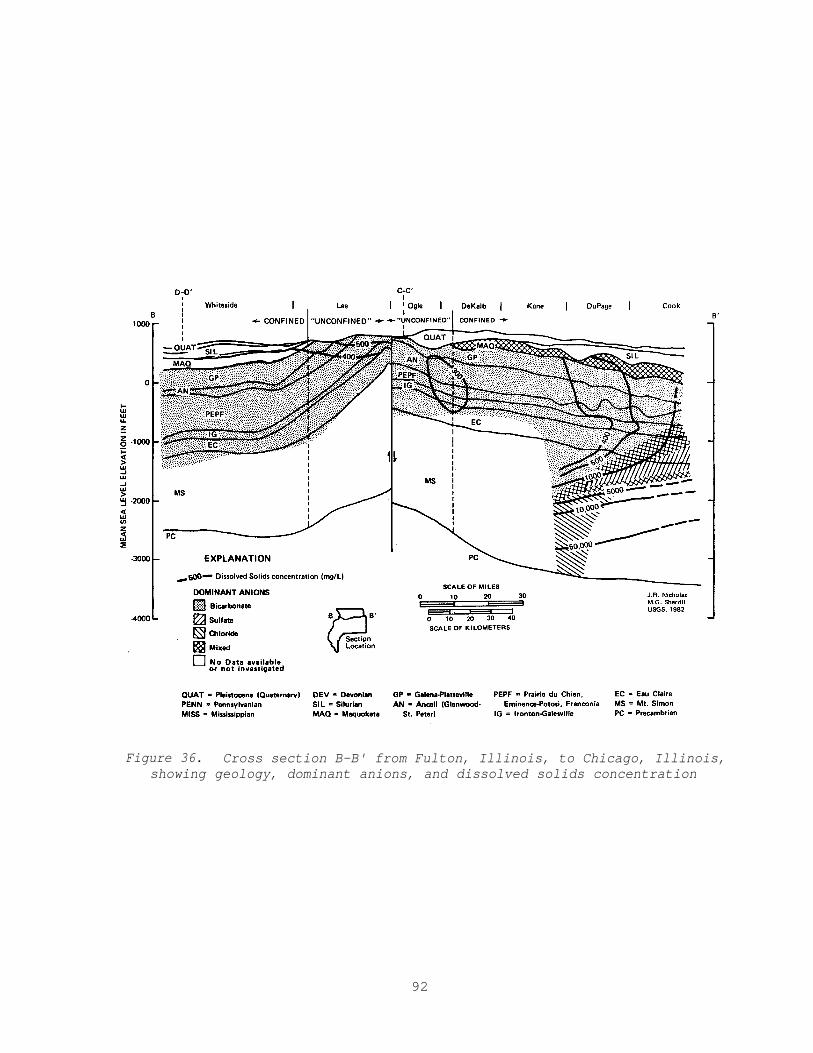
Figure 36. Cross section B-B' from Fulton, Illinois, to Chicago, Illinois,showing geology, dominant anions, and dissolved solids concentration
92
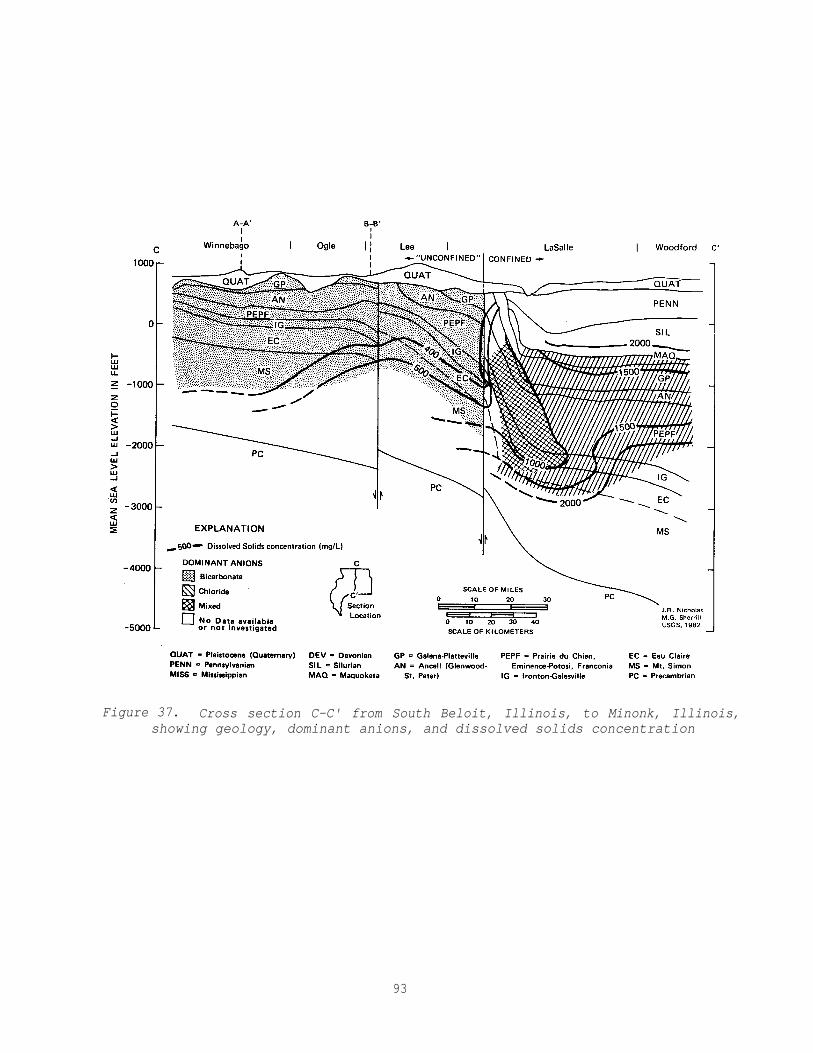
Figure 37. Cross section C-C' from South Beloit, Illinois, to Minonk, Illinois,showing geology, dominant anions, and dissolved solids concentration
93
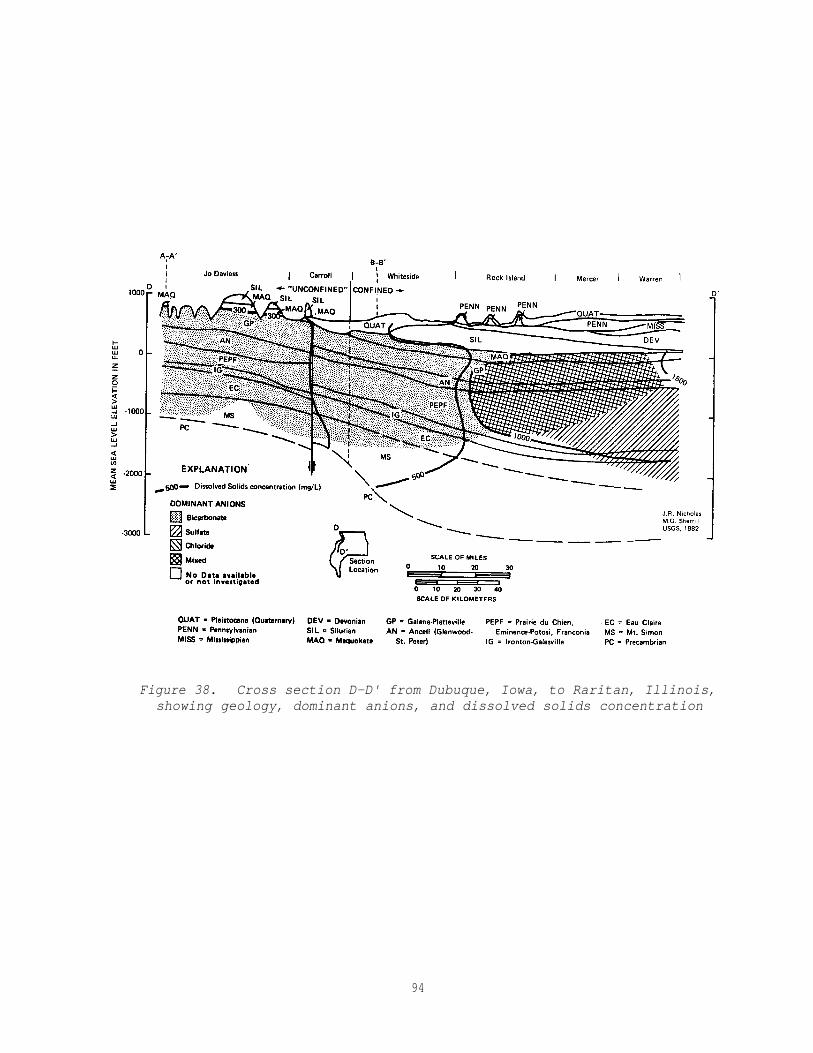
Figure 38. Cross section D-D' from Dubuque, Iowa, to Raritan, Illinois,showing geology, dominant anions, and dissolved solids concentration
94
sections B-B’, C-C’, and D-D’ (Pigs. 36-38, respectively) are not of major
extent but are included for accuracy and completeness.
Water Quality of the Confined Area
In contrast to the "unconfined" area, significant vertical and areal
changes in the chemical character of groundwater occur within the confined
area of the Cambrian and Ordovician aquifers. Prior to heavy pumpage in
northeastern Illinois, groundwater in the confined area traveled relatively
longer flow paths at slower travel rates. The resultant longer time of
contact between groundwater and rock units increased the dissolved solids
concentration and more directly affected water types.
There are several water types between the calcium-magnesium bicarbonate
water of the recharge area and the sodium chloride brines of the deep basin
(Pig. 34). The cation evolution is from calcium-magnesium to calcium to
sodium, with mixed waters occurring between dominant types. Anion evolution
is from bicarbonate to sulfate to chloride, with mixed waters occurring
between dominant types.
The pattern of evolution of water type from calcium magnesium bicarbon-
ate to sodium chloride may be modified by geologic structures. Changes of
water type across relatively short horizontal distances are associated with
the steeply dipping bedrock near La Salle/Peru (fig. 37). Dissolved solids,
sodium, and chloride increase significantly; however, there is no sulfate-
dominant water type.
Within certain limitations, the general water quality and hydrology of
the four units within the confined area of the Cambrian and Ordovician
aquifers can be differentiated and discussed separately (fig. 39). The four
units are the 1) Maquoketa Confining Unit (not shown in fig. 39), 2) Galena-
Platteville and Ancell aquifers, 3) Ironton-Galesville aquifer, and 4) Basal
Bedrock Aquigroup (Elmhurst-Mt. Simon aquifer). The limitations that affect
area-wide characterization of units are:
1. Water-type changes occur down-dip within aquifer units.
2. Vertical components of flow cause mixing to occur between
aquifer units.
3. Composite wells produce water from two or more aquifer units.
4. Data are non-uniformly distributed areally and vertically.
95

Figure 39. Map of 500 mg/L isocons of dissolved solidsfor major producing units
96
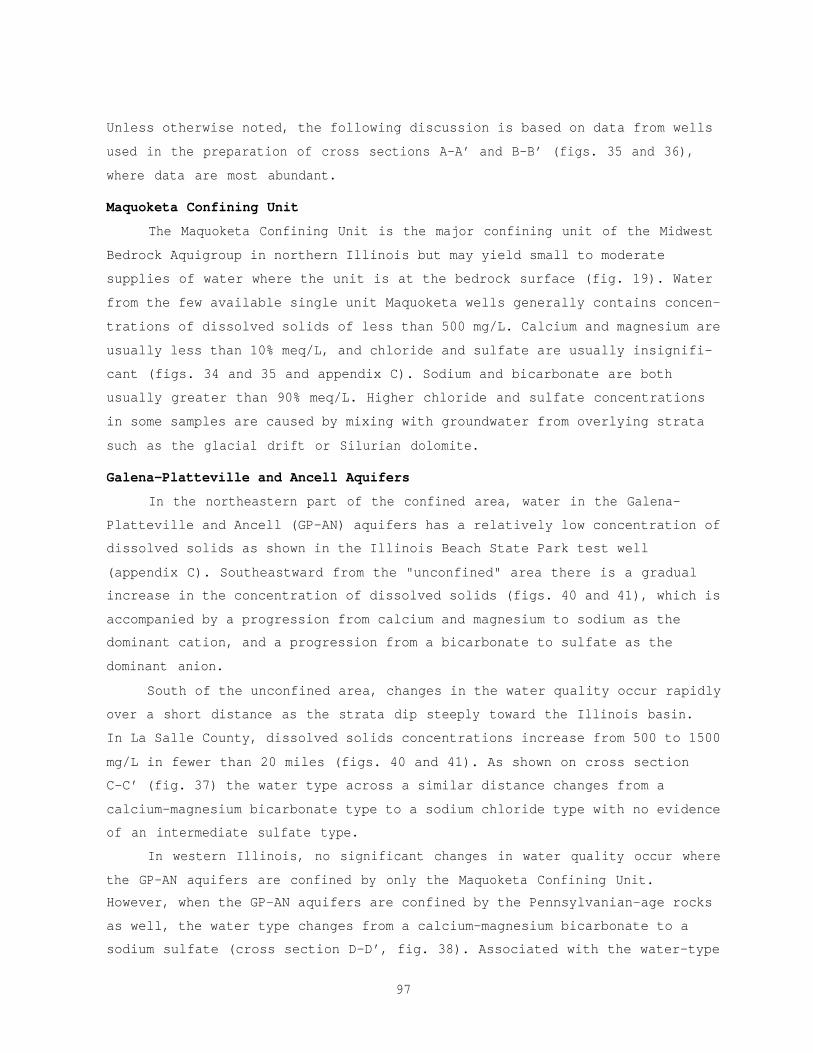
Unless otherwise noted, the following discussion is based on data from wells
used in the preparation of cross sections A-A’ and B-B’ (figs. 35 and 36),
where data are most abundant.
Maquoketa Confining Unit
The Maquoketa Confining Unit is the major confining unit of the Midwest
Bedrock Aquigroup in northern Illinois but may yield small to moderate
supplies of water where the unit is at the bedrock surface (fig. 19). Water
from the few available single unit Maquoketa wells generally contains concen-
trations of dissolved solids of less than 500 mg/L. Calcium and magnesium are
usually less than 10% meq/L, and chloride and sulfate are usually insignifi-
cant (figs. 34 and 35 and appendix C). Sodium and bicarbonate are both
usually greater than 90% meq/L. Higher chloride and sulfate concentrations
in some samples are caused by mixing with groundwater from overlying strata
such as the glacial drift or Silurian dolomite.
Galena-Platteville and Ancell Aquifers
In the northeastern part of the confined area, water in the Galena-
Platteville and Ancell (GP-AN) aquifers has a relatively low concentration of
dissolved solids as shown in the Illinois Beach State Park test well
(appendix C). Southeastward from the "unconfined" area there is a gradual
increase in the concentration of dissolved solids (figs. 40 and 41), which is
accompanied by a progression from calcium and magnesium to sodium as the
dominant cation, and a progression from a bicarbonate to sulfate as the
dominant anion.
South of the unconfined area, changes in the water quality occur rapidly
over a short distance as the strata dip steeply toward the Illinois basin.
In La Salle County, dissolved solids concentrations increase from 500 to 1500
mg/L in fewer than 20 miles (figs. 40 and 41). As shown on cross section
C-C’ (fig. 37) the water type across a similar distance changes from a
calcium-magnesium bicarbonate type to a sodium chloride type with no evidence
of an intermediate sulfate type.
In western Illinois, no significant changes in water quality occur where
the GP-AN aquifers are confined by only the Maquoketa Confining Unit.
However, when the GP-AN aquifers are confined by the Pennsylvanian-age rocks
as well, the water type changes from a calcium-magnesium bicarbonate to a
sodium sulfate (cross section D-D’, fig. 38). Associated with the water-type
97
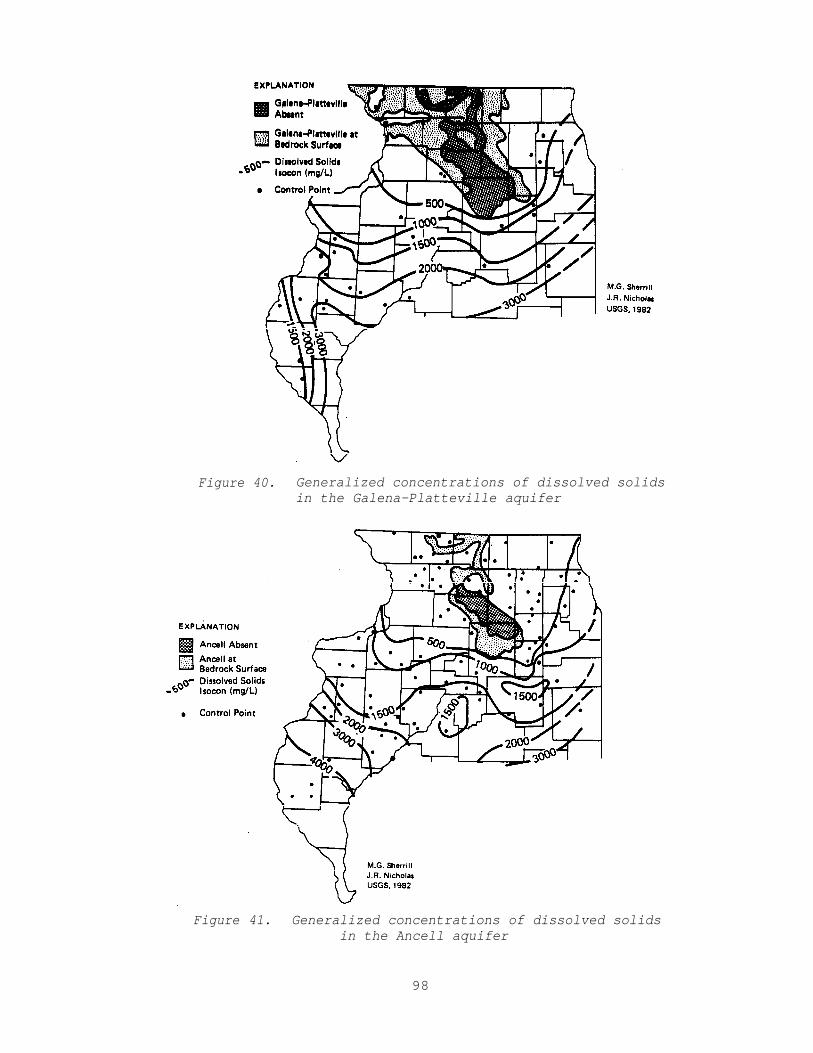
Figure 40. Generalized concentrations of dissolved solidsin the Galena-Platteville aquifer
Figure 41. Generalized concentrations of dissolved solidsin the Ancell aquifer
98
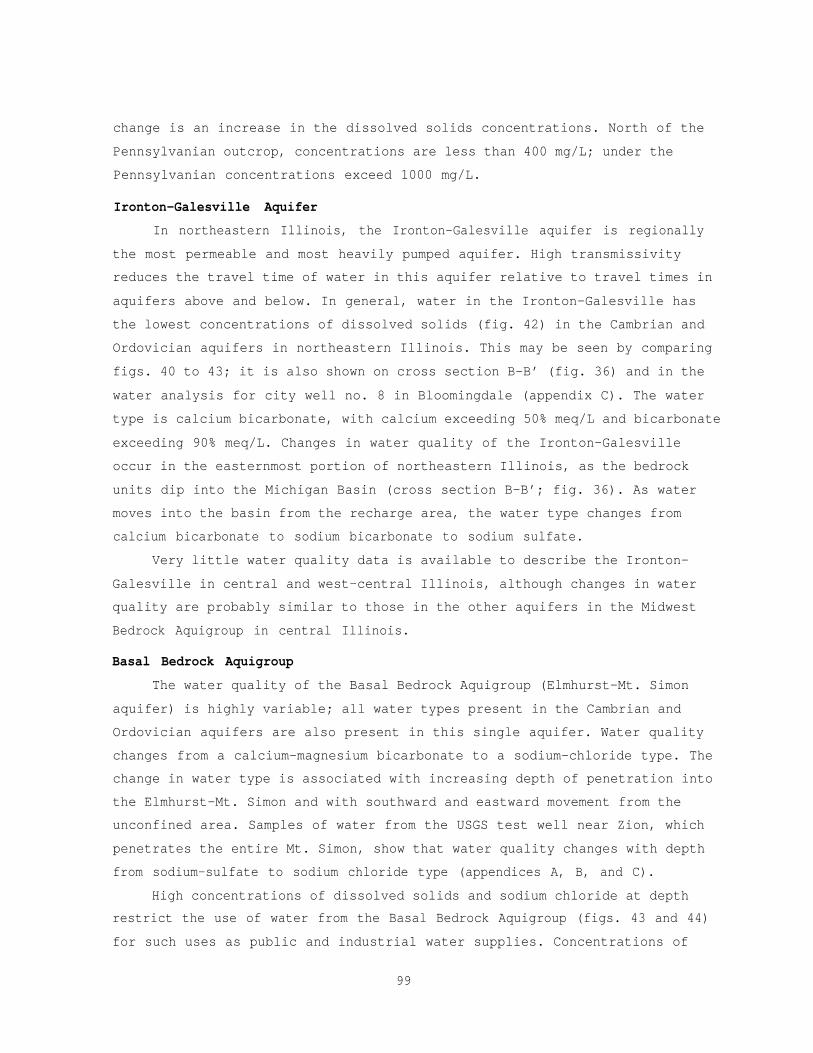
change is an increase in the dissolved solids concentrations. North of the
Pennsylvanian outcrop, concentrations are less than 400 mg/L; under the
Pennsylvanian concentrations exceed 1000 mg/L.
Ironton-Galesville Aquifer
In northeastern Illinois, the Ironton-Galesville aquifer is regionally
the most permeable and most heavily pumped aquifer. High transmissivity
reduces the travel time of water in this aquifer relative to travel times in
aquifers above and below. In general, water in the Ironton-Galesville has
the lowest concentrations of dissolved solids (fig. 42) in the Cambrian and
Ordovician aquifers in northeastern Illinois. This may be seen by comparing
figs. 40 to 43; it is also shown on cross section B-B’ (fig. 36) and in the
water analysis for city well no. 8 in Bloomingdale (appendix C). The water
type is calcium bicarbonate, with calcium exceeding 50% meq/L and bicarbonate
exceeding 90% meq/L. Changes in water quality of the Ironton-Galesville
occur in the easternmost portion of northeastern Illinois, as the bedrock
units dip into the Michigan Basin (cross section B-B’; fig. 36). As water
moves into the basin from the recharge area, the water type changes from
calcium bicarbonate to sodium bicarbonate to sodium sulfate.
Very little water quality data is available to describe the Ironton-
Galesville in central and west-central Illinois, although changes in water
quality are probably similar to those in the other aquifers in the Midwest
Bedrock Aquigroup in central Illinois.
Basal Bedrock Aquigroup
The water quality of the Basal Bedrock Aquigroup (Elmhurst-Mt. Simon
aquifer) is highly variable; all water types present in the Cambrian and
Ordovician aquifers are also present in this single aquifer. Water quality
changes from a calcium-magnesium bicarbonate to a sodium-chloride type. The
change in water type is associated with increasing depth of penetration into
the Elmhurst-Mt. Simon and with southward and eastward movement from the
unconfined area. Samples of water from the USGS test well near Zion, which
penetrates the entire Mt. Simon, show that water quality changes with depth
from sodium-sulfate to sodium chloride type (appendices A, B, and C).
High concentrations of dissolved solids and sodium chloride at depth
restrict the use of water from the Basal Bedrock Aquigroup (figs. 43 and 44)
for such uses as public and industrial water supplies. Concentrations of
99
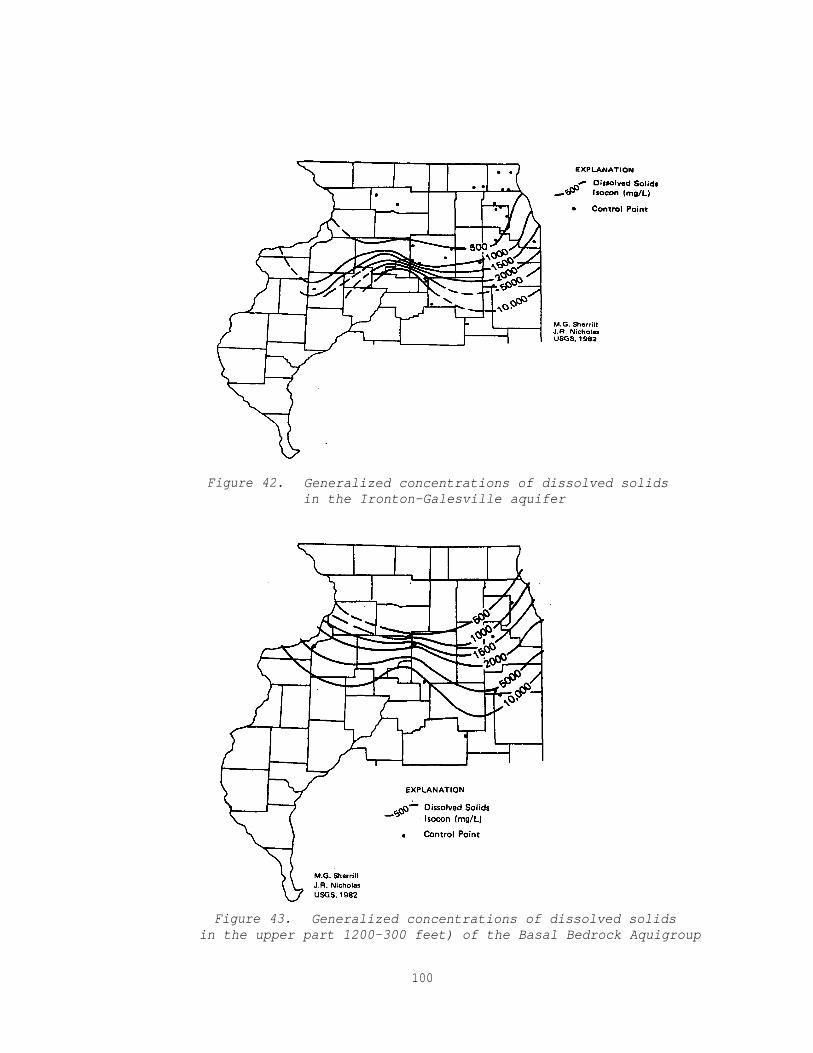
Figure 42. Generalized concentrations of dissolved solidsin the Ironton-Galesville aquifer
Figure 43. Generalized concentrations of dissolved solidsin the upper part 1200-300 feet) of the Basal Bedrock Aquigroup
100
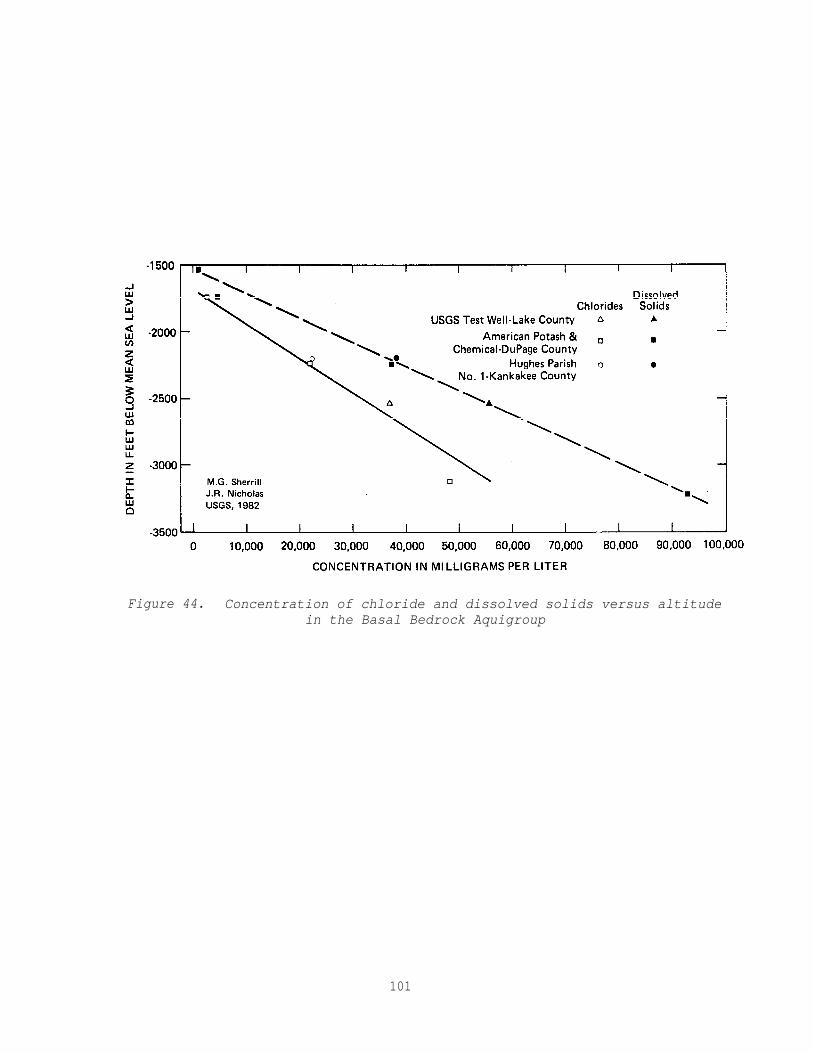
Figure 44. Concentration of chloride and dissolved solids versus altitudein the Basal Bedrock Aquigroup
101
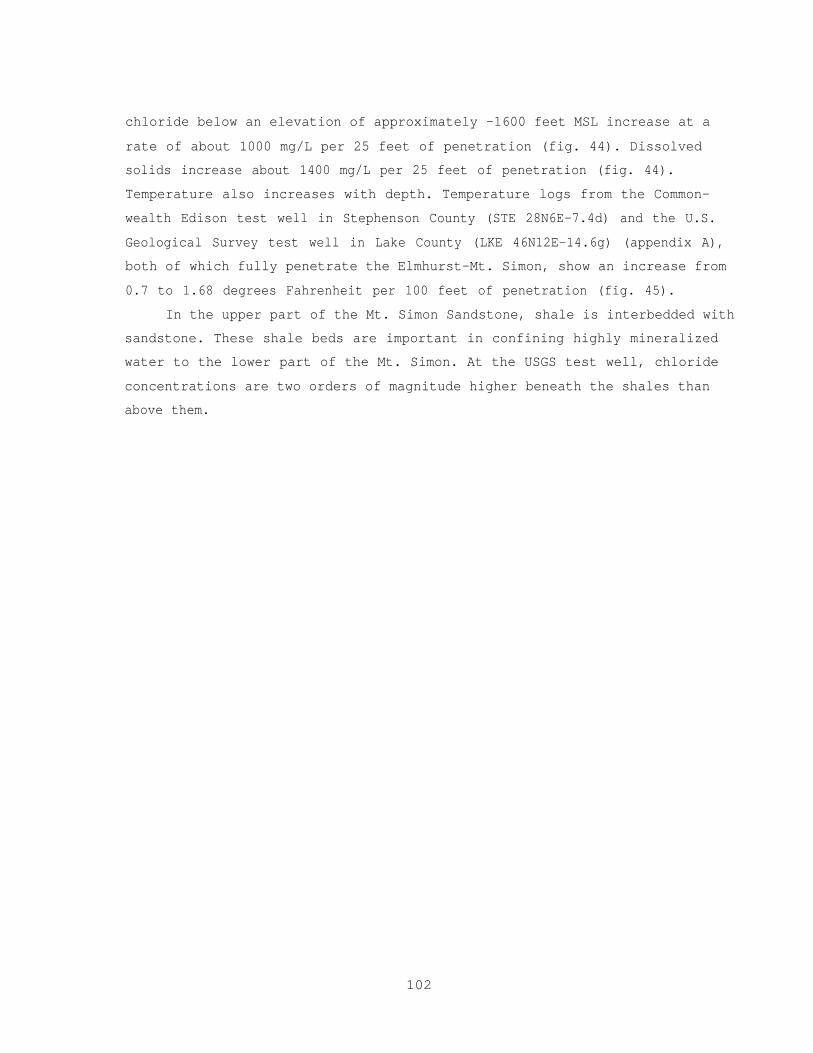
chloride below an elevation of approximately -1600 feet MSL increase at a
rate of about 1000 mg/L per 25 feet of penetration (fig. 44). Dissolved
solids increase about 1400 mg/L per 25 feet of penetration (fig. 44).
Temperature also increases with depth. Temperature logs from the Common-
wealth Edison test well in Stephenson County (STE 28N6E-7.4d) and the U.S.
Geological Survey test well in Lake County (LKE 46N12E-14.6g) (appendix A),
both of which fully penetrate the Elmhurst-Mt. Simon, show an increase from
0.7 to 1.68 degrees Fahrenheit per 100 feet of penetration (fig. 45).
In the upper part of the Mt. Simon Sandstone, shale is interbedded with
sandstone. These shale beds are important in confining highly mineralized
water to the lower part of the Mt. Simon. At the USGS test well, chloride
concentrations are two orders of magnitude higher beneath the shales than
above them.
102
103
Figure 45. Temperature logs of two wells in northern Illinois
SUMMARY AND CONCLUSIONS
The Cambrian and Ordovician rocks include major aquifers throughout all
of northern Illinois and are also tapped by wells as far south and west as
Fulton and McDonough Counties. In northern Illinois approximately 250
municipalities as well as 150 industries derive at least a portion of their
water requirements from these sources. This report incorporates both previ-
ously collected and reported data as well as data collected during the study.
The updated information was used in the preparation of fifteen maps showing
the thickness and surface configuration of geologic units. The report
reflects the current state of understanding of the geologic, hydrologic, and
water quality character of the aquifers. The scope of this understanding can
be summarized by the following key conclusions:
1. Storage coefficients of the Midwest Bedrock Aquigroup under artesian
conditions range from 1.6x10⁻⁴ to 6.8x10⁻⁴ and average 3.9x10⁻⁴.
Storage coefficients have not been evaluated where the system is now
dewatered by pumpage. Storage coefficients in the Basal Bedrock
Aquigroup range from 1.3x10⁻⁴ to 5.2x10⁻⁴.
2. Transmissivities in the Midwest Bedrock Aquigroup range from 10,000 to
20,000 gpd/ft in northeastern Illinois and are generally increased by
local or regional thickening of the Ancell and Ironton-Galesville
aquifers. In north-central Illinois, where the Maquoketa Confining Unit
is absent, the Galena-Platteville Unit contributes significantly to the
transmissivity, and regional values generally exceed 20,000 gpd/ft.
Transmissivities in the Basal Bedrock Aquigroup range from 980 to 10,600
gpd/ft.
3. Total withdrawals from wells finished in Cambrian and Ordovician rocks
averaged 278.6 mgd between 1971 and 1980 but declined to 258.4 mgd in
1980. The largest withdrawals occur in Cook, DuPage, Kane, and Will
Counties, where 1980 deep pumpages averaged 67.2 mgd, 28.4 mgd,
27.7 mgd, and 23.7 mgd, respectively.
4. Water level data suggest that, prior to development of the Midwest Aqui-
group, a groundwater ridge existed in parts of McHenry, Kane, and DeKalb
Counties, and groundwater moved southeastward toward Chicago and west-
ward toward the Rock River. A second groundwater ridge existed in
104
portions of Jo Daviess, Stephenson, Carroll, and Ogle Counties. Ground-
water discharge is believed to have occurred along portions of the Rock
River; along the Illinois River in Grundy, LaSalle, Calhoun, and Jersey
Counties; along the Mississippi River above Clinton, Iowa; and along the
Pecatonica, Galena, -and Apple Rivers.
5. Groundwater withdrawals have caused water levels to decline as much as
900 feet in parts of Cook, DuPage, and Will Counties. Dewatering of the
Galena-Platteville Unit is occurring at Aurora and Elgin, while at
pumping centers at Joliet and in northern Cook County and eastern
DuPage-western Cook Counties, all of the Galena-Platteville Unit and the
upper part of the Ancell aquifer have been dewatered.
6. Maximum recharge rates, through the Maquoketa Confining Unit in north-
eastern Illinois and outside the area where the Maquoketa is present,
have been estimated to be 3060 gpd/sq mi and 42,000 gpd/sq mi, respec-
tively. Maximum recharge has probably- been reached in areas of heavy
pumpage in the northeast, while in areas to the west of the Maquoketa,
recharge is at about half of the maximum estimated rate.
7. The practical sustained yield of the Midwest Aquigroup, estimated by
Walton (1964) to be 65 mgd for the eight-county northeastern Illinois
areas, has been exceeded every year since about 1958. In north-central
and northwestern Illinois, development has not exceeded the practical
sustained yield, which is probably at least as great as that for north-
eastern Illinois. The potential for groundwater development in western
Illinois is limited by the amount of lateral inflow which can be induced
and also by poor water quality.
8. Wells in northern Illinois usually exceed 500 gpm in yield and may
exceed 1000 gpm. In western Illinois, typical well yields are smaller
because wells generally do not penetrate the more mineralized deeper
units and tap only the Ancell aquifer.
9. Groundwater in the "unconfined" area of the Cambrian and Ordovician
aquifers is chemically homogeneous and low in total dissolved solids.
Concentrations of dissolved solids are generally between 250 and 400
milligrams per liter (mg/L). Water is a calcium-magnesium bicarbonate
type, with calcium greater than 50% milliequivalents per liter (meq/L),
magnesium between 30 and 50% meq/L, and bicarbonate about 90% meq/L.
105
10. In contrast to the "unconfined" area, significant vertical and areal
changes in the chemical character of groundwater occur in the confined
area of the Cambrian and Ordovician aquifers. These changes are related
to the longer Plow paths and travel times in the confined area. Cation
evolution is Prom calcium-magnesium to calcium to sodium, and anion
evolution is from bicarbonate to sulfate to chloride.
11. Hydraulic stress imposed by heavy pumpage of an aquifer modifies the
pattern of chemical change evolution. For example, increased concentra-
tions of sodium and chloride in the Ironton-Galesville aquifer are due
at least in part to increasing head differences between this aquifer and
the underlying, more saline, Elmhurst-Mt. Simon aquifer.
12. In northeastern Illinois the Ironton-Galesville aquifer generally has
the lowest dissolved solids concentrations in the confined part of the
Cambrian and Ordovician aquifers. The better quality of water from the
Ironton-Galesville is probably attributable to its greater permeability
and larger production, which result in reduced travel time for water
moving from the recharge area.
13. In northeastern Illinois water from the upper 300 or 400 feet of the
Basal Bedrock Aquigroup is normally of sufficient quality to be used for
public or industrial supplies. Below an elevation of about -1600 feet
MSL, concentrations of chlorides increase about 1000 mg/L per 25 feet of
penetration. Concentrations of dissolved solids similarly increase
about 1400 mg/L per 25 feet of penetration.
14. Temperature of groundwater also increases with depth in the Basal Aqui-
group. Temperature logs from two wells fully penetrating this aquifer
show increases of 0.7 and 1.68 degrees Fahrenheit per 100 feet of pene-
tration.
106
107
SELECTED BIBLIOGRAPHY
Anderson, C. B., 1919. Artesian waters of northeastern Illinois. Illinois
State Geological Survey Bulletin 34, 326 p.
Anderson, R. C., 1955. Pebble lithology of the Marseilles till sheet in
northeastern Illinois. Journal of Geology, Vol. 154, No. 3, p. 72-78.
Atherton, E., and J. E. Palmer, 1979. The Mississippian and Pennsylvanian
(Carboniferous) Systems in the United States--Illinois. Illinois State
Geological Survey Reprint 1979H, 42 p.
Bell, A. H. J., Elwood Atherton, T. C. Buschbach, and D. H. Swain, 1964.
Deep oil possibilities of the Illinois Basin. Illinois State Geological
Survey Circular 368, 38 p.
Bergstrom, R. E., J. W. Foster, L. F. Selkregg, and W. A. Pryor, 1955.
Groundwater possibilities in northeastern Illinois. Illinois State
Geological Survey Circular 198, 24 p.
Bond, D. C., 1971. Background materials for "Symposium on Future Petroleum
Potential of the NPC Region 9." Illinois State Geological Survey,
Illinois Petroleum 96, 63 p.
Bond, D. C., 1972. Hydrodynamics in deep aquifers of the Illinois Basin.
Illinois State Geological Survey Circular 470, 71 p.
Boulton, N. S., 1963. Analysis of data from nonequilibrium pumping tests
allowing for delayed yield from storage. Proceedings of the Institution
of Civil Engineers, Vol. 26, p. 469-482.
Bradbury, J. C., and Elwood Atherton, 1965. Precambrian basement of
Illinois. Illinois State Geological Survey Circular 382, 13 p.
Bristol, H. M., and T. C. Buschbach, 1973. Ordovician Galena Group
(Trenton) - Structure and oil fields. Illinois State Geological Survey,
Illinois Petroleum 99, 38 p.
Brueckmann, J. E., and R. E. Bergstrom, 1968. Groundwater geology of the
Rock Island, Monmouth, Galesburg, and Kewanee area, Illinois. Illinois
State Geological Survey Report of Investigation 221, 56 p.
Bruin, J., and H. E. Hudson, Jr., 1955. Selected methods for pumping test
analysis. Illinois State Water Survey Report of Investigation 25,
54 p.
Buschbach, T. C., 1961. Morphology of the sub-St. Peter surface of north-
eastern Illinois. Illinois Academy of Science Transactions, Vol. 54,
pp. 83-89.
Buschbach, T. C., 1964. Cambrian and Ordovician strata of northeastern
Illinois. Illinois State Geological Survey Report of Investigation 218,
90 p.
Buschbach, T. C., 1965. Deep stratigraphic test well near Rock Island,
Illinois. Illinois State Geological Survey Circular 394, 20 p.
Buschbach, T. C., 1970. Cambrian and Ordovician strata of north-central
Illinois, in Guidebook for Thirty-Fourth Annual Tri-State Field Confer-
ence (I. Edgar Odom and Malcolm P. Weiss, Conference Coordinators).
Northern Illinois University Department of Geology.
Buschbach, T. C., 1975. Cambrian System, in Handbook of Illinois
Stratigraphy. Illinois State Geological Survey Bulletin 95, p. 34-37.
Buschbach, T. C., and D. C. Bond, 1974. Underground storage of natural gas
in Illinois--1973. Illinois State Geological Survey, Illinois
Petroleum 101, 71 p.
Cartwright, Keros, 1983. Classification of hydrostratigraphic units in
Illinois. Illinois State Geological Survey Draft Memorandum, Open
File.
Cooper, H. H., Jr., and C. E. Jacob, 1946. A generalized graphical method
for evaluating formation constants and summarizing well-field history.
Transactions of the American Geophysical Union, Vol. 27, No. 4,
pp. 526-534.
Csallany, Sandor, 1966. Yields of wells in Pennsylvanian and Mississippian
rocks in Illinois. Illinois State Water Survey Report of
Investigation 55, 43 p.
Csallany, Sandor, and W. C. Walton, 1963. Yields of shallow dolomite wells
in northern Illinois. Illinois State Water Survey Report of
Investigation 46. 43 p.
Ekblaw, G. C., and J. E. Lamar, 1964. Sand and gravel resources of north-
eastern Illinois. Illinois State Geological Survey Circular 359, 8 p.
Emrich, G., 1966. Ironton and Galesville (Cambrian) Sandstones in Illinois
and adjacent areas. Illinois State Geological Survey Circular 403,
55p.
108
Emrich, G., and R. E. Bergstrom, 1962. Des Plaines Disturbance, northeastern
Illinois. Geological Society of America Bulletin, Vol. 73, pp. 959-968;
Illinois State Geological Survey Reprint 1962-T.
Ferris, J. G., 1959. Ground water, Chapter 7, in C.O. Wisler and E. R.
Brater, eds., Hydrology, John Wiley & Sons, New York.
Foley, F. C., and H. F. Smith, 1954. Ground water recharge of a deeply
buried artesian aquifer in Illinois and Wisconsin. U.S.A. Publication
No. 37 de l'Association Internationale d'Hydrologic (Assemblee Generale
de Rome, Tome II).
Follmer, Leon R., 1982. The geomorphology of the Sangamon surface: its
spatial and temporal attributes, in Colin E. Thorn [ed.], Space and Time
in Geomorphology, The Binghampton Symposia in Geomorphology: Interna-
tional Series, No. 12, London: George Allen and Unwin, p. 117-146.
Foster, J. W., 1956. Groundwater geology of Lee and Whiteside Counties,
Illinois. Illinois State Geological Survey Report of Investigation 194,
67 p.
Freeze, R. Allan, and John A. Cherry, 1979. Groundwater. Prentice-Hall,
Inc., Englewood Cliffs, New Jersey, p. 172-178.
Frye, J. C., H. D. Glass, and H. B. Willman, 1962. Stratigraphy and
mineralogy of the Wisconsinan loesses of Illinois. Illinois State
Geological Survey Circular 334, 55 p.
Frye, J. C., H. D. Glass, J. P. Kempton, and H. B. Willman, 1969. Glacial
tills of northwestern Illinois. Illinois State Geological Survey
Circular 437, 47 p.
Frye, J. C., and H. B. Willman, 1963. Development of Wisconsinan classifica-
tion in Illinois related to radiocarbon chronology. Geological Society
of America Bulletin, Vol. 74, No. 4, p. 501-506.
Frye, J. C., H. B. Willman, and H. D. Glass, 1964. Cretaceous deposits and
the Illinoian glacial boundary in western Illinois. Illinois State
Geological Survey Circular 364, 28 p.
Gilkeson, Robert H., Eugene C. Perry, Jr., and Keros Cartwright, 1981.
Isotopic and geologic studies to identify the source of sulfate in
groundwater containing high barium concentrations. University of
Illinois Water Resources Center Report UILU-WRC-81-0165, 30 p.
Gibb, James P., and Michael O'Hearn, 1980. Illinois groundwater quality data
summary. Illinois State Water Survey Contract Report No. 230, 60 p.
109
Grogan, Robert M., 1949. Present state of knowledge regarding the Pre-
Cambrian crystallines of Illinois. Illinois Academy of Science
Transactions, Vol. 42, p. 97-119; Illinois State Geological Survey
Circular 157.
Hackett, J. E., 1960. Groundwater geology of Winnebago County, Illinois.
Illinois State Geological Survey Report of Investigation 213, 63 p.
Hackett, J. E., and R. E. Bergstrom, 1956. Groundwater in northwestern
Illinois. Illinois State Geological Survey Circular 207, 25 p.
Hanson, R., 1950. Public groundwater supplies in Illinois. Illinois State
Water Survey Bulletin 40, 1036 p.
Hanson, R., 1958. New public ground-water supplies in Illinois, 1950-1857.
Illinois State Water Survey Supplement I to Bulletin 40, 260 p.
Hanson, R., 1961. Additions to public ground-water supplies in Illinois.
Illinois State Water Survey Supplement II to Bulletin 40, 656 p.
Hantush, M. S., 1956. Analysis of data from pumping tests in leaky aquifers.
American Geophysical Union Transactions, Vol. 37, No. 6, p. 702-704.
Hantush, M. S., and C. E. Jacob, 1955. Non-steady radial flow in an infinite
leaky aquifer. American Geophysical Union Transactions, Vol. 36, No. 1,
p. 95-100.
Heidari, Manoutchehr, and Keros Cartwright, 1981. Analysis of rock stress
around a liquid waste injection system in Illinois. Water Resources
Bulletin, Vol. 17, No. 4, p. 614-622.
Hem, J. D., 1970. Study and interpretation of the chemical characteristics
of natural water. 2nd Edition, U.S. Geological Survey Water-Supply
Paper 1473, 363 p.
Hoover, L. R., and R. J. Schicht, 1967. Development in deep sandstone
aquifer along the Illinois River in LaSalle County. Illinois State
Water Survey Report of Investigation 59, 23 p.
Horberg, Leland, 1950. Bedrock topography in Illinois. Illinois State
Geological Survey Bulletin 73, 111 p.
Horberg, Leland, 1953. Pleistocene deposits below the Wisconsin drift in
northeastern Illinois. Illinois State Geological Survey Report of
Investigation 165, 61 p.
Horick, P. J., and W. L. Steinhilber, 1978. Jordon aquifer of Iowa. Iowa
Geological Survey Miscellaneous Map Series 6.
110
Hough, Jack L., 1958. Geology of the Great Lakes. University of Illinois
Press, 313 p.
Hughes, G. M., and Paul Kraatz, 1966. Bedrock aquifers of northeastern
Illinois. Illinois State Geological Survey Circular 406, 15 p.
Illinois Environmental Protection Agency, 1979. Public water supply data
book, computer printout, September 1979. Division of Public Water
Supplies.
Illinois-State Water Survey and Hittman Associates, 1973. Feasibility study
on desalting brackish water from the Mt. Simon Aquifer in northeastern
Illinois. Cooperative report supported by Department of Interior,
Office of Saline Water. Illinois State Water Survey Contract
Report 153, 120 p.
Jacob, C. E., 1947. Drawdown test to determine effective radius of artesian
well. Transactions of American Society of Civil Engineers, Vol. 112,
p. 1047-1070.
Keifer and Associates, Inc., 1977a. Regional water supply. 304 p.
Keifer and Associates, Inc., 1977b. Modification of lake diversion
accounting procedure at Chicago. 66 p.
Kempton, John P., Walter J. Morse, and Adrian P. Visocky, 1982. Hydrogeo-
logic evaluation of sand and gravel aquifers for municipal groundwater
supplies in east-central ‘Illinois. Illinois State Geological Survey and
State Water Survey Cooperative Groundwater Report 8, 59 p.
Kirk, J. R., J. Jarboe, E. W. Sanderson, R. T. Sasman, and R. A. Sinclair,
1979. Water withdrawals in Illinois, 1978. Illinois State Water Survey
Circular 140, 34 p.
Kirk, J. R., J. Jarboe, E. W. Sanderson, R. T. Sasman, and C. G. Lonnquist,
1982. Water withdrawals in Illinois, 1980. Illinois State Water Survey
Circular 152, 47 p.
Kolata, D. R., T. C. Buschbach, and J. D. Treworgy, 1978. The Sandwich Fault
Zone of northern Illinois. Illinois State Geological Survey
Circular 505, 26 p.
Kontis, A.-L., and R. J. Mandle, 1980. Data-base system for Northern Midwest
Regional Aquifer System Analysis. U.S. Geological Survey Water
Resources Investigation 80-104, 23 p.
111
Kosanke, R. M., J. A. Simon, H. R. Wanless, and H. B. Willman, 1960. Classi-
fication of the Pennsylvanian strata of Illinois. Illinois State
Geological Survey Report of Investigation 214, 84 p.
Krumbein, W. C., 1933. Textural and lithologic variations in glacial till.
Journal of Geology, Vol. 45, No. 6, p. 577-601.
Larson, T. E., 1963. Mineral content of public groundwater supplies in
Illinois. Illinois State Water Survey Circular 90, 28 p.
Leighton, M. M., George E. Ekblaw; and Leland Horberg, 1948. Physiographic
divisions of Illinois. Illinois State Geological Survey Report of
Investigation 129, 19 p.
Masters, John M., 1978. Sand and gravel resources in northeastern Illinois.
Illinois State Geological Survey Circular 503, 11 p.
Maxey, G. B., 1964. Hydrostratigraphic units. Journal of Hydrology, Vol. 2,
p. 124-129.
Meinzer, O. E., 1923. The occurrence of ground water in the United States.
U.S. Geological Survey Water Supply Paper 489, 321 p.
Moench, A. F., and A. P. Visocky, 1971. A preliminary 'least cost' study of
future groundwater development in northeastern Illinois. Illinois State
Water Survey Circular 102, 19 p.
Nicholas, J. R., M. G. Sherrill, and H. L. Young, 1984 (in press). Test well
penetrating the Cambrian-Ordovician aquifer system in northeastern
Illinois. U.S. Geological Survey WRI Report 84.
Northeastern Illinois Planning Commission, 1966. The water resource in
northeastern Illinois, planning its use. Technical Report 4, 182 p.
Northeastern Illinois Planning Commission, 1974. Regional water supply
report. Technical Report 8, 97 p.
Northeastern Illinois Planning Commission, 1976. Estimated future water
supply demands for northeastern Illinois. Prepared for the Division of
Water Resources, Illinois Department of Transportation, 63 p.
Norton, W. H., 1897. Artesian wells of Iowa. Iowa Geological Survey,
Vol. 6, p. 115-428.
Piskin, Kemal, and R. E. Bergstrom, 1975. Glacial drift in Illinois:.
thickness and character. Illinois State Geological Survey Circular 490,
35 p.
Prickett, T. A., 1965. Type-curve solution to aquifer tests under water-
table conditions. Ground Water, Vol. 3, July, p. 5-14.
112
Rorabaugh, M. I., 1953. Graphical and theoretical analysis of step drawdown
test of artesian well. Proceedings of the American Society of Civil
Engineers, Vol. 79, Separate No. 362, 23 p.
Rubey, W. W., 1952. Geology and mineral resources of the Hardin and Brussels
Quadrangles. U.S. Geological Survey Professional Paper 218, 179 p.
Russell, R. R., 1963. Ground-water levels in Illinois through 1961.
Illinois State Water Survey Report of Investigation 45, 51 p.
Sasman, R. T., 1965. Ground-water pumpage in northeastern Illinois through
1962. Illinois State Water Survey Report of Investigation 50, 31 p.
Sasman, R. T., and W. H. Baker, Jr., 1966. Ground-water pumpage in north-
eastern Illinois through 1963. Illinois State Water Survey Report of
Investigation 52, 33 p.
Sasman, R. T., W. H. Baker, Jr., and W. P. Patzer, 1962. Water-level decline
and pumpage during 1961 in deep wells in the Chicago region, Illinois.
Illinois State Water Survey Circular 85, 32 p.
Sasman, R. T., C. R. Benson, G. L. Dzurisin, and N. E. Risk, 1973. Water-
level decline and pumpage in northern Illinois, 1966-1967. Illinois
State Water Survey Circular 113, 41 p.
Sasman, R. T., C. R. Benson, G. L. Dzurisin, and N. E. Risk, 1974. Ground-
water pumpage in northern Illinois, 1960-1970. Illinois State Water
Survey Report of Investigation 73, 46 p.
Sasman, R. T., C. R. Benson, J. S. Mende, N. F. Gangler, and V. M. Colvin,
1977. Water-level decline and pumpage in deep wells in the Chicago
region, 1971-1975. Illinois State Water Survey Circular 125, 35 p.
Sasman, R. T., C. R. Benson, R. S. Ludwigs, and T. L. Williams, 1982.
Water-level trends, pumpage, and chemical quality in the deep sandstone
wells in northern Illinois. Illinois State Water Survey Circular 154.
Sasman, R. T., C. K. McDonald, and W. R. Randall, 1967. Water-level decline
and pumpage in deep wells in northeastern Illinois, 1962-1966. Illinois
State Water Survey Circular 94, 36 p.
Sasman, R. T., T. A. Prickett, and R. R. Russell, 1961. Water-level decline
and pumpage during 1960 in deep wells in the Chicago region, Illinois.
Illinois State Water Survey Circular 83, 43 p.
Savage, T. E., 1908. On the Lower Paleozoic stratigraphy of southwestern
Illinois. American Journal of Science, Vol. 25, p. 431-443; expanded in
Illinois State Geological Survey Bulletin 8, p. 103-116.
113

Schicht, R. J., and J. R. Adams, 1977. Effects of proposed 1980 and 1985
lake water allocation in the deep sandstone aquifer in northeastern
Illinois. Illinois State Water Survey Contract Report 188, 16 p.
Schicht, R. J., J. R. Adams, and J. B. Stall, 1976. Water resources avail-
ability, quality, and cost in northeastern Illinois. Illinois State
Water Survey Report of Investigation 83, 90 p.
Schicht, R. J., and Allen Moench, 1971. Projected groundwater deficiencies
in northeastern Illinois, 1980-2020. Illinois State Water Survey
Circular 101, 22 p.
Shaw, James, 1873. Geology of northwestern Illinois. Illinois State
Geological Survey, Geological Survey of Illinois, Vol. V, p. 1-216.
Singh, K. P., and J. R. Adams, 1980. Adequacy and economics of water supply
in northeastern Illinois, 1985-2010. Illinois State Water Survey Report
of Investigation 97, 205 p.
Smith, H. F., and T. E. Larson, 1948. Groundwater resources in Winnebago
County. Illinois State Water Survey Report of Investigation 2, 35 p.
Steinhilber, W. L., and H. L. Young, 1979. Plan of study for the Northern
Midwest Regional Aquifer System Analysis. U.S. Geological Survey Water
Resources Investigation 79-44, 20 p.
Suter, M., R. E. Bergstrom, H. F. Smith, G. H. Emrich, W. C. Walton, and
T. E. Larson, 1959. Preliminary report on ground-water resources of the
Chicago region, Illinois. Illinois State Water Survey and State
Geological Survey Cooperative Report 1, 89 p.
Swann, D. H., and H. B. Willman, 1961. Megagroups in Illinois. American
Association of Petroleum Geologists Bulletin, Vol. 45, p. 471-483;
Illinois Geological Survey Reprint 1961-N.
Templeton, J. S., 1950. Mt. Simon Sandstone in northern Illinois. Illinois
Academy of Science Transactions, Vol. 43, p. 151-159.
Templeton, J. S., and H. B. Willman, 1963. Champlainian Series (Middle
Ordovician) in Illinois. Illinois State Geological Survey Bulletin 89,
260 p.
Theis, C. V., 1935. The relation between the lowering of piezometric surface
and the rate and duration of discharge of a well using ground-water
storage. Transactions of the American Geophysical Union 16th Annual
Meeting,. Part 2, p. 519-524.
114
Thwaites, F. T., 1927. Stratigraphy and geologic structure of northern
Illinois. Illinois State Geological-Survey Report of Investigation 13,
49 p.
Trowbridge, A. C., and E. W. Shaw, 1916. Geology and geography of the Galena
and Elizabeth Quadrangles; Illinois State Geological Survey
Bulletin 26, 171 p.
Visocky, A. P., 1982. Impact of Lake Michigan allocations on the Cambrian-
Ordovician aquifer system. Illinois State Water Survey Contract
Report 292, 36 p.
Visocky, A. P., H. A. Wehrmann, K. W. Kim, and R. W. Ringler, 1978. Assess-
ment of public groundwater supplies in Illinois. Illinois State Water
Survey and State Geological Survey Contract Report 209, 193 p.
Walker, W. H., R. E. Bergstrom, and W. C. Walton, 1965. Preliminary report
on the ground-water resources of the Havana region in west-central
Illinois. Illinois State Water Survey and State Geological Survey
Cooperative Groundwater Report 3, 61 p.
Walton, W. C., 1960. Leaky artesian aquifer conditions in Illinois.
Illinois State Water Survey Report of Investigation 39, 27 p.
Walton, W. C., 1962. Selected analytical methods for well and aquifer evalu-
ation. Illinois State Water Survey Bulletin 49, 82 p.
Walton, W. C., 1964. Future water-level declines in deep sandstone wells in
Chicago region. Illinois State Water Survey Reprint 36, 8 p.
Walton, W. C., and Sandor Csallany, 1962. Yields of deep sandstone wells in
northern Illinois. Illinois State Water Survey Report of Investi-
gation 43, 47 p.
Walton, W. C., R. T. Sasman, and R. R. Russell, 1960. Water-level decline
and pumpage during 1959 in deep wells in the Chicago region, Illinois.
Illinois State Water Survey Circular 79, 39 p.
Water for Illinois, A plan for action, 1967. Illinois Department for
Business and Economic Development, Springfield, 452 p.
Water Resources and Climate, Atlas of Illinois Resources, Section 1, 1958.
Illinois Board of Economic Development, Springfield, 58 p.
Weller, J. M., 1940. Geology and soil possibilities of extreme southern
Illinois. Illinois State Geological Survey Report of Investigations 71,
71 p.
115
Wickham, S. S., and W. H. Johnson, 1981. The Tiskilwa till, a regional view
of its origin and depositional processes. International Glaciological
Society, Annals of Glaciology, No. 2, p. 176-182.
Wiedman, S., and A. R. Schultz, 1915. The underground and surface water
supplies of Wisconsin. Wisconsin Geological and Natural History Survey
Bulletin 35.
Willman, H. B., 1943. High-purity dolomite in Illinois. Illinois State
Geological Survey Report of Investigations 90, 89 p.
Willman, H. B., 1971. Summary of the geology of the Chicago area. Illinois
State Geological Survey Circular 460, 77 p.
Willman, H. B., 1973. Rock stratigraphy of the Silurian System in north-
eastern and northwestern Illinois. Illinois State Geological Survey
Circular 479, 55 p.
Willman, H. B., et al., 1967. Geologic map of Illinois. Illinois State
Geological Survey.
Willman, H. B., E. Atherton, T. C. Buschbach, C. Collinson, J. C. Frye,
M. E. Hopkins, J. A. Lineback, and J. A. Simon, 1975. Handbook of
Illinois stratigraphy. Illinois State Geological Survey Bulletin 95,
261 p.
Willman, H. B., and J. C. Frye, 1970. Pleistocene stratigraphy of Illinois.
Illinois State Geological Survey Bulletin 94, 204 p.
Willman, H. B., H. D. Glass, and J. C. Frye, 1963. Mineralogy of glacial
tills and their weathering profiles in Illinois. Part I--Glacial
tills. Illinois State Geological Survey Circular 347, 55 p.
Willman, H. B., and D. R. Kolata, 1978. The Platteville and Galena groups in
northern Illinois. Illinois State Geological Survey Circular 502, 75 p.
Willman, H. B., and J. N. Payne, 1942. Geology and mineral resources of the
Marseilles, Ottawa, and Streator Quadrangles. Illinois State Geological
Survey Bulletin 66, 388 p.
Willman, H. B., and J. S. Templeton, 1951. Cambrian and Lower Ordovician
exposures in northern Illinois. Illinois Academy of Science Trans-
actions, Vol. 44, p. 109-125. Illinois State Geological Survey
Circular 179 (1952).
116
Weller, D. M., et al., 1973 to date. Public groundwater supplies in Illinois
counties. Illinois State Water Survey Bulletin 60, including: 60-1,
Adams, 24 p.; 60-4, Kendall, 16 p.; 60-5, Brown, 4 p.; 60-6, Boone,
12 p.; 60-11, Stark, 10 p.; 60-18, Putnam, 13 p.; 60-19, McHenry, 52 p.;
60-20, Lake, 91 p.; 60-22, Kane, 92 p.; 60-23, Henderson, 20 p.; 60-35,
Warren, 20 p.; and 60-28, Carroll, 23 p.
Workman, L. E., and A. H. Bell, 1948. Deep drilling and deeper oil possi-
bilities in Illinois. American Association of Petroleum Geologists
Bulletin, Vol. 32, p. 2041-2062. Illinois State Geological Survey
Report of Investigation 139, 22 p.
Zeizel, A. J., W. C. Walton, R. T. Sasman, and T. A. Prickett, 1962.
Ground-water resources of DuPage County, Illinois. Illinois State Water
Survey and Geological Survey Cooperative Report 2, 103 p.
117

118
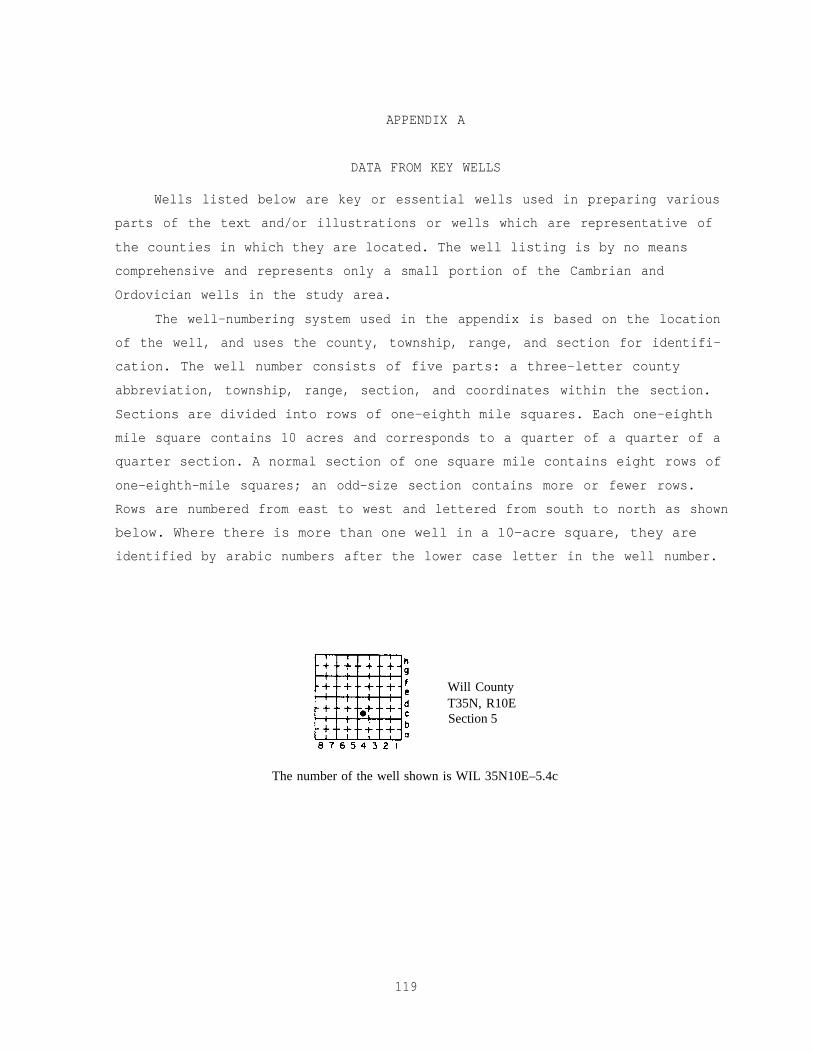
APPENDIX A
DATA FROM KEY WELLS
Wells listed below are key or essential wells used in preparing various
parts of the text and/or illustrations or wells which are representative of
the counties in which they are located. The well listing is by no means
comprehensive and represents only a small portion of the Cambrian and
Ordovician wells in the study area.
The well-numbering system used in the appendix is based on the location
of the well, and uses the county, township, range, and section for identifi-
cation. The well number consists of five parts: a three-letter county
abbreviation, township, range, section, and coordinates within the section.
Sections are divided into rows of one-eighth mile squares. Each one-eighth
mile square contains 10 acres and corresponds to a quarter of a quarter of a
quarter section. A normal section of one square mile contains eight rows of
one-eighth-mile squares; an odd-size section contains more or fewer rows.
Rows are numbered from east to west and lettered from south to north as shown
below. Where there is more than one well in a 10-acre square, they are
identified by arabic numbers after the lower case letter in the well number.
The number of the well shown is WIL 35N10E–5.4c
Will CountyT35N, R10ESection 5
119
County abbreviations used are:
ADM = Adams IRO = IroquoisBNE = Boone JDV = Jo DaviessBRN = Brown KNE = KaneBUR = Bureau KNK = KankakeeCAL = Calhoun KEN = KendallCAR = Carroll KNX = KnoxCOK = Cook LKE = LakeDEK = DeKalb LAS = LaSalleDUP = DuPage LEE = LeeFRD = Ford LIV = LivingstonFUL = Fulton MCD = McDonoughGRY = Grundy MCH = McHenryHAN = Hancock MCL = McLeanHND = Henderson MRS = MarshallHRY = Henry MER = Mercer
OGL = OglePEO = PeoriaPKE = PikePUT = PutnamRIS = Rock IslandSCH = SchuylerSTK = StarkSTE = StephensonTAZ = TazewellVER = VermilionWAR = WarrenWIS = WhitesideWIL = WillWIN = WinnebagoWDF = WoodfordWTS = Whiteside
Other abbreviations used in the report are:
P = Public Supply PEPF = Prairie du Chien,I = Industrial Supply Eminence-Potosi,R = Rural (non-irrigation) Franconia
Supply IG = Ironton-GalesvilleA = Abandoned EC = Eau ClaireT = Test Well MS = Mt. Simon
QUAT = Pleistocene (Quaternary) PC = PrecambrianPENN = Pennslvanian DL = Driller's LogMISS = Mississippian SS = State Geological Survey,DEV = Devonian Sample Set NumberSIL = Silurian GPD/FT = Gallons per day per footMAQ = Maquoketa MG/L = Milligrams per literCO = Cambrian-Ordovician CTY WELL = SGS designated county
(Midwest Bedrock Aquigroup) well numberGP = Galena-Platteville W = State Water Survey,AN = Ancell (Glenwood-St. Peter) water quality analysis
PDC = Prairie du Chien E = Illinois EPA, waterEP = Eminence-Potosi quality analysisFR = Franconia U = U.S. Geological Survey,
water quality analysis
120

ADM 256W-19-1c 256 Bertha Phillips T 1941 750 1,570 PDC DL;SS 7053 Dry and Aband.ADM 1S9W-16.4e 235 Hubbard, S.A. T 1922 465 891 AN DL;SS 280ADM 1N6W-34.3f 21166 Camp Point P 1962 697 1,150 PDC 935 5 AN DL
BNE 43N3E-9.3h Carlton #1 R 110 FP GP DL U-251196 1980 439 Single unit GPBNE 43N3R-25.4d 271 Elizabeth
Taylor #1 T 1931 817 2,998 PC 110 20 DL;SS 1100 33 1931 17,500 1931BNE 44N3E-25.4d 296 Keene Belvid I 1942 780 550 AN 55 10 AN DL;SS 8451 17 1942 19,900 1942
Canning #2BNE 44N3E-25.7c 343 Belvidere #2 P 1951 763 1,861 MS 50 12 CO,MS DL 16 1951 41,170 1951 E-02973 1971 684BNE 44N3E-25.8b 292 Belevidere #3 P 1908 755 1,803 MS 55 15 CO,MS DL 26 1951 11,000 1946 E-029701 1971 738
(CO-MS)42,560(CO) 1951
BNE 45N4E-11.7h Capron #1 P 1900 912 880 90 10 CO DL 7 1971 31,000 1946 E-00856 1971 360 No geological dataBNE 45N4E-22.8h 334 Gerald Seaver R 1966 882 404 AN 390 5 DL;SS 52916 30 1966 U-248085 1979 375 Single unit ANBNE 46N3E-33.7f 336 Krupke #1 T 1950 925 1,555 MS
BRN 1S2W-33.1h 44 G. Cox #1 I 600 938 GP DL;SS 312BRN 1S4W-22.6e 302 T 1964 705 1,045 GP 495 10 DL;SS 48780 Dry and Aband. 1964
BUR 15N6E-10.8b 164 Neponset #3 P 1955 820 1,640 AN 1,070 8 CO DL;SS 25955 302 1956 17,000 1956 W-153664 1960 793
BUR 15N6E-34.4c 165 Berry #1 P 1957 800 2,701 E 140 8.6 DL;SS 27725 Dry and Aband.Plugged 1957, boreholeLogged
BUR 15N6E-34.6c 646 Buda #5 P 1968 770 1,601 AN 1,115 6 AN DL 240 1968 5,650 1968 U-246125 1980 1,220 Single Unit ANBUR 16N11E-10.8e 173 Joanna Western T 1960 630 1,643 PDC 1,170 10 CO DL;SS 36332 1,720 1960
Mills #1BUR 16N11R-34.6h 21181 Spring Valley P 1976 620 2,723 IG 1,158 18 DL;SS 60599 155 1976
#11
CAL 12S2W-9.5d 15 August Franke 1933 580 552 AN DL;SS 1300CAL 10S3W-1.5c 42 Oettle #1 1969 535 485 GP 55 7 DL;SS 56406CAL 8S4W-6.3b 4 Fienup #1 1954 448 2,550 MS 310 8 DL;SS 24666 Dry and Aband.
CAR 23N5E-2.5f 88 Chadwick #2 P 1945 800 1,215 115 15 CO DL;SS 12117 175 1964 3,000 1950 E-113906 1978 353CAR 24N3E-10.2e 118 Savanna #4 P 1935 610 1,309 EC 318 15.3 CO DL;SS 1613 0 1935 1935 E-B00142 1976 297CAR 24N4E-12.7h3 2 Mt. Carroll #3 P 1955 740 1,453 MS 730 16 CO,MS DL;SS 26039 120 1955 17,248 (CO) 1955 E-B49157 1978 376
CAR 24N6E-5.5e 3 Lanark #3 P 1956 880 1,101 EC 340 14 CO DL;SS 27454 175 1957 15,000 1957 E-B50658 1976 294CAR 25N3E-27.8b1 166 Miss. P 1951 655 560 GP 265 6 GP DL;SS 1310 51 1951 1,175 1940 E-B48681 1978 288 Single Unit GP
Palisades St.PkCAR 25N7E-19.6f1 Shannon #1 P 1945 945 250 GP 6 CO DL 58 1957 7,300 1957 E-01062 1971 420
COK 35N13E-1.1d 2461 Flossmoor #2a P 1973 674 1,764 EC 630 12 CO DL;SS 58917 15,351 1973COK 35N14R-10.1g 958 Glenwood #5 P 1969 627 1,785 1,153 12 IG DL;SS 56581 5,700 1969COK 37N12E-2.8h2 466 Orchard Hill P 1962 680 1,610 EC 1,123 10 AN,IG DL;Ss 42346 7,200 1962 Single Unit
Subd. #2COK 37N14E-22.1b 458 Sherwin 1962 590 1,648 615 16.4 MAQ DL;SS 43826 234 1962 Detailed
Williams Co #1 Report filed.COK 37N14E-27.6g 891 Chicago Sanit. T 1968 591 1,696 EC DL
Dist. DH-1COK 39N13E-21.6g 2845 Kropp Forge Co 1955 610 1,635 EC 20 PEPG,IG 10,350 1966
ECCOK 37N14E-22.5a 3202 Chicago 1935 596 2,000 MS 1,810 6 DL;SS 1691COK 40N12E-31.4d 114 Automatic Elec. I 1956 655 1,470 MS 73 30 CO DL;SS 27117 23,223 1957
COK 41N9E-36.3f 406 Hanover Park #1 P 1961 820 1,339 10 E,IG DL;SS 39878 428 1961 18,640 1961AN
COK 41N10E-15.4h 264 Hoffman Ests. P 1959 775 1,380 E 1,019 12 DL;SS 33351 423 1959 22,000 1959 W-149556 1959 35444 C
SOLIDS(MG/L)
REMARKSDISSOLVEDLOCATION CTY
NUMBER
YEAROF
TEST
TOTALANALYSESOF
TEST
MINERALYEAR
WELLOWNER USE
(GPD/FT)MISSIVITY
URED
TRANS-MEAS-
LAND)
YEAR
BELOW(FTLEVELWATER
AQUIPTYPE RECORDPRINC
(IN)DIAM.CASING
(FT)DEPTHCASING
ESTFM
YEAR DEEP-DRILL (FT)
SURF DEPTHELEV(FT)
121
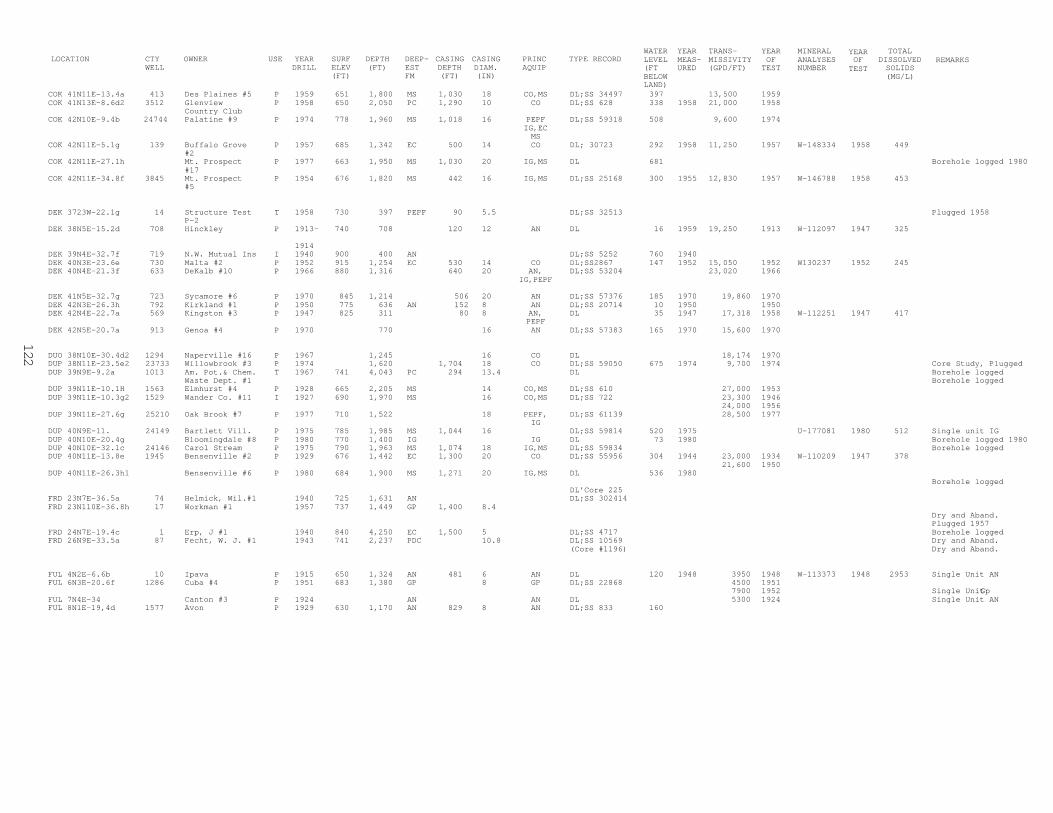
LOCATION CTYWELL
OWNER USE YEARDRILL
SURFELEV(FT)
DEPTH(FT)
DEEP-ESTFM
CASINGDEPTH(FT)
CASINGDIAM.(IN)
PRINCAQUIP
TYPE RECORDWATERLEVEL(FTBELOWLAND)
YEARMEAS-URED
TRANS-MISSIVITY(GPD/FT)
YEAROF
TEST
MINERALANALYSESNUMBER
YEAROF
TEST
TOTALDISSOLVEDSOLIDS(MG/L)
REMARKS
COK 41N11E-13.4a 413 Des Plaines #5 P 1959 651 1,800 MS 1,030 18 CO,MS DL;SS 34497 397 13,500 1959COK 41N13E-8.6d2 3512 Glenview P 1958 650 2,050 PC 1,290 10 CO DL;SS 628 338 1958 21,000 1958
Country ClubCOK 42N10E-9.4b 24744 Palatine #9 P 1974 778 1,960 MS 1,018 16 PEPF DL;SS 59318 508 9,600 1974
IG,ECMS
COK 42N11E-5.1g 139 Buffalo Grove P 1957 685 1,342 EC 500 14 CO DL; 30723 292 1958 11,250 1957 W-148334 1958 449#2
COK 42N11E-27.1h Mt. Prospect P 1977 663 1,950 MS 1,030 20 IG,MS DL 681 Borehole logged 1980#17
COK 42N11E-34.8f 3845 Mt. Prospect P 1954 676 1,820 MS 442 16 IG,MS DL;SS 25168 300 1955 12,830 1957 W-146788 1958 453#5
DEK 3723W-22.1g 14 Structure Test T 1958 730 397 PEPF 90 5.5 DL;SS 32513 Plugged 1958P-2
DEK 38N5E-15.2d 708 Hinckley P 1913- 740 708 120 12 AN DL 16 1959 19,250 1913 W-112097 1947 325
1914DEK 39N4E-32.7f 719 N.W. Mutual Ins I 1940 900 400 AN DL;SS 5252 760 1940DEK 40N3E-23.6e 730 Malta #2 P 1952 915 1,254 EC 530 14 CO DL;SS2867 147 1952 15,050 1952 W130237 1952 245DEK 40N4E-21.3f 633 DeKalb #10 P 1966 880 1,316 640 20 AN, DL;SS 53204 23,020 1966
IG,PEPF
DEK 41N5E-32.7g 723 Sycamore #6 P 1970 845 1,214 506 20 AN DL;SS 57376 185 1970 19,860 1970DEK 42N3E-26.3h 792 Kirkland #1 P 1950 775 636 AN 152 8 AN DL;SS 20714 10 1950 1950DEK 42N4E-22.7a 569 Kingston #3 P 1947 825 311 80 8 AN, DL 35 1947 17,318 1958 W-112251 1947 417
PEPFDEK 42N5E-20.7a 913 Genoa #4 P 1970 770 16 AN DL;SS 57383 165 1970 15,600 1970
DUO 38N10E-30.4d2 1294 Naperville #16 P 1967 1,245 16 CO DL 18,174 1970DUP 38N11E-23.5e2 23733 Willowbrook #3 P 1974 1,620 1,704 18 CO DL;SS 59050 675 1974 9,700 1974 Core Study, PluggedDUP 39N9E-9.2a 1013 Am. Pot.& Chem. T 1967 741 4,043 PC 294 13.4 DL Borehole logged
Waste Dept. #1 Borehole loggedDUP 39N11E-10.1H 1563 Elmhurst #4 P 1928 665 2,205 MS 14 CO,MS DL;SS 610 27,000 1953DUP 39N11E-10.3g2 1529 Wander Co. #11 I 1927 690 1,970 MS 16 CO,MS DL;SS 722 23,300 1946
24,000 1956DUP 39N11E-27.6g 25210 Oak Brook #7 P 1977 710 1,522 18 PEPF, DL;SS 61139 28,500 1977
IGDUP 40N9E-11. 24149 Bartlett Vill. P 1975 785 1,985 MS 1,044 16 DL;SS 59814 520 1975 U-177081 1980 512 Single unit IGDUP 40N10E-20.4g Bloomingdale #8 P 1980 770 1,400 IG IG DL 73 1980 Borehole logged 1980DUP 40N10E-32.1c 24146 Carol Stream P 1975 790 1,963 MS 1,074 18 IG,MS DL;SS 59834 Borehole loggedDUP 40N11E-13.8e 1945 Bensenville #2 P 1929 676 1,442 EC 1,300 20 CO DL;SS 55956 304 1944 23,000 1934 W-110209 1947 378
21,600 1950DUP 40N11E-26.3h1 Bensenville #6 P 1980 684 1,900 MS 1,271 20 IG,MS DL 536 1980
Borehole loggedDL’Core 225
FRD 23N7E-36.5a 74 Helmick, Wil.#1 1940 725 1,631 AN DL;SS 302414FRD 23N110E-36.8h 17 Workman #1 1957 737 1,449 GP 1,400 8.4
Dry and Aband.Plugged 1957
FRD 24N7E-19.4c 1 Erp, J #1 1940 840 4,250 EC 1,500 5 DL;SS 4717 Borehole loggedFRD 26N9E-33.5a 87 Fecht, W. J. #1 1943 741 2,237 PDC 10.8 DL;SS 10569 Dry and Aband.
(Core #1196) Dry and Aband.
FUL 4N2E-6.6b 10 Ipava P 1915 650 1,324 AN 481 6 AN DL 120 1948 3950 1948 W-113373 1948 2953 Single Unit ANFUL 6N3E-20.6f 1286 Cuba #4 P 1951 683 1,380 GP 8 GP DL;SS 22868 4500 1951
7900 1952 Single Unit GpFUL 7N4E-34 Canton #3 P 1924 AN AN DL 5300 1924 Single Unit ANFUL 8N1E-19,4d 1577 Avon P 1929 630 1,170 AN 829 8 AN DL;SS 833 160
122

FUL 8N3E-2.1f 703 Midland Elec. 1933 700 2,777 IG 1,704 8 DL;SS 1329Coal
FUL 8N3E-33.5d 947 Fairview #1 P 1951 740 1,605 AN 1,605 6 AN DL;SS 12872 225 1952 8,600 1951 W-127314 1952 1584 Single Unit AN
FUL 8N4E-11.1g 948 Farmington #2 P 1956 710 1,743 AN 1,280 12 AN DL;SS27476 291 1952 1,900 1921 W-146687 1958 1965 Single Unit AN
GRY 31N8E-4.2b 698 Gardner P 1925 588 973 AN 800 8 AN DL;SS 435 63 1928 91 1951 W-61868 1928 980 Single UnitGRY 31N6E-20.3c 1558 Babson Farms 1947 655 535 AN 450 6 DL 175 1947
GRY 32N6E-29.4e 1053 E.I. DuPont #3 1940 520 1,545 EC 306 16 CO DL;SS 4374 14,500 1943GRY 33N7E-4.4c 1080 Morris #5 P 1954 505 1,462 EC 800 16 IG DL;SS 24398 46 1958 17,000 1958 W-147974 1958 419 Borehole logged
21,500 1954GRY 33N7E-9.3h 1095 Morris #4 P 1938 518 1,501 EC 915 16 CO DL;SS 2920 59 1955 10,500 1947 W-112558 1947 411GRY 33N8E-34.1d 22366 Coal City #5 P 1978 565 1,785 21 CO DL;SS 61510 230 5,300 1978GRY 33N8E-1.3e 22239 Minooka #4 P 1973 613 725 AN 200 8 AN DL;SS 58845 223 1973 5,900 1973 Single Unit ANGRY 34N8E-35.1e 907 Dresden Nuclear 1957 530 1,500 26 CO DL;SS 29050 2,830 1957
#2HAN 3N7W-17.7e 157 M.D. Lafferty 1944 645 3,025 MS 233 10.8 DL;SS 11030 Dry and Aband.
Borehole loggedHAN 4N5E-28.6g 200 Joe Rice 1941 614 2,085 PEPF 744 4.8 DL;SS 5672 Plugged back
To 260 ft.HAN 5N8W-6.8h Camp Eastman P 1958 AN 4 AN DL 2,080 1957 Single Unit ANHAN 6N9W-2.1h 46 Nauvoo Milk I 1945 645 811 GP 65 8 DL
Prod.HAN &N8W-2.2c 81 Chicago Bridge I 1966 745 30 10 CO DL;SS 53716 20 1966 2,840 1966
& Iron #1HND 8N6W-2.5c 28 Evans 1964 533 802 AN 176 8 DL;SS 49972 Dry and Aband.
Left open forWater well.
HND 9N5w-25.1e Stronghurst #1 P 1925 8 AN DL;SS 2713 2,080 1925HND 10N5W-34.2f 21 Dale McChesney 1950 675 675 GP 675 5.4 AN DL 165 1950HND 11N5W-22.8b 196 G.C. Richmond #1 1942 520 900 AN DL;SS 8791 Dry and Aband.
HRY 14N1E-21.1f 301 Alpha #2 P 1950 770 1,209 AN 1,209 16 CO DL;SS 20014 256 1950 4,112 1950 W-120516 1950 754HRY 14N4E-27.8b 497 Galva #4 P 1933 845 1,687 PDC 1,040 20 AN DL 304 1945 10,000 1934 W-112718 1947 898
13,000 19345,058 1970
HRY 15N3E-7.3f 622 Cambridge #2 P 1913 800 1,377 AN 955 8 AN DL 14,200 1944 W-109415 1946 640 Single UnitHRY 15N5E-33.5h4 521 Kewanee #2 P 1927 848 2,430 EC 14 CO DL;SS 613 304 1945 20,750 1927 W-108625 1938 1700
2,080HRY 15N5E-33.6g 515 Kewanee #3 P 1939 820 2,484 IG 1,525 10 AN DL;SS 273 1944 2,250 1939 W-8624 1939 1600 Single Unit
CO 22,000 1939CO 36,000 1939CO 23,000 1939
HRY 16N1E-30.8a 360 E. A. South T 1961 803 3,863 PCDL;SS 41427 Obsrv. Well
HRY 17N1E-5.6d Silvis #6 P 1976 690 1,371 AN 312 12 Sil, DL 206 1980 Plugged 1972CO Borehole logged
HRY 17N3E-1.52a 587 Patten 1940 612 1,137 AN 820 8 DL;SS 4505 1980Dry and Aband.
HRY 17N3E-35.1e 265 Midland Elec. I 1956 700 1,300 AN 548 16 DL;SS 28041 95 1956 PluggedCoal Corp. #2
IRO 27N13W-31.8e 918 Harroun #1 T 1970 653 4,005 MS 4,000 5.5 DL;SS 56798 Borehole logged
IRO 26N13W-11.1h 46 V. Taden #1 T 1960 653 3,475 MS 3,466 5.5 DL;SS 35648 Borehole logged
SOLIDS(MG/L)
REMARKSDISSOLVEDLOCATION CTYNUMBER
YEAROF
TEST
TOTALANALYSESOF
TEST
MINERALYEAR
WELLOWNER USE
(GPD/FT)MISSIVITY
URED
TRANS-MEAS-
LAND)
YEAR
BELOW(FTLEVELWATER
AQUIPTYPE RECORDPRINC
(IN)DIAM.CASING
(FT)DEPTHCASING
ESTFM
DEEP-DRILL (FT)
SURF DEPTHELEV(FT)
YEAR
123
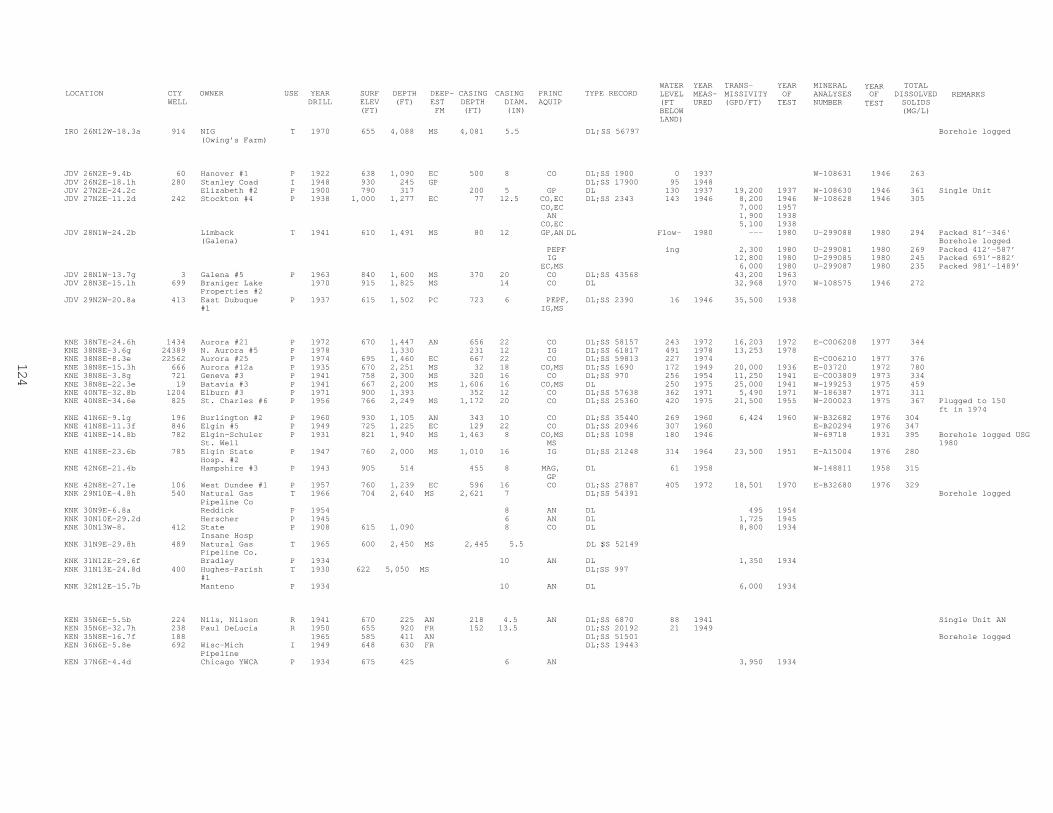
IRO 26N12W-18.3a 914 NIG T 1970 655 4,088 MS 4,081 5.5 DL; SS 56797 Borehole logged(Owing’s Farm)
JDV 26N2E-9.4b 60 Hanover #1 P 1922 638 1,090 EC 500 8 CO DL; SS 1900 0 1937 W-108631 1946 263JDV 26N2E-18.1h 280 Stanley Coad I 1948 930 245 GP DL; SS 17900 95 1948JDV 27N2E-24.2c Elizabeth #2 P 1900 790 317 200 5 GP DL 130 1937 19,200 1937 W-108630 1946 361 Single UnitJDV 27N2E-11.2d 242 Stockton #4 P 1938 1,000 1,277 EC 77 12.5 CO, EC DL; SS 2343 143 1946 8,200 1946 W-108628 1946 305
CO, EC 7,000 1957AN 1,900 1938
CO, EC 5,100 1938JDV 28N1W-24.2b Limback T 1941 610 1,491 MS 80 12 GP, AN DL Flow- 1980 --- 1980 U-299088 1980 294 Packed 81’-346'
(Galena) Borehole loggedPEPF ing 2,300 1980 U-299081 1980 269 Packed 412’-587’IG 12,800 1980 U-299085 1980 245 Packed 691’-882’
EC, MS 6,000 1980 U-299087 1980 235 Packed 981’-1489’JDV 28N1W-13.7g 3 Galena #5 P 1963 840 1,600 MS 370 20 CO DL; SS 43568 43,200 1963JDV 28N3E-15.1h 699 Braniger Lake 1970 915 1,825 MS 14 CO DL 32,968 1970 W-108575 1946 272
Properties #2JDV 29N2W-20.8a 413 East Dubuque P 1937 615 1,502 PC 723 6 PEPF, DL; SS 2390 16 1946 35,500 1938
#1 IG, MS
KNE 38N7E-24.6h 1434 Aurora #21 P 1972 670 1,447 AN 656 22 CO DL; SS 58157 243 1972 16,203 1972 E-C006208 1977 344KNE 38N8E-3.6g 24389 N. Aurora #5 P 1978 1,330 231 12 IG DL; SS 61817 491 1978 13,253 1978KNE 38N8E-8.3e 22562 Aurora #25 P 1974 695 1,460 EC 667 22 CO DL; SS 59813 227 1974 E-C006210 1977 376KNE 38N8E-15.3h 666 Aurora #12a P 1935 670 2,251 MS 32 18 CO, MS DL; SS 1690 172 1949 20,000 1936 E-03720 1972 780KNE 38N8E-3.8g 721 Geneva #3 P 1941 758 2,300 MS 320 16 CO DL; SS 970 256 1954 11,250 1941 E-C003809 1973 334KNE 38N8E-22.3e 19 Batavia #3 P 1941 667 2,200 MS 1,606 16 CO, MS DL 250 1975 25,000 1941 W-199253 1975 459KNE 40N7E-32.8b 1204 Elburn #3 P 1971 900 1,393 352 12 CO DL; SS 57638 362 1971 5,490 1971 W-186387 1971 311KNE 40N8E-34.6e 825 St. Charles #6 P 1956 766 2,249 MS 1,172 20 CO DL; SS 25360 420 1975 21,500 1955 W-200023 1975 367 Plugged to 150
ft in 1974KNE 41N6E-9.1g 196 Burlington #2 P 1960 930 1,105 AN 343 10 CO DL; SS 35440 269 1960 6,424 1960 W-B32682 1976 304KNE 41N8E-11.3f 846 Elgin #5 P 1949 725 1,225 EC 129 22 CO DL; SS 20946 307 1960 E-B20294 1976 347KNE 41N8E-14.8b 782 Elgin-Schuler P 1931 821 1,940 MS 1,463 8 CO, MS DL; SS 1098 180 1946 W-69718 1931 395 Borehole logged USG
St. Well MS 1980KNE 41N8E-23.6b 785 Elgin State P 1947 760 2,000 MS 1,010 16 IG DL; SS 21248 314 1964 23,500 1951 E-A15004 1976 280
Hosp. #2KNE 42N6E-21.4b Hampshire #3 P 1943 905 514 455 8 MAG, DL 61 1958 W-148811 1958 315
GPKNE 42N8E-27.1e 106 West Dundee #1 P 1957 760 1,239 EC 596 16 CO DL; SS 27887 405 1972 18,501 1970 E-B32680 1976 329KNK 29N10E-4.8h 540 Natural Gas T 1966 704 2,640 MS 2,621 7 DL; SS 54391 Borehole logged
Pipeline CoKNK 30N9E-6.8a Reddick P 1954 8 AN DL 495 1954KNK 30N10E-29.2d Herscher P 1945 6 AN DL 1,725 1945KNK 30N13W-8. 412 State P 1908 615 1,090 8 CO DL 8,800 1934
Insane HospKNK 31N9E-29.8h 489 Natural Gas T 1965 600 2,450 MS 2,445 5.5 DL ; SS 52149
Pipeline Co.KNK 31N12E-29.6f Bradley P 1934 10 AN DL 1,350 1934KNK 31N13E-24.8d 400 Hughes-Parish T 1930 622 5,050 MS DL; SS 997
#1KNK 32N12E-15.7b Manteno P 1934 10 AN DL 6,000 1934
KEN 35N6E-5.5b 224 Nils, Nilson R 1941 670 225 AN 218 4.5 AN DL; SS 6870 88 1941 Single Unit ANKEN 35N6E-32.7h 238 Paul DeLucia R 1950 655 920 FR 152 13.5 DL; SS 20192 21 1949KEN 35N8E-16.7f 188 1965 585 411 AN DL; SS 51501 Borehole loggedKEN 36N6E-5.8e 692 Wisc-Mich I 1949 648 630 FR DL; SS 19443
PipelineKEN 37N6E-4.4d Chicago YWCA P 1934 675 425 6 AN 3,950 1934
SOLIDS(MG/L)
REMARKSDISSOLVEDLOCATION CTYNUMBER
YEAROF
TEST
TOTALANALYSESOF
TEST
MINERALYEAR
WELLOWNER USE
(GPD/FT)MISSIVITY
URED
TRANS-MEAS-
LAND)
YEAR
BELOW(FTLEVELWATER
AQUIPTYPE RECORDPRINC
(IN)DIAM.
CASING
(FT)DEPTHCASING
ESTFM
DEEP-DRILL (FT)
SURF DEPTHELEV(FT)
YEAR
124
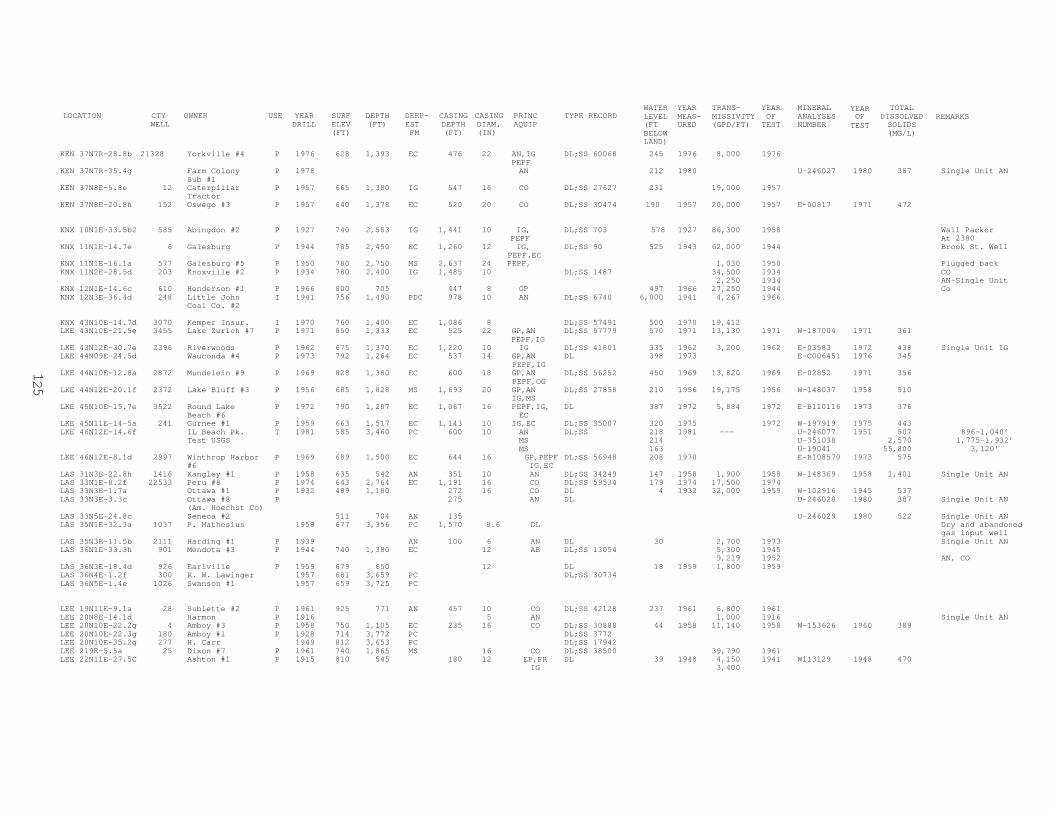
KEN 37N7R-28.8b 21328 Yorkville #4 P 1976 628 1,393 EC 476 22 AN,IG DL;SS 60068 245 1976 8,000 1976PEPF
KEN 37N7R-35.4g Farm Colony P 1978 AN 212 1980 U-246027 1980 387 Single Unit ANSub #1
KEN 37N8E-5.8e 12 Caterpillar P 1957 665 1,380 IG 547 16 CO DL;SS 27627 231 19,000 1957Tractor
KEN 37N8E-20.8h 152 Oswego #3 P 1957 640 1,378 EC 520 20 CO DL;SS 30474 190 1957 20,000 1957 E-00817 1971 472
KNX 10N1E-33.5b2 585 Abingdon #2 P 1927 740 2,583 IG 1,441 10 IG, DL;SS 703 578 1927 86,300 1958 Wall PackerPEPF At 2380
KNX 11N1E-14.7e 6 Galesburg P 1944 785 2,450 EC 1,260 12 IG, DL;SS 90 525 1943 62,000 1944 Brook St. WellPEPF.EC
KNX 11N1E-16.1a 577 Galesburg #5 P 1950 780 2,750 MS 2,637 24 PEPF, 1,030 1950 Plugged backKNX 11N2E-28.5d 203 Knoxville #2 P 1934 780 2,400 IG 1,485 10 DL;SS 1487 34,500 1934 CO
2,250 1934 AN-Single UnitKNX 12N1E-14.6c 610 Henderson #1 P 1966 800 705 447 8 GP 497 1966 27,250 1944 CoKNX 12N3E-36.4d 248 Little John I 1941 756 1,490 PDC 978 10 AN DL;SS 6740 6,000 1941 4,267 1966
Coal Co. #2
KNX 43N10E-14.7d 3070 Kemper Insur. I 1970 760 1,400 EC 1,086 8 DL;SS 57491 500 1970 19,412LKE 43N10E-21.5e 3455 Lake Zurich #7 P 1971 850 1,333 EC 525 22 GP,AN DL;SS 57779 570 1971 13,130 1971 W-187004 1971 361
PEPF,IGLKE 43N12E-30.7e 2396 Riverwoods P 1962 675 1,370 EC 1,220 10 IG DL;SS 41801 335 1962 3,200 1962 E-03583 1972 438 Single Unit IGLKE 44N09E-24.5d Wauconda #4 P 1973 792 1,264 EC 537 14 GP,AN DL 398 1973 E-C006451 1976 345
PEPF,IGLKE 44N10E-12.8a 2872 Mundelein #9 P 1969 828 1,380 EC 600 18 GP,AN DL;SS 56252 450 1969 13,820 1969 E-02852 1971 356
PEPF,OGLKE 44N12E-20.1f 2372 Lake Bluff #3 P 1956 685 1,828 MS 1,693 20 GP,AN DL;SS 27858 210 1956 19,175 1956 W-148037 1958 510
IG,MSLKE 45N10E-15.7e 3522 Round Lake P 1972 790 1,287 EC 1,067 16 PEPF,IG, DL 387 1972 5,884 1972 E-B110116 1973 376
Beach #6 ECLKE 45N11E-14-5a 241 Gurnee #1 P 1959 663 1,517 EC 1,143 10 IG,EC DL;SS 35007 320 1975 1972 W-197919 1975 443LKE 46N12E-14.6f IL Beach Pk. T 1981 585 3,460 PC 600 10 AN DL;SS 218 1981 --- U-246077 1951 507 896-1,040’
Test USGS MS 214 U-351038 2,570 1,775-1,932’MS 163 U-19041 55,800 3,120’
LKE 46N12E-8.1d 2997 Winthrop Harbor P 1969 689 1,500 EC 644 16 GP,PEPF DL;SS 56948 208 1970 E-B108570 1973 575#6 IG,EC
LAS 31N3E-22.8h 1416 Kangley #1 P 1958 635 542 AN 351 10 AN DL;SS 34249 147 1958 1,900 1958 W-148369 1958 1,401 Single Unit ANLAS 33N1E-8.2f 22533 Peru #8 P 1974 643 2,764 EC 1,191 16 CO DL;SS 59534 179 1974 17,500 1974LAS 33N3E-1.7a Ottawa #1 P 1932 489 1,180 272 16 CO DL 4 1932 32,000 1959 W-102916 1945 537LAS 33N3E-3.3c Ottawa #8 P 275 AN DL U-246028 1980 387 Single Unit AN
(Am. Hoechst Co)LAS 33N5E-24.8c Seneca #2 511 704 AN 135 U-246029 1980 522 Single Unit ANLAS 35N1E-32.3a 1037 P. Mathesius 1958 677 3,356 PC 1,570 8.6 DL Dry and abandoned
gas input wellLAS 35N3E-11.5b 2111 Harding #1 P 1939 AN 100 6 AN DL 30 2,700 1973 Single Unit ANLAS 36N1E-33.3h 901 Mendota #3 P 1944 740 1,380 EC 12 AB DL;SS 13054 5,300 1945
9,219 1952 AN, COLAS 36N3E-18.4d 926 Earlville P 1959 679 650 12 DL 18 1959 1,800 1959LAS 36N4E-1.2f 300 R. W. Lawinger 1957 681 3,659 PC DL;SS 30734LAS 36N5E-1.4e 1026 Swanson #1 1957 659 3,725 PC
LEE 19N11E-9.1a 28 Sublette #2 P 1961 925 771 AN 457 10 CO DL;SS 42128 237 1961 6,800 1961LEE 20N8E-14.1d Harmon P 1916 5 AN 1,000 1916 Single Unit ANLEE 20N10E-22.2g 4 Amboy #3 P 1958 750 1,105 EC 235 16 CO DL;SS 30888 44 1958 11,140 1958 W-153626 1960 389LEE 20N10E-22.3g 180 Amboy #1 P 1928 714 3,772 PC DL;SS 3772LEE 20N10E-35.2g 277 H. Carr 1949 812 3,653 PC DL;SS 17942LEE 219E-5.5a 25 Dixon #7 P 1961 740 1,865 MS 16 CO DL;SS 38500 39,790 1961LEE 22N11E-27.5C Ashton #1 P 1915 810 545 180 12 EP,FR DL 39 1948 4,150 1941 W113129 1948 470
IG 3,400
SOLIDS(MG/L)
REMARKSDISSOLVEDLOCATION CTYNUMBER
YEAROF
TEST
TOTALANALYSESOF
TEST
MINERALYEAR
WELLOWNER USE
(GPD/FT)MISSIVITY
URED
TRANS-MEAS-
LAND)
YEAR
BELOW(FTLEVELWATER
AQUIPTYPE RECORDPRINC
(IN)DIAM.CASING
(FT)DEPTHCASING
ESTFM
DEEP-DRILL (FT)
SURF DEPTHELEV(FT)
YEAR
152
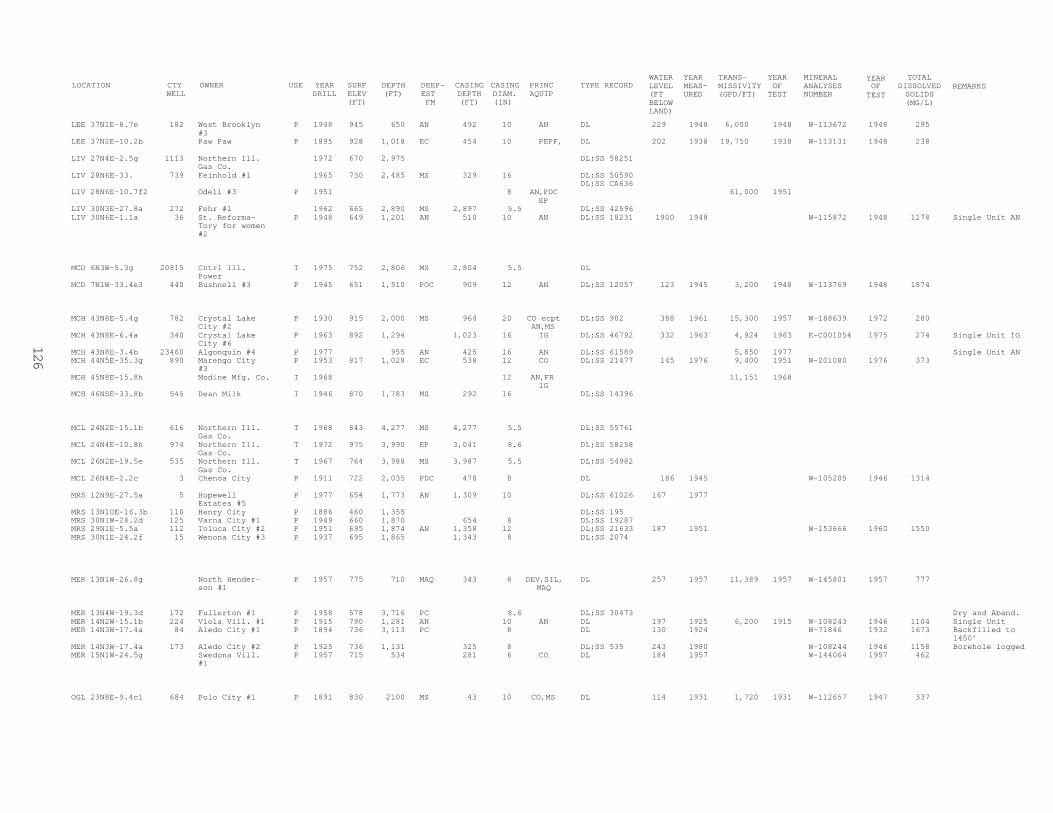
LEE 37N1E-8.7e 182 West Brooklyn P 1948 945 650 AN 492 10 AN DL 229 1948 6,000 1948 W-113672 1948 295#3
LEE 37N2E-10.2b Paw Paw P 1895 928 1,018 EC 454 10 PEPF, DL 202 1938 19,750 1938 W-113131 1948 238
LIV 27N4E-2.5g 1113 Northern Ill. 1972 670 2,975 DL;SS 58251Gas Co.
LIV 28N6E-33. 739 Feinhold #1 1965 730 2,485 MS 329 16 DL;SS 50590DL;SS CA636
LIV 28N6E-10.7f2 Odell #3 P 1951 8 AN, PDC 61,000 1951EP
LIV 30N3E-27.8a 272 Fehr #1 1962 665 2,890 MS 2,897 5.5 DL;SS 42596LIV 30N6E-1.1a 36 St. Reforma- P 1948 649 1,201 AN 510 10 AN DL;SS 18231 1900 1948 W-115872 1948 1278 Single Unit AN
Tory for women#2
MCD 6N3W-5.3g 20815 Cntrl Ill. T 1975 752 2,806 MS 2,804 5.5 DLPower
MCD 7N1W-33.4e3 440 Bushnell #3 P 1945 651 1,510 POC 909 12 AN DL;SS 12057 123 1945 3,200 1948 W-113769 1948 1874
MCH 43N8E-5.4g 782 Crystal Lake P 1930 915 2,000 MS 964 20 CO ecpt DL;SS 902 388 1961 15,300 1957 W-188639 1972 280City #2 AN, MS
MCH 43N8E-6.4a 340 Crystal Lake P 1963 892 1,294 1,023 16 IG DL;SS 46792 332 1963 4,924 1963 E-C001054 1975 274 Single Unit IGCity #6
MCH 43N8E-3.4b 23460 Algonquin #4 P 1977 955 AN 425 16 AN DL;SS 61589 5,850 1977 Single Unit ANMCH 44N5E-35.3g 890 Marengo City P 1953 817 1,028 EC 538 12 CO DL;SS 21477 145 1976 9,400 1951 W-201080 1976 373
#3MCH 45N8E-15.8h Modine Mfg. Co. I 1968 12 AN, FR 11,151 1968
IGMCH 46NSE-33.8b 545 Dean Milk I 1946 870 1,783 MS 292 16 DL;SS 14396
MCL 24N2E-15.1b 616 Northern Ill. T 1968 843 4,277 MS 4,277 5.5 DL;SS 55761Gas Co.
MCL 24N4E-10.8h 974 Northern Ill. T 1972 975 3,990 EP 3,041 8.6 DL;SS 58258Gas Co.
MCL 26N2E-19.5e 535 Northern Ill. T 1967 764 3,988 MS 3,987 5.5 DL;SS 54982Gas Co.
MCL 26N4E-2.2c 3 Chenoa City P 1911 722 2,035 PDC 478 8 DL 186 1945 W-105205 1946 1314
MRS 12N9E-27.5a 5 Hopewell P 1977 654 1,773 AN 1,309 10 DL;SS 61026 167 1977Estates #5
MRS 13N10E-16.3b 110 Henry City P 1886 460 1,355 DL;SS 195MRS 30N1W-28.2d 125 Varna City #1 P 1949 660 1,870 654 8 DL;SS 19287MRS 29N1E-5.5a 112 Toluca City #2 P 1951 695 1,874 AN 1,358 12 DL;SS 21633 187 1951 W-153666 1960 1550MRS 30N1E-24.2f 15 Wenona City #3 P 1937 695 1,865 1,343 8 DL;SS 2074
MER 13N1W-26.8g North Hender- P 1957 775 710 MAQ 343 8 DEV, SIL, DL 257 1957 11,389 1957 W-145801 1957 777son #1 MAQ
MER 13N4W-19.3d 172 Fullerton #1 P 1958 578 3,716 PC 8.6 DL;SS 30473 Dry and Aband.MER 14N2W-15.1b 224 Viola Vill. #1 P 1915 790 1,281 AN 10 AN DL 197 1925 6,200 1915 W-108243 1946 1104 Single UnitMER 14N3W-17.4a 84 Aledo City #1 P 1894 736 3,113 PC 8 DL 130 1924 W-71846 1932 1673 Backfilled to
1450’MER 14N3W-17.4a 173 Aledo City #2 P 1925 736 1,131 325 8 DL;SS 535 243 1980 W-108244 1946 1158 Borehole loggedMER 15N1W-24.5g Swedona Vill. P 1957 715 534 281 6 CO DL 184 1957 W-144064 1957 462
#1
OGL 23N8E-9.4c1 684 Polo City #1 P 1891 830 2100 MS 43 10 CO, MS DL 114 1931 1,720 1931 W-112657 1947 337
SOLIDS(MG/L)
REMARKSDISSOLVEDLOCATION CTYNUMBER
YEAROF
TEST
TOTALANALYSESOF
TEST
MINERALYEAR
WELLOWNER USE
(GPD/FT)MISSIVITY
URED
TRANS-MEAS-
LAND)
YEAR
BELOW(FTLEVELWATER
AQUIPTYPE RECORDPRINC
(IN)DIAM.CASING
(FT)DEPTHCASING
ESTFM
DEEP-DRILL (FT)
SURF DEPTHELEV(FT)
YEAR
126
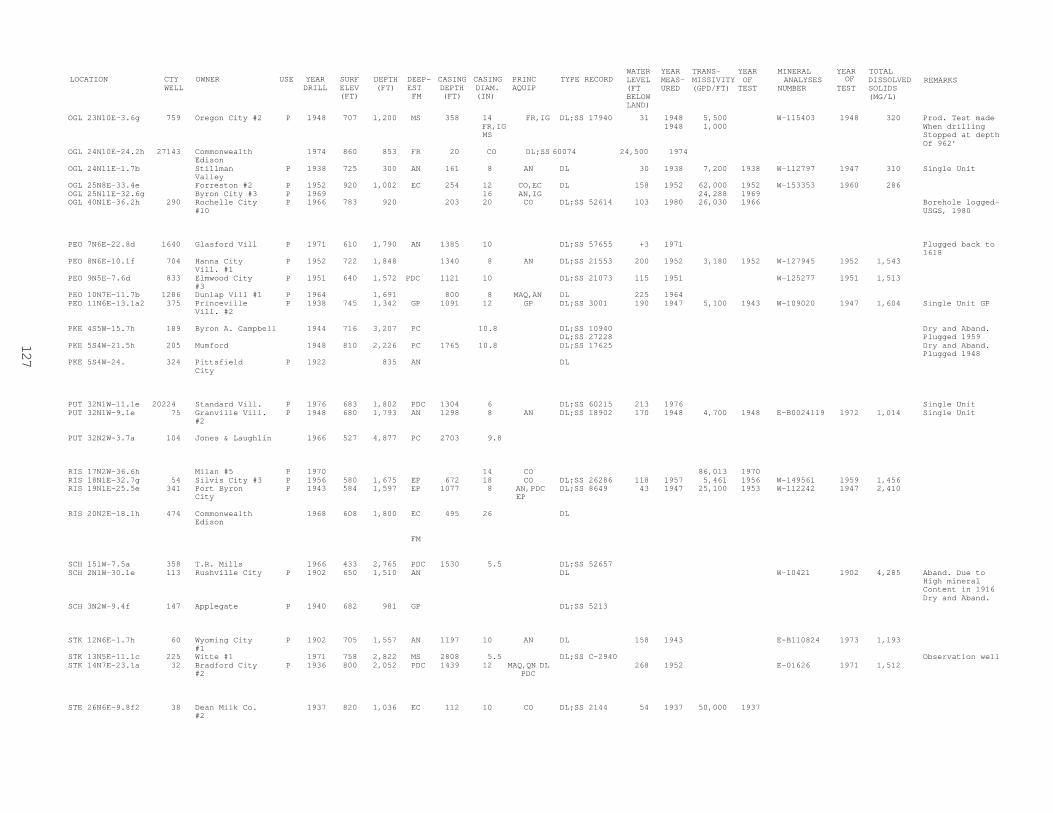
OGL 23N10E-3.6g 759 Oregon City #2 P 1948 707 1,200 MS 358 14 FR,IG DL;SS 17940 31 1948 5,500 W-115403 1948 320 Prod. Test madeFR,IG 1948 1,000 When drillingMS Stopped at depth
Of 962’OGL 24N10E-24.2h 27143 Commonwealth 1974 860 853 FR 20 CO DL;SS 60074 24,500 1974
EdisonOGL 24N11E-1.7b Stillman P 1938 725 300 AN 161 8 AN DL 30 1938 7,200 1938 W-112797 1947 310 Single Unit
ValleyOGL 25N8E-33.4e Forreston #2 P 1952 920 1,002 EC 254 12 CO, EC DL 158 1952 62,000 1952 W-153353 1960 286OGL 25N11E-32.6g Byron City #3 P 1969 16 AN, IG 24,288 1969OGL 40N1E-36.2h 290 Rochelle City P 1966 783 920 203 20 CO DL;SS 52614 103 1980 26,030 1966 Borehole logged-
#10 USGS, 1980
PEO 7N6E-22.8d 1640 Glasford Vill P 1971 610 1,790 AN 1385 10 DL;SS 57655 +3 1971 Plugged back to1618
PEO 8N6E-10.1f 704 Hanna City P 1952 722 1,848 1340 8 AN DL;SS 21553 200 1952 3,180 1952 W-127945 1952 1,543Vill. #1
PEO 9N5E-7.6d 833 Elmwood City P 1951 640 1,572 PDC 1121 10 DL;SS 21073 115 1951 W-125277 1951 1,513#3
PEO 10N7E-11.7b 1286 Dunlap Vill #1 P 1964 1,691 800 8 MAQ, AN DL 225 1964PEO 11N6E-13.1a2 375 Princeville P 1938 745 1,342 GP 1091 12 GP DL;SS 3001 190 1947 5,100 1943 W-109020 1947 1,604 Single Unit GP
Vill. #2
PKE 4S5W-15.7h 189 Byron A. Campbell 1944 716 3,207 PC 10.8 DL;SS 10940 Dry and Aband.DL;SS 27228 Plugged 1959
PKE 5S4W-21.5h 205 Mumford 1948 810 2,226 PC 1765 10.8 DL;SS 17625 Dry and Aband.Plugged 1948
PKE 5S4W-24. 324 Pittsfield P 1922 835 AN DLCity
PUT 32N1W-11.1e 20224 Standard Vill. P 1976 683 1,802 PDC 1304 6 DL;SS 60215 213 1976 Single UnitPUT 32N1W-9.1e 75 Granville Vill. P 1948 680 1,793 AN 1298 8 AN DL;SS 18902 170 1948 4,700 1948 E-B0024119 1972 1,014 Single Unit
#2
PUT 32N2W-3.7a 104 Jones & Laughlin 1966 527 4,877 PC 2703 9.8
RIS 17N2W-36.6h Milan #5 P 1970 14 CO 86,013 1970RIS 18N1E-32.7g 54 Silvis City #3 P 1956 580 1,675 EP 672 18 CO DL;SS 26286 118 1957 5,461 1956 W-149561 1959 1,456RIS 19N1E-25.5e 341 Port Byron P 1943 584 1,597 EP 1077 8 AN, PDC DL;SS 8649 43 1947 25,100 1953 W-112242 1947 2,410
City EP
RIS 20N2E-18.1h 474 Commonwealth 1968 608 1,800 EC 495 26 DLEdison
FM
SCH 151W-7.5a 358 T.R. Mills 1966 433 2,765 PDC 1530 5.5 DL;SS 52657SCH 2N1W-30.1e 113 Rushville City P 1902 650 1,510 AN DL W-10421 1902 4,285 Aband. Due to
High mineralContent in 1916Dry and Aband.
SCH 3N2W-9.4f 147 Applegate P 1940 682 981 GP DL;SS 5213
STK 12N6E-1.7h 60 Wyoming City P 1902 705 1,557 AN 1197 10 AN DL 158 1943 E-B110824 1973 1,193#1
STK 13N5E-11.1c 225 Witte #1 1971 758 2,822 MS 2808 5.5 DL;SS C-2940 Observation wellSTK 14N7E-23.1a 32 Bradford City P 1936 800 2,052 PDC 1439 12 MAQ, QN DL 268 1952 E-01626 1971 1,512
#2 PDC
STE 26N6E-9.8f2 38 Dean Milk Co. 1937 820 1,036 EC 112 10 CO DL;SS 2144 54 1937 50,000 1937#2
SOLIDS(MG/L)
REMARKSDISSOLVEDLOCATION CTYNUMBER
YEAROF
TEST
TOTALANALYSESOF
TEST
MINERALYEAR
WELLOWNER USE
(GPD/FT)MISSIVITY
URED
TRANS-MEAS-
LAND)
YEAR
BELOW(FTLEVELWATER
AQUIPTYPE RECORDPRINC
(IN)DIAM.CASING
(FT)DEPTHCASING
ESTFM
DEEP-DRILL (FT)
SURF DEPTHELEV(FT)
YEAR
127
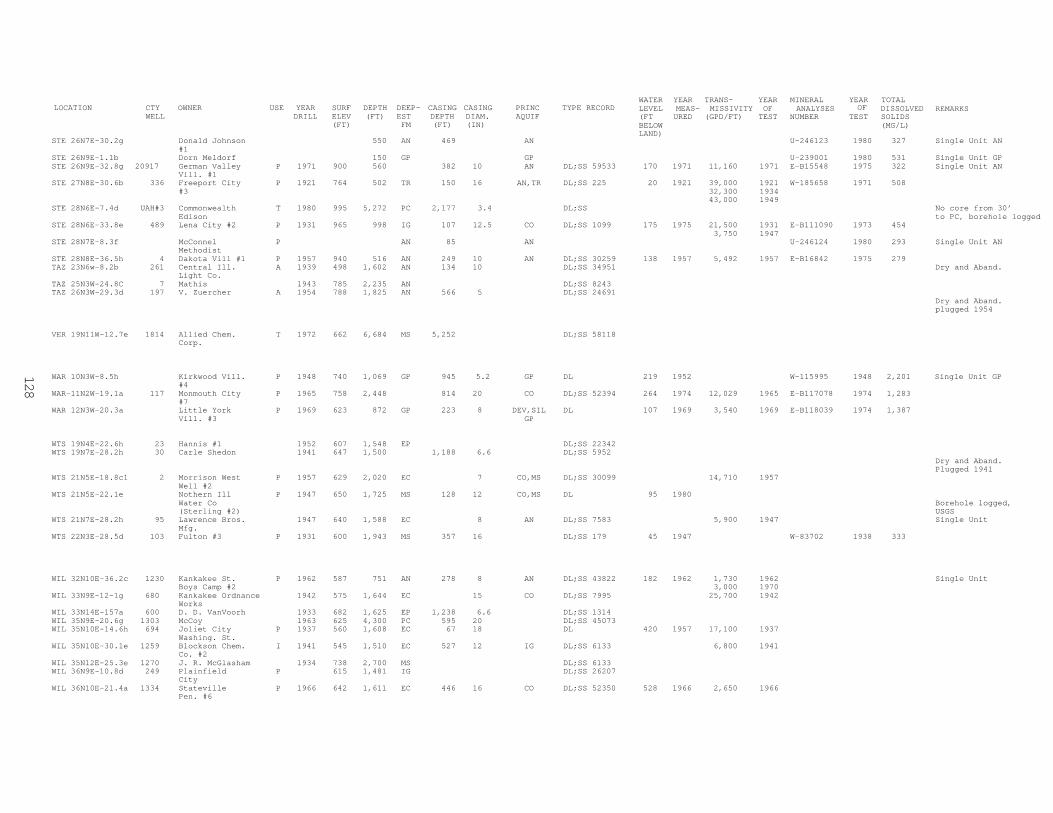
STE 26N7E-30.2g Donald Johnson 550 AN 469 AN U-246123 1980 327 Single Unit AN#1
STE 26N9E-1.1b Dorn Meldorf 150 GP GP U-239001 1980 531 Single Unit GPSTE 26N9E-32.8g 20917 German Valley P 1971 900 560 382 10 AN DL;SS 59533 170 1971 11,160 1971 E-B15548 1975 322 Single Unit AN
Vill. #1STE 27N8E-30.6b 336 Freeport City P 1921 764 502 TR 150 16 AN,TR DL;SS 225 20 1921 39,000 1921 W-185658 1971 508
#3 32,300 193443,000 1949
STE 28N6E-7.4d UAH#3 Commonwealth T 1980 995 5,272 PC 2,177 3.4 DL;SS No core from 30’Edison to PC, borehole logged
STE 28N6E-33.8e 489 Lena City #2 P 1931 965 998 IG 107 12.5 CO DL;SS 1099 175 1975 21,500 1931 E-B111090 1973 4543,750 1947
STE 28N7E-8.3f McConnel P AN 85 AN U-246124 1980 293 Single Unit ANMethodist
STE 28N8E-36.5h 4 Dakota Vill #1 P 1957 940 516 AN 249 10 AN DL;SS 30259 138 1957 5,492 1957 E-B16842 1975 279TAZ 23N6w-8.2b 261 Central Ill. A 1939 498 1,602 AN 134 10 DL;SS 34951 Dry and Aband.
Light Co.TAZ 25N3W-24.8C 7 Mathis 1943 785 2,235 AN DL;SS 8243TAZ 26N3W-29.3d 197 V. Zuercher A 1954 788 1,825 AN 566 5 DL;SS 24691
Dry and Aband.plugged 1954
VER 19N11W-12.7e 1814 Allied Chem. T 1972 662 6,684 MS 5,252 DL;SS 58118Corp.
WAR 10N3W-8.5h Kirkwood Vill. P 1948 740 1,069 GP 945 5.2 GP DL 219 1952 W-115995 1948 2,201 Single Unit GP#4
WAR-11N2W-19.1a 117 Monmouth City P 1965 758 2,448 814 20 CO DL;SS 52394 264 1974 12,029 1965 E-B117078 1974 1,283#7
WAR 12N3W-20.3a Little York P 1969 623 872 GP 223 8 DEV,SIL DL 107 1969 3,540 1969 E-B118039 1974 1,387Vill. #3 GP
WTS 19N4E-22.6h 23 Hannis #1 1952 607 1,548 EP DL;SS 22342WTS 19N7E-28.2h 30 Carle Shedon 1941 647 1,500 1,188 6.6 DL;SS 5952
Dry and Aband.Plugged 1941
WTS 21N5E-18.8c1 2 Morrison West P 1957 629 2,020 EC 7 CO,MS DL;SS 30099 14,710 1957Well #2
WTS 21N5E-22.1e Nothern Ill P 1947 650 1,725 MS 128 12 CO,MS DL 95 1980Water Co Borehole logged,(Sterling #2) USGS
WTS 21N7E-28.2h 95 Lawrence Bros. 1947 640 1,588 EC 8 AN DL;SS 7583 5,900 1947 Single UnitMfg.
WTS 22N3E-28.5d 103 Fulton #3 P 1931 600 1,943 MS 357 16 DL;SS 179 45 1947 W-83702 1938 333
WIL 32N10E-36.2c 1230 Kankakee St. P 1962 587 751 AN 278 8 AN DL;SS 43822 182 1962 1,730 1962 Single UnitBoys Camp #2 3,000 1970
WIL 33N9E-12-1g 680 Kankakee Ordnance 1942 575 1,644 EC 15 CO DL;SS 7995 25,700 1942Works
WIL 33N14E-157a 600 D. D. VanVoorh 1933 682 1,625 EP 1,238 6.6 DL;SS 1314WIL 35N9E-20.6g 1303 McCoy 1963 625 4,300 PC 595 20 DL;SS 45073WIL 35N10E-14.6h 694 Joliet City P 1937 560 1,608 EC 67 18 DL 420 1957 17,100 1937
Washing. St.WIL 35N10E-30.1e 1259 Blockson Chem. I 1941 545 1,510 EC 527 12 IG DL;SS 6133 6,800 1941
Co. #2WIL 35N12E-25.3e 1270 J. R. McGlasham 1934 738 2,700 MS DL;SS 6133WIL 36N9E-10.8d 249 Plainfield P 615 1,481 IG DL;SS 26207
CityWIL 36N10E-21.4a 1334 Stateville P 1966 642 1,611 EC 446 16 CO DL;SS 52350 528 1966 2,650 1966
Pen. #6
SOLIDS(MG/L)
REMARKSDISSOLVEDLOCATION CTYNUMBER
YEAROF
TEST
TOTALANALYSESOF
TEST
MINERALYEAR
WELLOWNER USE
(GPD/FT)MISSIVITY
URED
TRANS-MEAS-
LAND)
YEAR
BELOW(FTLEVELWATER
AQUIFTYPE RECORDPRINC
(IN)DIAM.CASING
(FT)DEPTHCASING
ESTFM
DEEP-DRILL (FT)
SURF DEPTHELEV(FT)
YEAR
128
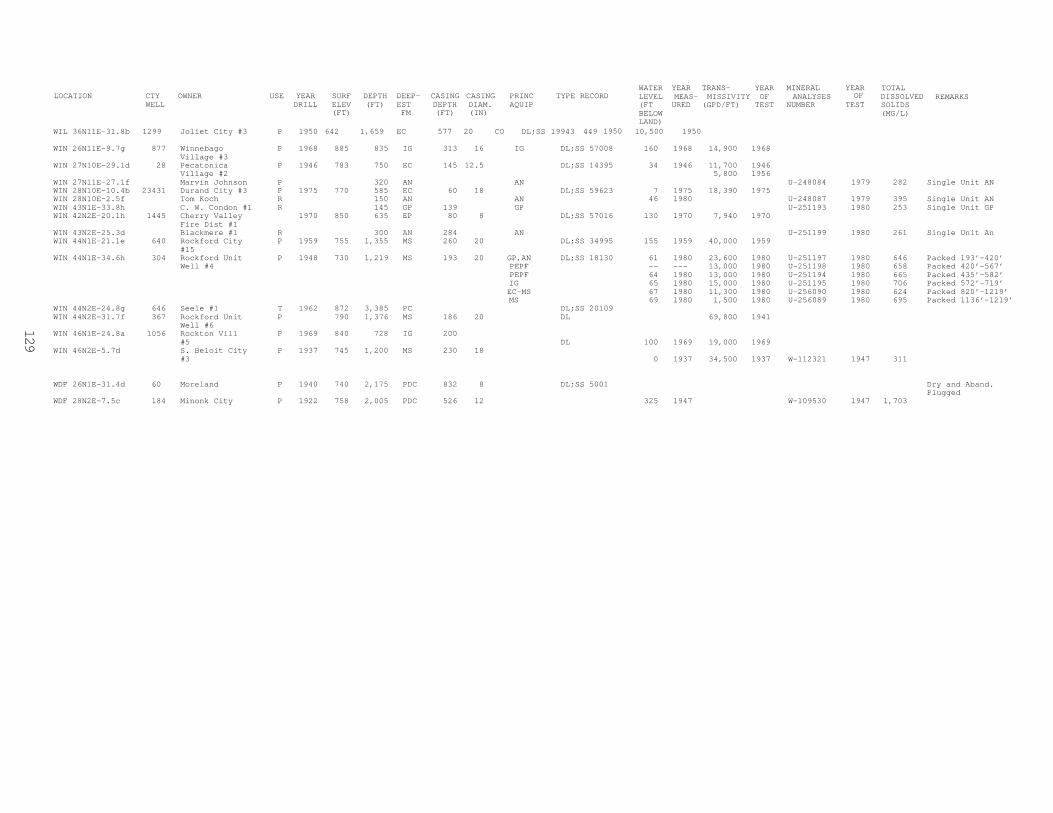
WIL 36N11E-31.8b 1299 Joliet City #3 P 1950 642 1,659 EC 577 20 CO DL;SS 19943 449 10,500 19501950
WIN 26N11E-9.7g 877 Winnebago P 1968 885 835 IG 313 16 IG DL;SS 57008 160 1968 14,900 1968Village #3
WIN 27N10E-29.1d 28 Pecatonica P 1946 783 750 EC 145 12.5 DL;SS 14395 34 1946 11,700 1946Village #2 5,800 1956
WIN 27N11E-27.1f Marvin Johnson P 320 AN AN U-248084 1979 282 Single Unit ANWIN 28N10E-10.4b 23431 Durand City #3 P 1975 770 585 EC 60 18 DL;SS 59623 7 1975 18,390 1975WIN 28N10E-2.5f Tom Koch R 150 AN AN 46 1980 U-248087 1979 395 Single Unit ANWIN 43N1E-33.8h C. W. Condon #1 R 145 GP 139 GP U-251193 1980 253 Single Unit GPWIN 42N2E-20.1h 1445 Cherry Valley 1970 850 635 EP 80 8 DL;SS 57016 130 1970 7,940 1970
Fire Dist #1WIN 43N2E-25.3d Blackmere #1 R 300 AN 284 AN U-251199 1980 261 Single Unit AnWIN 44N1E-21.1e 640 Rockford City P 1959 755 1,355 MS 260 20 DL;SS 34995 155 1959 40,000 1959
#15WIN 44N1E-34.6h 304 Rockford Unit P 1948 730 1,219 MS 193 20 GP,AN DL;SS 18130 61 1980 23,600 1980 U-251197 1980 646 Packed 193’-420’
Well #4 PEPF -- --- 13,000 1980 U-251198 1980 658 Packed 420’-567’PEPF 64 1980 13,000 1980 U-251194 1980 665 Packed 435’-582’IG 65 1980 15,000 1980 U-251195 1980 706 Packed 572’-719’EC-MS 67 1980 11,300 1980 U-256090 1980 624 Packed 820’-1219’MS 69 1980 1,500 1980 U-256089 1980 695 Packed 1136’-1219’
WIN 44N2E-24.8g 646 Seele #1 T 1962 872 3,385 PC DL;SS 20109WIN 44N2E-31.7f 367 Rockford Unit P 790 1,376 MS 186 20 DL 69,800 1941
Well #6WIN 46N1E-24.8a 1056 Rockton Vill P 1969 840 728 IG 200
#5 DL 100 1969 19,000 1969WIN 46N2E-5.7d S. Beloit City P 1937 745 1,200 MS 230 18
#3 0 1937 34,500 1937 W-112321 1947 311
WDF 26N1E-31.4d 60 Moreland P 1940 740 2,175 PDC 832 8 DL;SS 5001 Dry and Aband.Plugged
WDF 28N2E-7.5c 184 Minonk City P 1922 758 2,005 PDC 526 12 325 1947 W-109530 1947 1,703
129
SOLIDS(MG/L)
REMARKSDISSOLVEDLOCATION CTYNUMBER
YEAROF
TEST
TOTALANALYSESOF
TEST
MINERALYEAR
WELLOWNER USE
(GPD/FT)MISSIVITY
URED
TRANS-MEAS-
LAND)
YEAR
BELOW(FTLEVELWATER
AQUIPTYPE RECORDPRINC
(IN)DIAM.CASING
(FT)DEPTHCASING
ESTFM
DEEP-DRILL (FT)
SURF DEPTHELEV(FT)
YEAR
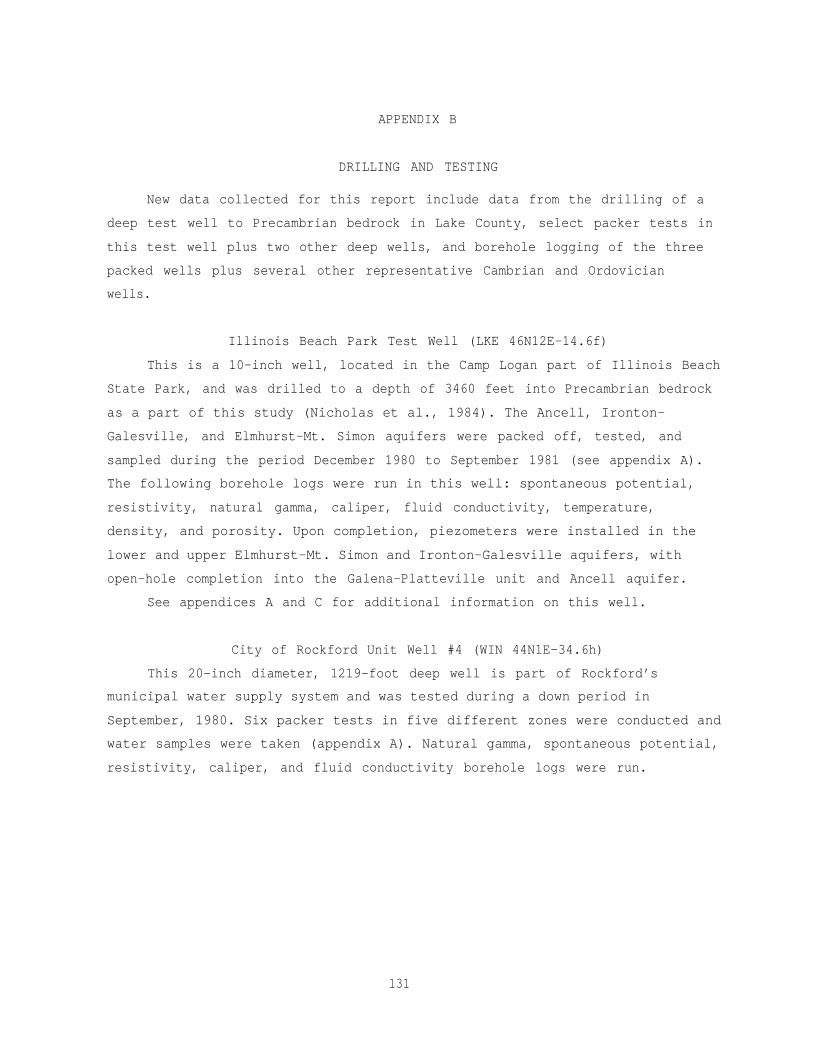
APPENDIX B
DRILLING AND TESTING
New data collected for this report include data from the drilling of a
deep test well to Precambrian bedrock in Lake County, select packer tests in
this test well plus two other deep wells, and borehole logging of the three
packed wells plus several other representative Cambrian and Ordovician
wells.
Illinois Beach Park Test Well (LKE 46N12E-14.6f)
This is a 10-inch well, located in the Camp Logan part of Illinois Beach
State Park, and was drilled to a depth of 3460 feet into Precambrian bedrock
as a part of this study (Nicholas et al., 1984). The Ancell, Ironton-
Galesville, and Elmhurst-Mt. Simon aquifers were packed off, tested, and
sampled during the period December 1980 to September 1981 (see appendix A).
The following borehole logs were run in this well: spontaneous potential,
resistivity, natural gamma, caliper, fluid conductivity, temperature,
density, and porosity. Upon completion, piezometers were installed in the
lower and upper Elmhurst-Mt. Simon and Ironton-Galesville aquifers, with
open-hole completion into the Galena-Platteville unit and Ancell aquifer.
See appendices A and C for additional information on this well.
City of Rockford Unit Well #4 (WIN 44N1E-34.6h)
This 20-inch diameter, 1219-foot deep well is part of Rockford’s
municipal water supply system and was tested during a down period in
September, 1980. Six packer tests in five different zones were conducted and
water samples were taken (appendix A). Natural gamma, spontaneous potential,
resistivity, caliper, and fluid conductivity borehole logs were run.
131
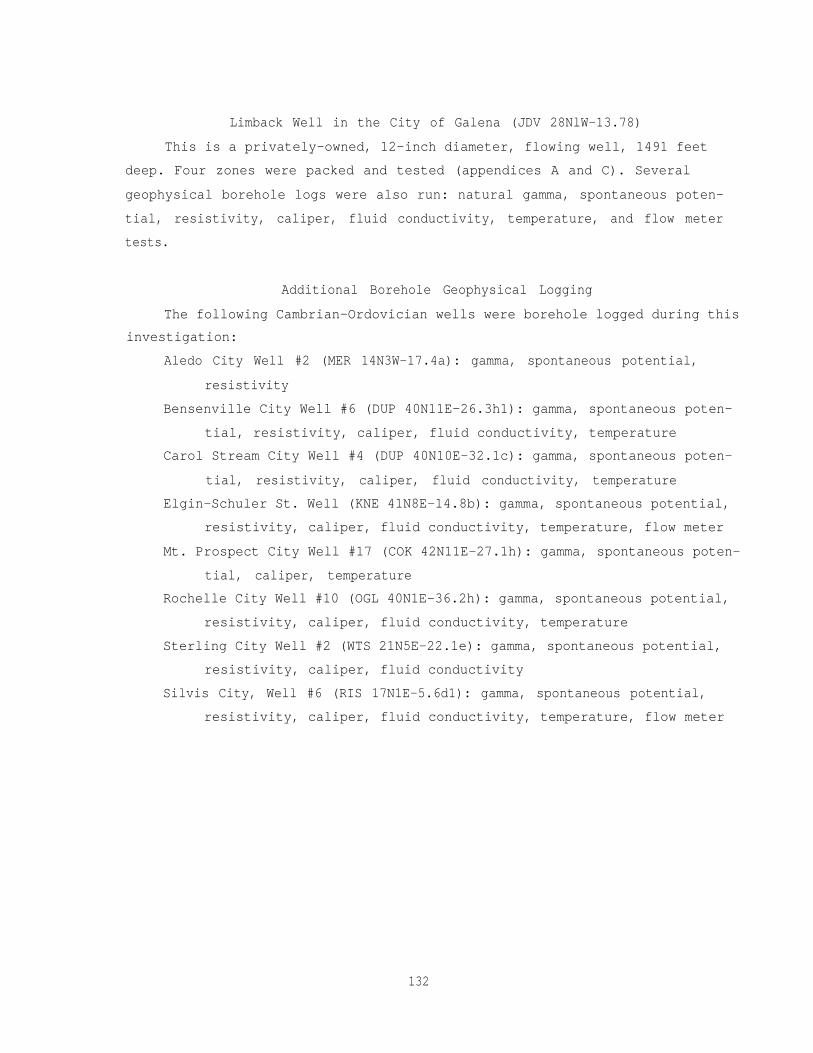
Limback Well in the City of Galena (JDV 28NlW-13.78)
This is a privately-owned, 12-inch diameter, flowing well, 1491 feet
deep. Four zones were packed and tested (appendices A and C). Several
geophysical borehole logs were also run: natural gamma, spontaneous poten-
tial, resistivity, caliper, fluid conductivity, temperature, and flow meter
tests.
Additional Borehole Geophysical Logging
The following Cambrian-Ordovician wells were borehole logged during this
investigation:
Aledo City Well #2 (MER 14N3W-17.4a): gamma, spontaneous potential,
resistivity
Bensenville City Well #6 (DUP 40N11E-26.3h1): gamma, spontaneous poten-
tial, resistivity, caliper, fluid conductivity, temperature
Carol Stream City Well #4 (DUP 40N10E-32.1c): gamma, spontaneous poten-
tial, resistivity, caliper, fluid conductivity, temperature
Elgin-Schuler St. Well (KNE 41N8E-14.8b): gamma, spontaneous potential,
resistivity, caliper, fluid conductivity, temperature, flow meter
Mt. Prospect City Well #17 (COK 42N11E-27.1h): gamma, spontaneous poten-
tial, caliper, temperature
Rochelle City Well #10 (OGL 40N1E-36.2h): gamma, spontaneous potential,
resistivity, caliper, fluid conductivity, temperature
Sterling City Well #2 (WTS 21N5E-22.1e): gamma, spontaneous potential,
resistivity, caliper, fluid conductivity
Silvis City, Well #6 (RIS 17N1E-5.6d1): gamma, spontaneous potential,
resistivity, caliper, fluid conductivity, temperature, flow meter
132
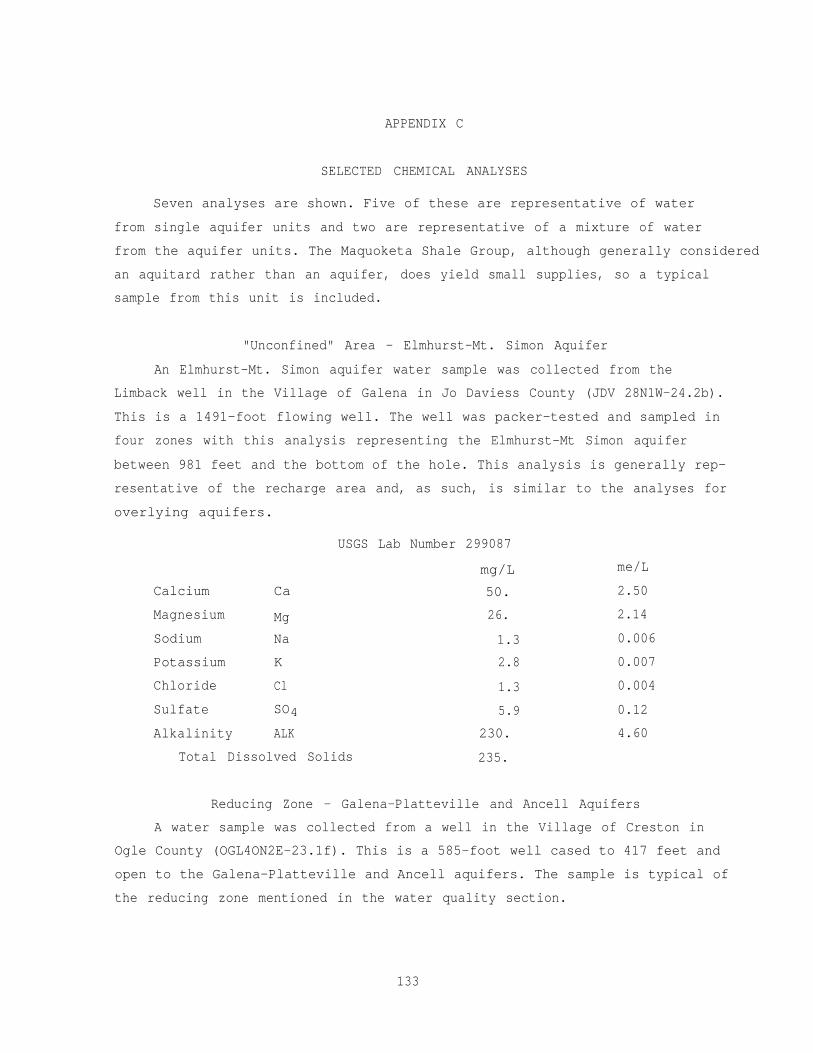
APPENDIX C
SELECTED CHEMICAL ANALYSES
Seven analyses are shown. Five of these are representative of water
from single aquifer units and two are representative of a mixture of water
from the aquifer units. The Maquoketa Shale Group, although generally considered
an aquitard rather than an aquifer, does yield small supplies, so a typical
sample from this unit is included.
"Unconfined" Area - Elmhurst-Mt. Simon Aquifer
An Elmhurst-Mt. Simon aquifer water sample was collected from the
Limback well in the Village of Galena in Jo Daviess County (JDV 28N1W-24.2b).
This is a 1491-foot flowing well. The well was packer-tested and sampled in
four zones with this analysis representing the Elmhurst-Mt Simon aquifer
between 981 feet and the bottom of the hole. This analysis is generally rep-
resentative of the recharge area and, as such, is similar to the analyses for
overlying aquifers.
USGS Lab Number 299087
mg/L
50.
26.
1.3
2.8
1.3
5.9
230.
235.
Calcium Ca
Magnesium Mg
Sodium Na
Potassium K
Chloride Cl
Sulfate SO4
Alkalinity ALK
Total Dissolved Solids
me/L
2.50
2.14
0.006
0.007
0.004
0.12
4.60
Reducing Zone - Galena-Platteville and Ancell Aquifers
A water sample was collected from a well in the Village of Creston in
Ogle County (OGL4ON2E-23.1f). This is a 585-foot well cased to 417 feet and
open to the Galena-Platteville and Ancell aquifers. The sample is typical of
the reducing zone mentioned in the water quality section.
133
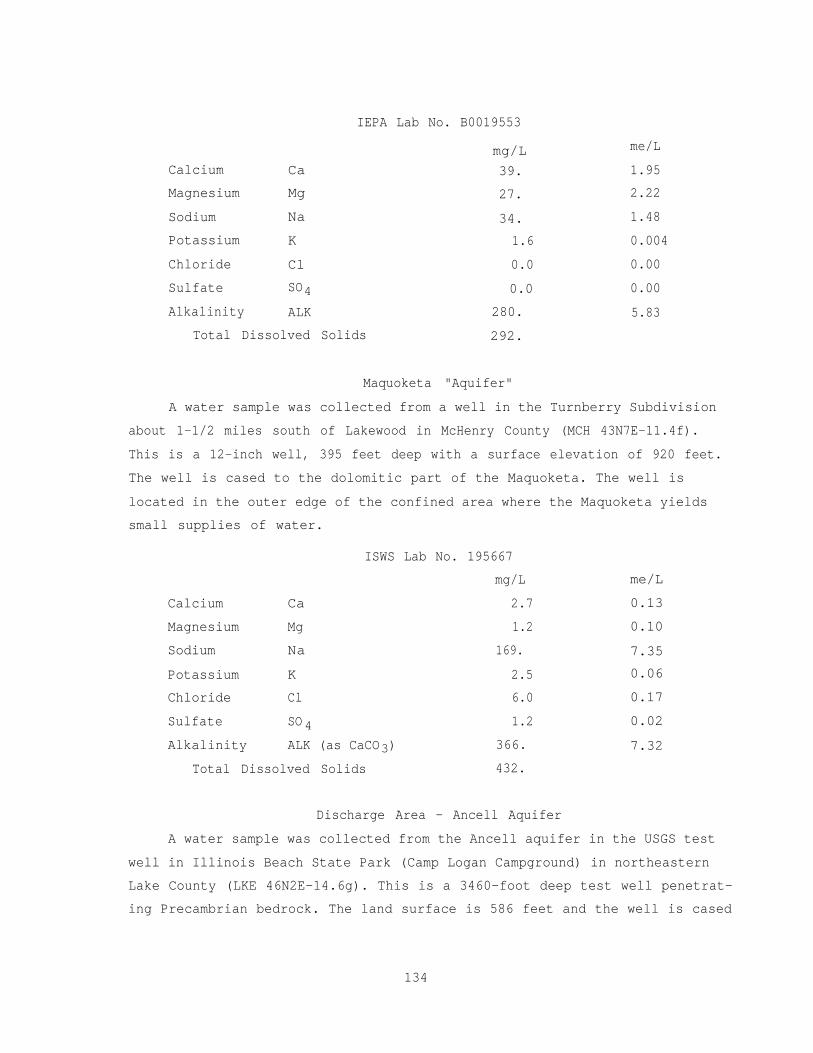
IEPA Lab No. B0019553
mg/L
Calcium Ca 39.
Magnesium Mg 27.
Sodium Na 34.
Potassium K 1.6
Chloride Cl 0.0
Sulfate SO4 0.0
Alkalinity ALK 280.
Total Dissolved Solids 292.
me/L
1.95
2.22
1.48
0.004
0.00
0.00
5.83
Maquoketa "Aquifer"
A water sample was collected from a well in the Turnberry Subdivision
about 1-1/2 miles south of Lakewood in McHenry County (MCH 43N7E-11.4f).
This is a 12-inch well, 395 feet deep with a surface elevation of 920 feet.
The well is cased to the dolomitic part of the Maquoketa. The well is
located in the outer edge of the confined area where the Maquoketa yields
small supplies of water.
ISWS Lab No. 195667
mg/L
Calcium Ca 2.7
Magnesium Mg 1.2
Sodium Na 169.
Potassium K 2.5
Chloride Cl 6.0
Sulfate SO4 1.2
Alkalinity ALK (as CaCO3) 366.
Total Dissolved Solids 432.
me/L
0.13
0.10
7.35
0.06
0.17
0.02
7.32
Discharge Area - Ancell Aquifer
A water sample was collected from the Ancell aquifer in the USGS test
well in Illinois Beach State Park (Camp Logan Campground) in northeastern
Lake County (LKE 46N2E-14.6g). This is a 3460-foot deep test well penetrat-
ing Precambrian bedrock. The land surface is 586 feet and the well is cased
134
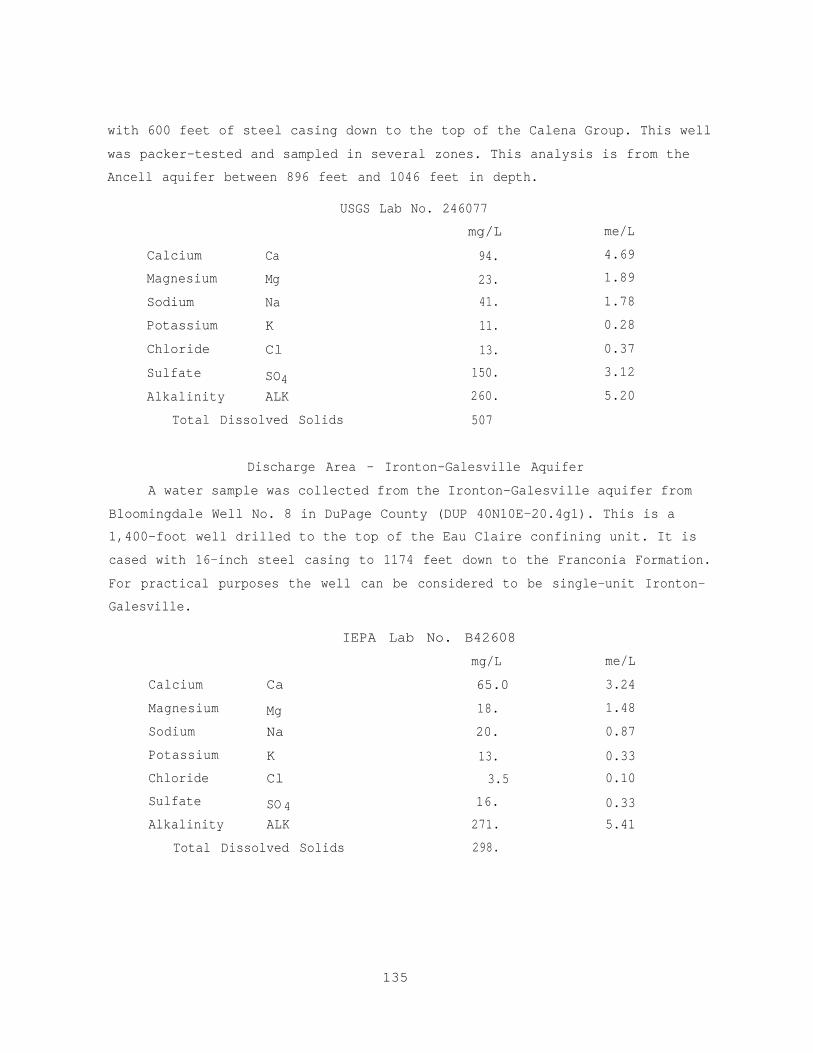
with 600 feet of steel casing down to the top of the Calena Group. This well
was packer-tested and sampled in several zones. This analysis is from the
Ancell aquifer between 896 feet and 1046 feet in depth.
USGS Lab No. 246077
Calcium Ca
Magnesium Mg
Sodium Na
Potassium K
Chloride Cl
Sulfate SO4Alkalinity ALK
Total Dissolved Solids
mg/L
94.
23.
41.
11.
13.
150.
260.
507
me/L
4.69
1.89
1.78
0.28
0.37
3.12
5.20
Discharge Area - Ironton-Galesville Aquifer
A water sample was collected from the Ironton-Galesville aquifer from
Bloomingdale Well No. 8 in DuPage County (DUP 40N10E-20.4g1). This is a
1,400-foot well drilled to the top of the Eau Claire confining unit. It is
cased with 16-inch steel casing to 1174 feet down to the Franconia Formation.
For practical purposes the well can be considered to be single-unit Ironton-
Galesville.
me/L
Calcium Ca
Magnesium Mg
Sodium Na
Potassium K
Chloride Cl
Sulfate SO 4Alkalinity ALK
Total Dissolved Solids
IEPA Lab No. B42608
mg/L
65.0
18.
20.
13.
3.5
16.
271.
298.
3.24
1.48
0.87
0.33
0.10
0.33
5.41
135
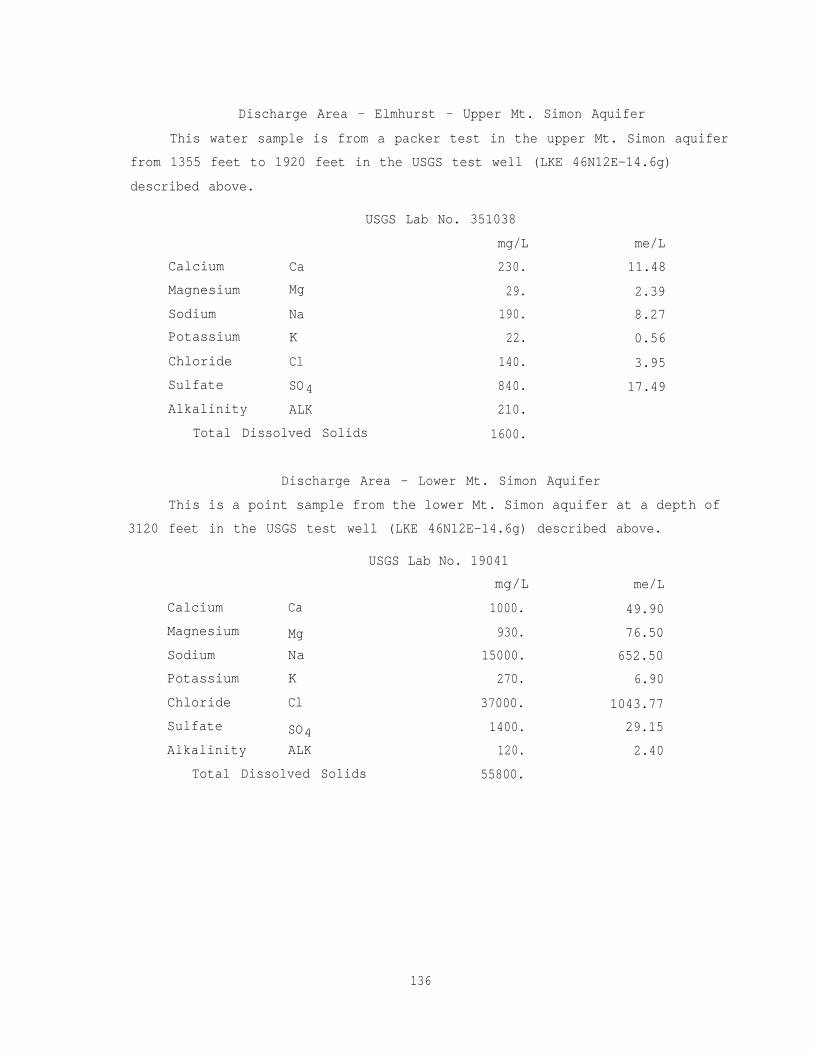
Discharge Area - Elmhurst - Upper Mt. Simon Aquifer
This water sample is from a packer test in the upper Mt. Simon aquifer
from 1355 feet to 1920 feet in the USGS test well (LKE 46N12E-14.6g)
described above.
USGS Lab No. 351038
mg/L
Calcium Ca
Magnesium Mg
Sodium Na
Potassium K
Chloride Cl
Sulfate SO4
Alkalinity ALK
Total Dissolved Solids
230.
29.
190.
22.
140.
840.
210.
1600.
me/L
11.48
2.39
8.27
0.56
3.95
17.49
Discharge Area - Lower Mt. Simon Aquifer
This is a point sample from the lower Mt. Simon aquifer at a depth of
3120 feet in the USGS test well (LKE 46N12E-14.6g) described above.
me/L
49.90
76.50
652.50
6.90
1043.77
29.15
2.40
Calcium Ca
Magnesium Mg
Sodium Na
Potassium K
Chloride Cl
Sulfate SO4Alkalinity ALK
Total Dissolved Solids
USGS Lab No. 19041
mg/L
1000.
930.
15000.
270.
37000.
1400.
120.
55800.
136