Embed Size (px)
Citation preview
Short Papers in Geology
Hydrology, and Topography
Articles 1-59 GEOLOGICAL SURVEY RESEARCH 1962
G E 0 L 0 G I CAL S U R V.E Y P R 0 FE S s· I 0 N A L P A P E R 4 5 0- B
_$_cfentific notes and summaries of investigations
prepared by members of the Geologic-' Wat~r
Resources-' and Topographic n~·visions in the fields
of geology-' hydrology-' topography-' and allied
sczences
UNITED STATES GOVERNMENT PRINTING OFFICE, WASHINGTON : 1962
UNITED STATES DEPARTMENT OF THE INTERIOR
STEWART· L. UDALL, Secretary
GEOLOGICAL SURVEY
Thomas B. Nolan, Director
For sale by the Superintendent of Documents, U.S. Government Printing Office Washington 25, D. C.
FOREWORD
This collection of 59 short papers on subjects in the fields of geology, hydrology, topography, and related sciences is one of a, series to be relea~ed during the year as chapters of Professional Paper 450. The papers in this chapter report on the scientific and economic· results of current work by members of the Geologic, Topographic, and 'Vater Resources Division of the United States Geological Survey. Some of the pa.pers annom1ce new discoveries or present observations on problems of limited scope; other papers draw conclusions from more extensive or continuing investigations that in large part will be discussed in greater detail in reports to be published in the future.
Chapter A of this series, to be published later in the year, will present a synopsis of results from a wide range of work done during the present fiscal year. ·
THOl\rAs B. NoLAN, Director.
rn
CONTENTS P~i:ge
Foreword---------------------------------------~----------------------------------------------------------- JU
GEOLOGIC STUDIES Economic geology
l. Stratigraphic and structural controls of mineralization in the Taylor mining district near Ely, Nevada, by Harald Drewes----~-----~-------------------------------------------------------------------------------- B-1 .;
2. Suggestions for prospecting in the Humboldt Range and adjacent areas, Nevada, by Robert E. Wallace and Donald B. Tatlock---------~----------------------------------------------------------------------- 3 I'
Structural geology 3. Possible detachment faults in the Teepee Creek quadrangle, Gallatin County, Montana, by Irving J. Witkind __ _ 6 4. Hydrogeologic evidence of the extension of the E~;tst Range fault, Humboldt and Pershing Counties, Nevada,
by Philip Cohen--------------------------------------~----------------------------~--------------- 9 ......,.,
Stratigraphy 5. · Old metavolcanic rocks of the Big Creek area, central Idaho, by B. F. Leonard ____________________________ _ 11 6. Angular unconformity between Mesozoic and Paleozoic rocks in the northern Sierra Nevada, California, by L. D.
Clark, R. W. Imlay, V. E. McMath, and N.J. Silberling ______________________________________________ _ 15 .... 7. Mesozoic age of metamorphic rocks in the Kings River area, southern Sierra Nevada, California, by James G.
Moore and Franklin C. Dodge _____________________________________________________________________ _ 19 .. 8. Red Bird Silty Member of the Pierre Shale, a new stratigraphic unit, by James R. Gill and William A. Cobban_ 21 9. Note on post-Rustler red beds of Permian age of southeast New Mexico and west Texas, by James B. Cooper__ 24
10. Volcanic rocks of Oligocene age in the southern part of the Madison Range, Montana and Idaho, by Warren Hamilton and Estella B. Leopold _______ -·- __________________________________________________________ _ 26
11. Radiocarbon dates relating to a widespread volcanic ash deposit, eastern Alaska, by Arthur T. Fernald ________ "' 29
Sedimentation and sedimentary petrology 12. Origin of spherulitic phosphate nodules in bas.al Colorado Shale, Bearpaw Mountains, Montana, by W. T. Pecora,
B. C. Hearn, Jr., and Charles Milton ________________________________________________________________ _ 30 13. Stream directions in the Lakota Formation (Cretaceous) in the northern Black Hills, Wyoming and South Dakota,
by William J. Mapel and Charles L. Pillmore---------------------------------------------------------- 35 14. Formation and depositton of clay balls, Rio Puerco, New Mexico, by Carl F. Nordin, Jr., and William F. Curtis ___ ' 37 15. Estimating porosity from specific gravity, by Philip Cohen _______________________________________________ _ 41 16. Relation of volumetric shrinkage to clay content of sediments from the San Joaquin Valley, California, by A. I.
Johnson and D. A. Morris __________________ ----_-- ___ -- ___ --- ___ -- ___________________ - ____ -- _______ _ 43 /
Geomorphology 17. Lower Pleistocene Prairie Divide Till, Larimer County, Colorado, by D. V. Harris and R. K. Fahnestock _____ _ 45 18. Late Pleistocene and Recent erosion and alluviation in parts of the Colorado River system, Arizona and Utah, by
Maurice E. Cooley ____ - ____________________ ------_----------_-_------- ____ - _________ -------_---- __ _ 48 19. Relation of alluvial-fan size and slope to drainage-basin size and lithology in western Fresno County, California, by
Willia1n B. Bull ___________________________________________________________________________________ _ 51 20. Recent growth of Halemaumau, Kilauea Volcano, Hawaii, by Donald H. Richter, James G. Moore, and Robert .,..
T. Haugen---------------------------------------------------------------------------------------- 53
Paleontology
21. Marginal sea of middle Eocene age in New Jersey, by Stephen M. Herrick __ ------.-------------------------- 56 22. Recent discoveries of the Cretaceous ammonite Haresiceras and their stratigraphic significance, by William A.
Cobban------------------------------------------------------------------------------------------- 58 23. Triassic fossils from the southern Klamath Mountains, California, by N . .J. Silberling and W. P. Irwin _________ _ 60
Geophysics 24. Thermal regime in the raised delta of Centrum S~, northeast Greenland, by Daniel B. Krinsley _______________ _ 62 25. Magnetic anomalies· and ultramafic rock in northern California, by William P. Irwin and Gordon D. Bath _____ _ 65
Mineralogy, geochemistry, and petrology 26. Vanadium-rich garnet from Laguna, New Mexico, by Robert H. Moench ______ ... ____________________________ _ 67 27. Thorium and uranium in some alkalic igneous rocks from Virginia and Texas, by David Gottfried, Roosevelt Moore,
and Alice Caemmerer __ -~- ______________ · __________________________________________ ------ ___________ _ 70 28. Saline features of a small ice platform in Taylor Valley, Antarctica, by Warren Hamilton, Irving C. Frost, and
l)hilip T. Hayes _________________________________________________________________________ -:-. ________ _ 73
v
VI CONTENTS
Analytical and petrographic methods Page
B-76 78
"--29. Index of refraction measurements of fused Hawaiian rocks, by D. B. Stewart _______________________________ _ 30. Determination of silica· in tektites and similar glasses by volatilization, by Maxwell K. Carron and Frank Cuttitta_ 31. Use of La20a as a heavy absorber in the X-ray fluorescence analysis of silica rocks, by Harry J. Rose, Jr., Isidore
Adler, and. Francis J. Flanagan ______________________________________________________________________ _
32. X-ray fluorescence determination of thallium in manganese ores, by Harry J. Rose, Jr., and Francis J. Flanagan_
Oceanography 33. Electrode determination of the carbon dioxide content of sea water and deep-sea sediment, by G. W. Moore, C. E.
Roberson, and H. D. Nygren _______________________________________________________________________ _
HYDROLOGIC STUDIES Ground water
80 82
83
34. Transitory movements of the salt-water front in an extensive artesian aquifer, by Harold R. Henry_____________ 87 35. Estimating the effects of stream impoundment on ground-water levels, by J: E. Reed and M·. S. Bedinger_______ 88 36. Movement of ground water beneath the bed of the Mullica River in the Wharton Tract, southern New Jersey,
by S. M. Lang and E. C. RhodehameL _ _ _ _ _ _ _ _ _ _ _ _ _ _ _ _ _ _ _ _ _ _ _ _ _ _ _ _ _ _ _ _ _ _ _ _ _ _ _ _ _ _ _ _ _ _ _ _ _ _ _ _ _ _ _ _ _ _ _ _ _ _ _ 90
37. Movement of perched ground water in alluvium near Los Alamos, New Mexico, by J. H. Abrahams, Jr., E. H. Baltz, and W. D. Purtyman_ _ _ __ _ _ _ ___ _ _ _ _ _ __ __ __ _ _ _ _ _ _ _ _ _ _ _ _ _ _ _ _ __ _ _ _ _ _ _ _ _ _ _ _ _ ___ _ ___ _ __ _ _ _ _ _ _ _ _ _ _ _ 93
38. Source of ground-water runoff at Champlin Creek, Long Island, New 'York, by E. J. Pluhowski and I. H. Kantrowitz ____________________________________ :. __ ,... _________________________ .. ______________________ 95
39. Relation of faulting to the occurrence of ground water in the Flagstaff area, Arizona, by J. P.. Akers____________ 97 40. Method for measuring upward leakage from artesian aquifers using rate of salt-crust accumulation, by J. H. Feth
and R. J. Brown---------------------~------------------------------------------------------~------ 100 41. Seasonal temperature changes in wells as indicators of semi confining beds in valley-train aquifers, by Stanley E.
Norris and Andrew M. Spieker __________________________________________________________________ ----·-_ 101
42. Temperature-depth relations in wells as indicators of semi confining beds in valley-train aquifers, by Stanley E: Norris and Andrew M. Spieker_______________________________________________________________________ 103
43. Water-yielding potential of weathered crystalline rocks at the Georgia Nuclear Laboratory, by J. W. Stewart____ 106 44. Use of inflatable packers in multiple-zone testing of water wells, by F. C. Koopman, J. H. Irwin, and E. D. Jenkins 108
Surface water 45. Estimating days of continuously deficient discharge, by C. H. Hardison and J. R. Crippen ___________________ _
"'-46. Determination of tide-affected discharge of the Sacramento River at Sacramento, California, by S. E. Rantz ___ _ 47. Points of origin of_perennial flow in Georgia, by William J. Schneider_ ____________________________________ _
Quality of water 48. Determination of boron in waters containing fluoride, by Jack J. Rowe ____________________________________ _ 49. Limitations of the methylene blue method for ABS determination, by Cooper H. Wayman ____________ . _____ _ 50. Hydrochemical facies in the "400-foot" and "600-foot" sands of the Baton Rouge area, Louisiana, by C. 0. Morgan
and M. D. Winner, Jr _____________________________________________________________________________ _ 51. Cation hydrochemical facies of ground water in the Englishtown Formation, New Jersey, by Paul R. Seaber ___ _ 52. Use of Na/Cl ratios to distinguish oil-field from salt-spring brines in western Oklahoma, by A. R. Leonard and
P. E. Ward----------------------------------------------------------------------------------------53. Relation between aluminum content and pH of water, Beaver Creek strip-mining area, Kentucky, by George
110 Ill 113
114 117
120 124
126
W. Whetstone and John J. Musser___________________________________________________________________ 127 54. Chemical quality of surface waters in the Brazos River basin, Texas, by Burdge Irelan and H. B. Mendietta_____ 129 55. Chemical quality of ground water in St; Thomas, Virgin Islands, by I. G. Grossman--------------------'------ 131
TOPOGRAPHIC STUDIES Photogrammetry
56. A test of the direct geodetic restraint methoq of analytical aerotriangulation, by Robert C. Eller and Morris L. McKenzie_------------------------------------------------------------------------------------------
57. Research activity with the U-60 orthophotoscope, by Marvin B. Scher _____________________________ · _____ ----
Field control
133 135
58. Research on target design for photoidentification of control, by David Landen __ ~_____________________________ 137 59. New elevation meter for topographic surveys, by Julius L. Speert____________________________________________ 141
INDEXES
Subject------------------------------------------~-------------------------------------------------------- 143 Author------------------------------------------------------------------------------------~-------------- 145
..
~· .
...
GEOLOGICAL SURVEY RESEARCH 1962
SHORT PAPERS IN GEOLOGY, HYDROLOGY, AND TOPOGRAPHY, ARTICLES 1-59
GEOLOGIC STUDIES
ECONOMIC GEOLOGY
1. STRATIGRAPHIC AND STRUCTURAL CONTROLS OF MINERALIZATION IN THE TAYLOR MINING ,DISTRICT NEAR ELY, NEVADA
By HARALD DREwEs, Denver, Colo.
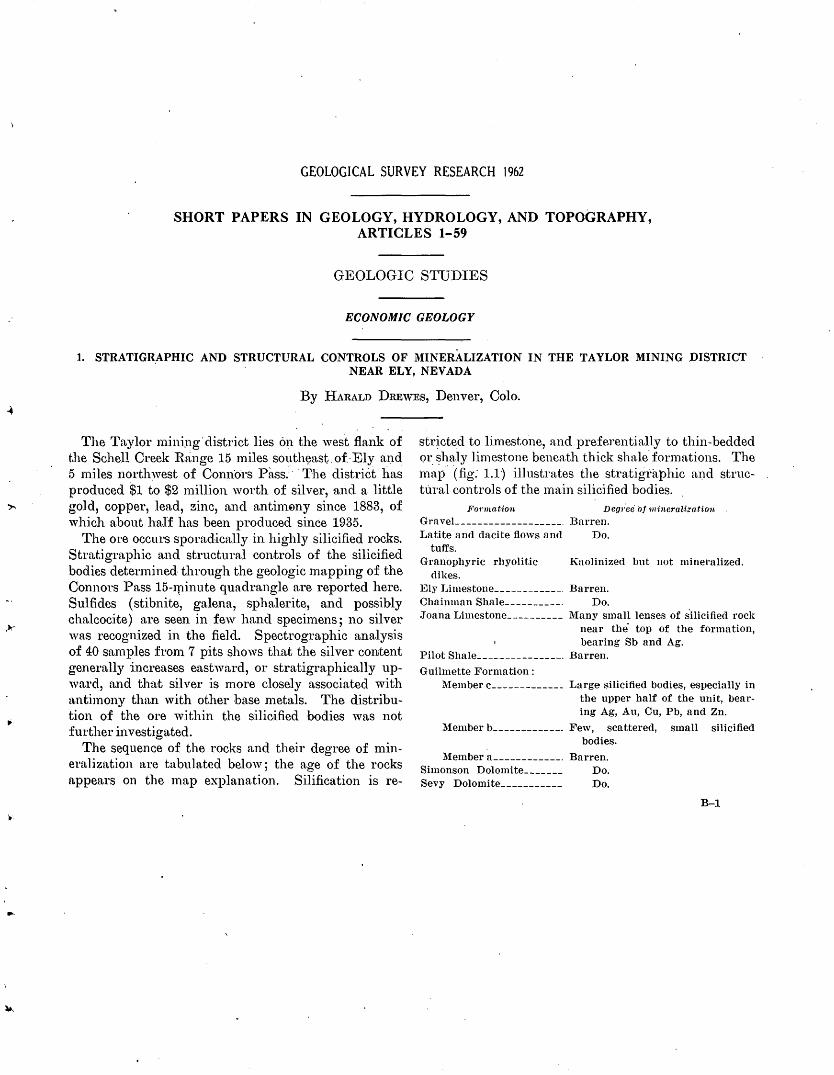
The Taylor minipg ·district lies on the west flank of the Schell Creek R~inge 15 miles soutlwast of.· Ely ai).d 5 miles nortlnvest of Connors Pass; · The district lias produced $1 to $2 million worth of silver, and a little gold, copper, lead, zinc, and anti1n~ny since 1883, of which about half has been produced since 1935.
The ore occurs sporadically in highly silicified rocks. Stratigraphic and structural controls of the silicified bodies determined through the geologic mapping of the Connors Pass 15-Ipinute quadrangle are reported here. Sulfides ( stibnite, galena, sphalerite, and possibly chalcocite) are seen in few hand specimens; no silver wn,s recognized in the field. Spectrographic analysis of 40 sn,mples fr01n 7 pits shows that the silver content generally increases eastward, or stratigraphically upward, and that silver is more closely associated with n.ntimony than with other base n1etals. The distribution of the ore within the silioified bodies was not further investigated.
The sequence of the rocks and their degree of mineralization a.re tabulated below; the age of the rocks appears on the map explanation. Silification is re-
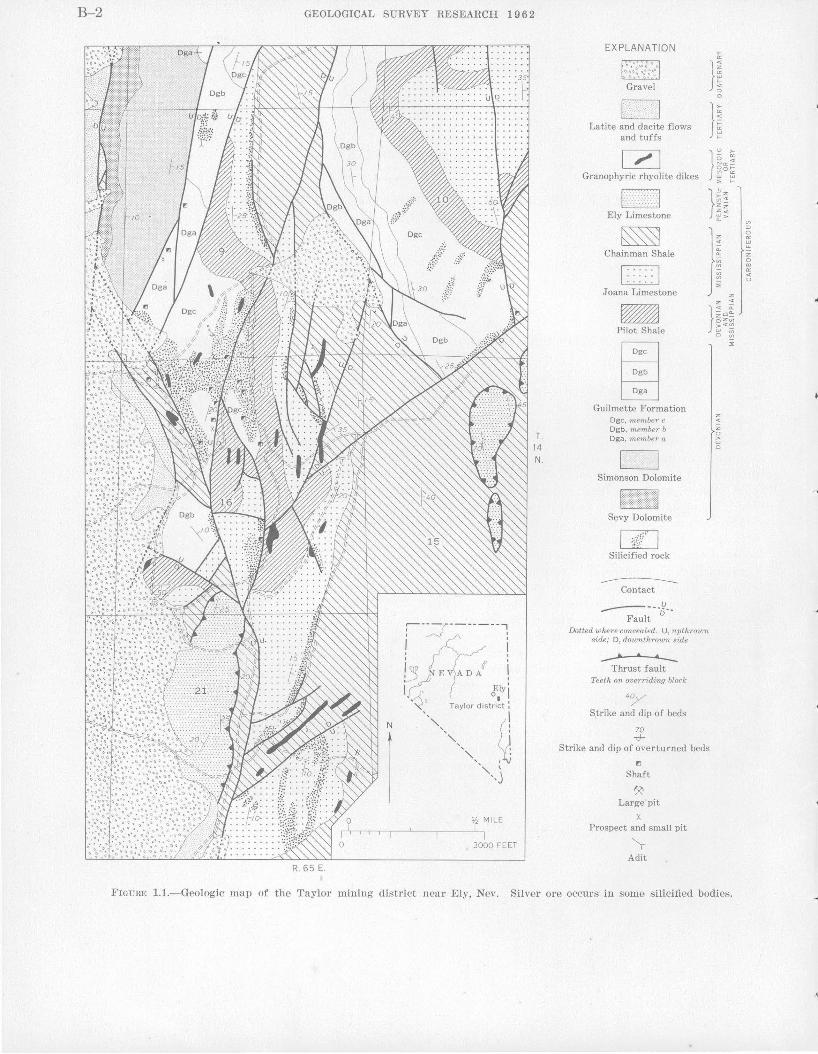
str~cted to limestoi1e, and preferentially to thin-bedded or. ~haly limestone beneath thick shnJe. formations. The map· (fig: 1.1) illustrates the stratigdtphic m)d structtl.ral controls of the main silicified bodies.
Fonna.tion Deg·r.ee· oj mi.neralization
GraveL------------------· Barren. Latite and dacite flows and Do.
tuffs. Granophyric rhyolitic
dikes. Kaolinized but not mineralized.
Ely Limestone ____________ , Barren. Chainman Shale___________ Do . . Joana T..~imestone __________ Many small lenses of silicified rock
near the· top of the formation, bearing Sb and Ag.
Pilot Shale ________________ Barren.
Guilmette Formation: Member C------------- Large silicified bodies, especially in
the upper half of the unit, bearing Ag, Au, On, Pb, and Zn.
Member b------------- Few, scattered, small silicified bodies.
Member a------------· Barren. Simonson Dolomite_______ Do. Sevy Dolomite___________ Do.
B-1
B-2 GEOLOGICAL SURVEY RESEARCH 1 9 6 2
R. 65 E.
T. 14 N.
EXPLANATION
Gravel
Latite and dacite flows and tuffs
[2] Granophyric rhyolite dikes
Ely Limestone
Chainman Shale
Joana Limestone -Pilot Shale
Guilmette Formation Dgc, member c Dgb, member b Dga, member a
Simonson Dolomite
Sevy Dolomite
ULJ Silicified rock
-----Contact
-------6--Fault
Dotted where concealed. U, upthrown side; D, downthrown side
~ Thrust fault
Teeth on overriding block
4~
S,trike and dip of beds
70 +
>a::
n
z <(
z
~ 0
Strike and dip of overturned beds
l"l
Shaft
~ Large pit
X Prospect and small pit
y Adit
FIGURE 1.1.- Geologic map of the Taylor mining dis trict near Ely, Nev. Silver ore occurs in some silicified bodies.
...
...
ARTICLE 2 B-3
The silicified limestone is in part localized along normal faults that trend north to northeast and have displacements of a. few tens of feet to several hundreds of feet. Silicified rock along these faults is locally sheared. Much smaller silicified bodies are found elsewhere in the quadrangle where norm.al faults of similar trend cut only the 1niddle or middle and lower plates of the three rna.jor thrust plates, and the bodies are probably contemporaneous with the thrusting. A postm.inernJization normal fault with many hundreds to possibly several thousands of feet of .displacement trends northwest close to the foot of the range and brings young unmineral.ized rocks down against older mineralized rocks.· At least smne of the movement on th1s fault postdates the latite and dacite flows and related sediments, probably of middle Tertiary age, found along the edge of the valley. ~fany thick, short rhyolitic dikes with northerly and
northeasterly strikes n.re concentrated in the Taylor district, suggesting that they are related to the mineralizn.tio.n. The feldspars of all the dikes are strongly kaolinized, but none of the dikes are strongly silicified
or mineralized. The concentration of dikes near the mineralized bodies and the parallelism between many dikes, older faults, and silicified bodies suggests that· the stresses in the rocks were similar during formation of the dikes and m_ineralized bodies, and that the silicification and the emplacement of the dikes took place at about the same time. The dikes are porphyritic, with phenocrysts of quartz, unlike that· of the nearby rhyolitic volcanic rocks. The dikes may be re]a;ted. to other porphyry intrusive bodies accompanied by mineralization in eastern Nevada.
In conclusion, the ore-bea.ring silicified bodies are localized near the tops of the Guilmette Formatimi and the Joana Limestone and along nonnal faults. The same horizons in adjacent downfaulted blocks, and shaly limestone in the n1iddle member and at the base of the. lower member of the Guilmette Formation in the mineralized area, should be explored. The rhyolitic dikes are concentrated near the mineralized bodies and are probably related to them temporally, and possibly genetically.
2. SUGGESTIONS FOR PROSPECTING IN THE HUMBOLDT RANGE AND ADJACENT AREAS, NEVADA
By RoBERT E. WALLACE and DoNALD B. TATLOCK, Menlo Park, Calif.
Work done in cooperation with the Nevada Bm·ea1t of Mines
During recent geologic investigations in the Humboldt Range, northwestern Nevada, we found that for many of the mineral deposits, a distinctive geologic setting can be defined that should serve as a guide in the search for additional deposits both in the Humboldt Range and in neai"by localities of similar geologic setting. In the following suggestions for prospecting, broad geologic areas are primarily defined, and within these areas ·locnl structures must be considered.
The geologic structures and lithologic units of the range that are referred to in this article are shown on preliminary geologic maps of the Buffalo Mountain quadrangle (vV all ace and others, 1959) and of the Unionville qua.draJ1gle (vVallace and.others, 1962; Wallace and others, 1960, fig. 133.1, p . .B292). These maps are a necessary adjunct to the following discussion.
Silver.-The Weaver Rhyolite and immediately un-
derlying parts of the Rochester Rhyolite are the host rocks for the Rochester and Pa,ckard silver districts (l{nopf, 1924). In addition, the larger bodies of rhyolite porphyry, which are believed to be feeders for the 'Veaver Rhyolite, commonly have silver related to them. This type of mineralization is believed to be genetically rehtted to the igneous rocks and thus is of Permia11 ( ~) or Early Triassic age.
In prospecting, pay special attention to the Weaver Rhyolite and the rhyolite porphyry stocks that are in a. crude line between South American Canyon a.nd Unionville. The silver minerals characteristic of the area are difficult to identify by naked eye and commonly are "in rather indistinct silicified zones in the rhyolite .. Without thorough testing, such silver-bearing zones may easily be overlooked. Best values are probably within a few hundred feet of the surface .
B-4 GEOLOGICAL SURVEY RESEARCH 1 9 6 2
Silver-scheelite.-A distinctive type of deposit containing conspicuous quartz veins, which in turn conta.in 'inconspicuous silver minerals and sparse scheelite, is found in the Prida Formation of Middle Triassic age. This is a limy unit resting on volcanic rocks of the l{oipato Group. The Arizona (Cameron, 1939), Rye Patch (Ransome, 1909, p. 43-44) and Relief (Schrader, 1915, p. 362) mines characterize this type of deposit. The possibility exists that the silver in these deposits was remobilized from Permian ( ? ) and Early Triassic deposits by igneous activity in Late Jurassic or Early Cretaceous time.
The entire outcrop band of the Prida Formation warrants prospecting for this type of deposit, but exam.ine particularly the limestone ·adjacent to or near rhyolite porphyry intrusive bodies of Weaver Rhyolite.
Scheelite-beryl-fluorite.-Scheelite deposits throughout Pershing and Humboldt Counties are related to granitoid rocks generally of granodioritic or· quartz monzonitic composition of Late .Jurassic or Early Cretaceous age that have intruded limestone bodies. The Little (Oreana) tungsten deposits (Kerr, 1938; Vitaliano, 1944) on the west flank of the Humboldt Range are characteristic and are in veins in limestone near quartz monzonite and related aplite bodies. I-Iigh-grade pods have formed in limestone immediately below metadiorite sills. Beryl, and in some places fluorite, occupies the same or similar veins in the same setting.
Limestone bodies intruded hy granodiorite or quartz monzonite should be examined for scheelite by ultraviolet light. In addition, the combination of beryl, fluorite, and scheelite suggests a similarity to the Mt. Wheeler mine (Stager, 1960; Whitebread and Lee, 1961) where beryl and less conspicuous beryllium minerals such as phenacite have been found. The search for less conspicuous beryllium deposits may require sp~cial techniques such as use of a bery llometer.
Lode gold.--Quartz veins containing native gold ·are related to the swarms of rhyolite porphyry dikes in the headwaters of Limerick, Sacramento, Spring, North American, and South American Canyons (Knopf, 1924, p. 51-52; Schrader, 1915, p. 354). The veins are generally not in the rhyolite porphyry dikes but are in the same host rocks as the rhyolite porphyry dikes.
Any quartz vein cutting the Limerick Greenstone or the Rochester Rhyolite in the general vicinity of rhyolite porphyry intrusive bodies should be considered a potential gold prospect.
Placer gold.-Drainage channels that cross potential lode-gold areas may contain placer gold. For example, Limerick, Spring, and North and South American Canyons (Knopf, 1924, p. 58; Schrader, 19·15, p. 368) are known to contain placer gold.
Situations where several stages of concentration might have occurred, for example channels within channels, offer better than average possibilities of successful prospecting.
Cinnabar and st-ibnite.-Cinnaba.r and stibnite deposits are believed to be related to late Tertiary and Quaternary basin-range faults that blocked out the range. It is also believed that the main deposits were formed during an early part of this period of faulting, perhaps at about the same time that basaltic and andesitic lavas were extruded. Bailey and Phoenix ( 1944, p. 29) point out, however, that basalt itself has not proved. to be a good host rock and that cinnabar deposits in the more rec-ently active fault zones, commonly accompanied by hot springs, have not proved to be of economic value.
The lower flanks and margins of the range are promising for prospecting, particularly those flanks on which both limy formations and basalt flows are found; the part of the flank basin ward from faults of late Tertiary age, such as the Fitting fault, is particularly promising. 'Vi thin such· geologic settings, more detailed prospecting guides, such as rock alteration (Bailey and Phoenix. 1944, p. 29), may be helpful.
/ron.-Magnetite and hematite are clearly related to large altered dioritic bodies and to associated andesitic rocks throughout much of Nevada (Reeves and J(ral, 1955). There is growing evidence that these may be of Early Cretaceous or possibly Late Jurassic age. The magnetite an9, hematite are in veins and in disseminated masses through the diorite. The trends of iron-bearing veins in the Buena Vista Hills area of Pershing County are somewhat random.
Dioritic and andesitic bodies of Mesozoic age should receive attention in prospecting. Within these bodies additional iron deposits 1night be revealed by magne~c and gravity surveys, both where these bodies crop out, and where. these rocks might be concealed by basin fill Gravity anomalies might reveal nonmagnetic hematite bodies.
Li1nestone.-Analyses. of limestone of tl1e Prida and Natchez Pass Formations of Middle and Late Triassic age suggest large limestone bodies of sufficient quality for Portland cement. Samples containing as much as 55 percent CaO, less than 0.2 percent Si02, and less than 0.5 percent MgO have been found.
Inasmuch as there appear to be large quantities of limestone of cement quality, the economic considera
. tions of transporta!ion, fuel, and ease of quarrying must receive attention before any part of the limestone is selected for detailed testing.
Perlite.-N umerous bodies of perlite were found in the lower part of the rhyolite flows and tuffs of Tertiary
''
ARTICLE 2 B-5
age. At least one such body is being 1nined in the Trinity Range.
The contact between Tertiary rhyolite and underlying rocks in the 'Vest IIumboldt and Trinity Ranges warrants prospe~ting.
/i,,valJO'rites.-The basins around the IIumboldt Range contain halite and conceivably may contain other evapOI'ites such as borates. Relatively little is know1i. of the buried deposits in the basins, although one hole was drilled in Carson Sink during the search for potash before the first 'Vorld 'Var (Gale, 1911). D. F. Hewett (oral communication) has found that boron is more abundant in hot springs of western Nevada than in hot springs of eastern Nevada, and this fact together with the relative abundance of boron aluminum silicates such ns tour.maJine and dumortierite in the I-Iumboldt Hange is suggestive of a boron-rich province. Gravity studies by Don M:abey of the U.S. Geological Survey (written comnu1nication, 1960) indicate that the basin fill is at least 8,000 feet thick in Buena Vista Valley nnd more than 4,000 feet thick between the Humboldt River HJld the west fta.nk of the Humboldt Range in the vicinity of Rye Patch.
Too little is known of the geologic history of the bn.sins to suggest which locality is most favorable for prospecting.
Sand and g1·avel.-Along the borders of ancient Lake Lahontan, which occupied the basins around the H;runboldt. Range, mn.ny beaches and bars were f9rmed that contn.in wn.ve-sorted gravel and sand. During lowWit-ter levels and n.fter the lake had. completely dried up, winds gathered much of the s~tnd into dunes. Such sn.nd and gravel from which the fine particles have been sorted by the action of waves and winds have properties that m.ake then1 suitable for economic use.
Many beaches and bars of Lake Lahontan, as well ns saJld dunes, are clearly visible on aerial photogra.phs of the Humboldt Range and surrounding b~tsins. These photographs are availruble from the U.S. Geological Sur-
vey and Army Map Service. Many of th~se potential sources of sand and gravel are near highways and railroads ru1d thus may have economic value. Examination of aerial photographs may save time in the search for sand and gravel.
REFERENCES ~ailey, E. H., and Phoenix, b. A., 1944, Quicksilver deposits
in Nevada: Nevada Univ. Bull., v. 38, no. 5, Geology and Mining ser. 41, 206 p.
Cameron, E. N., 1939, Geology and mineralization of the northeastern Humboldt Range, Nevada: Geol. Soc. America Bull., v. 50, no. 4, p. 563-634.
Gale, H. S., 1911, The search for potash in the United States: U.S. Geol. Survey Bull. 530-A, p. 3-27.
Kerr, P. F., 1938, Tungsten mineralization at Oreana, Nevada: Econ. Geology, v. 33, no. 4, p. 390-427. '
Knopf, Adolph, 1924, Geology and ore deposits of the Rochester district, Nevada: U.S. Geol. Survey Bull. 763, p. 1-78.
Ransome, F. L., 1909, Notes on some mining districts in Humboidt County, Nevada: U.S. Geol. Survey Bull. 414, p. 1-75.
Reeves, R. G., and Kral, V. E., 1955, Geology and iron .ore deposits of the Buena Vista Hills, Churchill and Pershing Counties, Nevada, pt. A of Iron ore· deposits of_ Nevada: Nevada Bur. Mines Bull. 53, p. 1-32.
Schrader, F. C., 1915, The Rochester mining district, Nevada: U.S. Geol. Survey Bull. 580, p. 325-372. ·
Stager, H. K., 1960, A new beryllium deposit at the Mount ·wheeler mine, White Pine County, Nevada: Art. 30 in U.S. Geol. Survey Prof. Paper 400-B, p. B70-B71.
Vitaliano, C. J., 1944, Contact metamorphism at Rye Patch, Nevada: Geol. Soc. America Bull., v. 55, no. 8, p. 921-950.
Wallace, R. E., Silberling, N. J., Irwin, W. P., and Tatlock, D. B., 1959, Preliminary geologic map of the Buffalo Mountain quadrangle, 'Nevada: U.S. Geol. Survey Mineral Inv. Field Studies Map MF-220.
Wallace, R. E., Tatlock, D. B., and Silberling, N. J., 1960, Intrusive rocks of Permiah and Triassic age in the Humboldt Range, Nevada: Art. 133 in U.S. Geol. Survey Prof. Paper 400--B, p. B291-B293.
·wallace, R. E., Tatlock, D. B., Silberliug, N.J., and Irwin, ,V. P., 1962, Preliminary geologic map of the Unionville quadrangle, Nevada: U.S. Geol. Survey Mineral Inv. Field Studies Map MF-245.
·Whitebread, D. H., and Lee, D. E., 1961, Geology of the Mount Wheeler mine area, White Pine County, Nevada: Art. 193 in U.S. Geol. Survey Prof. Paper 424-C, p. C120-C122.
B-6 GEOLOGICAL SURVEY RESEARCH 1 9 6 2
STRUCTURAL GEOLOGY
3. POSSIBLE DETACHMENT FAULTS IN THE TEPEE CREEK QUADRANGLE, GALLATIN COUNTY, MONTANA
By IRVING J. WrTKIND, Denver, Colo.
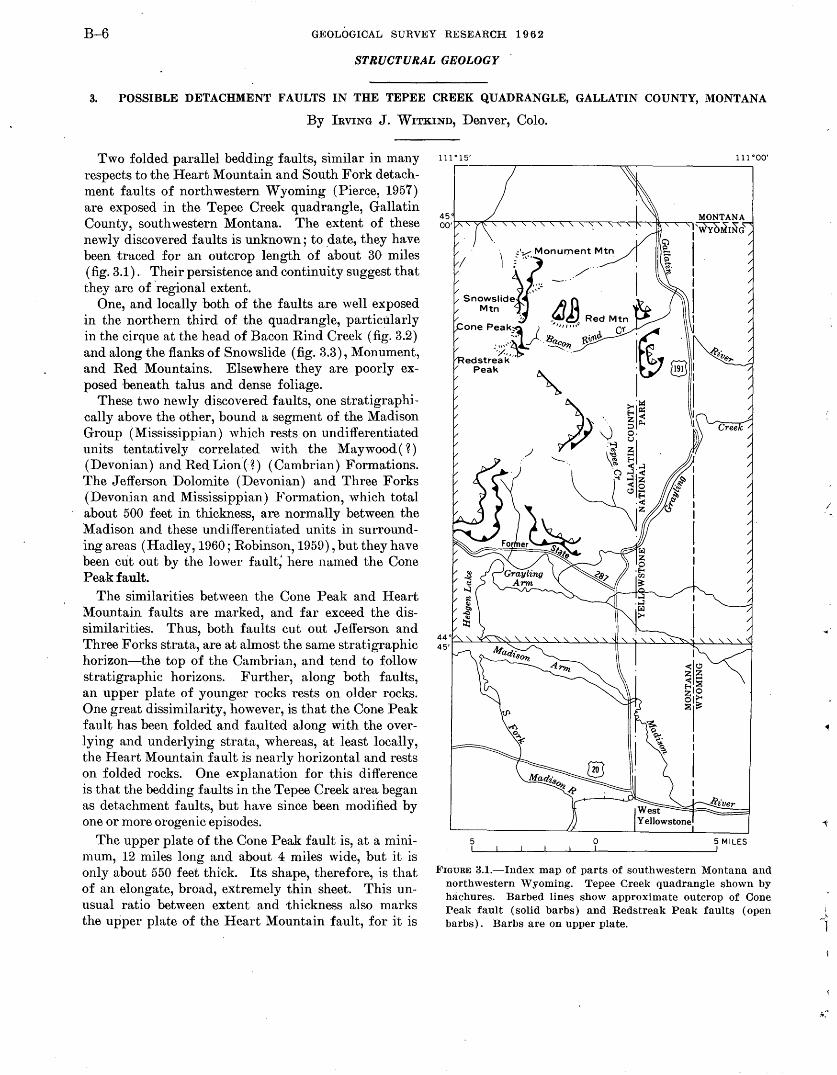
Two folded parallel bedding faults, similar in many respects to the Heart Mountain and South Fork detachment faults of northwestern Wyoming (Pierce, 1957) are exposed in the Tepee Creek quadrangle, Gallatin County, southwestern Montana. The extent of these newly discovered faults is unknown; to date, they have been traced for an outcrop length of about 30 miles (fig. 3.1). Their persistence and continuity suggest that they are of ·regional extent.
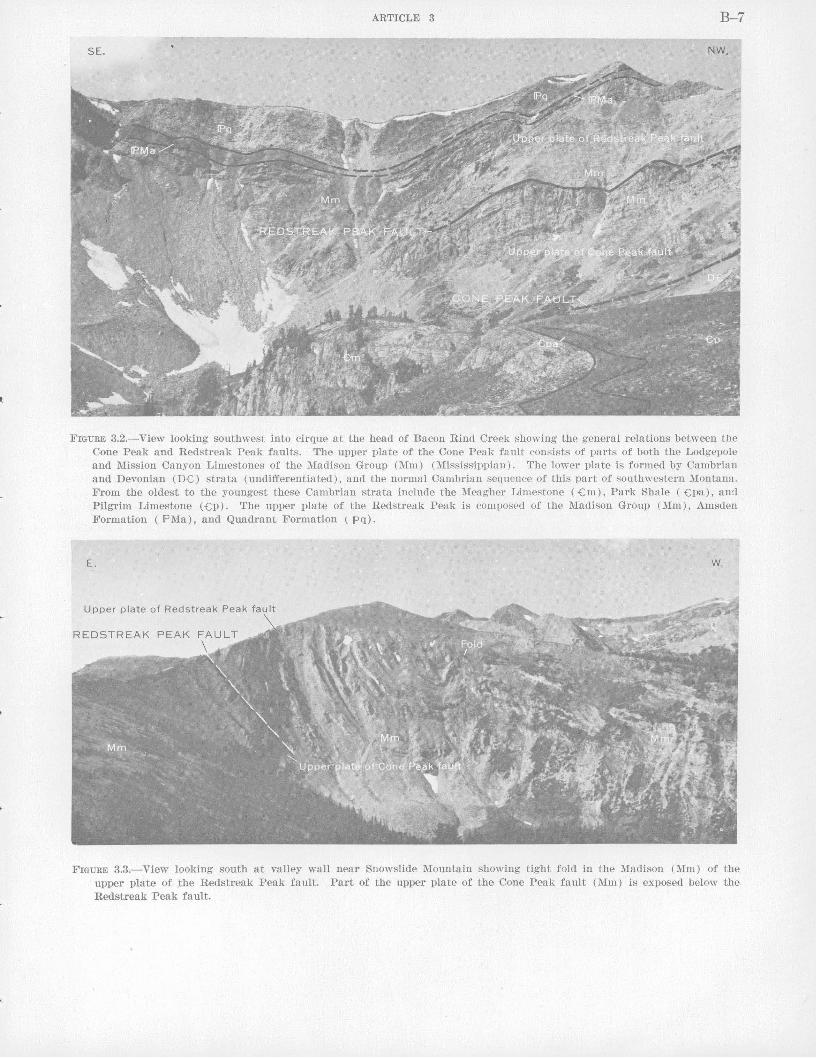
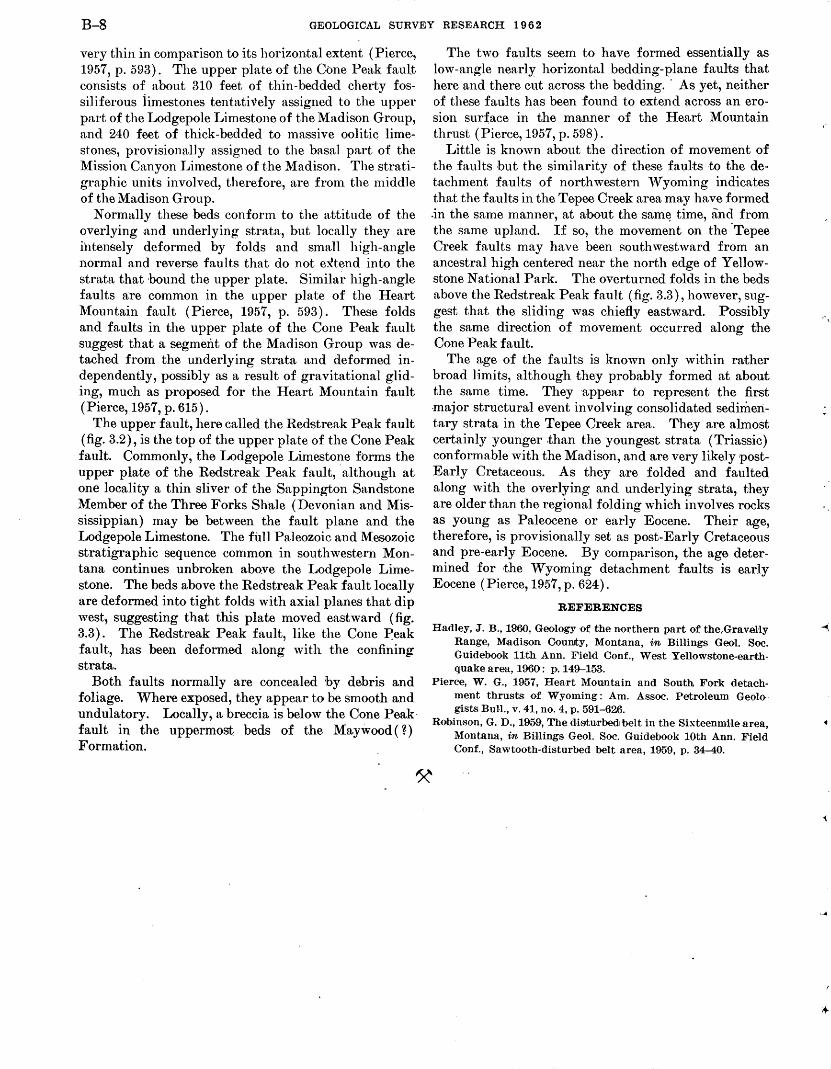
One, and locally both of the faults are well exposed in the northern third of the quadrangle, particularly in the cirque at the head of Bacon Rind Creek (fig. 3.2) and along the flanks of Snowslide (fig. 3.3), Monument, and Red Mountains. Elsewhere they are poorly exposed beneath talus and dense foliage.
These two newly discovered faults, one stratigraphically above the other, bound a segment of the Madison Group (Mississippian) which rests on undifferentiated units tentatively correlated with the Maywood( n (Devonian) and Red Lion{~) (Cambrian) Formations. The Jefferson Dolomite (Devonian) and Three Forks (Devonian and Mississippian) Formation, which total about 500 feet in thickness, are normally between the Madison and these undifferentiated units in surrounding areas (Hadley, 1960; Robinson, 195g), but they have been cut out by the lower fault; here named the Cone Peak fault.
The similarities between the Cone Peak and Heart Mountain faults are marked, and far exceed the dissimilarities. Thus, both faults cut out Jefferson and Three Forks strata, are at almost the same stratigraphic horizon-the top of the Cambrian, and tend to follow stratigraphic horizons. Further, along both faults, an upper plate of younger rocks rests on older rocks. One great dissimilarity, however, is that the Cone Peak fault has been folded and faulted along with the overlying and underlying strata, whereas, at least locally, the Heart Mountain fault is nearly horizontal and rests on folded rocks. One explanation for this difference is that the bedding faults in the Tepee Creek area began as detachment faults, but have since been modified by one or more orogenic episodes.
The upper plate of the Cone Peak fault is, at a minimum, 12 miles long and about 4 miles wide, but it is only about 550 feet thick. Its shape, therefore, is that of an elongate, broad, extremely thin sheet. This unusual ratio between extent and thickness also marks the upper plate of the Heart Mountain fault, for it is
111°15' 111 ·oo·
5 0 5 MILES
FIGURE 3.1.-Index map of parts of southwestern Montana and northwestern ·wyoming. Tepee Creek quadrangle shown by hrichures. Barbed lines show approximate outcrop of Cone Peak fault (solid barbs) and Redstreak Peak faults (open barbs). Barbs are on upper plate.
/
I
' ~1
.('
ARTICLE 3 B-7
FIGURE 3.2.-View looking southwest into cirque at the head of Bacon Rind Creek showing the general relations between the Cone Peak and Redstreak Peak faults. The upper plate of the Cone Peak fault consists of parts of both the Lodgepole and Mission Canyon Limestones of the Madison Group (Mm) (Mississippian). The lower plate is formed by Cambrian and Devonian (D£) strata (undifferentiated), and the normal Cambrian sequence of this part of southwestern Montana. From the oldest to the youngest these Cambrian strata include the Meagher Limestone ( £m), Park Shale ( £pa), and Pilgrim Limestone (£p). The upper plate of the Redstreak Peak is composed of the Madison Group (Mm), Amsden Formation ( IPMa), and Quadrant Formation ~ pq).
E. w.
FIGURE 3.3.-View looking south at valley wall near Snowslide Mountain showing tight fold in the Madison (Mm) of the upper plate of .the Redstreak Peak fault. Part of the upper plate of the Cone Peak fault (Mm) is exposed below the Redstreak Peak fault.
B-8 GEOLOGICAL SURVEY RESEARCH 1 9 6 2
very thin in comparison to its horizontal extent (Pierce, 1957, p. 593). The upper plate of the Cone Peak fault consists of about 310 feet of thin-bedded cherty fossiliferous iimestones tentatively assigned to the upper part of the Lodgepole Limestone of the Madison Group, and 240 feet of thick-bedded to massive oolitic limestones, provisionally assigned to the basal part of the Mission Canyon Limestone of the Madison. The stratigraphic units involved, therefore, are from the middle of the Madison Group.
Normally these beds conform to the attitude of the over1ying .and underlying strata, but locally they are ihtensely deformed by folds and small high-angle normal and reverse faults that do not extend into the strata that hound the upper plate. Similar high-angle faults are common in the upper plate of the Heart Mountain fault (Pierce, 1957, p. 593). These folds and faults in the upper plate of the Cone Peak fault suggest that a segment of the Madison Group was detached from the underlying strata and deformed independently, possibly as a result of gravitational gliding, much as proposed for the Heart Mountain fault (Pierce, 1957, p. 615).
The upper fault, here called the Redstreak Peak fault (fig. 3.2), is the top of the upper plate of the Coile Peak fault. Commonly, the Lodgepole Limestone forms the upper plate of the Redstreak Peak fault, ·although at one locality a thin sliver of the Sappington Sandstone Member of the Three Forks Shale (Devonian and Mississippian) may be between the fault plane and the Lodgepole Limestone. The full Paleozoic and Mesozoic stratigraphic sequence common in southwestern Montana continues unbroken above the Lodgepole Limestone. The beds above the Redstreak Peak fault locally are deformed into tight folds with axial planes that dip west, suggesting that this plate moved eastward (fig. 3.3). The Redstreak Peak fault, like the Cone ~eak fault, has been deformed along with the confining strata.
Both faults normally are concealed by debris and foliage. Where exposed, they appear to be smooth and undulatory. Locally, a breccia is below the Cone Peak fault in the uppermost beds of the Maywood ( ? ) Formation.
The two faults seem to have formed essentially as low-angle nearly horizontal bedding-plane faults that here and there cut across the bedding. · As yet, neither of these faults has been found to extend across an erosion surface in the manner of the Heart Mountain thrust (Pierce, 1957, p. 598).
Little is known about the direction of movement of the faults hut the similarity of these faults to the detachment faults of northwestern 1Vyoming indicates that the faults in the Tepee Creek area may have formed .in the same manner, at about the sam~ time, and from the same upland. If so, the movement on the -Tepee Creek faults may have been southwestward from an ancestral high centered near the north edge of Yellowstone National Park. The overturned folds in the beds above the Redstreak Peak fault (fig. 3.3), however, suggest that the sliding was chiefly eastward. Possibly the same direction of movement occurred along the Cone Peak fault.
The age of the faults is known only within rather broad limits, although they probably formed at abowt the same time. They appear to represent the first -major structural event involving consolidated sedimentary strata in the Tepee Creek area. They are almost certainly younger .than the youngest strata (Triassic) conformable with the Madison, and are very likely postEarly Cretaceous. As they are folded and faulted along with the overlying and underlying strata, they are older than the regional folding which involves rocks as young as Paleocene or early Eocene. Their age, therefore, is provisionally set as post-Early Cretaceous and pre-early Eocene. By comparison, the age determined for the Wyoming detachment faults is early Eocene (Pierce, 1957, p. 624).
REFERENCES
Hadley, J. B., 1960, Geology of the northern part of the,Grave.Hy Range, Madison. Ooulllty, Montana, in Billings Geol. Soc. Guidebook 11th Ann. Field Conf., West Yellowstone-earthquake area, 1960: p. 149-153.
Pierce, W. G., 1957, Heart Mountain and South Fork detachment thrusts of Wyoming: Am. Assoc. Petroleum Geolo· gists Bull., v. 41, no. 4, p. 591-626.
Robinson, G. D., 1959, The d-i·sturbedi belt in the Sixteenm~le area, Montana, in Billings Geol. Soc. Guidebook lOth Ann. Field Conf., Sawtooth-disturbed belt area, 1959, p. 34-40.
·-4
ARTICLE 4 B-9
4. HYDROGEOLOGIC EVIDENCE OF THE EXTENSION OF THE EAST RANGE FAULT, HUMBOLDT AND PERSHING COUNTIES, NEV A'DA
By PHILIP CoHEN, Carson City, Nev.
Wo·rk done in cooperation with the Nevada Department of ConservatiO'n and Natural Resottrces
Faults and associated phenomena are known to influence the occurrence and movement of ground water, and apparent hydrologic anomalies commonly are explained on the basis of inferred faults. Less commonly, n.s in this report, hydrogeologic evidence is used to demonstrate the existence or extension of a fault.
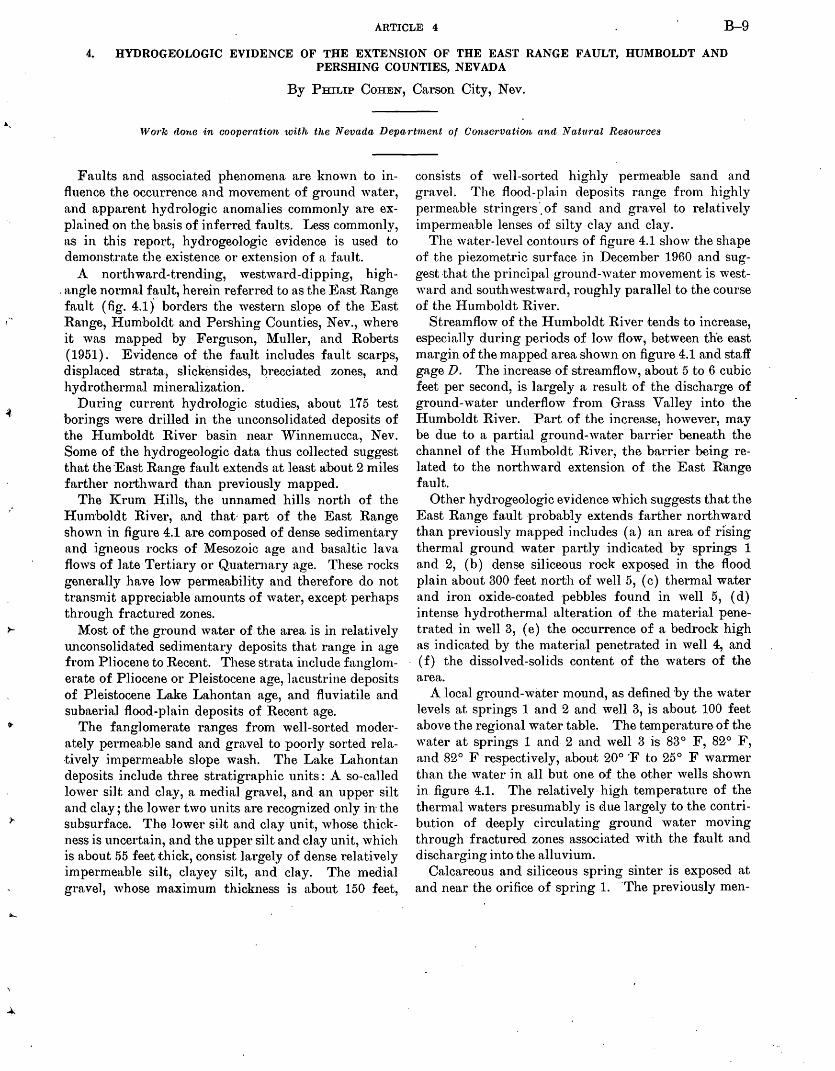
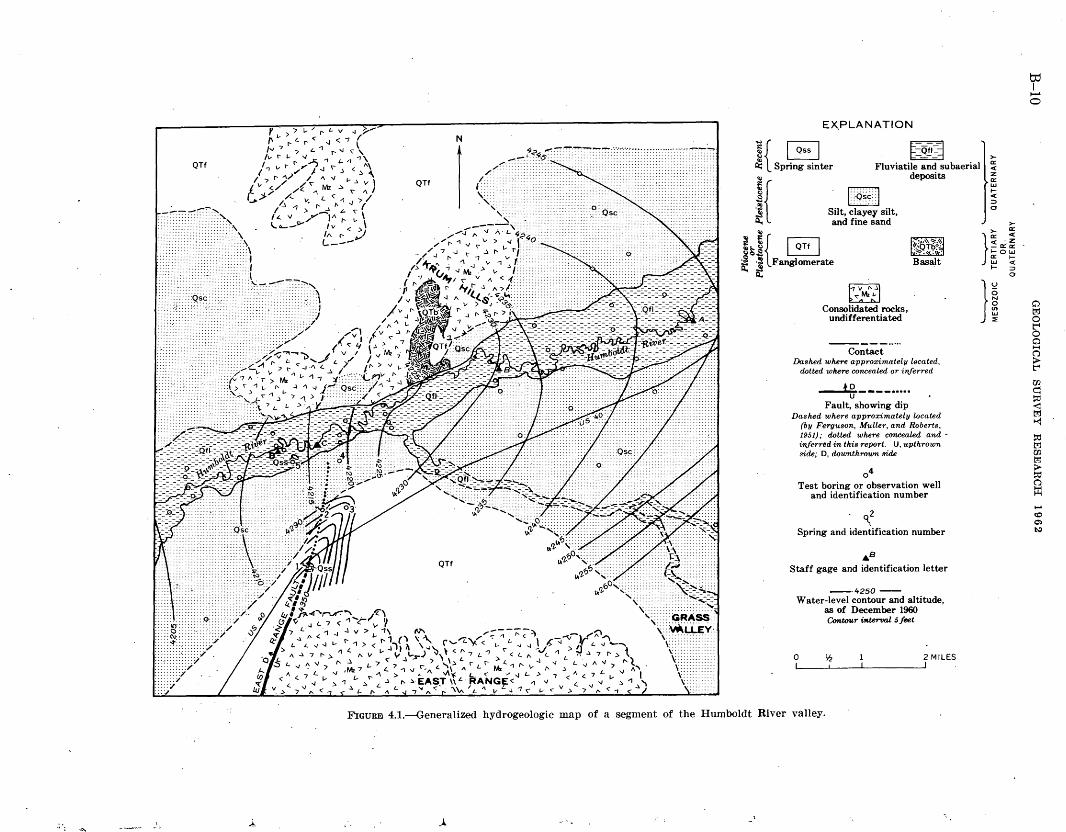
A northward-trending, westwa.rd-dipping, high-. angle normal fault, herein referred to as the East Range fault (fig. 4.1) borders the western slope of the East Range, Humboldt and Pershing Counties, Nev., where it was mapped by Ferguson, Muller, and Roberts (1951). Evidence of the fault includes fault scarps, displaced strata, slickensides, qrecciated zones, and hydrothermal mineralization.
During current hydrologic studies, about 175 test borings were drilled in the unconsolidated deposits of the Humboldt River basin near Winnemucca, Nev. Some of the hydrogeologic data thus collected suggest that the ·East Range fault extends at least about 2 miles farther northward than previously mapped.
The l(rum Hills, the unnamed hills north of the I-Iumboldt River, and that· part of the East Range shown in figure 4.1 are composed of dense sedimentary and igneous rocks of Mesozoic age and basaltic lava flows of late Tertiary or Quaten1ary age. These rocks generally have low permeability and therefore do not transmit appreciable amounts of water, except perhaps through fractured zones.
Most of the ground water of the area is in relatively tmconsolidated sedimentary deposits that range in age from Pliocene to Recent. These strata include fanglomerate of Pliocene or Pleistocene age, lacustrine deposits of Pleistocene Lake Lahontan age, and fluviatile and subaerial flood-plain deposits of Recent age.
The fanglomerate ranges from well-sorted moderately permea;ble sand and gravel to poorly sorted relatively impermeable slope wash. The Lake Lahontan deposits include three stratigraphic units: A so-called lower silt and clay, a medial gravel, and an upper silt and clay; the lower two units are recognized only in the subsurface. The lower silt and clay unit, whose thic.kness is uncertain, and the upper silt and clay unit, which is about 55 feet .thick, consist largely of dense relatively impermeable silt, clayey silt, and clay. The medial gravel, whose maximum thickness is about 150 feet,
consists of well-sorted highly permeable sand and gravel. The flood-plain deposits range from highly permeable stringers·. of sand and gravel to relatively impermeable lenses of silty clay and clay.
The water-level contours of figure 4.1 show the shape of the piezometric surface in December 1960 and suggest that the principal ground-water movement is westward and southwestward, roughly parallel to the course of the Humboldt River.
Streamflow of the Humboldt River ·tends to increase, especially during periods of low flow, between tlie east margin of the mapped area shown on figure 4.1 and staff gage D. The increase of streamflow, about 5 to 6 cubic feet per second, is largely a result of the discharge of ground-water underflow from Grass Valley into the Humboldt River. Part of the increase, however, may be due to a partial ground-water barrier beneath the channel of the Humboldt River, the barrier being related to the northward extension of the East Range fault.
Other hydrogeologic evidence which suggests that the East Range fault ·probably extends farther northward than previously mapped includes (a) an area of ri'sing thermal ground water partly indicated by springs 1 and 2, (b) dense siliceous rock exposed in the flood plain about 300 feet north of well 5, (c) thermal water and iron oxide-coated pebbles found in well 5, (d) intense hydrothermal alteration of the material penetrated in well 3, (e) the occurrence of a bedrock high as indicated by the material penetrated in well 4, and (f) the dissolved-solids content of the waters of the area.
A local ground-water mound, as defined by the water levels at springs 1 and 2 and well 3, is about 100 feet above the regional water table. The temperature of the water at springs 1 and. 2 and well 3 is 83° F, 82° F, and 82° F respectively, about 20° 'F to 25° F warmer than the water in all but one of the other wells shown in figure 4.1. The relatively high temperature of the thermal waters presumably is clue largely to the contribution of deeply circulating ground wate~ moving through fractured zones associated with the fault and discharging into the alluvium.
Calcareous and siliceous spring sinter is exposed at and near the orifice of spring 1. 'The previously men-
QTt
y . -,. L·-" I"" > {. <" L. v ..J v '" 7 r- r- .J < '1 / jv I' j.. -,.-JL1 t-.J ,\
,., v r- r- .,.-I) .., '- 'l 1\ I .,. r- "'/"' J .J ' .) < "\ I"<"'/""~~ r >"'/ /../{ '"' Mz ~ ~- ~ "" '
.i /..1.._ V L<: \/\/ I -1 ::: r- f\ -1".,. / ''- " ..,~ ~ ' ( ~--~"' I" r- "\ /v \
'" r- < >J (_ ___ .,....
/~\ (<~
...,.-:,.., ,... .,. r-
N
l --f.<.~~ __ .,.,._......,.....,._~_,._., ... ,
QTf
L 7 I'). t -.J L -.J A V I' l
). .,. "' A < 7 L v -J I
" " ). .., ..l." 7 ,.. <., < /
EXPLANATION
l{ 8 ~ Spring sinter
t=~:!l~~ Fluviatile and subaerial
deposits
i{ ~
~ ~
Silt, clayey silt, and fine sand
~~~ ~ ~{ ~os ~ ~ j Fanglomerate Q, Q;.
~ ~
Consolidated rocks, undifferentiated
Contact Dashed where approximately l9cated,
dotted where concealed or inferred
--i.E.----····· u Fault, showing dip
Dashed where approximately located (by Ferguson, Muller, and Roberts, 1951); dotted where concealed and -inferred in this report. U, upthrown side; D, downthrown side
04 Test boring or observation well
and identification number
'\2 Spring and identification number
._a Staff gage and identification letter
--·4250 -water-level contour and altitude,
as of December 1960 Contour iftterval 5 feet
0 'f.! 1 2MILES
FIGURE 4.1.-Generalized hydrogeologic map of a segment of the Humboldt River valley .
.... " . 4
>-0:: < z 0:: L1J t< ;::)
0
>-
};;: ~ < .z -0::0:: t-ow 0:: tLlJ < t- ;::)
0
}
to I .......
0
0 t?=:l 0 ~ 0 0 t-4 0 > ~
Ul q ~ -<l t?=:l ~
~ t?=:l Ul t?=:l > ~ 0 ~ ..... co 0)
~
)..
ARTICLE 5 B-11
tioned siliceous rock exposed in the flood plain north of well 5 suggests former hot-spring activity at least as far north ::ts that exposure.
The media.l gravel unit of Lake Lahontan age was penetrated il) well 5 from the land surface to a depth of 83 feet. The pebbles and sand grains are almost completely coated with iron oxide. The temperature of the water in the well is 84° F. This is the only lest boring in the Hood plain in which thermal water was observed in the media,] gravel and in which the particles of the deposit are coated with iron oxide. The iron oxide coatings probably are related to the thermal water, and the thermal water is interpreted as being associated with the fault. ·
'Vell 3 penetrated poorly sorted coarse fanglomerate from the land surface to a depth of 32 feet. The stratmn beneath the fanglomerate is a dense plastic variegated cl~ty containing small fragments of amorphous silica. The occurrence, texture, ·and color of the clay, plus the relatively high temperature of the water in the well, also suggest hydrothermal activity-activity that probably is. related to the fault.
'Vell 4 penetrated the upper silt and clay unit of" Lake Lahontan age from the land stn·face to a depth of 42 feet, fanglomerate from 42 to 75 feet, and basalt
at a depth of 75 feet. The basalt is believed to be part of the upthrown side of the fault block bounded by the East Range fault, and it is tentatively correlated with the basalt exposed to the nortlnn~st across the I-Imnboldt River.
The dissolved-solids content of the waters of springs 1 and 2 and ".,.ells 3, 4, and 5 is about 4 to 5 times greater than the dissolved-solids content of the waters of the other wells and of the water of the Humboldt River. Also, the chemical character of the wa.ters of springs 1 and 2 and wells 8 ~1nd 4 differs markedly from the chemica] character of the other wa,ters in the area.. The waters associated with the fault a.re sodium bicarbonate waters, whereas the other waters of the study area are mixed types.
On the basis of the aforementioned hydrogeologic evidence, it is postulated that the East Range fault extends at least as far northward as shown in figure 4.1. It may extend northward across the Humboldt River, but this is uncertain.
REFERENCE
Ferguson, H. C., Muller, S. W., and Roberts, R. .J., 1951, Geology of the Winnemucca quadrangle, Nevada: U.S. Geol. Survey Geol. Quad. Map GQ-11.
STRATIGRAPHY
5. OLD METAVOLCANIC ROCKS OF THE BIG CREEK AREA, CENTRAL IDAHO
By B. F. LEONARD, Denver, Colo.
A varied sequence of old metavolcanic rocks is part of n. hu·ge roof pendant in the Idaho batholith at Big Creek, Valley County, Idaho. Big Creek, at lat 45°07%' N., long 115°19112' vV., is near the middle of the exposed batholith. The metavolcanics are mainly dark-green amphibole- and mica-rich schists, but elongate-pebble breccias and conglomerates are conspicuous locally. Schistose quartz-feldspar rocks with relict feldspar phenocrysts are exposed in one area. The rocks are interpreted as flows, tuffs, and volcanic breccitl.s that were isoclinally folded and locally dist:upted long before the Idaho batholith was emplaced. They were in,truded at~d cut off by the batholith, and were reconstituted by heat and solutions from the
629660-62-2
cooling granitic mass. The age of the metavolcanic and associated metasedimentary rocks is presumably Precambrian or early Paleozoic. The word "old" is used here to distinguish these metavolcanics from the Casto Volcanics, which are also older than the batholith but are less deformed and of Permian ( ~) age.
The main belt of old metavolcanic rocks, 5 miles long and 0.5 to 1 mile wide, trends northwest through Big Creek, parallel to a local southeastward projection of the batholith and separated from it by a_belt of metasedimentary rocks 0.5 mile wide: The metavolcanics belong m~inly to the epidote-amphibolite. facies, but rocks of amphibolite facies are exposed where the insulating layer of metasediments pinches out, bringing
B-12 GEOLOGICAL SURVEY RESEARCH 19 6 2
batholithic rocks directly against metavolcanics. To the northwest, the belt of metavolcanics loses its identity in a welter of Tertiary dikes that border the main contact of the batholith at this longitude. To the southeast, the metavolcanics pinch out or pass abruptly into massive metatuffs( n so poorly exposed that they cannot be distinguished in the field from the neighboring metasiltstones. A small mass of metavolcanic conglomerate in greenschist facies lies in a parallel syncline 3.5 miles northeast of the main belt. The stratigraphic relations of this mass and of remnants farther northeast are uncertain. Fragments of elongate-pebble conglomerate and porphyrdblastic amphibole-pyroxene schist resembling rocks of the main belt are found as inclusions in the granitic rocks 20 miles south of Big Creek. Thus the old volcanic. rocks may once have extended for at least 20 miles across the present trend of the major fold systems of the metamorphic rocks. Some speculations on the former extent of these rocks are presented at the end of this article.
A stratigraphic section across the best exposures of metavolcanics was measured by miniature theodolite . and stadia on the arete west of Placer Lake, 2.6 miles northwest of Big Creek. Three main meta volcanic units were recognized. From the top downward, the inferred sequence and present thickness of units is: metavolcanic breccia and conglomerate, 100-150 feet; hornblende schist and hornfels with relict. subophitic fabric, interlayered or interlensed with biotite-rich schist and hornfels, 240-330 feet; and porphyroblastic hornblende schist, 80-260 feet. The total thic·kness of the partial section is estimated to be 420-7 40 feet; the bottom of the meta vo~canics is not exposed here. Because of isoclinal folding and development of very large boudins, the true sequence may not be the one reported, and the estimates of thickness may be significant only as orders of magnitude.
The upper part of the breccia unit is a strongly lineated rock having a fine gray matrix that contains abundant angular, elongate fragments of blastoporphyritic hornblende-rich hornfels, laminated biotiterich hornfels, quartz-feldspar hornfels, and' perhaps metasiltstone. The fragments range in length from a few millimeters to several centimeters. Some of the smaller ones are rounded. Their outlines are slightly blurred hy growth of new biotite. All the fragments except the metasiltstone are of metavolcanic rocks identical with those exposed elsewhere in the belt. The matrix is a mosaic of silt-size quartz and feldspar. It contains scattered euhedral plagioclase relics and roun.ded quartz grains with authigenic quartz overgrowths, and is partly replaced by biotite and mag-
netite. The rock is interpreted as a metamorphosed breccia rich in pyroclastic debris but with some fine particles derived from quartz-cemented sandstone ("orthoquartzite''). The lower part of the breccia unit is a light- to dark-green medium-grained massive to schistose amphibole-rich rock containing sporadic elliptical pebbles of fine-grained quartzite and silty limestone. The quartzite and limestone are the same sort a.s those found in metasediments stratigraphically below the meta volcanics. Rare pebbles of dark-green finegrained hornblende-rich hornfels are present; probably these represent metamorphosed lava or tuff. The lower part of the breccia unit is interpreted as metamorphosed basaltic tuff, locally conglomeratic, perhaps with some lava.
The middle unit, where hornblende rich, is feldspathic or calcareous. Some of the rock as a relict ophitic fabric, though it now consists of albite-oligoclase laths empedded in porphyroblastic blue-green hornblende and dark-green biotite. Schistose parts contain lenticles of granular sodic plagioclase in masses of hornblende and biotite. Sparse interlayers or lenses of very fine darkgreen biotite-rich hornfels and dark-gray silty laminated hornfels are present. Under the microscope, the silty hornfels shows relict euhedral plagioclaSe, and rounded quartz grains with authigenic quartz overgrowths. · Before metamorphism the rocks of this unit were mainly lavas, with subordinate volcanic siltstones.
The lower unit contains little or no clastic debris. It is fine- to medium-grained massive to schistose amphibole-rich. rock consisting of dark-green to black hornblende porphyroblasts in a lighter green amphibole matrix. Granular sodic plagioclase is sparingly present. No relict fabric has been seen.
Some epidote and sphene are present in ·the hornblende-rich rocks of all three units, ilmenite is usually an abundant accessory, and apatite is abundant locally. Blue-green chlorite is sparingly present in some rocks.
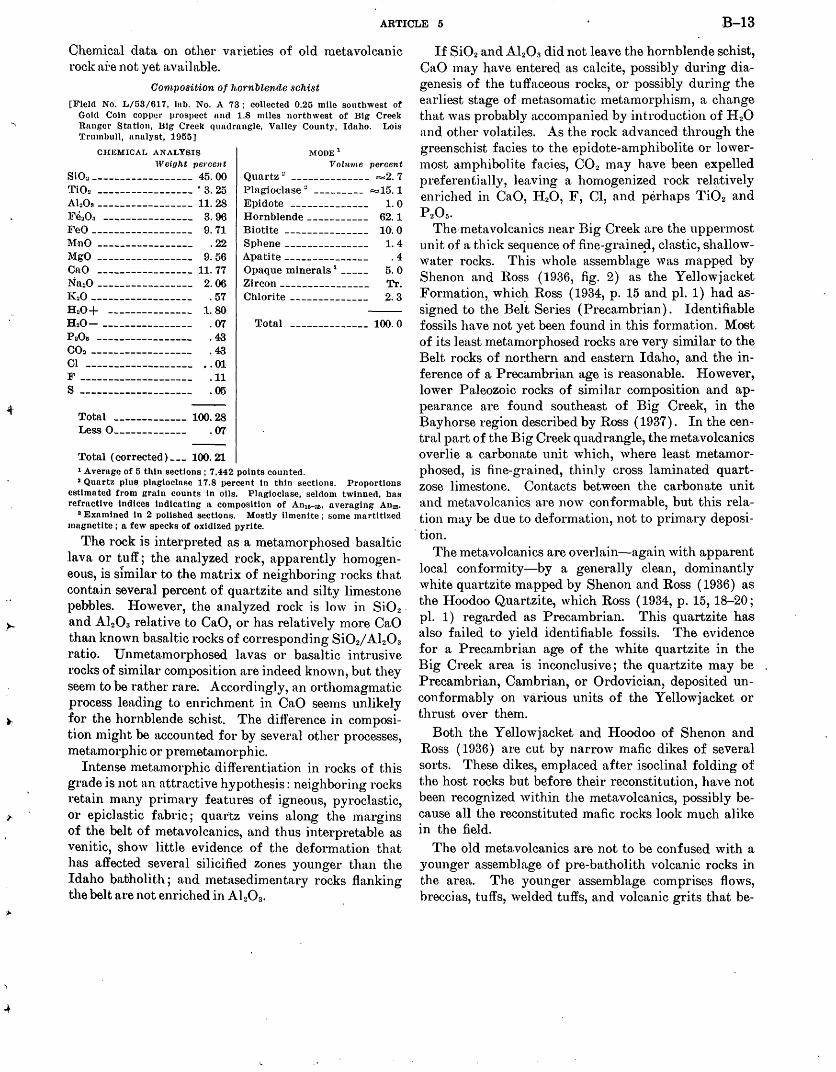
A chemical analysis and mode of outwardly homogeneous dark-green hornblende schist from the middle unit are given in the table below. The analyzed sample contained a little vein calcite that is not present in the thin sections or in duplicate hand specimens. The rock was selected for analysis because it was abundant and seemed most nearly representative of the whole metavolcanic sequence. However, the analyzed rock seems to be of slightly higher metamorphic grade-perhaps lowermost amphi•bolite facies-than rocks in the measured section. The analyzed rock is high in Ti, as are other old mafic igneous rocks of the area. Except for Ti, the minor-element content of the rock does not differ significantly from that of several suites of metasedimentary rock from the various metamorphic zones.
j
~·
ARTICLE 5 B-13
Chemical data on other varieties of old metavolcanic rock ai·e not yet available.
Oom.1JOsition ot hornblende schist
[lricld No. L/53/617, lab. No. A 73; collected 0.25 mile southwest of Golcl Coin COl}PIJJ' prospect und 1.8 miles northwest of Big Creek R1wgcr Station, Big Creek quadrangle, Valley County, Idaho. Lois ~e!"llmbull, nnalyst, 1955]
CHI~MICAL AN AI-YSIS
Weight perce11t
810~------------------ 45.00 Ti02 ----------------- • 3. 25 Al~On ----------------- 11. 28 l!""e~O:, ---------------- 3. 96 FeQ __________________ 9.71
MnO ----------------- . 22
~igO ----------------- 9.56 CaO ----------------- 11. 77
~a~o ----------------- 2.06 1(20 ------------------ .57 H~O+ --------------- 1. 80 H20- ---------------- . 07 PnOG ----------------- .43 00:~ ------------------ . 43 01 ------------------- •. 01 F -------------------- .11 s -------------------- .05
Total ------------- 100.28 Less o_____________ . 07
Total (corrected) ___ 100.21
MODE 1
Vohune percent
Quartz~ -------------- =2. 7 Plagioclase~ --------- =15. 1 Epidote -------------- 1. 0 Hornblende ----------- 62. 1 Biotite --------------- 10. 0 Sphene--------------- 1.4 Apatite --------------- . 4 Opaque minerals 3 _____ 5. 0
Zircon ---------------- Tr. Chlorite -------------- 2. 3
Total -------------- 100.0
1 Average of 5 thin sections; 7,442 points counted. 2 Quartz plus plagioclase 17.8 percent in thin sections. Proportions
estimated from grain counts In oils. Plagioclase, seldom twinned, has refractive indices Indicating a composition of An15- 35, averaging An25•
8 Examined in 2 polished sections. Mostly ilmenite; some martltlzed mugnetite; a few specks of oxidized pyrite.
'I'he rock is interpret~d as a metamorphosed basaltic lava or t_uff; the analyzed rock, apparently homogeneous, is similar to the matrix of neighboring rocks that contain several percent of quartzite and silty limestone pebbles. However, the analyzed rock is low in Si02 .
and Al20s relative to CaO, or has relatively more CaO than known basaltic rocks of corresponding SiOz/ Al20 3
ratio. Unmetamorphosed lavas or basaltic intrusive rocks of similar composition are indeed known, but they seem to be rather rare. Accordingly, an orthomagmatic process leading to enrichment in CaO seems unlikely for the hornblende schist. The difference in composition might be accounted for by several other processes, metamorphic or premetamorphic.
Intense 1netamorphic differentiation in rocks of this gra~e is not an ~ttractive hypothesis: neighboring rocks retn1n mn.ny prunary features of igneous, pyroclastic, or epiclastic fabric; quartz veins along the margins of the belt of metavolcanics, and thus interpretable as venitic, show little evidence of the deformation that hns affected several silicified zones younger than the Idaho batholith; and metasedimentary rocks flanking tJ1e belt are not enriched in Ab03 •
I£ Si02 and Al20 3 did not leave the hornblende schist, CaO may have entered as calcite, possibly during diagenesis of the tuffaceous rocks, or possibly during the earliest stage of metasomatic metamorphism, a change that was probably accompanied by introduction of H 20 and other volatiles. As the rock advanced through the greenschist facies to the epidote-amphibolite or lowermost amphibolite facies, C02 may have been expelled preferentially, leaving a homogenized rock relatively enriched in CaO, H20, F, Cl, and perhaps Ti02 and P205.
The meta volcanics near Big Creek a.re the uppermost unit of a thick sequence of fine-graine9-, clastic, shallowwater rocks. This whole assemblage was mapp~d by Shenon and Ross (1936, fig. 2) as the Yellowjacket Formation, whicJ:l Ross ( 1934, p. 15 and pl. 1) had assigned to the Belt Series (Precambrian) . Identifiable fossils have not yet been found in this formation. Most of its least metamorphosed rocks are very similar to the Belt rocks of northern and eastern Idaho, and the inference of a Precambrian age is reasonable. However, lower Paleozoic rocks of similar composition and appearance are found southeast of Big Creek, in the Bay horse region described by Ross (1937). In the cen .. tral part of the Big Creek quadrangle, the meta volcanics overlie a carbonate unit which, where least metamorphosed, is fine-grained, thinly cross laminated quartzose limestone. Contacts between the carbonate unit and meta volcanics a.re now conformable, but this relation may be due to deformation, not to prima,ry deposi-
. tion. The meta volcanics a.re overlain-a.gain with apparent
loca.l conformity-by a generally clean, dominantly white quartzite mapped by Shenon and Ross (1936) as the Hoodoo Quartzite, which Ross ( 1934, p. 15, 18-20; pl. 1) regarded as Precambrian. This quartzite has also failed to yield identifiable fossils. The evidence for a Precambrian age of the white quartzite in the Big Creek area is inconclusive; the quartzite may be Precambrian, Cambrian, or Ordovician, deposited unconformably on various units of the Y ellowj acket or thrust over them.
Both the Y ellowj acket and Hoodoo of Shenon and Ross ( 1936) are cut by narrow mafic dikes of several sorts. These dikes, emplaced after isoclinal folding of the host rocks but before their reconstitution, have not been recognized within the metavolcanics, possibly because all the reconstituted mafic rocks look much alike in the field.
The old metavolcanics are not to be confused with a younger assemblage of pre-batholith volcanic rocks in the area. The younger assemblage comprises flows, breccias, tuffs, welded tuffs, and volcanic grits that be-
B-14 . GEOLOGICAL SURVEY RESEARCH 1 9 6 2
long to the Casto Volcanics, a formation first described by Ross (1934, p. 28-35). In the Big Creek quadrangle, the Casto Volcanics lie unconformably on the .Hoodoo Quartzite of Shehon and Ross. The old meta volcanics are isoclinally folded and show greater internal deformation than the Casto. However, parts of the Casto have been intruded and thermally metamorphosed by the Idaho batholith to form hornfelses that resemble some of the old metavolcanics. The two sets of volcanics, as well as the post-batholith Challis Voleanics of Tertiary age, can be distinguished only by careful mapping.
Old metavolcanic rocks of the sort. described here have not been reported from central Idaho, though Ross (1934, p. 27) mentioned tuffaceous rocks as one of several possible antecedents for "black schist" of indeterminate age near W oodt.ick Creek, Casto quadrangle. Lava flows are present in Belt roeks in northern Idaho and neighboring areas, but pyroclastic or
· epiclastic volcanics seem to be rare: Johns ( 1961, p. 26) mentions one occurrence of basalt-pebble "agglomerate" overlying a flow of Purcell Basalt in northern Lincoln County, Mont.; Leech (1958; p. 8) notes that tuff is associated with andesitic lava at the top of the Kitchener-Siyeh Formation of the Purcell Series in the Fernie area, southeastern British Columbia. Far to the northwest and southeast of the Big Creek area, along the trend of regional structures in the old rocks, sequences that include both old metavolcanic rocks and coarse clastic deposits are found in northeastern Washington and in the Pocatello area,. southeastern Idaho.
In the Metaline district, Washington, Park and Cannon (1943, p. 7-15) found that the thick, virtually unsorted, generally non volcanic ( ~) Shedroof Conglomerate graded upward into greenstone and green schist of the Leola Volcanics. Relict ophitic, diabasic, and amygdular( ~) textures, rare pillow structures, and tuffaceous fabric are preserved in some of the volcanics. Park and Cannon tentatively assigned both formations to the top of the Precambrian sequence in that area. The two units, each more than 5,000 feet thick, are unconformably(~) overlain by fine-grained phy1lites with subordinate carbonate rocks, quartzite, and grit (Monk Formation, tentatively placed at the bo,se of the Cambrian) and by the thick Gypsy Quartzite of Cambrian age. A similar sequence of conglomerate and overlying volcanics o"f ~recarribrian age, succeeded by quartzite of Cambrian age, has been recognized some distance south of the Metaline district by Bennett ( 1941), Campbell and Loofhourow (1957) ~ Weis (1959), and others. The correhitives of these. rocks in Canada have been discussed by Reesoi· (1957,·p.158-16.2'; 17'5), who inter-
preted part of the Precambrian sequence as eugeosynclinal.
The meta volcanics near Pocatello are also greenstones. These metamorphosed lavas, tuffs, and volcanic breccias constitute the Bannock Volcanic Formation of Ludlum ( 1942). According to Ludlum, a minimum thickness of 400 feet of Bannock is overlain by a thick sequence of mainly clastic rocks (Pocatello Formation) whose lower part contains coarse conglqmerates that he interpreted as tillites. According to Ludlum the Bannock, Pocatello, and overlying Blackrock Limestone are Precambrian, overlain unconformably by the very thick Brigham Quartzite of Cambrian age. Earlier workers assigned younger ages to some of these rocks. Others dispute the assignment of the nonfossiliferous lower strata of the Brigham to the Cambrian.
In northeastern Utah, coarse clastic rocks of Precambrian and Cambrian age, locally overlain by quartzite of Cambrian age, have been interpreted as tillites by Blackwelder ( 1932) and <?thers. Mafic volcanic rocks seem to be sparse or absent from the scattered exposures of- these coarse clastic rocks. Dott (1961, fig. 4 and p. 1301-1303) recently reexamined some of the Utah "tillites" and concluded that their origin was uncertain.
Precise correlation of metavolcanics at Big Creek with those to the northwest or southeast is not possible, and none should be inferred from this brief account. However, there is a "family resemblance" in the association of greenstones and coarse clastic deposits of relatively great age, overlain by thick, rather clean quartzites. The coarse clastic deposits are somewhat enigmatic in origin; they underlie the greenstone at Metaline but overlie it at Big Creek and Pocatello. The overlying quartzite is not conformable with the assemblage of greenstone. and conglomerate. Possibly the quartzite is late Precambrian in places; the upper parts are Cambrian near Metaline and Pocatello; coneeivably the quartzite is as young as Ordovician in central Idaho, if it is the correlative of the IGnnikinic.
The Metaline and Big Creek areas of metavolcap.ics and coarse clastics coincide with the southwest margin of the Belt sea inferred by C. P. Ross ( 1961, personal communication) from his compilation of regional dat.a. (Because he regards the age assignment of the greenstone and conglomerate near Pocatello as uncertain, Ross does not inClude those rocks in the Belt.) . It is easy to speculate that the .eugeosyncline of Bel:t age postulated near the Canadi~n border by Reesor ( l9·57) and others extended southward and .southeastward, passing into a miogeosync~ine that contain~d relatively thin deposits of volcanic and epidastic volcanic rocks in the Big Creek area, and relatively thi1~ ·:~olcan~es
,.J
.. ,
I~
ARTICLE 6 B-15
locally overlain by "tillite" in the Pocatello area. Such speculation is scarcely supported by the meager data on distribution of rocks having the family resemblance noted n.bove. I-Iowever, recognition of the resemblance may be useful in attacking some other problems of central Idaho geology.
REFERENCES
:Bennett, ,V. A. G., 1041, Preliminary report on magnesite deposits of Stevens County, 'Vashington: Washington State Dept. Conserv. and Devel., Div. Geology, Rept. Inv. 5, 25 p.
Blackwelder, Eliot, 1932, An ancient glacial formation in Utah: Jour. Geology, v. 40, p. 289-304.
Campbell, Ian, and Loofbourow, J. S., Jr., 1957, Preliminary geologic map nnd seetions of the magne~ite belt, Stevens County, Washington: U.S. Geol. Survey Mineral Inv. Field Studies Map MF-117.
Dott, R. H., Jr., 1001, Squantum "tillite," Massachusetts-evidence of glaciation or subaqueous mass movements? : Geol. Soc. America Bull., v. 72, p. 128!}-1305.
Johns, W. M., 1961, Progress ·report on geologic investigations in the Kootem:ti-l!,lathead area, northwest Montana, pt. 3,
Northern Lincoln County: Montana Bur. Mines and Geology Bull. 23, 57 p.
Leech, G. B., 1958, Fernie map-area, west half, British Oolumbia: Canada Geol. Survey Pruper 5&-10, 40 .p.
Ludlum, J. C., 1942, Pre-Cambrian formations at Pocatello, Idaho: Jour. Geology, v. 50, p. 85-95 .
Park, C. F., Jr., and Cannon, R. S., Jr., 1943, Geology and ore deposits of the Metaline quadrangle, Washington: U.S. Geol. Survey Prof. Paper 202, 81 p.
Reesor, J. E., 1957, The Proterozoic of the Cord~llera in southeastern British Columbia and southwestern Alberta, in Gill, J. K, eel., The Proterozoic in Canada. Royal Soc. Canada Special Pub. 2, p. 150-177.
Ross, C. P., 1934, Geology and ore deposits of the Oasto quadrangle, Idaho: U.S. Geol. Survey Bull. 854, 135 p.
--1937, Geology and ore deposits of the Bayhorse region, Custer C01.mty, Idaho: U.S. Geol. Survey Bull. 877, 161 p.
Shenon, P. J., and Ross, C. P., 1936, Geology and ore deposits near Edwardsburg and Thunder Mountain, Idaho: Idaho Bur. Mines and GeOlogy Pamph. 44, 45 p.
Wei-s, P. L., 1959, Lower Cambrian and Precambrian rocks in northeastern ·washington [abs.] : Geol. Soc. America Bull., v. 70, p.1790.
6. ANGULAR UNCONFORMITY BETWEEN MESOZOIC AND PALEOZOIC ROCKS IN THE NORTHERN SIERRA NEVADA, CALIFORNIA
By L. D. CLARK, R. W. IMLAY, V. E. McMATH, and N. J. SILBERLING, 1\fenlo Park, Calif., 'Vashington, D.C .• Univ. of Oregon, Eugene, Oreg., Menlo Park, Calif.
Work done in cooperation with the Oalifm"'nia Division of M·ines and Geology
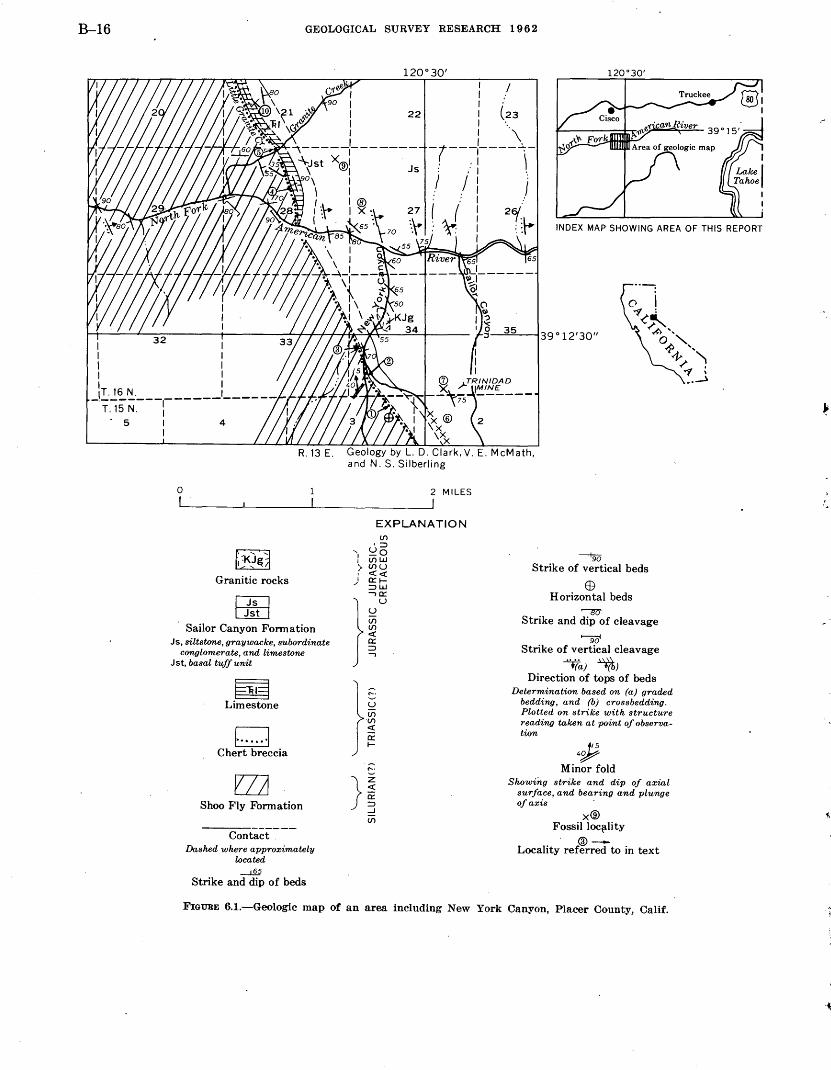
In the canyon of the North Fork of the American River about 5 miles south of Cisco in the northern Sierra Nevada, Calif., rocks of probable Silurian age are overlain with pronounced angular unconformity by rocks of Mesozoic age. The truncated Paleozoic strata are overlain by a sedimentary chert breccia which in turn is overlain conformably by limestone of Late Triassic ( ? ) age in the northern part of the area studied. Lower Jurassic beds of the Sailor Canyon Formation unconformably overlie the limestone in the northern part of the area and the chert breccia, in the southern part. The Paleozoic rocks are complexly folded and have a well-developed slaty cleavage; the Mesozoic rocks dip steeply but are little folded, and cleavage in them is obscure. The sharp contact between the Paleozoic rocks and the chert breccia is well exposed and is not faulted. The d.ihedral angle. between the bedding of the Paleozoic and Mesozoic rocks ranges :from. 0° to 90°.
These relations provide evidence that the rocks of probable Silurian age were strongly folded, regionally metamorphosed to a low grade, and deeply eroded during later Paleozoic or Triassic time and that little folding occurred during latest Triassic (?) and earliest Jurassic time. Relations are much less clear elsewhere in northern California and westernmost Nevada, and proof of pre-Jurassic regional metamorphism and folding sufficient to cause vertical dips has been lacking. The unconformity separating Paleozoic and Mesozoic rocks was first recognized by Lindgren ( 1900), but new stratigraphic and structural information requires that his description of the relations be expanded and modified.
CORRELATION AND AGE OF ROCKS BENEATH THE . UNCONFORMITY
Paleozoic strata beneath the unconformity, exposed in the western part of the area (fig. 6.1), were included with the Blue Canyon Formation by Lindgren ( 1900).
B-16 GEOLOGICAL SURVEY RESEARCH 1 9 6 2
I I I
I I I I
_1!.·..!.~~----~------~------·-~-~--r-:~ T.15 N. I
. 5 I 4 I
R.13 E.
0
f::K2~a Granitic rocks
8fa Sailor Canyon Formation
Js, siltstnne, graywacke, subordinate co:nglomerate, and limestone
Jst, basal tuff unit
~ Limestone
CJ Chert breccia
Shoo Fly Formation
Contact Dashed where approximately
located ~
Strike and dip of beds
2 MILES
EXPLANATION
INDEX MAP SHOWING AREA OF THIS REPORT
-.:::3:...::5:.._--139 ° 12'30"
--fgo Strike of vertical beds
EB Horizontal beds ~
Strike and dip of cleavage
t---g(j Strike of vertical cleavage
-'-';{a) ~) Direction of tops of beds
Determination based on (a) graded bedding, and (b) crossbedding. Plotted on strike with structure reading taken at point of observation
4~ Minor fold
Show{ng strike and dip of axial surface, and bearing and plunge of axis
x® Fossil loc{llity . ®-
Locality referred to in text
FIGURE 6.1.-Geologic map of an area including New York Canyon, Placer County, Calif.
-~
'\•
ARTICLE 6 B-17
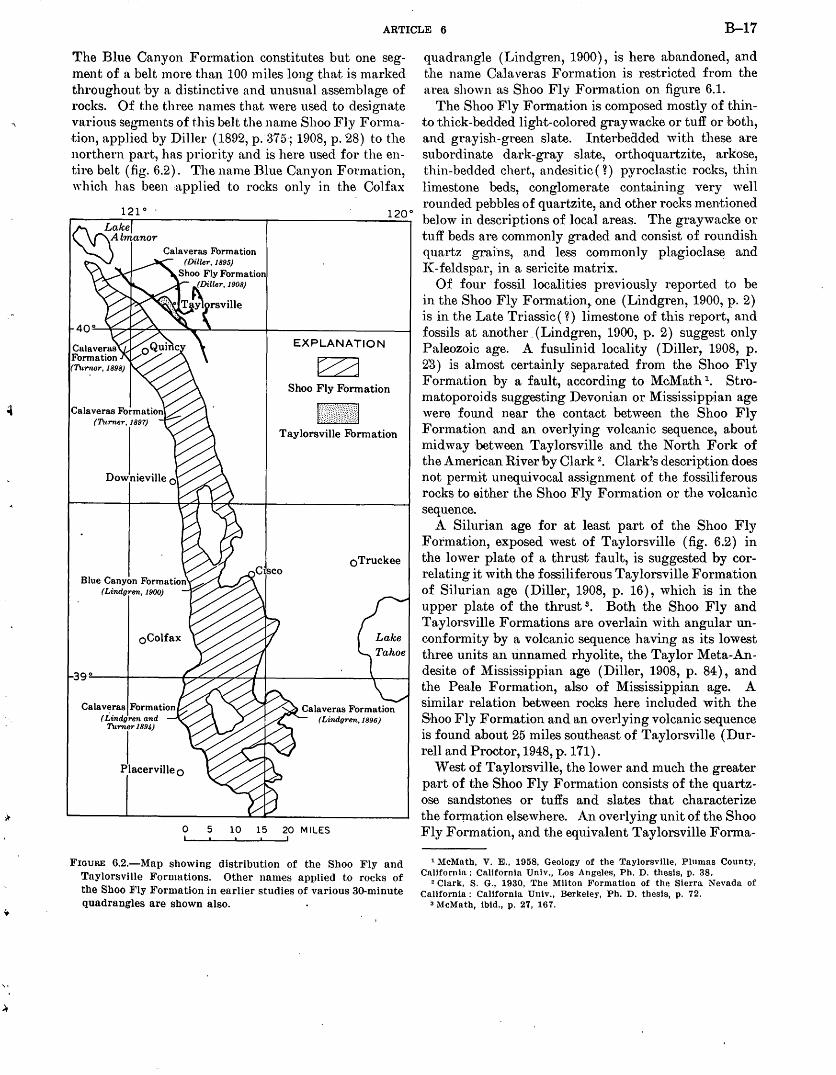
The Blue Canyon Formation constitutes but one segment of a belt more than 100 miles long that is marked throughout by a distinctive and unusual assemblage of rocks. Of the three names that were used to designate various segments of this belt the name Shoo Fly Formation, applied by Diller (1892, p. 375·; 1908, p. 28) to the northern part, has priority and is here used for the entire belt (fig. 6.2). The name Blue Canyon Formation, which has been :applied to rocks only in the Colfax
121° .
EXPLANATION
Shoo Fly Fonnation
Taylorsville Formation
oTruckee
Blue Canyon Formation (Lindgren, 1900)
Calaveras Formation Calaveras Formation (Lindgren and (Lindgren,l896) "'118 .. )
Placerville 0
0 5 10 15 20 MILES
Fxoun.E 6.2.-Map showing distribution of the Shoo Fly and Tnylorsville J!""ormntions. Other names applied to rocks of the Shoo J!""ly ]!""ormation in earlier studies Qf various 30-minute quadrangles are shown also.
quadrangle (Lindgren, 1900), is here abandoned, and the name Calaveras Formation is restricted from the area shown as Shoo Fly Formation on figure 6.1.
The Shoo Fly Formation is composed mostly of thinto thick-bedded light-colored graywacke or tuff or both, and grayish-green slate. Interbeaded with these are subordinate da.rk-gray slate, orthoquartzite, arkose, thin-bedded chert, andesitic( n pyroclastic rocks, thin limestone beds, conglomerate containing very well rounded pebbles of quartzite, and other rocks mentioned below in descriptions of local areas. The graywacke or tuff beds are commonly graded and consist of roundish quartz grains, and less commonly plagioclase and !{-feldspar, in a sericite matrix.
Of four fossil localities previously reported to be in the Shoo Fly Formation,. one (Lindgren, 1900, p. 2) is in the Late Triassic ( ~) limestone of this report, and fossils at another. (Lindgren, 1900, p. 2) suggest only Paleozoic age. A fusulinid locality (Diller, 1908, p. 2'3) is almost certainly separated from the Shoo Fly Formation by a fault, according to McMath 1 • Stromatoporoids suggesting Devonian or Mississippian age were fotmd near the contact between the Shoo Fly Formation and an overlying volcanic sequence, about midway between Taylorsville and the North Fork of the American River by Clark 2• Clark's description does not permit unequivocal assignment of the fossiliferous rocks to sither the Shoo Fly Formation or the volcanic sequence.
A Silurian age for at least part of the Shoo Fly Formation, exposed west of Taylorsville (fig. 6.2) in the lower plate of a thrust fault, is suggested by correlating it with the fossiliferous Taylorsville Formation of Silurian age (Diller, 1908, p. 16), which is in the upper plate of the thrust 3 • Both the Shoo Fly and Taylorsville Formations are overlain with angular unconformity by a volcanic sequence having as its lowest three units an rinnamed rhyolite, the Taylor Meta-Andesite of l\1:ississippian age (Diller, 1908, p. 84), and the Peale Formation, also of Mississippian age. A similar relation between rocks here included with the Shoo Fly Formation and an overlying volcanic sequence is found about 25 miles southeast of Taylorsville (Durrell and Proctor, 1948, p. 171).
West of Taylorsville, the lower and much the greater part of the Shoo Fly Formation consists of the quartzose sandstones or tuffs and slates that characterize the formation elsewhere. An overlying unit of the Shoo Fly Formation, and the equivalent Taylorsville Forma-
1 1\IcM:ath, V. E., 1958, Geology of the Taylorsville, Plumas County, California: California Univ., Los Ang~es, Ph. D. thesis, p. 38.
2 Clark, S. G., 1930, The Milton Formation of the Sierra Nevada of California : California Univ., Berkeley, Ph. D. thesis, p. 72.
a McMath, ibid., p. 27, 167.
B-18 GEOLOGICAL SURVEY RESEARCH 1 9 6 2
tion above a fault that truncates its lower part, are each about 2,000 feet thick. They consist largely of black or greenish-gray obscurely laminated phyllite and slate, and thin beds, commonly graded, of feldspathic, possibly tuffaceous, graywacke. In the Shoo Fly Formation this unit is overlain by about 3,000 feet of andesitic greenstone, mostly derived from lava, and subordinate interlayered chert.
DESCRIPTION OF AREA
Within the area studied (fig. 6.1), the most abundant rocks in the Shoo Fly Formation are thin-bedded darkgray slate and siltstone that is in part pyritic and in part quartzose, thin-bedded chert, and fine-grained thin-bedded quartz-rich graywacke or rhyolitic tuff. Medium-grained arkose containing both plagioclase and K-feldspar is exposed on theN orth Fork of the American River. Conglomerate consisting of well-rounded quartz and quartzite pebbles is sparse. Some beds of coarse sandstone and fine conglomerate composed of angular fragments of chert are interbedded with siltstone and chert on the ridge north of map locaJity 4 (fig. 6.1). Slaty cleavage is prominent in the originally argillaceous rocks, but original textures in the rocks of sand size and larger are well preserved, and in most
. places the rocks are little sheared. Because rocks of the Shoo Fly Formation within the area of figure 6.1 have not been correlated with a specific part of the section in the Taylorsville area, they are designated Silurian(?).
The Shoo Fly Formation is unconformably overlain by a coarse, nonbedded, poorly sorted chert breccia that locally attains a thickness of 75 feet or more. The breccia separates the Shoo Fly Formation to the southwest from fossiliferous Mesozoic rocks to the northeast, is structurally concordant with the Mesozoic rocks, and is considered Mesozoic in age. The composition and texture of the breccia vary along strike, but chert pebbles of various colors are everywhere the most abundant. Fragments of thin-bedded dark-gray slate and fine-grained graywacke or silicic tuff derived from the Shoo Fly Formation are common locally. Finegrained dioritic or quartz monzonitic rocks are common in the breccia near the north side of the rna p area. Sparse pebbles of mica schist were found at locality 4. The matrix consists of sand- and granule-sized grains of chert. Commonly the largest pebbles in the breccia are about 4 inches in diameter, but near the north edge of the area, scattered blocks as much as 20 inches long occur in the breccia. At localit-y 4 and on the crest of the ridge to the north, outcrop areas of the Shoo Fly Formation more than 20 feet long and 5 feet wide are surrounded by chert breccia. Such a pattern could re-
suit either from deposition of the breccia on a very irregular erosion surface or from incorporation of detached blocks of the Shoo Fly in the breccia.
The contact between the chert breccia and the underlying Shoo Fly Formation is a nearly straight line at map scale, but in outcrops the contact surface has a relief of several feet. Where well exposed at localities 2 and 4, the contact alternately follows bedding of. the Shoo Fly Formation and fracture surfaces that cut across the bedding. Rocks of the Shoo Fly Formation in contact with the chert breccia are: At locality 1, thinbedded chert; at 2 and 4, thin-bedded black slate; and at· 3 and 5, medium- and fine-grained graywacke or silicic tuff.
North of the North Fork of the American River the chert breccia is conformably overlain by limestone of Late Triassic ( ~) age. In New York Canyon the breccia is overlain by the Sailor Canyon Formation of late Early Jurassic age. The chert breccia is of probable Triassic age.
The limestone that overlies the chert breccia is about 400 feet thick at the crest of the spur north of locality 4. It is absent in New York Canyon, but is possibly· concealed on the south side of the canyon of the North Fork of the American River. The lower part of the limestone unit consists of alternating layers of thinbedded argillaceous gray limestone that weathers reddish brown, and thin- to medium-bedded gray limestone that weathers very light gray. Well-rounded granules or angular fragments of chert characterize some of these beds. The middle part consists of less argillaceotis limestone beds that form bold cliffs, and the upper part consists of thin interbeds of light-gray limestone and light-greenish-gray very fine grained pyritic sandstone probably derived from silicic tuff.
A Late Triassic(~) age for the limestone is based mainly on the occurrence at locality 10 (USGS Mes. loc. M1167) of numerous spherical objects with the surficial and internal structure of H eterastridium, a supposed hydrozoan coelenterate that is widely distributed in deposits of Norian (late Late Triassic) age. Howev~r, in view of the doubtful biologic affinities and unknown evolutionary history of this organism, the age must be considered provisional. A post-Paleozoic age for the limestone is corroborated by the presence of poorly preserved ·scleractinian corals, large cidarid echinoid spines, and Pentaorinus-like crinoid columnals with petaloid crenulations on the articulating surfaces. · The Sailor Canyon Formation, occupying the eastern part of the map area, overlies the limestone unit in the northern part of the area and the chert breccia in the southern part. It is at least 10,000 feet thick and consists largely of graywacke, tuff of intermediate compo-
•
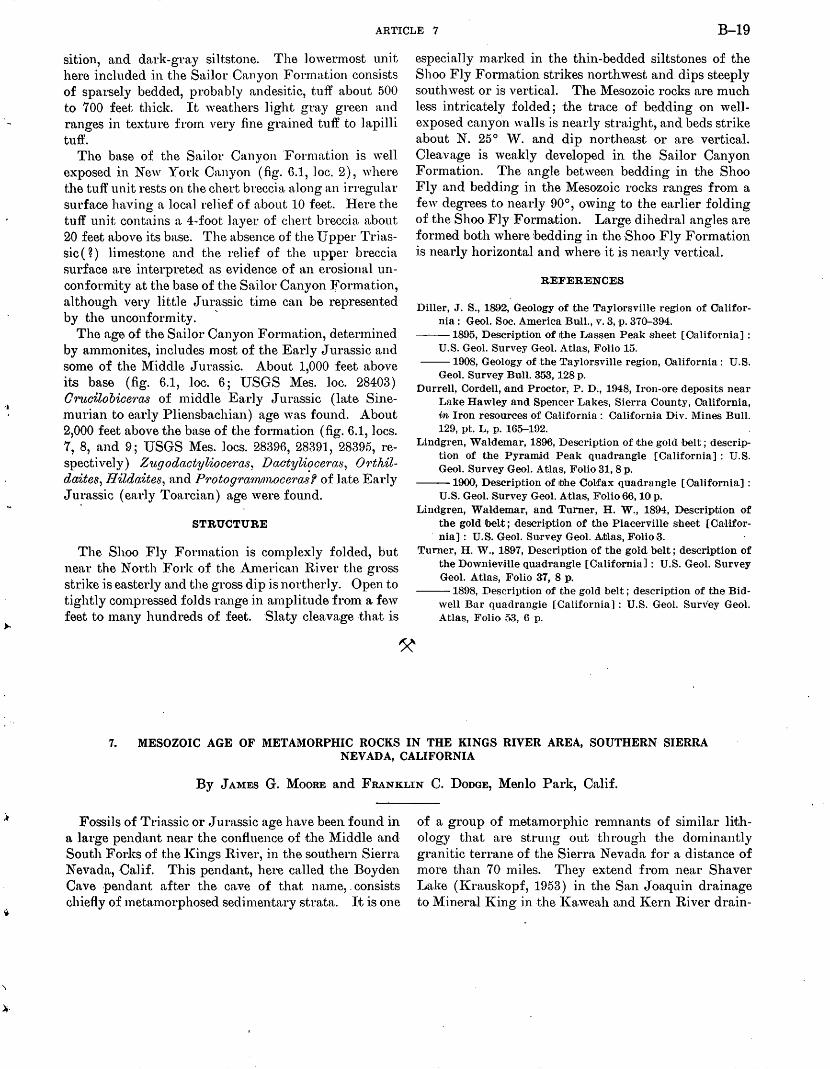
~·
ARTICLE 7 B-19
sition, and dark-gray siltstone. The lowermost unit here included in the Sailor Canyon Formation consists of sparsely bedded, probably andesitic, tuff about 500 to 700 feet thick. It weathers light gray green and ranges in texture from very fine grained tuff to lapilli tuff.
The base of the Sailor Canyon Formation is well exposed in New York Canyon (fig. 6.1, loc. 2), where the tuff unit rests on the chert breccia along an irregular surface having a locnl relief of about 10 feet. Here the tuff unit contains n. 4-foot. layer of ehert breccia nbout 20 feet nbove its base. The absence of the Upper Triassic( n limestone and the relief of the upper breccia surface ~tre interpreted as evidence of an erosional unconformity nt the base of the Sailor Canyon }formation, although very little Jurassic time can be represented by the unconformity. '
The age of the Sailor Canyon Formation, determined by ammonites, includes most of the Early Jurassic and some of the Middle Jurassic. About 1,000 feet above its base (fig. 6.1, loc. 6; USGS Mes. loc. 28403) O?•twilobioe'ras of middle Early Jurassic (late Sinemurian to early Pliensbachian) age was found. About 2,000 feet above the base of the formation (fig. 6.1, locs. 7, 8, and 9; USGS Mes. locs. 28396, 28391, 28395, respectively) Zugodaotyliooeras, Daotyliooera8, Orthildaites, Hildaites, and P?·otogram;nwce·ra,;? of late Early J u~·assic (early Toarcian) age were found.
STRUCTURE
The. Shoo Fly Formation is com.plexly folded, but nen,r the North Fork of the American River the gross strike :is easterly and the gross dip is northerly. Open to tightly cmnpressed folds range in amplitude from a few feet to n1any hundreds of feet. Slaty cleavage that is
especially marked in the thin-bedded siltstones of the Shoo Fly Formation strikes northwest and dips steeply southwest or is vertical. The Mesozoic rocks are much less intricately folded; the trace of bedding on wellexposed canyon walls is nearly straight, and beds strike about N. 25° W. and dip northeast or are vertical. Cleavage is weakly developed in the Sailor Canyon Formation. The angle between bedding in the Shoo Fly and bedding in the Mesozoic rocks ranges from a few degrees to nearly 90°, owing to the earlier folding of the Shoo Fly Formation. Large dihedral angles are formed both where bedding in the .Shoo Fly Formation is nearly horizontal and where it is nearly vertical.
REFERENCES
Diller, J. S., 1892, Geology of the Taylorsville region of California: Geol. Soc. America BUill., v. 3, p. 370--394.
--1895, Descr-iption of the Lassen Peak sheet [ Oalifornia] : U.S. Geol. Survey Geol. Atlas, Folio 15.
--1908, Geology of the Taylorsville region, California: U.S. Geol. Survey Bull. 353, 128 p.
Durrell, Cordell, and Proctor, P. D., 1948, Iron-ore deposits near Lake Hawley and Spencer Lakes, Sierra County, California, in Iron resources of OaHfornia: California Div. Mines Bull. 129, pt. L, p. 165-192.
Lindgren, Waldemar, 1896, Description of the gold belt; description of the Pyramid Peak quadrangle [California] : U.S. Geol. Survey Geol. Atlas, Folio 31,8 p.
--1900, Description of ttlhe Col.fax quadrangle [California] : U.S. Geol. Survey Geol. Atlas, Folio66, 10 p.
Lindgren, Waldemar, and Turner, H. W., 1894, Description of the gold lbelt; descri-ption of the Placerville sheet [ California] : U.S. Geol. Survey Geol. Atlas, Folio3.
Turner, H. W., 1897, Description of the gold belt; description of the Downiev·Hle quadrangle [California]: U.S. Geol. Survey Geol. Atlas, Folio 37, 8 p.
--1898, Description of the gold belt; description of the Bidwell Bar quadrangle [California] : U.S. Geol. Surv·ey Geol. Atlas, Folio 53, 6 p.
7. MESOZOIC AGE OF METAMORPHIC ROCKS IN THE KINGS RIVER AREA, SOUTHERN SIERRA NEVADA, CALIFORNIA
By JAMES G. MooRE and FRANKLIN C. DoDGE, Menlo Park, Calif.
Fossils of Triassic or Jurassic age have been found in a large pendant near the confluence of the Middle and South Forks of the ICings River, in the southern Sierra Nevada, Calif. This pendant, here called the Boyden Cave .pendant after the cave of that name,. consists chiefly of metamorphosed sedimentary strata. It is one
of a group of metamorphic remnants of similar lithology that are strung out through the dominantly granitic terrane of the Sierra Nevada for a distance of more than 70 miles. They extend from near Shaver Lake (J(rauskopf, 1953) in the San Joaquin drainage to Mineral King in the J(aweah and Kern River drain-
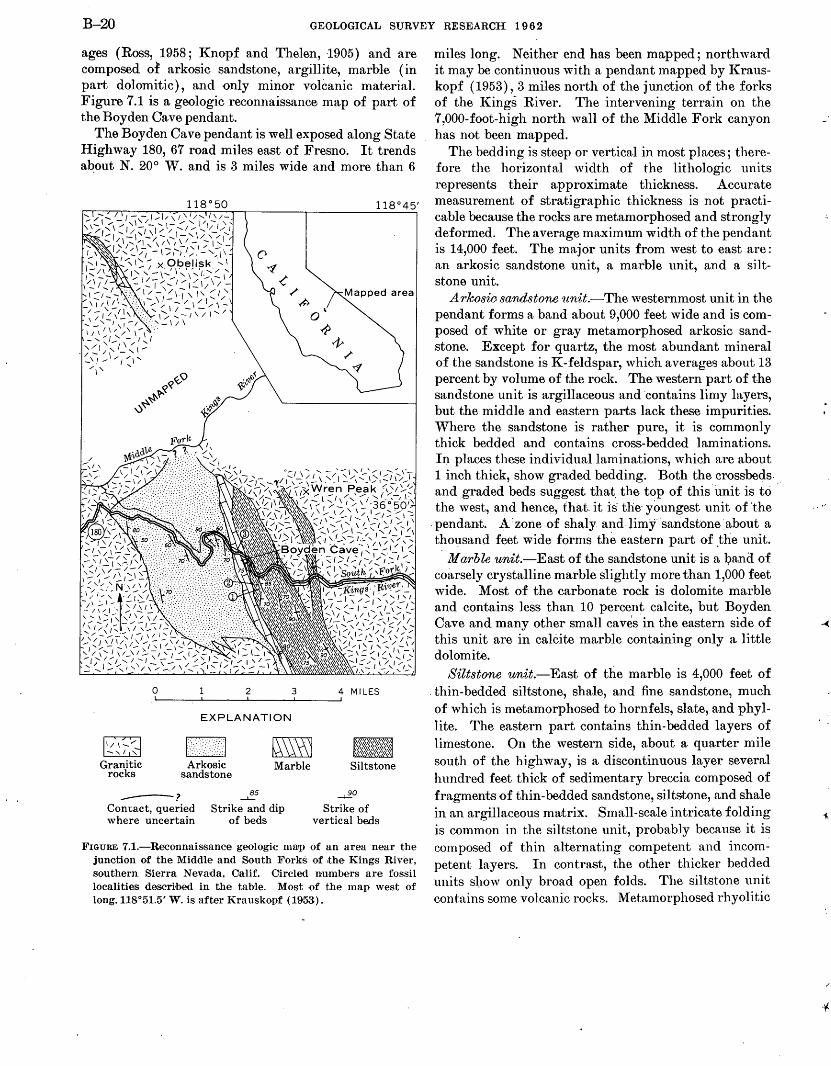
B-20 GEOLOGICAL SURVEY RESEARCH 19 6 2
ages (Ross, 1958; Knopf and Thelen, 1905) and are composed of arkosic sandstone, argillite, marble (in part dolomitic), and only minor volcanic material. Figure 7.1 is a geologic reconnaissance map of part of the Boyden Cave pendant.
The Boyden Cave pendant is well exposed along State Highway 180, 67 road miles east of Fresno. It trends a~out N. 20° W. and is 3 miles wide and more than 6
~ ~
Granitic rocks
0
---?
2 3
EXPLANATION
m Arkosic
sandstone
85 ___J,_
~ Marble
Con-tact, queried where uncertain
Strike and dip of beds
4 MILES
Siltstone
~0
Strike of vertical be.ds
FIGURE 7.1.-Reconnaissance geologic ma'p of an area near the junction of the Middle and South l!""'orks of the Kings River, southern Sierra Nevada, Calif. Circled numbers are fossil localities described in the table. Most of the map west of long.l18°51.5' W. is ·after Krauskopf (1953).
miles long. Neither end has been mapped; northward it may be continuous with a pendant mapped by l{rauskopf (1953), 3 miles north of the junction of the forks of the Kings River. The intervening terrain on the 7,000-foot-high north wall of the Middle Fork canyon has not been mapped.
The bedding is steep or vertical in most places; therefore the horizontal width of the lithologic units represents their approximate thickness. Accurate measurement of stratigraphic thickness is not practicable because the rocks are metamorphosed and strongly deformed. The average maximum width of the pendant is 14,000 feet. The major units from west to east are: an arkosic sandstone unit, a ma.rble unit, and a siltstone unit.
A rkosw sandstone ·unit.-The westernmost unit in the pendant forms a band about 9,000 feet wide and is composed of white or gray metamorphosed arkosic sandstone. Except for quartz, the most abundant mineral of the sandstone is K-feldspar, which averages about 13 percent by volume of the rock. The western part of the sandstone unit is argillaceous and contains limy layers, but the middle and eastern parts lack these impurities. Where the sandstone is rather pure, it is commonly thick bedded and contains. cross-bedded laminations. Il). places these individual laminations, which are about 1 inch thick, show graded bedding. Both the crossbeds .. and graded beds suggest that. the top of this. unit is to the west, and hence, that_ it is the· youngest unit of "the
. pendant. A zone of shaly and limy ·sandstone ·.about a thousand feet wide forms the eastern part of .the unit.
Marble unit.-East of the sandstone unit is a l;>a.nd of coarsely crystalline marble slightly more than 1,000 feet wide. Most of the carbonate rock is dolomite marble and contains less than 10 percent calcite, but Boyden Cave and many other small caves in the eastern side of this unit are in calCite marble containing only a little dolomite.
Siltstone unit.-East of the marble is 4,000 feet of . thin-bedded siltstone, shale, and fine sandstone, much of which is metamorphosed to hornfels, slate, and phyllite. The eastern part contains thin-bedded layers of limestone. On the western side, about a quarter mile south of the highway, is a discontinuous layer several hundred feet thick of sedimentary breccia composed of fragments of thin-bedded sandstone, siltstone, and shale in an argillaceous matrix. Small-scale intricate folding is common in the siltstone unit, probably because it is composed of thin alternating competent and incompetent layers. In contrast, the other thicker bedded units sl:ww only broad open folds. The siltstone unit contains some volcanic rocks. Metamorphosed rhyolitic
. ,-
·'I-
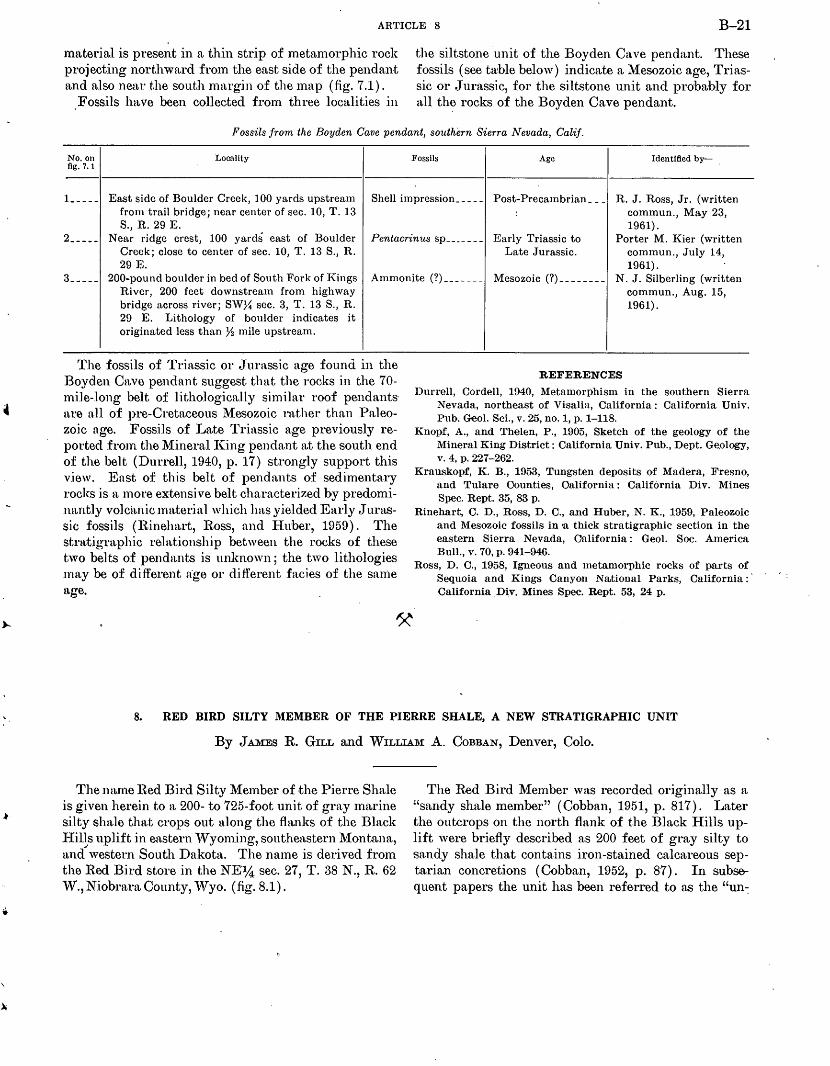
ARTICLE 8 B-21
material is present in a thin strip of metamorphic rock projecting northward frmn the east side of the pendant and also near the south margin of the 1nn.p (fig. 7.1).
Fossils have been collected frmn three localities in
the siltstone unit of the Boyden Cave pendant. These fossils (see twble below) indicate a Mesozoic age, Triassic or Jurassic, for the si1tstone unit and proha:bly for all the rocks of the Boyden Cave pendant.
Fossils from the Boyden Cave pendant, southern Sierra Nevada, Calif.
No. on fig. 7.1
J .. ocallty Fossils Age Identified by-
L _ _ _ _ East side of Boulder Creek, 100 yards upstream from trail bridge; near center of sec. 10, T. 13 s., n. 29 K
Shell impression_____ Post-Precambrian __ _ R. J. Ross, Jr. (written commun., May 23, 1961).
2_ _ _ _ _ N en,r ridge crest, 100 yards east of Boulder Creek; close to center of sec. 10, T. 13 S., R. 29 E.
Pentacrinus sp____ _ _ _ Early Triassic to Late Jurassic.
Porter M. Kier (written commun., July 14, 1961).
3_ _ _ _ _ 200-pound boulder in bed of South Fork of Kings River, 200 feet downstream from highway bridge across river; SWH sec. 3, T. 13 S., R. 29 K Lithology of boulder indicates it originated less than ~'2 mile upstream.
Ammonite(?) _______ Mesozoic(?) _______ _ N. J. Silber ling (written commun., Aug. 15, 1961).
The fossils of Triassic or Jurassic age found in the Boyden c~we pendant suggest that the rocks in the 70-mile-long belt of lithologically similar roof pendants· n,re all of pre-Cretaceous ~1esozoic rather than Paleozoic age. Fossils of Late Triassic age previously reported from the Mineral ICing pendant n.t the south end of the belt (Durrell, 1940, p. 17) strongly support this view. Enst of this belt of pendants of sedimentary rocks is a more extensive belt characterized by predominantly volc~tnic material which has yielded Early J urnssic fossils (Rinehart, Ross, and I:Iuber, 1959). The strat.igraphic relationship between the rocks of these two belts of pendants is unknown; the two lithologies .may be of different ~\ge or different facies of the sani.e nge.
REFERENCES Durrell, Cordell, 1940, Metamorphism in the southern Sierra
Nevada, northeast of Visalia, California: California Univ. Pub. Geol. Sci., v. 25, no. 1, p. 1-118.
Knopf, A., and Thelen, P., 1905, Sketch of the geology of the Mineral King District: California Univ. Pub., Dept. Ge.ology, v. 4, p. 227-262.
Krauskopf, K. B., 1953, Tungsten deposits of Madera, Fresno, and Tulare Counties, California: California Div. Mines Spec. Rept. 35, 83 p.
Rinehart, C. D., Ross, D. C., and Huber, N. K., 1959, Paleozoic and Mesozoic fossils in 'a thick stratigraphic section in the eastern Sierra Nevada, California: Geol. Soc. America Bull., v. 70, p. 941-946.
Ross, D. C., 1958, Igneous and metamorphic rocks of parts of Sequoia and Kings Canyon National Parks, California:' California .Div. Mines Spec. Rept. 53, 24 p.
8. RED BIRD SILTY MEMBER OF THE PIERRE SHALE, A NEW STRATIGRAPHIC UNIT
By JAMES R. GILL and WILLIAM A. CoBBAN, Denver, Colo.
The IUtnle Red Bird Silty Member of the Pierre Shale is given herein to a 200- to 725-foot unit of gray 1narine silty shale that crops out along the fla.nks of the Black J[il~s uplift :in eastern 'Vymning, southeastern Montana, and western South Dakota. The name is derived from the Red Bird store in the NE'% sec. 27, T. 38 N., R. 62 W., Niobrltra County, Wyo. (fig. 8.1).
The Red Bird Member was recorded originally as a "sandy shale member" (Cobban, 1951, p. 817). Later the outcrops on the north flank of the Black Hills uplift were briefly described as 200 feet of gra.y silty to sandy shale that contains iron-stained calcareous septarian concretions (Cobban, 1952, p. 87). In subsequent papers the unit has been referred to as the "un-:
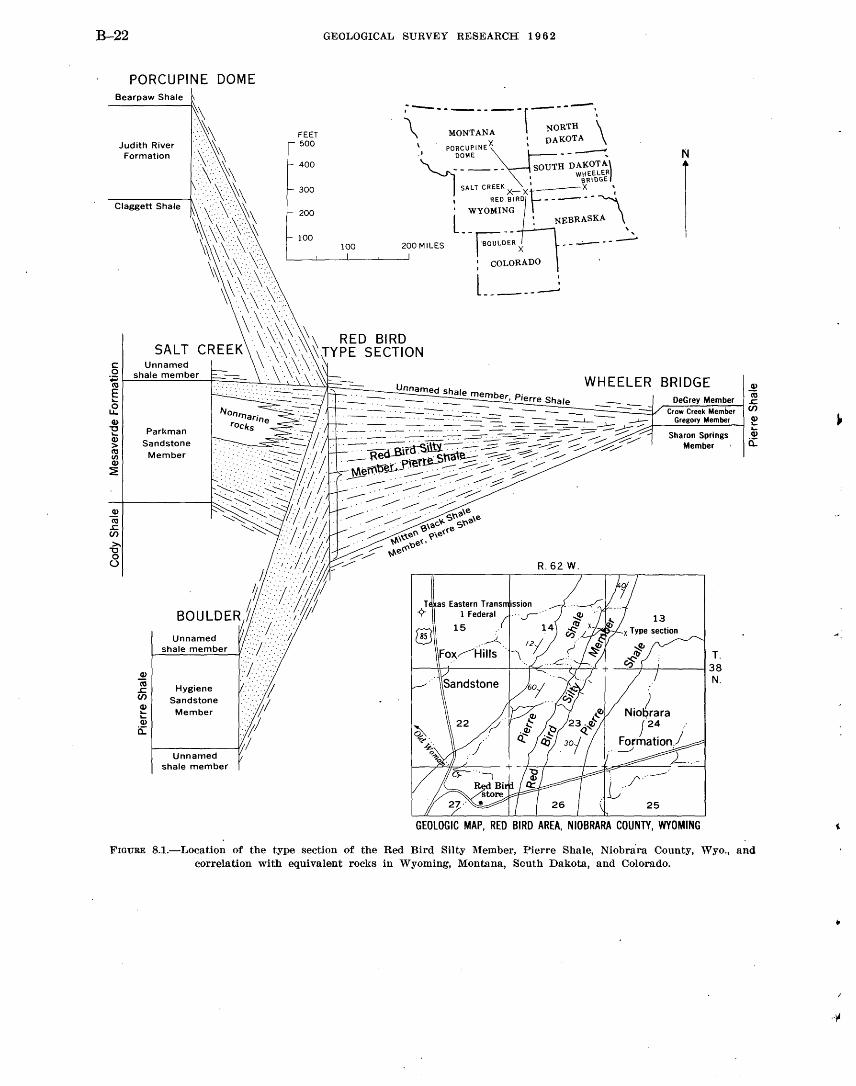
B-22
PORCUPINE DOME Bearpaw Shale
Judith River Formation
Claggett Shale
Q)
-ro .s:: en >.
"0 0
(..)
Q)
-ro .s:: en ~ ..... Q)
a:
Unnamed shale member
Hygiene Sandstone Member
Unnamed shale member
GEOLOGICAL SURVEY RESEARCH 1 9 6 2
\-•. =~~A--.\ -:~:T:-·\, I DAKOTA
\ . PORCUPINEX 1
·"'' ~~M-E-~-SOUT~ ~~) WHEELER 1 BRIDGE
' sALT cR:;: ~-;;BxC==~ _ ~~ • WYOMING r L ~ NEBRASKA '
- -~ BOUL;E-R X • ----~
: COLORADO '
N
1 l_ ____ ___;
BRIDGE Q)
DeGrey Member -ro .s::
Crow Creek Member en Gregory Member Q) ..... .....
Sharon Springs Q)
Member a:
R.62 W.
T. 38 N.
GEOLOGIC MAP, RED BIRD AREA, NIOBRARA COUNTY, WYOMING
FIGURE 8.1.-Location of the type section of the Red Bird Silty Member, Pierre Shale, Niobrara County, 'Vyo., and correlation with equivalent rocks in Wyoming, Montana, South Dakota, and Colorado.
~
...
··~
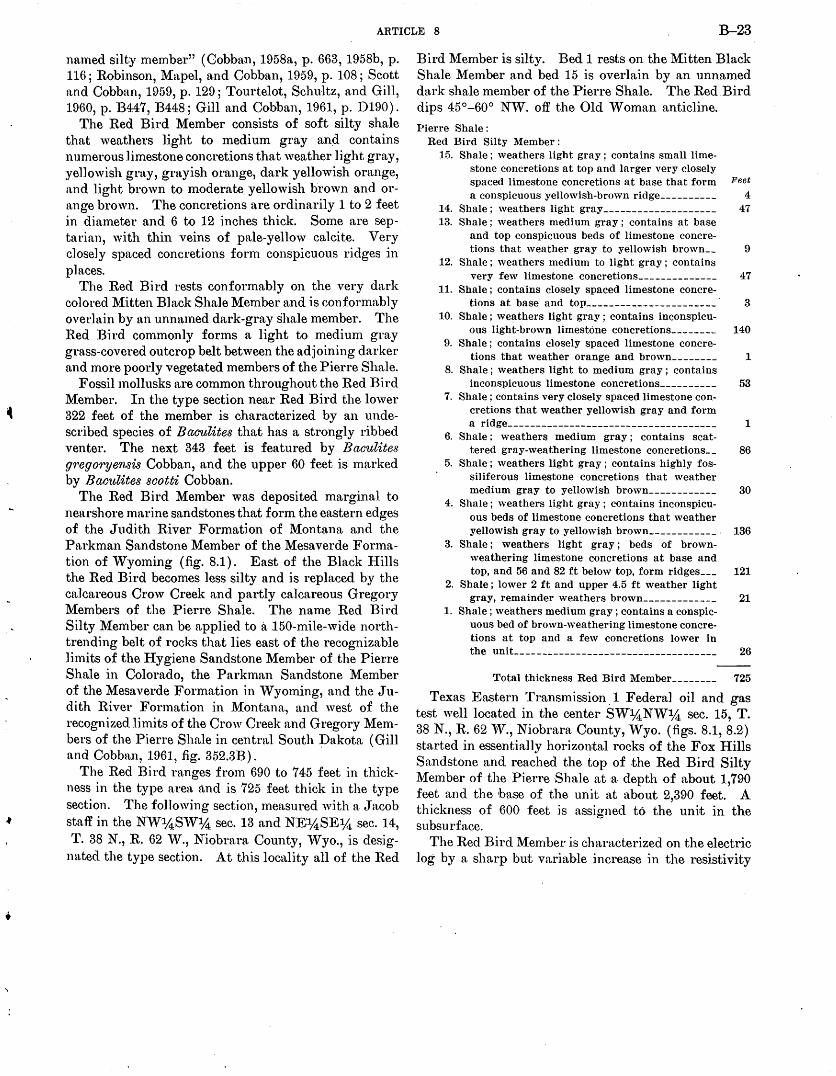
ARTICLE 8 B-23
named silty member" (Cobban, 1958a, p. 663, 1958b, p. 11(); Robinson, Mapel, and Cobban, 1959, p. 108; Scott and Cobban, 1959, p. 129; Tourtelot, Schultz, and Gill, 1960, p. B447, B448; Gill and Cobban, 1961, p. D190).
The Red Bird Member consists of soft silty shale tlutt weathers light to medium gray and contains numerous limestone concretions that weather light gray, yellowish gra,y, grayish orange, dark yellowish orange, and light brown to moderate yellowish brown and orange brown. The concretions are ordinarily 1 to 2 feet in diameter and 6 to 12 inches thick. Some are septarian, with thin veins of pale-yellow calcite. Very closely spaced concretions form conspicuous ridges in places.
The Red Bird rests conformably on the very dark colored Mitten Black Shale Member and is conformably overlain by nn unna1ned dark-gray shale member. The Red Bird commonly forms a light to medium gray grass-covered outcrop belt between the adjoining darker and more poorly vegetated members of the Pierre Shale.
Fossil mollusks are common throughout the Red Bird Member. In the type section near Red Bird the lower 322 feet of the member is characterized by an undescribed species of Baculites that has a strongly ribbed venter. The next 343 feet is featured by Baculites g'regO'I·yensis Cobban, and the upper 60 feet is marked by B aculites scotti Cobban.
The Red Bird Member was deposited marginal to nearshore marine sandstones that form the eastern edges of the Judith River Formation of Montana and the Pn,rkman Sandstone Member of the Mesaverde Formation of Wyoming (fig. 8.1). East of the Black Hills the Red Bird becomes less silty and is replaced by the calcareous Crow Creek and partly calcareous Gregory Members of the Pierre Shale. The name Red Bird Silty Member can be applied to a 150-mile-wide northtrending belt of rocks that lies east of the recognizable limits of the :Hygiene Sandstone Member of the Pierre Shale in Colorado, the Parkman Sandstone Member of the Mesaverde Formation in Wyoming, and the Judith River Formation in Montana, and west of the recognized limits of the Crow Creek and Gregory Members of the Pierre Shale in central South pakota (Gill and Cobban, 1961, .fig. 352.3B).
The Red Bird ranges from 690 to 745 feet in thickness in the type area and is 725 feet thick in the type section. The following section, measured with a Sacob staff in the NW1,4SW% sec. 13 and NE:%SE% sec. 14, T. 38 N., R. 62 W., Niobrara County, Wyo., is desig
mtted the type section. At this locality all of the Red
Bird Member is silty. Bed 1 rests on the Mitten Black Shale Member and bed 15 is overlain by an unnamed dark shale member of the Pierre Shale. The Red.Bird dips 45°-60° NW. off the Old Woman anticline.
Pierre Shale : Red Bird Silty Member:
15. Shale; weathers light gray ; contains small lime-stone concretions at top and larger very closely spaced limestone concretions at base that form Feet a conspicuous yellowish-brown ridge__________ 4
14. Shale; weathers light gray____________________ 47 13. Shale ; weathers medium gray ; contains at base
and top conspicuous beds of limestone concre-tions that weather gray to yellowish brown__ 9
12. Shale; weathers medium to light gray; contains very few limestone concretions______________ 47
11. Shale ; contains closely spaced limestone concre-tions at base and top _______________________ . 3
10. Shale ; weathers light gray ; contains inconspicu-ous light-brown limestone concretions________ 140
9. Shale ; contains closely spaced limestone concre-tions that weather orange and brown________ 1
8. Shale; weathers light to medium gray; contains inconspicuous limestone concretions__________ 53
7. Shale ; contains very closely spaced limestone concretions that weather yellowish gray and form a ridge_____________________________________ 1
6. Shale; weathers medium gray; contains scat-tered gray-weathering limestone concretions__ 86
5. Shale; weathers light gray; contains highly fossiliferous limestone concretions that weather medium gray to yellowish brown____________ 30
4. Shale; weathers light gray; contains inconspicu-ous beds of limestone concretions that weather yellowish gray to yellowish brown ____________ . 136
3. Shale ; weathers light gray ; beds of brownweathering limestone concretions at base and top, and 56 and 82 ft below top, form ridges___ 121
2. Shale ; lower 2 ft and upper 4.5 ft weather light gray, remainder weathers brown_____________ 21
1. Shale; weathers medium gray; contains a conspicuous bed of brown-weathering limestone concretions at top and a few concretions lower in the unit____________________________________ 26
Total thickness Red Bird Member-------- 725
Texas Eastern Transmission . 1 Federal oil and gas test well located in the center SW%NW"% sec. 15, T. 38 N., R. 62 W., Niobrara County, Wyo. (figs. 8.1, 8.2) started in essentially horizontal rocks of the Fox Hills Sandstone and reached the top of the Red Bird Silty Member of the Pierre Shale at a depth of about 1,790 feet and the base of the unit at about 2,390 feet. A thickness of 600 feet is assigned to the unit in the subsurface.
The Red Bird Member is characterized on the electric log by a sharp but variable increase in the resistivity
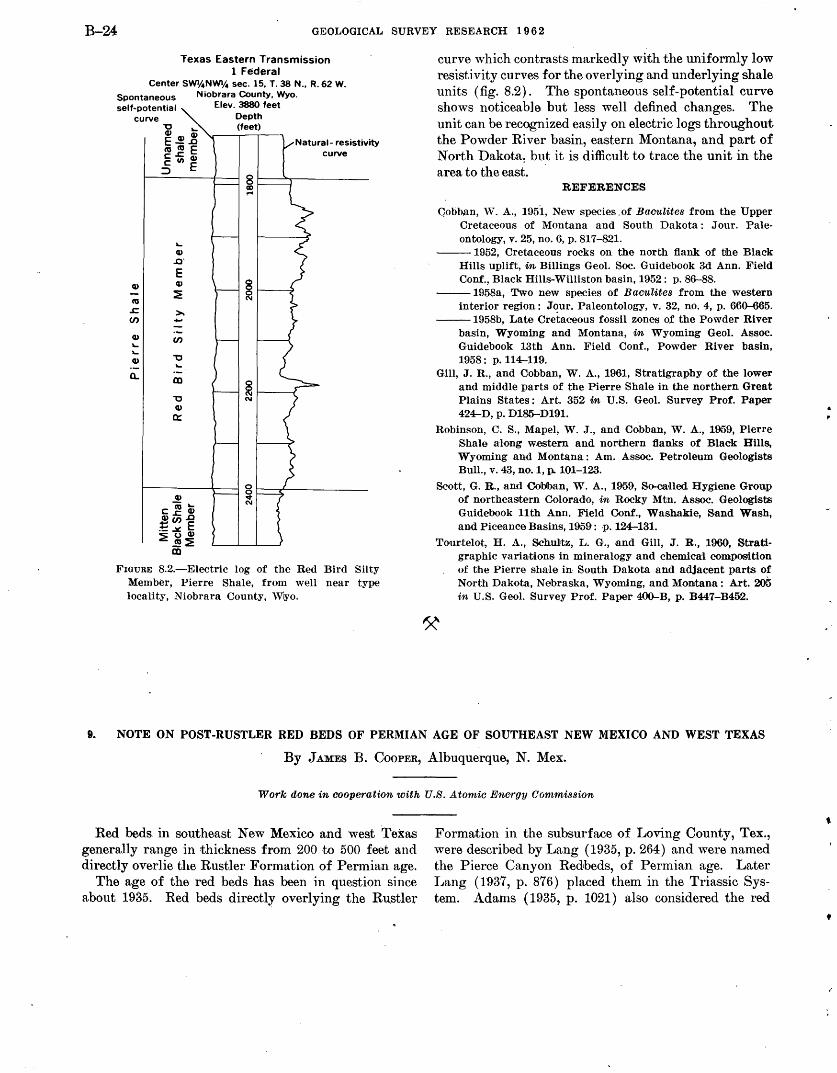
B-24 GEOLOGICAL SURVEY RESEARCH 1 9 6 2
"Texas Eastern Transmission 1 Federal
Center SWl/.tNWl/4 sec. 15, T. 38 N., R. 62 W.
Spontaneous self·potential
Niobrara County, Wyo. Elev. 3880 feet
Q)
CQ
.r:. en Q) ~
~
Q)
a..
~
Q)
..0'
E Q)
~
>. -en "0 ~
·-m
"0 Q)
0::
Q)
c: (ij Q) Q)J::..C
~~E ~~~
ffi
Depth (feet)
curve
FIGURE 8.2.-Electric log of the Red Bird Silty Member, Pierre Shale, from well near type locality, Niobrara County, W\yo.
curve which contrasts markedly with the uniformly low resistivity curves for the overlying and underlying shale units (fig. 8.2). The spontaneous self-potential curve shows noticeable but less well defined changes. The unit can be rec~onized easily on electric logs throughout the Powder River basin, eastern Montana, and part of North Dakota, but it is difficult to trace the unit in the area to the east. .
REFERENCES
Qobban, W. A., 195i, New species .of Baculites from the Upper Cretaceous of Montana and South Dakota: Jour. Paleontology,v.25,no.6,p.817-821.
--1952, Cretaceous rocks on the north flank of tJbe Black Hills uplift, in Billings Geol. Soc. Guidebook 3d Ann. Field Conf., Black Hills-Williston basin, 1952: p. 86-88.
--1958a, Two new species of Baculites from the western interior region: J~ur. Paleontology, v. 32, no. 4, p. 660-665 .
--1958b, Late Cretaceous fossil zones of the Powder River basin, Wyoming and Montana, in Wyoming Geol. Assoc. Guidebook 13th Ann. Field Conf., Powder River basin, 1958: p.114-119.
Gill, J. R., and Cobban, W. A., 1961, Stratigraphy of the lower and middle parts of the Pierre Shale in the northern Great Plains States: Art. 352 in U.S. Geol. Survey Prof. Paper 424-D, p. Dl85--D191.
Robinson, C. S., Mapel, W. J., and Cobban, W. A., 1959, Pierre Shale along w.estern and nofltbern flanks of Black Hills, Wyoming and Montana : Am. Assoc. Petroleum Geologists Bull., v. 43, no. 1, p. 101-123.
Scott, G. R., and Cobban, W. A., 1959, So-caned Hygiene Gronp of northeastern Colorado, in Rocky Mtn. Assoc. GeologlsU; Guidebook 11th Ann. Field Conf., Washakie, Sand Wash, and Piceance Basins, 1959: p. 124-131.
Tour.telot, H. A., Schultz, L. G., and Gill, J. R., 1960, Stratigraphic variaotions in mineralogy and chemica·l composition of tJhe Pierre shale in South Dakota and adjacent parts of North Dakota, Nebraska, Wyoming, and Montana: Art. 205 in U.S. Geol. Survey Prof. Paper 400-B, p. B447-B452.
9. NOTE ON POST-RUSTLER RED BEDS OF PERMIAN AGE OF SOUTHEAST NEW MEXICO AND WEST TEXAS
By JAMES B. CooPER, Albuquerque, N. Mex.
Work done in cooperation with U.S. Atomic Energy Commission
Red beds in southeast New Mexico and west Texas generally range in thickness from 200 to 500 feet and directly overlie the Rustler Formation of Permian age.
The age of the red beds has been in question since about 1935. Red beds directly overlying the Rustler
Formation in the subsurface of Loving County, Tex., were described by Lang ( 1935, p. 264) and were named the Pierce Canyon Redbeds, of Permian age. Later Lang (1937, p. 876) placed them in the Triassic System. Adams ( 1935, p. 1021) also considered the red
t
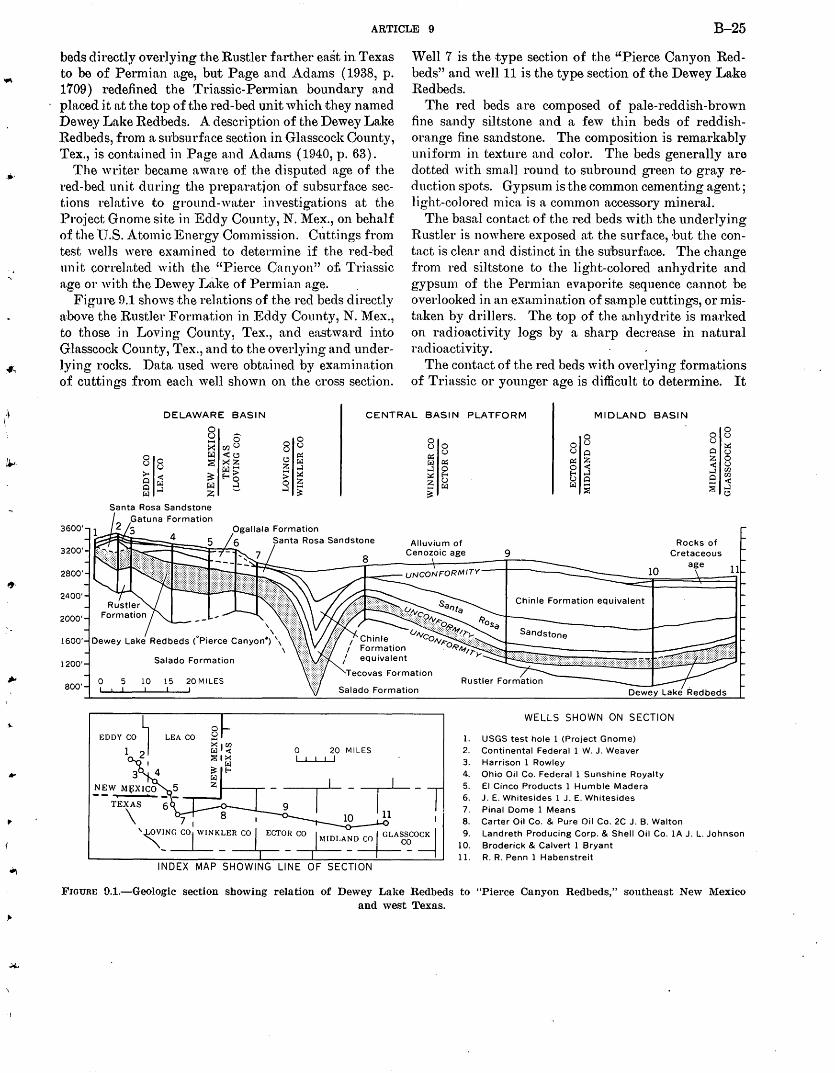
,,..
ARTICLE 9 B-25
beds directly overlying the Rustler farther east in Texas to be of Permian age, but Page and Adams (1938, p. 1709) redefined the Triassic-Permian boundary and placed it at the top of the red-bed unit which they named Dewey Lake Redbeds. A description of the Dewey Lake Redbeds, from a subsurface section in Glasscock County, Tex., is contn,ined in Page and Ada.ms (1940, p. 63).
The writer became n.ware of the disputed age of the red-bed unit during the prepn.ratjon of subsurface sections reln.tive to ground-wa,ter investigations at the Project Gnome site in Eddy County, N. Mex., on behalf of the ·u.S. Atomic Energy Commission. Ct~ttings from test wells were examined to determine if the red-!bed unit correlated with the "Pierce Canyon" of, Triassic n.ge or with the Dewey Lake of Permian age.
Figure 9.1 shows the relations of the red beds directly 11hove the Rustler Formation in Eddy County, N.Mex., to those in Loving County, Tex., and eastward into Glasscock County, Tex., and to the overlying and underlying rocks. Data used were obtn.ined by examination of cuttings from each well shown on the cross section.
Well 7 is the type section of the "Pierce Canyon Redbeds" and well 11 is the type section of the Dewey Lake Redbeds.
The red beds are com posed of pale-reddish-brown fine s~tndy siltstone and a few thin beds of reddishorange fine sandstone. The composition is remarkably uniform in texture and color. The beds generally are dotted with small round to subround green to gray reduction spots. Gypsum is the common cementing agent; light-colored mica is a common accessory mineral.
The basal contact of the red beds with the underlying Rustler is nowhere exposed at the surface, hut the contact is clear and distinct in the subsurface. The change from red siltstone to the light-colored anhydrite and gypsum of the Permian evaporite sequence cannot be overlooked in an exa.mination of sample cuttings, or mistaken by drillers. The top of the anhydrite is ma.rked on radioactivity logs by a sharp decrease in natural radioactivity.
The contact of the red beds with over lying formations of Triassic or younger age is difficu It to determine. It
DELAWARE BASIN CENTRAL BASIN PLATFORM MIDLAND BASIN
0 0 (.) 8 0 0 0 u ;;< 0 0 u u
ooU u u 0 0 ~ u u u ~ ~ u
T ~ <((,!) p:: p:: z 0 ~ :><Z (.!) ~ ~ p:: p:: z u u < u ~- z ~ ~ 0 0 < ~ en
>< < ~ E-<~ > ~ ~ E-< E-< ~ en ~ ~ 0 z z u u ~ ~ < ~ ~ ~ ::. ~ ~ ~
~ ~ ~ ~ ~ z (.!)
Santa Rosa Sandstone
3600' nta Rosa Sandstone Rocks of
3200'
2800'
2400'
2000'
1600'
1200'
WELLS SHOWN ON SECTION
1. USGS test hole 1 (Project Gnome) 0 20 MILES 2. Continental Federal 1 W. J. Weaver LLL.LJ 3. Harrison 1 Rowley
4. Ohio Oil Co. Federal 1 Sunshine Royalty 5. El Cinco Products 1 Humble Madera 6. J. E. Whitesides 1 J. E. Whitesides 7. Pinal Dome 1 Means 8. Carter Oil Co. & Pure Oil Co. 2C J. B. Walton 9. Landreth Producing Corp. & Shell Oil Co. 1A J. L. Johnson
10. Broderick & Calvert 1 Bryant 11. R. R. Penn 1 Habenstreit
INDEX MAP SHOWING LINE OF SECTION
FrounE 9.1.-Geologic section showing relation of Dewey Lake Redbeds to "Pierce Canyon Redbeds," southeast New Mexico and west Texas.
B-26 GEOLOGICAL SURVEY RESEARCH 1 9 6 2
is not usually recognized by drillers. The contact is not always apparent from an examination of sample cuttings, although it is generally recognizable if the samples 'have been properly collected and prepared. As shown on figure 9.1, the red beds are overlain by the Tecovas Formation as far west as eastern Loving County, Tex.; northwest of these the red beds are overlain by the Santa Rosa Sandstone of Triassic age and the Ogallala Formation (Pliocene).
The change from rocks of known Triassic age to red beds of Pet-mian or Triassic age is generally marked by a change from a dark purplish color to a dull reddish brown. Rocks of Triassic age generally contain fine angular sand gra.ins and much da.rk mica, 'vhich are uncommon in the red beds. Reduction spots are useful, in a general way, as a stratigraphic marker, although they are not limited to the red beds hut are found also in the overlying beds of Triassic age. However, the reduction spots are more abundant in the red beds, and when the spots are present in quantity the observer can search more closely for other diagnostic features of the red beds.
Garza and Wesselman (1959, p. 18) report that in Winkler County, Tex., the top of the red beds generally is recognizable on gamma-ray and electric logs. The structural trough in Winkler County, shown on the cross section, was outlined by them from electric-log data. This trough. was formed by subsidence during removal by ground water of soluble salts in the underlying Permian rocks. The east edge of the- trough approximately overlies the buried Capitan reef, and the axis of the trough trends generally south, extending from Lea County, N.Mex., through the western part of Winkler County and southward into Ward County.
The purpose of this paper is to point out that the red beds overlying the Rustler Formation in southeast New Mexico and the Dewey Lake Redbeds overlying the Rustler in west Texas appear to be a single lithologic and stratigraphic unit, and that, to the writer, the lithology, color, and apparently conformable relation with the Rustler Formation suggest that the red beds are of Permian age. In view of these relationships, only one name should be used for this unit. The name Dewey Lake Redbeds is well established in the literature and is used by industry for this unit in New Mexico as well as Texas, and no question has been raised as to its validity or age designation. Also, the age designations of Permian, Triassic, and Permian or Triassic given the red beds called "Pierce Canyon" in geologic literature have been confusing. Accordingly the name Dewey La.ke Redbeds is used herein for the post-Rustler red-bed-unit.
REFERENCES
Adams, J. E., 1935, Upper Permian stratigraphy of West Texas Permian Basin: Am. Assoc. Petroleum Geologists Bull., v. 19, no. 7, p. 1010-1022, 2 figs.
Garza, S., and Wesselman, J. B., 1959, Geology and groundwater resources of Winkler County, Texas: Texas Board of Water Engineers BUll. 5916, 200 p., 8 pls., 15 figs.
I.ang, W. B., 1935, Upper Permian formations of Delaware basin of Texas and New Mexico: Am. Assoc. Petroleum Geologists Bull., v. 19, n<>. 2, p. 262-270, 7 figs.
--1937, The Permi-an formations of the Pecos Valley of New Mexico and Texas: Am. Assoc. Petroleum Geologists Bull., v. 21, no. 7, p. 833-898, 29 figs.
Page, L. R., and Adams, J. E., 1938, Stratigraphy, Eastern Midland Batsin, Texas [abs.] : Am. Assoc .. Petroleum Geologists Bull., v. 22, no. 1Z, p. 1709.
--1940, Stratigraphy, Eastern Midland Basin, Texas : Am. Assoc. Petroleum Geologists Bull., v. 24, no. 1, p. 52-64, 2 figs.
10. VOLCANIC ROCKS OF OLIGOCENE AGE IN THE SOUTHERN PART OF THE MADISON RANGE, MONTANA AND IDAHO
By WARREN HAMILTON and EsTELLA B. LEoPOLD, Denver, Colo.
The south end of the Madison Range is composed of Oligocene tuffs and flows that overlie rocks ranging from middle ( ? ) Precambrian to Early Cretaceous in age and that are overlapped by Pliocene(?) and Pleistocene rhyolite tuffs of the surrounding YellowstoneSnake River volcanic province (fig. 10.1). This article is based upon reconnaissance made as part of the geo-
logic study of the region of the Hebgen Lake earthquake of 1959. A summary of the volcanic geology has been published (Hamilton, 1960).
The Oligocene rocks, exposed in the mountains south of Targhee Pass, make a bedded sequence about 1,000 feet thick of rhyolite welded tuff and mafic alkaline lava. This part of the Madison Range is a fault block
.. _
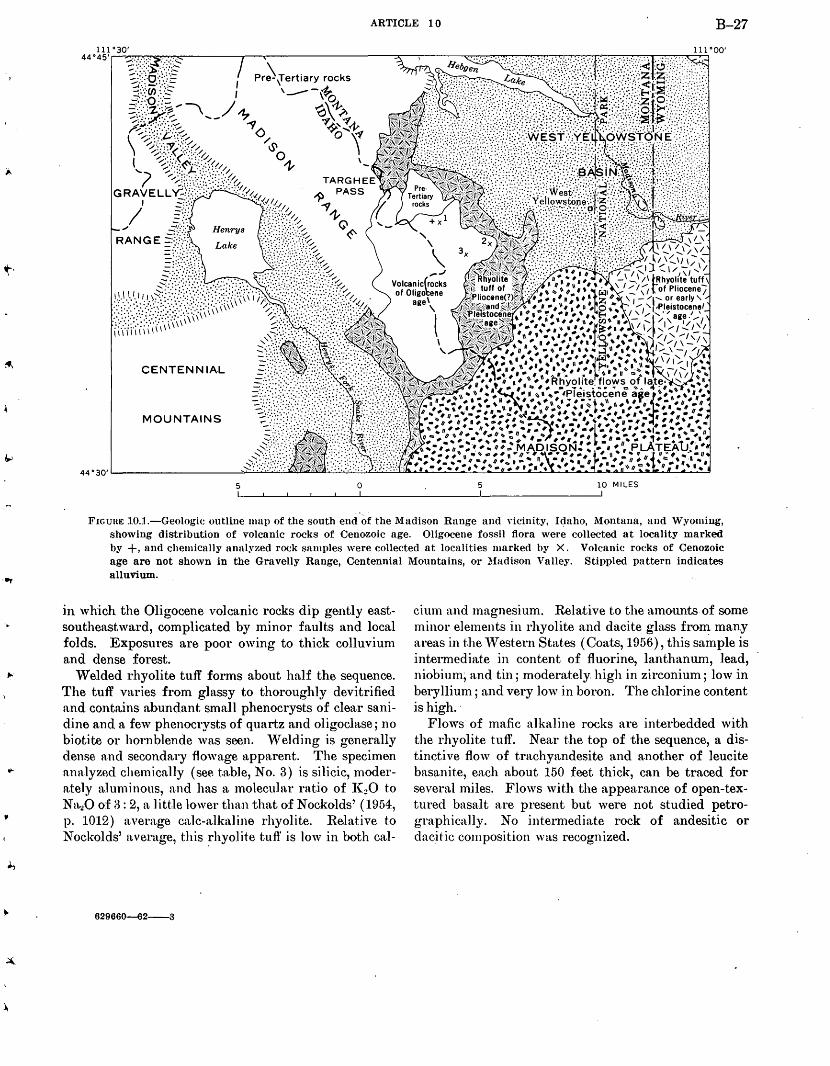
':-·
.~
. ..,
'
ARTICLE 10 B-27
.....,
RANGE=:::.:
~!~t.~;~~N~\~~~;Dt~')l~;~:;·i·, i1Yii'11111 111
CENTENNIAL
MOUNTAINS
5
Pr~\fertiary rocks
'---~ 'o B~~-?» ~~,~~ o''\
0 5 10 MILES
FIGUUE 10.1.-Geologi<: outline map of the south end of the Madison Range and Yicinity, I~aho, Montana, and Wyoming, showing distribution of volcanic rocks of Cenozoic age. Oligocene fossil flora were collected at locality marked by +, and chemically analylr.ed rock samples were collected at localities marked by X. Volcanic rocks of Cenozoic age are not shown in the Gravelly Range, Centennial Mountains, or Madison Valley. Stippled pattern indicates alluvium .
in which the Oligocene volcanic rocks dip gently eastsoutheastward, complicated by minor faults and local folds. Exposures are poor owing to thick colluvium and dense forest.
Welded rhyolite tuff forms about half the sequence. The tuff varies from glassy to thoroughly devitrified and contains abundant small phenocrysts of clear sanidine and a few phenocrysts of quartz and oligoclase; no biotite or hornblende was seen. Welding is generally dense a,nd secondary flowage apparent. The specimen nnn.lyzP,d chemically (see ta,ble, No. 3) is silicic, moderately nJuminous, and luts a moleculnr ratio of K 20 to Na,..!O of 3: 2, a little lower than that of Nockolds' (1954, p. 1012) average calc-alkaline rhyolite. Relative to Nockolds' average, this ~·hyolite tuff is low in both cal-
629660--62--3
cium and magnesium. Relative to the amounts of some minor elements in rhyolite and dacite glass from many areas in the "\Vestern States (Coats, 1956), this sainple is intermediate in content of fluorine, lanthanum, lead, niobium; and tin; moderately high in zirconium; low in beryllium; and very low in boron. The chlorine content is high.·
Flows of mafic alkaline rocks are interbedded with the rhyolite tuff. Near the top of the sequence, a distinctive flow of trachya.ndesite and another of leucite basanite, each about 150 feet thick, can be traced for several miles. Flows with the appearance of open-textlired basalt are present but were not studied petrographically. No intermediate rock of andesitic or dacitic composition was recognized.
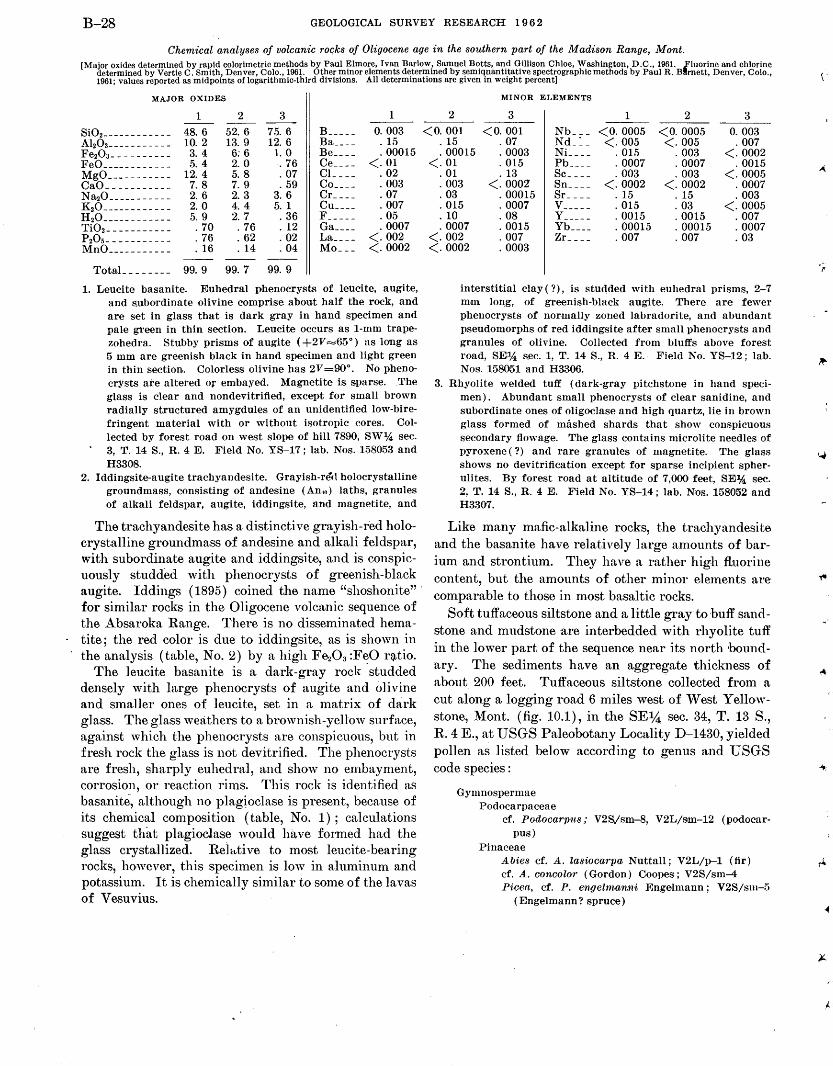
B-28 GEOLOGICAL SURVEY RESEARCH 1 9 6 2
Chemical analyses of volcanic ror;ks of Oligocene age in the southern part of the Madison Range, Mont. [Major oxides determined by rapid colorimetric methods by Paul Elmore, Ivan Barlow, Samuel Botts, and Gillison Chloe, Washington, D.C., 1961. .Fluorine and chlorine
determined by Vertie C. Smith, Denver, Colo., 1961. Other minor elements determined by semiquantitative spectrographic methods by Paul R. B!lmett, Denver, Colo., 1961; values reported as midpoints of logarithmic-third divisions. All determinations are given in weight percent]
MAJOR OXIDES
1 2 3 1
Si02------------ 48. 6 52. 6 75. 6 B _____ 0. 003 Al20a----------- 10. 2 13. 9 12. 6 Ba ____ . 15 Fe20a- _-------- 3. 4 6:6 1.0 Be ____ . 00015 FeO _____ - ------ 5. 4 2. 0 . 76 Ce ____ <. 01 MgO ___ - - - - - - - - 12. 4 5. 8 . 07 CL ___ . 02 CaO ______ - _ - - - 7. 8 7. 9 . 59 Co ____ . 003 N a20 ______ - _ - - - 2. 6 2. 3 3. 6 Cr ____ . 07 K20----- - - - - - - - 2. 0 4. 4 5. 1 Cu ____ . 007 H2o _____ ------- 5. 9 2. 7 . 36 F _____ . 05 Ti 02 ___ ------- - . 70 . 76 . 12 Ga ____ . 0007 P20s----------- . 76 . 62 . 02 La ____ <. 002 MnO ____ ------- . 16 . 14 . 04 Mo ___ <. 0002
TotaL _______ 99. 9 99. 7 99. 9
1. Leucite basanite. Euhedral phenocrysts of leucite, augite, and s.ubordinate olivine comprise about half the rock, and are set in glass that is dark gray in hand specimen and pale green in thin section. Leucite occurs as 1-mm trapezohedra. Stubby prisms of augite (+2V=65°) as long as 5 mm are greenish black in hand specimen and light green in thin section. Colorless olivine has 2V =90°. No phenocrysts ate altered o:r embayed. Magnetite is sparse. .The glass is clear and nondevitrified, except for small brown radially structured amygdules of an unidentified low-birefringent material with or without isotropic cores. Collected by forest road on west slope of hill 7890, SW~ sec. 3, T. 14 S., R. 4 E. Field No. YS-17; lab. Nos. 158053 and H3308.
2. Iddingsite-augite trachyandesite. Grayish-ref\ holocrystalline groundmass, consisting of andesine (Anw) laths, granules of alkali feldspar, augite, iddingsite, and magnetite, and
The trachyandesite has a distinctive grayish-red holocrystalline groundmass of andesine and alkali feldspar, with subordinate augite and iddingsite, and is conspicuously studded with phenocrysts of greenish-black augite. Iddings ( 1895) coined the name "shoshonite" · for similar rocks in the Oligocene volcanic sequence of the Absaroka Range. There is no disseminated hematite; the red color is due to iddingsite, as is shown in the analysis (table, No. 2) by a high Fe.z03 :FeO r~tio.
The leucite basanite is a dark-gray rock ·studded densely with large phenocrysts of augite and olivine and smaller ones of leucite, set in a matrix of dark glass. The glass wetithers to a brownish-yellow surface, against which the phenocrysts are conspicuous, but in fresh rock the glass is not devitrified. The phenocrysts are fresh, sharply euhedral, and show no embayment, corrosion, or reaction rims. This rock is identified as basanite, although no plagioclase is present, because of its chemical composition (table, No. 1); calculations suggest that plagioclase would have formed had the glass crystallized. Reic~tive to most leucite-bearing rocks, however, this specimen is low in aluminum and potassium. It is chemically similar to some of the lavas of Vesuvius.
MINOR ELEMENTS
2 3 1 2 3 <O. 001 <O. 001 Nb ___ <O. 0005 <O. 0005 0. 003
. 15 . 07 Nd_ ~ _ <· 005 <. 005 . 007
. 00015 . 0003 Ni_ ___ . 015 . 003 <. 0002 <. 01 . 015 Pb ____ . 0007 . 0007 . 0015
. 01 . 13 Sc ____ . 003 . 003 <. 0005
. 003 <. oooz Sn ____ <. 0002 <. 0002 . 0007
. 03 . 00015 Sr_--- . 15 . 15 . 003
. 015 . 0007 v _____ . 015 . 03 <. 0005
. 10 . 08 y ----- . 0015 . 0015 . 007
. 0007 . 0015 Yb ____ . 00015 . 00015 . 0007 <. 002 . 007 Zr_--- . 007 . 007 . 03 <. 0002 . 0003
interstitial clay ( ? ) , is studded with euhedral prisms, 2-7 mm long, of greenish-black augite. There are fewer phenocrysts of normally zoned labradorite, and abundant pseudomorphs of red iddingsite after small phenocrysts and granules of olivine. Collected from bluffs above forest road, SE1,4 s.ec. 1, T. 14 S., R. 4 E. Field No. YS-12; lab. Nos. 158051 and H3306.
3. Rhyolite welded tuff (dark-gray pitchstone in hand specimen). Abundant small phenocrysts of clear sanidine, and subordinate ones of oligoclase and high quartz, lie in brown glass formed of mashed shards that show conspicuous secondary flowage. The glass contains microlite needles of pyroxene ( ?) and rare granules of magnetite. The glass shows no devitrification except for sparse incipient spherulites. By forest road at altitude of 7,000 feet, SE% sec. 2, T. 14 S., R. 4 E. Field No. YS-14; lab. Nos. 158052 and H3307.
Like many mafic-alkaline rocks, the trachyandesite and the basanite have relatively large amounts of barium and strontium. They have a rather high fluorine content, but the amounts of other minor elements are· comparable to those in most basaltic rocks.
Soft tuffaceous siltstone and a little gray to buff sandstone and mudstone are interbedded with rhyolite tuff in the lower part of the sequence near its north boundary. The sediments have an aggregate thickness of about 200 feet. Tuffaceous siltstone ·collected from a cut along a logging road 6 miles west of West Yell owstone, Mont. (fig. 10.1), in the SE% sec. 34, T. 13 S., R.. 4 E., at USGS Paleobotany Locality D-1430, yielded pollen as listed below according to genus and USGS code species :
Gymnospermae Podocarpaceae
cf. Podocarp1t8; V2S/sm-8, V2L/sm-12 (podocarpus)
Pinaceae Abies cf. A. lasiocarpa Nuttall; V2L/p-1 (fir) cf. A. concolor (Gordon) Coopes; V2S/sm-4 Picea, cf. P. engelmanni Engelmann ; V2Sjsm-5
(Engelmann? spruce)
A.
l'
...
.,.
ARTICLE 11 B-29
P·intts Y2S/sm-10 (pine) Tsuga cf. T. rnertensiana (Bongard) Sargent;
Tsng-1 (hemlock) Tnxodiaceae
cf. Sequoia a/finis Lesquereaux; Tax-p--1 (sequoia'?)
Gnetncene Ephed·ra cf . . E. nevadensis Watso~·; Gn-7 (ephedra)
.Angiospermae Gramineae, undetermined (grass) Snlica<.:eae
cf. Sal·ix; 03-rt-13 (willow) Juglandaceae
Oa·rya; P3-sm-40, P3-sm-14a (hickory) Pte·roca·rya; P5-sm-5, · P6-sm-:-2 ( lingnut)
Betul11ceae JJ etttla; :P3-sm -12 (birch) A.l'IMts; P5-sm-1, P4-sm-3 (alder) cf. Ost1·ya; P3-sm-43 (hornbeam)
Ulmf¥!ene Dlnws or Zel"ko·1:a.; P4-foss-1, P~foss-1 (elm)
Aquifoliaceae Jle:c; C3P3-p-4 (holly)
Rosacette ; 03-st-2 Family and generic affinities not certain :
cf. E'llcomon·ia,; 03-sm-18 cf. Platanus; 03-r-21 (sycamore?) cf. Liq·ni(la?nbar ,· P3-sm-42 cf. 'l.'·il·ia; BCP3-r-7 (linden?) Stcphanop01·opollenites; P5-sm-4 (a pollen-form
genus)
Four of the cerbtinly identified genera ( Oa1·ya, PteToca'rya, [llmtt8 or Zelh~ova, and /lex) do not now live in the region. The pollen species of Salix ( ~), Platantl8 ( ?) , 1',ilia (?), a.nd StephanoJJOT01Jollenites have been found in the 'Vestern States only in sediments of Oligocene age, including the Florissant Lake Beds of Colorado and the 'Vhite River Group of 'Vyoming.
~1ost of the other plants are known from strata of both Oligocene and ~Eocene ages in the region, although several have not been found previously in the region in rocks of either age. An Oligocene age is probable, and a 1noist-temperate climate is indicated.
Lapping onto the Oligocene and pre-Tertiary rocks of the southern part of the Madison Range a.re rhyolite tuffs of the Snake River-Yellowstone volcanic pt~ovince (fig. 10.1) of Pliocene and Qmtternary volcanism. The young rhyolite is genera1ly on low ground about the base of the mountains-porous Pleistocene rhyolite laps across the Madison R~1>nge frontal fault from the basin of Henrys Fork of the Snake River-although Pliocene(~) rhyolite has been considerably uplifted north of Targhee F ass. Constructional surfaces are preserved on large areas of these young rhyolites~ whereas they are lacking on· the Oligocene rocks. Alkaline ma.fic rocks are limited to the Oligocene sequence, but as some of the rhyolite of ·that sequence is similar to welded tuff of the Yellowstone volcanic province the two assemblages may have been confused in part.
REFERENCES
Coats, R. R., 1956, Relationship of uranium and other trace elements to post-Cretaceous vulcanism: U.S. Geol. Survey TEI-159, 66 p., issued ·by U.S. Atomic Energy Comm. Tech. Inf. Service, Oak Ridge, Tenn.
Hamilton, Warren, 1000, Late Ceno7-oic tectonics and volcanism of the Yellowstone region, "\Vyo.ming, Montana, and Idaho, in Billings Geol. Soc. Guidebook 11th Ann. Field Conf., West Yellowstone-earthquake area, 1960: p. 92-105.
Iddings, J. P., 1895, Absarokite-shoshonite-banakite series: Jour. Geology, v. 3, p. 935-959.
Nockolds, S. R., 1954, Average chemical compositions of some igneous rocks: Geol. Soc. America Bull., v. 65, p. 1007-1032.
11. RADIOCARBON DATES RELATING TO A WIDESPREAD VOLCANIC ASH DEPOSIT, EASTERN ALASKA
By ARTHUR T. FERNALD, Washington, D.C.
A conspicuous blanket of volcanic ash, first described by Schwatka (1885, p. 196) and Dawson (1889, p. 43b-46b), covers a wide area in eastern Alaska and southern Yukon Territory. It generally occurs at or near the surfn.ce of the ground, ~ut in certain localities it has been buried by sever~tl feet of loess and organic material. The distribution and thickness of the ash have been m~tpped in detail by Bostock ( 1952, fig. 1).
Capps (1916, p. 69-75, 81-83) estimated the age of the ash to be 1,400 years in the vVhite River valley,
where it is overlain by 7 feet of peat. He based this estimate on a calculn.ted accumulation rate of 1 foot of peat in 200 years determined from the ages of trees, tts shown by their annual rings, growing on a constantly thickening moss mat. He had observed that the trees send out successively higher root branches as the permafrost table, which is related to the thickness of n1oss, rises.
The 1,400-year age is remarkably close to radiocarbondated peat samples that indicate the ash fell between
B-30 GEOLOGICAL SURVEY RESEARCH 19 6 2
1,750 and 1,520 B.P. (Before' Present). The samples were collected from layered peat that overlies and underlies the ash in an exposure in the upper Tanana River valley. A pit dug in an interduue hollow within a stabilized dune field exposes, from top to bottom, (a) 16 inches of peat with admixtures of silt, (b) 6 inches of white ash, (c) 2 inches of peat, and (d) gray-brown dune sand. The sample (I-276) 1 from the bottom 2 inches of the upper peat bed is dated at 1,520+100 B.P. The sample (I-275) 1 from the lower bed has a date of 1,750+ 110 B.P.
Another radiocarbon-dated peat sample, collected from within the flood-plain deposits of the upper· Tanana River, gives a maximum age of 2,000+250 years B.P. for the ash fall. The cut bank exposes, from top to bottom, (a) 12 inches of layered peat, (b) 42 inches of bedded silt and fine sand with organic debris, (c) 30 inches of white ash with thin beds of gray silt, and (d) 6 inches of layered peat. The sample (W-978) 2 was cqllected from the middle part of the lower peat bed.
The age of the ash provides an important reference point in the interpretation of the surficial geology of the upper Tanana River valley, particularly the flood-plain deposits. The ash is not present on or within the deposits of the slip-off slopes of the Tanana River but it is preserut on all low terraces. It has been re: worked into the deposits of parts of the flood plain that are intermediate between the slip-off slopes and the low terraces, as in the cut bank described above.
REFERENCES
Bostock, H. S., 1952, Geology of northwest Shakwak valley, Yukon Territory: Canada Geol. Survey Mem. 267, 54 p.
Capps, S. R., 1916, The Chisana-White River District, Alaska: U.S. Geol. Survey Bull. 630, 130 p.
Dawson, G. M., 1889, Report on an exploration in the Yukon District, N. W. T., and adjacent northern portion of British Columbia: Canada Geol. Survey Ann. Rept., v. 3, pt. 1, rept. B ( 1887-88) , 277 p.
Schwatka, Frederick, 1885, Along Alaska's great river: New York, Cassell & Co., 360 p.
1 Dat~d by Isotope~, Inc., Westwood, N.J. 2 Dated by U.S. Geological Survey Radiocarbon Laboratory.
SEDIMENTATION AND SEDIMENTARY PE'/'ROLOGY
12. ORIGIN OF SPHERULITIC PHOSPHATE NODULES IN BASAL COLORADO SHALE, BEARPAW MOUNTAINS, MONTANA
By W. T. PEcoRA, B. C. HEARN, ,JR., and CHARLES MILTON, Washington, D.C.
STRATIGRAPHY
Spherulitic phosphate nodules occur in the Fall River Sandstone Member at the base of the marine Colorado Shale in the Bearpaw Mountains, north-central Montana. Virtually only the basal 30 feet of black fissile shale contains these nodules, and none have been found elsewhere in the stratigraphic section in this region. Interbedded with the black shale are thin beds of very fine grained thinly laminated sandstone that contain surficial casts of worm trails and· similar "spaghetti" markings. In, the upper, more sandy part of the member, which is some 300 feet thick, molds and prints of mollusks collected by W. T. Pecora and Joe H. Kerr in 1952 were identified by W.A. Cobban, of the U.S. Geological Survey, as I nooeramu,s bellev'lWn8is Reeside., Ostrea larimeren8is Reeside, ,and Ostrea noot'llten8is Reeside, which are indicative of Albian ag~~
In an easterly distance of 30 miles along the Bearpaw Mountains structural arch, spherulitic nodules have been found wherever the contact between the Kootenai Formation and overlying Colorado Shale is well exposed. In the eastern part of the mountains, near Cleveland, several domes in an area of about 60 square miles afford excellent exposures, whereas in the western part, metamorphism has somewhat inhibited liberation of the nodules from enclosing rock.
Black shale enclosing the phosphatic nodules is nonfossiliferous and free of other nodules or concretions
' such as those of carbonate, pyrite, or barite that occur in shale at other stratigraphic horizons in the region. The shale is laminated and composed of the typical ultra fine grained platy minerals (clay and mica) and angular to subrounded grains of quartz. Chemical analyses of unweathered basal shale that was free of
....
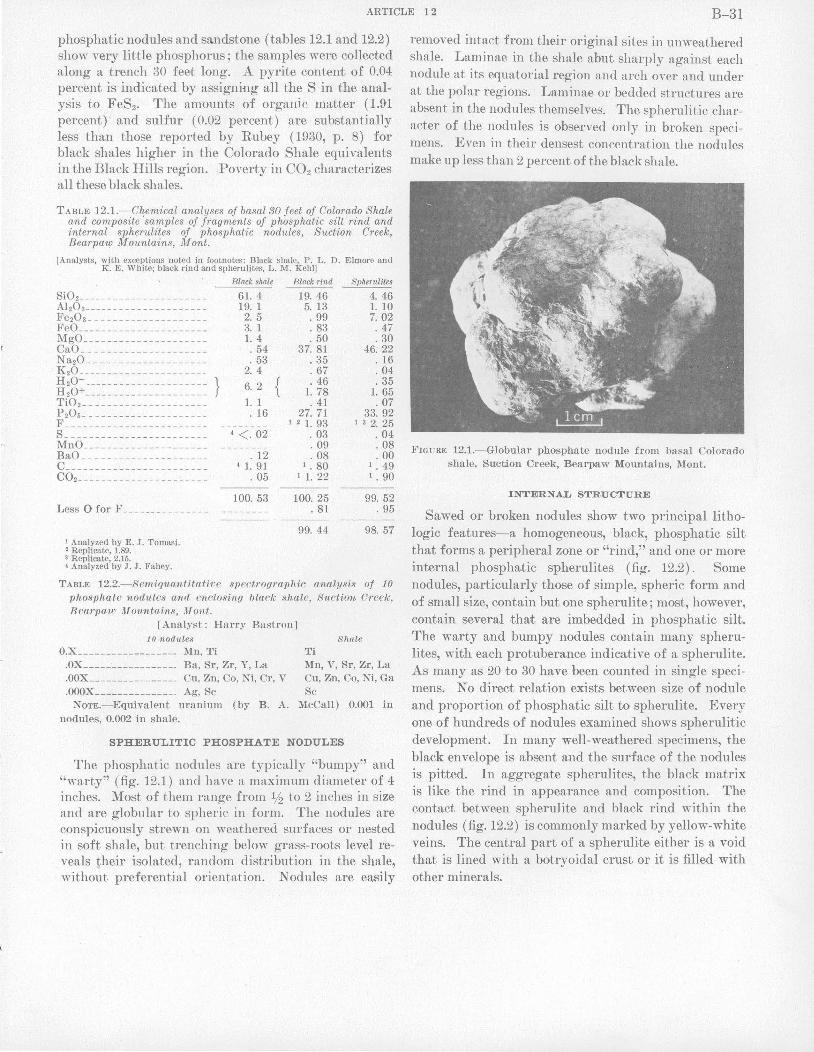
ARTICLE 12 B-31
phosphatic nodules and sandstone (tables 12.1 and 12.2) show very little phosphorus; the samples were collected along a trench 30 feet long. A pyrite content of 0.04 percent is indicated by assigning all the S in the analysis to FeSz. The amounts of organic mUJtter ( 1.91 percent) · and sulfur ( 0.02 percent) are substantially less than those reported by Rubey ( 1930, p. 8) for black shales higher in the Colorado Shale equivalents in the Black Hills region. .Poverty in C02 characterizes all these black shales.
TABLE 12.1.-Chemical analyses of basal 30 feet of Colorado Shale and composite 'samples of fragments of phosphatic silt rind and internal spherulites of phosphatic nodules, Suction Creek, Bearpaw Mountains, Mont.
[Analysts, with exceptions noted in footnotes: Black shale, P. L. D . Elmore and K. E. White; black rind and spherulites, L. M. Kehl]
Black shale Rlack rind Spherulites
Si02------- - -------------Ah0a------- --- --- -------Fe20a --------------------FeO ________________ _____ _ ~gO ______ ___ ___________ _ Cao __________ ____ ____ __ _ N a20 _ - - - - ------ ---------K20 __ ___ ___ _____________ _ H2o- ________ _____ _____ ___ } H20+ ____ _____ ___________ _ Ti02--- - ---- ------------P205------ --- ------------F ___ _____________ _______ _ s _____ ______ ______ ______ _ ~no ____________ ___ _____ _ BaO ____ ___ _____________ _ c _______ _____ ___________ _ C02- -_--- _------- ___ -_- __
Less 0 for F ____ __ ________ _
' Analyzed by E. J. Tomasi. 2 Replicate, 1.89. a Replicate, 2.15. 4 Analyzed by J. J. Fahey.
61. 4 19. 1
2. 5 3. 1 1.4 . 54 . 53
2. 4
6. 2 { 1. 1 . 16
4 <· 02
. 12 4 1. 91
. 05
100. 53
19. 46 5. 13
. 99
. 83
. 50 37. 81
. 35
. 67
. 46 1. 78 . 41
27. 71 1 2 1. 93
. 03 . 09 . 08
1 • 80 1 1. 22
100. 25 . 81
99. 44
4. 46 1. 10 7. 02
. 47
. 30 46. 22
. 16
. 04
. 35 1. 65 . 07
33. 92 1 3 2. 25
. 04
. 08
. 00 1 • 49 1 • 90
99. 52 . 95
98. 57
TABLE 12.2.-Semiquantitative spectrographic analysis of 10 phosphate nodttles ancl enclosing black shale, Suction Creek, B earpaw Mountains, Mont.
[Analyst: Harry Bastron] 10 nodules
o.x __________________ Mn, 'l'i
.ox _____ ·___________ _ Ba, Sr, Zr, Y, La
.oox ________________ Cu, Zn, Co, Ni, Cr, v
.ooox _____________ __ Ag, sc
Shale
Ti Mn, V, Sr, Zr, La Cu, Zn, Co, Ni, Ga Sc
NOTE.-Equivalent uranium (by B. A. McCall) 0.001 in nodules, 0.002 in shale.
SPHERULITIC PHOSPHATE NODULES
The phosphatic nodules are typically "bumpy" and "warty" (fig. 12.1) and have a maximum diameter of 4 inches. Most of them range from lj2 to 2 inches in size and are globular to spheric in form. The nodules are conspicuously strewn on weathered surfaces or nested in soft shale, but trenching below grass-roots level reveals their isolated, random distribution in the shale, without preferential orientation. Nodules are easily
removed intact from their original sites in unweathered shale. Laminae in the shale abut sharply against each nodule at its equatorial region and arch over and under at the polar regions. Laminae or bedded structures are absent in the nodules themselves. The spherulitic character of the nodules is observed only in broken specimens. Even in their densest concentration the nodules make up less than 2 percent of the black shale.
J!..,IGURE 1.2.1.-Globular phosphate nodule from basal Colorado shale, Suction Creek, Bearpaw Mountains, Mont.
INTERNAL STRUCTURE
Sawed or broken nodules show two principal lithologic features-a homogeneous, black, phosphatic silt that forms a peripheral zone or "rind," and one or more internal phosphatic spherulites (fig. 12.2). Some nodules, particularly those of simple, spheric form and of small size, contain but one spherulite; most, however, contain several ·that are imbedded in phosphatic silt. The warty and bumpy nodules contain many spherulites, with each protuberance indicative of a spherulite. As many as 20 to 30 have been counted in single specimens. No direct relation exists between size of nodule and proportion of phosphatic silt to spherulite. Every one of hundreds of nodules examined shows spherulitic development. In many well-weathered specimens, the black envelope is absent and the surface of the nodules is pitted. In aggregate spherulites, the black matrix is like the rind in appearance and composition. The contact between spherulite and black rind within the nodules (fig. 12.2) is commonly marked by yellow-white veins. The central part of a spherulite either is a void that is lined with a botryoidal crust or it is filled with other minerals.
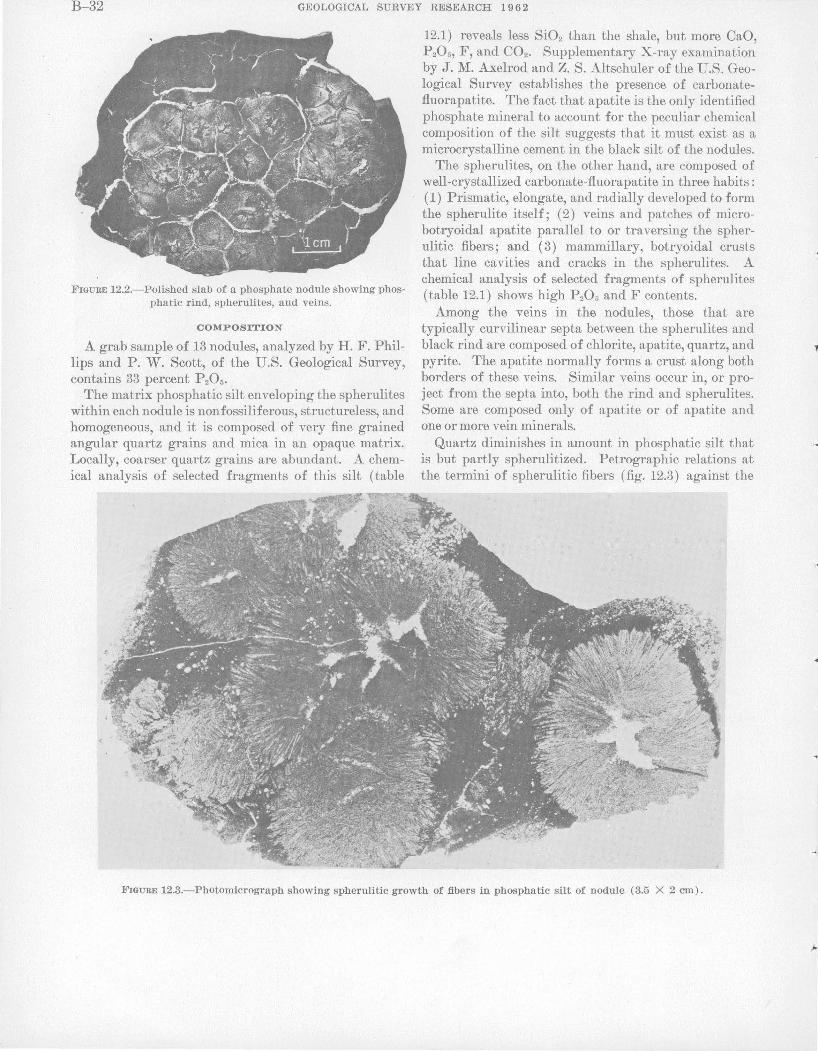
B-32 GEOLOGICAL SURVEY RESEARCH 1 9 6 2
FIGURE 12.2.-Polished slab of a phosphate nodule showing phosphatic rind, spherulites, and veins.
COMPOSITION
A grab sample of 13 nodules, analyzed by H. F. Phillips and P. W. Scott, of the U.S. Geological Survey, contains 33 percent P20s.
The matrix phosphatic silt enveloping the spherulites within each nodule is nonfossiliferous, structureless, and homogeneous, and it is composed of very fine grained angular quartz grains and mica in an opaque matrix. Locally, coarser quartz grains are abundant. A chemical analysis of selected fragments of this silt (table
12.1) reveals less Si02 than the shale, but more CaO, P20s, F, and C02. Supplementary X-ray examination by J. M. Axelrod and Z. S. Altschuler of the U.S. Geological Survey establishes the presence of carbonatefluorapatite. The fact that apatite is the only identified phosphate mineral to account for the peculiar chemical composition of the silt suggests that it must exist as a microcrystalline cement in the black silt of the nodules.
The spherulites, on the other hand, are composed of well-crystallized carbonate-fluorapatite in three habits: ( 1) Prismatic, elongate, and radially developed to form the spherulite itself; ( 2) veins and patches of microbotryoidal apatite parallel to or traversing the spherulitic fibers; and ( 3) mammillary, botryoidal crusts that line cavities and cracks in the spherulites. A chemical analysis of selected fragments of spherulites (table 12.1) shows high P205 and F contents.
Among the veins in the nodules, those that are typically curvilinear septa between the spherulites and black rind are composed of chlorite, apatite, quartz, and pyrite. The apatite normally forms a crust along both borders of these veins. Similar veins occur in, or project from the septa into, both the rind and spherulites. Some are composed only of apatite or of apatite and one or more vein minerals.
Quartz diminishes in amount in phosphatic silt that is but partly spherulitized. Petrographic relations at the termini of spherulitic fibers (fig. 12.3) against the
FIGURE 12.3.-Photomicrograph showing spherulitic growth of fibers in phosphatic silt of nodule (3.5 X 2 em).
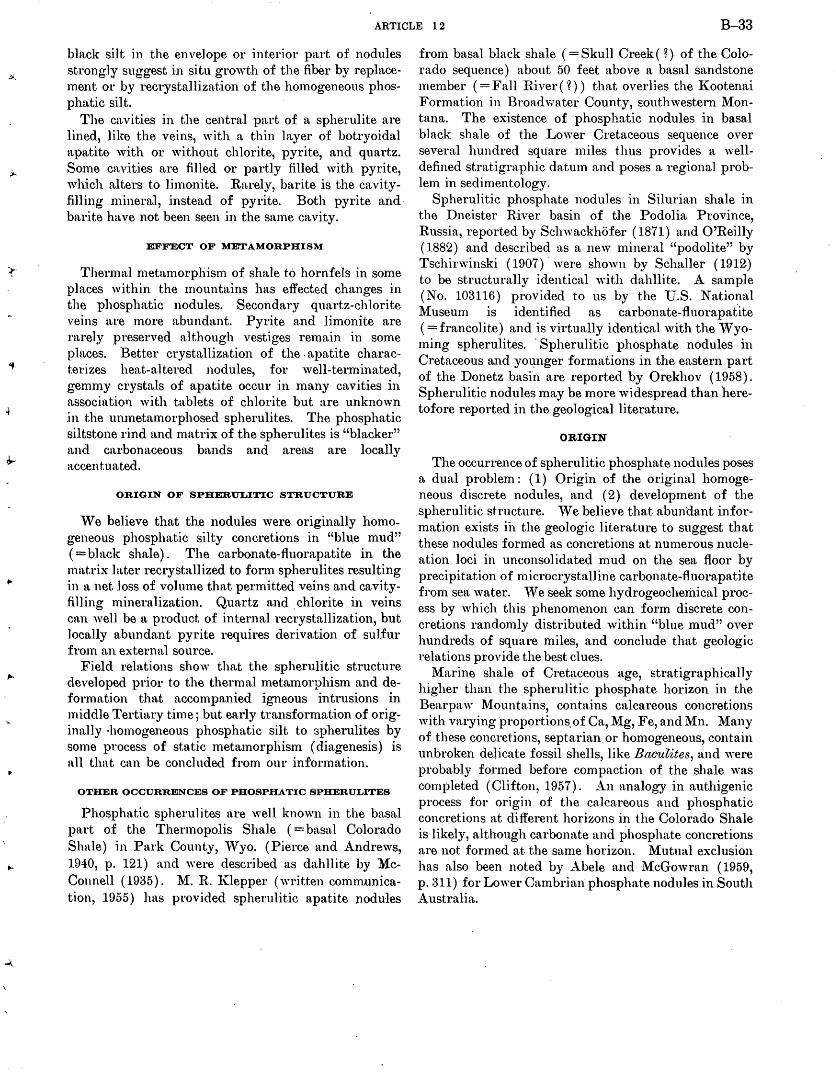
ARTICLE 12 B-33
black silt in the envelope or interior part of nodules strongly suggest in situ growth of the fiber by replacement or by recrystallization of the homogeneous phosphatic silt.
The cavities in the central part of a spherulite are lined, like the veins, with a thin layer of botryoidal apatite with or without chlorite, pyrite, and quartz. Some mtv.ities are filled or partly filled with pyrite, which alters to limonite. Rttrely, barite is the cavityfining mineral, instead of pyrite. Both pyrite and· barite have not been seen in the same cavity.
EFFECT OF MET AMORPHISM
Thermal metamorphism of shale to hornfels in some places within the mountains has effected changes in the phosphatic nodules. Secondary quartz-chlorite veins are more abundant. Pyrite and limonite are rarely preserved although vestiges remain in some places. Better crystallization of the. apatite characterizes heat-altered nodules, for well-terminated, gemmy crystals of apatite occur in many cavities in associntio11 with tablets of chlorite but are unknown . in the unmetamorphosed spherulites. The phosphatic siltstone rind and matrix of the spherulites is "blacker" and carbonaceous bands and areas are locally accentuated.
ORIGIN OF SPHERULITIC STRUCTURE
V\T e believe that the nodules were originally homo-1 . 'I t' . "bl d" O'eneous phosp 1atlc s1. ty concre IOns 1n u,e mu
( = bhH~k shnJe). The carbonate-fluorapatite in the rnatrix later recrystallized to form spherulites resulting in a net loss of volume that permitted veins and cavityfilling mineralization. Quartz and . chlorite in veins can well be a product of internal recrystallization, but locally abundant pyrite requires derivation of sulfur from an external source.
Field rehttions show that the spherulitic structure developed prior to the thermal metamorphism and deformu.tion thn.t accompanied igneous intrusions in rniddle Tertiary time; but early transformation of origimtlly ·homogeneous phosphatic silt to spherulites by some process of static metamorphism (diagenesis) is n.ll that can be concluded from our information.
OTHER OCCURRENCES OF PHOSPHATIC SPHERULITES
Phosphatic spherulites are well known in the basal pa,rt of the Thermopolis Shale (=basal Colorado Shale) in Park County, 1Vyo. (Pierce and Andrews, 1940, p. 121) and were described as dahllite by McConnell ( 1935). ~L R. l{]epper (written coml1U.lnication, 1955) has provided spherulitic apatite nodu1es
from basal black shale ( =Skull Creek ( ~) of the Colorado sequence) about 50 feet above a basal sandstone member (=Fall R-iver(~)) that overlies the l(ootenai Formation in Broadwater County, southwestern Montana. The existence of phosphatic nodules in basal black shale of the Lower Cretaceous sequence over several hundred squ:are miles thus provides a welldefined stratigraphic datum and poses a regional problem in sedimentology.
Spherulitic phosphate nodules in Silurian shale in the Dneister River basin of the Podolia Province, Russia, reported by Schwackhofer ( 1871) and O'Reilly (1882) and described as a new mineral "podolite" by Tschirwinski (1907) ·were shown by Schaller (1912) to be structurally identical with dahllite. A sample (No. 103116) provided to us by the U.S. National Museum is identified as carbonate-fluorapatite (=francolite) and is virtually identical with the Wyoming spherulites. · Spherulitic phosphate nodules ·in Cretaceous and yOl~nger formations in the eastern part of the Donetz basin are reported by Orekhov ( 1958). Spherulitic nodules may be more widespread than heretofore reported in the geological literature .
ORIGIN
The occurrence of spherulitic phosphate nodules poses a dual problem: ( 1) Origin of the original homogeneous discrete nodules, and ( 2) development of the spherulitic structure. We believe that abundant information exists ii1 the geologic literature to suggest that these nodules formed as concretions at numerous nucleation loci in unconsolidated mud on the sen floor by precipitation of microcrystalline carbonate-fluorapatite from sea water. '" e seek some hydrogeochemical process by which this phenomenon can form discrete concretions randomly distributed within "blue mud" over hundreds of square miles, and conclude that geologic relations provide the best clues.
Marine shale of Cretaceous age, stratigraphically hio-her than the spherulitic phosphate horizon in the
0 •
Bearpa w Mountains, contains calcareous concretiOns with varying proportions, of Ca, Mg, Fe, and Mn. Many of these concretions, septarian. or homogeneous, contain unbroken delicate fossil shells, like Baeul'ites, and were probably formed before compaction of the shale was completed (Clifton, 1957). An analogy in authigenic process for origin of the calcareous and phosphatic concretions at different horizons in the Colorado Shale is likely, although carbonate and phosphate concretions are not formed at the same horizon. Mutual exclusion has also been noted by Abele m1d McGowran ( 1959, p. 311) for Lower Cambrian phosphate nodules in South Australia.
B-34 GEOLOGICAL SURVEY RESEARCH 19 6 2
GEOLOGIC CONSIDERATIONS
Phosphorites are widely distributed in the geologic column. Most of them," however, are phosphatic shales interbedded with sandstone, limestone, chert, or ghiuconitic greensand and are characterized by phosphatized fossil fragments, oolitic pellets, or smooth pebble-like units with rock, mineral, or fossil nuclei. Fossil fragments commonly are entirely replaced by phosphate or are armored by pelletal colloform apatite.
Phosphatic nodules dredged from the sea floor (Murray and Renard, 1891; Dietz and others, 1942; Emery and others, 1952) at depths up to 11,000 feet are slabby to rounded and composed of rock, mineral, bone, and foram fragments cemented and coated by microcrystalline phosphate. The nodules are most abundant on shelves and banks near continental borders where cold and warm water currents meet. One nodule from the Coronado Bank, provided to us· by F. R. Shepard, is composed of a heterogeneous mixture of subangular detrital fragments (quartz, plagioclase, hypersthene, hornblende, tourmaline, sphene, biotite, and porphyritic andesite) in a matrix of dark submicroscopic carbonate fluorapatite containing irregularly distributed threadlike areas of greenish chlorite. Neither spherulitic structure nor carbonate is present in the nodule.
SOURCE OF PHOSPHORUS.
Phosphate to form concretions in the Colorado Shale was most likely derived from sea water tr~nsgressing a broad shelf area in Early Cretaceous time rather than from alteration of excreta or calculi of marine animals.
Many investigators have recorded a systematic variation of the phosphoric acid content of sea water as a function of temperature, depth, pH, and season (Matthews, 1917; Atkins, 1928). · Surface oceanic waters, through the activity of organisms, become impoverished in plant nutrients such as phosphate and nitrate, and deeper waters become enriched by "mineralized" organic matter falling to the sea bottom. Thomsen ( 1931, 1937) reported about 100 to 200 mg per m3 P 20 5 at depths of about 3,000 m in several oceans, and Atkins ( 1925, 1928) reports an increase from 8 mg per m3
P205 at 100 ~ depth (T=15.1 °C) to 88 mg per m3
P205 at 3,000 m depth (T=3.1 ° C) in the Atlantic Ocean between the Canary Islands and Lisboa.
Kazakov (1938, 1950) stated that his experimental studies of the equilibrium system Ca0-P20 5-H20 and Ca0-Pt05-HF-H20-C02 suggested that precipitation of phosphate probably does not occur in the· phytoplankton zone on oceanic shelf areas, and that all the phosphate precipitated below that zone would be ap-
atite in association with calcium carbonate. We do not support Kazakov's conclusion, however, that precipitation of calcium carbonate must precede that of apatite in sea water. C02 in apatite analyses, normally assigned to CaCOa as a separate phase mixed with apatite (Kazakov, 1938), is currently interpreted· (Altschuler and others, 1952) to be a component of a single structural phase. Bottom m"!lds containing organic matter, apatite, and sulfide would require, with reference to the Eh-pH diagram of Krumbein and Garrels ( 1952), a hydrogeochemical environment of pH above 7 but less than 7.8, and of Eh in the negative region (Swanson, 1961). Higher pii and positive Eh would favor precipitation of carbonate and sulfate. In the mud-bottom habitat represented by the basal Colorado black shale, any preexisting CaCOa phase would not be in equilibrium and would be dissolved, replaced, or armored by an apatite aureole, according to . our interpretation. As indicated by the Cretaceous system in Montana and Wyoming, and as earlier noted by McKelvey and others ( 1953) for part of the Phosphoria Formation of Permian age, first carbonate-fluorapatite, and later CaCOa, were precipitated as the transgressive sea ascended the shelf.
CONCLUSIONS
Phosphate nodules in basal marine Colorado Shale in the northern Great Plains of Montana and "\Vyoming record a special situation of a widespread transgressive shelf sea where bottom muds were accumulating beyond the influence of nearshore turbulent conditions and at a depth greater than the base of the zone of photosynthesis. Environmental hydrochemical conditions of the bottom slimes and water are low pH, reducing conditions, high partial pressure of C02, and high concentration of Ca, _P, F, and H 2S. Only soft-bodied animals were present. Precipitation of carbonatefluorapatite occurred first as a concretionary microcrystalline cement in silt prior to final compaction of the bottom mud shale. The phenomenon is most likely a result .of saturation in P 20 5 caused by a rise in pH and temperature to disturb the apatite solution equilibrium in upwelling ocean water. -These ·concretions later recrystallized diagenetically and developed apatite spherul1tes and secondary veins.
REFERENCES
Abele, C., and McGowran, B., 1959, The geology of the Cambrian south of Adelaide: Royal Soc. South Australia Trans., v. 82, p. 301-320. .
Altschuler, Z. S., Cisney, E. A, and Barlow, I. H., 1952, X-ray evidence of the nature of carbonate-apatite [abs.] : Geol. Soc. America Bull., v. 63, p. 1230-1231.
......
.J"r
•
-J ..
ARTICLE .13 B-35
Atkins, \V. R. G., 1925, The phosphate· content of fresh and salt waters in its relationship to the growth of algal plankton: Marine Bioi. Assoc. Jour., [United Kingdom], v. 13, p. 119-150.
--- 1928, Seasonal variations in the phosphate and silicate content of sen water: Marine Bioi. Assoc. Jour., v. 15, p. 191-205.
Clifton, H. E., 1957, Carbonate conct·etions of the Ohio shale: Ohio .Tour. Sci., v. 57, p. 114-129.
Dietz, R. S., Emery, K. 0., and Shepard, F. P., 1942, Phosphorite deposits on the sea floor off southern California : Geol. Soc. America Bull., v. 53, p. 815-847.
Emery, K. 0., Butcher, \V. S., Gould, H. R., and Shepard, F. P., 1952, Submarine geology off San Diego, California: Jour. Geology, v. 60, p. 511-549.
Kazakov, A. V., 1938, ~rhe phosphorite facies and the genesis of phosphorites, vn Geological investigations of agricultural ores U.S.S.R.: Sci. lust. Fertilizers and Insectofungicides 'l'rans. (U.S.S.R.), no. 142, p. 95--113. (Special issue in l!Jnglish published for 17th Internat. Geol. Cong.)
--- 1950, Fluorapatite system equilibria under conditions of formntion of sedlmentnry rocks: Akad. Nauk SSSR Inst. Geol. Nnuk 'l'rudy, Vyp. 114, Geol. Ser. no. 40, p. 1-21.
Krnmbein, \V. C. nnd Garrels, R. 1\:l., 1952, Origin and classification of chemical sedi.ments in terms of pH and oxidationreduction potentinls: Jour. Geology, v. 60, p. 1-33.
Mntthews, D. J., 1917, On ,the amount of phosphoric acid in the sen wtlter off Plymouth Sound: Marine Bioi. Assoc. Jour., v. 11, p. 251-257. .
McConnell, Duncan, 1935, Spberulitic concretions of dahllite from Ishnwoon, \Vyoming: Am. Mineralogist, v. 20, p. 693-698.
McKelvey, V. 1D., Swanson, R. \Y., and Sheldon, R. P., 1953, The Perminn phosphorite deposits of western United States in Giulhnm, P. I.J. R., ed., Paper XI in Origine des Gisements
de phosphates de chaux: Internat. Geol. Cong., 19th, Algiers, 1952, Comptes rendus, sec. 11, pt. 11, ·p. 41>--64.
Murray, .J., and Renard, .A. F., 1891, Report on the scientific results of the exploring voyage of· H.M.S. Olwlle'ltger, 1873-76, Deep sea deposits, p. 396-400.
O'Reilly, J. P., 1882, The phosphorite nodules of Podolia: Royal Soc. Dublin Proc., v. 4, p. 215--222.
Orekhov, S., 1958, Mineralogy and structural types of phosphorites of the Rostov region [translation of abstract] : Uchenye Zapiski Rostov-na Donn Gosudarst Univ., v. 53, p. 273-287.
Pierce, \V. G., and Andrews, D. A., 1940, Geology and coal resources of the region south of Cody, Park County, Wyoming; U.S. Geol. Survey Bull. 94:1-B, p. 99-175.
Rubey, \V. \V., 1930, Lithologic studies of fine-grained Upper Cretaceous sedimentary rocks of the Black Hills region : U.S. Geol. Survey Prof. Paper 165--A, 54 p.
Schaller, \V. T., 1912, 'I'he .Probable identity of podolite with dahllite in Mineralogic notes, series 2:. U.S. Geol. Suney Bull. 509, p: 96-97.
Schwackhofer, Fr., 1871, Ueber die Phosphorit-Einlagerungen an den Ufern des Dniester in russich und osterreichisch Podolien und in der Bukowina : K. K. Geol. Reichsanstalt .Jahrb., v. 21, p. 211-230.
Swanson, V. E., 1961, Geology and geochemistry of uranium in marine black shales, a review: U.S. Geological Survey Prof. Paper 356-C, p. 67-112.
Thomsen, H., 1931, Nitrate and phosphate contents of Mediterranean water : Danish Oceanographic Expedition Rept., 1908-10, v. 3, misc. papers, no. 6, 14 p.
---1937, Hydrographical observations made during the Dana Expedition 1928-1930 : Dana Repts., no. 12, 46 p.
Tschirwinski, W., 1907, Uber Podolite, ein Neues Mineral: Centralbl. Mineralogic, p. 279-283.
13. STREAM DIRECTIONS IN THE LAKOTA FORMATION (CRETACEOUS) IN THE NORTHERN BLACK HILLS, WYOMING AND SOUTH DAKOTA
By WILLIAM J. MAPEL and CHARLES L. PILLMORE, Denver, Colo.
The Lakota Formation of Early Cretaceous ~1-ge is 100 to 250 feet thick in the northern Black Hills. It consists hugely of sandstone, siltstone, and claystone deposited on the flood plains of streams. The formation and its regional stratigraphic relations in the Black II ills have been described by vVaage ( 1959), Mapel and Gott ( 1959), and Post and Bell ( 1961).
Sandstone beds in much of the Lakota Formation are conspicuously crossbedded in sets a few inches to about 3 feet thick. At places the crossbeds dip as steeply as 30°. The crossbedded sandstones are mostly medium to coarse gt:nined and at. many places contaip lenses of granules and small pebbles.
'I' he dip directions of the cross beds were determined at 65 localities between Devils Tower and Newcastle on the west side of the Black Hills and at 20 localities near Aladdin at the north end of the Black Hills (fig. 13.1) to establish the direction of flow of streams that deposited the sediments. Dip directions of from 10 to 20 sets of crossbeds were averaged. to find the dip direction at each locality. Directions from place to place are greatly diverse, but fairly definite trends become apparent if the dip directions are averaged for localities · grouped according to geographic location, stratigraphic
. position, or both. Four such groupings are shown on figure 13.1 and a statistical analysis of the results is
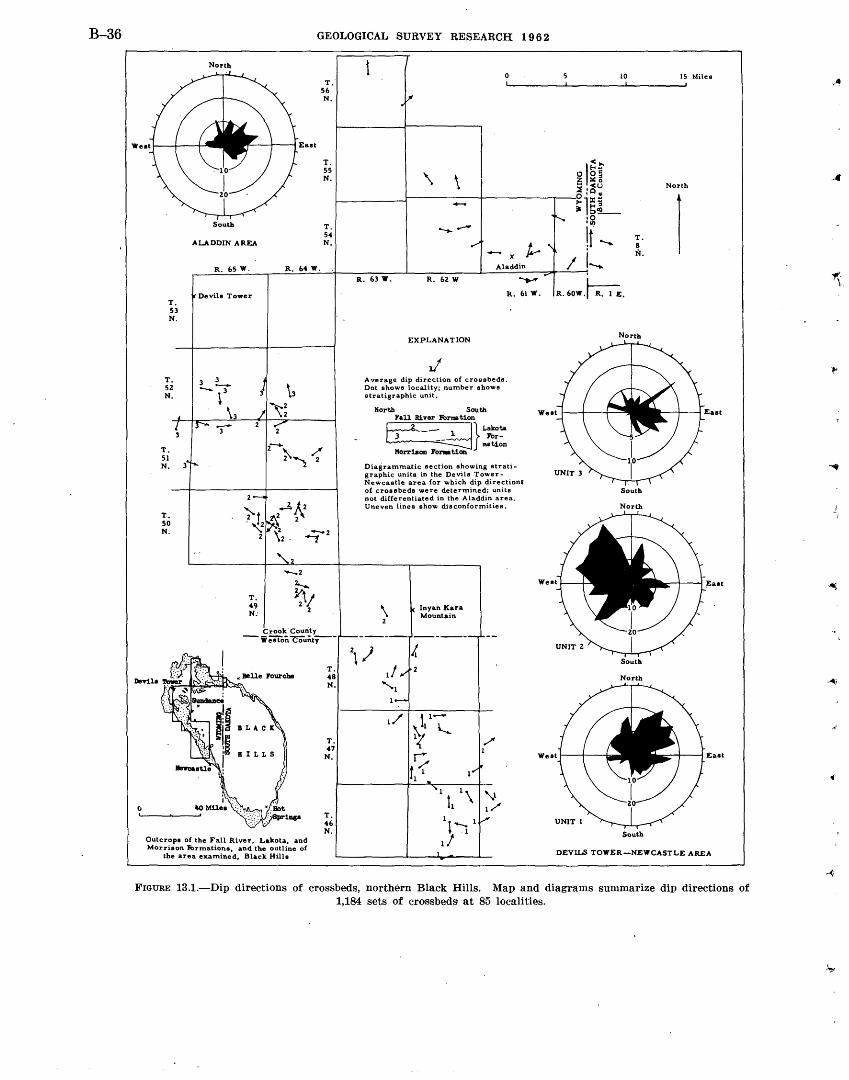
B-36 GEOLOGICAL SURVEY RESEARCH 19 6 2
T. 53 N.
T. 52 N.
T. 51 N.
T. 50 N.
North
South
ALADDIN AREA
R. 65 W.
Devils Tower
T. 49 N;
R. MW.
T. 56 N.
T. 55 N.
T. 54 N.
Crook'Courity --weston couiit_y __
Outcrops of the Fall River, Lakota, and Morrison FOrmations, and the outline of
the area examined, Black Hills
T. 48 N.
T. 47 N.
T. 46 N.
\ \ -X f-.
Aladdin
R. 63 W. R. 62 W ~
R.
EXPLANATION
J Average dip direction of crossbeds. Dot shows locality; number shows stratigraphic unit.
North South Fall River Formation
~}Lakota .) - l J'or--- mation
Morraon l'o:rution
61 w.
Diagrammatic section showing stratigraphic units in the Devils TowerNewcastle area for which dip directionS of crossbeds were determined; units not differentiated in the Aladdin area. Uneven lines show disconformities.
\ Inyan Kara Mountain 2
2\) 1/ '1
1--
1/ \111
~ l{ / ...._..... 1/
f1 1
l t~
1/
10 15 Miles
,~!' 0 oc:: ~ ~ g
North ~·~u Oi:z:~
I >- .... " !II: :;,IQ __
•0 Ill)
!f ~ T. 8
I._ N.
I
R.60W.~.
North
South
North
South
North
South
DEVILS TOWER-NEWCASTLE AREA
FIGURE 13.1.-Dip directions of crossbeds, northern Black Hills. Map and diagrams summarize dip directions of 1,184 sets of crossbeds at 85 localities.
....
·~
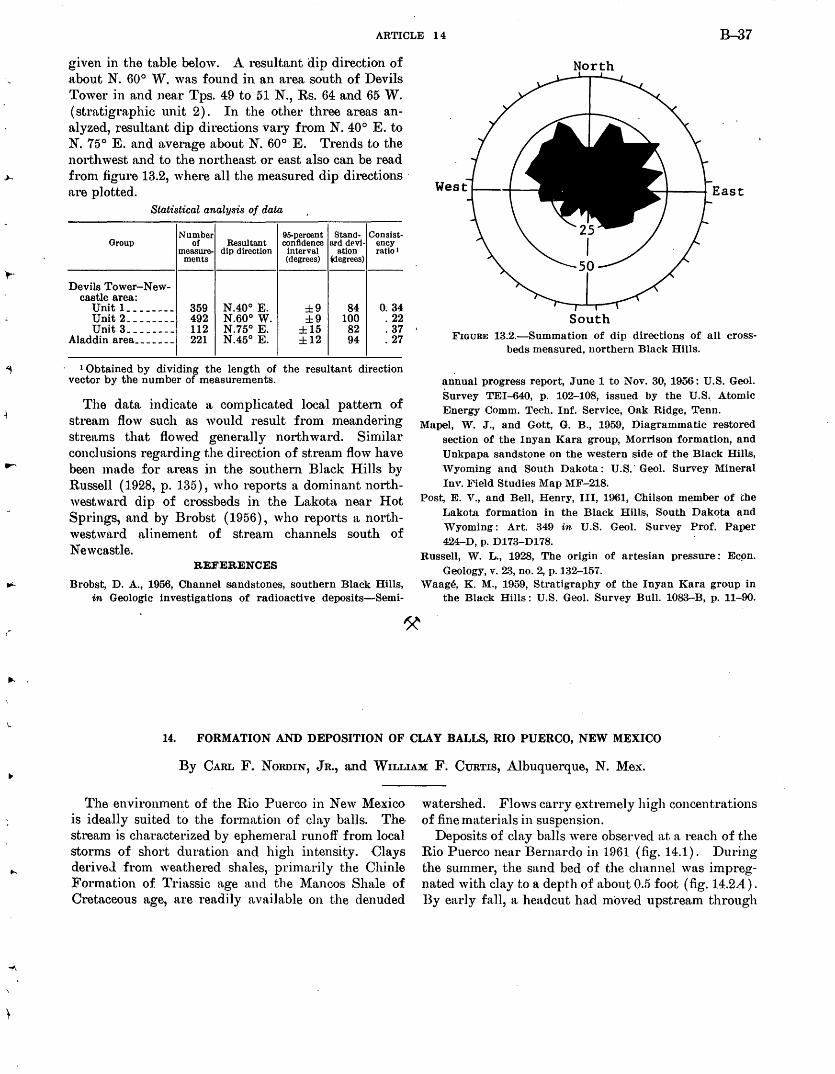
"""'
ARTICLE 14 B-37
given in the table below. A resultant dip direction of about N. 60° W. was found in an area south of Devils Tower in and near Tps. 49 to 51 N., Rs. 64 and 65 W. (stratigraphic unit 2) . In the other three areas analyzed, resultant dip directions vary from N. 40° E. to N. 75° E. and average about N. 60° E. Trends to the northwest and to the northeast or east also can be read from figure 13.2, where all the measured dip directions· are plotted.
Statistical analysis of data
Number 95-percent Stand- Consist-Group of Resultant confidence ard df'vi- ency
measure- dip direction interval ation ratio 1
ments (degrees) 6degrees)
Devils Tower-New-castle area:
Unit!_ _______ 359 N.400 E. ±9 84 0. 34 Unit 2 ________ 492 N.60° w. ±9 100 . 22 Unit 3 ________ 112 N.75° E. ±15 82 . 37
Aladdin area _______ 221 N.45° E. ±12 94 . 27
1 Obtained by dividing the length of the resultant direction vector by the number of measurements.
The data indicate a complicated local pattern of stream flow such as would result from meandering streams that flowed generally northward. Similar conclusions regarding the direction of stream flow have been made for areas in the southern Black Hills by Russell (1928, p. 135), who reports a dominant northwestwn,rd dip of crossbeds in the Lakota near Hot Springs, and by Brobst (1956), who reports a northwestwnrd alinement of stream channels south of Newcastle.
REFERENCES
Brobst, D. A., 1956, Channel sandstones, southern Black Hills, in Geologic investigations of radioactive deposits-Semi-
South FIGURE 13.2.-Summation of dip directions of all cross·
beds measured, northern Black Hills.
annual progress report, June 1 to Nov. 30, 1956: U.S. Geol. Survey TEI-640, p. 102-108, issued by the U.S. Atomic Energy Comm. Tech. Inf. Service, Oak Ridge, Tenn.
Mapel, W. J., and Gott, G. B., 1959, Diagrammatic restored section of the Inyan Kara group, Morrison formation, and Unkpapa sandstone on the western side of the Black Hills, 'Vyoming and South Dakota: U.s.· Geol. Survey Mineral Inv. Field Studies Map MF-218.
Post, E. V., and Bell, Henry, III, 1961, Chilson member of the Lakota formation in the Black Hills, South Dakota and Wyoming: Art. 349 in U.S. Geol. Survey Prof. Paper 424-D, p. D173-D178.
Russell, W. L., 1928, The origin of artesian pressure: Ecpn. Geology, v. 23, no. 2, p. 132-157.
Waage, K. M., 1959, Stratigraphy of the Inyan Kara group in the Black Hills: U.S. Geol. Survey Bull. 1083-B, p. 11-90.
14. FORMATION AND DEPOSITION OF CLAY BALLS, RIO PUERCO, NEW MEXICO
By CARL F .. NoRDIN, JR., and WILLIAM F. CURTIS, Albuquerque, N. Mex.
The environment of the Rio Puerco in New Mexico is ideally suited to the formation of clay balls. The· stream is characterized by ephemeral runoff from local storms of short duration and high intensity. Clays derive"l from weathered shales, primarily the Chinle Formation of Triassic age and the Mancos Shale of Cretaceous age, are readily available on the denuded
watershed. Flows carry extremely high concentrations of fine materials in suspension.
Deposits of clay balls 'vere observed at a reach of the Rio Puerco near Bernardo in 1961 (fig. 14.1). During the summer, the sand bed of the channel was impregnated with clay to a depth of about 0.5 foot (fig. 14.2A). By early fall, a headcut had moved upstream through
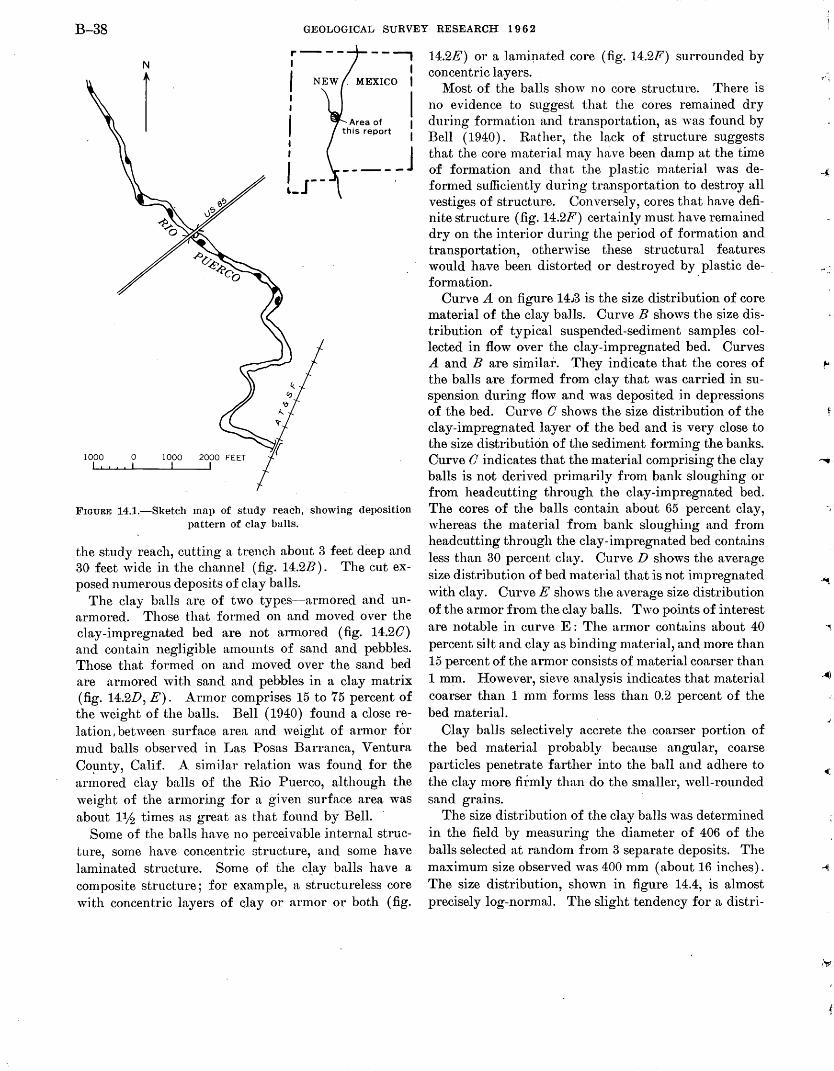
B-38 GEOLOGICAL SURVEY RESEARCH 19 6 2
N
I
1000 0 1000 2000 FEET I I I I I I
,.---- ---, 1
I
I I
Lr-
I I
I I I
_____ j
FIGURE 14.1.-Sketch map of study reach, showing deposition pattern of clay balls.
the study reach, cutting a trench about 3 feet deep and 30 feet wide in the channel (fig. 14.2B). The cut exposed numerous deposits of clay balls.
The clay balls are of two types--armored and unarmored. Those that formed on and moved over the clay-impregnated bed are not armored (fig. 14.20) and contain negligible amounts of sand and pebbles. Those that formed on and moved over the sand bed are armored with sand and pebbles in a clay matrix (fig. 14.2D, E). Armor comprises 15 to 75 percent of the weight of the balls. Bell ( 1940) found a close re-lation, between surface area and weight of armor for mud balls observed in Las Posas Barranca, Ventura Co~u1ty, Calif. A siinilar relation was found for the armored clay balls of the Rio Puerco, although the weight of the armoring for a given surface area was about llh times as great as that found by Bell.
Some of the balls have no perceivable internal structure, some have concentric structure, and some have laminated structure. Some of the cl_ay balls have a composite structure; for example, a structureless core with concentric layers of clay or armor or both (fig.
14.2E) or a lamipated core (fig. 14.2F) surrounded by concentric layers.
Most of the balls show no core structure. There is no evidence to suggest that the cores remained dry during formation and transportation, as was found by Bell (1940). Rather, the lack of structure suggests that the core material may have been damp at the time of formation and that the plastic material was deformed sufficiently during transportation to destroy all vestiges of structure. Conversely, cores that have definite structure (fig. 14.2F) certainly must have remained dry on the interior during the period of formation and transportation, otherwise these structural features would have been distorted or destroyed by plastic deformation.
Curve A on figure 14J3 is the size distribution of core material of the clay balls. Curve B shows the size distribution of typical suspended-sediment samples collected in flow over the clay-impregnated bed. Curves A and B are similar. They indicate that the cores of the balls are formed :from clay that was carried in suspension during flow and was deposited in depressions of the bed. Curve 0 shows the size distribution of the clay-impregnated layer of the bed and is very close to the size distribution of the sediment forn1ing the banks. Curve 0 indicates that the material comprising the clay balls is not derived primarily from bank sloughing or from headcutting through the clay-impregnated bed. The cores of the balls contain about 65 percent clay, whereas the material from bank sloughing and from headcutting through the clay-impregnated bed contains less than 30 percent clay. CurveD shows the average size distribution of bed material that is not impregnated with clay. Curve E shows the average size distribution of the armor from the clay balls. Two points of interest are notable in curve E : The armor contains about 40 percent silt and clay as binding material, and more than 15 percent of the al'lllor consists of material coarser than 1 mm. However, sieve analysis indicates that material coarser than 1 mm forms less than 0.2 percent of the bed material.
Clay balls selectively accrete the coarser portion of the bed material probably because angular, coarse particles penetrate farther into the ball and adhere to the clay more firmly than do the sinaller, well-rounded sand grains.
The size distribution of the clay balls was determined in the field by measuring the diameter of 406 of the balls selected at random from 3 separate deposits. The maximum size observed was 400 mm (about 16 inches). The size distribution, shown in figure 14.4, is almost precisely log-normal. The slight tendency for a distri-
-,
I~
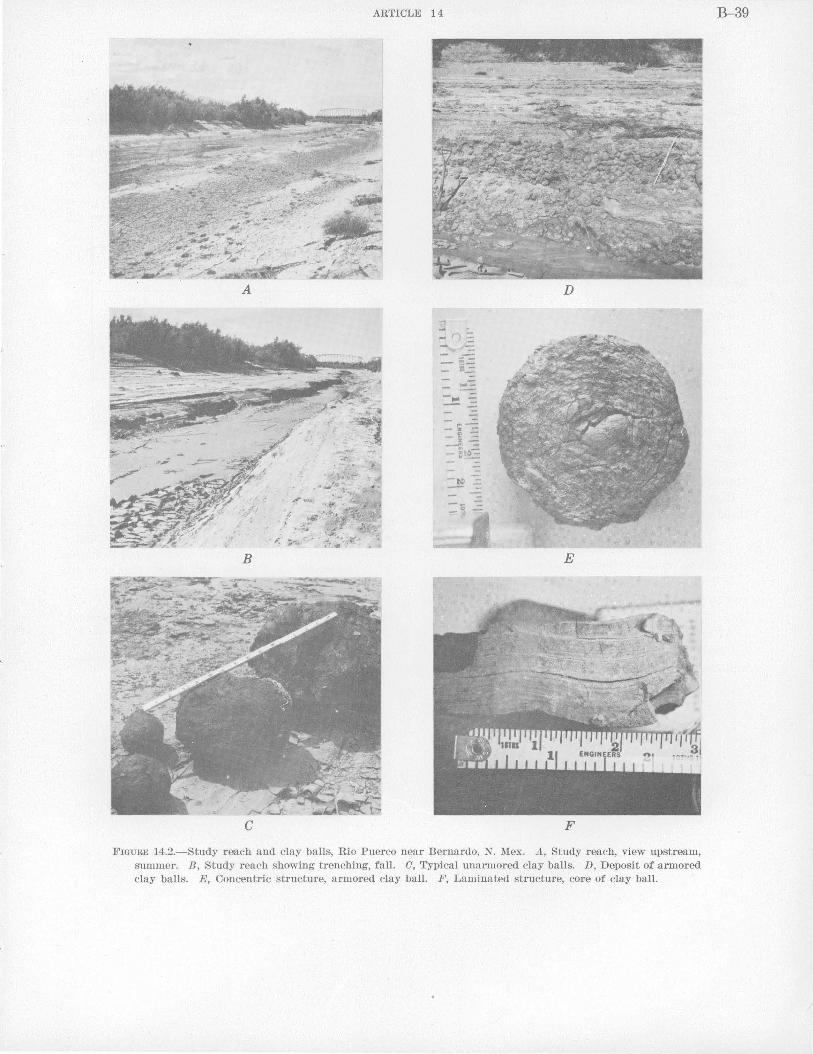
ARTICLE 14
A
B
c
... -- 2 -t:>-
~; -"' -"-
D
E
F
FIGURE 14.2.-Study reach and clay balls, Rio Puerco near Bernardo, N. Mex. A, Study reach, view upstream, summer. B, Study reach showing trenching, fall. 0, Typical unarmored clay balls. D, Deposit of armored clay balls. E, Concentric structure, armored clay ball. F, Laminated structure, core of clay ball.
B-39
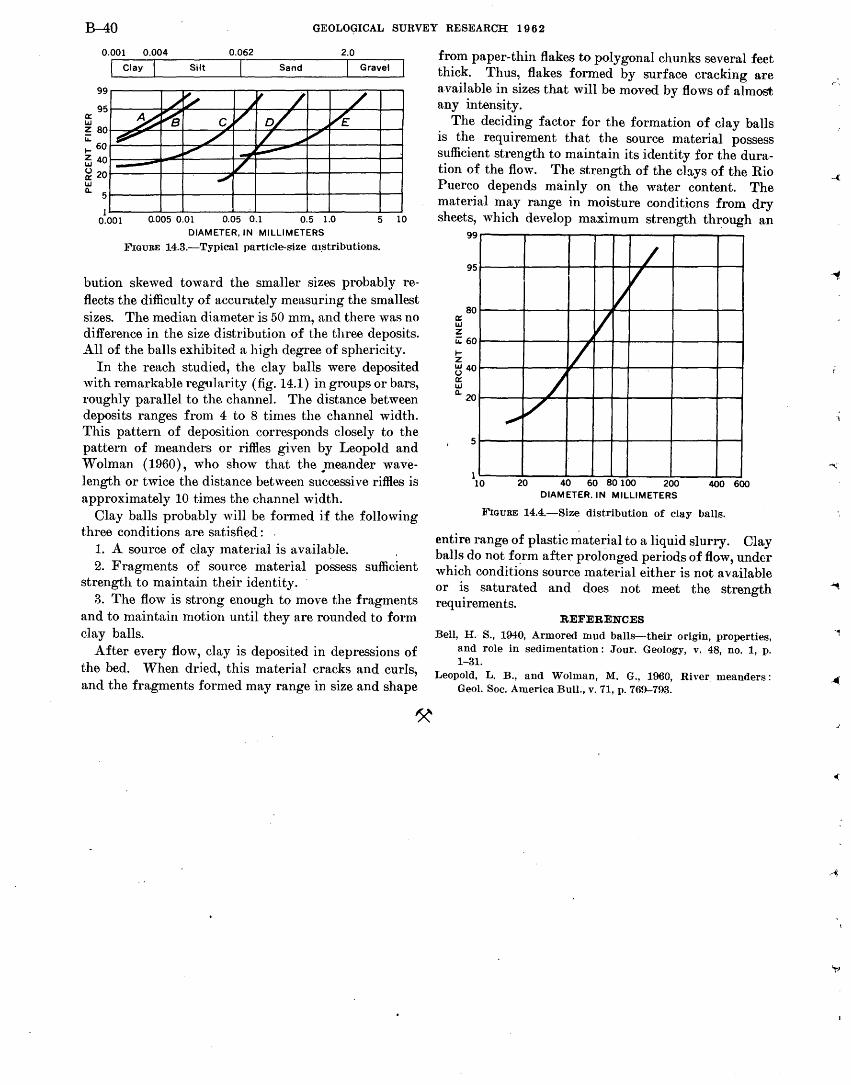
B-40 GEOLOGICAL SURVEY RESEARCH 19 6 2
a::
0.001
Clay
0.004
I Silt
0.062 2.0
Sand I Gravel
99~----~~r------.--.~--~~-.----~~-,
95~----~~~----~~--~,_~~~~--T-~
~ 80~~~~~----~q_-1~~--~~------T--; u: 1- 60 ffi40~--~~~~----~~------;-~------T--1
~20~----~~~--~~-1------;-~------T--; LIJ
~ 5~----~~r-----;-~------;-~------~-, 1~-----L--~----~~~----~~~----~-7
0.001 0.005 0.01 0.05 0.1 0.5 1.0 5 10 DIAMETER, IN MILLIMETERS
FIGuRE 14.3.-Typical particle-size m_stributions.
bution skewed toward the smaller sizes probably reflects the difficulty of accurately measuring the smallest sizes. The median diameter is 50 mm, and there was no difference in the size distribution of the three deposits. All of the balls exhibited a high degree of sphericity.
In the reach studied, the clay balls were deposited with remarkable regularity (fig. 14.1) in groups or bars, roughly parallel to the channel. The distance between deposits ranges from 4 to 8 times the channel width. This pattern of deposition corresponds closely to the pattern of meanders or riffles given by Leopold and Wolman (1960), who show that the .meander wavelength or twice the distance between successive riffles is approximately 10 times the channel.width.
Clay balls probably will be formed if the following three conditions are satisfied: .
1. A source of clay material is availa?le. 2. Fragments of source material possess sufficient
strength to maintain their identity. 3. The flow is strong enough to move the fragments
and to maintain motion until th£>,y are rounded to form clay balls.
After every flow, clay is deposited in depressions of the bed. When dried, this material cracks and curls, and the fragments formed may range in size and shape
from paper-thin flakes to polygonal chunks several feet thick. Thus, flakes formed by surface cracking are available in sizes that will be moved by flows of almost any intensity.
The deciding factor for the formation of clay balls is the requirement that the source material possess sufficient strength to maintain its identity for the duration of the flow. The strength of the cb.ys of the Rio Puerco depends mainly on the water content. The material may range in moisture conditions from dry sheets, which develop maximum strength through an
99
95
80 a:: LIJ z u: 60 1-z ~ 40 a:: LIJ ~ 20
5
1 10
/
ll v
~v 1/
L ~ v·
20 40 60 80 100 200 400 600 DIAMETER. IN MILLIMETERS
FIGuRE 14.4.-Size distribution of clay balls.
entire range of plastic material to a liquid slurry. Clay balls do not fC!rm after prolonged periods of flow, unde:r which conditions source material either is not available or is saturated and does not meet the strength requirements.
REFERENCES
Bell, H. S., 1940, Armored mud balls-their origin, properties, and role in sedimentation: Jour. Geology, v. 48, no. 1, p. 1-31.
Leopold, L. B., and Wolman, M. G., 1960, River meanders: Geol. Soc. America Bull., v. 71, p. 769-793.
..-.:
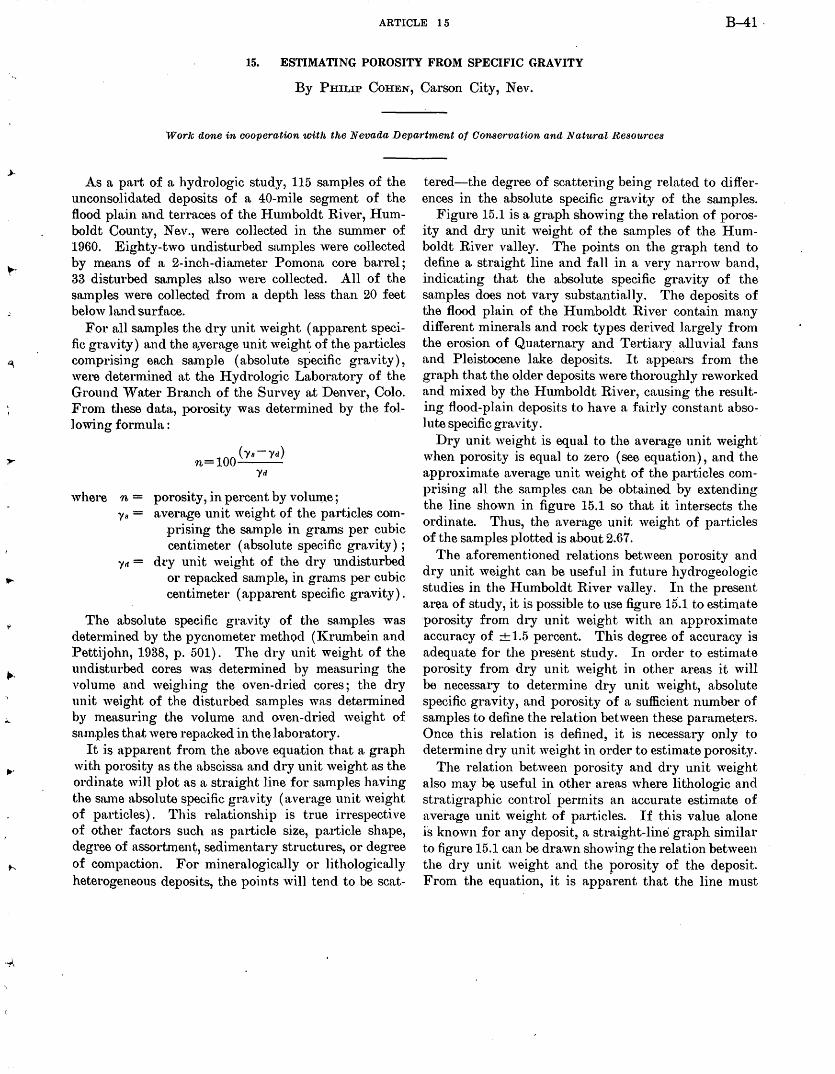
...
...
ARTICLE 15 B-41·
15. ESTIMATING POROSITY FROM SPECIFIC GRAVITY
By PHILIP CoHEN, Carson City, Nev.
Work done in cooperation with the Nevada Department of Oon8ervation and Natu,ral Resources
As a part of a hydrologic study, 115 samples of the unconsolidated deposits of a 40-mile segment of the flood plain n.nd terraces of the Humboldt River, Humboldt County, Nev., were collected in the summer of 1960. Eighty-two undisturbed samples were collected by 1n.e~u1s of a 2-inch-diruneter Pomona core barrel; 33 disturbed srunples also were collected. All of the snmples were collected from a depth less than 20 feet below ln . .nd surface.
For all samples the dry unit weight (apparent specific gravity) m1d the 1\Verage unit weight of the particles comprising each sample (absolute specific gravity), were determined n.t the Hydrologic Laboratory of the Ground Water Branch of the Survey at Denver, Colo. From these data, porosity was determined by the foLlowing formula:
where n = porosity, in percent by volume; y 8 = average unit weight of the particles com
prising the sample in grams per cubic centimeter (absolute specific gravity) ;
yr~ = dt·y unit weight of the dry undisturbed or repacked sample, in grruns per cubic centimeter (apparent specific gravity).
The absolute specific gravity of the samples was determined by the pycnometer method (ICrumbein and Pettijohn, 1938, p. 501). The dry unit weight of the undisturbed cores was determined by measuring the volume and weighing the oven-dried cores; the dry unit weight of the disturbed samples was determined by measuring the volume and oven-dried weight of sa.m.ples that were repacked in the laboratory.
It is apparent frmn the above equation that a graph with porosity as the abscissa, and dry unit weight as the ordinate will plot as a straight line for samples having the sn.me a.bsolute specific gravity ( a.verage unit weight of pn.rticles). This rela.tionship is true irrespective of other factors such as particle size, partic.le sha.pe, degree of assortment, sedimentary structures, or degree of compaction. For mineralogically or lithologically heterogeneous deposits, the points will tend to be scat-
tered-the degree of scattering being related to differences in the absolute specific gravity of the samples.
Figure 15.1 is a graph showing the rela.tion of porosity and dry unit weight of the samples of the Humboldt River valley. The points on the graph tend to define a straight line and fall in a very narrow band, indicating that the absolute specific gravity of the samples does not vary substantially. The deposits of the flood plain of the Humboldt River contain ma.ny different minerals and rock types derived largely from the erosion of Qua.ternary and Tertiary alluvial fa .. ns and Pleistocene lake deposits. It appears from the graph that the older deposits were thoroughly reworked and mixed by the Humboldt River, causing the resulting flood-plain deposits to have a fairly constant absolute specific gravity.
Dry unit weight is equal to the average unit weight· when porosity is equal to zero (see equation), and the approximate average unit weight of the particles comprising all the samples can be obtained by extending the line shown in figure 15.1 so that it intersects the ordinate. Thus, the average unit weight of particles of the samples plotted is about 2.67.
The aforementioned relations between porosity and dry unit weight can be useful in future hydrogeologic studies in the Humboldt River valley. In the present area of study, it is possible to use figure 15.1 to estimate ·porosity from dry unit weight with an approximate accuracy of + 1.5 percent. This degree of accuracy is adequate for the present study. In order to estimate porosity from dry unit weight in other areas it ·will be necessary to determine dry unit weight, absolute specific gravity, and porosity of a sufficient number of samples to define the relation between these parameters. Once this relation is defined, it is necessary only to determine dry unit weight in order to estimate porosity.
The relation between porosity and dry unit weight also may be useful in other areas where lithologic and stratigraphic control permits an accurate estimate of average unit weight of particles. If this value alone is known for any deposit, a straight-line graph similar to figure 15.1 can be drawn showing the relation between the dry unit weight and the porosity of the deposit. From the equation, it is apparent that the line must
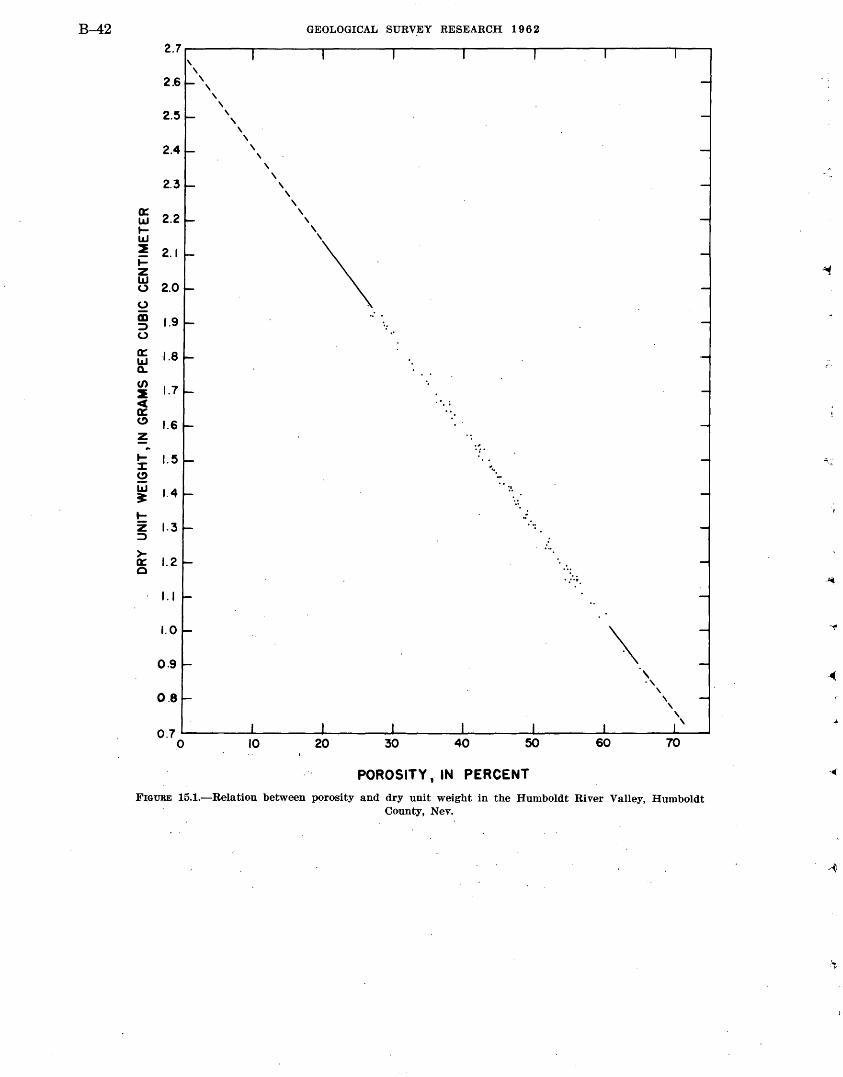
B-42 GEOLOGICAL SURVEY RESEARCH 1962
2.7 \
\
2.6 \ \
\ \
2.5 \ \
\ \
2.4 \ \
\ \
2.3 \ \
\ 0:: 2.2
\ LLI \ t- \ LLI \
2 2.1 \ i= z LLI
2.0 0
0 iii 1.9
.. ~ 0
0:: 1.8 LLI a.. (/)
1.7 ~ c:( ,•.
0:: (!) 1.6 z
·;· .... 1.5 ~ .. ~ ·-LLI ., ~ 1.4 .. .... -z 1.3 ~ : ... >- 1.2 0:: 0 ...
. :·•. I. I
1.0
\ 0.9 \ •\
\ 0.8 \
\ \
\
0.7 0 10 20 30 40 50 60 70
POROSITY, IN PERCENT
FIGURE 15.1.-Relation between porosity and. dry unit weight in the Humboldt River Valley, Humboldt County, Nev.
·~
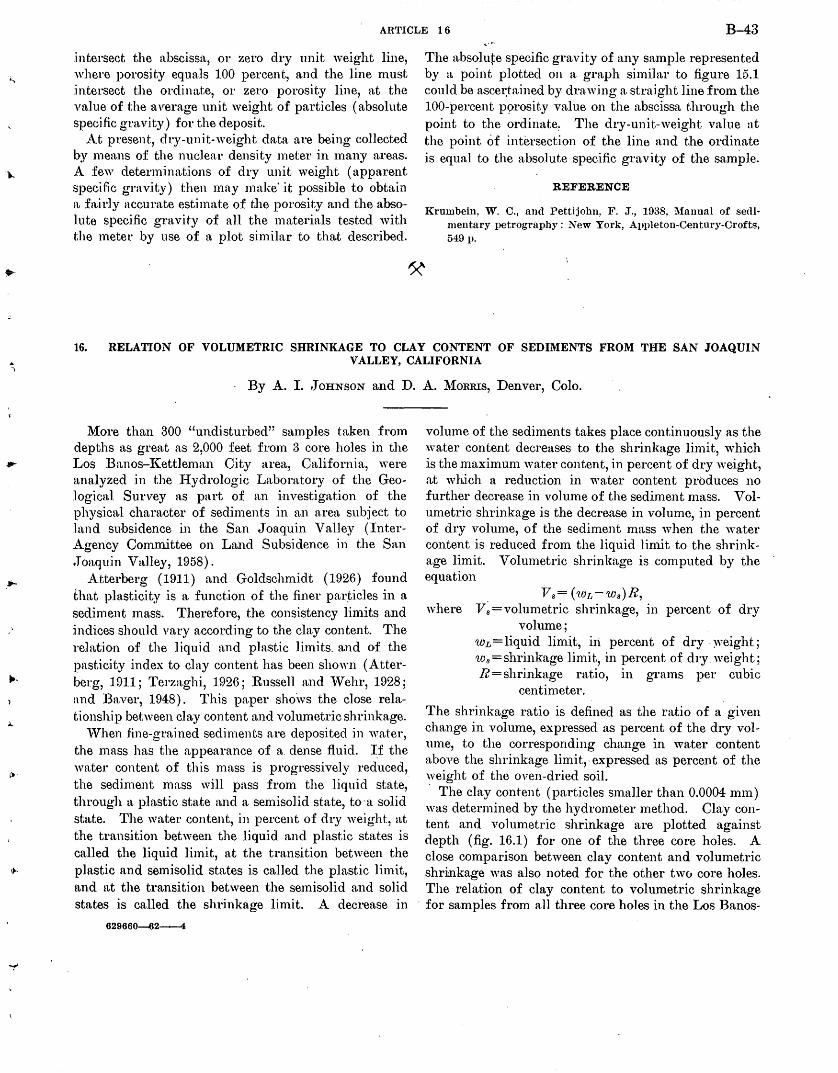
;
~~-
ARTICLE 16 B-43
:intersect the abscissa, or zero dry unit weight line, where porosity equals 100 percent, and the line n1ust intersect the ordinate, or zero porosity line, at. the value of the ~werage unit weight of particles (absolute specific gravity) for the deposit.
.At present, dry-unit-weight data are being collected by means of the nuclear density meter in many areas . .A few determinations of dry unit weight (apparent specific gravity) then may make' it possible to obtain ~1 fttirly accurate estimate of the porosity and the absolute specific gravity of all the materials tested with the meter by use of a plot similar to that described.
,,-••
The absolute specific gravity of any sample represented by a point plotted on a graph similar to figure 15.1 could be ascer:ta.ined by drawing a straight line fron1 the 100-percent p9rosity value on the abscissa through the point to the ordinate~ The dry-unit-weight value at the point of intersection of the line and the ordinate is equal to the absolute specific gravity of the sample.
REFERENCE
Krumbein, W. C., and Pettijohn, ~"'. J., 1938, Manual of sedimentary petrography: New York, Appleton-Century-Crofts, 549 p.
16. RELATION OF VOLUMETRIC SHRINKAGE TO CLAY CONTENT OF SEDIMENTS FROM THE SAN JOAQUIN VALLEY, CALIFORNIA
By A. I. ,JOHNSON and D. A. l\{oRRis, Denver, Colo.
More than 300 "undisturbed" samples taken from depths as great as 2,000 feet from 3 core holes in the Los Banos-l(ettleman City area, California, were analyzed in the Hydrologic Laboratory of the Geological Survey as part of an investigation of the physicaJ character of sediments in an area subject to land subsidence in the San Joaquin Valley (InterAgency Committee on La.nd Subsidence in the San .Joaquin Valley, 1958).
Atterberg ( 1911) and Goldschmidt ( 1926) found thn,t plasticity is a function of the finer particles in a sediment mass. Therefore, the consistency limits and indices should vary according to the clay content. The relation of the liquid and plastic limits. a.nd of the pnsticity index to c1ay content has been shown (Atterberg, 191.1; Terzaghi, 1926; Russell and vVehr, 1928; and Baver, 1948). This paper sho\vs the close relationship between clay content and volumetric shrinkage.
''Then fine-grained sediments are deposited in ·water, the mass has the appearance of a. dense fluid. I.f the water content of this mass is progressively i·educed, the sediment mass wHl pass from the liquid state, through a plastic state and a semisolid state, to-a solid state. The water content, in percent of dry weight, at the transition between the liquid and plastic states is called the liquid limit, at the transition between the plnstic and semisolid states is called the plastic limit, nnd at the transition between the semisolid and solid states is called the shrinkage limit. A decrease in
629660-62---4
volume of the sediments takes place continuously as the water content decreases to the shrinkage limit, which is the maximum water content, in percent of dry weight, at which a reduction in water content produces no further decrease in volume of the sediment mass. Volumetric shrinkage is the decrease in volume, in percent of dry volume, of the sediment mass when the water content is reduced from the liquid limit to the shrinkage limit. Volumetric shrinkage is computed by the equation
Vs= ('wr,-~os)R, where V~=volumetric shrinkage, in percent of dry
volume; wL= liquid limit, iri percent of dry . ~veight; 'Ws=shrinkage limit, in percent of dry. weight; R =shrinkage ratio, in grams per cubic
centimeter.
The shrinkage ratio is defined as the ratio of a given change in volume, expressed as percent of the dry volume, to the corresponding change in water content above the shrinkage limit,· expressed as percent of the weight of the oven-dried soil. · The clay content (particles sma1ler than 0.0004 mm) was determined by the hydron1eter method. Clay content and volumetric shrinkage are plotted against depth (fig. 16.1) for one of the three core holes. A close comparison between clay content and volumetric shrinkage was also noted for the other twu core holes. The relation of clay content to volumetric shrinkage
· for samples from all three core holes in the Los Banos-
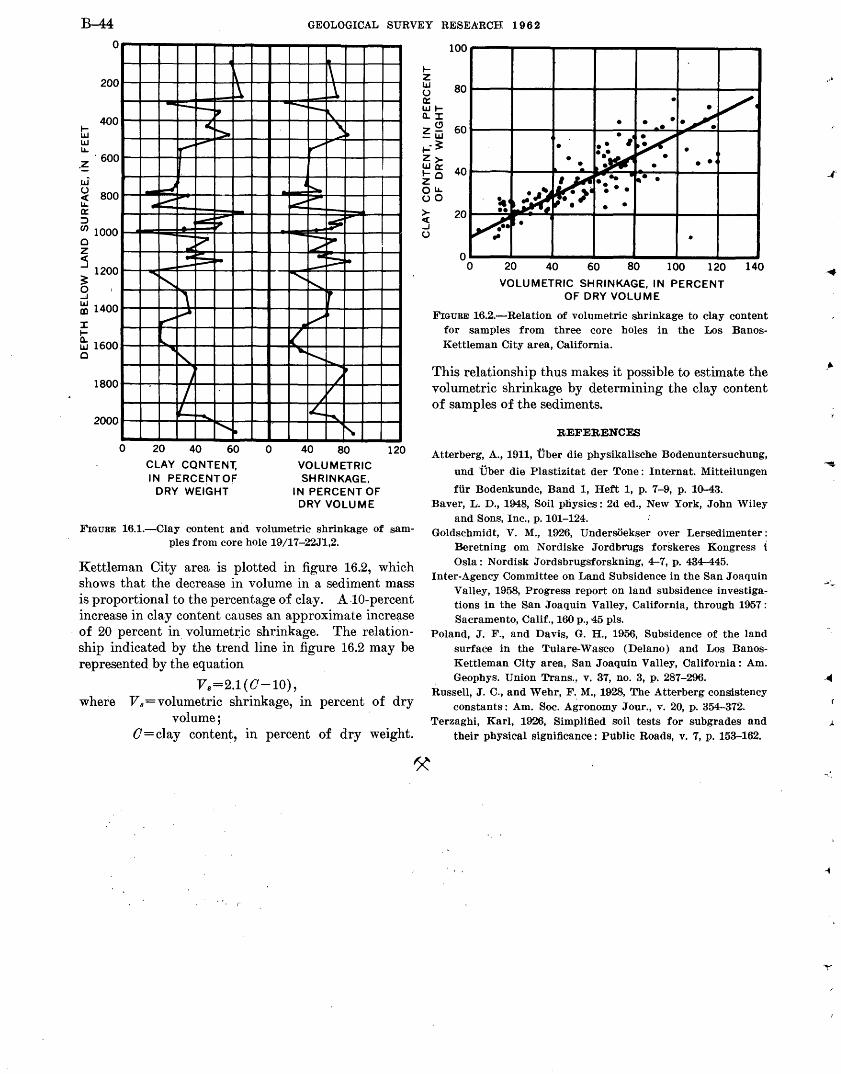
B-44 0
GEOLOGICAL SURVEY RESEA:RCH 1 9 6 2
..... UJ UJ LL.
200
400
0 600 -~ .LJ' ~ 800 LL. 0:: :::> (j) 1000 0 z
~ 1200 ~ 0 ..J
~ 1400 :t ..... ~ 1600 0
1800
2000
0
\
ll r-- ~---~
< t:::. r--- I-"'"
~
~ ... 6::::: .
A ~ ;--~ lllllt.
~ ~ 1---...~
\ ~ ~
~,
J
I I(_ t-....
~"""-!-20 40 60
CLAY CONTENT, IN PERCE~T OF
DRY WEIGHT
0
l\ Ll
r--- r-1\.
~~ ~
4~
~ --~ -~ L -~~ -I' r--.... r
.v {_ ...
j"-......_
/~ ~
.L
1-'-~ ~
40 80 VOLUMETRIC SHRINKAGE,
IN PERCENT OF DRY VOLUME
120
FIGURE 16.1.-0lay content and volumetric shrinkage of samples from core hole 19/17-22.11,2.
Kettleman City area is plotted in figure 16.2, which shows that the decrease in volume in a sediment mass is proportional to the percentage of clay. AJO-percent increase in clay content causes an approximate increase of 20 percent in volumet:r:ic shrinkage. The relationship indicated by the trend line in figure 16.2 may be represented by the equation
Vs=2.1(0-10), where Vs=volumetric shrinkage, in percent of dry
volume; 0 =clay content, In percent of dry weight.
100~--~----~----~--~-----p----~--~
~ 20~--~ .. ._~-----+----~----~----~----1 ..J ()
0~--~----~---a----~--------~--~ 0 20 40 60 80 100 120 140
VOLUMETRIC SHRINKAGE, IN PERCENT OF DRY VOLUME
FIGURE 16.2.-Relation of volumetric shrinkage to clay content for samples from three core holes in the Los BanosKettleman City area, California .
This relationship thus makes it possible to estimate the volumetric shrinkage by determining the clay content of samples of the sediments.
REFERENCES
Atterberg, A., 1911, Uber die physikalische Bodenuntersuchung,
und Uber die Plastizitat der Tone: Internat. Mitteilungen
fUr Bodenkunde, Band 1, Heft 1, p. 7-9, p. 10-43. Baver, L. D., 1948, Soil physics: 2d ed., New York, John Wiley
and Sons, Inc., p. 101-124. Goldschmidt, V. M., 1926, Unders.Oekser over Lersedimenter:
Beretning om Nordiske Jordbrugs forskeres Kongress i Osla: Nordisk Jordsbrugsforskning, 4-7, p. 434-445.
Inter-Agency Committee on Land Subsidence in the San Joaquin Valley, 1958, Progress report on land subsidence investigations in the San Joaquin Valley, California, through 1957: Sacramento, Calif., 160 p., 45 pls.
Poland, J. F., and Davis, G. H., 1956, Subsidence of the land surface in the Tulare-,Vasco (Delano) and Los BanosKettleman City area, San Joaquin Valley, California: Am. Geophys. Union Trans., v. 37, no. 3, p. 287-296.
Russell, J. C., and Wehr, F .. M., 1928, The Atterberg consistency constants: Am. Soc. Agronomy Jour., v. 20, p. 354-372.
Terzaghi, Karl, 1926, Simplified soil tests for subgrades and their physical significance : Public Roads, v. 7, p. 153-162.
··'
••
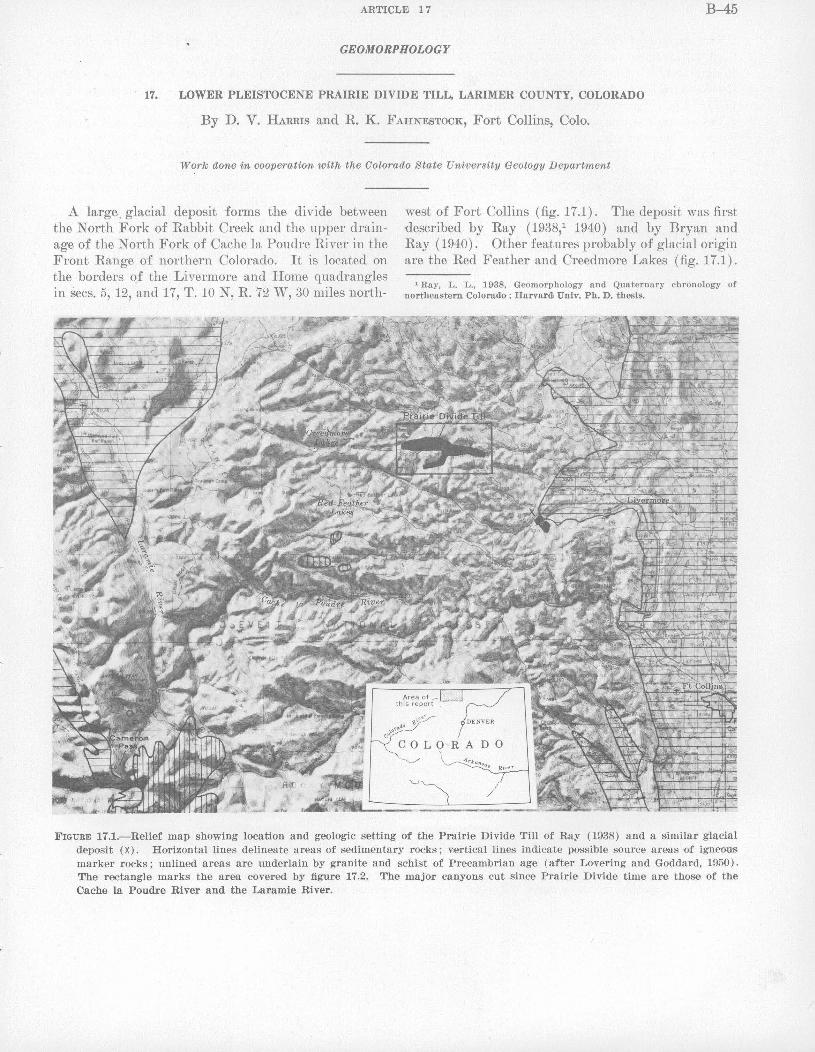
ARTICLE 17 B-45
GEOMORPHOLOGY
17. LOWER PLEISTOCENE PRAIRIE DIVIDE TILL, LARIMER COUNTY, COLORADO
By D. V. HARRIS and R. K. FAHNESTOCK, Fort Collins, Colo.
Work done in cooperation with the Colorado State University Geology Department
A large. glacial deposit forms the divide between the North Fork of Rabbit Creek and the upper drainage of theN orth Fork of Cache la Poudre River in the Front Range of northern Colorado. It is located on the borders qf the Livermore and Home quadrangles in Sees. 5, 12, and 17, T. 10 N, R. 72 W, 30 miles north-
west of Fort Collins (fig. 17.1). The deposit was first described by Ray (1938/ 1940) and by Bryan and Ray ( 1940). Other features probably of glacial origin are the Red Feather and Creedmore Lakes (fig. 17.1).
1 Ray, L. L., 1938, Geomorphology and Quaternary chronology of northeastern Colorado : Harvard Univ. Ph. D. thesis.
FIGURE 17.1.-Relief map showing location and geologic setting of the Prairie Divide Till of Ray (1938) and a similar glacial deposit (X). Horizontal lines delineate areas of sedimentary rocks; vertical lines indicate possible source areas of igneous marker rocks ; unlined areas are underlain by granite and schist of Precambrian age (after Lovering and Goddard, 1950) . The rectangle marks the area covered by figure 17.2. The major canyons cut since Prairie Divide time are those of the Cache la Poudre River and the Laramie River.
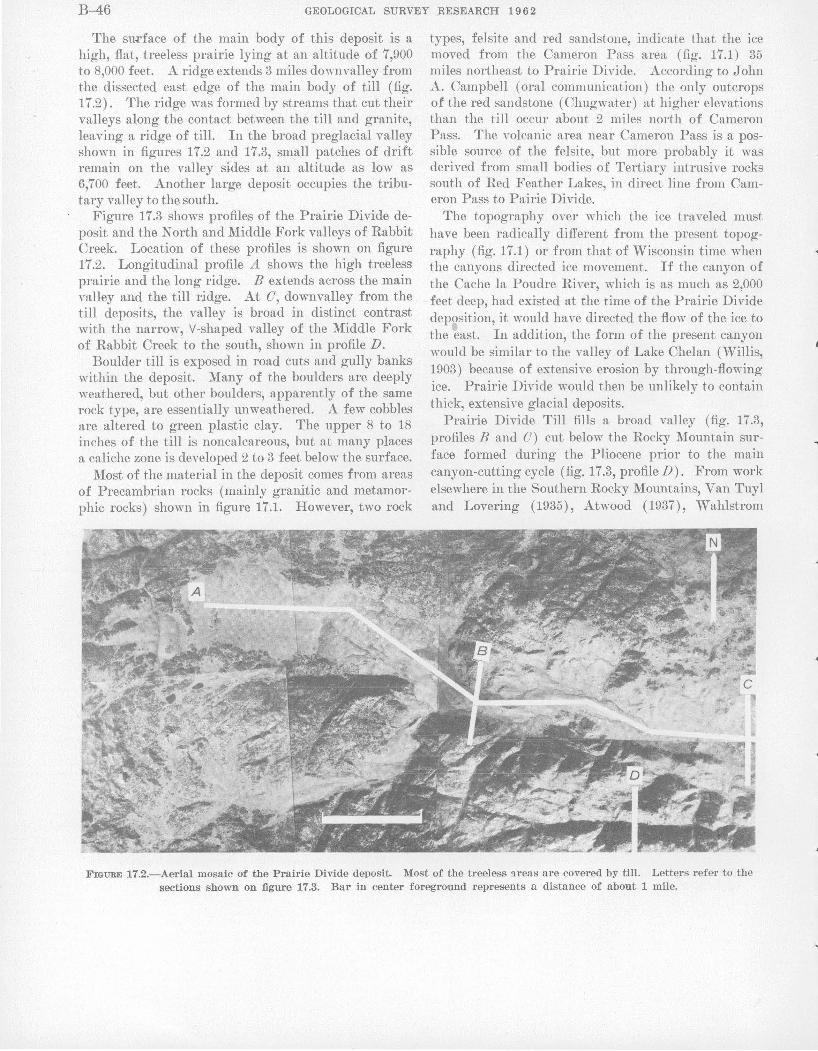
B-46 GEOLOGICAL SURVEY RESEARCH 1962
The sul.'face of the main body of this deposit is a high, flat, treeless prairie lying at an altitude of 7,900 to 8,000 foot. A ridge extends 3 miles down valley from the dissected east edge of the main body of till (fig. 17.2). The ridge was formed by streams that cut their valleys along the contact between the till and granite, leaving a ridge of till. In the broad preglacial valley shown in- figures 17.2 and 17.3, small patches of drift remain on the valley sides at an altitude as low as 6,700 feet. Another large deposit occupies the tributary valley to the south.
Figure 17.3 shows profiles of the Prairie Divide deposit and the North and Middle Fork valleys of Rabbit Creek. Location of these profiles is shown on figure 17.2. Longitudinal profile A shows the high treeless prairie and the long ridge. B extends across the main valley and the till ridge. At 0, downvalley from the till deposits, the valley is broad in distinct contrast with the narrow, V-shaped valley of the Middle Fork of Rabbit Creek to the south, shown in profile D.
Boulder till is exposed in road cuts and gully banks within the deposit. Many of the boulders are deeply weathered, but other boulders, apparently of the same rock type, are essentially unweathered. A few cobbles are altered to green plastic clay. The upper 8 to 18 inches of the till is noncalcareous, but at many places a caliche zone is developed 2 to 3 feet below the surface.
Most of the material in the deposit comes from areas of Precambrian rocks (mainly granitic and metamorphic rocks) shown in figure 17 .1. However, two rock
types, felsite and red sandstone, indicate that the ice moved from the Cameron Pass area (fig. 17.1) 35 miles northeast to Prairie Divide. According to John A. Campbell (oral communication) the only outcrops of the red sandstone (Chugwater) at higher elevations than the till occur about 2 miles north of Cameron Pass. The volcanic area near Cameron Pass is a possible source of the felsite, but more probably it was derived from small bodies of Tertiary intrusive rocks south of Red Feather Lakes, in direct line from Cameron Pass to Pairie Divide.
The topography over which the ice traveled must have been radically different from the present topography (fig. 17.1) or from that of Wisconsin time when the canyons directed ice movement. If the canyon of the Cache la Poudre River, which is as much as 2,000 feet deep, had existed at the time of the Prairie Divide deposition, it would have directed the flow of the ice to the east. In addition, the form of the present canyon would be similar to the valley of Lake Chelan (Willis, 1903) because of extensive erosion by through-flowing ice. Prairie Divide would then be unlikely to contain thick, extensive glacial deposits.
Prairie Divide Till fills a broad valley (fig. 17.3, profiles B and 0) cut below the Rocky ~1ountain surface formed during the Pliocene prior to the 1nain canyon -cutting cycle (fig. 17 .3, profile D) . From work elsewhere in the Southern Rocky Mountains, VanTuyl and Lovering (1935), Atwood (1937), Wahlstrom
FIGURE 17.2.-Aerial mosaic of the Prairie Divide deposit. Most of the treeless 9-reas are covered by till. Letters refer to the sections shown on figure 17.3. Bar in center foreground represents a distance of about 1 mile.
•
1
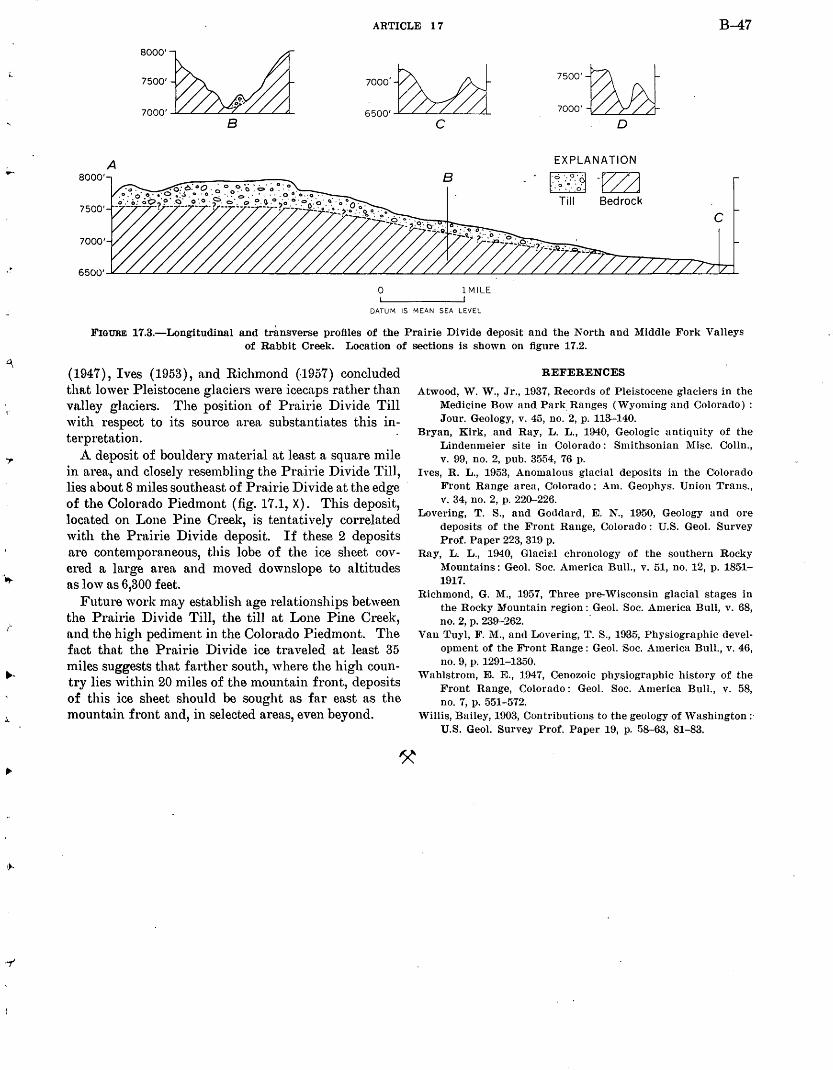
·~
,-
ARTICLE 17 B-47
1ooo·-P\ A~ 7500'~ ~ ~ 7000'~
0 B 6500'~
c
A EXPLANATION
8000' B - ~-~ ~ LLLJ
Till Bedrock 7500'
7000'
0 1 MILE
DATUM IS MEAN SEA LEVEL
FIGURE 17.3.-Longitudin.al and transverse profiles of the Prairie Divide deposit and the North and Middle Fork Valleys of Rabbit Creek. Location of sections is shown on figure 17.2.
(1947), Ives (1953), and Richmond (-1957) concluded that lower Pleistocene glaciers were icecaps rather than valley glaciers. The position of Prairie Divide Till with respect to its source area substantiates this interpretation.
A deposit of bouldery material at least a square mile in area, and closely resembling the Prairie Divide Till, lies about 8 miles southeast of Prairie Divide at the edge of the Colorado Piedmont (fig. 17.1, X). This deposit, located on Lone Pine Creek, is tentatively correlated with the Prairie Divide deposit. If these 2 deposits are contemporaneous, this lobe of the ice sheet covered a large area and moved downslope t.o altitudes as low as 6,300 feet.
Future work may establish age relationships between the Prn.irie Divide Till, the till at Lone Pine Creek, and the high pediment in the Colorado Piedmont. The fact thnt the Prairie Divide ice traveled at least 35 miles suggests that farther south, where the high country lies within 20 miles of the mountain front, deposits of this ice sheet should be sought as far east as the mountain front and, in selected areas, even beyond.
REFERENCES
Atwood, W. W., Jr., 1937, Records of Pleistocene glaciers in the Medicine Bow and Park Ranges (Wyoming and Colorado) : Jour. Geology, v. 45, no. 2, p. 113-140.
Bryan, Kirk, .and Ray, L. L., 1940, Geologic antiquity of the Lindenmeier site in Colorado : Smithsonian Misc. Colin., v. 99, no. 2, pub. 3554, 76 p.
Ives, R. L., 1953, Anomalous glacial deposits in the C<>lorado Front Range area, Colorado: Am. Geophys. Union Trans., v. 34, no. 2, p. 22()-226.
Lovering, T. S., and Goddard, E. N., 1950, Geology and ore deposits of the Front Range, Colorado: U.S. Geol. Survey Prof. Paper 223, 319 p.
Ray, L. L., 1940, Glacill'.l chronology of the southem Rocky Mountains: Geol. Soc. America Bull., v. 51, no. 12, p. 1851-1917.
Richmond, G. l\f., 1957, Three pre-Wisconsin glacial stages in the Rocky Mountain region: Geol. Soc. America Bull, v. 68, no.2,p. 239-262. ·
Van Tuyl, F. M., and Lovering, T. S., 1935, Physiographic development of the Front Range: Geol. ·soc. America Bull., v. 46, no. 9, p. 1291-1350.
'Vahlstrom, E. E., 1947, Cenozoic physiographic history of the Front Range, Colorado: Geol. Soc. America Bull., v. 58, no. 7, p. 551-572.
Willis, Bailey, 1903, Contributions to the geology of Washington:· U.S. Geol. Survey Prof. Paper 19, p. 58-63, 81-83.
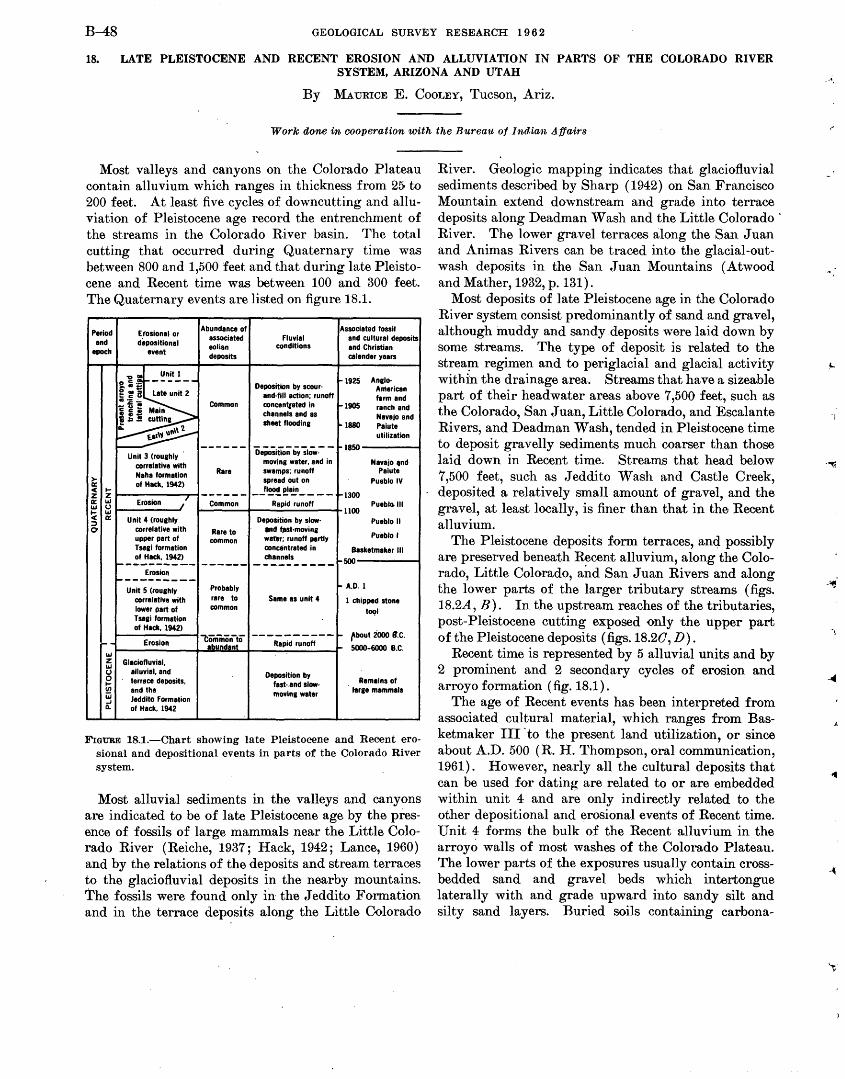
B-48 GEOLOGICAL SURVEY RESEARCH 1 9 6 2
18. LATE PLEISTOCENE AND RECENT EROSION AND ALLUVIATION IN PARTS OF THE COLORADO RIVER SYSTEM, ARIZONA AND UTAH
By MAumeE E. CooLEY, Tucson, Ariz.
Work done in cooperation with the Bureau of Indian Affairs
Most valleys and canyons on the Colorado Plateau contain alluvium which ranges in thickness from 25 to 200 feet. At least five cycles o£ downcutting and alluviation o£ Pleistocene age record the entrenchment o£ the streams in the Colorado River basin. The total cutting that occurred during Quaternary time was between 800 and 1,500 feet and that during late Pleistocene and Recent time was between 100 and 300 feet. The Quaternary events are listed on figure 18.1.
Period and
epach
Etosional or depositional
event
ifi~~ .. c\:•u~ll~'~:.~ ;--
Abundance of associated eolian dePOsits
Fluvial conditions
Deposition by scour· and·fill action; runoff concant,cated in channels and as llleet floodina ~-~·
~3 (rou(lhly . ---- - - iiit'Pcisitio'; bY slcnw:- -correlative with moving water, and in Naha formation Rare swamps; runoff
~ of Hack, 1942) spread out on
Associated fossil and cultural dePOsits and Christian calender years
1925 An(IIO· American firm and
1905 ranch and Navajo and
1880 Paiute utilization
1850
Navajo 11nd Paiute
Pueblo IV
~ !Z t------~------ _ _fl~e!~-·---ffi ~ Erosion 1 ' 1--c_o_m_mo_n-+ __ R_a.;...pid_ru_no_ff--+
~ ~ t--U-ni-t 4-(-ro-u(l-hly.J DePOsition by slow·
1300 Pueb~lll
llOO Pueblo II
o correlative with Rare to llld fltst·movina Pueblo 1 upper part of common watllr; runoff partly
Tseai formation concentrated in Basketmaker 111
~-!f!!c~~~2~- ------ -~~~e~s _____ ~soo-----4
1--w
Erosion ~---------
Unit 5 (rou(lhly correlative with lower part of Tse11i formation of Hack, 1942)
Erosion
~ Glaciofluvial, o alluvial, and 0 terrace dePOsits, :n end the ~ Jeddito Formation 1:L. of Hack, 1942
Probably rare to common
Same as unit 4
~A.D. 1
1 chipped stone toql
1:~~~iin-to ---------- ~ ~bout iooo lf.c. au~tndant Rapid runoff "" 5000-6000 B.C.
DePOsition by fast-.and slow· movin11 water
Remains of tarae mammals
FIGURE 18.1.-Chart showing late Pleistocene and Recent erosional and depositional events in parts of the Colorado River system.
Most alluvial sediments in the valleys and canyons are indicated to be o£ late Pleistocene age by the presence o£ fossils o£ large mammals near the Little Colorado River (Reiche, 1937; Hack, 1942; Lance, 1960) and by the relations o£ the deposits and stream terraces to the glaciofluvial deposits in the nearby mountains. The fossils were found only in: the Jeddito Formation and in the terrace deposits along the Little Colorado
River. Geologic mapping indicates that glaciofluvial sediments described by Sharp ( 1942) on San Francisco Mountain extend downstream and grade into terrace deposits along Deadman Wash and the Little Colorado · River. The lower gravel terraces along the San Juan and Animas Rivers can be traced into the glacial-outwash deposits in the San Juan Mountains (Atwood and Mather, 1932, p. 131).
Most deposits o£ late Pleistocene age in the Colorado River system consist predominantly o£ sand and gravel, although muddy and sandy deposits were laid down by some streams. The type o£ deposit is related to the strea~ regimen and to periglacial and glacial activity within the drainage area. Streams that have a sizeable part o£ their headwater areas above 7,500 feet, such as the Colorado, San Juan, Little Colorado, and Escalante Rivers, and Deadman Wash, tended in Pleistocene time to deposit gravelly sediments much coarser than those laid down in Recent time. Streams that head below 7,500 feet, such as ,Jeddito Wash and Castle Creek, deposited a relatively small amount of gravel, and the gravel, at least locally, is finer than that in the Recent alluvium.
The Pleistocene deposits form terraces, anq. possibly are preserved beneath Recent alluvium, along the Colorado, Little Colorado, and San Juan Rivers and along the lower parts of the larger tributary streams (figs. 18.2A, B). In the upstream reaches o£ the tributaries, post-Pleistocene cutting exposed only the upper part o£ the Pleistocene deposits (figs. 18.20, D).
Recent time is represented by 5 alluvial units and by 2 prominent and 2 secondary cycles o£ erosion and arroyo £ormation (fig. 18.1).
The age o£ Recent events has been interpreted £rom associated cultural material, which ranges from Basketmaker III , to the present land utilization, or since about A.D. 500 (R. H. Thompson, oral communication, 1961). However, nearly all the cultural deposits that can be used £or dating are related to or are embedded within unit 4 and are only indirectly related to the other depositional and erosional events o£ Recent time. lTnit 4 forms the bulk of the Recent alluvium in the arroyo walls o£ most washes o£ the Colorado Plateau. The lower parts of the exposures usually contain crossbedded sand and gravel beds which intertongue laterally with and grade upward into sandy silt and silty sand layers. Buried soils containing carbona-
.... ,
.-
'J
·""fl
).
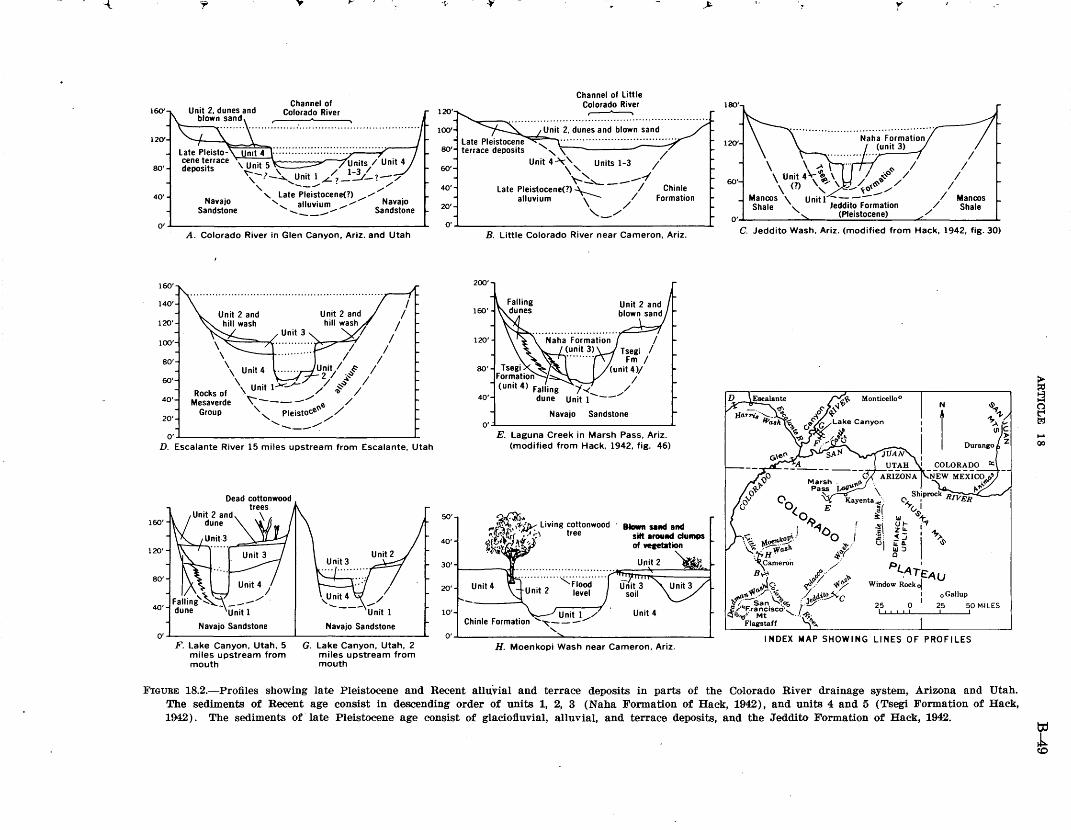
-t
160'
120'
80'
40'
r
Navajo Sandstone
,
Channel of Colorado River
0'~---------------------------------------------L
160'
140'
120'
100'
80'
60'
40'
20'
A. Colorado River in Glen Canyon, Ariz. and Utah
Rocks of Mesaverde
Group
I I
\
Unit I s- II ~/ -2/ -~
\ Unit 1 .......... _...._ / ~' 1 \""----_.../ ~ /
' e / '-.. Pleistoc.e(' / ........ /
____ .,...
I I
I I
o•._ __________________________________________ ~
D. Escalante River 15 miles upstream from Escalante, Utah
160'
120'
80'
40'
Navajo Sandstone Navajo Sandstone
0' F.~;:-;::=:-;-::=---:~:::--:.:::~~~___1 F. Lake Canyon, Utah, 5
miles upstream from mouth
G. Lake Canyon, Utah, 2 miles upstream from mouth
~
120'
100'
80'
60'
40'
20'
0'
50'
40'
~
Channel of little Colorado River
,~,
·' / Umt 4~\. Units 1-3 1 ,, "~'------~ Late Pleistocene(?)-\-.._ I Chinle
alluvium \ / Formation
-"'"
\..._//
--~~==~~------~ B. Little Colorado River near Cameron, Ariz.
200'
160'
120'
80'
40'
I Tsegi I
Fm I (unit 4)1
I '/·-/.._ ... /
Unit 1 --
Navajo Sandstone
o·~·------------------------------~ E. laguna Creek in Marsh Pass, Ariz.
(modified from Hack, 1942, fig. 46)
~ .. ~~~",;;IV Living cottonwood
'"' . .!.lj;\'·.~· t "i~' ~r( , ,4 o;\ ree Q~~i~_,.J 11-f-,-li-'""''"li.''-·-!:
30' ,n. ....
20' Unit 4
10'
0'~----------------~---------------------------L H. Moenkopi Wash near Cameron, Ariz.
180'
120'
60'
·r-
\ \ .,A~f I ~ \ Unit 4\-\ \ I $'0
/
\ (?) ,,. '..:-.-~o': ..... / Mancos \ Unitl ---- Mancos
Shale Shale ' Jeddito Formation
0, 1 , (Pleistocene) .... 1
C. Jeddito Wash, Ariz. (modified from Hack, 1942, fig. 30)
Monticello 0 I N
1 ~} .... ~~
nnnnanui)~
(' 'iS{ - \ 0.1 E Kayenta · ..
'O ~( -c I ~..d I ~: 'r . .,Q . ~~ '-~ t-t~k.~... 0 1' -E ~~·· wa.sh. . ..:' : H· ~-· ~~
Cameron ~~{
NEW MEXICC?~'!>
0 Ship~ /y i RIVER
v-s> :1 ~ tv ziL 1
~:::i II ~.>-~~ \S'
B-r.- ,./ ..to.&Jc;; ~~··· -~~
-n.fl. T' _::r-· . .., ~ . ~"l b'l'";.·-·· \.. 7 . / "':, ... F. San '>~q;, .. Je~~~'\:c
Pt..,tJ,, I . tf2.il Window Rock~ ,.,U
I
25 O I ~~"', .. ra~flscci·, t !:/" Flagstaff ... ~z, , .....
INDEX MAP SHOWING LINES OF PROFILES
FIGURE 18.2.-Profiles showing late Pleistocene and Recent alluvial and terrace deposits in parts of the Colorado River drainage system, Arizona and Utah. The sediments of Recent age consist in descending order of units 1, 2, 3 (Naha Formation of Hack, 1942), and units 4 and 5 (Tsegi Formation of Hack, 1942). The sediments of late Pleistocene age consist of glacio:fluvial, alluvial, and terrace deposits, and the Jeddito Formation of Hack, 1942.
> ~ 1-1 a t'4 t"J
.... 00
td
~
B.-50 GEOLOGICAL SURVEY RESEARCH 19 6 2
ceous material and very thin mud beds are scattered throughout the unit. The upper few feet of the unit usually contains considerable interbedded eolian material.
Unit 5 (fig. 18.2A), the oldest alluvial unit of Recent age, is beneath unit 4 in small exposures in Glen Canyon and possibly in other areas. It is lithologically similar to unit 4, although it is more firmly cemented. In some places a channeled erosion surface separates units 5 and 4, and in others their contact appears to be gradational. Evidence is insufficient at present to determine whether the channeled surfaces represent a regional or a local event.
Deposition of unit 4 was terminated by an erosional episode which may have started as early as A.D. 1100; erosion seems to have predominated during the A.D. 1200's, although in a few drainages no evidence of erosion during this time span was found. Stripping seems to have predominated during the earlier part of this erosional cycle, and deep channeli1_1g and arroyo cutting were restricted to the later part. In areas away from the deep channels, the erosion surface had slight relief; the channels were cut from 10 to 20 feet below the general level of this surface and are about two-thirds as deep and one-fifth as wide as the present arroyos formed in the same area.
Terraces were formed on unit 4 deposits during- erosion in the A.D. 1100's and 1200's along the Colorado River along most reaches of the Little Colorado and San Juan Rivers and along parts of tributary drainages, such as Harris Wash, J eddito Wash, Laguna Creek, and Lake Canyon (fig. 18.2A, B, 0, E, and G). In most places along the tributary streams the overlying sediments of unit 3 were deposited over the entire valley floor (fig. 18.2F, H).
Unit 3 contains a relatively large amount of carbonaceous material. It is composed mainly of very thin to thin-bedded sediments ranging from mud to silty sand. Gravel, prominent crossbedding features, and wind-deposited material are uncommon. The unit contains buried soils, and usually a prominent soil is the uppermost bed. In· many exposures unit 3 is represented only by this soil zone.
Units 5, 4, and 3 are probably roughly correlative with the Tsegi and N aha Formations defined by flack (1942) (fig. 18.20, E). Hack (1942, p. 51) noted that locally in Jeddito Valley, the Tsegi is separated by an erosion surface into a lower part and an upper part, which probably correlate with units 5 and 4, respec-
tively. The N aha probably correlates with unit 3. However, the correlations are tentative and the names N aha and Tsegi have not been extended beyond the areas where they were originally defined.
Events associated with the present episode of arroyo cutting abruptly terminated the deposition of unit 3. The earliest event was deposition of a thin mantle of sand and gravel (early unit 2). This was followed by the main cutting of the arroyos which occurred generally between about A.D. 1850 and 1900 (Bryan, 1925; Gregory and Moore, 1931, p. 143). Locally, deposits of late unit 2 were laid down within the confines of the arroyo, partly burying living cottonwood trees (figs. 18.2D, H). These deposits form low alluvial terraces whose heights approximate· those of high floods (fig. 18.2H). Most arroyos have widened since the main cutting, and at the present time some may be aggrading in a few places in the Defiance uplift-Chuska Mountains area.
The alluvial units were deposited under different fluvial conditions. Sediments of unit 3 were laid down by sluggish streams, and gravels in units 1, 2, and 4 by more vigorous streams (fig 18.1). The division of late Quaternary time into three broad periods of alluviation separated by periods of erosion (Bryan, 1940) can be recognized in many canyons and valleys, although the number, magnitude, and duration of the erosional and depositional events differ from drainage to drainage and along reaches of the same drainage.
REFERENCES
Atwood, W. W., and Mather, K. F., 1932, Physiography and Quaternary geology of the San Juan Mountai~s, Colorado: U.S. Geol. Survey Prof. Paper 146.
Bryan, Kirk, 1925, Date of channel trenching in the arid South-west : Science, v. 62, p. 338--344. ·
--1940, Erosion in the valleys of Southwest: New Mexico Quart., v. 10, p. 227-~2.
Gregory, H. E., and Moore, R. C., 1931, The Kaiparowits region, a geographic and geologic reconnaissance in parts of Utah and Arizona: U.S. Geol. Survey Prof. Paper 164.
Hack, .J. T., 1942, The changing physical environment of the Hopi Indians of Arizona: Peabody 1.\iuseum Papers, v. 35, no. 1.
Lance, J. F., 1960, Stratigraphic and structural position of Cenozoic fossil localities in Arizona : · Arizona Geol. Soc. Digest, v. 3, p. 155-160.
Reiche, Parry, 1937, Quaternary deformation in the Cameron district of the Plateau province: Am. Jour. Sci., 5th ser., v. 24, p. 128-138.
Sharp, R. P., 1942, Multiple Pleistocene glaciation on San Francisco Mountain, Arizona: Jour. Geology, v. 50, p. 481-503.
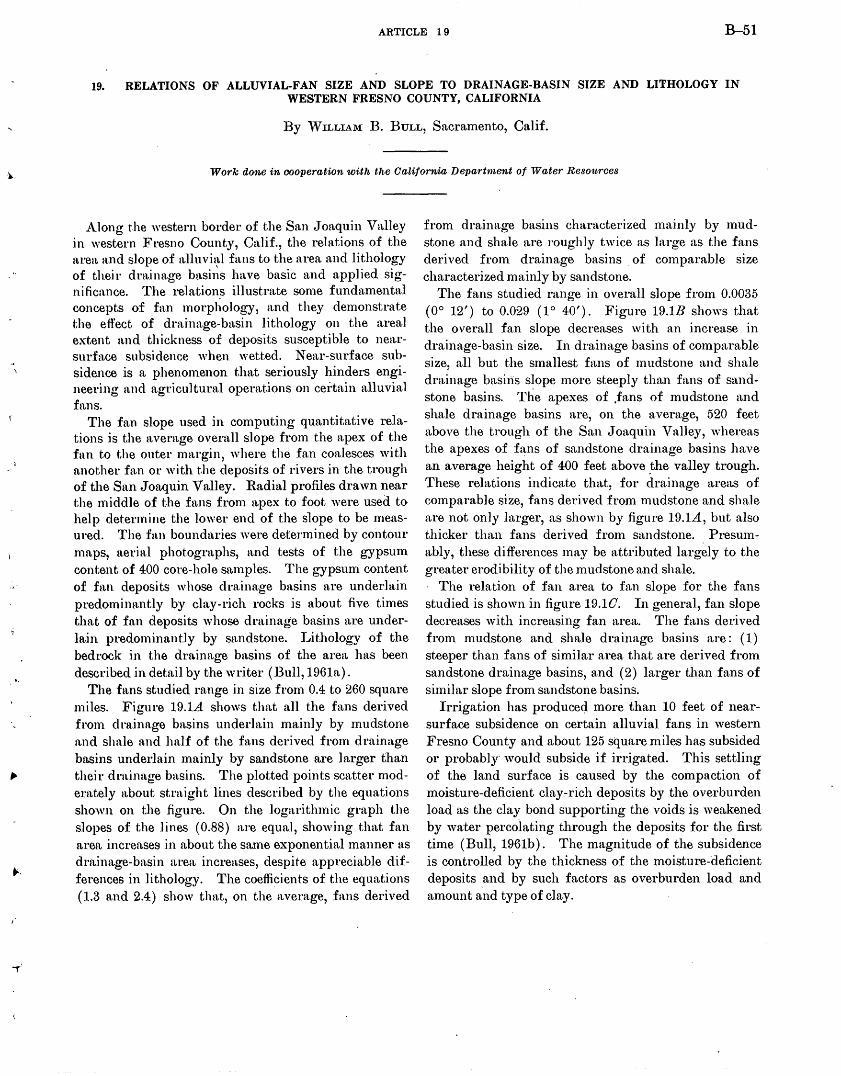
..,.·
ARTICLE 19 B-51
19. RELATIONS OF ALLUVIAL-FAN SIZE AND SLOPE TO DRAINAGE-BASIN SIZE AND LITHOLOGY IN WESTERN FRESNO COUNTY, CALIFORNIA
By WILLIAM B. BuLL, Sacramento, Calif.
Work done in oooperation with the California Department of Water Resources
Along the western border of the San Joaquin Valley in western Fresno County, Calif., the relations of the area and slope of uJluvi~~l fnns to the area and lithology of their drainage bn.sins have basic and applied significance. The relations illustrate some fundamental concepts of fan morphology, and they demonstrate the effect of drainage-bn.sin lithology on the areal extent and thickness of deposits susceptible to nea.rsurface subsidence when wetted. Near-surface subsidence is a phen01nenon that seriously hinders engineering and ~tgricultural operations on cedain alluvial fans.
The fan slope used in computing quantitative relations is the avernge overall slope from the apex of the fan to the outer margin, where the fan conlesces with another fan or with the deposits of rivers in the trough of the San Joaquin Valley. Radial profiles drawn near the middle of the fans from n.pex to foot were used to help determine the lower end of the slope to be measured. The fan boundaries were determined by contour maps, aerial photographs, and tests of the gypsum content of 400 core-hole samples. The gypsum content of fan deposits whose drainage basins are underlain predomimtntly by clay-rich rocks is about five times that of fnn deposits whose drainage basins are underlain predominantly by sandstone. Lithology of the bedrock in the drainage basins of the area has been described in detail by the writer (Bull, 1961a).
The fans studied range in size from 0.4 to 260 square miles. Figure 19.1A shows that all the fans derived from drn.inage basins underlain mainly by mudstone and shale and half of the fans derived from drainage basins underlain mainly by sandstone are larger than their drn.irmge basins. The plotted points scatter moderately about straight lines described by the equations shown on the figure. On the logarithmic graph the slopes of the lines (0.88) are equal, showing that fan area increttses in about the snJne exponential manner as drainage-basin area incren.ses, despite appreciable differences in lithology. The coefficients of the equations (1.3 and 2.4) show that, on the nverage, fans derived
from drainage basins eha.racterized mainly by mudstone and shale are roughly twice as large as the fans derived from drainage basins . of comparable size characterized mainly by sandstone.
The fans studied range in overall slope from 0.0035 ( 0° 12') to 0.029 ( 1° 40'). Figure 19.1B shows that the overall fan slope decre~tSes with an increase in drainage-basin size. In drainage basins of comparable size, all but the smallest fans of mudstone and shale drainage basi11s slope more steeply than fans of sandstone basins. Tl~e apexes of .fans of mudstone and shale drainage basins are, on the average, 520 feet above the trough of the San Joaquin Valley, whereas the apexes of fans of sandstone drainage basins have an average height of 400 feet above _the valley trough. These relations indicate that, for drainage areas of comparable size, fans derived from mudstone and shale are not only larger, as shown by figure 19.1A, but also thicker than fans derived fr01n sandstone. Presuma.bly, these differences may be attributed largely to the greater erodibility of the mudstone and shale. · The relation of fan area to fan slope for the fans studied is shown in figure 19.10. In general, fan slope decreases with increasing fan area. The fans derived from mudstone and shale drainage basins are: ( 1) steeper than fans of similar area that are derived from sandstone drainage basins, and ( 2) larger than fans of similar slope from sandstone basins.
Irrigation has producec;l more than 10 feet of nearsurface subsidence on certain alluvial fans in western Fresno County and about 125 square miles has subsided or probably would subside if irrigated. This settling of the land surface is caused by the compaction of moisture-deficient clay-rich deposits by the overburden load as the clay bond supporting the voids is weakened by water percoiating through the deposits for the first time (Bull, 1961b). The magnitude of the subsidence is controlled by the thickness of the moisture-deficient deposits .and by such factors as overburden load and amount and type of clay .
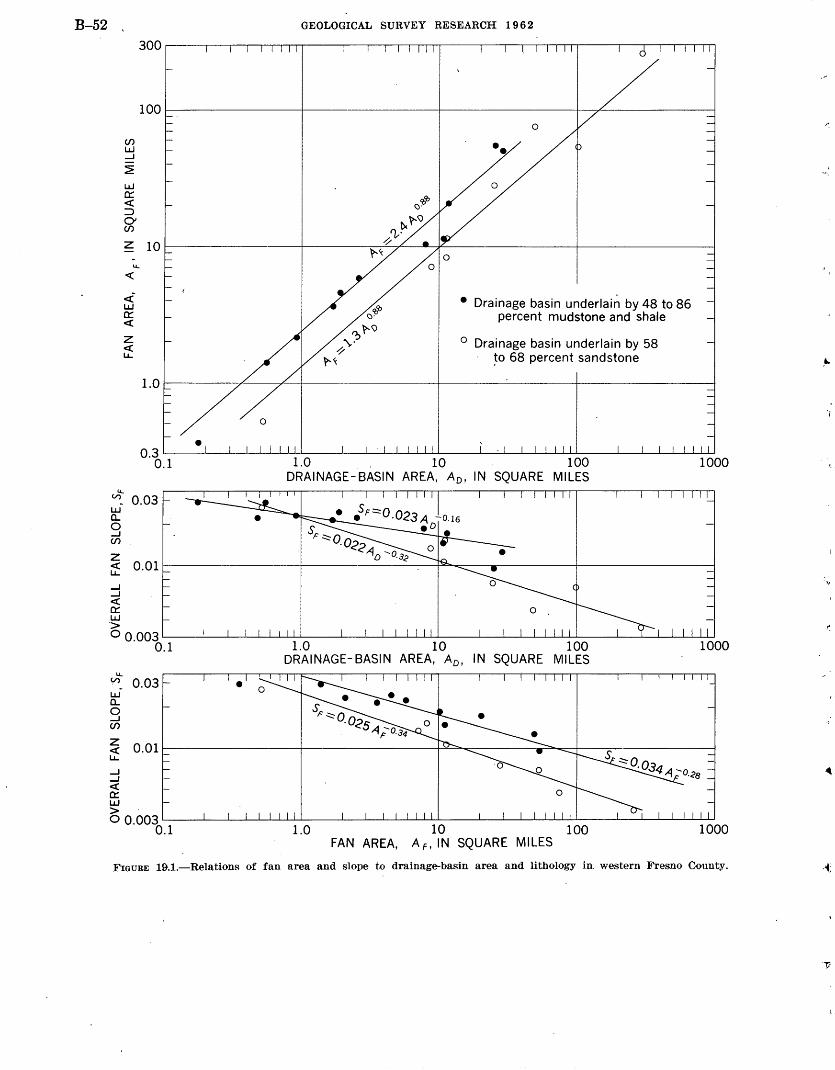
B-52 ,
.....J
.....J <( a:: LJ.J '>
(/) LJ.J .....J
~
LJ.J a:: <( :::> 0' (/)
z u.. ~
<i LJ.J a:: <(
z <( LL...
100
10
1.0
GEOLOGICAL SURVEY RESEARCH 1 9 6 2
• Drainage basin underlain by 48 to 86 percent mudstone and shale
0 Drainage basin underlain by 58 ~o 68 percent sandstone
0.3~--~--~~~~~----~~~~~~----~~--~~~U---~--~~~~LU
0.1 1.0 10 100 1000 DRAINAGE-BASIN AREA, A 0 , IN SQUARE MILES
0 0.003~----~~~~~~--~~~~~~~--~~~~~~~--~~~~~~ 0.1 1.0 10 100 1000
u.. V) 0.03 LJ.J Q_
0 .....J (/)
DRAINAGE-BASIN AREA, A0 , IN SQUARE MILES
z <( 0.01~--------------~--------------~~~---------=~~--------------~ LL...
.....J
.....J <( a:: LJ.J > 00.003L---~~_J~~~L---~~~_L~~L---~~~_L~~L---~~~_L~~
1.0 10 100 1000 0.1 FAN AREA, A F• IN SQUARE MILES
FIGURE 19.1.-Relations of fan area and slope to drainage-basin area and lithology in. western Fresno County. . .. ;
'11
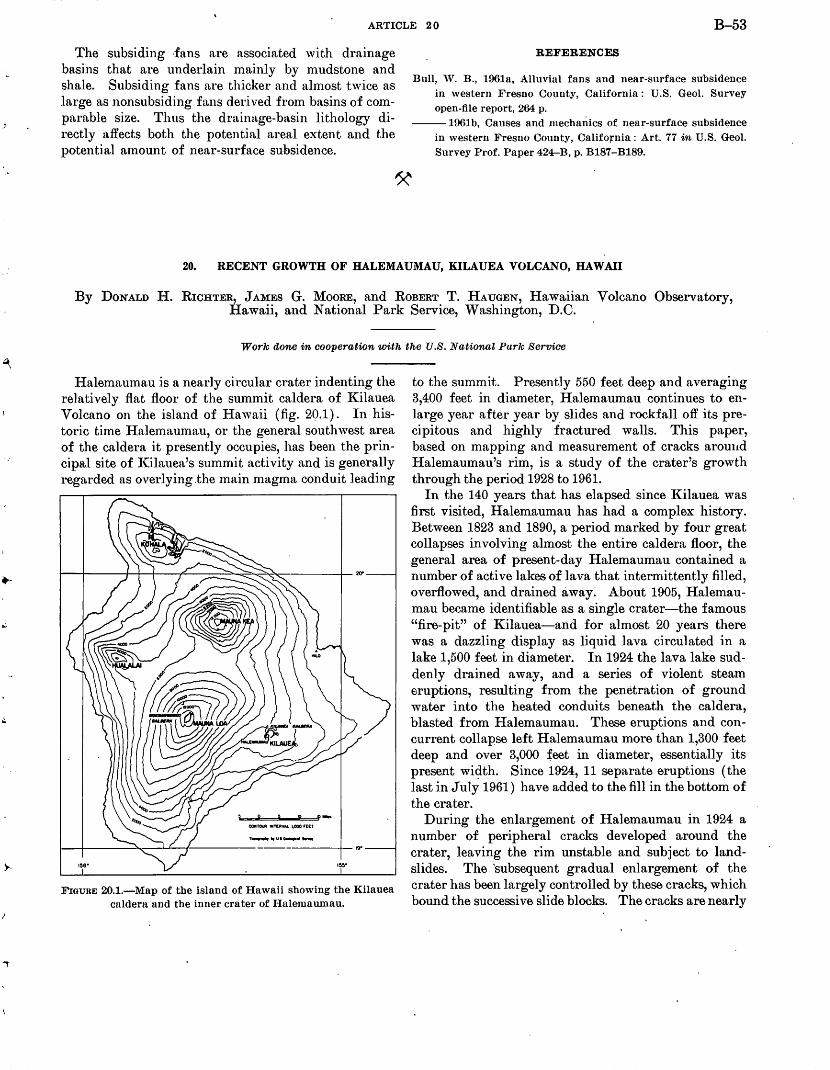
~·
..,
ARTICLE 20 B-53
The subsiding ·fans are associated with drainage basins that are underlain mainly by mudstone and shale. Subsiding fans are thicker and almost twice as large as nonsubsiding fn.ns derived from basins of comparable size. Thus the drainage-basin lithology directly affects both the potential areal extent and the potential amount of near-surface subsidence.
REFERENCES
Bull, ,V. B., 196la, Alluvial fans and near-surface subsidence in western Fresno County, California: U.S. Geol. Survey open-file report, 264 p.
--1961b, Causes and mechanics of near-surface subsidence in western Fresno County, California: Art. 77 in U.S. Geol. Survey Prof. Paper 424-B, p. B187-B189.
20. RECENT GROWTH OF HALEMAUMAU, KILAUEA VOLCANO, HAW All
By DoNALD H. RICHTER, JAMES G. MooRE, and RoBERT T. HAUGEN, Hawaiian Volcano Observatory, Hawaii, and National Park Service, Washington, D.C.
Work aone in cooperation with the U.S. National Park Service
Halemaumau is a nearly circular crater indenting the relatively flat floor of the summit caldera of Kilauea Volcano on the island of Hawaii (fig. 2().1). In historic time Halemaumau, or the general southwest area of the caldera it presently occupies, has been the principal site of IGlauea's summit activity and is generally regarded ns overlying .the main magma conduit leading
0 q , , .... CONTQ.It INTf.RVAL. I.OOOFtU
----l--19'
''6' ,,,. I
FIGURE 20.1.-Map of the island of Hawaii showing the Kilauea caldera and the inner crater of Halemaumau .
to the summit. Presently 550 feet deep and averaging 3,400 feet in diameter, Halemaumau continues to enlarge year after year by slides and rockfall off its precipitous and highly fractured walls. This paper, based on mapping and measurement of cracks arou11d Halemaumau's rim, is a study of the crater's growth through the period 1928 to 1961.
In the 140 years that has elapsed since Kilauea was first visited, Halemaumau has had a complex history. Between 1823 and 1890, a period marked by four great collapses involving almost the entire caldera floor, the general area of present-day Halemaumau contained a number of active lakes of lava that intermittently filled, overflowed, and drained away~ About 1905, Halemaumau became identifiable as a single crater-the famous "fire-pit" of Kilauea-and for almost 20 years there was a dazzling display as liquid lava circulated in a lake 1,500 feet in diameter. In 1924 the lava lake suddenly drained away, and a series of violent steam eruptions, resulting from the penetration of ground water into the heated conduits beneath the caldera, blasted from Halemaumau. These eruptions and concurrent collapse left Halemaumau more than 1,300 feet deep and over 3,000 feet in diameter, essentially its present wi~th. Since 1924, 11 separate eruptions (the last in July 1961) have added to the fill in the bottom of the crater.
During the enlargement of Halemaumau in 1924 a number of peripheral cracks developed around the crater, leaving the rim unstable and subject to landslides. The 'subsequent gradual enlargement of the crater has been largely controlled by these cracks, which bound the successive slide blocks. The cracks are nearly
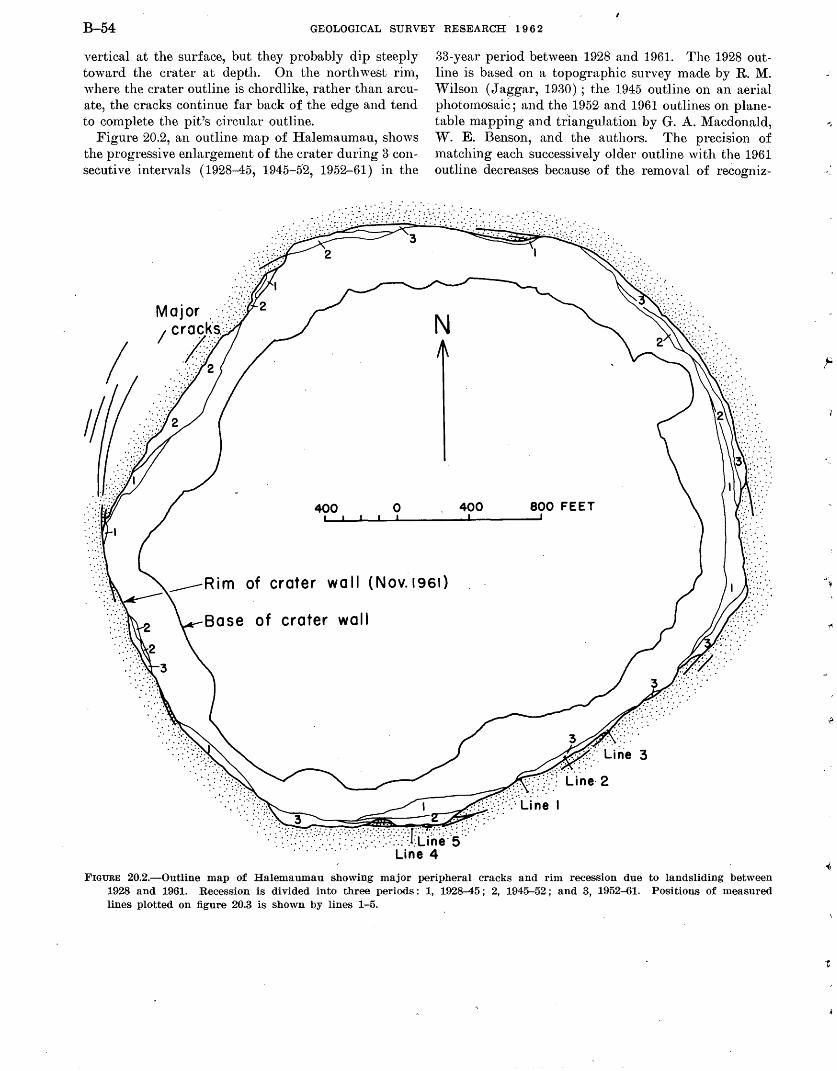
B-54 GEOLOGICAL SURVEY RESEARCH 1 9 6 2
vertical at the surface, but they probably dip steeply toward the crater at depth. On the nortlnvest rim, where the crater outline is chordlike, rather than arcuate, the cracks continue far back of the edge and tend to complete the pit's circular outline..
Figure 20.2, an outline map of Hale.maumau, shows the progressive enlargement of the crater during 3 consecutive intervals (1928-45, 1945-62, 1952-61) in the
400 0
33-year period between 1928 and 1961. The. 1928 outline is based on a topographic survey made. by R. M. Wilson ( J aggar, 1930) ; the 1945 outline on an aerial photomosaic; and the 1952 and 1961 outlines on planetable mapping and triangulation by G. A. Macdonald, W. E. Benson, and the authors. The. precision of matching each successively older outline with the. 1961 outline decreases because. of the. removal of re.Cogniz-
N
400 800 FEET
---Rim of crater wall (Nov.l961)
Base of crater wall
•' .· .. ··:·:·.· . 3
. ·.:.: Yi-.:>·\~f.:·<:': :\':'i\u~iiF;~: . FIGURE 20.2.-0utline map of Halemaumau showing major peripheral cracks and rim recession due to landsliding between
1928 and 1961. Recession is divided into three periods: 1, 1928-45; 2, 1945-52; and 3, 1952-61. Positions of measured lines plotted on figure 20.3 is shown by lines 1-5.
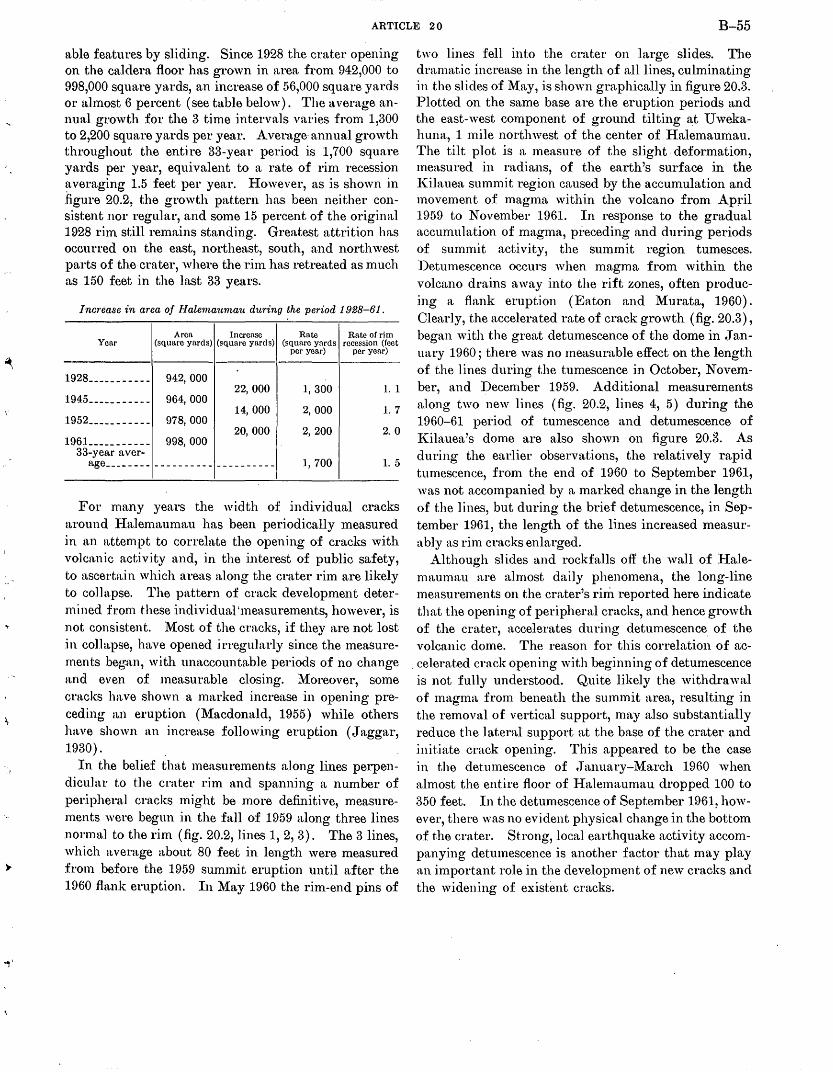
ARTICLE 20 B-55
n.ble features by sliding. Since 1928 the crater opening on the cnJdera floor has grown in area from 942,000 to 998,000 sqmtre yards, an increase of 56,000 square yards or uJmost ()percent (see table below). The average anlnutl growth for the 3 time intervals varies from 1,300 to 2,200 square yards per year. Average· annual growth throughout the entire 33-year period is 1,700 square yards per ye~tr, equivalent to a rate of rin1 recession nveraging 1.5 feet per year. However, as is shown in .figure 20.2, the growth pattern has been neither consistent nor regular, and some 15 percent of the original 1928 r.itn still remains standing. Greatest attrition has occurred on the east, northeast, south, and northwest parts of the crater, where the rin1 has retreated as much as 150 feet in the last 33 years.
lnc1·ease in area of lialemaurnau d~tring the period 1928-61.
Area Increase Rate Rate of rim Year (square yards) (square yards) (square yards recession (feet
per year) per year)
1928 ___________ 942,000 22, 000 1, 300 1. 1 1945 ___________ 964,000 14, 000 2,000 1.7
1952 _____ ------ 978,000 20, 000 2, 200 2. 0
1961_ ____ ------ 998, 000 33-year aver-n.ge ________ ---------- ---------- 1, 700 1.5
For rnn,ny years the width of individual cracks around I-Ialemaumau has been periodically measured in an attempt to correlate the opening of cracks with volcanic activity and, in the interest of public safety, to ascertain which areas along the crater rim are likely to collapse. The pattern of crack development determined from these individual'measurements, however, is not consistent. Most of the cracks, if they are not lost in collapse, ha,ve opened irregularly since the measurements beg:n.n, with unaccountable periods of no change and even of measurable closing. l\1oreover, some cracks have shown a marked increase in opening preceding an eruption (Macdonald, 1955) while others ha.ve shown an increase following eruption (Jaggar, 1930).
In the belief that measurements along lines perpendicular to the crater rim and spanning a number of peripheral cracks might be more definitive, measurements were begun in the fall of 1959 along three lines normn.l to the rim (fig. 20.2, lines 1, 2, 3). The 3 lines, which average about 80 feet in length were measured from before the 1959 sumtnit eruption until after the 1960 flank eruption. In l\1ay 1960 the rim-end pins of
two lines fell into the crater on large slides. The dramatic increase in the length of all lines, culminating in the slides of May, is shown graphically in figure 20.3. Plotted on the same base are the eruption periods and the east-west component of ground tilting at Uwekahuna, 1 mile northwest of the center of Halemaumau. The tilt plot is a measure of the slight, deformation, measured in radians, of the· earth's surface in the IGlauea summit region caused by the accumulation and movement of magma within the volcano from Ap~·il 1959 to November 1961. In response to the gradual accumulation of magma, pi·eceding and during periods of summit activity, the summit region tumesces. Detumescence occurs when magma from within the volcano drains away into the rift zones, often producing a flank eruption (Eaton and Murata, 1960). Clearly, the accelerated rate of crack growth (fig. 20.3), began with the great detumescence of the dome in January 1960; there was no measurable effect on the length of the lines during the tumescence in October, November, and December 1959. Additional measurements along two new lines (fig. 20.2, lines 4, 5) during the 1960-61 period of tumescence and detumescence of IGlauea's dome are also shown on figure 20.3. As during the earlier observations, the relatively rapid tumescence, from the end of 1960 to September 1961, was not accompanied by a marked change in the length of the lines, but during the brief detumescence, in September 1961, the length of the lines increased measurably as rim cracks enlarged.
Although slides and rockfalls off the wall of Halemaumau are almost daily phenomena, the long-line measurements on the crater's rim reported here indicate that the opening of peripheral cracks, and hence growth of the crater, accelerates during detumescence of the volcanic dome. The reason for this correlation of ac-
. celerated crack opening with beginning of detumescence is not fully understood. Quite likely the withdrawal of magma from beneath the summit area, resulting in the removal of vertical support, may also substantially reduce the lateral support at the base of the crater and initiate crack opening. This appeared to be the case in the detumescence of ,January-March 1960 when almost the entire floor of Halema.umau dropped 100 to 350 feet. In the detumescence of September 1961, however, there was no evident physical change in the bottom of the crater. Strong, local earthqmtke activity accompanying detumescence is another factor that may play an important role in the development of new cracks and the widening of existent cracks.
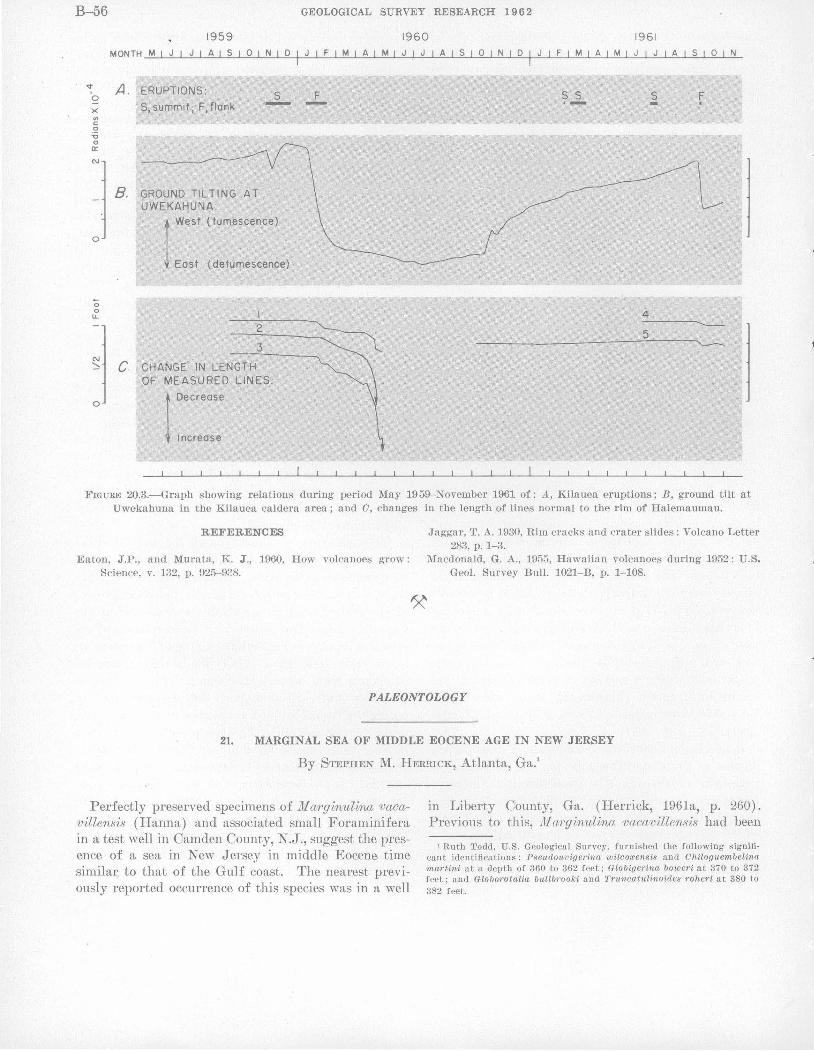
B-56 GEOLOGICAL SURVEY RESEARCH 1 9 6 2
1959 1960 1961
MONTH~M~~~~J~~A~!~S~~O~!~N~!~D~~~J~F~!~M~!~A~!~M~!~~J~~A~!~S~!-O~!~N~~D~~~J~~F~~M~!~A~!~M~!~J~!~J~!~A~-S~!~O~!~N~
'<t 'o X Ill c; 0
:0 0 a:: C\J
0
0 0 ~
0
A. ERUPTIONS:
S, summit; F, flank
8. GROUND TILTING AT UWEKAHUNA:
1 West (tumescence)
East (detumescence)
C CHANGE IN LENGTH OF MEASURED LINES:
1 Decrease
Increase
F s s s F - ·- - I
4 ---5
FIGURE 20.3.-Graph showing relations during period May 1959-November 1961 of: A, Kilauea eruptions; B, ground tilt at Uwekahuna in the Kilauea caldera area; and 0, changes, in the length of lines normal to the rim of Halemaumau.
REFERENCES
Eaton, J.P., and Murata, K. J., 1960, How volcanoes grow: Science, v. 132, p. 925-938.
Jaggar, T. A. 1930, Rim cracks and crater slides: Volcano Letter 283, p. 1-3.
Macdonald, G. A., 195G, Hawaiian volcanoes during 1952: U.S. Geol. Survey Bull. 1021-B, p. 1-108.
PALEONTOLOGY
21. MARGINAL SEA OF MIDDLE EOCENE AGE IN NEW JERSEY
By STEPHEN M. HERRICK, Atlanta, Ga.1
Perfectly preserved specimens of llf arginulina vacavillensis (Hanna) and associated small Foraminifera in a test well in Camden County, N.J., suggest the presence of a sea in New Jersey in middle Eocene time similar to that of the Gulf coast. The nearest pre viously reported occurrence of this species was in a well
in Liberty County, Ga. (Herrick, 1961a, p. 260). Previous to this, llf aTginulina vacavillensis had been
1 Ruth Todd, U.S. Geological Survey, furnished the following significant identifications : Pseudouvigerina wilcoxensis and Ohiloguembelin(t martini at a depth of 360 to 362 feet; Globigerina boweri at 370 to 372 feet; and Globorotalia bullbrooki and Truncatulinoides roheri at 380 to 382 feet.
1
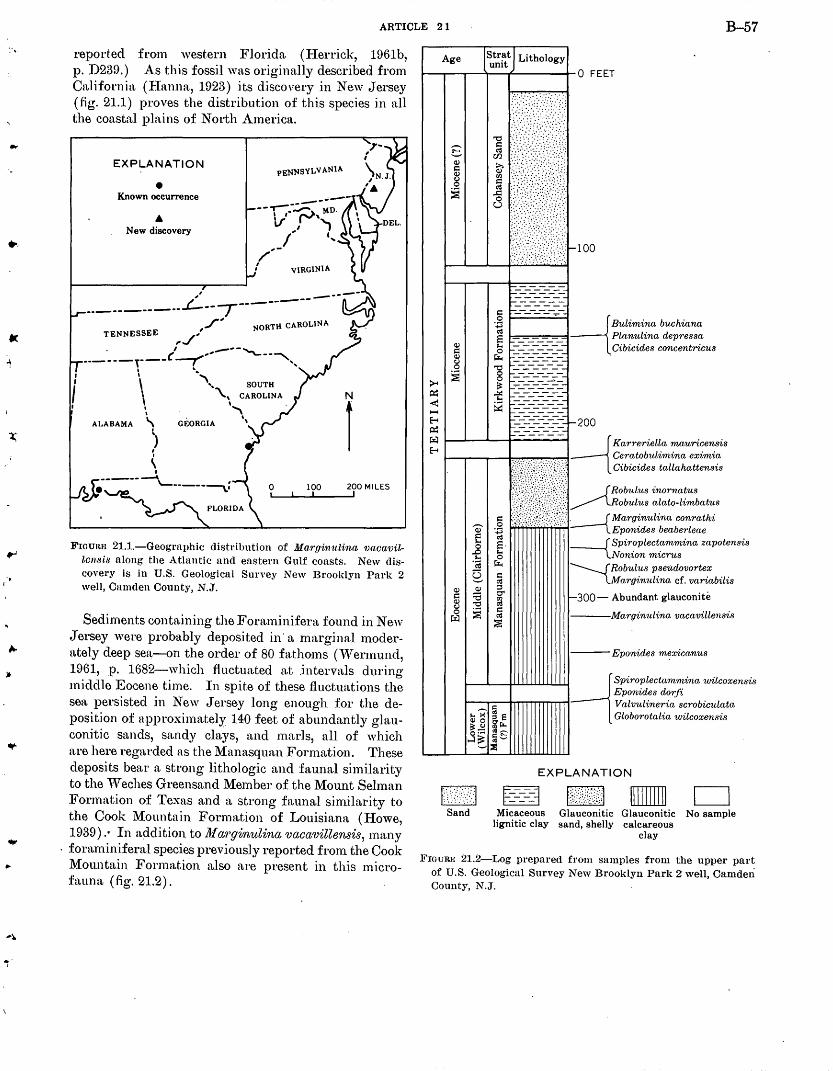
ARTICLE 21 B-57
reported from western Florida (Herrick, 1961b, p. D239.) As this fossil was originally described from California (Ilanna, 1923) its discovery in New Jersey (Jig. 21.1) proves the distribution of this species in all the coastal plains of North America.
EXPLANATION PENNSYLVANIA
• -----·-----__ ,__-~MD. Known occurrence
I I I~' v I .,
!' c,
A New discovery
/,-: VIRGINIA
L ------------------- T ,f' NORTH CAROLINA
TENNESSEE ,.../'
. l , ... ---""---, ------T·-- --r' ', I '• I ""\ \ '•"\.\ c:~~~~A
\ \ ALABAMA \ GEORGIA '
) , \
I
.--------"\.__-----~: 0 I
100 I
i 200 MILES
I
FIOU!Ull 21.1 .. -Geogrnphic distribution of Mar,qinnlina vacavillcnsi.'! along the Atlnntic and eastern Gulf coasts. New discovery is in U.S. Geological Survey New Brooklyn Park 2 well, Camden County, N.J.
Sediments containing the Foraminifera found inN ew Jersey were probably deposited .in· a marginal moderately deep sea-on the order of 80 fathoms (vVermund, 1961, .P· 1682-which ftuctua.ted at .intervals during rniddle Eocene time. In spite of these fluctuations the sea persisted .in New Jersey long enough for the deposition of approximately 140 feet of abundantly glauconitic sands, sandy clays, and marls, all of which are here regarded as t:he Manasquan Formation. These deposits bear a strong lithologic and faunal similarity to the 'Veches Greensand Member of the Mount Selman Formation of Texas and a strong faunal similarity to the Cook ~fountain Formation of Louisiana (Howe, 1939). · In addition to Ill a'rginulina vacavillensis, many fonuniniferal species previously reported from the Cook ~fountain Formation also are present in this microfauna (fig. 21.2).
lStr~t I Lithology umt J
~---r-r--4---f-----+- 0 FEET
Age
r-_ ----,__ ____ _ f----_-_-_-_ ,:::: f-=-=-=-=-::=-·B -{Bulimina buchiana S Planulina depressa
~ 5 ~==~===~= Cibicides concentricus
~ ! H~-~~~~~ < ~ _-_-_-_-_-_ ~ -:::=-:::=-=-=r-200 ~ ~-=~-=-=-=-~ -{Karreriella mauricensis ~ 1---r-,....-b~~~-:-1 Centtobulimina eximia
~{{}.~/? :\{~:}\ Cibicides tallahattensis .)'.'.y_,:,.,:_ ·-.:_::·.: :/:.:\-}::}/ \\ J Rob1tlus inornatus ·\:(((.} ~y; :-::. ~ LRobulus alato-limbatus
,:::: Wt::=;::/.:: . r Marginulina conrathi Q) ·B --I..Eponides beaberlene E S. -{Spiroplectammina znpoten.sis .f 5 Non_ion micrus ·ca ~ ---.._r Robulus pseudovortex S ; l..Marginulina cf. variabilis
::s cr r-300- Abundant glauconite ~ ,:::: ~
::I!S ---Marginulina vacavillensis
---Eponides m~xicanus
-1 Spiroplectammina wilcoxensis Eponides dor.fi
~~---+."'"T'T'T'TTTT"'"TT'T'1 Valvulineria scrobiculata ,.. ><' a e Globorotalia wilcoxensis ~ 0 ::s
~~ ~i; ...:1!3: ~--
'-':Jl
EXPLANATION
~ ~ - D
Sand Micaceous Glauconitic Glauconitic No sample lignitic clay sand, shelly calcareous
clay
FIGuRE 21.2-Log prepared from samvles from the upper part of U.S. Geological Survey New Brooklyn Park 2 well, Camden County, N.J.
B-58 GEOLOGICAL SURVEY RESEARCH 1 9 6 2
Ecologic studies of living ·organisms suggest that similar fossil species lived under similar environmental conditions. One may conclude from the evidence at hand, therefore, that a sea, similar to that known to have occupied the Gulf coast during middle Eocene time, also existed in coastal Georgia and New Jersey and probably in unreported intervening areas (the Carolinas and Virginia) . . As far as the writer is aware this paper constitutes
the first recognition of middle Eocene Foraminifera this far north in the Atlantic Coastal Plain. Spangler and Peterson ( 1950, p. 61) in a paper on the geology of the coastal plain in the central Atlantic States, consider the Manasquan Formation to be early Eocene (Wilcox) in age. On the basis of a few molluscan fossils, a vertebrate fossil, a.nd a crab's claw, Miller (1956, p. 733) concludes that "the Manasquan Formation is mid-Eocene Claiborne in age." The age of the Manasquan has been considered by Loeblich and Tappan ( 1957, p. 1113) to be earliest Eocene (Ypresian). On the basis of previous work and information presented in this article, the age of the Manasquan is considered to be early and middle Eocene.
REFERENCES
Hanna, G. D., 1923, Some Eocene Foraminifera near Vacaville, California: California Univ. Devt. Geol. Sci. Bull., v. 14, no. 9, p. 319-328.
Herrick, S.M., 1961a, Well Logs of the Coastal Plain of Georgia: Georgia Dept. Mines, Mining, and Geology Bull. 70, 462 p.
---1961b, A stratigraphically significant association of smaller Foraminifera from western Florida: Art. 376 in U.S. Geol. Survey Prof. Paper 424-D, P. D239 .
Howe, H. V., 1939, Louisana Cook Mountain IDocene Foraminifera: Louisiana State Dept. Conserv., Geol. Bull. 14, 122 p.
Loeblic.h, A. R., .Jr., and Tappan, Helen, 1957, Correla•tion of the Gulf and Atlantic Coastal Plain, Paleocene and lo.wer Eocene formations by means of planktonic Foraminifera : .Jour. Paleontology, v. 31, no. 6, p. 1109-1137.
Miller, H. "r., Jr., 1956, Correlation of Paleocene and. Eocene formations and Cretaceous-Paleocene boundary in New .Jersey: Am. Assoc. Petroleum Geologists Bull., v. 40, no. 4, p. 722-736.
Spangler, W. G., and Peterson, .J. J., 1950, Geology of Atlantic Coastal Plain in New Jersey, Delaware, Maryland, and Virginia ; Am. Assoc. Petroleum Geologists Bull., v. 34, no. 1, 99 p.
Wermund, E. G., 1961, Glauconite in early Tertiary sediments of Gulf Coastal Province: Am. Assoc. Petroleum Geologists Bull., v. 45, no. 10, p. 1667-1696.
22. RECENT DISCOVERIES OF THE CRETACEOUS AMMONITE HARESICERAS AND THEIR STRATIGRAPHIC SIGNIFICANCE
By WILLIAM A. CoBBAN, GLENN R. ScoTT, and JAMES R. GILL, Denver, Colo.
The Late Cretaceous ammonite H aresicera8 was found in the Niobrara Formation near Pueblo, Colo., in October 1961. Owing to its. association with the well known ScaJJhites hippocrepis (DeKay) of early Campanian age, H aresicera8 has been considered a guide fossil to that Cretaceous stage (Cobban and Reeside, 1952, p. 1019, and correlation chart). The discovery of H aresiceras near Pueblo thus provides evidence of a long-suspected early Campania.n age for the upper part of the Niobrara of the central Great Plains ( J eletzky, 1955). The purpose of this paper is to discus~ the stratigraphic implications of this discovery and to bring up to date the known records of occurrences of H aresiceras.
Haresicera8 was proposed by Reeside (1927, p. 17) to include ammonites that have compressed whorls, narrow mp.bilicus, flat venter. bordered by two rows of very small nodes, and subparallel flanks crossed by weak
sigmoidal ribs. Reeside described three species: H. placentifonne from the Telegraph Creek Formation of Park County, Wyo., H. natroneme from the Cody Shale of Natrona County, Wyo., and H. fi~1wri from the Mancos Shale of Emery County, Utah.
Haresiceras was first found by C. J. Hares in 1916. The genus is now known from 23 Geological Survey Mesozoic localities in the western. interior of the conterminous United States, 18 of which have been recorded in earlier reports. Reeside (1927, distribution table) listed 13 occurrences in Utah, Colorado, Wyoming, South Dakota, and Montana from rocks now assigned to the Mancos Shale, Cody Shale, Telegraph Creek Formation, and Gammon Ferruginous Member of the Pierre Shale. Five other· occurrences in the Cody Shale of central "\V'yoming have been recorded by Yenne and Pipiringos (1954), Hose (1955, p. 96), and l{eefer and Troyer ( 1956).
.4 I
....
• ARTICLE 22 B-59
New occurrences of Il(//f'esioeras are listed below with their Geological Survey ~fesozoic catalog numbers: 231,.77. NE1;4NE% sec. 13, T. 9 S., R. 61 E., Carter
County, Mont. From gray 1 imestone concretions in Gammon Ferruginous Member of Pierre Shale about 130 feet below Groat Sandstone Bed and 460 feet above top of Niobrara Formation. 11 aresice'ras placent'ifor·m,e.
.D1847. T'hree miles north of Bear Butte in the NElJr NEl4. sec. 6, T. () N., R. 6 E., Meade County, S.Dak. From m.arlstone lens in lower part of Gammon Ferruginous Me1nber of Pierre Shale. Il a'resiceras nat'l·one'n8e.
D181,..9. About 3.5 miles south of Alkali Creek in the N'V14. sec. 9, T. 4 N., R. 8 E., ~1eade County, S. Dak. From nmrlstone lens 50 feet above base of Gammon Ferrug.inous Meinbet· of Pierre Shale. 11 aresiceras nat'I'O'nense.
D2827. Four miles north of Boulder in the S'V%SElj1
sec. 1, T. 1 N., R. 71 ,V., Boulder County, Colo. From 28 feet below top of Niobrara Forrnation (base of upper yellowish-orange chalky limestone unit of Smoky }[ill Shale Member). Ilaresiceras natronen . .se ( ~)
JJ3266. One mile east of Apishapa River on small spur at base of mesa. in the NE1;4SvV1;4N,V1;4 sec. 23, T. 23 S., R. 59 ,V., Otero County, Colo. From 84 feet below top of Niobrara Formation (platy yellowish-gray chalky limestone about 70 feet below upper yellowish-ontnge chalky 1 imestone unit of Smoky Hill Shale Member). H(u·esice?YlS plaoent'ifor"lne. The last :four localities are of exceptional interest in
that they are the first records of 11 a1··esioe'ras in South Dakota east of the Black Fillls and in Colorado east of the Front Range. The two collections from east of the Black }[ills were made by Gill fr01n grayish-orangeweathering madstone in a partly calcareous shale unit assigned by the writers to the Gammon Ferruginous ~feinbet· o:f the Pierre Shale but clearly transitional into Niobrara .I ithology. The fossils are chiefly impressions but include a few well-preserved uncrushed septate coils. 8caJJldtes aq'ttilaensis Reeside and a fine-ribbed :form of 80(lJJhites hiJJpom·epi,s (Del(ay) are associated with the Hm··esice?Yl8 at the Bear Butte -locality (D1847). The two collections from the Front Range area in Colorado were made by Scott frmn rocks of unquestioned Niobrara lithology. The collection from loeali.ty D2827 near Boulder consists of an impression of part of a very large specimen that does not show the venter. The strongly ribbed flanks suggest assignment to 11. 'na,t?··one'nse. The collection from Otero County (D326()) consists of rather poor impressions of 15 weakly ribbed specimens assigned to fl. JJlacentiform~.
629660-62-5
These are associated with impressions of fragments of scaphites thn,t could be 8. hippoc'l'eJJis.
H(f,'resiceras placentiforme a1i.d fl. natronense have not been found together. The holotype of H. placentiforme came from the Elk Basin Sandstone Member of the Telegraph Creek Formation in the Elk Basin oil field along the boundary of Montana and Wyoming where it was associated with coarse-ribbed forms of 8ca1JhUe~ hizJpocrepis. The type of H. natronense came from the Cody Shale 200 feet below the Shannon Sandstone Me1nber in the Salt Creek oil field in N atrona County, vVyo. Fossil collections made subsequently by Gill at that locality show that a level 200 feet below the Shannon Sandstone Member is near the top of the range of S. hippocrepis and that the late form of this scaphite is characterized by fine ribbing. The Eagle Sandstone of central and south-central Montana contains this type of scaphite. A preliminary study of the collectionR of If aresioeras from all localities in the western interior region shows that fl. plaoentijm"''ne is older than If. natronense and is associated w~th a coarser form of S. hizJpocrepis. Both coarse- and fine-ribbed forms of 8. hippocreJJis were figured by Grossouvre (1893, pl. 32, figs. 2, 3a, 3b; pl. 35, figs. 6a-c; pl. 37, figs. 3a, 3b) and assigned to the Campanian.
The Telegraph Creek Fonnation at Elk Basin overlies undifferentiated "Niobrara and Carlile Shales" (Dobbin and others, 1945). Farther east on the northwest flank of the Powder River Basin the Telegraph Creek is treated as a member of the Cody Shale and overlies the Niobrara Shale Member of the Cody which is in part calcareous (Richards, 1955, p. 55). The occurrence of H aresioeras JJlacentiforme in the Telegraph Creek Formation at Elk Basin and in the Niobrara Formation near Pueblo, Colo., shows that the top of the Niobrara rises in time in a southeasterly direction. That the Eagle Sandstone, which overlies the Telegraph Creek Formation, is also a time equivalent to the upper part of the Niobrara Formation is suggested by the occurrence of H. natronense associated with fine-ribbed forms of 8cazJhites hippocrepis in Niobrara and Pierre transition rocks on the east side of the Black Hills uplift and by the presence of what appears to be II. nat1·onense within the Niobrara Formation in Colorado.
REFERENCES
Cobban, W. A.; and Reeside, J. B., .Jr., 1952, Correlation of the Cretaceous formations of the Western Interior of the United States : Geol. Soc. America Bull., v. 63, no. 10, p. 1011-1044.
Dobbin, C. E., and others, 1945, Geologic and structure map of the Elk Basin oil and gas field and vicinity, Park Oounty,

B-60 GEOLOGICAL SURVEY RESEARCH 1 9 6 2
~Wyoming, and Carbon County, Montana: U.S. Geol. Survey General Mineral Resources Map.
Grossouvre, A. de, 1893, Recherches sur Ia Craie Superieure, pt. 2, Paleontologie, Les ammonites de la Craie Snpedeure: Mem. Carte geol. France, 264 p. [1894].
Hose, R. K., 1955, Geology of the Crazy Woman Creek area, .Johnson County, "W"yoming: U.S. Geol. Survey Bull. 102·7-B, p. 33-118.
. Jeletzl\:y, J. A., 1955, Belemnitella p1·aeourrso'l·, probably from the Niobrara of Kansas, and some stratigraphic implications: .Tour. Paleontology, v. 29, no. 5, p. 876-885.
Keefer, ,V. R., and Troyer, l\L L., 1956, Stratigraphy of the Upper Cretaceous and lower Tertiary rocks of the Shotgun
Butte area, Fremont County, 'Vyoming: U.S. Geol. Survey Oil and Gas Inv. Chart OC-56.
Reeside, J. B., Jr., 1927, The cephalopods of the Eagle Sandr stone and related formations in the 'Vestern Interior of the United States: U.S. Geol. Survey Prof. Paper 151, p. 1-87.
Richards, P. 'V., 1955, Geology of the Bighorn Canyon-Hardin area, Montana and 'Vyoming: U.S. Geol. Survey Bull. 1062, p. 1-93 .
Yenne, K. A., and Pipiringos, G. N., 1954, Stratigraphic sections of Cody Shale and younger Cretaceous and Paleocene rocks in the 'Vind River Basin, Fremont County, 'Vyoming: U.S. Geol. Survey Oil and Gas I1iv. Chart OC-49.
23. TRIASSIC FOSSILS FROM THE SOUTHERN KLAMATH MOUNTAINS, CALIFORNIA
By N. J. SrLBERLING and W. P. IRWIN, Menlo Park, Calif.
Fossils recently collected near the mutual boundary of Tehama, Trinity, and Shasta Counties in northwestern California confirm the Late Triassic age of some of the eugeosynclina1 rocks included by Irwin ( 1960, fig. 3, p. 20-26) in the "Western Paleozoic and Triassic Belt" of the Klamath Mountains. Heretofore, the presence of Triassic rocks in this belt was indicated by its continuance northward into exposures of the Applegate Group, which was assigned a Late(?) Triassic age by Wells, Hotz, and Cater(1949, p. 3, 4), and by several small, poorly preserved specimens of the Triassic ammonite A rcestes in one of several collections made by Diller ( 1903, p. 344-356) in the southern Klamath Mountains. The new collection of fossils described here provides a relatively precise age determination for one locality in this large structurally and stratigraphically complex belt, and it demonstrates that well-preserved biologically and stratigraphically useful faunas can be found in these rocks, which for the most p~rt have not yet received detailed study.
In May and October 1961, the writers attempted to relocate Diller's ammonite locality near White Rock, a prominent limestone outcrop on the divide between the drainages of the Sacramento and Trinity Rivers about 5 miles northwest of North Yolla Bolly Mountain. At the approximate location given by Diller a concentration of fossiliferous limestone float was found in an area underlain mostly by mafic volcanic rocks and thin-bedded radiolarian chert. Its localized occurrence near the crest of the drainage divide and its proximity to outcrops of limestone interstratified with
volcanic rocks and chert indicates that this :fossiliferous float was derived more or less in place fron1 a .. sma..ll limestone lens which may have been only several inches thick and a few feet long.
The fauna obtained from this locality (USGS Mesozoic locality M1140; see locality list at end of paper) is surprisingly diverse and well. preserved, although the cephalopods are mainly small immature specimens which cannot be identified positively as to species. Of foremost age significance are the ammonites, which include:
Olionitites cf. 0. angulo8U8 (Mojsisovics) Lecanites sp. Styrites cf. S. vermetus (Dittmar) J uvavites sp. Arcestes sp. Oladiscites cf. 0. pusillus (Mojsisovics) 11/egaphyllites cf.llf. jarbas (Munster) Placites cf. P. plaeoides (Mojsisovics) Mo.fsvarites cf. M. eugyrus (Mojsisovics)
Also present are shell fragments of the pelecypod H alobia with ribbing like that of H. arztstriaca Mojsisovics; pectenid, pteriid, nuculid, and other pelecypods; indeterminate gastropods; orthoconic nautiloids; rhynchonellid, spiriferid, terebratulid, and lingulid brachiopods; and crinoid columnals. The ammonites for the most part belong to long-ranging genera including some that first appear in the upper Middle Triassic and others that range through the Upper Triassic. The association of ammonite genera, however, is distinctive and unlike that .of any other known fauna from the
-· II
-..
I~
... I
ARTICLE 23 B-61
Triassic of N oith America. The genera and species of ammonites represented are n1ost like those of the middle 1\:a.rn in.n fauna. of the 1'nwhyce1Yt8 aonoides zone, described by ~iojsisovics (1893, p. 796-798; 1902, p. 336-337) from the I-Ia.llstatt region of Austria. The arrunonites :from near 'Vhite H.ock thus represent a sornewlmt older part of the J(arni~ul than the rich late 1\:a.rnia.n a.mmonite fauna, n1onographed by J. P. Smith (1927), fr01n the so-caJled I-Iosselkus Limestone about 60 miles to the northeast in the easternmost J\]amath ~fountains.
'1'he fauna, from the limestone float at. loca..lit.y M1140 :is markedly different from that of nearby larger masses of limestone, some of which have an outcrop area of several acres or more. These large limestone bodies, such as 'Vl1ite H.ock (USGS ~iesozoic localities ~11217 a.nd ~11218) and a conspicuous limestone about 5 1niles to the northwest on the divide between I-Iayfork and Prospect Creeks (USGS ~1esozoic locality ~11216), consist of massive pure somewhat recrystallized organic detrital limestone bounded on all sides by volcanic rocks. Hecognizaole fossils are scarce, though fragInentary scleractinian corals, hydrozoans, bryozoa, and calcareous a.lgae were found in both limestorie bodies. Some of these fossils are indicative of an early Mesozoi~" age, but they provide no basis for detailed age assignment.
LOCALITIES CITED
[Alllocnlltles In southem Klamath MountainH>, Calif .. ]
USGS MeRozoic loc. l\11.140. Near boundary between Trinity nnd Tehnma Counties about % mile west of "'hite Rock limestone. Float hlo<::ks of limestone found together on south side of ~aernmento Ynlley-Trinity RiYer drainage divide just downhill from low saddle on crest. Center of JjJ% sec. 1!), T. 28 N., H. 10 W., Dul.Jakelln l\ft. 15-min. quad. Collected. by N .. T. Silberling, D. h .)one:;, nnd W. P. Irwin,
:\lay lHGl. [Possibly the same as loc. 705 of Diller (1003, p. 3H).]
GSGS :\Iesozok loc. Ml2Hl. 'l'rinity County. Conspicuous limestone mass on north side near <::rest of ridge between Hayfork and Prospect Creeks. NEl4NEl4 sec. 4, ~r. 28 N., R. 11 W. Dubakella Mt. 1G-min. quad. Collected by N .. J. Silherling and W. P. Irwin, Odober J!.)(il. [Apvroximately the smne as locs. 703 and 706 of Diller (1903, 11· 346).]
USGS Mesozoic: loc. l\f1217. Near boundary between Trinity and 'l.'ehama Counties. Isolated limestone mass about ¥10
mile north of main 'Vhite Rock limestone outcrop area. On north side near erest of Sacramento Valley-Trinity River drainage divide. Center of ·w14 sec. 20, T. 28 N., R. 10 "\V. Dnhakella l\H. Hi-min, (JUHd. Colleded by N .. J. Silherling all(l W. P. Irwin, Odober 1001.
USGS Mesozoic loe. M1218. Near boundary between 'l'rinity and Tehama Counties. Northeast end of main 'Vhite Rock limestone outcro11 area. On south side near crest of Sacramento Valley-'l'rinity RiYer drainage divide. Center of W% sec. 20, '1'. 28 N., R. 10 W. Dubakella Mt. 15-min. quad. Colleeted by N .. J. Silberling and W. P. Irwin, October 19tll. [Approximately the snrne as loc. 704 of Diller ( 1!)03, v. 344) . ]
REFERENCES
Diller, .J. S., 1903, Klamath Moutain seetion. Am . .Jour. Sci., ser. 4, v. Hi, p. 342-3()2.
Irwin, ,V. P., 1060, Geologic reeonnaissance of the northern Coast Hanges and Klamath Mountains, California: California DiY. Mines Bull. 179, 80 p.
Mojsisovics, Ji}dmund von, 1803, Die Cephalor,oden der Hallstiitter Kalke: Ahh. geol. Reichsanst. Wien, Band 6, Hiilfte 2, 83G p., l)lS. 71-200.
---1902, Die Cephalopoden der Halstiitter Kalke. Suppl.Heft: Abh. Geol. Heiehsnnst. 'Vieu, Band 6, Hiilfte 1, p. 17f,_ 3G6, 23 pls.
Smith, .J. P., 11)27, lJp1•er 'l~rinsgie mnrine invertebrate faunas of North America; U.S. Geol. Survey l'rof. Paper 141, 262 p., 121 l)lS.
\Vell~, F. G., Hotz, P. K, and Cater, :E'. "r., .Jr., 1!)49, Preliminary description of the geology of the Kerby quadrangle, Oregon; Oregon Dept. Geology amll\fineral· Industries Bull. 40, 23 p.

B-62 GEOLOGICAL SURVEY RESEARCH 1 9 6 2
GEOPHYSICS
24. THERMAL REGIME IN THE RAISED DELTA OF CENTRUM S0, NORTHEAST GREENLAND
By DANIEL B. l(RINSLEY, vVashington, D.C.
Work done in COOJJet·ation with Air Force Camb·ddge Besr.arch Labm·atot·ies
Centrum Sy> (lake), lat soo 10' N. and long 22° vV., occupies a northeast-oriented glacial valley that has been cut 2,:300 feet below an extensive plateau. The lake is 12 miles long and 2.5 miles wide near its midpoint (fig. 24.1) ; the surface of the lake is :328 feet above sea level. The principal tribut:u·ies, Saefaxi Elv and Graeselven 1 (rivers), originate at the margin of the Greenland Ice Cap 25 miles ''"est and southwest of the lake. The outlet into Lower Saefaxi Elv, at the east end of the lake, is 20 miles from the sea at Hekla Sun d.
1 Provh;ional name.
The bedrock surrounding the western two-thirds of the la.ke is part of a thick series of banded clark limestones and lighter dolomitic beds of Ordovician and Silurian age (Centrum Limestone). The beds eli p gently eastward but are tightly folded locally. East of the Centrum Limestone along an approximately
· north strike, older dolomitic. rocks, most of which are of Precambrian age, have been thrust over the Silurian limestones (Frankl, E., 1954).
Glacial and glac.iolacustrine deposits of variable thickness mantle the lower slopes and the high plate~tu above the lake. Rec.essional moraines on the plateau are
~
~
0
PRINCIPAL BODIES OF WATER
GLACIERS AND ICECAPS
RECESSIONAL MORAINES AND RELATED MARGINAL CHANNELS
5 10 15 MILES
00'
FIGURE 24.1.-Map of the Centrum S~ area.
'j
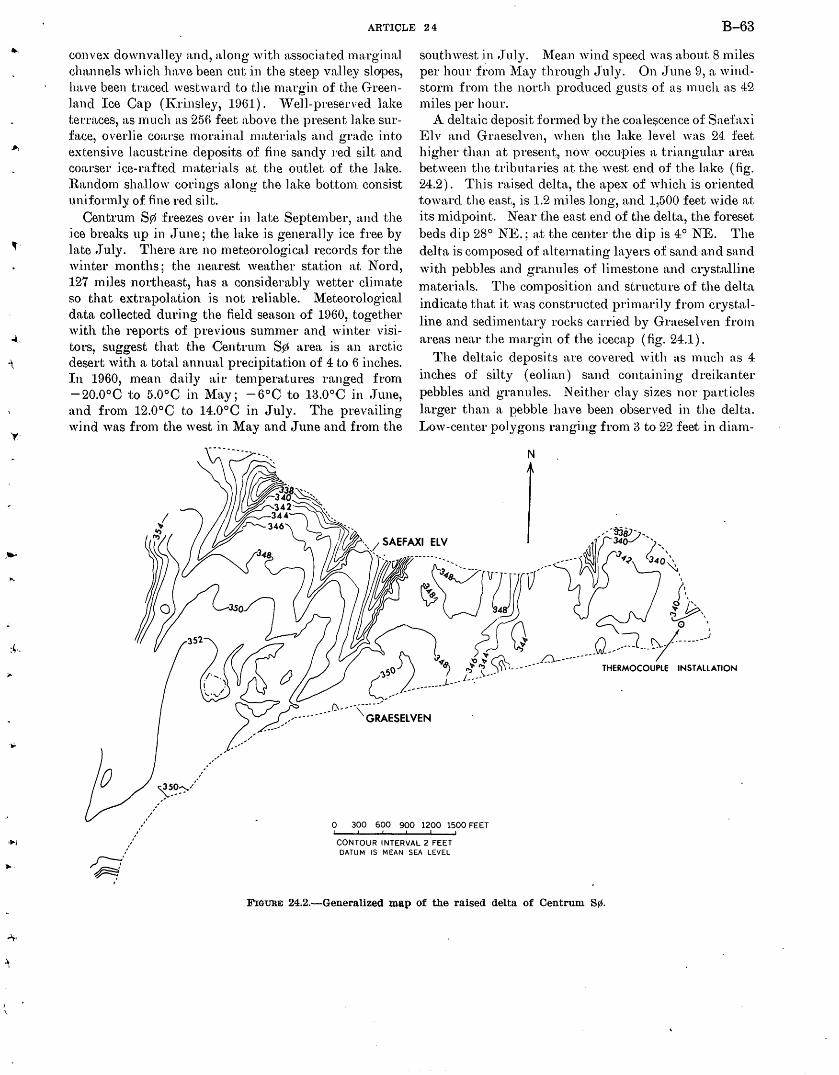
:4·.
i~l
.....
J
\
ARTICLE 24 B-63
convex downvaJley and, along with associated marginal cha.nnels which have been cut in the steep valley slQipes, have been traced westward to the margin of the Greenla.nd Ice Cap (I\.rinsley, 19()1). V\Tell-preserved lake tel.'races, as much us 256 feet above the present lake surface, overlie coarse morainal materials and grade into extensive lacustrine deposits of fine sandy red silt a.nd coai.'Ser ice-rafted materials at the outlet. of the .lake. Random shallow corings along the lake bottom. consist uniformly of fine red silt.
Centrum 80 freezes over in late September, and the ice breaks up in ,June; the lake is generally ice free by late .July. There are no meteorological records for the winter months; the nearest weather station at Nord, 127 miles northeast, has a considerably wetter climate so that extrapohttion is not reliable. Meteorological data collected during the field season of 1960, together with the reports of previous summer and winter visitors, suggest tha;t the ·Centrum 80 area is an arctic desert with a total annual precipitation of 4 to 6 inches. In 1960, mean daily air temperatures ranged from -20.0°C to 5.0°C in ~fay; -6°C to 13.0°C in June, and from 12.0°C to 14.0°C in July. The prevailing wind was from the west in May and June and from the
/:····'
southwest in .July. ~{ean wind speed was about 8 miles per hour fi·om ~{ay through J·uly. On .June 9, a windstorm from the north produced gusts of as much as 42 miles per hour.
A deltaic deposit formed by the coalescence of Snefaxi Elv and Graeselven, when the lake level was 24 feet higher tha.n at present., now occupies a triangular area between the tributaries at the west end of the lake (fig. 24.2). This raised delta, the a,pex of which is oriented toward the east, is 1.2 miles long, m1d 1,500 feet wide at its midpoint. Nea,r the east end of the delta, the foreset beds dip 28° NE.; at the center the dip is 4° NE. The delta is composed of alternating layers of sand and sand with pebbles and granules of limestone and crystalline materials. l'he composition and structure of the delta indicate that it was constructed primarily from crystalline and sedimentary rocks carried by Graeselven from areas near the margin of the icecap (fig. 24.1).
The deltaic deposits are covered with as much as 4 inches of silty (eolian) sand containing dreikanter pebbles and granules. Neither clay sizes nor particles larger than a pebble have been observed in the delta. Low-center polygons ranging from 3 to 22 fee;t in diam-
,.///;.~~:·/ 0 300 600 900 1200 1500 FEET
CONTOUR INTERVAL 2 FEET
~.' r-:
DATUM IS MEAN SEA LEVEL
FIGURE 24.2.-Generalized map of the raised delta of Centrum S~.
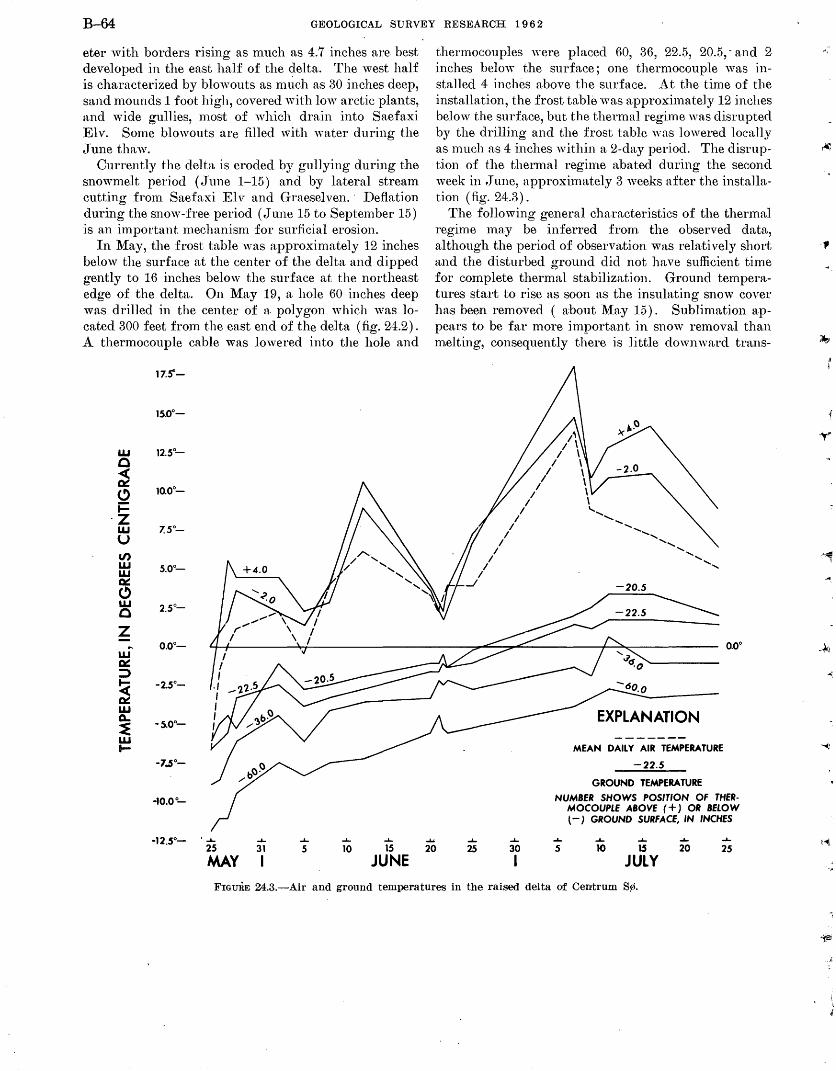
B-64 GEOLOGICAL SURVEY RESEARCH 1 9 6 2
eter with borders rising as much as 4.7 inches are best developed in the east half of the delta. The west half is characterized by blowouts as nuich as ao inches deep, sand mounds 1 foot high, covered with low arctic plants, and wide gullies, most of which drain into Saefaxi Elv. Some blowouts are filled with water during the tTune thaw.
Currently the delta is eroded by gullying during the snowmelt period (,June 1-15) and by lateral stream cutting from Saefaxi Elv and Graeselven. · Deflation during the snow-free period (,June 15 to September 15) is an important mechanism for surficial erosion.
In May, the frost table was approximately 12 inches below the surface at the center of the delta and dipped gently to 16 inches below the surface at the northeast edge of the delta. On May 19, a hole 60 inches deep was dril1ed in the center of a. polygon which was located 300 feet frmn the east end of the delta (fig. 24.2). A thermocouple cable was lowered into the hole and
17.SC-
15.0°-
w 12.5°-c ~
10.0°-C> ~
·Z w 7.50-u en w 5.0°-w ~ C) w 2.5°-c z .. 0.0°-w ~ :;:)
~ -2.50-
w 0.. -s.oo-~ w .....
-7~0-
·10.0°-
·~ ~ ~
thermocouples were placed 60, 36, 22.5, 20.5,- and 2 inches below the surface; one thermocouple was installed 4 inches above the surface. At the time of the installation, the frost table was approximately 12 inches below the surface, but the thermal regime was disrupted by the drilling and the frost table was lowered locally as much as 4 inches within a 2-day period. The disruption of the thermal regime abated during the second week in .June, approximately 3 weeks after the installation (fig. 24.3).
The following general chara.cteristics of the thermal regime may be inferred from the observed data., although the period of observa.tion wa.s relatively short and the disturbed ground did not have sufficient time for complete thermal stabilization. Ground tempera.tures start to rise as soon as the insulating snow cover has been removed ( about ~{a,y 15). Sublimation appears to be fa.r more important in snow removal than m.elting, consequently there is little downward tra.ns-
"""' ~ ~
EXPLANATION
MEAN DAILY AIR TEMPERATURE
-22.5
GROUND TEMPERATURE NUMBER SHOWS POSITION OF THER
MOCOUPLE ABOVE ( +) OR BELOW l-) GROUND SURFACE, IN INCHES
~ ~ ~ ~ ~ -12.5°-25 31 5 10 15 20 25 30 5 10 15 20 25 MAY I JUNE I JULY
FIGURE 24.3.-Air and ground temperatures in the raised delta of Centrum Sri.
-~ l
··,
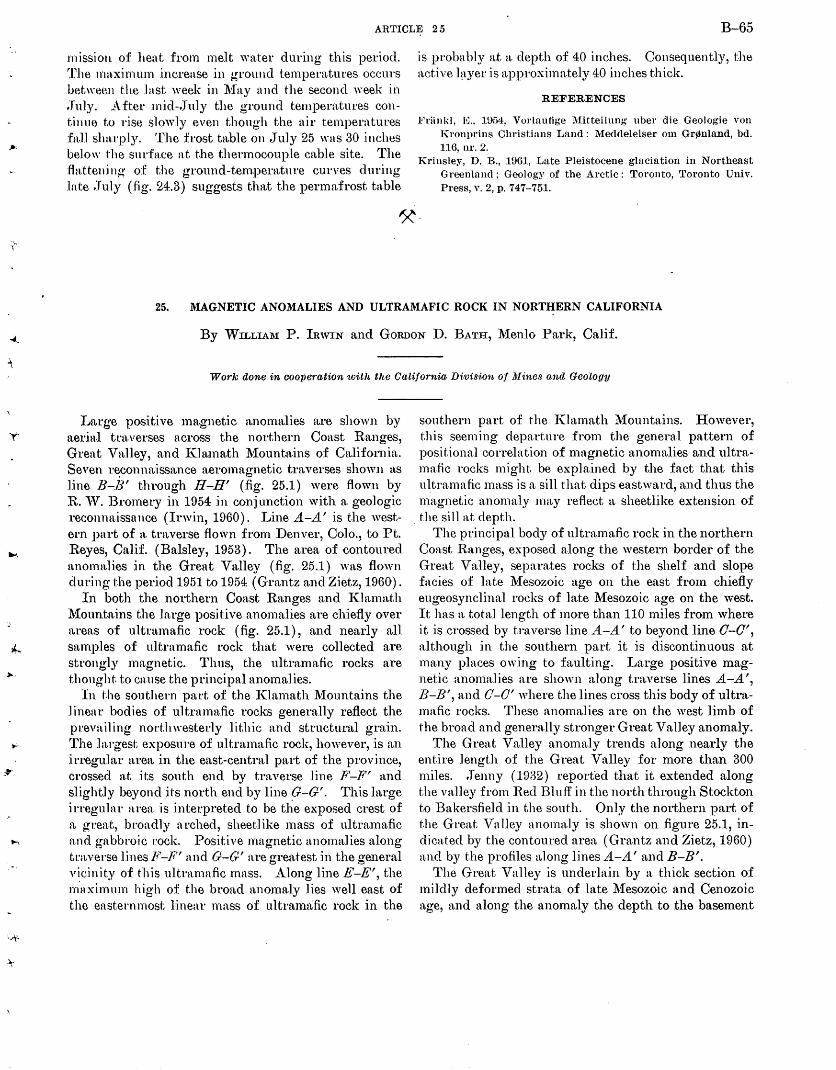
-(
ARTICLE 25 B-65
mission of heat :from melt water during this period. The rnnxirnum .increase in ground temperatures occurs between the last week in l\fay and the second week in .Tuly. After rn.id-,July the ground temperatures continue to rise slowly even though the air temperatures :fa.ll sha.rp.ly. The frost ta.ble on July 25 wus 30 inches below the surface at the thermocouple cable site. The fla.tten.i ng· o:f the ground-tem.pera.tnre curves during late .Tuly (fig. 24.3) suggests tha.t the permafrost table
is probably a.t a. depth of 40 inches. Consequently, the active l~tyer is approximately 40 inches thick.
REFERENCES
Fdinkl, K, 1!>f4, Vorlnufige Mitteilung uber die. Geologie von Kronprins Christians Land : Meddelelser om Grjllnland, bd. 116, ur. 2.
Krinsley, D. B., 1961, Late Pleistocene glaciation in Northeast Greenhmd; Geology of the Arctic: Toronto, Toronto Univ. Press, v. 2, p. 747-751.
~·
25. MAGNETIC ANOMALIES AND ULTRAMAFIC ROCK IN NORTHERN CALIFORNIA
By WILLIAl\f P. InwiN and GoRDON D. BATH, Menlo Park, Calif.
Work done in cooperation with the California Di.vision of Mines and Geology
Large positive ma.gnetic anomalies are shown by aerial traverses across the northern Coast Ranges, Great Valley, and I\Ja.math Mounta.ins of California. Seven r~connaissa.nce aeromagnetic traverses shown as line 13-13' through Ji-ll' (fig. 25.1) were flown by R. '"· Bromery in 1954 in conjunction with a geologic reeonnaissance (Irwin, 1960). Line A-A' is the western pnrt of a traverse flown from Denver, Colo., to Pt. Reyes, Cali:f. (Balsley, 1953). The area of contoured anomalies in the Great Valley (fig. 25.1) was flown dur.ing the period 1951 to 1954 (Grantz and Zietz, 1960).
In both the northern Coast Ranges and J(la.math l\1ountn.ins the large positive anomalies are chiefly over ~treas of ultramafic rock (fig. 25.1), and nearly all samples of ultramafic rock that were collected are strongly magnetic. Thus, the ultramafic rocks are thought to cause the principal anomalies.
In t-.he southern part of the I\Jamath l\1ountains the linear bodies of ultrama.fic rocks generally reflect the prev:tiling northwesterly lithic and structural grain. The la.J'gest exposure of ultramafic rock, however, is an irregular area in the east-centra.l part of the province, crossed n.t its south end by traverse line F'-F' and slightly beyond :it-s north end by line G-G'. This large itTegu'lnr area is interpreted to be tl~e exposed crest of ~t great, broadly arched, sheetlike mass of ultramafic n.nd gabbroic rock. Positive magnetic anomalies along traverse lines F'-F' and G-G' :u·e greatest in the general vicinity o:f this ultramafic nmss. Along line E-E', the m'uximurn high of the broad anomaly lies well east of the ensternrnost linear mass of ultrama·fic rock in the
southern part of the Klamath ~1ountains. However, this seeming departure from the general pattern of positional correlation of magnetic anomalies and ultramafic rocks might be explained by the fact that this ultramafic mass is a sill that clips eastward, and thus the magnetic anomaly ma.y reflect a sheetlike extension of the sill at depth.
The principal body of ultramafic rock in the northern Coast Ranges, exposed along the westen1 border of the Great Valley, separates rocks of the shelf and slope facies of late Mesozoic age on the east from chiefly eugeosynclinal rocks of late Mesozoic age on the west. It has a total length of more than 110 1niles from where it is crossed by traverse line A-A' to beyond line 0-0', although in the southern part it is discontinuous at many places owing to faulting. Large positive magnetic anomalies are shown along traverse lines A-A', 13-B', and 0-0' where the lines cross this body of ultramafic rocks. These anomalies are on the west limb of the broad and generally stronger Great Valley anomaly.
The Great Valley anomaly trends along nearly the entire length of the Great Valley for more than 300 miles. Jenny (1932) reported that it extended along the valley from Red Bluff in the north through Stockton to Bakersfield in the south. Only the northern part of the Great Va1ley anomaly is shown on figure 25.1, indicated by the contoured are~t (Grantz and Zietz, 1960) and by the profiles along lines A-A' and B-B'.
The Great Valley is underlain by a thick section of mildly deformed strata of late l\1esozoic and Cenozoic age, and along the anomaly the depth to .the basement
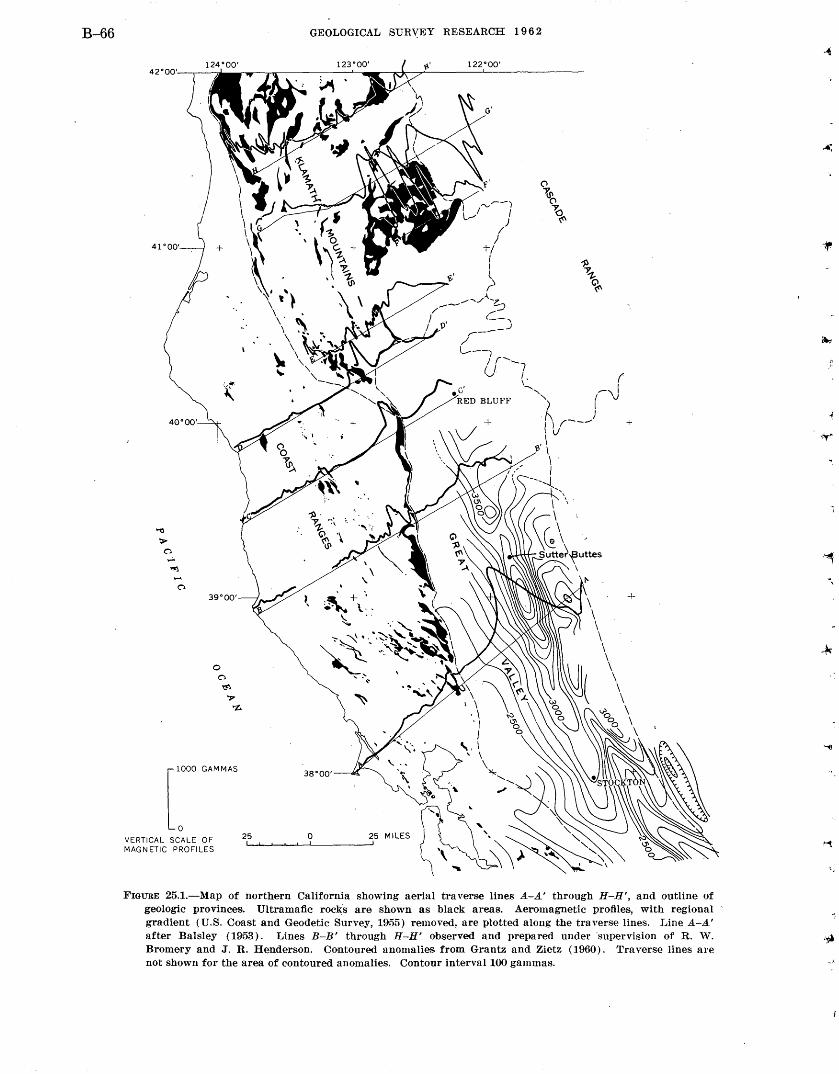
B-66
40"00'
[00 GAMMAS
VERTICAL SCALE OF MAGNETIC PROFILES
25
GEOLOGICAL SUR~EY RESEARCH 1 9 6 2
122"00'
0 25 MILES
\ \ \ \ \ \ \
+
+
\ \ \ \ \
FIGURE 25.1.-Map of northern California showing aerial traverse lines A-A' through H-H', and outline of geologic provinces. Ultramafic rock·s are shown as black areas. Aeromagnetic profiles, with regional gradient (U.S. Coast and Geodetic Survey, 1955) removed, are plotted along the traverse lines. Line A-A' after Balsley (1953). Lines B-B' through H-H' observed and prepared under ·supervision of R. ,V. Bromery and J. R. Henderson. Contoured anomalies from Grantz and Zietz (1960). Traverse lines are not shown for the area of contoured anomalies. Contour interval 100 gammas.
~)
·~·
+
ARTICLE 26 B-67
complex has been established by drilling to range frorn approximate:Iy 1 to 3 1niles: Little is known regarding th.e kind of basement rock cored by drilling. Data a.vailable for 10 holes drilled along or near the crest of the anomaly, chiefly near Sutter Buttes, show the cored bn,sement rock to be chiefly intrusive rocks of interrnediate composition; 1 core was gabbro, and 1 about 50 miles south of Sutter Buttes was ultramafic.
Ultramafic rock buried at considerable depth along the lengt-h of the valley ma,y be the ca,use of the Great Valley anomaly. This relation is suggested chiefly by t·.he fact that the large anomalies are principally over a.reas oJ ultramaJic rock where the causative rocks are exposed. According to Grttntz and Zietz ( 1960),
the rod:s producing the Great Valley anomaly at•e buried nhont: !) to 10 miles. but sharper, superimpo~;ed anomalies yield clepths that approximate the base of the Mesozoic and Tertiary sedimentnry rodu::. Becnuse they are magnetic and very large, the rock n1nsses which produee the broad magnetic highs are thought to be igneous.
The ultramnJic rock, assuming that to be the cttuse of the Great Valley anomaly, must lie chiefly below a considerable thickness of basen1ent rock in addition to the late Mesozoic n.nd Cenozoic strata, judging from the
difference between the known depth to basement and the depth to the anomaly-producing rock estimated by Grantz and Zietz (1960). J..JOcally, however, the ultramafic rock is part of the basement complex ~1t or near the interface of the basement and overlying strata., as shown by at least one well core, and thus might also account for the sharp local anomalies superimposed on the broad Great Valley anmnaly.
REFERENCES
Balsley, J. R., 1953, Total-intensity aeromagnetic profile from Denver, Colo. to Point Reyes, Calif.: U.S. Geol. Survey open-file report.
Grantz, Arthur, and Zietz, Isidore, 19HO, Possible significance of broad magnetic highs over belts of moderately deformed sedim~ntary rocks in Alaska and California: Art. 158 in U.S. Geol. Survey Prof. PaJ)er 400-B, p. B342-B347.
Irwin, 'V. P., 1960, Geologic reconnaissance of the northern Coast Ranges and Klamath Mountains, California: California Div. Mines Bull. 179, 80 p.
.Jenny, ,V, P., 1932, Magnetic vector study of regional and local geologic structure in principal oil states: Am. Assoc. Petroleum Geologists Bull., v. 16, p. 1171-1203.
U.S. Coast and Geodetic Survey, 1955, Total intensity chart of the United States: U.S. Coast and Geod. Survey, chart no. 3077.
MINERALOGY, GEOCHEMISTRY, AND PETROLOGY
26. VANADIUM-RICH GARNET FROM LAGUNA, NEW MEXICO
By RoBERT H. MoENCH, Denver, Colo.
Wm·k (lone on behalf of the U.S. AtoHI-ic En.wgy 001nm,ission
Vanadium-rich garnet has been identified as a constituent of it metamorphosed uranium-vanadium deposit in the Laguna mining district, about 15 miles west of Albuquerque, N. :Mex. The garnet occurs in one of several small deposits :in the Sandy uran:imn mine, about 4 miles southeast of the village of Laguna.
The presence of vanadium in ga.rnet was previously reported by Doelter ( 1916), who classed V20 3 as a rare component of calcium garnet and reported 0.09 and 0.24 perc~nt V20a in 2 chemical analyses. According to his f.ormuln, (CaaV2Si:~Ot2) trivalent vanadium substitutes for aluminum and trivalent iron in the. calcium garnet series. ~1ore recently, Ba.dalov (1951) described a van-
adium-rich grossularite that contains 4.52 percent V20 3 ,
the highest va.nadium content reported in garnet to date. This garnet is associated with vanadium-bearing tourmaline in the contact zone between quartz veins and vanadiferous graphitic hornfels.
This paper presents preliminary data that establish the existence of the vanadimn-rich garnet (an unnamed new mineral) and describes its occurrence and geologic significance. The garnet is fine grained and can be separated iii pure fol'ln only with great difficulty. Spectrographic analyses reported here were made by Nancy M:. Conklin, of the U.S. Geological Survey, on a small quantity of the purified mineral. Complete chemical
B-68 GEOLOGICAL SURVEY RESEARCH 1 9 6 2
and mineralogic data will be presented at a later date after a quantity sufficient for complete chemical analysis has been separated.
The Laguna district forms the east end of the southern San Juan Basin mineral belt (Hilpert and Moench, 1960), one of the world's most productive uranilim regions. The largest uranium-vanadium deposits in the belt are in sandstones of the Morrison Formation, many smaller deposits are in the Todilto Limestone, and a few small deposits are in the Entrada Sandstone, all of Jurassic age. The sedimentary strata and some of the uranium-vanadium deposits of the district are cut by diabase sills and dikes, which metamorphosed the rocks and ore deposits for distances of a few feet from the contacts. The vanadium-rich garnet described here is
·one of the products of this metamorphism. The Sandy mine is in an area where small uranium
vanadium deposits are found in the Todilto Limestone and Entrada Sandstone (Hilpert and Moench, 1960, p. 457-460). These deposits, the largest of which has yielded about 3,000 tons of uranium ore, contain about equal amounts of uranium and vanadium. 'Vhere unoxidized, the uranium is largely in coffinite and uraninite, and the vanadium is largely in vanadium clay, which is composed of interstratified mica (probably roscoelite) and montmorillonite mixed with some chlorite (identifications by John C. Hathaway, U.S. Geological Survey). Quantitative and semiquantitative spectrographic analyses show that the vanadium clay contains 7 or 8 percent vanadium. The clay is interstitial to sand grains of the Entrada Sandstone and em bays the calcite cement; it occurs also in thin laminae in the Todilto Limestone and along boundaries between the calcite grains. It is concentrated along small folds that formed while the limestone was being deposited.
The sedimentary strata at the mine are nearly horizontal and have been intruded by many vertical diabase dikes, most less than 5 feet wide, and by sills that range from 1 to 75 feet in thickness. Metamorphic effects are conspicuous for several feet above and below sills more than about 15 feet thick. The metamorphic envelopes are best developed in the calcareous parts of the Entrada Sandstone and the Todilto Limestone and are marked by the presence of garnet, idocrase, diopside, biotite, plagioclase, epidote, and wollastonite.
Garnet is the most widespread and abundant metamorphic mineral. Two types of garnet have been distinguished-andradite-grossul a rite and vanadium-rich garnet. The andradite-grossularite forms pale-green to reddish-brown dodecahedral crystals, occurs as granular aggregates in barren sandstone and limestone, and encrusts joints in barren sandstone and in ore. The garnet on joints does not contain much vanadium and
gives X-ray powder patterns similar to standard andradite-grossularite patterns (l\iary E. 1\{rose, written communication, 1959).
Vanadium-rich garnet was discovered in the prospect pit in a small uranium-vanadium deposit (fig. 26.1) on the contact between the Entrada Sandstone and the Todilto Limestone. The deposit is separated by 2 or 3 feet of limestone from an overlying sill. The sill, largerly eroded in the vicinity of the prospect pit., was originally about 20 feet thick; garnet is present in a zone at least 5 feet thick below the base of the sill. In the pit, barren light-tan sandstone is sharply mottled and banded with uranium- and vanadium-bearing darkgray to black sandstone. The dark color is caused by vanadium clay.
In thin sections of banded ore, garnet embedded in vanadium clay is distinctly darker than that in barren sandstone. This relationship was observed within the space of a single thin section. Preliminary tests made on a small separate ( 10 milligrams) of the darker garnet indicated a vanadium content of 21 percent (see table, sample G-2a). On the theory that this high vanadium content might be caused by impurities, a second and larger sample (25 milligrams) was separated and proved to contain 14 percent vanadium (table, sample G-2b). Though colored deep greenish brown
Quantitative and semiquantitative spectrographic analyses of vanadium-rich garnet
[M, major constituent. Nancy M. Conklin, analyst]
Laboratory Field v AI Fe Mg Ca Ti Mn Ba Cr Cu serial No. No.
-------- - ----------256540 _______ G-2a I 21 7. I 4. 2 0.15 M 0.3 o. 3 0 0.003 0 289952 _______ G-2b I 14 7. 7. .3 M .15 .3 .007 .03 .007
1 Quantitative spectrographic determinations; all others are semiquantitative.
to brownish green, the analyzed material was clear, free from inclusions, and contained no visible impurities. It yielded an X-ray powder pattern (9-hour exposure) that shows only garnet lines similar in spacing and intensity to an andradite standard.
The high calcium content. of both samples indicates that the garnet is a member of the calcium-rich series. In this garnet, vanadium, iron, and aluminum probably proxy for one another according to the formula Ca3 (V,Fe,Al) 2 Si3012·
As the garnet formed in a uranium-vanadium deposit, one might expect it to contain uranium as well as vanadium, but. none was detected. The detection limit of uranium by spectrographic analysis is about 0.05 percent, but as a dilution technique was used, a uranium content of somewhat more than 0.1 percent might have escaped detection.
..
·~
+
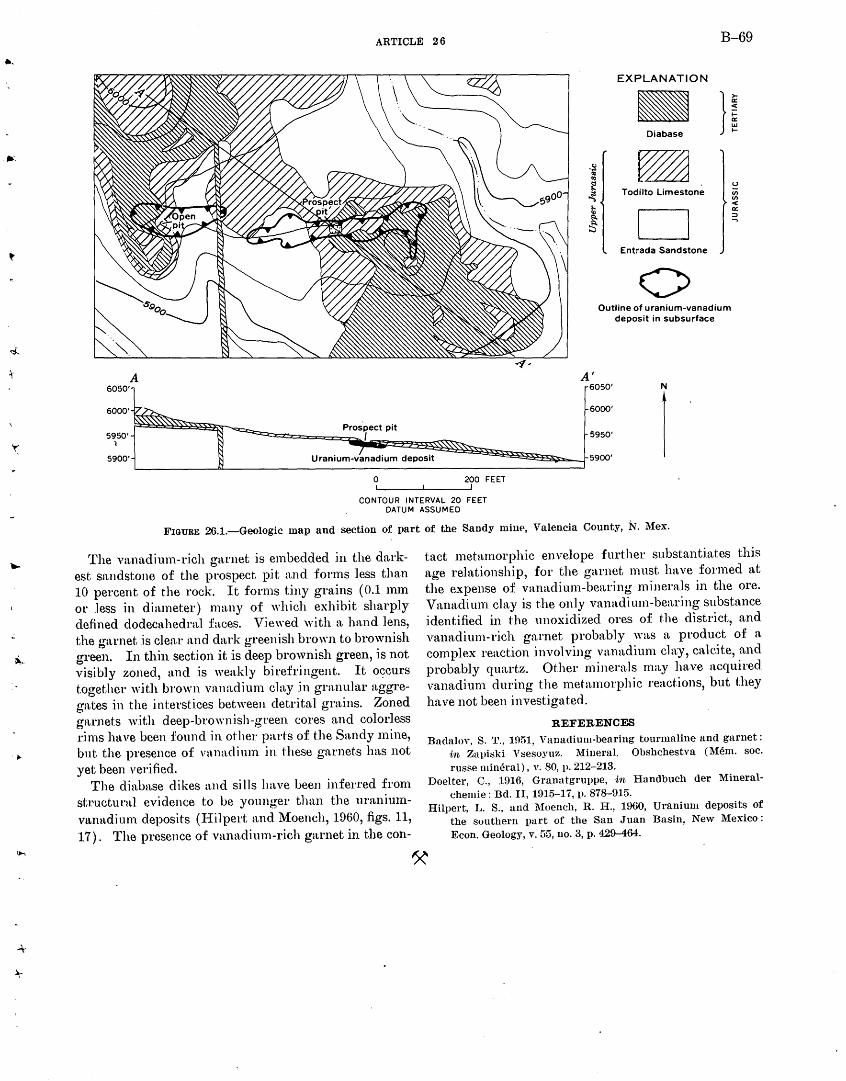
... ARTICLE 26 B-69
A 6050'
EXPLANATION
Diabase H Todilto Limestone
D Ent:-ada Sandstone
0 Outline of uranium·vanadium
deposit in subsurface
A' 6050'
6000'
N
u Cll Cll c(
0:: ::I ....,
5950' l
5900'
Pros.pect pit -
~~~~~::::~~~~~~::~~-~~~~~~~~~__j 5950' Uranium·v,nadium deposit 5900'
~--------~------------------------------------------~~ 0 200 FEET
CONTOUR INTERVAL 20 FEET DATUM ASSUMED
FIGURE 26.1.-Geologic map and section of part of the Sandy milw, Valencia County, N. Mex.
The vanadium-rich garnet is embedded in the darkest:. sandstone of the prospect pit and forms less than 10 percent of the rock. It forms tiny grains ( 0.1 mm or .less in diarneter) many of which exhibit sharply defined dodecahedral faces. Viewed with a hand .lens, the garnet .is clen.r and dark greenish brown to brownish green. In thin section it is deep brownish green, is not visibly zoned, and is weakly birefringent. It 09curs together with brown vanadium cln.y in granular aggregates in the .interstices between detrital grains. Zoned garnets with deep-brownish-green cores and colorless rims have been found in other parts of the Sandy mine, bnt the presence of vanadium in these garnets has not yet been verified.
The diabase dikes and sills have been inferred from stJ.'uctural evidence to be younger than the uraniumvanu.dium deposits (llilpert and Moench, 1960, figs. 11, 17). The presence of vanadium-rich garnet in the con-
tact metamorphic en vel ope further substantiates this age relationship, for the garnet must have formed at the expense of vanadium-bearing minerals in the ore. Vanadium clay is the only vanadium-bearing substance identified in the unoxidized ores of t.he district, and vanadium-rich garnet probably was a pt·oduct of a complex reaction involving vanadium clay, caleite, a.nd probably quartz. Other minerals may have acquired vanadium during the metamorphic reactions, but they have not been investigated.
REFERENCES
Bndalov, S. T., 1!151, Vanadium·bearing tourmaline and garnet: in Zaph;ki V sesoyuz. l\fineral. Obshchestva ( Mem. soc. russe mineral), v. 80, p. 212-213.
Doelter, C., 1916, Granatgruppe, i·n Handbuch der 1\fineralchemie: Bd. II, 1915-17, p. 878-915.
Hilpert, L. S., and Moench, R. H., 1960, Uranium deposits of the southern part of the San Juan Basin, New Mexico: Econ. Geology, v. G5, no. 3, p. 429-464.
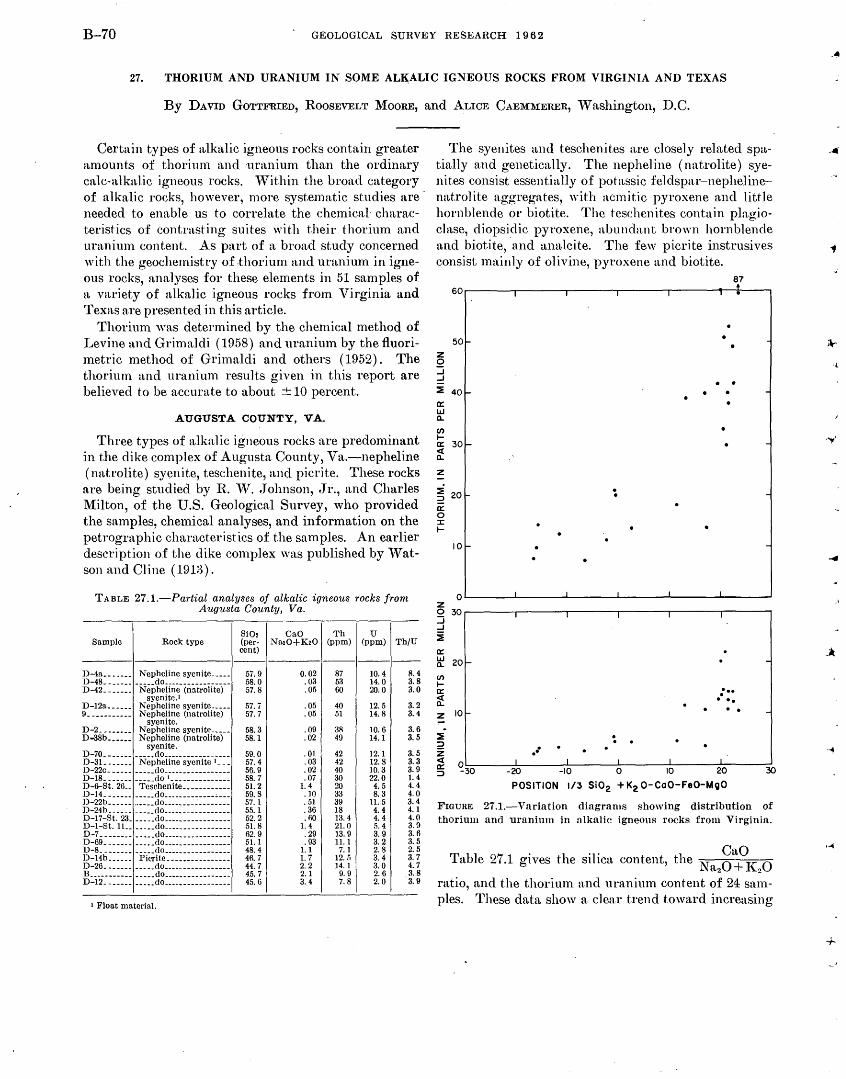
B-70 GEOLOGICAL SURVEY RESEARCH 1 9 6 2
27. THORIUM AND URANIUM IN SOME ALKALIC IGNEOUS ROCKS FROM VIRGINIA AND TEXAS
By DAVID GOTTFRIED, RoosEVELT MooRE, and ALICE CAEMMERER, 'Vashington, D.C.
Certain types of aJkalic igneous rocks contain greater amounts of thorium and uranium than the ordinary calc-alkalic igneous rocks. 'Vithin the broad category of alkalic rocks, however, more systematic studies are· needed to enable us to correlate the chemical characteristics of contrasting suites with their thorium and uranium content. As part of a broad study concerned with the geochemistry of thorium and uranium in igneous rocks, analyses for these elements in 51 samples of a variety of alkalic igneous rocks from Virginia and Texas are presented in this article.
Thorium was determined by the chemical method of Levine and Grimaldi (1958) and uranium by the fluorimetric method of Grimaldi and others (1952). The thorium and uranium results given in this report are believed to be accurate to about ± 10 percent.
AUGUSTA COUNTY, VA.
Three types of alkalic igneous rocks are predominant in the dike complex of Augusta County, Va.-nepheline ( natrolite) syenite, teschenite, and picrite. These rocks are being studied by R. vV. ,Johnson, Jr., and Charles Milton, of the U.S. Geological Survey, who provided the samples, chemical analyses, and information on the petrographic characteristics of the samples. An earlier deseription of the dike complex was published by Watson and Cline ( 1913).
TABLE 27.1.-Partial analyses of alkalic igneous rocks from Augusta County, Va.
Si02 CaO Th u Sample Rock type (per- Na20+K20 (ppm) (ppm) Th/U
cent) ----
D-4a _______ Nepheline syenite _____ 57.9 0.02 87 10.4 8. 4 D-48 •. _____ _____ do _________________
58.0 .03 53 14.0 3. 8 D-42 ...•••. Nepheline (natrolite) 57.8 .Ofi 60 20.0 3.0
syenite .I D-12a. _____ Nepheline syenite. ____ 57.7 .05 40 12.5 3. 2 g_ ---------- Nepheline (natrolite) 57.7 .05 51 14.8 3. 4
syenite. D-2.- ------ Nepheline syenite _____ 58.3 .09 38 10.6 3. 6 D-38b •••••• Nepheline (natrolite) 58.1 .02 49 14.1 3. 5
D-70. ------syenite.
____ .do _________ -------- 59.0 .01 42 12.1 3. 5 D-3L ------ Nepheline syenite 1 ___ 57.4 .03 42 12.8 3.3 D-22c. ----- _____ do ________ --------- 56.9 .02 40 10.3 3. 9 D-18. ------ _____ do~--------------- 58.7 .07 30 22.0 1.4 D-6-St. 26__ Teschenite •• ____ ------ 51.2 1.4 20 4. 5 4. 4. D-14.- ----- ___ .• do _____ --------"--- 59.8 .10 33 8. 3 4.0 D-22b. _____ ...... do ....• ---~-------- 57. 1 . 51 39 11.5 3.4 D-24b. _____ _____ do ....• ---------- __ 55. 1 . 36 18 4. 4 4.1 D-17-St. 23. _____ do ....• -----------_ 52.2 .fiO 13. 4 4. 4 4.0 D-1-St. IL ___ •. do _________ -------- 51.8 1.4 21.0 5. 4 3. 9 D·-7 ________ _____ do _____ ------------ 62.9 . 29 13.9 3. 9 3. 6 D-69 •.•.... _____ do ____________ ----- 51.1 . 93 11.1 3.2 3. 5 D-8. ------- ____ .do _________________ 48.4 1.1 7. 1 2.8 2. 5 D-14b. _____ Picrite. _______ ------- _ 46.7 1.7 12. 5 3. 4 3. 7 D-26. ------ _____ do _____ -----------_ 44.7 2. 2 14.1 3. 0 4. 7 n ___________ ___ •• do _____ • ___________ 45.7 2.1 9. 9 2. 6 3. 8 D-12. ------ _____ do _____ ------- _____ 45.6 3. 4 7. 8 2.0 3. 9
1 Float material.
The syenites and teschenit.es a .. re closely related sp~ttially and genetically. The nepheline ( natrolite) syenites consist essentially of potassic felclspar-nephelinenat.rolit.e aggregates, with acmitic pyroxene and little hornblende or biotite. The tesehenites contain pla.g:ioclase, diopsidic pyroxene, almndant brown hornblende and biotite, ·and analcite. The few picrite instrusives consist mainly of olivine, pyroxene and biotite.
87 60r------T,-------.-,-----.,-------.-,----~~.~~~--.
z Q ..J ..J
50-
~ 40r a: w 0..
(/) 1-a: 30 r<( 0..
z
10-
. .
. . -
-
-
-
o~----~~-------~~----~~~----~~-------~~----~ z 3 30~-----,,-------.-~------~r------.l-------.-,----~ ..J
~ a: ~ 20f-(/')
1-a: it z 10-
. .. . . :·· ... . .
I I I I L -20 -10 0 10 20
POSITION t/3 Si02 + K2 0-CoO-FeO-MQO
-
-
30
FIGURE 27.1.-Variation diagrams showing distribution of thorium and uranium in alkalic igneous rocks from Virginln.
T bl 1 . . CaO
a e 27.1 gtves t. 1e s1hca content, the Naz0+J{20
ratio, and the thorium and uranium content of 24 samples. These data. show a clear trend toward increasing
-•
+
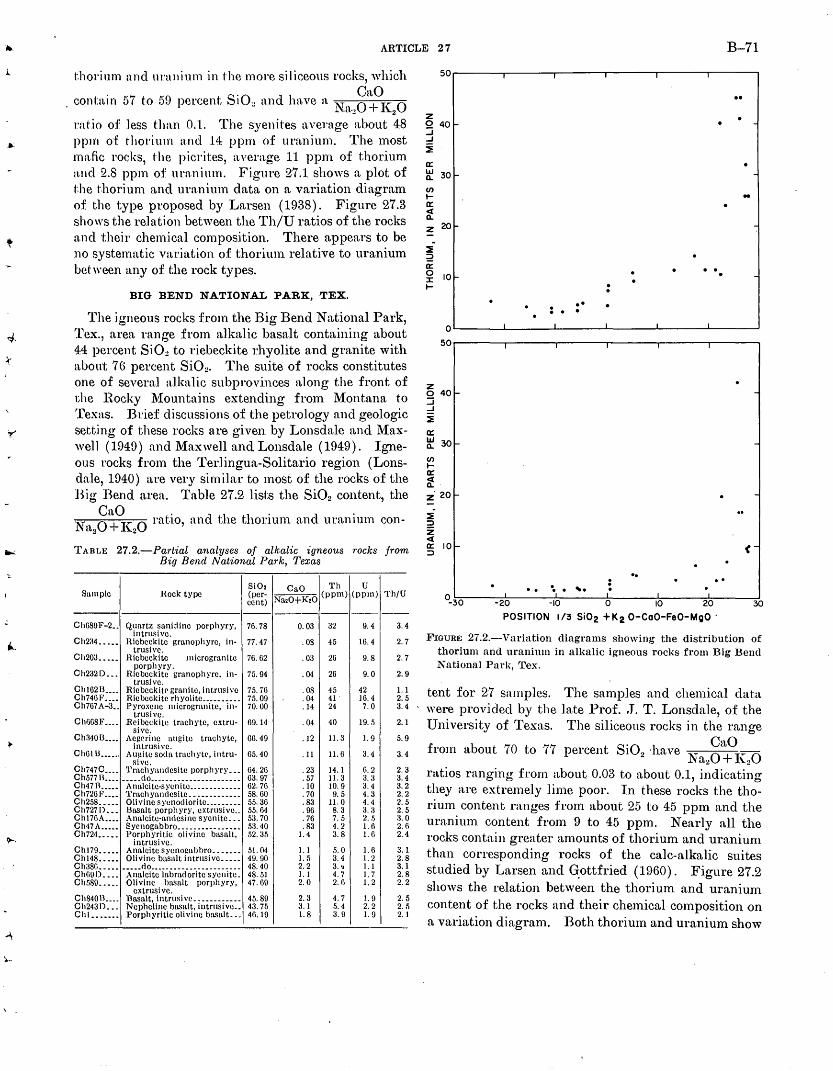
~-
~--
\ .
ARTICLE 27 B-71
thorium and uranium in t-he more siliceous rocks, which
. 7 s·o d l CaO con tam 5 to 59 percent 1 2 an mve a N· 0 + J( 0 . a.z 2
rat-io of less than 0.1. The syenites average about 48 ppm of t-horium and 14 ppm of uranium. The most maJic rocks, t-he picrites, average 11 ppm of thorium and 2.8 ppm of uranium. Figure 27.1 shows a plot of the thorium and uranium data on a variation diagram of the type proposed by Larsen (1938). Figure 27.3 shows the relation between the Th/U ratios of the rocks and their chemical composition. There appears to be no systematic variation of thorium relative to uranium bet" ween any of the rock types.
BIG BEND NATIONAL PARK, TEX.
The igneous rocks from the Big Bend National Park, Tex., area range from alkalic basalt containing about 44 percent Si02 to riebeckite rhyolite and granite with about 7() percent Si02• The suite of rocks constitutes one of several alkalic subprovinces along the front of t;he Hocky ~1ountains extending from ~1ontana to l'exas. Brief discussions of the petrology and geologic set;t;ing of these rocks are given by Lonsda.le and ~1axwell ( 1949) and Maxwell and Lonsdale ( 1949). Igneous rocks from the Terlingua-Solitario region (Lonsdale, 1940) are very similar to most of the rocks of the Big Bend area. Table 27.2 lists the Si02 content, the
CaO . l l 1 . d . N· O + l( 0 rat10, anc t:. 1e t wrmm an uran1um con-r <12 . 2
TABLE 27.2.-Partial analyses of alkalic igneous rocks from Big Bend National Park, Texas
Si02 CaO Th u Sample H.ock type (per-
Na20+K20 (ppm) (ppm) Th/U
cent) ----------
Ch689F-2 •. Qtmrtz sani:line intrusive.
porphyry, 76.78 0.03 32 9. 4 3.4
Ch2:i4 •.••• Hicbeckitc granophyrc, in- 77.47 . OS 45 16.4 2. 7 trusive.
Ch203 ••••• H.icbcckitc microgmnitc 76.62 . 03 26 9.8 2. 7
Ch232D ••• porphyry.
Ric beekite granoph yrc, in- 75.94 .04 26 9. 0 2.9 trusivc.
Chi02B •••• Hicbcckit<' granite, intrusive 75. iO . 08 45 42 1.1 Ch746F •••• Ricbcckitc rhyolite __________ 75.09 . 04 41 16.4 2. 5 Ch707A-3 •. Pyroxene m icrograni te, in- 70.00 .14 24 7. 0 3. 4
trusive. ChU68F ••.• Hei bccki tc trachyte, extru- 69.14 . 04 40 19. 5 2.1
sive. Ch:l40B •••• Aegerine augite trachyte, 66.49 .12 11.3 1.9 5. 9
intrusive. Ch61B ••••.. AU!!itc soda trachyte, intru- 65.40 .11 11.6 3. 4 3.4
sivc. Chi47C •..• 'l'mchynndcsitc porphyry ___ 64.26 . 23 14.1 (l. 2 2.3 Ch577B •••• ••••• do. ______________________ 63.97 . 57 11.3 a. a 3.4 Ch47H ••••• A nalcite-sycnitc ... __ • __ • ____ 62.76 .10 10.9 3.4 3. 2 Ch726F •••• 'l'mchyandesite .. ----------- 58.60 . 70 9. 5 4. 3 2. 2 Ch258 ••••• Olivine sycnodiorite ...••...• 55.36 . 83 11.0 4. 4 2. 5 Ch727D ••• Basalt porphyry, extrusive ... 55.64 . 96 8. 3 a. a 2. 5 Cht76A •••• Analcite-andesine syenite ... 53.70 . 76 7. 5 2 . .') :t 0 Ch47A .•••• Syenogabbro .• __________ •••• 5:3.40 .83 4. 2 1.6 2.o Ch724 •• __ • Porphyritic olivine basalt, .52. 35 1.4 3.8 1.6 2.4
intrusi vc. Cht79 ••••• Analcite syenogabbro ••. ____ 51.04 1.1 5. 0 1.6 3. 1 Chl48 ••••• Olivine basalt intrusive ..••. 4\J. 90 1. .'i 3. 4 1.2 2.8 ChaS(i ••• __ _____ cto _______________________
48.40 2. 2 3. 't 1.1 3.1 Chn\JD ••.• Analcite labradorite syenite. 48.51 1.1 4. 7 1.7 2. 8 Ch!i8!J •.••. Olivine basalt porphyry, 47.69 2. 0 2. r; 1.2 2. 2
extrusive. Ch8401L .. Basalt, intrusive ..••..••.••. 45.89 2.3 4. 7 1.9 2. 5 Ch243D ••. Nepheline basalt, intrusive .• 43.75 3.1 5. 4 2. 2 2. 5 Chi. •••••• Porphyritic olivine basalt. .• 46.19 1.8 3. 9 1.9 2.1
50 I I I I I
.. z 0 40 :::::;
-..J
~ a: UJ 30 f-a.. en t-a: c:t a.. z 20
~ 2 a: 0 10 :X:
. . . -t- . .
. . . . . . 0 I I I I I
50 I I I I I
z 0 40 t- -:J ..J
~
a: UJ 30 t-a.. -en t-a: ~ z. 20f-
~ :::l z c:t a: 10 t-:::l
.. . . . 0-30
I • • .. 1 • ~. 1: I •,
-20 -10 0 10 20 30
POSITION 1/3 Si02 +K 2 0-CaO-FeO-MgO ·
FIGURE 27.2.-Variation diagrams showing the distribution of thorium and uranium in alkalic igneous rocks from Big Bend National Park, Tex.
tent for 27 samples. The samples and chemical data ' were provided by the late Prof. ,T. T. Lonsdale, of the
University of Texas. The siliceous rocks in the range
from about ;-,(0 to 77 t s·o l CaO percen 1 2 · utve N O+Ir O a2 ~z
ratios ranging from about 0.03 to about 0.1, indicating they are extremely lime poor. In these rocks the thorium content ranges from about 25 to 45 ppm and the uranium content from 9 to 45 ppm. Nearly all the rocks contain greater amounts of thorium and uranium than corresponding rocks of the calc-alkalic suites studied by Larsen and G:ottfried (1960). Figure 27.2 shows the relation between the thorium and uraniun1 content of the rocks and their chemical composition on a variation diagram. Both thorium and uranium show
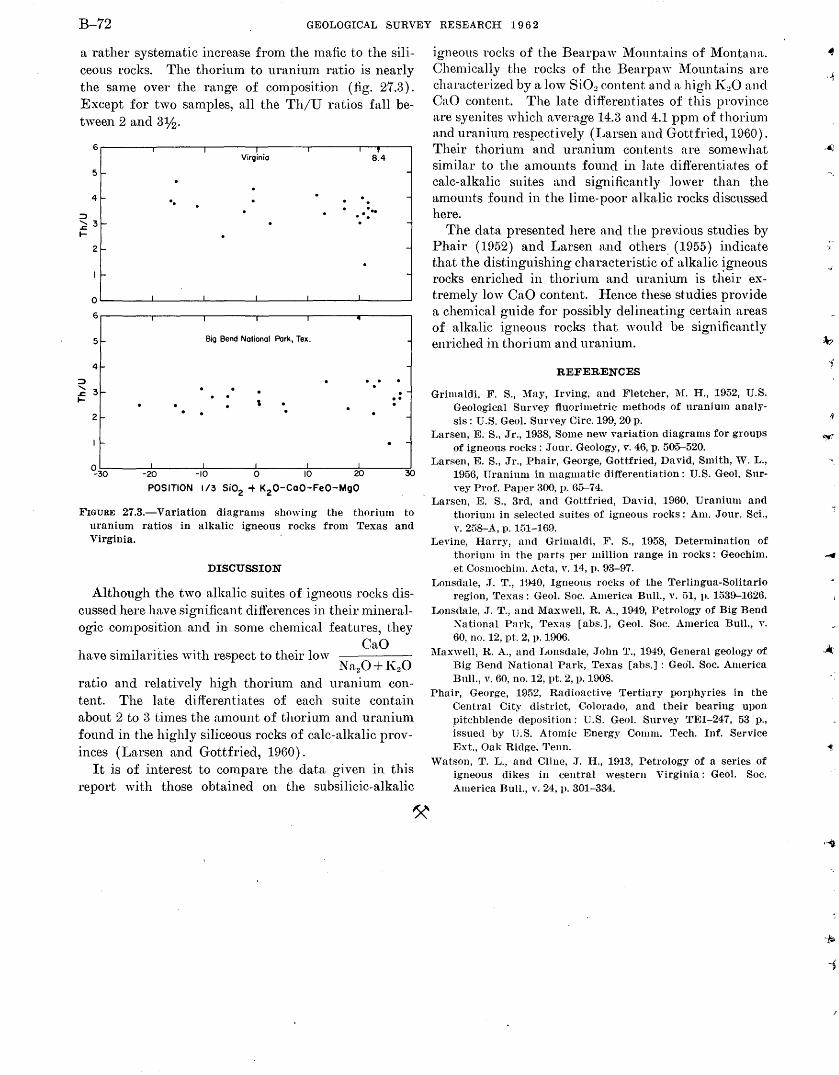
B-72 GEOLOGICAL SURVEY RESEARCH 1 9 6 2
a rather systematic increase from the mafic to the siliceous rocks. The thorium to uranium ratio is nearly the same over the range of composition (fig. 27.3). Except for two samples, all the Th/U ratios fall between 2 and 3¥2.
6 I I
Virg\nia I I T
8.4
5r -
4-- .. . -. ::J
. . .. .. ~ 31- -t-
2- -
II- -
0 I I I I 1
6 I I I I ..
5~ Big Bend National Pork, Tex.
4 -
::J . . ....... . ..t::. 31- . -t-
' .. .
21-
II-
~30 I I I I I
-20 -10 0 10 20 30
POSITION 1/3 Si02 + K2 0-Ca0-Fe0-Mg0
FIGURE 27.3.-Variation diagrams showing the thorium to uranium ratios in alkalic igneous rocks from Texas and Virginia.
DISCUSSION
Although the two alkalic suites of igneous rocks discussed here have significant differences in their mineralogic composition and in some chemical features, they
CaO have similarities with respect to their low
Na20+ I\:20 ratio and relatively high thorium and uranium content. The late differentiates of each suite contain about 2 to 3 times the amount of thorium and uranium found in the highly siliceous rocks of calc-alkalic provinces (Larsen and Gottfried, 1960).
It is of interest to compare the data given in this report with those obtained on the subsilicic-alkalic
igneous rocks of the Bearpaw ~fountains of ~fontana. Chemically the rocks of the Bearpa w ~fountains are characterized by a low 8102 content and a high l\:20 and CaO content. The late differentiates of this province are syenites which average 14.3 and 4.1 ppm of thorium and uranium respectively (Larsen and Gottfried, 1960). Their thorium and uranium contents are somewhat similar to the amounts found in ]ate differentiates of calc-alkalic suites and significantly lower tha.n the amounts found in the lime-poor alkalic rocks discussed here.
The data presented here and the previous studies by Phair (1952) and Larsen and others. (1955) indicate that the distinguishing characteristic of alkalic igneous rocks enriched in thoriun1 and uranium is tl~eir extremely low CaO content. Hence these studies provide a chemical guide for possibly delineating certain areas of alkalic igneous rocks that ·would be significantly enriched in thorium and uranimn.
REFERENCES
Grimaldi, F. S., May, Irving, and Fletcher, l\1. H., 1952, U.S. Geological Survey fluorimetric methods of uranium analysis: U.S. Geol. Survey Circ. 199, 20 p.
Larsen, E. S., Jr., 1938, Some new variation diagrams for groups of igneous rocks: .Jour. Geology, v. 46, p. 505-520.
Larsen, E. S., Jr., Phair, George, Gottfried, David, Smith, 'V. L., 1956, Uranium in magmatic differentiation: U.S. Geol. Survey Prof. Paver 300, p. 65-74.
Larsen, E. S., 3rd, and Gottfried, David, 1960, Uranium and thorium in selected suites of igneous rocks: Am. Jour. Sci., v. 258-A, p. 151-169.
Levine, Harry, and Grimaldi, F. S., 1958, Determination of thorium in the parts per million range in rocks: Geochim. et Cosmochim. Acta, v. 14, p. 93-97.
Lonsdale, .J. T., liMO, Igneous rocks of the Terlingua-Solitario region, Texas: Geol. Soc. America Bull., v. 51, v. 1539-1626.
Lonsdale, J. T., and Maxwell, R. A., 1949, Petrology of Big Bend National Park, Texas [abs.], Geol. Soc. America Bull., v. 60, no. 12, pt. 2, p. 1906.
1\iaxwell, R. A., and Lonsdale, .John T., 1!H9, General geology of Big Bend National Pari\:, Texas [abs.] : Geol. Soc. America Bull., v. 60, no. 12, pt. 2, p. 1908.
Phair, George, 1952, Radioactive Tertiary porphyries in the Central City district, Colorado, and their bearing upon pitchblende deposition: U.S. Geol. Survey TEI-247, 53 p., issued by U.S. Atomi<.: Energy Comm. Tech. Inf. Service Ext., Oak Ridge, Tenn.
Watson, T. L., and Cline, .J. H., 1913, Petrology of a series of igneous dikes in central western Virginia: Geol. Soc. America Bull., v. 24, p. 301-334.
.Jil;
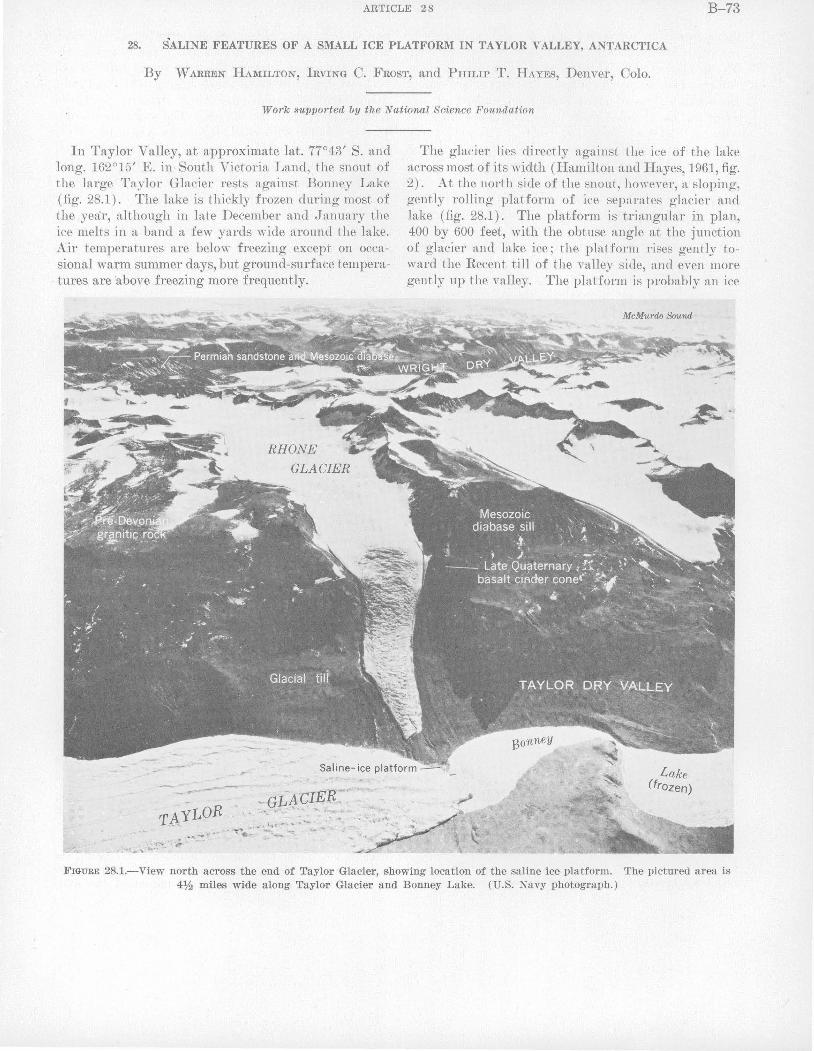
ARTICLE 28 B-73
28. SALINE FEATURES OF A SMALL ICE PLATFORM IN TAYLOR VALLEY, ANTARCTICA
By WARREN IIAMILTON, IRVING C. FRosT, and PHILIP T. HAYEs, Denver, Colo.
Work supported by the National Science Foundation
In Taylor Valley, at approximate lat. 77°43' S. and long. 162°15' E. in· South Victoria Land, the snout of the large Taylor Glacier rests against Bonney Lake (fig. 28.1). The lake is thickly frozen during most of the year, although in late December and January the ice melts in a band a few yards wide around the lake. Air temperatures are belo\v freezing except on occasional warm summer days, but ground-surface tempera-
. tures are ·above freezing more frequently.
-r-- ... ·-
The glacier lies directly against the ice of the lake across most of its width ( Ha.milton and Hayes, 1961, fig. 2). At the north side of the snout, however, a sloping, gently rolling platform of ice separates glacier and lake (fig. 28.1). The platform is triangular in plan, 400 by 600 feet, with the obtuse angle at the junction of glacier and Jake ice; the platform rises gently toward the Recent. till of the valley side, and even more ge11tly up the valley. The platform is probably an ice
McMurdo Sound
FIGURE 28.1.-View north across the end of Taylor Glacier, showing location of the saline ice platform. The pictured area is 4lh miles wide along Taylor Glacier and Bonney Lake. (U.S. Navy photograph.)
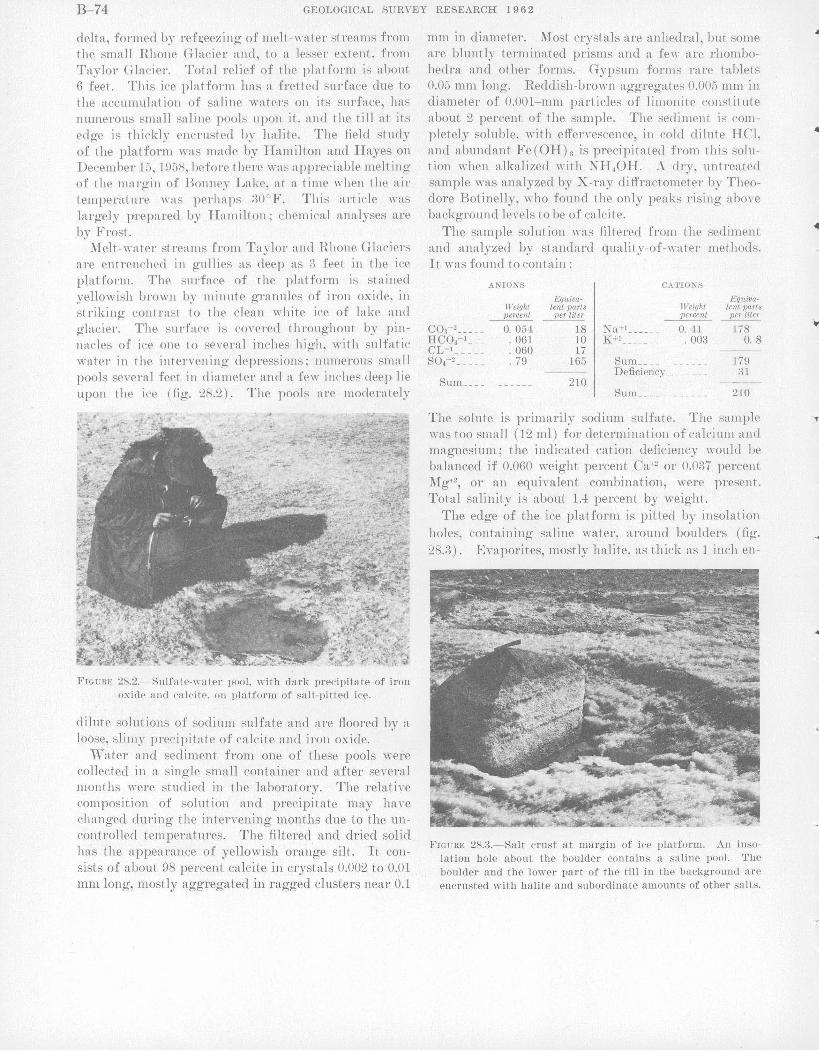
B-74 GEOLOGICAL SURVEY RESEARCH 1 9 6 2
delta, formed by ref~;eezing of melt-\Yater streams from th~ small Rhone Glacier and, to a lesser extent, from Taylor Glacier. Total relief of the platform is about 6 feet. This ice platform has a fretted surface due to the aceumulation of saline waters on its surface, has numerous small saline pools upon it, and the till at its edge is thickly encrusted by halite. The iield study of the platform ,;.,ras made by Hamilton and Hayes on December 15, 1958, before there was appreeiable melting of the margin of Bonney Lake, at a time \Yhen the air temperature \\"as perhaps 00°F. This artiele \Yas largely prepared by J-Iamilton; chemieal analyses are by Frost.
M:elt-\Yater streams from Taylor and Rhone Glaciers are entrenched in guJlies a,s deep as 3 feet in the ice platform. The surface of the platform is stained yellowish brown by minnte granules of iron oxide, in striking co11trast to the clean white ice of lake and ghcier. The surface is covered throughout by pinnacles of ice one to several inehes hig-h, with sulfatic water in the intervening depressions; 1nm1erous small pools several feet in diameter and a few inches cleep lie upon the ice (fig. 28.2). The pools are moderately
FIGURE 2g.2.-Sulfl:lte-water pool, with dark precipitate of iron oxide and calc-ite, on platform of salt-pitted ice.
dilute solutions of sodium sulfate and are floored by a loose, slimy precipitate of calcite and iro11 oxide.
Water and sediment from one of these pools were colleeted in a single small eontainer and after several months were studied in the laboratory. The relative composition of solution and precipitate may have changed during the intervening months due to the uncontrolled temperatures. The filtered and dried solid has the appearance of yellowish orange silt. It consists of about 98 percent calcite in crystals 0.002 to 0.01 mm long, mostly aggregated in ragged dusters near 0.1
mm in diameter. Most crystals are anhedral, but some are bluntly terminated prisms and a fe'" are rhombohedra and other forms. Gypsum forms rare tablets 0.05 mm long. Reddish-brown aggregates 0.005 mm in diameter of 0.001-mm particles of limonite constitute about 2 percent of the sample. The sediment is completely soluble, with effervescence, in cold dilute I-ICl, and alnmdant Fe ( OH) 3 is preeipitated from this solution when alkalized \Yith NH40H. A dry, untreated sample was analyzed by X-ray diffractometer by Theodore Botinelly, \Yho found the only peaks rising above background le\Tels to be of calcite.
The sample solution was filtered from the sediment and analyzed by standard quality-of-water methods. It was found to contain:
ANIONS CATIONS
Equiva- Equiva-Weight lent parts Weight lent parts percent per liter percent per liter
COa-2 ___ -- 0. 054 18 Na+1 ______ 0. 41 178 HC03-t ___ . 061 10 K+I ___ ____ . 003 0. 8 CL-1 _____ . 060 17 so4-z _____ . 79 165 Sum ____ 179
- --- Deficiency ________ 31 Sum ____ 210 ---
Sum ____ 210
The solute is primarily sodium sulfate. The sample was too small (12 ml) for determination of ealeium and magnesium; the indicated cation deficiency \vould be balaneed if 0.060 weight pereent Ca+2 or 0.037 percent Mg+2, or an equivalent combination, were present. Total salinity is about 1.4 percent by weight.
The edge of the ice platform is pitted by insolation holes, eontaining saline water, around boulders (fig. 28.:1). Evaporites, mostly halite, as thick as 1 ineh en-
FIGURE 28.3.-Salt crust at margin of ice platform. An insolation hole about the boulder contains a saline pooL The boulder and the lower paTt of the till in the background are encrusted with halite and subordinate amounts of other salts.
..
. ....
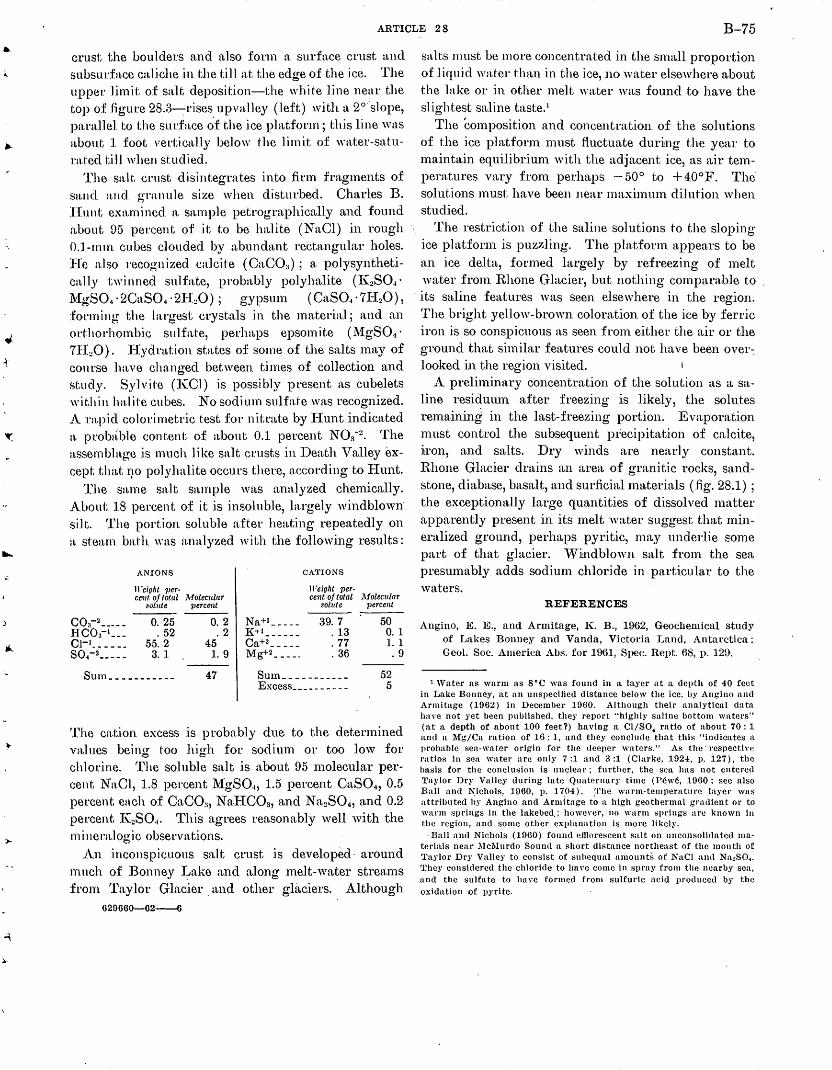
1).-
ARTICLE 28 B-75
crust the boulders and also form a surface crust and subsurface cal.iche in the till at the edge of the ice. The upper l.im it of salt deposition-the white l.ine near the top of figure 28.3---:-rises up valley (left) w.ith a 2° ·slope, p:u:n.llel to the surface of the ice platform; this line was about l foot; vertically below t-he 1 im it of water-saturn.t'ed till when studied.
The salt crust disiHtegrates into firm fragments of su.nd and granule size when disturbed. Charles B. llunt exa.minecl a S<tmple petrographically and found about D5 percent of .it to be halite (NaCl) in rough 0.1-nun cubes clouded by abundant rectangular holes. ]~[e aJso recognized calcit-e ( CaC03 ) ; a polysynthetically twinned sulfate, probably polylutlite (l(zS04 · ~fgS04 · 2CaSO 4 · 21CO) ; gypsum ( CaS04 · 7IIzO), fm·1ning the largest crystals .in the material; and an m't'horhomhic sulfn.t'e, perhaps epsom ite (:~1gS04 · 7I:CO). Jiydration states of some of the salts may of course .lmve changed between times of collection and study. Sylvit·e (J(Cl) is possibly present as cubelets within lmlit·e cubes. No sodium sulfate was recognized. A rn.pid colorimetric test for nitrate by liunt indicated a. prob<t.ble content of about 0.1 percent NOa-2
• The a.ssernblage is much like salt crusts in Death Valley except that I}O polyhnlite occurs there, according to I:Iunt.
The same salt; sample was analyzed chemically. About 18 percent of it is insoluble, l;trgely windblown· si.lt. The poJ:tion soluble after heating repeatedly on a. st·earn ba.t'h was analyzed with the following results:
ANIONS
ll'eioht 1Jer-cent of total Afolecular
.9olnte 1Jercent
0. 25 . 52
55. 2 3. 1
StlliL----------
0. 2 .2
45 1.9
47
CA'l'IONS
Weioht per-cent of total Afolecular
solute percent
Na+l ____ _ K-tl _____ _
Ca+2 ____ _
Mg+2_ ----
39. 7 . 13 . 77 . 36
Sum __________ _ Excess _________ _
50 0. 1 1. 1 .9
52 5
The cation excess is probably due to the determined values being too high for sodium or too low for chlorine. The soluble salt is about 95 molecular percent NaCl, 1.8 percent ~igSO<~, 1.5 percent CaS04, 0.5 percent each. o:f CaC0:-1' NaHC03, and NazS04, and 0.2 percent 1(280.,. T'his agrees reasonably well with the 1n i nera.logic observations.
.An inconspicuous salt crust is developed· around lnuch of Bonney Lake and along 1nelt-water stre~ims from Taylor Glacier . and other glaciers. Although
629660-62-6
salts must be more concentrated in the small proportion of 1 iquid water than in the ice, no water elsewhere about the lake or in other melt water was found to have the slightest saline taste.1
The composition and concentration of the solutions of the ice platform must fluctuate during the year to mainta.in equilibriwn with the adjacent ice, as air temperatures vary from perhaps -50° to +40°F. The solutions must have been near maximmn dilution when studied.
The restriction of the saline solutions t-o the sloping ice pla.tfonn is puzzling. The platfonn appears to be an ice delta, formed largely by refreezing of melt water frmn Rhone Glacier, but nothing comparable to
·its saline features was seen elsewhere in the region. The bright yellow-brown coloration of the ice by ferric iron is so conspicuous as seen frmn either the air or the ground that similar features could not have been over-. looked in the region visited.
A preliminary concentration of the solution as a saline residumn after freezing is likely, the solutes remaining in the last-freezing portion. Evaporation must control the subsequent pt;ecipitation of calcite, ~ron, and salts. Dry winds are nearly constant. Rhone Glacier drains an area of granitic rocks, sandstone, diabase, basalt, and surficial 1naterials (fig. 28.1) ; the exceptionally large quantities of dissolved matter apparently present in its melt water suggest that min-· eralized ground, perhaps pyritic, may underlie some part of that glacier. vVl!nclblown sa..It from the sea presumably_ adds sodium chloride in particular to the waters.
REFERENCES
Angino, E. E., and Armitage, K. B., 1962, Geochemical study of Lakes Bonney and Yanda, Victoria Land, Antarctica: Geol. Soc. America Abs. for 1961, Srlec. Rept. 68, p. 129 .
1 Water as warm as soc was found in a layer at a de(}th of 40 feet in Lake Bonney, at an unS[)ecified distance below the ice, hy Angino and Armitage (1962) in December 1960. Although their analytical data ha ye not yet been IHJblished, they report "highly saline bottom waters'' (at a depth of about 100 feet?) having a Cl/S04 ratio of about 70: 1 and a Mg/Cn ration of 16: 1, and they conchHle that this "indicates a prohahle sen-water origin for the dee()er waters." As the· respective mtios in sea wate•· nrc only 7:1 and 3:1 (Clarke, 1924, p. l27), the basis fot· the conclusion is nnclen•·; further, the sen. has not entet·ed 'l'nylor Dry Valley during late Qnatet'IHll'Y time (P~w~. 1960; see also Ball and Nichols, 1960, p. 1704). :.l'he warm-temperatn•·e layer was attt·ibuted hy Angino and Armitage to a high geothermal gnulient or to warm springs in the lake bed,; however, no warm springs are known in the region, and some other explanation is more likely.
·Ball and Nichols (1960) found efflorescent salt on unconsolidated ma.terials near l\lci\Iut·<lo Sountl a short distance northeast of the mouth of Taylor Dry Valley to consist of snhequnl amount~ of NaCI antl Na~S04 • They considered the citloride to have come in spray from the nearby sea, and the sulfate to have formed from sulfm·lc acid produced by the oxidation of pyrite.
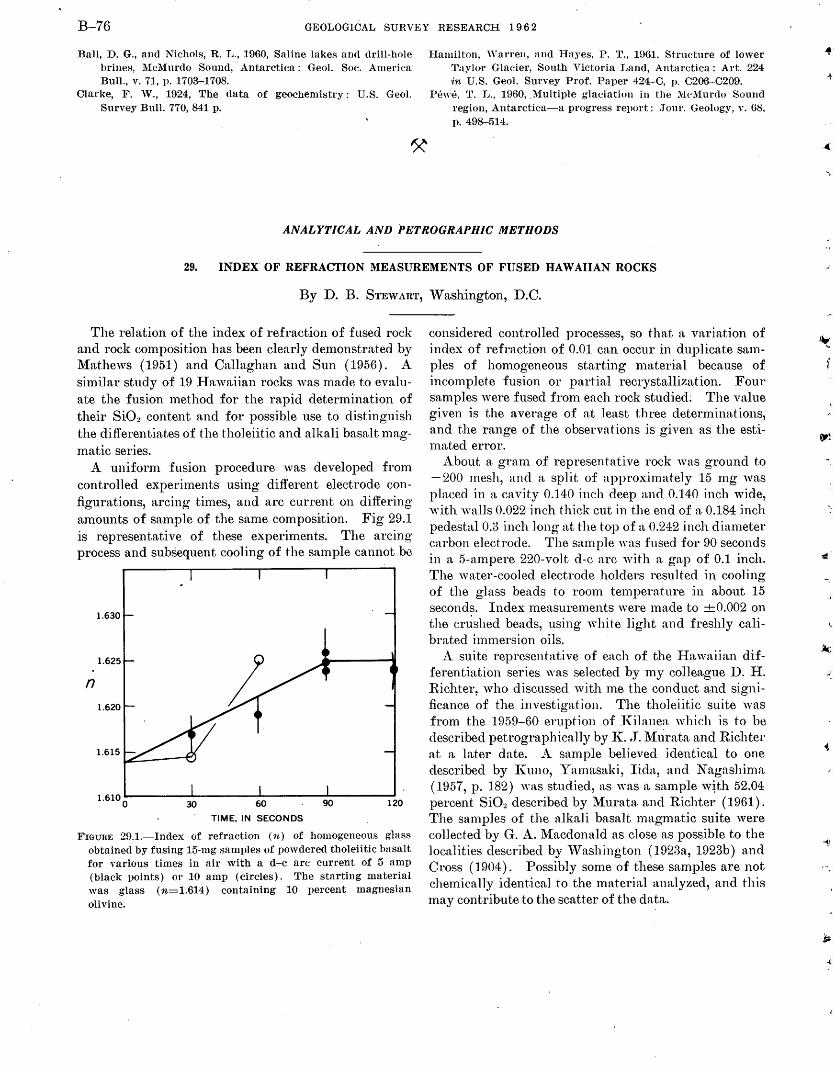
B-76 GEOLOGICAL SURVEY RESEARCH 1 9 6 2
Ball, D. G., and Nichols, R. L., 1960, Saline lakes and drill-hole brines, McMurdo Sound, Antarctica: Geol. Soc. America Bull., v. 71, v. 1703-1708.
Clarl{e, F. W., 1924, The data of geochemistry: U.S. Geol. Survey Bull. 770, 841 p.
Hamilton, 'Varre11, and Hayes, P. T., 1961. Structure of lower Taylor Glacier, South Victoria Land, Antarctica: Art. 224 'in U.S. Geol. Survey Prof. Paper 424-C, p. 0206-0209.
Pewe, ~r. L., 1960, .Multiple glaciation in the ~:IeMurdo Sound region, Antarctica-a progress report: ;ronr. Geology, v. 68, p. 498--514.
ANALYTICAL AND PETROGRAPHIC METHODS
29. INDEX OF REFRACTION MEASUREMENTS OF FUSED HAWAIIAN ROCKS
By D. B. STEWART, Washington, D.C.
The relation of the index of refraction of fused rock and rock composition has been clearly demonstrated by Mathews (1951) and Callaghan and Sun (1956). A similar study of 19 Hawaiian rocks was made to evaluate the fusion method for the rapid determination of their Si02 content and for possible use to distinguish the differentiates of the tholeiitic and alkali basalt magmatic series.
A uniform fusion procedure was developed from controlled experiments using different electrode configurations, arcing times, and arc current on differing amounts of sample of the same composition. Fig 29.1 is representative of these experiments. The arcing process and subsequent cooling of the sample cannot be
1.630
n 1.620
1.615
1.610 0 30 60 90 120
TIME, IN SECONDS
FIGURE 29.1.-Index of refraction (n) of homogeneous glass obtained by fusing 15-mg samples of powdered tholeiitic basalt for various times in air with a d-e arc current of 5 amp (black points) or 10 amp (circles). The starting material was glass (n=1.614) containing 10 percent magnesian olivine.
considered controlled processes, so that a variation of index of refraction of 0.01 can occur in duplicate samples of hmnogeneous starting material because of incomplete fusion or partial recrystallization. Four samples were fused frmn eaeh rock studied: The value given is the average of at least three determinations, and the range of the observations is given as the estimated error.
About a gram of representative rock was ground to -200 mesh, and a split of approximately 15 mg was placed in a cavity 0.140 inch deep and 0.140 inch wide, ·with walls 0.022 inch thick cut in the end of a. 0.184 inch pedestal 0.3 inch long at the top of a 0.242 inch diameter carbon electrode. The sample ·was fused for 90 seconds in a 5-ampere 220-volt d-e arc with a gap of 0.1 inch. The water-cooled electrode holders resulted in cooling of the glass beads to room temperature .in about 15 seconds. Index measurements were made to +0.002 on the crtished beads, using white light and freshly calibrated immersion oils.
A suite representative of each of the Hawaiian differentiation series was selected by my colleague D. H. Richter, who discussed with me the conduct and signi:fic.a.nce of the investigation. The tholeiitic suite was from the 1959-60 eruption of l{i]auea which is to be described petrographically by IC .T. ~it1ra.ta and Richter at a later date. A sample believed identical to one described by l{uno, Yamasaki, Iida, and Nagashima (1957, p. 182) was studied, as ·was a sample w~th 52.04 percent Si02 described by Murata and Richter (1961). The samples of the alkali basalt magmatic suite were collected by G. A. Macdonald as close as possible to the localities described by vVashington ( 1923a, 1923b) and Cross ( 1904). Possibly some of these samples are not chemically identical to the material analyzed, and this may contribute to the scatter of the data.
I~
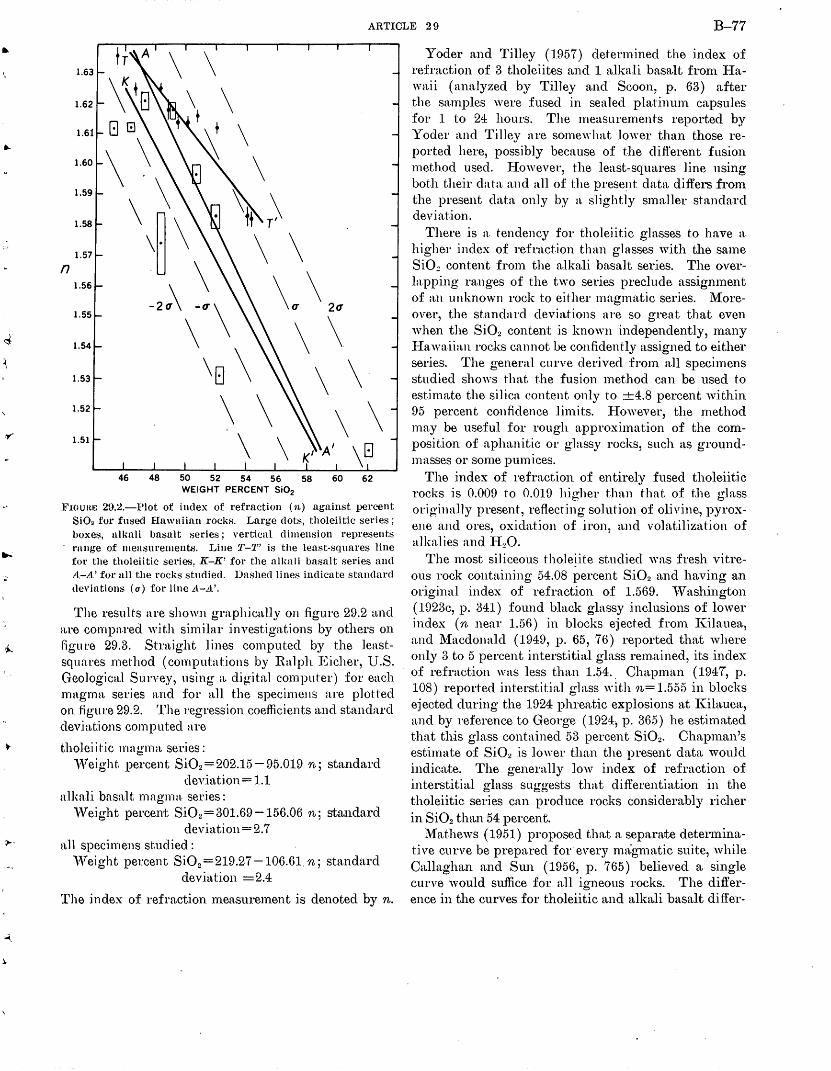
~.
ARTICLE 29 B-77
G E1
\\ \\ \~ \ . \ -2~\u\ 20'
1.53 \s \ 1.52 \ \ 1.51 \ \
46 48 50 52 54 56 58 60 62 WEIGHT PERCENT Si02
]fiOuln; 2n.~.-Plot of index of refraction ( n) against percent SiO~ for fu::;ed Hnwuiinn rock8. Large dots, tholeiitic series; boxes, ullmli IJasnlt :-:;eries; vertkal dimension represents rnnge of measurements. Line '1.'-1" is the least-squares line for the tholeiitic series, K-K' for the alkali basalt series and 11.-A.' fo1· nil the rocks studied. Dnshed lines indicate standard devintions (a) for line il-.A'.
The results are shown graphically on figure 29.2 and are compa.red with similar :investigations by others on figure 29.3. Straight lines computed by the leastsquares method (computations by Ralph Eicher, U.S. GeologicaJ Survey, using a. digital computer) for each rnagrna series and for all the specimens are plotted on .tigure 29.2. The regression coefficients a.nd standard dev.in.t:ions computed are
tho.lei it"ic 1nagma. series: '\Teight percent Si02=202.15-95.019 n; standard
deviation= 1.1 nllmli basalt magma. ser.ies:
'Veight percent Si02 = 301.69-156.06 n; sta.ndard deviation= 2.7
n.ll specitnens studied: "Teight percent Si02=219.27-106.61.n; standard
deviation =2.4
The index of refrn.ction 1nea.surement is denoted by n.
Yoder and Tilley (1957) determined the index of refraction of 3 tholeiites and 1 alka.li basalt fron1 Hawaii (analyzed by Tilley and Scoon, p. 63) after the samples were fused in sealed platinum capsules for 1 to 24 hours. The measurements reported by Yoder and Tilley are somewhat .lower than those reported here, possibly because of the different fusion method used. However, the least-squares line using both their data and all of the present data differs from the present data. only by a slightly smaller standard deviation.
There is n. tendency for tholeiitic glasses to have a higher index of refraction than glasses with the same SiO:! content from the a.lkali basalt series. The over.ln.pping ranges of the two series preclude assignment of a.n unknown rock to either magmatic series. Moreover, the standard dev.iations are so great that even when the Si02 content is known independently, n1any IIa.waiian rocks cannot be confidently assigned to either series. The general curve derived frmn aU specimens studied shows that the fusion method can be used to estimate the silica content only to +4.8 percent within 95 percent confidence limits. I-Iowever, the method may be useful for rough approximation of the composition of aphanitic or glassy rocks, such as groundmasses or some pum 1ces.
The index of refraction of entirely fused tholeiitic roeks is 0.009 to 0.019 higher than that of the glass orig·inally present, reflecting solution of olivine, pyroxene and ores, oxidation of iron, and volatilization of alkalies and H20.
The most si.liceous tholeiite studied was fresh vitreous rock eontn.ining 54.08 percent Si02 and having an original index of refraction of 1.569. 'Vashington (1023c, p. 341) found black glassy inelusions of lower index ( n near 1.56) in blocks ejected from IGlauea, and ~{acdonald ( 1949, p. 65, 76) reported that where only 3 to 5 percent interstitial glass remained, its index of refraction was less than 1.54.. Chapman ( 1947, p. 108) reported interstitia] glass with n= 1.555 :in blocks ejected during the 1924 phrea,tic explosions at IGlauea, a.nd by reference to George ( 1924, p. 365) he estimated that this glass contained 53 percent Si02• Chap1nan's estimate of Si02 is lower than the present data would indica.te. The generally low index of refraetion of interstitial glass suggests that differentiation in the tholeiitic. series can produce roeks eonsiderably richer in Si02 than 54 percent.
~{a thews ( 1951) proposed that a separate detenninati ve eurve be prepared for· every m~igmatie suite, while Callaghan and Sun ( 1956, p. 765) believed a single curve would suffice for all igneous rocks. The difference in the curves for tholeiitic and alkali basalt differ-
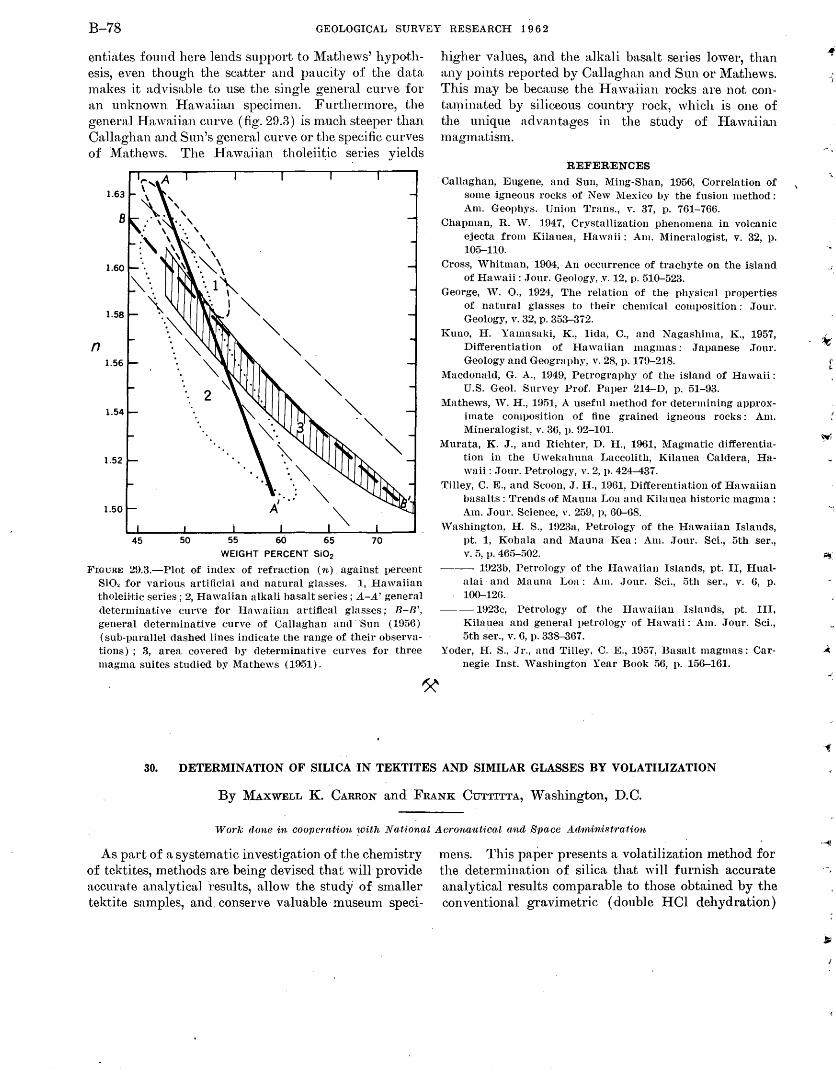
B-78 GEOLOGICAL SURVEY RESEARCH 19 6 2
entiates found here lends support to l\1athews' hypothesis, even though the sca.tter and paucity of the data. makes it advisa-ble to use the single general curve for an unknown I-Ia:wa.iia.n specimen. Furthermore, the general I-Ia,waiian curve (fig. 29.3) is m.uch steeper than Callaghan a.nd Sun's general curve or the specific curves of l\1athews: The Hawaiian tholeiitic series yields
n
WEIGHT PERCENT Si02
li,IGURE 29.3.-Plot of index of refraction (n) against percent Si02 for various artificial and natural glasses. 1, Hawaiian tholeii-tic series; 2, Hawaiian alkali basalt series; .A-A' general determinative curve for Hawaiian artifical glasses; B-B', general determinative curve of Callaghan and Sun (1956) (sub-parallel dashed lines indicate the range of their observations) ; 3, area coYered by determinative curves for three magma suites studied by Mathews ( 1951).
higher values, and the a.lkali basalt series lower, than a.ny points reported by Ca.llaghan and Sun or l\1athews. This may be because the I-Iawa.iian rocks are not conbu11inated by siliceous country rock, which is one of the unique advantages in the study of I-Iawaiian magmatism.
REFERENCES Callaghan, Eugene, and Sun, l\fing-Shan, 1956, Correlation of
some igneous rocks· of New Mexico IJy the fusion method: Am. Geophys. Union Trans., v. 37, p. 761-766.
Chapman, R. ,V. 1947, Crystallization phenomena in volcanic ejecta from Kilauea, Hawaii: Am. Mineralogist, v. 32, p. 105-110.
Cross, ·whitman, 1904, An occurrence of trachyte on the island of Hawaii: .Jour. Geology, .v. 12, p. 510-523.
George, ,V. 0., 1924, The relation of the physical properties of natural glasses to their chemical composition: .Jour. Geology, v. 32, p. 353-372.
Kuno, H. Yamasaki, K., Iida, C., and Nagashima, K., 1957, Differentiation of Hawaiian magmas: .Japanese .Jour. Geology and Geography, v. 28, p. 179-218.
Macdonald, G. A., 1949, Petrography of the island of Hawaii : U.S. Geol. Survey Prof. Paper 214-D, p. 51-93.
Mathews, \V. H., 1951, A useful method for cletermining approximate composition of fine grained igneous rocks: Am. Mineralogist, v. 36, v. 92-101.
Mlirata, K. J., and Richter, D. H., 1961, Magmatic differentiation in the Uwekahuna Laccolith, Kilauea Caldera, Hawaii: .Jour. Petrology, v. 2, p. 424-437.
Tilley, C. E., and Scoon, .J. H., 1961, Differentiation of Hawaiian basalts: Trends of Mauna Loa and Kilauea historic magma: Am. Jour. Science, v. 259, p, 60-68.
\Vashington, H. S., 1923a, Petrology of the Hawaiian Islands, pt. 1, Kohala and Mauna Kea: Am. Jour. Sci., 5th ser., v. 5, p. 465-502.
--- 1923b, Petrology of the Hawaiian Islands, pt. II, Hualalai· and Mauna Loa: Am .. Jour. Sci., 5th ser., v. 6, p. 100-126.
--1!)23c, Petrology of the Hawaiian Islands, pt. III, Kilauea and general petrology of Hawaii: Am . .Jour. Sci., 5th ser., v. 6, p. 338-367.
Yoder, H. S., Jr., nnd Tilley, C. E., 1957, Basalt magmas: Carnegie lust. \Vashington Year Book 56, p. 156-161.
30. DETERMINATION OF SILICA IN TEKTITES AND SIMILAR GLASSES BY VOLATILIZATION
By MAxWELL K. CARRON and FRANK CUTTITTA, Washington, D.C.
Work llone in coope1·ation '!1Jith National .Aeronatttica.l a.nd Space A.dntini.lltration
As part of a systematic investigation of the chemistry of tektites, methods are being devised that will provide accurate analytical results, allow the study of smaller tektite samples, and. conserve valuable museum speci-
mens. This paper presents a volatilization method for the determination of silica that will furnish accurate analytical results comparable to those obtained by the conventional gravimetric (double HCl dehydration)
II'-
ARTICLE 30 B-79
or the spectrophotometric (molybdenum-blue) methods, perrnit the detennina.tion of Al, :Mg, Ca, Na, IC, Ti, .Fe, P, and ~1n in the same sample taken for the silica. determination, and be less time consuming than the conventional gra.vimetric procedure.
An accurately weighed portion of tektite is digested with JIF .in a weighed pla.tinum crucible. Silicon :is volatilized as SiF4 n.t ste:nn-baJh temperature, and the resultant fluoride salts n.re converted to nitrates with concentrnted I:INOa. The :nitrates in the residue are decornposed with formaldehyde, evnpora.ted to dryness on a ste:un bath, and ignited to constant weight at 7n0°C±15°C.
The deeomposit.ion of nitrates -with formaldehyde is accomplished in two steps, a.s follows:
4N031 -I-2CII20~4N0;-1 -I-2H20+2C02· 4NO;-• + 3CH 20~2N 2 + 3C0z + 02 + 3Hz0
The residue contains the oxides of Al, Fe, Cn., ~1g, Nn., IC, Ti, ~fn, P, a.nd the trac('. constituents. These oxides u.re brought into solution by digestion with a mixture o:f I-IF· £[Cl0., followed by heating to fumes of liCl04 • Except for the determination of ferrous iron, one sample c:tll be used for the deterrnination of all the mttjor constituents of tektites.
The method n.ppears to be especially suited to the detennina.tion o:f Si02 in tektites because of their low alkali. eontent n.nd almost complete absence of vohttile constituent·s such as C02 and J:CO. A correction must be mn.de for the oxidation of FeO ·to Fe20:~ after the finn.l .ignition to constant weight.
P1··ooed'wre-T'o 0.2000 g of sample in a weighed platinum crucible, add 2 1nl of water and 4-5 ml 4~ percent lfF. Cover with n. plat.innm cover n.nd digest on a steam bath :for n.t least 2 hours. Uncover, evaporate the solution to about 2 ml, and add 5 ml cone JINOa. Evaporate the solution to dryness. Repeat the evaporation tw.iee with 5-ml adclitions of cone lTNOa. Add two !5-ml portions o:l: formaldehyde, and evaporate to dryness each time to destroy nitrtttes. Allow the second ev:tporation to proceed overnight. lfeat the partially covered crucible gent~lj in nn air bath, gradua.lly raising the temperature to full heat of the burner. Continue heating for another lfi miHutes. Transfer the crucible to a regulated mufHe furnace. fleat at 750° C± 15° C for 3 hours with the cover slightly aside. to allow oxidation of :iron to the ferric state. 'Veigh and repeat the heating for additional lj2-hour periods until constant
weight .is obtained. The loss in weight after ignition to constant weight, corrected for the oxidation of the FeO originally present in the tektite to Fe20a, represents the silica content of the sample.
The temperature of ignition of the residues is cr.itical. Constant ·weights obtained at 750° C ga.ve silica values comparable to those obtained by conventional gravimetric or spectrophotometric methods. Igniting at 700° C for 4 hours ga.ve lower silica values, ranging from 1 to 2 percent absolute below acceptable values. At 800° C, results were high by nearly 0.5 percent absolute.
The possibility of loss by vol:-..tilization of the alkalies at the temperature (750° C) of ignition to constant weight was investigated. The n.lka1i eontent (Na20 and I\:20) of the ignited residues was determined by flame photometry. The results show no significant difference from those obtained for the original untreated tektite samples. The described procedure was devised primarily for use as an independent and accura.te method for the determintion of silica in tektites a,nd other similar glasses.
The table below presents a comparison of silica determinations by the volatilization-formaldehyde method with those by the conventional gravimetric or spectrophotometric methods. All results are well within 1 percent (relative) of each other. Our data also indicate that this procedure provides a better reproducibility of results than the conventional gravimetric or spectrophotometric methods.
Comparison of determinations of Si02 in tektites by various methods
Spectra-Tektite 1 Gravimetric 2 photo- Volatilization •
metric3
Bediasite B-6-- __________ ------------- 76. 4 76. 26 Bediasite B-50 ___________ ------------- 78. 4 78. 15 Bediasite B-85 ___________ ------------- 75. 7 75. 77 Bediasite B-86 ___________ ------------- 75. 4 75. 45 Synthetic bediasite 5 ST-L_ 76.47,76.27_ ------ 76.41,76.35 Synthetic bediasite 5 ST-2 __ 76. 19, 7f). 90_ ------ 76. 13 Synthetic australite 6 ST-3 __ 75. 90, 75. 44_ 75. 6 75. 30,75. 59 Synthetic australite 6 ST-4 __ 75. 89. 75. 60_ 75. 8 75. 85,75. 80 Synthetic aust.ra1ite6 STG-2_ 7 4. 9 5- - - - - - - 75. 2 74. 88
1 Naturnl-bediasite samples are from Lee County, 'l'cx. :.! Double dehydration with HCI plus recovery of SI02 from the R 20:J·
'3 Avernge of 6 determinations by the molybdenum-blue method. 4 Volatilization-formaldehyde procedure described in this report. 5 Prepared according to an average bediasite composition by Corning
Gla!-\S Co. 0 Prepared by Dr. Dean Chapman, Ame:s Research Center, Moffett
Field, Calif.
B-80 GEOLOGICAL SURVEY RESEARCH 1 9 6 2
31. USE OF La20a AS A HEAVY ABSORBER IN THE X-RAY FLUORESCENCE ANALYSIS OF SILICATE ROCKS
By HARRY J. RosE, JR., IsiDORE ADLER, and FRANCIS J. FLANAGAN, Washington, D.C.
The major problem in the development of an X-ray fluorescence method of analysis applicable to a wide variety of silicate rock types has been the matrix of the sample for analysis. For a number of reasons the problem is particularly great for the light elements. The X-ray fluorescence yield is lmv and the absorption by the detector is high. Further, these intensities can be altered considerably because of the large absorption coefficients for the light elements. Problems of absorption can be n1inimized in various ways such as by dilution of the sample, by the use of internal standardization, and by the use of a he~nry absorber as is described here.
To minimize interelement effects by the dilution method, a large diluent-to-sample ratio is required ·with a resultant loss in intensity that would interfere with the analysis of the light elements. Andermann (1961)
. and Claisse ( 1956) have discussed the heterogeneity of powdered samples even after long grinding periods and have indicated that one cannot reduce the particle size sufficiently to eliminate m.ineralogic differences from. sample to sample. For the same reasons, the mechanical addition of a heavy absorber to the dilution mixture fails to improve either linearity or scatter, serving only to decrease counting rates.
The internal standardization method has been treated comprehensively by Adler and Axelrod ( 195-5). The method requires the selection of an element as an internal standard that will be absorbed in the same way as the element to be analyzed. This technique works we.ll when one element, or even several, is involved, but the method would prove cumbersome for the analysis of a large number of elements.
Of the several methods of sample preparation, that of smoothing the surface of a finely powdered sample (Chodos and Engel, 1961) has the advantage of speed and simplicity but requires the use of sets of standards whose composition approximates that of the rocks to be analyzed. Although both their unknowns and standards were amphibolites, these authors did not report Si02 and AlzOa, the main constituents of silicate rocks, because of the poor precision of these detern1inations. Two considerations are important to the success of this method: The standards must be mineralogically similar to the samples to be analyzed, and all preparations must be of uniform particle size.
Claisse (1956) made borax fusions to eliminate mineralogic and particle-size effects and analyzed molded, fused buttons. To avoid problems of absorption he used a large flux-to-sample ratio to analyze
elements of intermediate atomic number where high intensities are available, but large dilutions cannot be tolerated for the light elements because of low intensities.
Andermann ( 1961) fused cement nnY mixes with an equal weight of lithium tetraborate and demonstrated the improvement of analyses of fused samples over those using powdered, unfused materials. The method is described as eliminating standardization by type of material but requires extensive calculations to correct for differences in composition~
Claisse ( 1956) mentioned the addition of a heavy element to the fusion mixture to produce a more absorbing glass. The addition causes some loss in intensity for the lighter elements but should minimize differences due to absorption.
Since samples to be analyzed might contain varying amounts of strongly absorbing elements, the effect of these elements might be minimized by introducing into the sample melt a strong absorber, an element of high atomic number, i1Yan amount such that the variation in concentration of absorbing elements in the unknown sample will not materially affect the overall absorption of .the pellet for the elements being determined. Lanthanum is a strong absorber, is readily available at a moderate price in the form of the oxide, and offers the least interference to the elements to be analyzed.
Several methods of preparation have been tried in this study. A set of six analyzed materials covering a range of silica usually found in rock analysis was prepared by each of three methods:. (1) One part of sample ground to 325 n1esh is mechanically mixed with four parts of boric acid; (2) 0.250 g of sample is fused with 1.250 g of Li2B40;; and (3) 0.250 g of sample is fused with 0.250 g of La203 and 1.000 g of Li:!B40 7 •
Fusions are made in graphite crucibles. After a preliminary heating at 750° C to remove CO:! and l-I2Q, the samples are fused at 1,000° C for 8 to 10 minutes. The cooled bead is 'Yeighed to determine loss on ignition of the sample and sufficient boric acid is added to bring the weight to 1.600 g. The bead and boric acid are ground together in a mixer-grinder to pass a 325-mesh screen. The boric acid serves as a binder in pressing a pellet and obviates differences in ignition losses from sample to sample. The samples are double pelleted with a boric acid backing as described by Rose and Flanagan (Art. 32).
The counting-rate data for Si02, CaO and Fe20 3 for each of the three preparations and duplicate determinations are plotted against concentration (fig. 31.1).
......
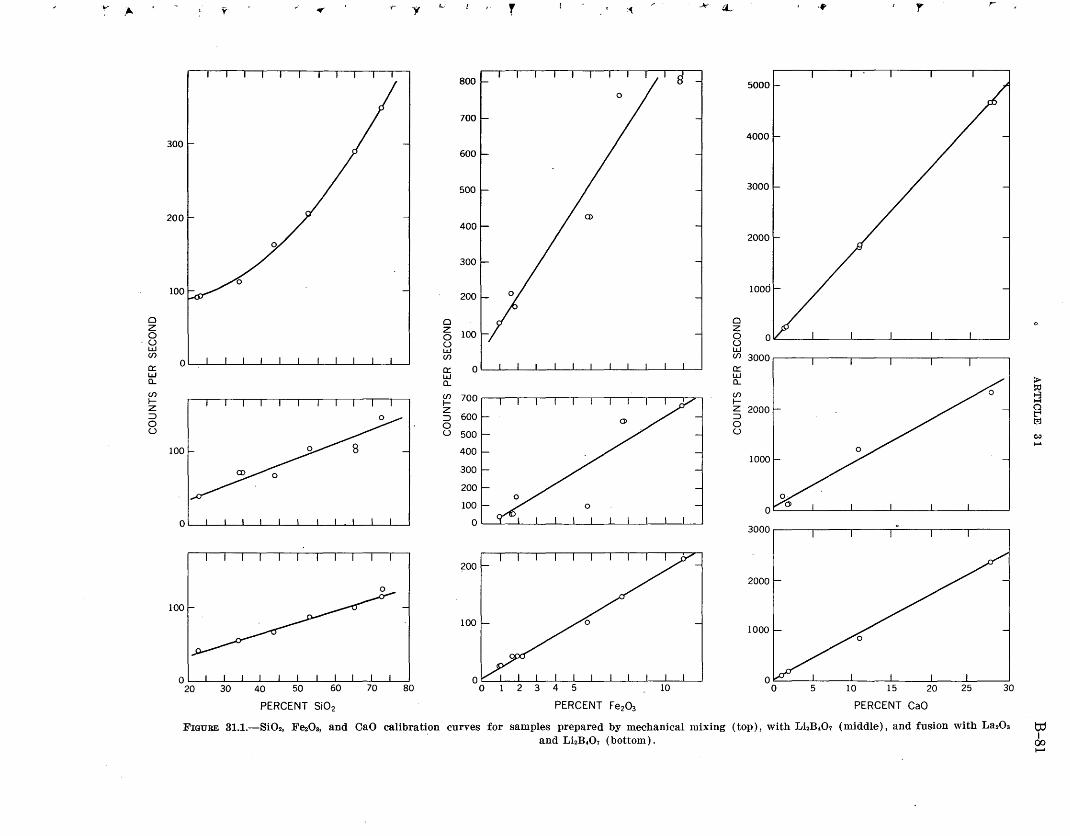
~ ,A. y T L.J r .A-' r y :~ (L ·f>' y .,.
Joor
1
, =~ I v l sooo
600 I 20J / J 50J I J ::::
"" a lOOd
~ z ~ 0 "" u a 0.. t)l z ~ lll. 5 § 0 6 I I I I I I I I I J ~ ~3000 u ,_ "" 0 z 0..
wo . 6 ~ ~ u ~2000r' ~ 0 ~ u ~ 0 t"4 ~
200 woo '"' '~I v ~ 0
3000
2000
100 1000
OL-~-L--L-~~--L--L~L-~~--L-~
20 30 40 50 60 70 80 10 5 10 15 20 25 30
PERCENT Si02 PERCENT Fe2~ PERCENT CaO
FIGURE 8l.l.-Si02, F~Oa, and CaO calibration curves for samples prepared by mechanical mixing (top), with Li2B,01 (middle), and fusion with La20a to and LhB.07 (bottom). ck
..........
B-82 GEOLOGICAL SURVEY RESEARCH ) 9 6 2
For samples mechanically mixed, the CaO data show excellent linearity over the range, the results for FezOa are scattered widely, and the data for SiOz are curvilinear. Although a linear curve may be drawn for Si02, the scatter of points for samples simply fused with Li 2B40 7 indicates that the calibnttion curves are of little value. The problem encountered in both of these preparations is the large absorption differences among the samples chosen.
The decrease in scatter and the improvement in the calibration lines when a heavy absorber, La20 3, is present can be seen in the curves. Minor problems remain of determining the optimum ra.t.io of La20 3 to Li2B 40 7
in the sample. The method, however, has been used to analyze successfully a variety of materials with results
agreemg within 1 percent of the che1nical determination.
REFERENCES
Adler, I. and Axelrod, J. M., 1955, Internal standards in fluorescent X-ray spectroscopy: Spectrochim. Acta, v. 7, p. 91-99.
Andermaun, George, 1961, Improvements in the X-ray emission analysis of cement raw mix: Anal. Chemistry, v. 33, p. 1689~ 1695.
Chodos, A. A., and Engel, C. G., 1961, Fluorescent X-ray spectrographic analysis of amphiuolite rocks: Am. Mineralogist, v. 46, p. 120-133.
Claisse, F., 1956, Accurate X-ray fluorescence analyses without internal standard: Department of Mines, Province of Quebec, Canada, P.R. 327,16 p.
32. X-RAY FLUORESCENCE DETERMINATION OF THALLIUM IN MANGANESE ORES
By HARRY J. RosE, JR. and FRANcr~ J. FLANAGAN, ·vvashington, D.C.
The X-ray spectrographic technique has been demonstrated as a useful tool for the determination of elenlents of geochemical interest (Adler and Axelrod, 1955, Axelrod and Adler, 1957). The determination of thallium is required occasionally, but the chemical procedure is frequently con1plicated by interference from geochemically rela.ted elements. A rapid X-ray spectrographic method for determining thallium in manganese ores has been developed that requires 100 mg (milligrams) of sample. vVhile the method described will determine thallium down to 100 ppm (parts per 1nillion), the present study indicates that as little as 10 ppm can be detected. As in most X-ray fluorescent n1ethods, the prepared samples and standards are not destroyed during the analysis and may be used for further study.
A set of synthetic standards is prepared by dilution of pure thallous nitrate with a 1nixture containing 90 percent manganese dioxide and 10 percent ferric oxide. By successive dilution of the thallous nitrate the composition of the standa.rd approximates the major constituents of the sample to be analyzed. Each dilution mixture is ground in an agate mortar to pass a 325-mesh screen. The standards in this study cover a range from 0.01 to 1.00 percent thallium.
The sample is ground to pass a 325-mesh screen. One hundred milligrams of the sample or standard is mixed with 900 mg of H3BOa in an agate mortar until homogeneous. The mixture is then pressed into a pellet 1 inch in diameter. For additional strength the pellet is prepared as a double layer by lightly pressing approximately 1 gram of H3BO:~ in the mold and then adding the sample-boric acid mixture onto this pellet in the mold before final pressure is applied. Sample numbers and other data may be written in ink on the smooth face of the boric acid backing, and the pellets thus formed may be stored indefinitely in pill boxes for future use. Dilution a.t this level tends to minimize interelement effects.
The instnunent consists of a two-channel fluorescent air-path X-ray spectrometer (Adler and Axelrod, 1953) with lithium fluoride analyzing crystals. l(ryptonhalogen filled Geiger counters are used ·with simultaneous counting by scalers operating in parallel. A tungsten target X-ray tube is operated at 50 kilovolts and 20 milliamperes. Two measurements are made: the time required to accumulate 10,000 counts for the Tl La line, a,nd the nmnber of counts recorded for the background position dbring this interval.
.. t.
l, )
J
ARTICLE 33 B-83
The .intensity of the background line at 33.30° 20 is subtracted from. the intensity of the Tl La ljne at 34.87° 20. A strnight-line calibra,tion curve is obtained over the range of 0.01 to 1.00 percent. thallium. The table below gives the data obtained on five samples analyzed by this method and the chemical values obtained by Cuttittn, (1961).
Scml7>le ! _____________________ _ 2 _____________________ _ 3 _____________________ _ 4 _____________________ _ 5 _____________________ _
X-ray
0. 23 . 34 . 07 . 02 . 28
Thalli1tm (percent)
0. 24 . 36 . 073 . 017 . 27
Chemical
0. 20 . 37 . 067 . 017 . 27
0. 24 . 38 . 070 . 017 . 30
The X-ray results were obtained by com1ting each standard and SHJnple twice :in a randmn order. The standard deviation of a single observation calculated from the duplicate net-counting rates for samples and standa.rds is 0.31 counts per second, equivalent to 0.005 percent Tl. The speed of the method may be demonstrated by the time necessary to prepare the pellets and count the set of fi.ve samples. Results on these samples were obtained within 4 hours, including the preparation of the standn.rds.
For samples having a concentration of thalliun1 an order of ma.gnitude lower than the values given above, it is possible to extend the lower limit of detection by reducing the amount of boric acid to be added to the samples and standards. However, problems of absorption become more critical as the proportion of diluent is reduced. vVhile the determination of thallium described herein was applied to manganese ores, the method can easily be adapted to other materials or elements of geochemical interest by preparing a set of standards whose matrix is similar to that of the material to be analyzed .
REFERENCES
Adler, Isidore, and Axelrod, J. l\f., 1953, A multi-wavelength fluorescence svectrometer: Opt. Soc. America Jour., v. 43, p. 769-772.
--1955, Determination of thorium by fluorescent X-ray S])ectrometry: Anal. Chemistry, v. 27, p. 1002-1003.
Axelrod, .J. :M., and Adler, Isidore, 1957, X-ray spectrographic determination of ce:;ium and rubidium: Anal. Chemistry, v. 28, p. 1280-1281.
Cuttitta, !!"rank, 1961, Dithizone mixed-color method for determining small amotmts of "thallium in manganese ores: Art. 290 in U.S. Geol. Survey Prof. Paver 424-C, p. C384-C385.
OCEANOGRAPHY
33. ELECTRODE DETERMINATION OF THE CARBON DIOXIDE CONTENT OF SEA WATER AND DEEP-SEA SEDIMENT
,>- By G. V\T. l\1oOim, C. E. RoBERSON, and H. D. NYGREN, l\1enlo Park, Calif., and U.S. Coast and Geodetic
~·
Survey, Washington, D.C.
Wo1·k done in COOlJeration wUh the U.S. Coast and Geodetic Su.rVf?Y
The Pco2 (partial pressure of carbon dioxide) was determined :in samples of water and sediment in the North Paci.fic using a Pco2 electrode originally designed for medical studies of human blood. This work was done aboard the U.S. Coast and Geodetic Survey 'ship Pionee'r :in September and October 1961 as part of a general investigation of the geochemistry of deep-sea sedirnent. The determ.inations compare favorably with theoreticnJ caJculations and provide new data on the distribution. of carbon dioxide in the North Pacific.
The Severinghaus P co2 electrode incorporates the glass-electrode principle (Severinghaus and Bradley, 1958). The instrument consists of a glass-calomel electrode pair mounted in a bicarbonate solution n.nd separated from the sample to be measured by a thin 'refton membrane (fig. 33.1). The nl.embrane permits passage of carbon dioxide molecules from the smnple into the bicarbonate solution while excluding ions that might alter the pl:I of the solution. Carbon dioxide from the sample pass~s through the Teflon 1nembrane
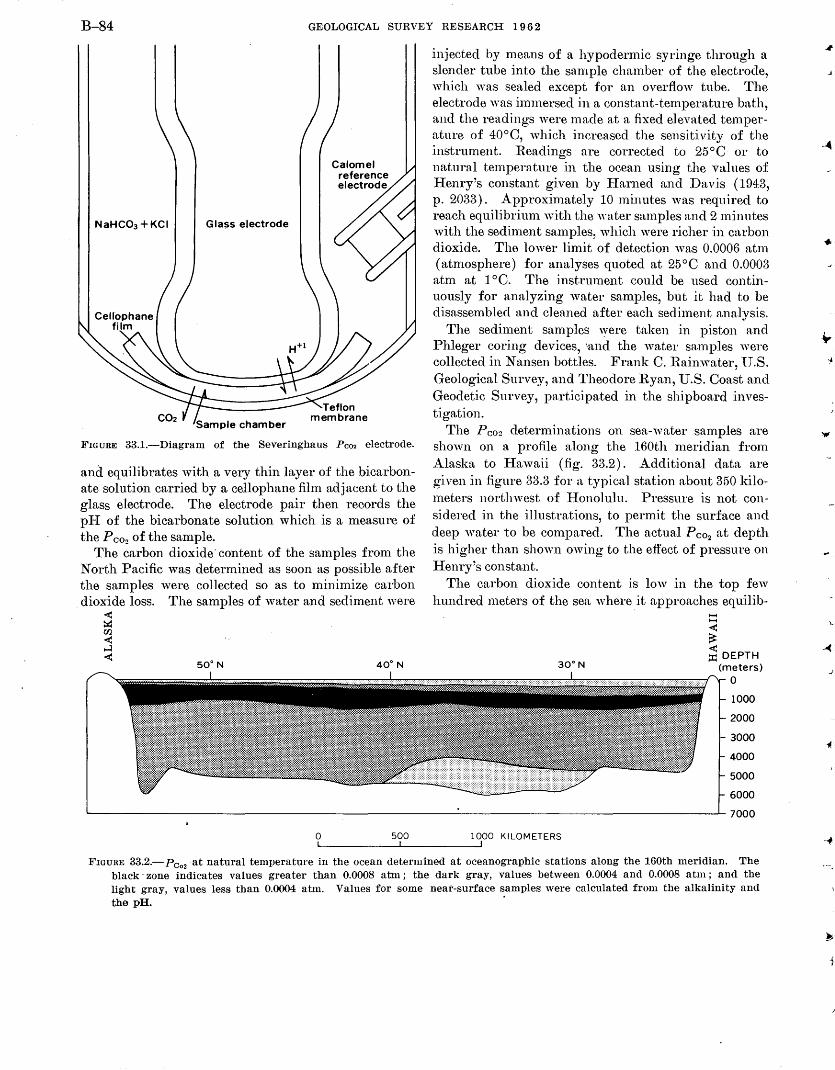
B-84 GEOLOGICAL SURVEY RESEARCH 1 9 6 2
NaHC03 +KCI Glass electrode
FIGURE 33.1.-Diagram of the Severinghaus Pco2 electrode.
and equilibrates with a very thin .layer of the bicarbonate solution carried by a cellophane film adjacent to the glass electrode. The electrode pair then records the pii of the bicarbonate solution which is a rneasure of the P co2 of the sample.
The carbon dioxide' content of the samples from the North Pacific was determined as soon as possible after the samples were collected so as to minimize carbon dioxide loss. The samples of water and sediment were
< ~ en < ~ <
0 500
injected by means of a hypodermic syringe through a slender tube into the sample chamber of the electrode, which ·was sealed except for an overflow tube. The electrode was immersed in a constant-temperature bath, and the readings were made at a fixed elevated temperature of 40°C, which increased the sensitivity of the instrument. Readings are corrected to 25°C or to natural temperature in the ocean using the values of Henry's constant given by Harned and Davis ( 1943, p. 2033). Approximately 10 minutes was required to reach equilibrium with the water samples and 2 minutes with the sediment samples, which were richer :in carbon dioxide. The lower limit of detection was 0.0006 atm (atmosphere) for analyses quoted at 25°C and 0.0003 atm at 1 °C. The instrument could be used continuously for analyzing water samples, but it had to be disassembled and cleaned after each secbment analysis.
The sediment samples 'yere taken in piston and Phleger coring devices, 'and the water samples were collected in Nansen bottles. Frank C. Rainw·ater, lJ.S. Geological Survey, and Theodore Ryan, U.S. Coast and Geodetic Survey, participated in the shipboard investigation.
The Pco2 determinations on sea-water samples are shown on a profile along the 160th meridian from Alaska to Hawaii (fig. 33.2). Additional data are given in figure 33.3 for a typical station about 350 kiloJneters northwest of :Honolulu. Pressure is not considered in the illustrations, to permit the surface and deep water to be compared. The actual Pco2 at depth is higher than shown owing to the effect of pressure on flenry's constant.
The carbon dioxide content is low in the top few hundred meters of the sea where it approaches equilib---< :::
30"N ~DEPTH
(meters) 0
1000
2000
3000
4000
5000
6000
7000
1000 KILOMETERS
FrounE 33.2.-Pc02
at natural temperature in the ocean determined at oceanographic stations along the 160th meridian. The black· zone indicates values greater than 0.0008 atm; the dark gray, values between 0.0004 and 0.0008 atm; and the light gray, values less than 0.0004 atm. Values for some neat-surface samples were calculated from the alkalinity and the pH.
j
•
\.
_, ,
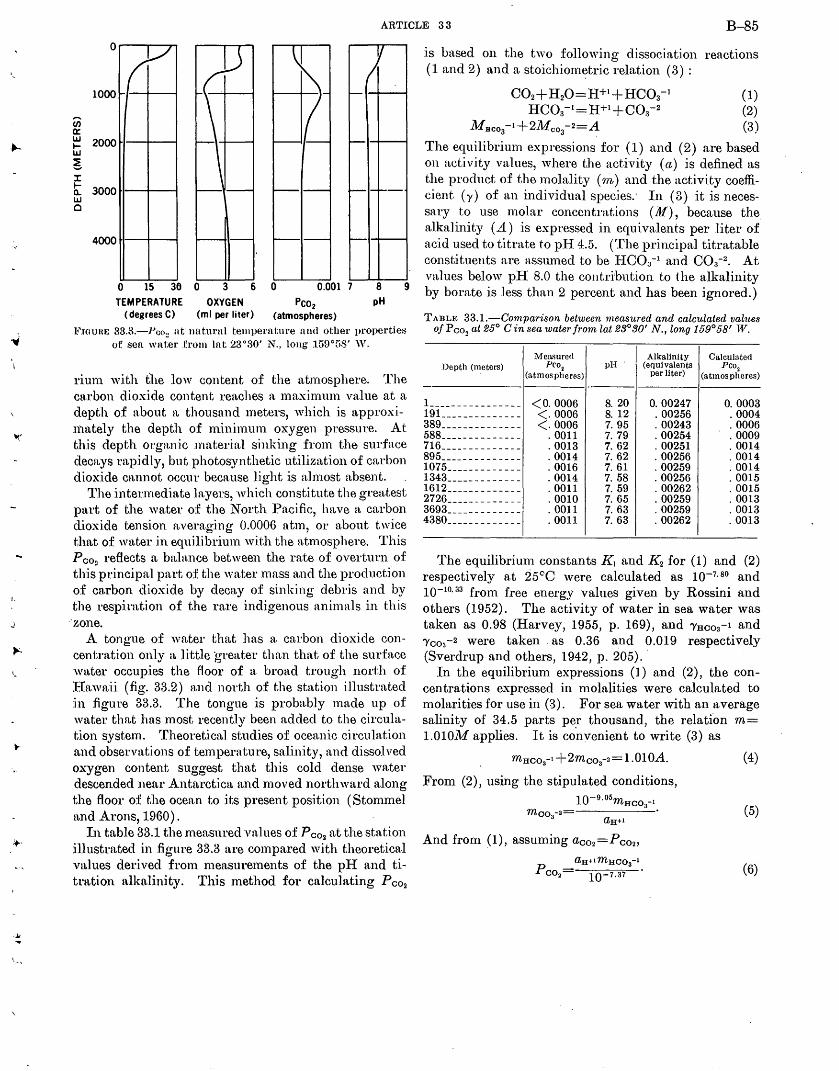
'
....
L
J
\.,
ARTICLE 33 B-85 0 rr
1000
<n 0:: w 2000 1-
\ \
I v
I -
w ~ J: 1-
3000 Q. w c
4000 1-l-~1----1
0 15 36 0 6 0 0.001 7 8 9
TEMPERATURE OXYGEN Pco2 pH (degrees C) (ml per liter) (atmospheres)
l~'IGUHE 33.3.-Pco:! nt unturnl temperature and other properties o.f sen wnt:er from lnt 23°30' N., long 159°58' W.
r:ium with the low content of the atmosphere. The carbon dioxide content reaches a maximum value at a depth of about a. thousand meters, which is approxin1ately the depth of minimum oxygen pressure. At this depth orga.Iric material sinking from the surface decays rapidly, but photosynthetic utilization of carbon dioxide cn.nnot occur because light :is almost absent.
The interJnedin.te layers, which constitute the greatest part of the water of the North Pacific, ha. ve a carbon dioxide tension a.verag.ing 0.0006 atm, or about twice that of water in equilibrium with the atmosphere. This P 002 reflects 11 balance between the rate of overturn of this pr.incipa.] part o:f the water mass a,nd the production of ca.rbon dioxide by decay of sinking debris and by the respiration of the rare indigenous animals in this
·'zone. A tongue of water thn.t has a carbon dioxide con
centration only a. little 'gl'eater than that of the surface wa.ter occupies the :floor of a broad trough north of IIn.wn.ii (fig. 33.2) and north of the station illustrated :in :figure 33.3. The tongue is proba.bly made up of wn,ter that has most recently been added to the circulation system. Theoretical studies of oceanic circulation and obsel'vat.ions of temperature, salinity, and dissolved oxygen content suggest that this cold dense water descended near Antarctica and moved northward along the floor of the ocean to its present position ( Stommel and Arons, 1960).
In table 33.1 the 1neasured values of Pc02 a.t the station illustrated in figure 33.3 are compared with theoretical values derived from measurements of the pH and titru.tion alkalinity. This n1ethod for calculating P co2
is based on the two following dissociation reactions ( 1 and 2) and a stoichiom~tric relation ( 3) :
C02+H20=H+1+HC03-1 (1)
HC03- 1=H+1+C03- 2 (2) Muco3- 1+2Mco
3-2=A (3)
The equilibrium expressions for (1) and (2) are based on activity values, where the activity (a) is defined as the product of the molality (1n) and the activity coefficient ( y) of an individual species: In (3) it is necessary to use molar concentrations (JJ/), because the alkalinity (A) is expressed in equivalents per liter of acid used to titrate to pH 4.5. (The principal titratable constituents are assmned to be fiC03- 1 and C03- 2 • At values below pH 8.0 the contribution to the alkalinity by borate is less than 2 percent and has been ignored.)
TABLE 33.1.-Comparison between measured and calculated values ofPco2 at 25° Cinsea water from lat 23°30' N., long 159°58' W.
.Measured Alkalinity Calculated Depth (meters) Pco
2 pH (equivalents Pco2
(atmospheres) per liter) (atmospheres)
1 ________________ <O. 0006 8. 20 0. 00247 0. 0003 191 ______________ <. 0006 8. 12 . 00256 . 0004 389 ______________ <· 0006 7. 95 . 00243 . 0006 588 ______________ . 0011 7. 79 . 00254 . 0009 716 ______________ . 0013 7. 62 . 00251 . 0014 895 ______________ . 0014 7. 62 . 00256 . 0014 1075 _____________ . 0016 7. 61 . 00259 . 0014 1343 _____________ . 0014 7. 58 . 00256 . 0015 1612 _____________ . 0011 7. 59 . 00262 . 0015 2726 _____________ . 0010 7. 65 . 00259 . 0013 3693 _____________ . 0011 7. 63 . 00259 . 0013 4380 _____________ . 0011 7. 63 . 00262 . 0013
The equilibrimn constants K 1 and K 2 for (1) and (2) respectively at 25cC were calculated as 10-7· 80 and 10-10
· 33 frmn free energy values given by Rossini and
others (1952). The activity of water in sea water was taken as 0.98 (Harvey, 1955, p. 169), and 'YHco3-I and 'Yco3-2 were taken . as 0.36 and 0.019 respectively (Sverdrup and others, 1942, p. 205). ·
In the equilibrium expressions (1) and (2), the concentrations expressed in n1olalities were calculated to n1olarities for use in (3). For sea water with an average salinity of 34.5 parts per thousand, the relation m= 1.010M applies. It is co'nvenient to write (3) as
mHco3-t +2mco3-2= 1.010A.
From (2), using the stipulated conditions, 10-9 ·05mHco
3-l
And fron1 (1), assuming aco2=Pco2 ,
aH+i mHcoa-1 l0-7.37
(4)
(5)
(6)
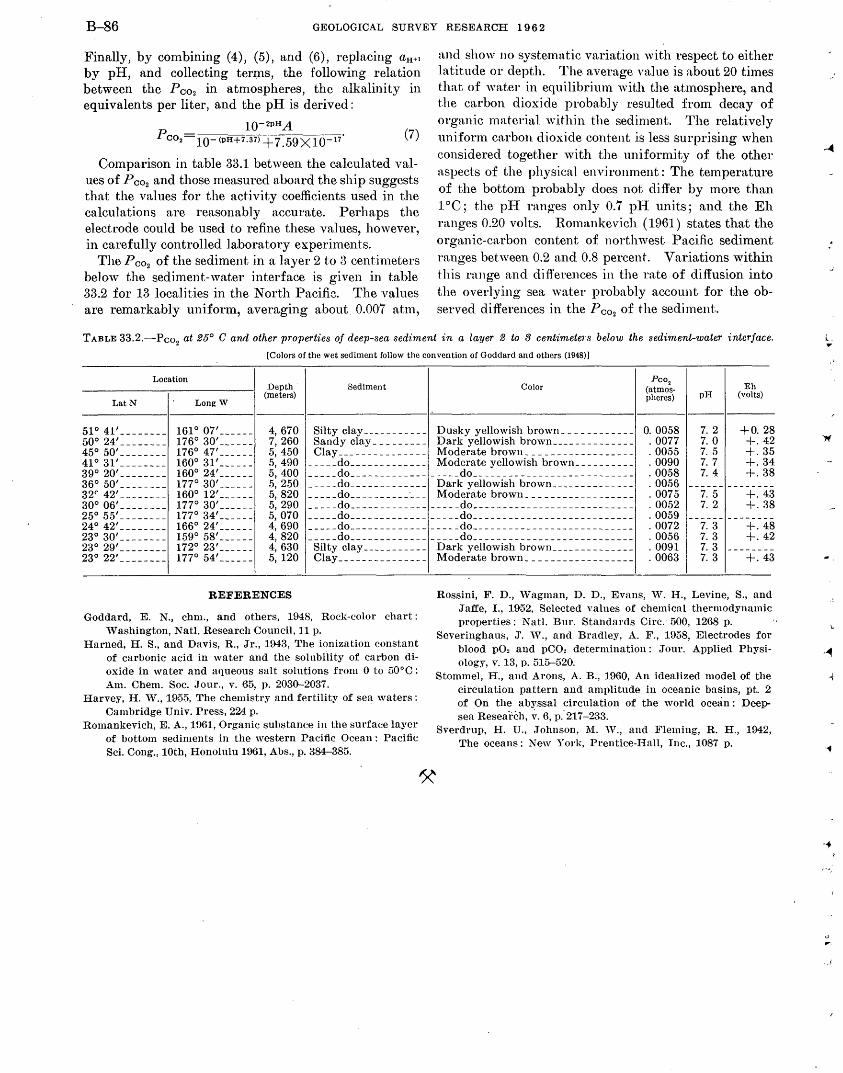
B-86 GEOLOGICAL SURVEY RESEARCH 1 9 6 2
Finally, by combining (4), (5), and (6), replacing aH+l
by pH, and collecting tern1s, the following relation between the Pco2 in atmospheres, the alkalinity m equivalents per liter, and the pH is derived:
10-2pHA Pco2= 10- <PH+7.a7> +7.59x 10⁻¹¹ (7)
Comparison in table 33.1 between the calculated values of P co2 and those measured aboard the ship suggests that the values for the activity coefficients used in the calculations are reasonably accurate. Perhaps the electrode could be used to refine these values, however, in carefully controlled laboratory experiments.
The p C02 of the sediment in a layer 2 to a centimeters below the sediment-water interface is given in table 33.2 for 13 localities in the North Pacifi~. The values are remarkably uniform, averaging about 0.007 atm,
and show no systematic variation with respect to either latitude or depth. The average value is about 20 times that of ·water in equilibrium with the nt1nosphere, and the carbon dioxide probably resulted from decay of organic material within the sediment. The relatively uniform carbon dioxide content is less surprising when considered together with the uniformity of the other aspects of the physical environment: The temperature of the bottom probably does not differ by more than 1 oc; the pH ranges only 0.7 pl-I units; and the Eh ranges 0.20 volts. Romankevich ( 1961) states that the organic-carbon content of northwest Pacific sediment ranges between 0.2 and 0.8 percent. Variations within this range and differences in the rate of diffusion into the overlying sea water probably account for the observed differences in the P co2 of the sediment.
TABLE 33.2.-Pc02 at 25° C and other properties of deep-sea sediment in a layer 2 to 3 centimeters below the sediment-water interface.
[Colors of the wet sediment follow the convention of Goddard and others (1948)]
Location
LatN Long W
51° 41'--------500 24' --------450 50'--------41° 31'--------390 20'--------36° 50'--------32" 42' --------300 06' --------250 55'--------240 42' --------230 30' --------230 29' --------230 22' --------
161 ° 07,- - - - - -176° 30' _____ _ 176° 47' _____ _ 160° 31' _____ _ 160° 24' ------177° 30' _____ _ 160° 12' _____ _ 177° 30' _____ _ 177° 34' _____ _ 166° 24' _____ _ 159° 58'------1720 23' ------177° 54'------
Depth (meters)
4, 670 7, 260 5, 450 5, 490 5, 400 5, 250 5, 820 5, 290 5,070 4, 690 4, 820 4, 630 5, 120
REFERENCES
Sediment Color
Silty clay ___________ Dusky yellowish brown ___________ _ Sandy clay _________ Dark yellowish brown _____________ _ Clay_______________ Moderate brown _________________ _
_ ____ do _____________ Moderate yellowish brown _________ _ _____ do __________________ do __________________________ _ _____ do_____________ Dark yellowish brown _____________ _ _ ____ do __________ ·___ Moderate brown _________________ _ _ ____ do __________________ do __________________________ _ _ ____ do __________________ do __________________________ _ _ ____ do __________________ do __________________________ _ _____ do __________________ do __________________________ _ Silty.clay ____ _ _ _ _ _ _ _ Dark yellowish brown _____________ _ Clay_______________ Moderate brown _________________ _
Pco2
(atmospheres)
0. 0058 . 0077 . 0055 . 0090 . 0058 . 0056 . 0075 . 0052 . 0059 . 0072 . 0056 . 0091 . 0063
pH Eh
(volts)
7. 2 +O. 28 7. 0 +. 42 7. 5 +. 35 7. 7 +. 34 7. 4 +. 38
7. 5 +. 43 7. 2 +. 38
7. 3 7. 3 7. 3 7. 3
+. 48 +. 42
+. 43
Goddard, E. N., chm., and others, 1948, Rock-color chart : \Vashington, Natl. Research Council, 11 p.
Rossini, F. D., \Vagman, D. D., Evans, \V. H., Levine, S., and Jaffe, I., 1952, Selected values of chemical thermodynamic properties: Natl. Bur. Standards Circ. · 500, 1268 p.
Severinghaus, J'. \V., and Bradley, A. F., 1958, Electrodes for blood p02 and pC02 determination: Jour. Applied Physiology, v. 13, p. 515-520.
Harned, H. S., and Davis, R., Jr., 1943, 'l'he ionization constant of carbonic acid in water and the solubility of carbon dioxide in water and aqueous salt solutions from 0 to 50°C: Am. Chern. Soc .. Jour., v. ·65, p. 2030-2037.
Harvey, H. W., 1955, The chemistry and fertility of sea waters: Cambridge Univ. Press, 224 p.
Romankevich, E. A., 1961, Organic substance in the surface layer of bottom sediments in the western Pacific Ocean: Pacific Sci. Cong., lOth, Honolulu 1961, Abs., p. 384-385.
Stommel, H., and Arons, A. B., 1960, An idealized model of the circulation pattern and amplitude in oceanic basins, pt. 2 of On the abyssal circulation of the world ocean : Deepsea Reseai;ch, ~- 6, p."217-233.
Sverdrup, H. U., Johnson, l\1. "r., and Fleming, R. H., 1942, The oceans: New Yorl\:, Prentice-Hall, Inc., 1087 p.
.. . ...
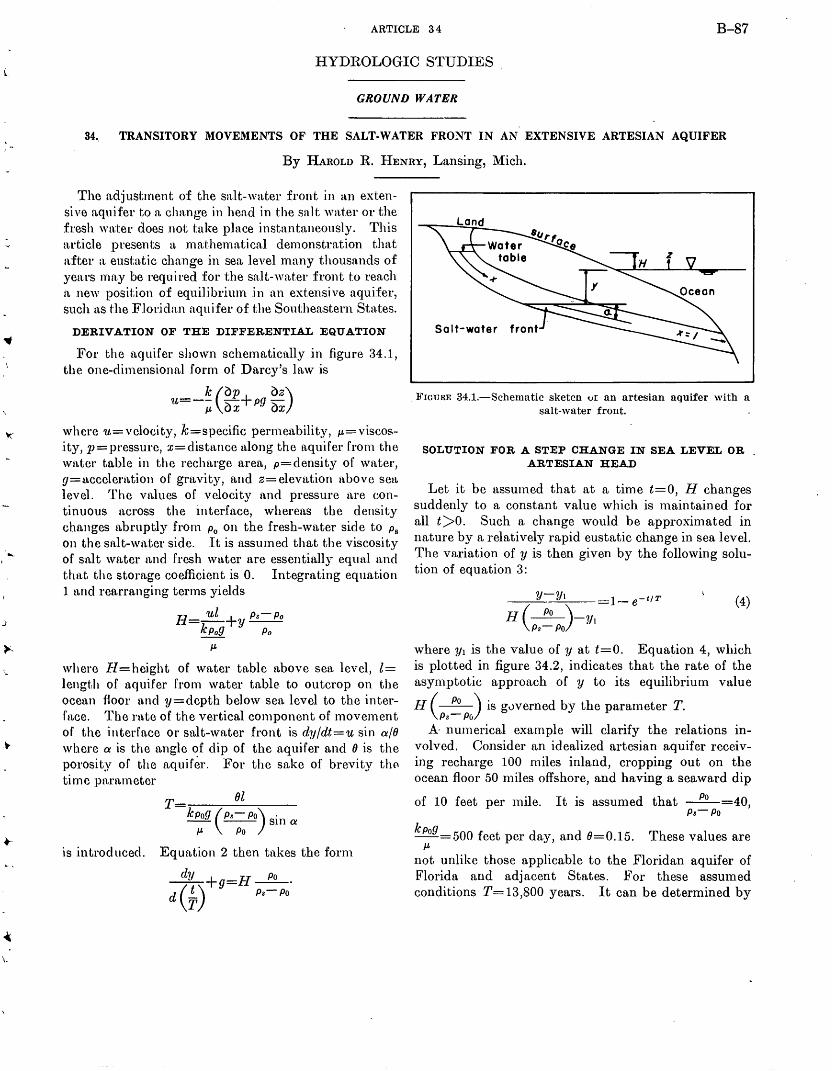
J
\.
ARTICLE 34 B-87
HYDROLOGIC STUDIES
GROUND WATER
34.. TRANSITORY MOVEMENTS OF THE SALT-WATER FRONT IN AN EXTENSIVE ARTESIAN AQUIFER
By HAROLD R. HENRY, Lansing, Mich.
The adjustment of the salt-water front in an extensive aquifer to a change in head in the salt water or the fresh water does not take place instantaneously. This article presents a mathematical demonstration that after a. eustatic change in sea level many thousands of years rrlfi.y be required for the salt-water front to reach a new position of equilibrium in an extensive aquifer, such fLS t:he Flor.idan aquifer of the Southeastern States.
DERIVATION OF THE DIFFERENTIAL EQUATION
For the aquifer shown schematically in figure 34.1, the one-dimensional form of Darcy's law is
u= -~ cop+ pg oz) J.L ox . ox
where u=velocity, k=specific permeability, J.L=viscosity, JJ=pressure, x=distn,nce along the n.quifer from the Witter table in the rechttrge area, p=density of Witter, g=nccelenttion of grnvity, and z=elevation ltbove sett level. The values of velocity and pressure nre continuous lteross the interfnce, whereas the density changes nbruptly from Po on the fresh-water side to p8
on the Sttlt-wlit.er side. It is nssumed that the viscosity of St1lt water and fresh water are essentially equnl and thn.t the storage coefficient is 0. Integrating equation 1 nnd rearranging terms yields
1'3_ ul + Ps- Po 7..--- y--
kpog Po
J.L
where fl=height of water table above sea level, l= length of nquifer from water table to outcrop on the ocm1.n floor and y=deptb below sea level to the interfu.ce. The rttte of the vertical component of movement of the interface or Stilt-water front is dyfdt=u sin a/8 where a is the nngle of dip of the aquifer and 8 is the porosity of the ttquifer. For the snke of brevity thf' tirne pttrameter
T 8l kpog cps- Po) sin a
J.L Po
is introduced. Equation 2 then tttkes the form
dy + -H Po -- g- --· d (T) Ps-Po
l!"'IGURE 34.1.-Schematic sketcn ur an artesian aquifer with a salt-water front.
SOLUTION FOR A STEP CHANGE IN SEA LEVEL OR ARTESIAN HEAD
Let it be assumed that at a time t=O, H changes suddenly to a constant value which is rnaintained for all t>O. Such a change would be approximated in nature by a relatively rapid eustntic change in sea level. The variation of y is then given by the following solution of equation 3:
1-e-tiT (4)
where Yt is the value of y at t=O. Equation 4, which is plotted in figure 34.2, indicates that the rate of the asymptotic appronch of y to its equilibriurn value
H (__!!!!___) is g0verned by the parameter T. Ps-Pu
A· numerical example will clarify the relations involved. Consider an idealized artesian aquifer receiving recharge 100 miles inland, cropping out on the ocean floor 50 miles offshore, and having a seaward dip
of 10 feet per mile. It is assumed that __EQ__=40, Ps-Po
kpog =500 feet per day, and 8=0.15. These values are J.L
not unlike those applicable to the Floridan aquifer of Florida and adjacent States. For these assumed conditions T= 13,800 years. It can be determined by
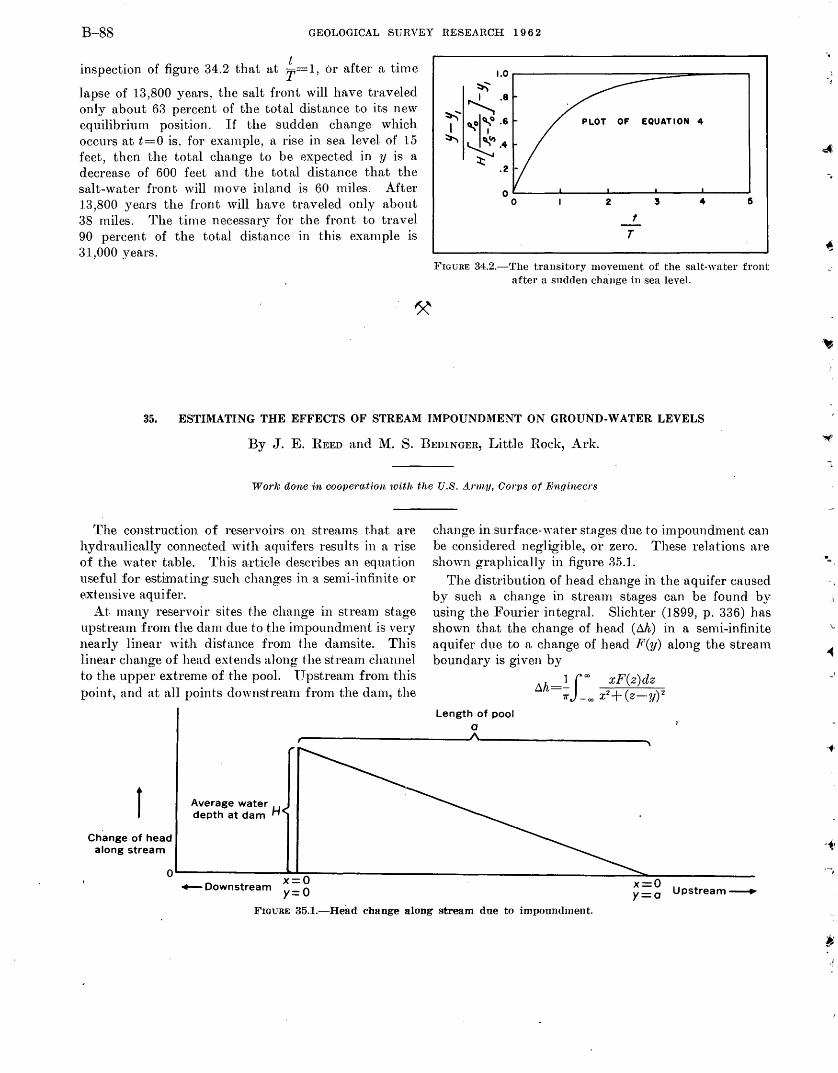
B-88 GEOLOGICAL SURVEY RESEARCH 1 9 6 2
inspection of figure 34.2 that at ~= 1, or n.fter a time
lapse of 13,800 yen.rs, the snit front will have traveled only about 63 percent of the total distn.nce to its new equilibrium position. If the sudden change which occurs at t=O is, for exn.mple, a rise in sea level of 15 feet, then the totn.l change to be expected in y is a decrease of 600 feet n,nd the total distance that the salt-water front will move inland is 60 miles. After 13,800 years the front will hn.ve traveled only about 3'8 miles. The time necessary for the front to travel 90 percent of the total distance in this example is 31,000 years.
PLOT OF EQUATION 4
0~----~----~------~-----L----~ 0
FIGURE 34.2.-The transitory movement of the salt-water front after a sudden cha.nge in sea level.
35. ESTIMATING THE EFFECTS OF STREAM IMPOUNDMENT ON GROUND-WATER LEVELS
By J. E. REED and M. S. BEDINGER, Little R.ock, Ark.
Work done in coope·ra.tio·n wUh the U.S. A.nny, Corps of Nnginecrs
The construction of reservoirs on streams that are hydraulically connected with aquifers results in a rise of the water table. This article describes an equation useful for estimating such changes in a semi-infinite or extensive aquifer.
At many reservoir sites t.he change in stream stage upstream from the dam due to the impoundment is very nearly linear 'vith distance from the damsite. This linear change of head extends along the stream channel to the upper extreme of the pool. lJpstream fron1 this point., and at all points downstream from the dam, the
r Change of head
along stream
Average water H depth at dam
change in surface-\Yater stages due to impoundment can be considered negligible, or zero. These relations are shown graphically in figure 35.1.
The distribution of head change in the aquifer caused by such a change in stream stages can be found by using the Fourier integral. Slichter (1899, p. 336) hn.s shown that the change of head (!1h) in a semi-infinite aquifer due to a change of head F(y) along the stream boundary is given by
Length of pool a
!1h=~J"' xF(z)dz 7r -"' xz+ (z-y)z
o~----------~x~=~O~------------------------------------~~~-----------+-Downstream y-- 0 x=O
y=a Upstream----.
FIGURE 35.1.-Head change· along stream due to impoundment.
\.
_,
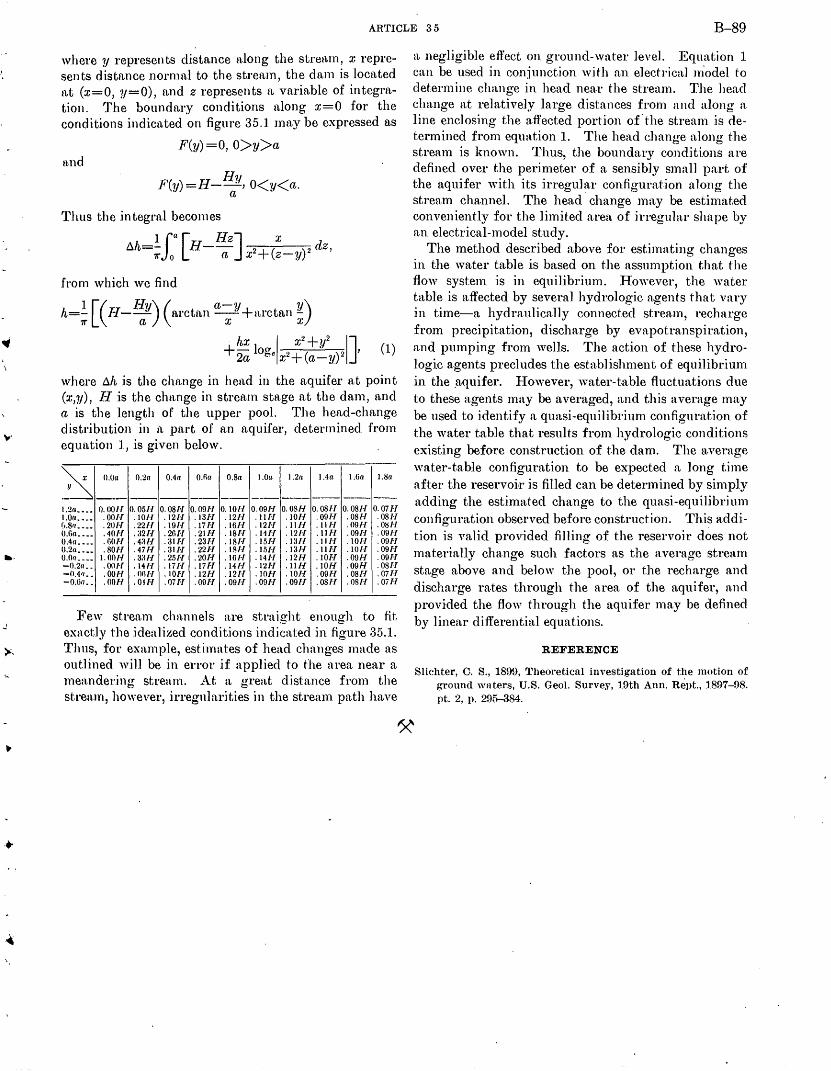
..!
>-
...
ARTICLE 35 B-89
where y represents distance along the strenm, x represents distn.nce norrnn.l to the stream, the dam is located n.t (x=O, y=O), n.nd z represents n variable of integration. The boundary conditions along x=O for the conditions indicn.ted on figure 35.1 mn.y be expressed as
F(y)=O, O>y>a tl.nd
Thus the in tegrn.l becomes
1ia [ liz] X ~h=- H-- 2+( ) 2 dz, 1r o a x z-y
from which we find
h=~ [ (r-1-1!Y) (arctan ax Y +arctan~)
hx I x2+y2 IJ +-lo<"r . ' 2a ee x2+ (a-y)2
(1)
where ~h is the chn.nge in hen.d in the aquifer at point (x,y), l-1 is the change in stren.m stage at the dam, and a, is the length of the upper pool. The head-change distribution in it part of an n.quifer, determined from equn.tion 1, is given below.
~ ().()(1 0.2ll 0.4ll O.fia O.Sa I.Oa. 1.2a I.4a 1.6a I. Sa
1.211 •••• 0.00/T O.OSH 0. OSH 0. 09H O.IOH 0.09H 0. OSJ-1 0.08/1 O.OSH 0. 07ll 1.011 •••• .001-l .lOH . 12/-/ .13H . 12!-l .lifT .JOH .09/f .OSH .OSH (1.811 •••• .20H .22fT .l9H .17H .16H .12H .III-I . 1l T-1 .09H .O~H o.na •••• .40H .:12H . 2(',ff .211-l . ISH .11/f .121-l .till .09H .09H 0.4ll •••• .GOff .4:UJ .31H . 23fT . ]8/-/ . ISH .13f/ .111-l .IOH .OfJH ll.2n •••• .SOH . 47 fl . :ill1 .22fT . ISH .lfjJ-l .13/l .llH .lOl-l .09H O.Orr •••• I.OOH . 3:111 . 2M! .20fT . Hll-l .141-l .12fT .10H .091-l .091-l -0.2a •. .OOH .14/J .17/-/ .17fT .14/f .12/J .llH .101-l .091-l .08H -OA't •• .OOfl . Oil£·/ .IOH . 12/J .12!/ .lOH .10/J . 09f/ .OSfl .071-l -o.na .. .OOH .OIH .Oil-l .09/f .09H .091-l .09/I .OSH .081-l .OiH
Few stren.m channels are straight enough to fit exactly the .idealized conditions indicated in figure 35.1. Thus, for example, estimates of head changes made as outlined will be in error if applied to the area near a meandering stream. At a great distance from the stream, however, irregularities in the stream path have
tt negligible effect on ground-water level. Equation 1 can be used in conjunction with an electrical n1odel to determine change in head near the stream. The head change at relatively large distances from and along n. line enclosing the affected portion of· the stream is determined from equation 1. The head change along the stream is known. Thus, the boundary conditions are defined over the perimeter of a sensibly small part of the aquifer with its irregular configuration along the stream channel. The head change may be estimated conveniently for the limited area of irregular shape by an electrical-model study.
The method described above for estimating changes in the water table is based on the assumption that the flow system is in equilibrium. However, the water table is affected by several hydrologic agents that vary in time-a hydraulically connected stream, recharge fron1 precipitation, discharge by evapotranspiration, and pumping from wel1s. The action of these hydrologic agents precludes the esta.b1ishment of equilibrium in the _aquifer. However, water-table fluctuations due to these agents may be averaged, and this average may be used to identify a qua.si-equilibrium configuration of the water table that results from hydrologic conditions existing before construction of the dam. The ~tverage water-table configuration to be expected a long time after the reservoir is filled can be determined by simply adding the estimated change to the quasi-equilibrium configuration observed before construction. This addition is valid provided filling of the reservoir does not materially change such factors as the average stream stage above and below the pool, or the recharge and discharge rates through the area of the aquifer, and provided the flow through the aquifer may be defined by linear differential equations .
REFERENCE
Slichter, C. S., 1899, Theoretical investigation of the motion of ground wnters, U.S. Geol. Survey, 19th Ann. Rept., 1897-98. I)t. 2, p. 295-384 .
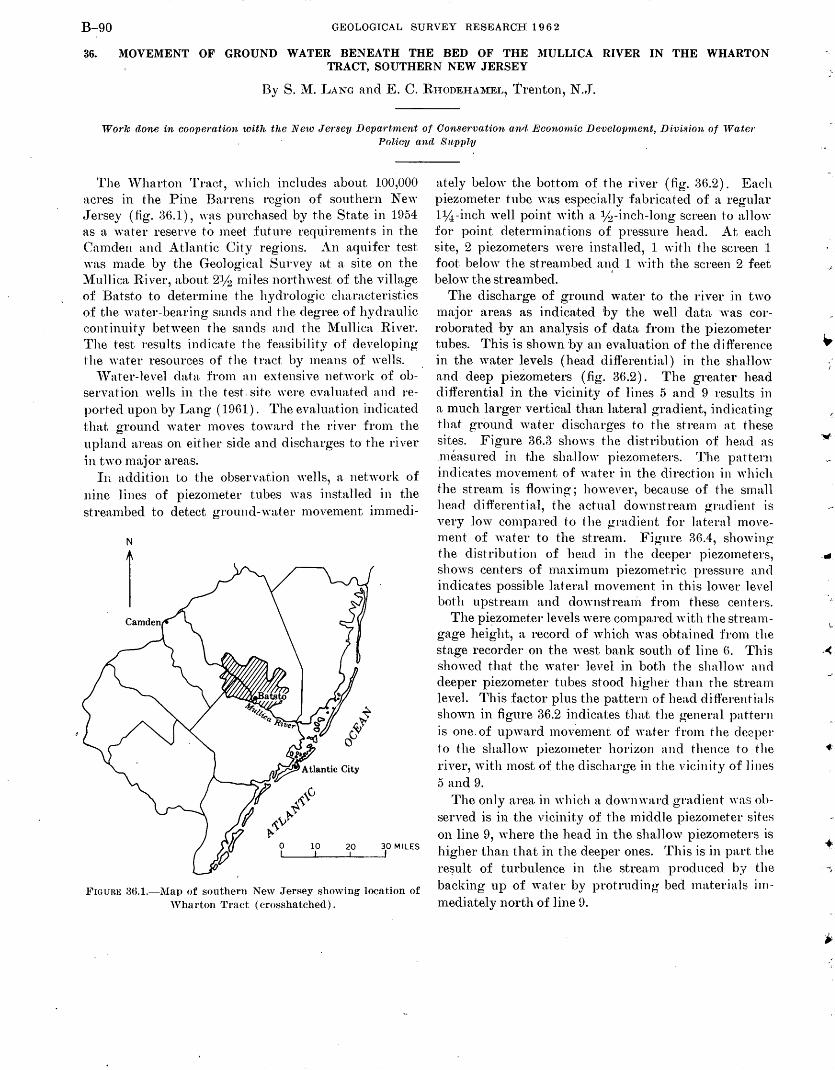
B-90 GEOLOGICAL SURVEY RESEARCH 1 9 6 2
36. MOVEMENT OF GROUND WATER BENEATH THE BED OF THE MULLICA RIVER IN THE WHARTON TRACT, SOUTHERN NEW JERSEY
By S. M. LANG and E. C. RnoDEHAMEL, Trenton, N .• T.
Work done in cooperation with the New Je1·sey Depa1·tment of Consm·vation anrl Econmnic Develo1nnent, Division of Water Policy and Supply
The 'Vharton Tract, ·which includes about 100,000 acres in the Pine Barrens region of southern New ,Jersey (fig. :36.1), was purchased by the State in 1954 as a water reserve t~ meet future requirements in the Camden and Atlantic City regions. An aquifer test was made by the Geological Survey n,t a site on the Mullica River, about 2lj2 miles northwest of the village of Batsto to determine the hydrologic characteristics of the water-bearing sands and the degree of hydraulic continuity behveen the sands and the ~1ullica River. The test results indicate the feasibility of developing the water resources of the tract. by means of wells.
'Vater-level data from an extensive network of observation wells in the test. site were evaluated and reported upon by Lang ( 1961). The evaluation indicated that ground water moves toward the river from the upland areas on either side and discharges to the river in two major areas.
In addition to the observation wells, a network of nine lines of piezometer tubes "·as installed in the streambed to detect ground-water movement immedi-
N
1
0 10 20 30 MILES
l!""IGURE 3().1.-Map of southern New Jersey showing location of Wharton Tract (crosshatched).
ately below the bottom of the river (fig. :36.2). Each piezometer tube was especially fabricated of a regular 11;4 -inch well point with a 1j2 -inch-long screen to allow for point determinations of pressure head. At each site, 2 piezometers were installed, 1 with the screen 1 foot below the streambed and 1 'vith the screen 2 feet belo'v the streambed. '
The discharge of ground water to the river in two major areas as indica;ted 'by the well data was corroborated by an analysis of data from the piezometer tubes. This is shown by an evaluation of the eli tference in the water levels (head differential) in the shallow and deep piezometers (fig. 36.2). The greater head differential in the vicinity of lines 5 and 9 results in a much larger vertical than lateral gradient, indicating that ground water discharges to the stream at these sites. Figure :36.3 shm,·s the distribution of head as .nu~a.sured in the sha.llow piezometers. The pntten1 indicates movement of 'Yater in the direction in which the strean1 is ftmving; however, because of the small head differential, the actual dmvnstream gradient is very low compared to the gradient for lateral movement of 'vater to the stream. Figure :16.4, showing the distribution of head in the deeper piezometers, shows centers of maximum piezometric pressure and indicates possible lateral movement in this lower level both upstream and clownstrean1 from these centers.
The piezometer levels were compared with the streamgage height, a record of which 'vas obtained from the stage recorder on the west bank south of line G. This showed that the water level in both the shallow nncl deeper piezometer tubes stood highei· than the stream level. This factor plus the pattern of he:td differentia Is shown in figure 36.2 indicates that the general pattern is one. of upward movement of water from the de~per to the sha.llo'v piezometer horizon and thence to the •: river, with most of the discharge in the vicinity of lines 5 and 9.
The only area in which a downward gradient was observed is in the vicinity of the middle piezometer sites on line 9, where the head in the shallow piezometers is higher than that in the deeper ones. This is in part the re~ult of turbulence in the stream produced by the backing up of water by protruding bed materials immediately north of line 9.
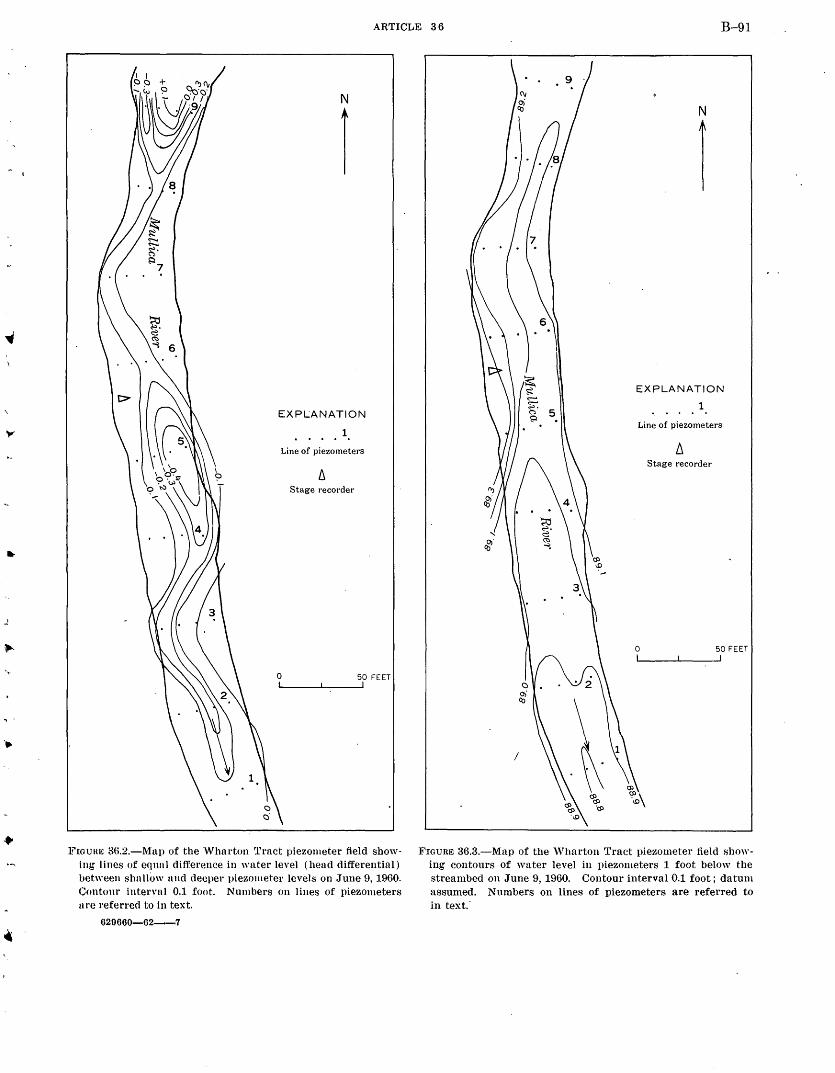
..
~ .
••
...
ARTICLE 36 B-91
N
1
EXPLANATION
1 .... Line of piezometers
Stage recorder
0 50 FEET
lf'IOUHI~ 3(i.2.-Mnp of the Wluutou Tract piezometer field showing lines of equnl difference in water level (head differential) hetween shnllow nnd deeper piezometer levels on .June 9, 1960. Contom· interval 0.1 foot. Numbers on lines of piezometers 11re referred to in text.
620660-62-----7
5
I
N
1
EXPLANATION
1
Line of piezometers
Stage recorder
0 50 FEET
FIGURE 36.3.-Map of the 'Vharton Tract piezometer field showing contours of water level in piezometers 1 foot below the streambed on June 9, 1960. Contour interval 0.1 foot; datum assumed. Numbers on lines of piezometers are referred to in text.·
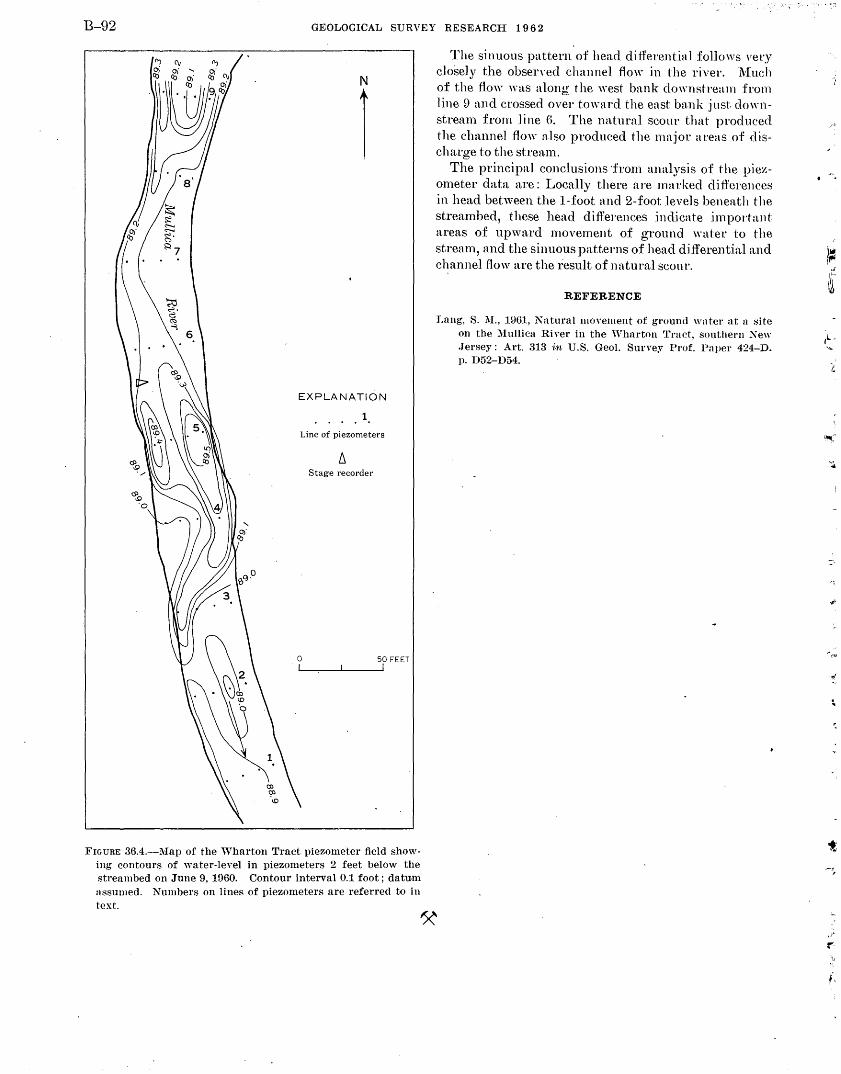
B-92 GEOLOGICAL SURVEY RESEARCH 1 9 6 2
N
1
EXPLANATION
. . . . 1. Line of piezometers
Stage recorder
0 50 FEET
FIGURE 36.4.-Map of the Wharton Tract piezometer field showing contours of water-level in piezometers 2 feet below the streambed on June 9, 1960. Contour interval 0.1 foot; datum assumed. Numbers on lines of piezometers are referred tQ in text.
The sinuous pattern of head differentia 1 follows very closely the obsen·ed channel flow in the river. IHueh of the flow was along: the west bank downstrean1 from line 9 and erossed over toward the east bank just downstream from line H. The natural scour that produced the ehannel ftow also produced the major areas of discharge to the stream.
The principal conclusions ·from analysis of the piezometer data are: Locally there are marked differe11ces in head between the 1-foot and 2-foot levels beneath the streambed, these head differences indicate important·. areas of upward movement of ground water to the stream, and the sinuous patterns of head differential and channel flow are the result of natural seour.
REFERENCE
Lang. S. l\1., 11:)61, Natural movement of ground wnter at a site on the Mullica River in the 'Vhnrton Traet, southem New .Jersey: Art. 313 ·i·n U.S. Geol. Survey Prof. Paper 424-D. p. D52-D54.
I '· • :If ~~
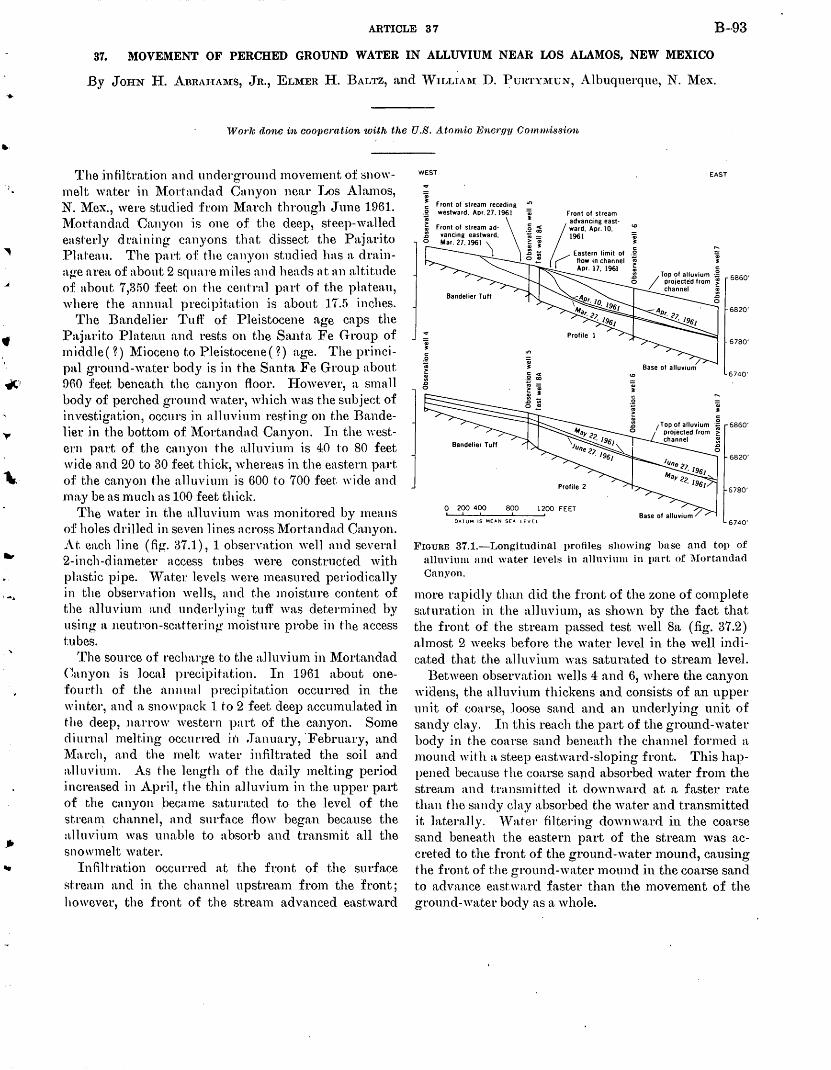
.•
~·,
I ....
,
ARTICLE 37 B--93
37. MOVEMENT OF PERCHED GROUND WATER IN ALLUVIUM NEAR LOS ALAMOS, NEW MEXICO
By JoHN li. ABRAHAl\IS, Jn., Er...l\IER H. BALTZ, and 'VILL~Al\I D. PuRTY.l\IUN, Albuquerque, N. l\1ex .
Wor1c (lone in cooperat-ion with the U.S. Atom·ic Energy Com.Jniss·ion
The infiltration and underground movement of ::;nowmelt water in J\forhtndad Cnnyon near Los Alamos, N. 1\fex., were studied from l\{arch through ,June 1961. J\forhtndad Ca11yon is one of the deep, steep-walled ensterly draining canyons that dissect the Pajarito PlnJe:\.11. The part of the cnnyon studied has a drnina.ge area of nbout 2 square miles and heads at an altitude of about 7,350 feet on the central part of the plateau, where the annual precipitation is about 17.5 inches.
The Bandelier Tuff of Pleistocene age caps the Pa.ju,rito Plateau and rests on the Santa Fe Group of middle ( ~) l\fiocene to Pleistocene (?) age. The principal ground-water body is in the Santa Fe Group about. !)60 feet beneath the canyon floor. IIowever, a small body of perched ground wn,t:er, which was the subject of investigation, occurs in alluvium resting on the Randelier in the bottom of J\fortandad Canyon. In the v;estern part of the c~myon the. a.lluYium is 40 to 80 feet wide and 20 to 30 feet thick, whereas in the eastern part of the canyon the alluvium is 600 to 700 feet ''"ide and rna.y be as much ns 100 feet thick
The water in the alluvium was monitored by 1neans of holes drilled in seven lines across Mortandad Canyon. At en.ch line (fig. :37.1), 1 observation well and several 2-inch-diamete.r access tubes were constructed with plastic pipe. '~Tater levels were. measured periodically in the observation wells, and the moisture content of the alluvium a,nd underlyi11g tuff was determined by using a neutron-scnJtet·ing· moisture probe in the access tubes.
The source of recharge to the aJluvium in l\{ortandad Canyon is local precipitation. In 1961 about onefourHl of the annual precipitation occurred in the winter, and a snowpack 1 to 2 feet deep accumulated in the deep, narrow western p:nt, of the. canyon. Some diurnal melting occutTed il'1 .January, 'February, and l\'[:trch, and the melt water infiltrated the. soil and :t11uviurn. As the length of the. daily melting period increased in April, the thin alluvium in the upper pa1t of the canyon .became saturated to the level of the stream channel, and surface flow began because. the alluvium was mutble to absorb and transmit all the snowmelt water.
Infiltrn.tion occurred at the front of the surface stream and in the channel upstream from the front; however, the ft·ont of the stream advanced eastward
WEST .. 1 Front of stream receding "' g westward, Apr.27.196l ~
.0~ Front ~f stream ad· j .~ ~ vancmg eastward, o; _
o Mar. 27, 1961 \ ~ 1 l ~i o._
Qj 31: c 0
1 0
Bandelier Tuff
DATUM IS MEAN SEA LEVEL
Front of stream advancing east·
/
ward, Apr. 10, 1961
./"" Eastern limit of I flow in channel
Apr. 17, 1961
EAST
6860'
6820'
6780'
6740'
6860'
6820'
6780'
6740'
FIGURE 37.1.-Longitudinal profiles showing base and top of alluvium and water levels in alluvium in part of l\iortandad Canyon.
more rapidly than did the front of the zone. of complete saturation in the alluvium, as shown by the fact that the front of the stream passed test well Sa (fig. 37.2) almost 2 weeks before the water level in the well indicated that the alluvium was saturated to stream level.
Between observation wells 4 and 6, where. the canyon widens, the alluvium thickens and consists of an upper unit of coarse, loose sand and an underlying unit of sandy clay. In this reach the. part of the ground-water body in the. coarse sand beneath the channel formed a mound with a steep eastward-sloping front. This happened because the coarse sa11d absorbed water from the. stream and transmitted it downward at a faster rate than the sanely clay absorbed the water and transmitted it laterally. "Tater filtering downward in the coarse sand beneath the eastern part of the stream was acCl'eted to the front of the ground-water mound, causing the front of the. ground-water mound in the. coarse sand to adva.nce eastward faster than the movement of the ground-water body as a whole..
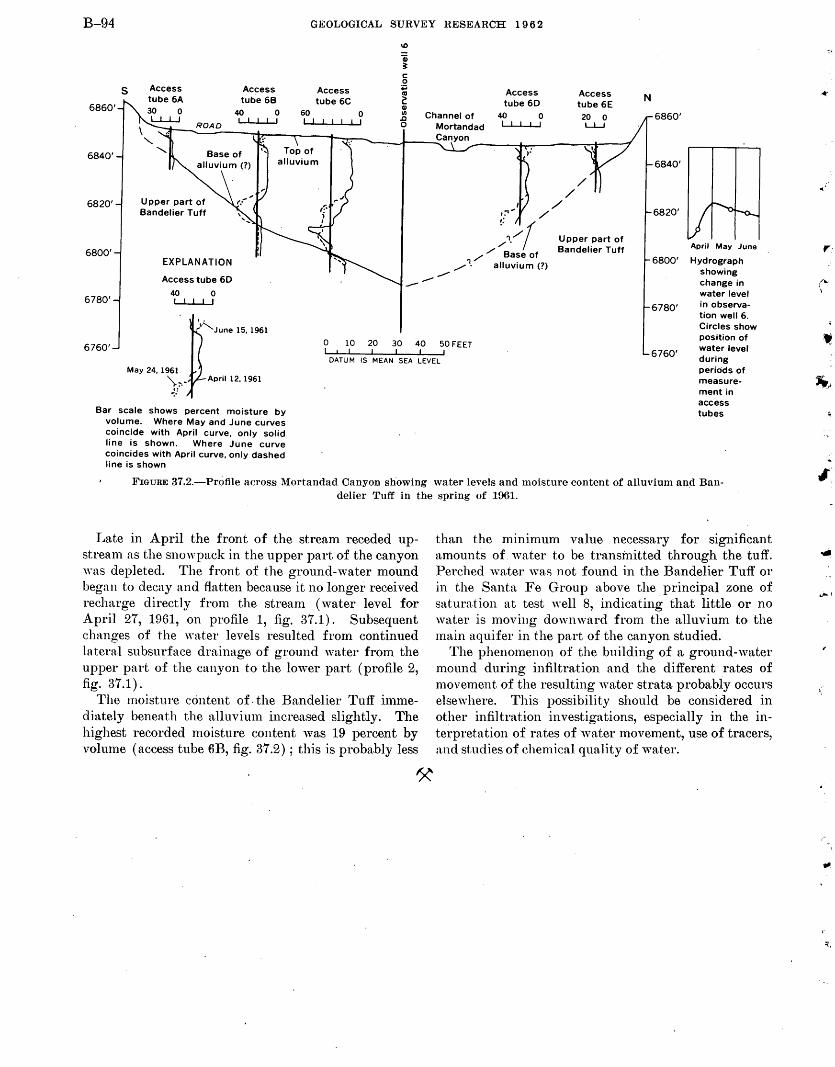
B-94 GEOLOGICAL SURVEY RESEARCH 1962
s 6860'
6840'
6820'
6800'
6780'
Access tube 6A
Upper part of Bandelier Tuff
EXPLANATION
Access tube 60
40 0 L...LL..LJ
Access tube 6B
~~·'-.June 15, 1961
Access tube 6C
60 0 I I I
ID
Qj ~ c: 0 .. ~ Q) Ul .0 0
Access tube 60
40 0 L..l....L.J....
Access tube 6E 20 0 LLJ
Upper part of Bandelier Tuff
N
6860'
6840'
6820'
April May June
6800' Hydrograph showing change in water level
6760' 0 10 20 30 40 50 FEET
in observation well 6. Circles show position of water level during
I I I I I I I
DATUM IS MEAN SEA LEVEL May 24, 1961
\.--J April 12, 1961
~.:
Bar scale shows percent moisture by volume. Where May and June curves coincide with April curve, only solid line is shown. Where June curve coincides with April curve, only dashed line is shown
periods of measurement in access tubes
FIGURE 37.2.-Profile across Mortandad Canyon showing water levels and moisture content of alluvium an~ Bandelier Tuff in the spring of 1961.
Late in April the front of the stream receded upstream as the snowpack in the upper part of the canyon was depleted. The front of the ground-water mound began to decay and flatten because it no longer received recharge directly from the stream (water level for April 27, 1961, on profile 1, fig. 37.1). Subsequent changes of the water levels resulted from continued lateral subsurface drainage of ground water from the upper part of the canyon to the lower part (profile 2, fig. 37.1).
The moisture content of. the Bandelier Tuff immediately beneath the alluvium increased slightly. The highest recorded moisture content was 19 percent by volume (access tube 6B, fig. 37.2); this is probably less
than the m1n1mum value necessary for significant amounts of water to be ti~ansinitted through the tuff. Perched 'vater was not found in the Bandelier Tuff or in the Santa Fe Group above the principal zone of saturation at test well 8, indicating that little or no water is moving downward from the alluvium to the main aquifer in the part of the canyon studied.
The phenomenon of the building of a ground-water mound during infiltration and the different rates of movement of the resulting water strata probably occurs elsewhere. This possibility should be considered in other infiltration investigations, especially in the inte~·pretation of rates of water movement, use of tracers, and studies of chemical quality of water.
...
(.._
'
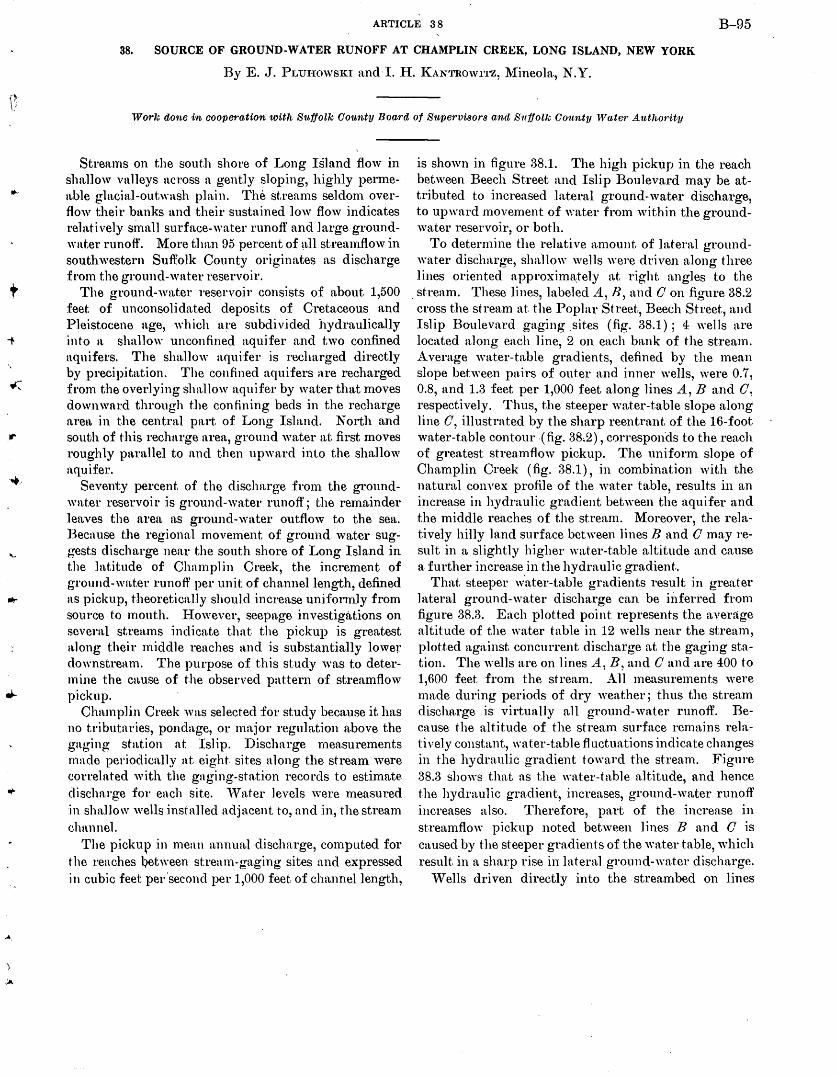
...
ARTICLE 38 B-95
38. SOURCE OF GROUND-WATER RUNOFF AT CHAMPLIN CREEK, LONG ISLAND, NEW YORK
By E .• J. PLunowsin and· I. H. I{ANTROWIT'".l, Mineola, N.Y.
Worlc done in coopet·ation with Sttf!olk County Board of S1tpervisors aml S·uffolk County Water Autho?'ity
Streams on the south shore of Long Island flow in shallow valleys across a gently sloping, highly permen.ble glacial-outwash plain. The st.rea.ms seldom overflow their banks and their sustained low flow indicates relatively sinall surface-water runoff and large groundwater runoff. More than 95 percent of all streatnflow in southwestern Suffolk County originates as discharge fl'om the ground-water reservoir.
The ground-water reservoir consists of about 1,500 feet of unconsolidated deposits of Cretaceous and Pleistocene age, which are subdivided hydraulically into a shallow unconfined aquifer and two confined aquifers. The shallow aquifer is recharged directly by precipitation. The confined aquifers are recharged from the overlying shallow aquifer by water that moves downward through the confining beds in the recharge nren. in the central part of Long Island. North and south of this recharge area, ground water a.t first moves roughly parallel to and then upward into the shallow aquifer.
Seventy percent of the discharge from the grmmdW!tter reservoir is ground-water runoff; the remainder leaves the area as ground-water outflow to the sea. Because the regiomtl movement of ground water suggests dischttrge near the south shore of Long Island in the latitude of Champlin Creek, the increment of ground-water runoff per unit of channel length, defined as pickup, t-heoretically should increase uniformly from source to mouth. 1-Iowever, seepage investigations on several streams indicate that the pickup is greatest along their middle reaches and is substantially lower downstream. The purpose of this study was to determine the cause of the observed pattern of streamflow pickup.
Champlin Creek was selected for study because it has no tributaries, pondage, or major regulation a.bove the gaging station at Islip. Discharge measurements rnnde periodically nt eight. sites along the stream were correlated with the gnging-stn..tion records to estimate discharge for each site. ''Tater levels w·ere measured in shallow wells installed adj~tcent to, and in, the stream chn.nnel.
The pickup in menn annual discharge, computed for t'.he reaches QebYeen stream-gaging sites and expressed in cubic feet per'second per 1,000 feet of channel length,
is shown in figure 38.1. The high pickup in the reach between Beech Street and Islip Boulevard may be attributed to increased lateral ground-water discharge, to upward movement of 'Yater from within the groundwater reservoir, or both.
To determine the relative amount of lateral groundwater discharge, shallow wells were driven along three lines oriented approximaJely at right angles to the
. stream. These lines, labeled A, B, and 0 on figure 38.2 cross the stream at the Poplar Street, Beech Street, and Islip Boulevard gaging .sites (fig. 38.1); 4 wells are located along each line, 2 on each bank of the stream. Average water-table gradients, defined by the mean slope between pairs of outer and inner wells, were 0.7, 0.8, and 1.8 feet per 1,000 feet along lines A, B and 0, respectively. Thus, the steeper water-table slope along line 0, illustrated by the sharp reentrant of the 16-foot water-table contour (fig. 38.2), corresponds to the reach of greatest streamflow pickup. The uniform slope of Champlin Creek (fig. 38.1), in combination with the natural convex profile of the wa.ter table, results in an increase in hydraulic gradient between the aquifer and the middle reaches of th~ stream. Moreover, the relatively hilly land surface between lines B and 0 may result in a. slightly higher water-table altitude and cause a further inci·ease in the hydraulic gradient.
That steeper w'ater-table gradients result in greater lateral ground-water discharge can be ii1ferred from figure 38.3. Each plotted point represents the average altitude of the water table in 12 wells near the stream, plotted against concurrent dischn.rge at the gaging station. The wells are on lines A, B, and 0 and are 400 to 1,600 feet from the stream. All measurements were made during periods of dry weather; thus the stream discharge is virtually all ground-water runoff. Because the altitude of the stream surface remains relatively constant, water-table fluctuations indicate changes in the hydraulic gradient toward the stream. Figure 38.3 shows that as the water-table altitude, and hence the hydraulic gradient, increases, ground-water runoff inereases also. Therefore, part of the increase in streamflow pickup noted between lines B and 0 is caused by the steeper gradients of the water table, which result in a sharp rise in lateral ground-water discharge.
'Veils driven directly into the strea.mbed on lines
B-96 GEOLOGICAL SURVEY RESEARCH 1 9 6 2
60'
40'
20' Great South Bay
Series of ponds
Source
SEA LEVEL~0~==------~2---------4L---------6L---------8~--------1~0--------~1~2--------~1~4--------~----
0ISTANCE, IN THOUSANDS OF FEET, UPSTREAM FROM MOUTH
2.0 a:: ~w (/) UJ 1.5 LL.LL. ua ~ ~ 1.0
0.:~ =>o ~ ~ 0.5 ll.
"C '-(Q
>.-. .!!u
:::::1 Q) 0 c: CD·a.:::;.
iii
A
B
.... Q) Q)
'- --+'!X) (/)Q)
~c: ()·cv~ Q)
CD
J;'wonE 38.1.-Stream vrofile (A_) and pickup in mean annual disehurge (B) of Champlin Creek. Lines referred to in B are shown in figure 38.2.
A, B, and 0 were used to determine the relative amount of upward ground-water movement into the creek. All wells "\vere screened in the uniform glacial-outwash deposits of the shallow unconfined aquifer. At each site, driving was stopped about every foot for the first 10 feet and about every 5 feet thereafter, the well was pumped, and observations of head were made after the water had returned to its static level. The head as indicated by water levels in the wells increased from about equal to the stream stage when the bottom of the well was just below the streambed, to half a foot higher than the stream stage at a depth of 5 feet. The head remained the same at depths between 5 feet ~lnd 60 feet, where driving was terminated.
These differences in head indicate that in the upper zone of the aquifer, ground water moves toward the stream both laterally and from below, but that below this upper zone the movement is predominantly horizontal under the regionn,l hydraulic gradient.
The stream acts as a. ground-water drain that causes a reduction in hydrostatic head adjacent to its channel. The hydraulic gradient thus established between the aquifer and the stream induces water to flow toward the stream. The limiting distance froni which water moves toward the stream, both laterally and from below, is controlled by the interrela,tion of the hydraulic gr:adient between aquifer and stream, and the pernieability of the aquifer. Because the stream is shallow, most ground water discharges through the streambed.
In summary, the rate of ground-water runoff is contro1led largely by the height of the water table adjacent to the stream. Ground-watet• movement into the stream channel along the middle and upper reaches of Champlin Creek is principally lateral, with little or no upward flow reaching the stream from deep within the aquifer.
"-:
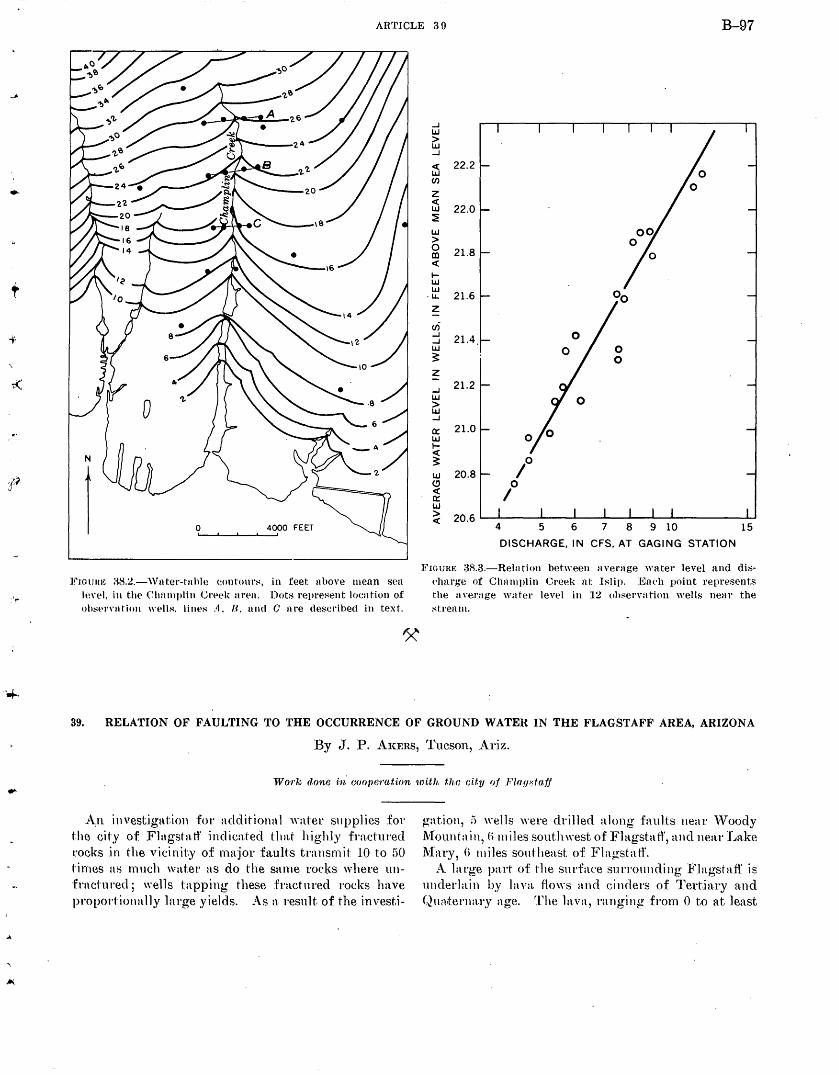
t
..
AR~rJCLE 39 B-97
N
1 0 4000 FEET
:wnlUHI~ 0H.:!.-\Vnter·-hthle <.:ont"our·~, in feet above mean SNl
lt~Yel. in thl' Chlllllplin Urt>ek art:>n. Dots rern·esent location of ollSPI'\'Ilt·ion wpll~. lilll'~" A. U. and 0 nt·e ch~scrihed in text.
...J UJ > UJ ...J
<( 22.2 UJ (/)
z <(
22.0 UJ ~
UJ > 0 21.8 CD <(
1-UJ UJ
21.6 ·LL
z u) ...J 21.4 ...J UJ ~
z ...J 21.2 UJ > UJ ...J
0:: 21.0 UJ 1-<(
~ 10 UJ 20.8 (.!) 0 <( I 0:: UJ > 20.6 <(
4 5 6 7 8 9 10 15
DISCHARGE, IN CFS, AT GAGING STATION
.IJ"'IGURE 38.3.-Relation between average water level and disdutrge of Chn mvlin Cre~~k at Islip. IDH('h point represents the a ,·e.rage water level i 11 12 ohsen·ntion wells near the stream.
39. RELATION OF FAULTING TO THE OCCURRENCE OF GROUND WATER IN THE FLAGSTAFF AREA, ARIZONA
By ,J. P. AKEns, Tucson, Ariz.
Worlc done in. aooperution with the Gity of Ji'laf}8fa.fj
A,n investigation for additional water supplies for the city of :Flugstatf indicated that highly fractured rocks in the vicinity of mnjor fault.s transmit 10 to 50 tirnes as much water as do the snme rod<:s where mt"fract"nred; wells tapping these fractured rocks have proport·ionnlly large yields. As a result. of the investi-
gation, :) \\·ells were drilled along :faults near 'Voody ~fountain, f) miles south west of Flagsta 1f, and near Lake ~fary, () miles southeast of Flag-staff.
A large part of. the sndace suiTotlllding Flagstaff is underlain by lava, f-lows and cinders of Tertiary and Qna,ternary age. The lava, ranging from 0 to at least
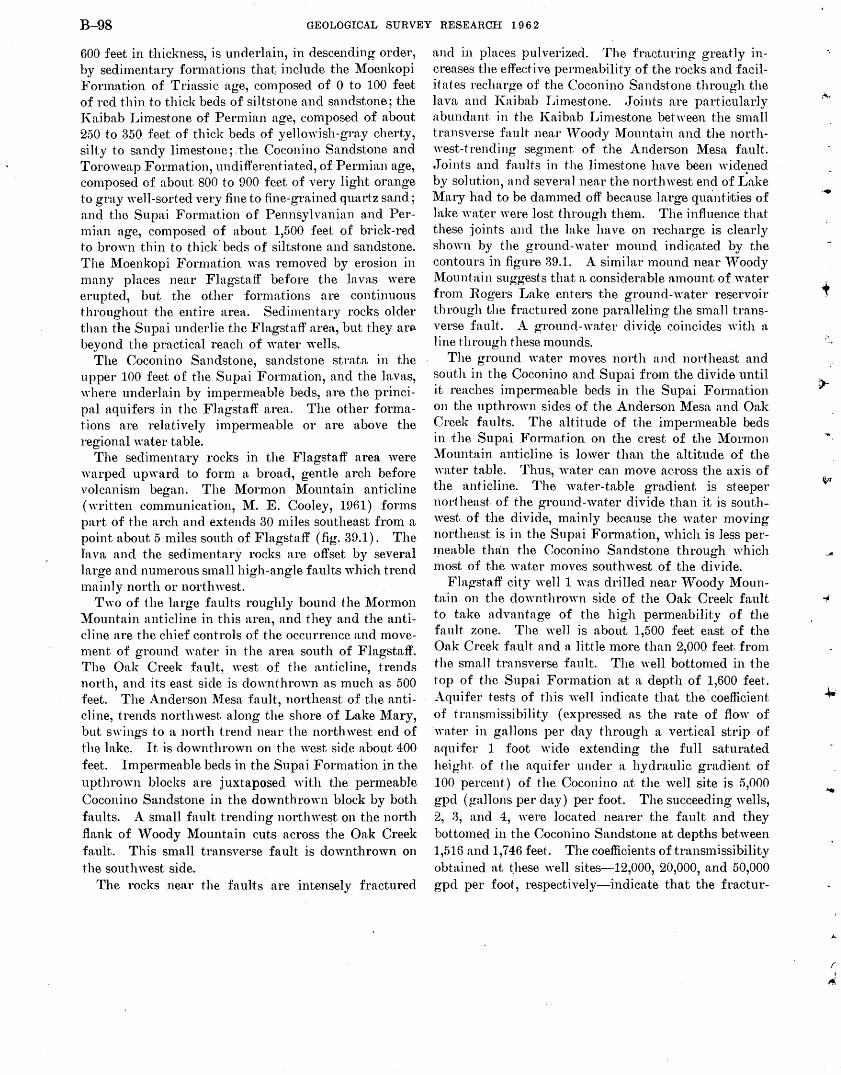
B-98 GEOLOGICAL SURVEY RESEARCH 1 9 6 2
600 feet in thickness, is underlain, in descending order, by sedimentary formations that. include the Moenkopi Formation of Triassic age, composed of 0 to 100 feet of red thin to thick beds of siltstone and sandstone; the J(aibab Limestone of Permian age, composed of about 250 rto 350 feet of thick beds of yellowish-gray cherty, silty to sandy limestone;. the Coconino Sandstone and Toroweap Formation, undifferentiated, of Permian age, composed of about 800 to 900 feet of very light orange to gray well-sorted very fine to fine-grained quartz sand; and the Supai Formation of Pennsylvanian and Permian age, composed of about 1,500 feet of brick-red to brown thin to thick beds of siltstone and sandstone. The Moenkopi Formation was removed by erosion in many places near Flagstaff before the lavas were erupted, but the other formations are continuous throughout the entire area. Sedimentary rocks older than the Supai underlie the Flagstaff area, but they an~ beyond the practical reach of water wells.
The Coconino Sandstone, sandstone strata in the upper 100 feet of the Supai Formation, and the lavas, where underlain by imp~rmeable beds, a.re the principal aquifers in the Flagstaff area. The other formations are relatively impermeable or are above the regional water table.
The sedimentary rocks in the Flagstaff area were warped upward to form a broad, gentle arch before volcanism began. The Mormon ~fountain anticline (written communication, M. E. Cooley, 1961) forms part of the arch and extends 30 miles southeast from a point about 5 miles south of Flagstaff (fig. 39.1). The lava and the sedimentary rocks are offset by several large and numerous small high-angle faults which trend mainly north or northwest.
Two of the large faults roughly bound the ~formon Mountain anticline in this area, and they and the anticline are the chief controls of the occurrence and movement of ground water in the area south of Flagstaff. The Oak Creek fault, west of the anticline, trends north, and its east side is downthrown as much as 500 feet. The Anderson l\fesa fault., northeast of the anticline, trends northwest along the shore of Lake Mary, but swings to a north trend near the northwest end of the lake. It is downthrown on the west side about 400 feet. Impermeable beds in the Supai Formation in the upthrown blocks are juxtaposed with the permeable Coconino Sandstone in the downthrown block by both faults. A small fault trending northwest on the north flank of "Voody Mountain cuts across the Oak Creek fault. This small transverse fault is downthrown on the southwest side.
The rocks near t.he faults are intensely fractured
and in places pulverized. The fracturing greatly increases the effective permeability of the rocks and facilitates recharge of the Coconino Sandstone through the lava and Kaibab Limestone. ,Joints are particularly abundant in the 1\:a.ibab Limestone between the small transverse fault near 'Voody ~fountain and the northwest-trending segment of the Anderson ~fesa fault. .Joints and faults in the limestone have been widened by solution, and several near the northwest end of J~ake Mary had to be dammed off because large quant-ities of lake ·water '"ere lost through them. The influence that these joints and the lake have on recharge is clearly shown by the ground-water mound indicated by the contours in figure 39.1. A similar n1ound near "'Toody ~fountain suggests that a considerable amount of water from Rogers Lake enters the ground-water reservoir through the fractured zone paralleling the small transverse fault. A ground-water divide coincides with a line through thes~ mounds. .
The ground water moves north and northeast and south in the Coconino and Supai from the divide until it reaches impermeable beds in the Supai Formation on the upthrm\'n sides of the Anderson ~fesa and Oak Creek faults. The altitude of the impermeable beds in the Supai Formation on the crest of the ~formon ~fountain anticline is lower than the altitude of the water table. Thus, "·ater can move across the axis of the anticline. The water-table gradient is steeper northeast of rthe ground-water divide than it is southwest of the divide, mainly because the water moving northeast is in the Supai Formation, which is less permeable than the Coconino Sandstone throuo-h which . b
most of the water moves southwest of the divide. Flagstaff city \Yell 1 was drilled near "'Voody Moun
tain on the dmn1thrown side of the Oak Creek fault to take advantage of the high permeability of the fault zone. The well is about 1,500 feet east of the Oak Creek fault and a little more than 2,000 feet from the small transverse fault. The well bottomed in the top of the Supai Formation at a depth of 1,600 feet. Aquifer tests of this well indicate that the "coefficient of transmissibility (expressed as the rate of flow of ·water in gallons per day through a vertical strip of aquifer 1 foot wide extending the full saturated height of the aquifer under a hydraulic gradient of 100 percent) of the Coconino at. the well site is 5,000 gpd (gallons per day) per foot. The succeeding wells, 2, 3, and 4, were located nearer the fault and they bottomed in the Coconino Sandstone at depths between 1,516 and 1,746 feeL The coefficients of transmissibility obtained at t;hese \Yell sites-12,000, 20,000, and 50,000 gpd per foot, respectively-indicate that the fractur-
.......
·•
:·
( I
~
.,
T. 23 N.
T. 22 N.
T. 21 N.
T. 20 N.
T. 19 N.
ARTICLE 39
~ '"" ,,,, \ f/1 :::. 111!1\l\1\1/lllllll\\1\~
111° 109" N
0
-.......=----~------i 32°
50 100~~~-, ........
. R. 6 E. R. 7 E.
EXPLANATION
u 0
Fault U, upthrown side; D, do.wnthrown side
Anticline
q Spring
0 sn2
Well and altitude, in feet, Qf water table
--6050-Water-level contour Contour interval 50 feet; datum is mean sea level
0 2
'-..._0 5095
R. 8 E.
3 MILES
l!,IGURE 39.1.-Mnp showing main structural features and water-level contours in the Flagstaff area.
B-99
B-100 · GEOLOGICAL SURVEY RESEARCH 1 9 6 2
ing, and hence the transn1issibility, increases toward the fault. A way from the fault zones transmissibilities generally are less than 1,000 gpd per foot. Similarly, the specific.:. capacity of wells completed in undistlp·bed Coconino ranges from a fraction to 1 gpm (gallon per minute) per foot of dra.wdown, "·hereas the specific capacity of the wells in the fractured fault
zone near 'Voody Mountain ranges frorn 2.5 to 8.6 gpm per foot of drawdown.
Hydrologic. conditions along the Anderson 1\1esa fault are similar to those along the Oak Creek fault, and the city of Flagstaff in November 1961 was drilling a well near Lake 1\1ary to ascertain whether similar high yields eould be obtained from wells "in tha.t area.
40. METHOD FOR MEASURING UPWARD LEAKAGE FROM ARTESIAN AQUIFERS USING RATE OF SALT-CRUST ACCUMULATION
By J. H. FETH and R. J. BRowN, Menlo Park, Calif., and Ogden, Utah
Work done in cooperation with the U.S. Bm·eau of Reclamation
Nearly 60,000 aeres of wet salt-encrusted barren land was exposed along the east shore of Great Salt Lake, Utah, during the period 1953-56 in an area underlain by aquifers that contain water under artesian pressure. A method was sought to measure the rate of upward leakage of the artesian water through the sodium-saturated elays that form the surface of the salt-encrusted barrens.
The mudflats west of the Ogden Bay Bird Refuge were selected in 1954 as being representative of the area. The crust was removed from 3 plots, each having an area of 5 square feet, so that a ne·w layer of salt could accumulate. Then the new crust was removed, separated from the clay adhering to it, dried, and weighed, thus showing the amount of salt that had been deposited by evaporation of rising brine during a given period of time. Five determinations of rate of accumulation were made during"the study (see table below).
The salt content of the brii1e was determined by digging a shallow well near the test plots and analyzing the water for its salt content. The brine was found to contain 93,000 parts per million of dissolved solids~
mostly sodium chloride, or 126.5 tons per acre-foot. From this information was calculated the amount of water evaporated to produce the accumulations of salt t-hat were collected and weighed. The rate of evaporation, in am·e-feet per acre, was calettlated on the basis of the eva.poration during the frost-free season of 160 days (Brown, 1960), inasmuch as the salt ernst does not form during the cold season.
Evaporation pans were used to compare the nornml rate of evaporation of fresh water and the rate of evaporation from the salt crust.
The average evaporation from the salt crust:. during the frost-free season was 0.04 acre-feet per acre (see table). This factor applied to the 60,000 acres of bar-
Rates of evaporation at and near the Ogden Bay Bird Refuge during the frost-free season of 1951,.
Plot Period t Number of days
Salt-crust tests Evaporation-pan tests
Amount of salt accumulated (grams)
Calculated Calculated potential Depth of water evaporated potential
evaporation evaporation during 160 --------------- during 160
days (acre-feet days (acre-feet per acre) Inches Feet per acre)
Comparison of salt-crust evaporation
to pan evaporation
(percent)
-------1-------------1------------1-----------------------A ____________ June 30-.July 13_____________ 13 92 B ____________ June 30-Aug. 2_____________ 33 70 A ____________ July 13-Aug. 2_____________ 20 85 C ____________ June 30-Aug. 24____________ 55 73 B ____________ Aug. 2-Aug. 24_____________ 22 41
Average ______________________ ---- _______ ------ _____ ----- ___ _
0. 09 . 03 . 05 . 02 . 02 . 04
5. 70 0. 48 13. 37 1. 11
7. 67 . 64 21. 43 1. 79
8. 06 . 67
.5. 90 5. 38 5. 12 5. 21 4. 87 5. 30
1.5 .6
1.0 . 4. . 4.
1 Rainfall during the period June 30 to August 24 at rain gage adjacent to evaporation pan totaled 0.25 inches (July, 0.16; Aug., 0.09), and fell during several periods, none having an intensity of as much as 0.1 inches in 24 hours, and is considered negligible in its effect upon the experiments.
........
....
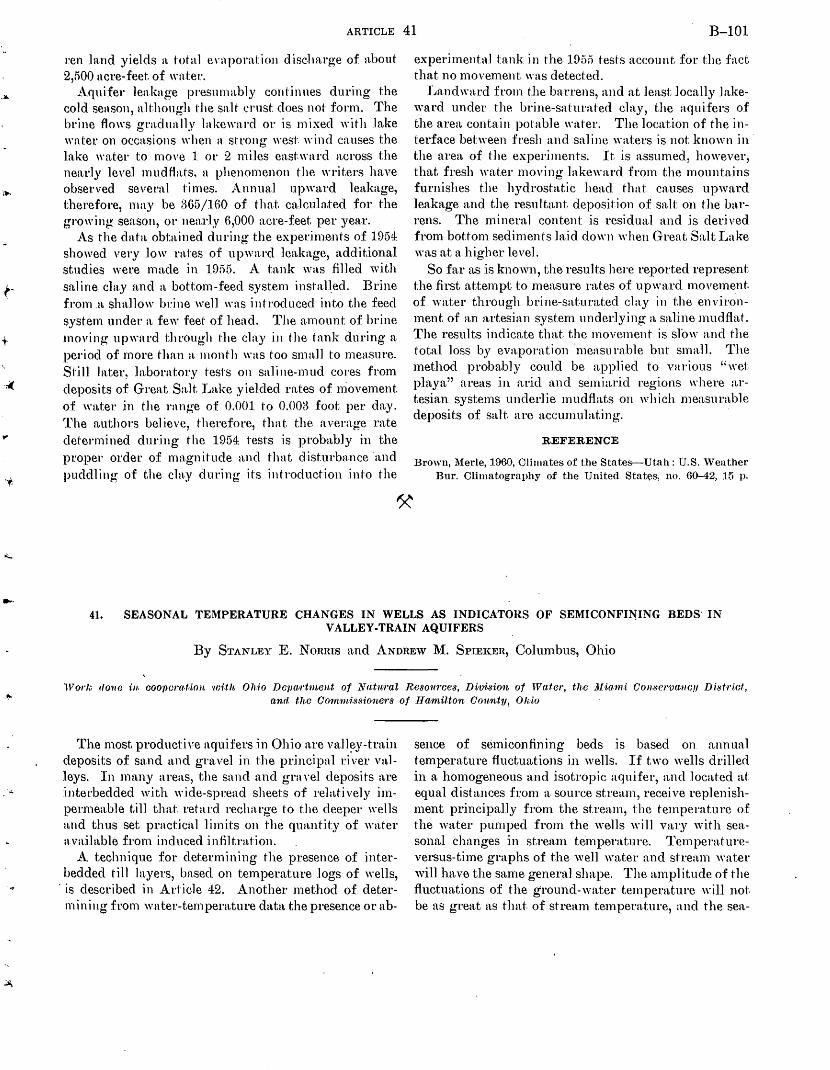
+
,..
.. ,
....
ARTICLE 41 B-101
ren land yields a h>htl en1porntion d isc.harge of about 2,:'500 acre-feet of water.
Aquifer leakage presumably continues during the cold senson, nlt:.hough the saH crust does not· form. The brine f-lows gradually lakeward or is mixed with lake wnt:er on occasions when a stTong west wind causes the lake water to move 1. ot· 2 miles east·.ward across the nearly level mudftnJs, n phenomenon the writers have observed several t·imes. Annual upward leakage, therefore, may be 865/l.GO of that caJcula.ted for the growing senson, or nearly 6,000 acre-feet per year.
As the data obtained during the experiments of 1954 showed very low rat·es of upward leakage, additional studies were made in 19:15. A tank was filled with saline c1a.y and n. bottom-feed systen1 install_ed. Brine from .n. shallow brine well was introduced into the feed system under· a few feet of head. The amount of brine moving upwnrd through t·he cla.y in the tank during a period of more t·han a. 1nonth was too small to measure. St·ill later, laboratory t-est·s on saline-mud cores from deposits of Great S:tlt J..~ake yielded rates of niovement of wn.t:er .in the range of O.OC>l to 0.00:3 foot per day. The authors believe, t·herefore, that the. average rate determined during the 1954 tests is probably in the proper order of magnitude and that clisturbance ·and puddling of the cla.y during its int-roduction into the
experimental tank in the 1955 tests account for the fact that no movement was detected.
Landward from the barrens, and at least locally lakeward under the brine-saturated clay, the aquifers of the area contain potable water. The location of the interface bebYeen fresh and saline waters is not known in the area of the experiments. It. is assumed, however, that fresh water moving lakeward from the motmtains furnishes the hydrostatic head that causes upward leakage and the resultant deposition of salt on the barrens. The mineral content is residual and is derived from bottom sediments laid down when Great Salt Lake was at a higher leveL
So far as is known, the results hel'e reported represent the first attempt to measure rates of upward movement. of water through brine-saturated clay in the environment of an artesian system underlying n. saline mudflat. The results indicate that the movement is slow and the total loss by evaporation 'mensurable but small. The method probably could be applied to various "wet playa" areas in arid ttnd semiarid regions where artesian systems underlie mudflats on which measurable deposits of salt are accmnulating.
REFERENCE
Brown, Merle, 1960, Climntes of the Stntes-Utnh: U.S. ·weather Bur. Climatogrnphy of the United States, no. 60-42, 15 p .
41. SEASONAL TEMPERATURE CHANGES IN WELLS AS INDICATORS OF SEMICONFI:N"ING BEDS· IN VALLEY-TRAIN AQUIFERS
By STANLEY E. NORRIS and ANDREW M. SPIEKER, Columbus, Ohio
1Varl,; rto·nc ·in COOJW'ra.t-ion ·wUh Ohio lJeJ)wrtm,ent of Nnt1wal Resom·ces, D·ivision of lVa.fet·, the M·iatni ConserV(I;IICJ/ District, anrl the Conunissione1·s of Hamilton C01mty~ Oh-io
The most product:i ve aquifers in Ohio are valley-train deposits of sand and gravel in the principal ri,ver valleys. In many areas, the sand and gravel deposits are interbedded with "·ide-spread sheets of relatively impermeable till that retard recharge to the deeper wells and thus set practical limits on the quantity of water available from .induced infiltra.t-ion.
A technique for determining the presence of interbedded till layers, based on temperature .logs of wells,
·is described in Article 42. Another method of deterrn in i11g frorn water-temperature data the presence or ab-
sence of semiconfining beds is based on annual temperature fluctuations in wells. If two wells drilled in a. homogeneous and isotropic aquifer, and located at equal distances from a. source stream, receive replenishment principally from the stream, the temperature of the water pumped from the wells "·ill vary with seasonal changes in strean1 temperature. Temperatureversus-time graphs of the well water and stream water will ha.ve the same genera] shape. The amplitude of the fluctuations of the ground-water temperature will not. be as great as thnJ of stream temperature, and the sea.-
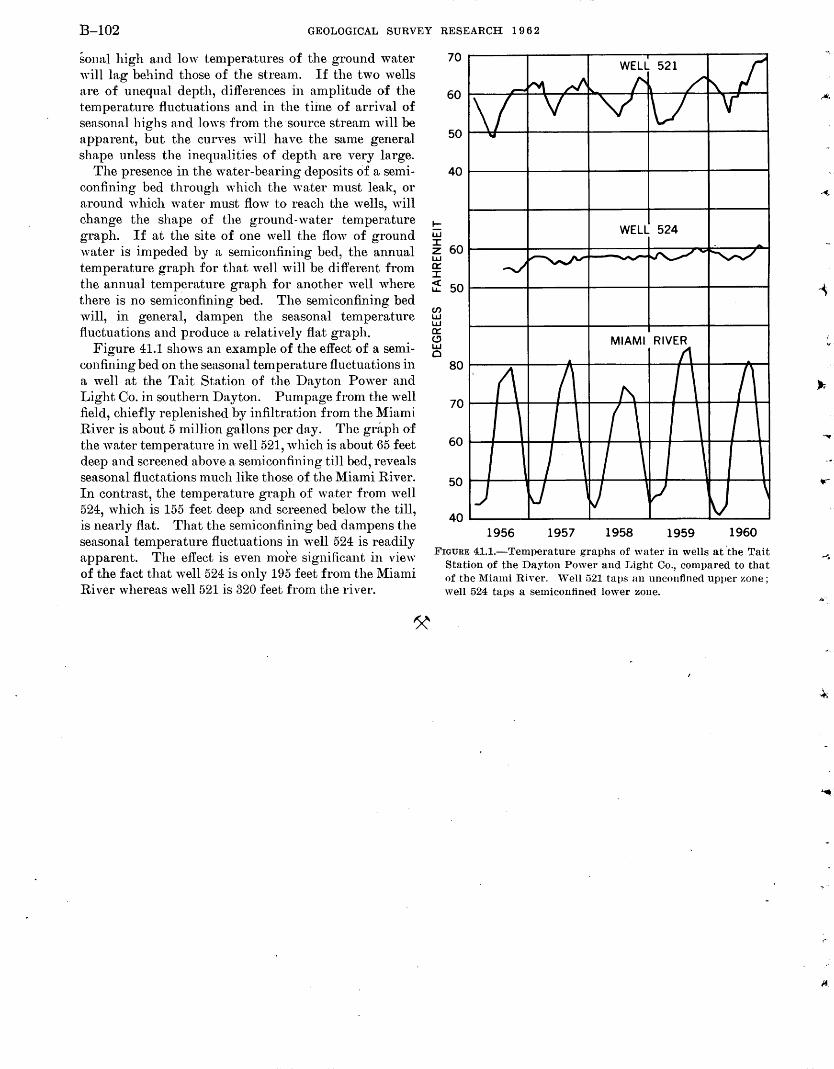
B-102 GEOLOGICAL SURVEY RESEARCH 1 9 6 2
sonal high and low temperatures of the ground water will lag behind those of the stream. If the two wells are of unequal depth, differences in amplitude of the temperature fluctuations and in the time of arrival of seasonal highs and lows from the source stream will be apparent, but the curves will have the same general shape unless the inequalities of depth are very large.
The presence in the water-bearing deposits of a semiconfining bed through which the water must leak, or around which water must flow to reach the wells, will change the shape of the ground-water temperature graph. If at the site of one well the flow of ground water is impeded by a semiconfining bed, the annual temperature graph for that well will be different from the annual temperature graph for another well where there is no semiconfining bed. The semiconfining bed will, in general, dampen the seasonal temperature fluctuations and produce a relatively flat graph.
Figure 41.1 shows an example of the effect of a semiconfining bed on the seasonal temperature fluctuations in a well at the Tait Station of the Dayton Power and Light Co. in southern Dayton. Pumpage from the well field, chiefly replenished by infiltration from the Miami River is about 5 million gallons per day. The graph of the water temperature in well521, which is about 65 feet deep and screened above a sem.iconfining till bed, reveals seasonal fluctations much like those of the Miami River. In contrast, the temperature graph of water from well 524, which is 155 feet deep and screened below the till, is nearly flat. That the semiconfining bed dampens the seasonal temperature fluctuations in well 524 is readily apparent. The effect is even more significant in view of the fact that well 524 is only 195 feet from the Miami River whereas well521 is 320 feet from the river.
40~-----+------~------r-----~------~
t:: UJ WELL 524 I
60 z UJ a:: I <(
50 LL.
en UJ UJ a:: (.!) UJ
MIAMI RIVER 0
80
70
60
50
40 1956 1957 1958 1959 1960
FIGURE 41.1.-Temperature graphs of water in wells at 'the Tait Station of the Dayton Power and Light Co., compared to that of the Miami River. ''ren 521 tavs an unconfined upper r.one; well 524 taps a semiconfined lower zone.
....
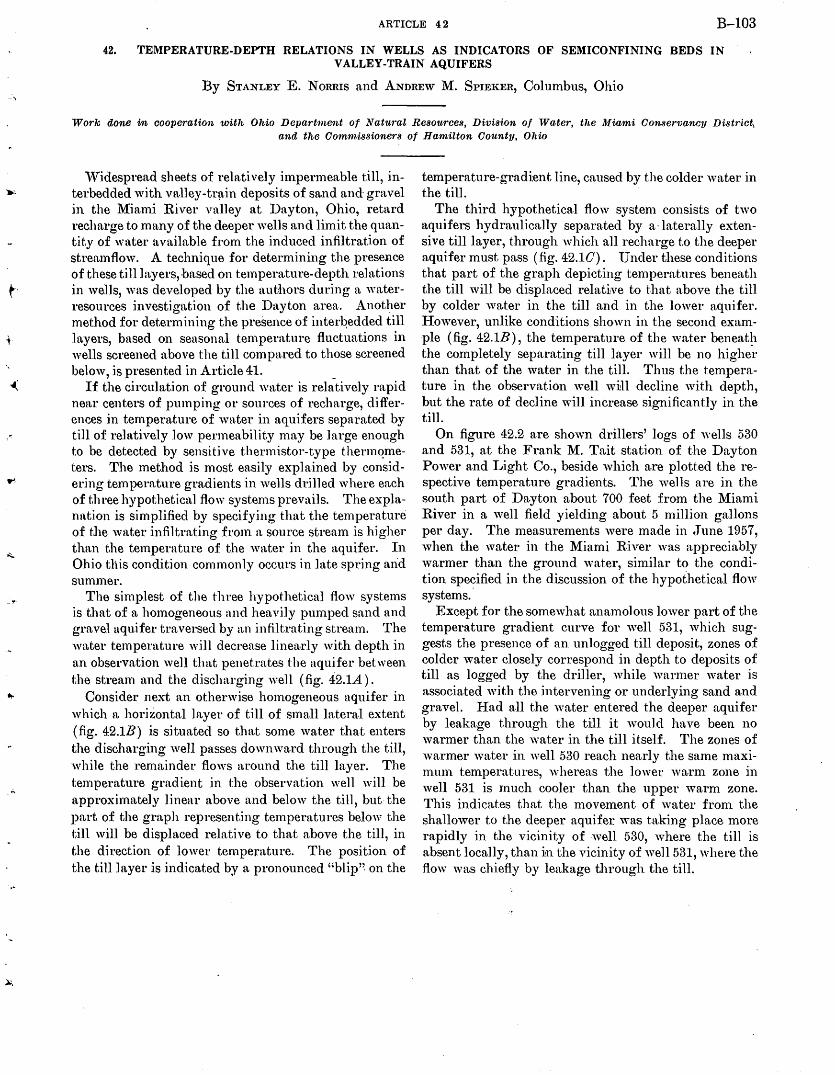
ARTICLE 42 B-103
42. TEMPERATURE-DEPTH RELATIONS IN WELLS AS INDICATORS OF SEMICONFINING BEDS IN VALLEY-TRAIN AQUIFERS
By STANLEY E. NORRIS and ANDREW M. SPIEKER, Columbus, Ohio
Wo1·k done in cooperation with Ohio Department ot Natural Resources, Division of Water, the Miami Conservancy Distdct, and the Commissioners of Hamilton County, Ohio
vVidespread sheets of relatively impermeable till, interbedded with va.lley-tqtin deposits of sand and· gravel in the Miami River valley at Dayton, Ohio, retard recharge to many of the deeper wells and limit the qmtntity of water available from the induced infiltration of strettmflow. A technique for determining the prese11ce of these till layers, based on temperature-depth relations in wells, was developed by the authors during a waterresources investigation of the Dayton area. Another method for determining the presence of interqedded till htyers, based on seasonal temperature fluctuations in wells screened rtbove the till compared to those screened below, is presented in Article 41.
If the circulation of ground water is rel~tively rapid near centers of pumping or sources of recharge, differences in temperature of water in aquifers separated by till of relatively low permeability may be large enough to be detected by sensitive thermistor-type therm~meters. The method is most easily explained by considering temperature gradients in wells drilled where each of three hypothetical flow systems prevails. The explantttion is simplified by specifying that the temperature of the water infiltrating fr01n a source stream is higher than the temperature of the water in the aquifer. In Ohio this condition commonly occurs in late spring arid summer.
The simplest of the three hypothetical flow systems is that of a homogeneous and heavily pumped sand and gravel aquifer traversed by an infiltrating stream. The water temperature will decrease linea.rly with depth in an observation well that penetrates the aquifer between the stream and the discharging well (fig. 42.1A).
Consider next an otherwise homogeneous aquifer in which a horizontal layer of till of small lateral extent (fig. 42.1B) is situated so tlutt some water that enters the discharging well passes down ward through the till, while the remainder flows around the till layer. The temperature gradient in the observation well will be approximately linear above and below the till, but the part of the graph representing temperatures below the till will be displaced relative to that above the till, in the direction of lower temperature. The position of the till layer is indicated by a pronounced "blip"· on the
temperature-gradient line, caused by the colder water in the till. ·
The third hypothetical flow system consists of two aquifers hydraulically separated by a·laterally extensive till layer, through which all recharge to the deeper aquifer must pass (fig. 42.10). Under these conditions that part of the graph depicting temperatures beneath the till will be displaced relat1ve to that above the till by colder water in the till and in the lower aquifer. However, unlike conditions shown in the second example (fig. 42.1B), the temperature of the water beneath the completely separating till layer will be no highe~· than that of the water in the till. Thus the temperature in the observation well w~ll decline with depth, but the rate of decline will increase significantly in the till.
On figure 42.2 are shown drillers' logs of wells 530 and 531, at the Frank M. Tait station of the Dayton Power and Light Co., beside which a.re plotted the respective temperature gradients. The wells are in the south part of Dayton about 700 feet from the Miami River in a well field yielding about 5 million gallons per day. The measurements were made in ~Tune 1957, when the water in the Miami River was a.ppreciably warmer than the ground water, similar to the condition spe?ified in the discussion of the hypothetical flow systems.
Except for the somewhat anamolous lower part of the temperature gradient curve for well 531, which suggests the presence of an unlogged till deposit, zones of colder water closely correspond in depth to deposits of till as logged by the driller, while warmer water is associated with the intervening or underlying sand and gravel. Had all the water entered the deeper aquifer by leakage through the till it would have been no warmer than the water in the till itself. The zones of warmer water in well 530 reach nearly the same maxim.tun temperatures, whereas the lower warm zone in well 531 is much cooler than the upper warm zone. This indicates that the movement of water fron1 the shallower to the deeper aquifer was taking place more rapidly in the vicinity of well 530, where the till is absent locally, than in the vicinity of well531, where the flow was chiefly by leakage tJwough the till.
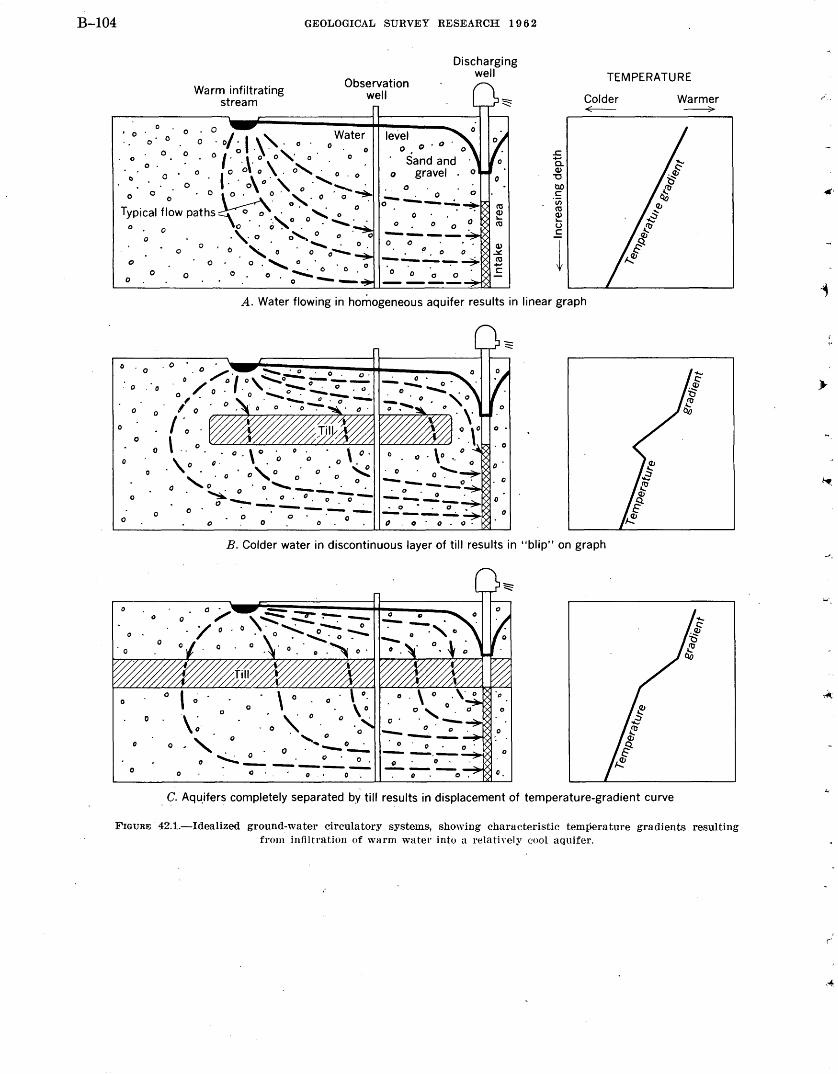
B-104 GEOLOGICAL SURVEY RESEARCH 1962
Observation well
Discharging well TEMPERATURE
Warm infiltrating stream
0 0
o · o/ ~ I . \ '\ . o Water • 0
o' o 0
. 0 0 0 0 ,. . \· 0 0 ,. 0
o.O o.,o.O o\.o'· o.o
0
0 0 . 0\ 0 " ·' 0 0 '\ 0 ·' 0 ............
0 0 ~· 0, . ., 0
Typical flow paths\ o_ o ·.~ o. 0 ~ ._:.,_ •0
0 0 0 • 0' . ~ .,. 0 0' 0 0
0
0
0 0 0
0 • .......___
0 ' 0 0 0--o.,o.·o 'o 0
0 • 0. :-----.:
0
level 0
0 . () .
Sand and 0 gravel
0
0 0
0 0 ~
0 0
0
..c ...... a. Q,) '0 t:l.O c ·v; ro Q,)
u c
l
Colder ~
A. Water flowing in homogeneous aquifer results in linear graph
0 0
0
0
0
0
0
0
0 0
0 • 0
0
0
0
0
'
B. Colder water in discontinuous layer of till results in "blip" on graph
0. -
/ "..::::- -.:::: ~ -/
0 • 0 ~. '"" 0-- ~ 0 .............. 0 -~
0 • Cl ·~ 0.
\ 0
0 0
0 -
' 0
'~ D
0
,, 0 0 .
' 0
0 ...__
~.!._ 0 0 ----0 0 0
C. Aqu,Hers completely separated by till results in displacement of temperature-gradient curve
Warmer ~
FIGURE 42.1.-ldealized ground-water circulatory systems, showing characteristic temperature gradients resulting from infiltration of warm watet· into a relatiYely cool aquifer.
.~;
r·
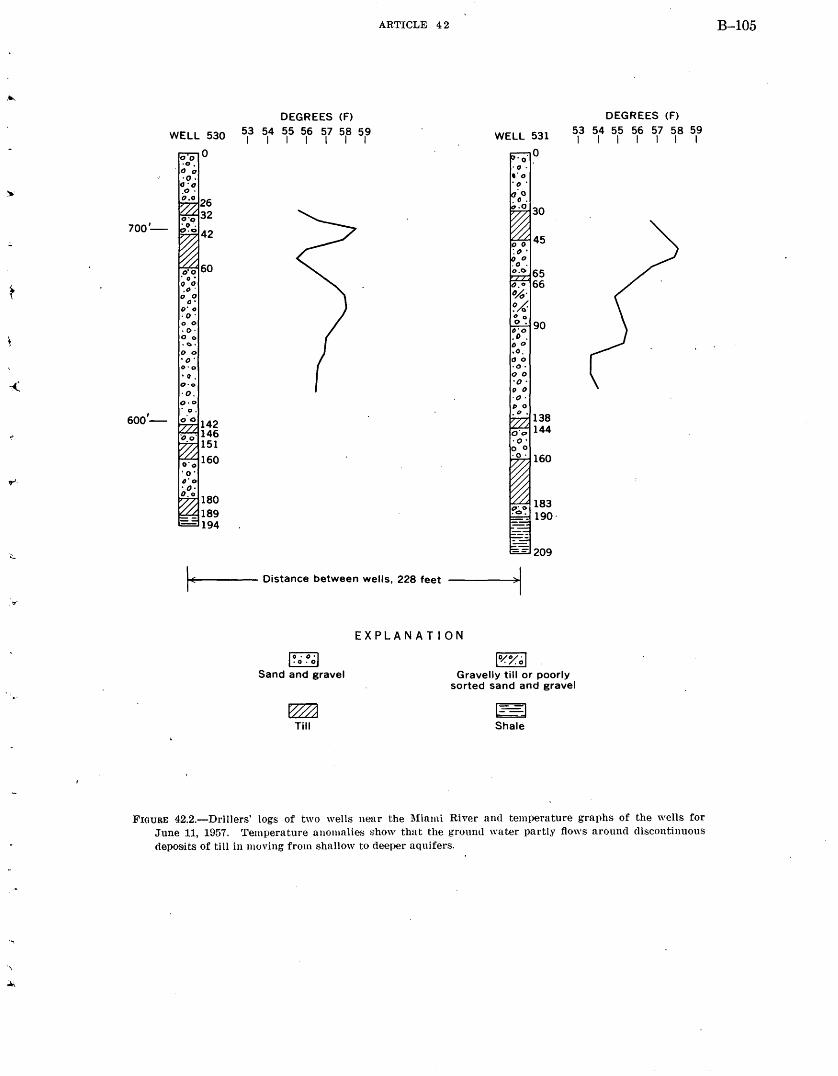
.....
;.
·<
r
_.,.
·~
700'-
6001-
WELL 530
tfO 60 • 0. 0 0 ,D.
0 0 a·
I)' 0 ·0. 0 0 . 0· 0 0
·~· I) 0 ·o. o·o • 0. O·o ·0. 0•0 . 0.
DEGREES (F)
53 54 55 56 57 58 59 I I I I I I I
ARTICLE 42
11-1<~------ Distance between wells, 228 feet
D'O .D Do .o. 0 0 ·0. oo ·o. " 0 ·O, , 0
·".
45
90
138 144
160
DEGREES (F)
53 54 55 56 57 58 59 I I I I I I I
EXPLANATION
~ ~
Sand and gravel
~ Till
IO/o71 ~
Gravelly till or poorly sorted sand and gravel
Shale
l!"IOURE 42.2.-Drillers' logs of two wells near the Miami River and temperature graphs of the wells for June 11, 1957. Temperature anomalies show that the gronnu water partly flows around discontinuous deposits of till in moving from shallow to deeper aquifers.
B-105
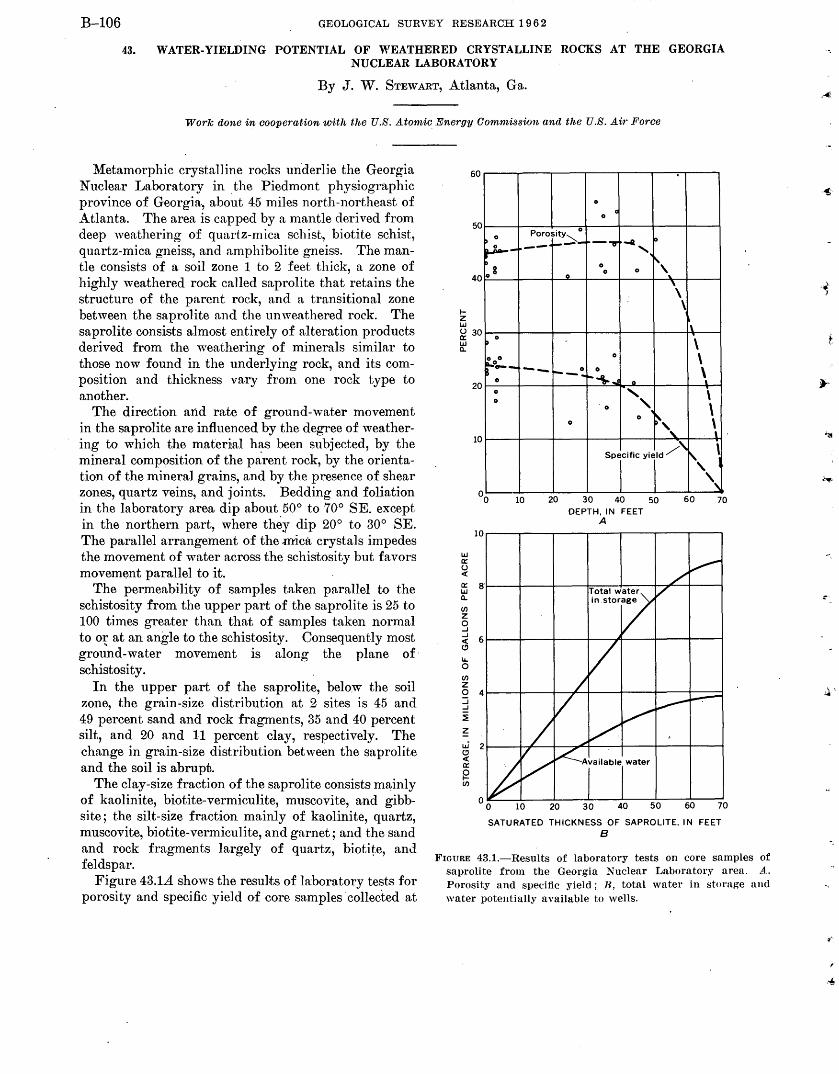
B-106 GEOLOGICAL SURVEY RESEARCH 1962
43. WATER-YIELDING POTENTIAL OF WEATHERED CRYSTALLINE ROCKS AT THE GEORGIA NUCLEAR LABORATORY
By J. W. STEWART, Atlanta, Ga.
Work done in cooperation with the U.S. Atomic Energy Commission and the U.S. Air· Force
Metamorphic crystalline rocks underlie the Georgia Nuclear Laboratory in _the Piedmont physiographic province of Georgia, about 45 miles north-northeast of Atlanta. The area is capped by a mantle derived from deep weathering of quartz-mica schist, biotite schist, quartz-mica gneiss, and amphibolite gneiss. The mantle consists of a soil zone 1 to 2 feet thick, a zone of highly weathered rock ca1led saprolite that retains the structure of the parent rock, and a transitional zone between the saprolite and the unweathered rock. The saprolite consists almost entirely of alteration products derived from the weathering of minerals similar to those now found in the underlying rock, and its composition and thickness vary from one rock type to another.
The direction and rate of ground-water movement in the saprolite are influenced by the degree of weathering to which the matedal has been subjected, by the mineral compqsition of the parent rock, by the orientation of the mineral grains, and by the presence of shear zones, quartz veins, and joints. Bedding and foliation in the laboratory area dip about 50° to 70° SE. except in the northern part, where they dip 20° to 30° SE. The parallel arrangement of the .mica crystals impedes the movement of water across the schistosity but favors movem~nt parallel to it.
The permeability of samples taken parallel to the schistosity from the upper part of the saprolite is 25 to 100 times greater than that of samples taken normal too~ at an angle to the schistosity. Consequently most ground-water movement is along the plane ofschistosity.
In the upper part of the saprolite, below the soil zone, the grain-size distribution at 2 sites is 45 and 49 percent sand and rock fragments, 35 and 40 percent silt, and 20 and 11 percent clay, respectively. The change in grain-size distribution between the saprolite and the soil is abrupt.
The clay-size fraction of the saprolite consists m~inly of kaolinite, biotite-vermiculite, muscovite, and gibbsite; the silt-size fraction mainly of kaolinite, quartz, muscovite, biotite-vermiculite, and garnet; and the sand and rock fragments largely of quartz, biotite, and feldspar.
Figure 43.1A shows the results of laboratory tests for porosity and specific yield of core samples collected at
1-z LLJ
60
50
40
~ 30
~
20
10
10
LLJ 0:: u c(
0:: LLJ
a· a.. (/)
z 0 ...J ...J
6 c( (!)
u... 0 (/)
z 0 4 ::::i ...J
~
~ u.i 2 (!) c( 0::
~ (/)
0
c 0
0 Porosity"'-. 0
--.,. -a, 0
~-~--f.--'-~ g 0
0 ~,
0 0 0
-.. \
\
\ ~ 0 \ 0 0 0 \ ~0-- -- ~-~ 0 \ ~
.. '"'\-..J 0 0
0
' \ 0
' 0 \ 0 ~, 0 \ -,
' s·r·;c y;r /, '· \ ' ', 10 20 30 40 50 60 70
DEPTH, IN FEET A
00 10
SATURATED THICKNESS OF SAPROLITE, IN FEET B
FIGURE 43.1.-Results of laboratory tests on core samples of saprolite from the Georgia Nuclear Laboratory area. A .. Porosity and specific yield; B, total water in storage and water potentially ayailable to wells.
-'!;
-~ }
-.
_c),-'·
-.
ri
,.
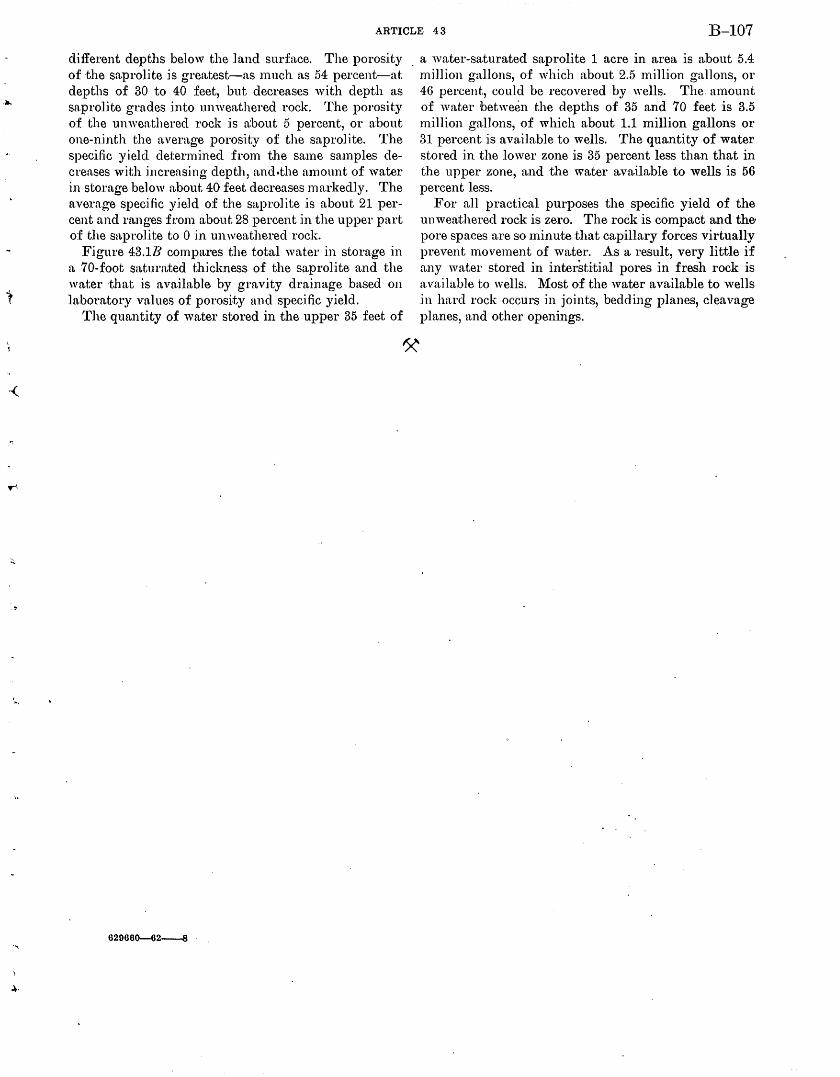
·{
I ~-
ARTICLE 43 B-107
different depths below the ]and surface. The porosity of the sa.prolite is grea.test-as much as 54 percent-at depths of 30 to 40 feet, but decreases with depth as sapro]jte grades into unwea.thered rock. The porosity o:f. the unweathered rock is a:bout 5 percent, or about one-ninth the average porosity of the saprolite. The specific yield. determined from the same samples decren.ses with :incrensing depth, and.the amount of water in storage below ttbout 40 feet decreases markedly. The average speci fie yield of the saprolite is about 21 percent and ranges from about 28 percent in the upper part o:f the saprolite to 0 :in unweathered rock.
Figure 43.1/J compa.res the total water in storage in a 70-foot saturn,ted thickness of the saprolite and the wa.ter that :is available by gravity drainage based on laboratory values of porosity and specific yield.
The quantity of water stored in the upper 35 feet of
629660--62----8 '
_ a water-saturated saprolite 1 acre in area is about 5.4 million g~tllons, of which about 2.5 million gallons, or 46 percent, could be recovered by wells. The. amount of water between the depths of 35 and 70 feet is 3.5 million gallons, of which about 1.1 million gallons or 31 percent is available to wells. The quantity of water stored in the lower zone is 35 percent less than that in the upper zone, and the water available to wells is 56 percent less.
For all practical purposes the specific yield of the unweathered rock is zero. The rock is compact and the· pore spaces are so minute that capillary forces virtually prevent movement of water. As a result, very little if any water stored in interstitial pores in fresh rock is available to wells. Most of the water available to wells in hard rock occurs in joints, bedding planes, cleavage planes, and other openings.
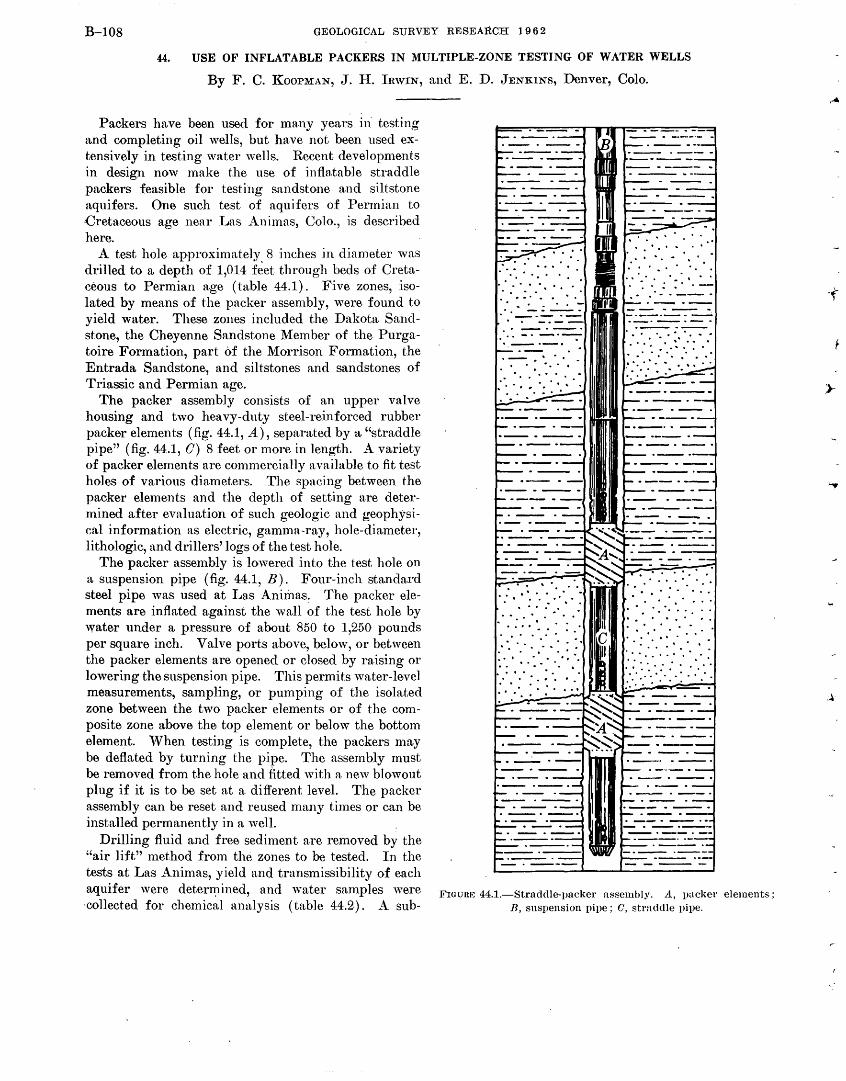
B-108 GEOLOGICAL SURVEY RESEARCH 1962
44. USE OF INFLATABLE PACKERS IN MULTIPLE-ZONE TESTING OF WATER WELLS
By F. C. KooPMAN, J. H. IRwiN, and E. D. JENKINs, Denver, Colo.
Packers have been used for many years in· testing and completing oil wells, but have not been used extensively in testing water wells. Recent developments in design now make the use of inflatable straddle packers feasible for testing sandstone and siltstone aquifers. One such test of aquifers of Permian to •Creta.ceous age near Las Animas, Colo., is described here.
A test hole approximately 8 inches in diameter was drilled to a depth of 1,014 f~et through beds of Cretaceous to Permian a.ge (table 44.1) . Five zones, isolated by means of the packer assembly, were found to yield water. These zones included the Dakota Sandstone, the Cheyenne Sandstone Member of the Purgatoire Formation, part of the Morrison Formation, the Entrada Sandstone, and siltstones and sandstones of Triassic and Permian age.
The packer assembly consists of an upper valve housing and two heavy-duty steel-reinforced rubber packer elements (fig. 44.1, A), separated by a "straddle pipe" (fig. 44.1, 0) 8 feet or more in length. A variety of packer elements are commercially available to fit test holes of various diameters. The spacing between the packer elements and the depth of setting are determined after evaluation of such geologic and geophysical information as electric, gamma-ray, hole-diameter, lithologic, and drillers' logs of the test hole.
The packer assembly is lowered into the test hole on a suspension pipe (fig. 44.1, B). Four-inch standard steel pipe was used at Las Animas: The packer elements are inflated against the wall of the test hole by water under a pressure of about 850 to 1,250 pounds per square inch. Valve ports above, below, or between the packer elements are opened or closed by raising or lowering the suspension pipe. This permits water-level measurements, sampling, or pumping of the isolated zone between the two packer elements or of the composite zone above the top element or below the bottom element. When testing is complete, the packers may be deflated by turning the pipe. The assembly must be removed from the hole and fitted with a new blowout plug if it is to be set at a different level. The packer assembly can be reset and reused many times or can be installed permanently in a well.
Drilling fluid and free sediment are removed by the "air lift" method from the zones to be tested. In the tests at Las Animas, yield and transmissibility of each aquifer were deterll).ined, and water samples were ·collected for chemical analysis (table 44.2). A sub-
..... . . ..... · .
....... . .. ... . . . . . . . . . . . . . . ·.
FIGURE 44.1.-Straddle-paeker assembly. A., pacl.:er elements; B, suspension pipe; C, straddle pipe.
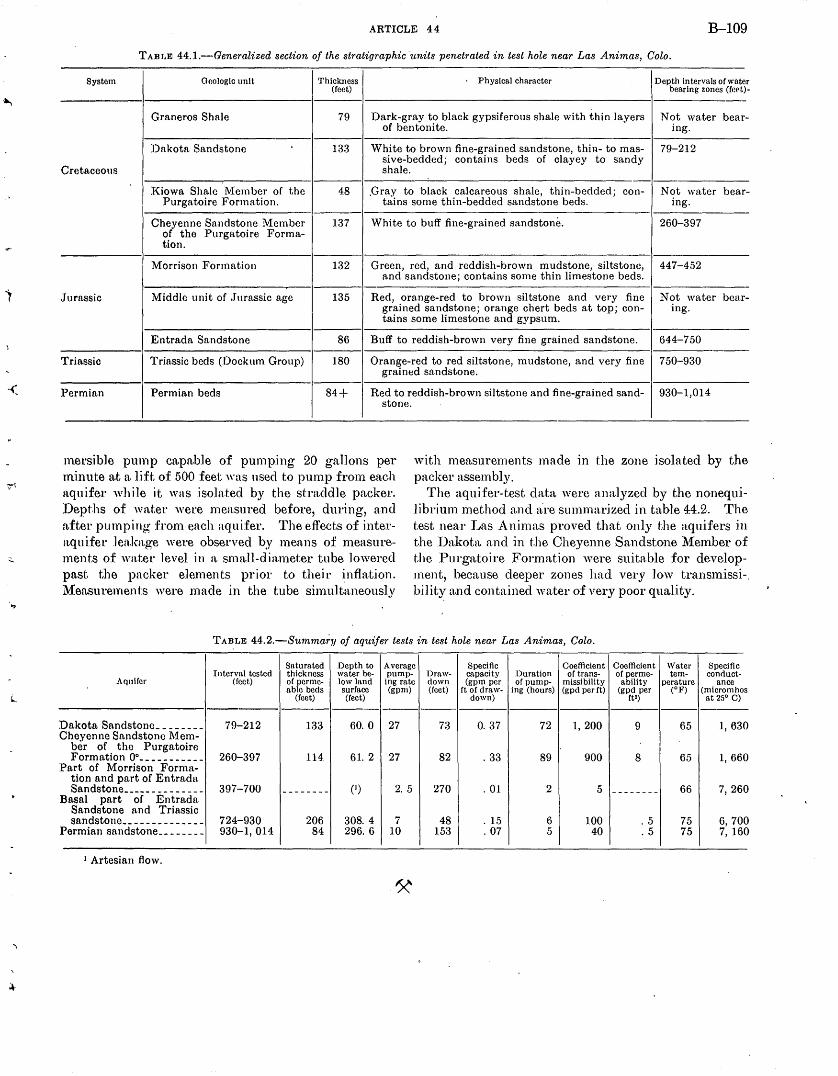
-(
~-
ARTICLE 44 B-109
T ABI .. E 44.1.-Generalized section of the stratigraphic units penetrated in test hole near Las Animas, Colo.
System Geologic unit Thickness Physical character Depth intervals of water (feet) bearing zones (fc('t)-
Graneros Shale 79 Dark-gray to black gypsiferous shale with thin layers Not water bear-of bentonite. in g.
Dakota Sandstone 133 White to brown fine-grained sandstone, thin- to mas- 79-212 sive-bedded; contains beds of clayey to sandy
Cretaceous shale.
Kiowa Shale lVIem ber of the 48 .Gray to black calcareous shale, thin-bedded; con- Not water bear-Purgatoire :Formation. tains some thin-bedded sandstone beds. ing.
Cheyenne Sandstone Member 137 White to buff fine-grained sandstone. 260-397 of the Purgatoire Forma-tion.
Morrison Formation 132 Green, red, and reddish-brown mudstone, siltstone, 447-452 and sandstone; contains some thin limestone beds.
Jurassic Middle unit of Jurassic age 135 Red, orange-red to brown siltstone and very fine Not water bear-grained sandstone; orange chert beds at top; con- in g. tains some limestone and gypsum.
Entrada Sandstone 86 Buff to reddish-brown very fine grained sandstone. 644-750
Triassic Triassic beds (Dockum Group) 180 Orange-red to red siltstone, mudstone, and very fine 750-930 grained sandstone.
Permian Permian beds 84+ Red to reddish-brown siltstone and fine-grained sand- 930-1,014 stone.
m.ersible pump cn.p:tble of pumping 20 gallons per minute a.t a. lift of 500 feet was used to pump from each aquifer while it was .isolated by the straddle packer. Depths o:f water were measured before, during, and :tfter pumping from ench aquifer. The effects of intern,qu ifet.· ]en.kn.ge were observed by means of measurements of water level i11 a smaH-dia.meter tube lowered past. the packer ele.ments prior to their ~nflation. ~{ensurements were made in the tube simultaneously
with measurements made in the zone isolated by the packer assembly.
Aquifer
Dakota Sandstone ________ Cheyenne Sandstone Mem-
ber of the Purgatoire Formation oo ___________
Part of Morrison Forma-tion and part of Entrada. Sandstone ______________
Basal part of Entrada Sandstone and Triassic sandstone ______________
Permian sandstone ________
I Artesian flow.
The aquifer-test data were analyzed by the nonequi]ibrium method a.nd ~-tre summarized in table 44.2. The test near Las Animas proved that only the aquifers in the Da.kota and in the Cheyenne Sandstone ~{ember of the Purga.toire Formation were suitable for development, because deeper zones had very low transmissi-. hility and contained water of very poor quality.
TABI .. E 44.2.-Summary of aquifer tests in test hole near Las Animas, Colo.
Saturated Depth to Average Specific Coefficient Coefficient \Vater Specific Interval tested thickness water be- pump- Draw- capacity Duration of trans- of perme- tem- conduct-
(feet) of perme- low land ing rate down (gpm per of pump- missibility ability perature a nee able beds surface (gpm) (feet) ft of draw- ing (hours) (gpd perft) (gpd per (oF) (micromhos
(feet) (feet) down) ft2) at 25° C) --- ----
79-212 133 60. 0 27 73 0. 37 72 1, 200 9 65 1, 630
260-397 114 61. 2 27 82 . 33 89 900 8 65 1, 660
397-700 -------- (I) 2. 5 270 . 01 2 5 -------- 66 7, 260
724-930 206 308. 4 7 48 . 15 6 100 .5 75 6, 700 930-1, 014 84 296. 6 10 153 . 07 5 40 .5 75 7, 160
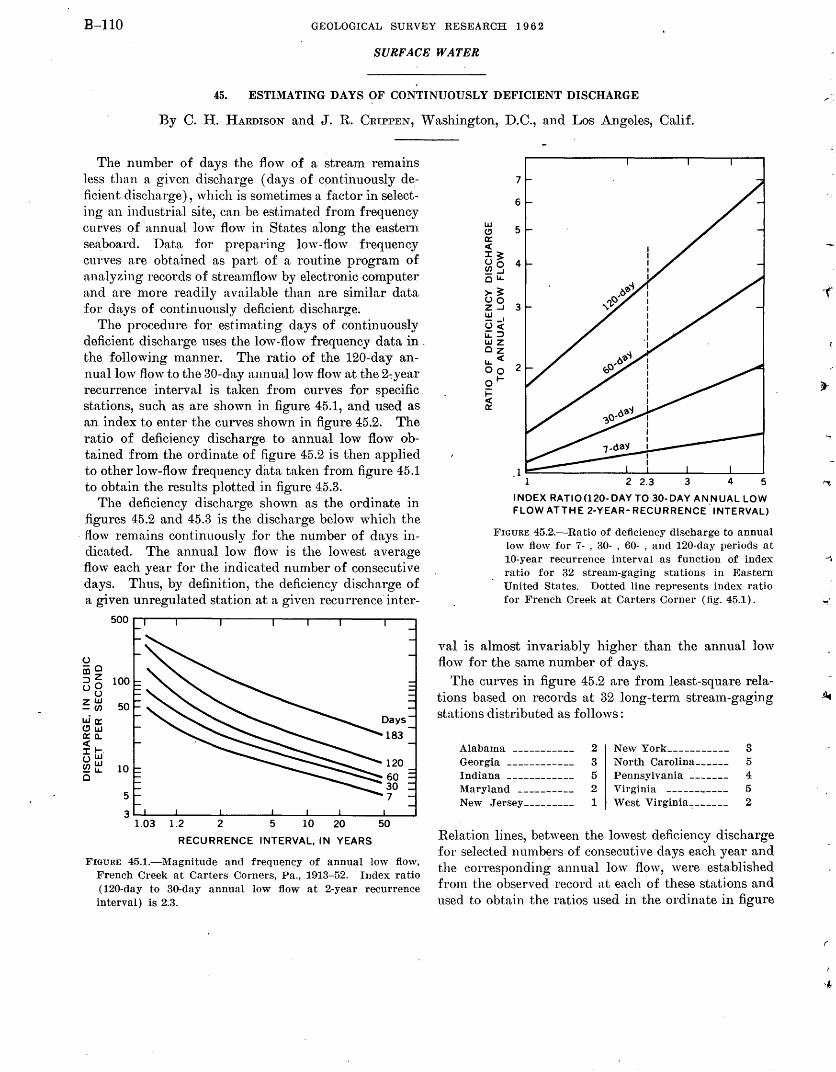
B-110 GEOLOGICAL SURVEY RESEARCH 1 9 6 2
SURFACE WATER
45. ESTIMATING DAYS OF CONTINUOUSLY DEFICIENT DISCHARGE
By C. H. HARDISON and J. R. CRIPPEN, Washington, D.C., and Los Angeles, Calif.
The number of days the flow of a strea.m remains less than a given discharge (days of continuously deficient discharge), which is sometimes a factor in selecting an industrial site, can be estimated from frequency curves of annual low flow in States along the eastern seaboard. Data for preparing low-flow frequency curves are obtained as part of a routine program of analyzing records of streamflow by electronic computer and are more readily available than are similar data for days of continuously deficient discharge.
The procedure for estimating days of continuously deficient discharge uses the low-flow frequency data in. the following manner. The ratio of the 120-day annual low flow to the 30-day annual low flow at the 2-:yea.r recurrence interval is taken from curves for specific stations, such as are shown in figure 45.1, and used as an index to enter the curves shown in figure 45.2. The ratio of deficiency discharge to annual low flow obtained from the ordinate of figure 45.2 is then applied to other low-flow frequency data taken from figure 45.1 to obtain the results plotted in figure 45.3.
The deficiency discharge shown as the ordinate in figures 45.2 and 45.3 is the discharge below which the
·flow remains continuously for the number of days indicated. The annual low flow is the lowest average flow each year for the indicated number of consecutive days. Thus, by definition, the deficiency discharge of a given unregulated station at a given recurrence· inter-
500~----r-----r-----~----~--~----~---,
u iii~ :::::10 100 uu ~ ~ 50 wa::: C!'UJ a::: a.. < :I: ...... uw ~~ Cl
10
5
3~----~----~----_.----~--~----~--~ 1.03 1.2 2 5 10 20 50
RECURRENCE INTERVAL, IN YEARS
FIGURE 45.1.-l\Iagnitude and frequency of annual low flow, Frencn Creek at Carters Corners, Pa., 1913-52. Index ratio (120-day to 30-day annual low flow at 2-year recurrence interval) is 2.3.
UJ (!l a::: c(
:I:~ uo ~_J 0~
>~ uo Z-l
~ -· Uc( ~:::I UJZ cz ~c(
oo ol-i= c( 0:::
7
6
5
4
3
2
1~------------~~----_.----~--~ 1 2 2.3 3 4 5
INDEX RATIOC120-DAY TO 30-DAY ANNUAL LOW FLOW ATTHE 2-YEAR- RECURRENCE .INTERVAL)
FIGURE 45.2.-Ratio of deficiency discharge to annual low flow for 7- , 30- , 60- , and 120-day periods at 10-year recurrence interval as function of index ratio for 32 stream-gaging stations in lDastern United States. Dotted line represents index ratio for French Creek at Carters Corner (fig. 45.1).
val is almost invariably higher than the annual low flow for the same number of days.
The curves in figure 45.2 are from least-square r.elations based on records at 32 long-term stream-gaging stations distributed as follo,vs:
Alabama ----------- 2 New York ___________ 3 Georgia ------------ 3 North Carolina ______ 5 Indiana ------------ 5 Pennsylvania ------- 4 Maryland ---------- 2 Virginia ----------- 5 New Jersey--------- 1 'Vest Virginia-:------ 2
Relation lines, between the lowest deficiency discharge for selected num~rs of consecutive days each year and the corresponding annual low flow, were established from the observed record at each of these stations and used to obtain the ratios used in the ordinate in figure
·(·
])-
'"'·
~~
-~
(
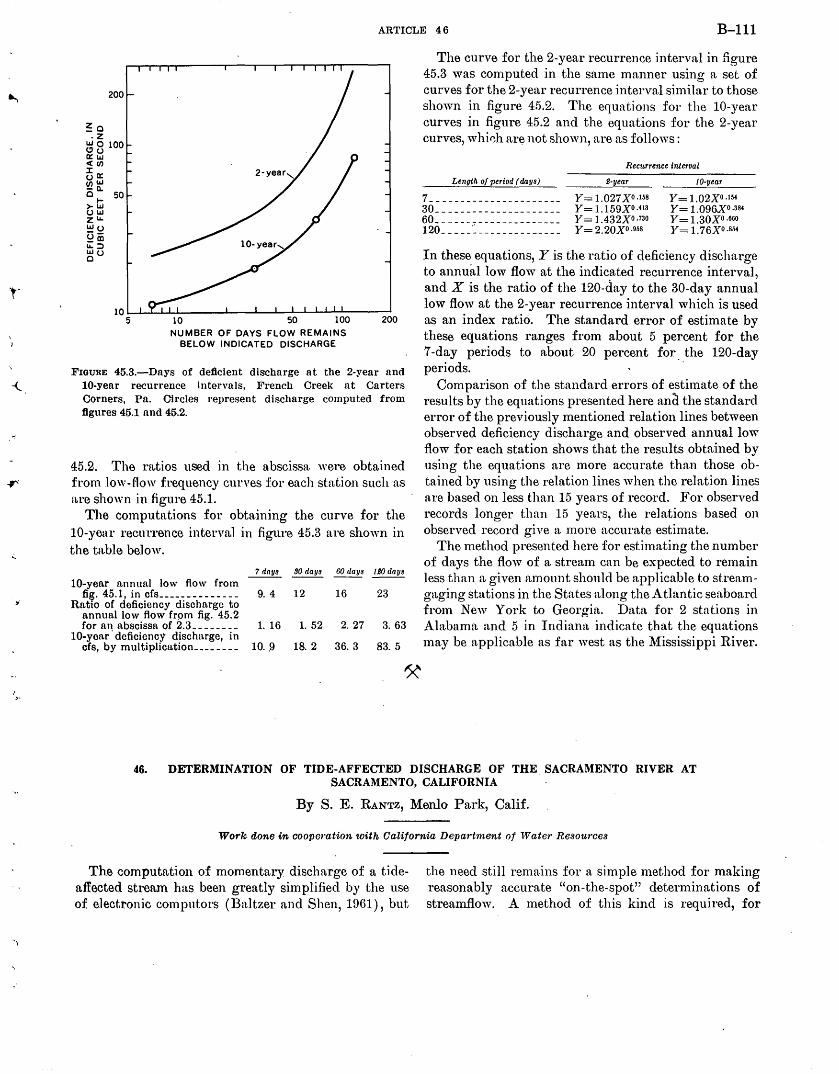
,.
! .)oo
ARTICLE 46 B-111
200
~0 .z ~ 0 100 0:~ c((J) J:o: (.)UJ !QQ. 01- 50 >UJ (.)UJ zu.. U.l(.)
Qai U..::::l ~(.)
NUMBER OF DAYS FLOW REMAINS BELOW INDICATED DISCHARGE
FIGURE 45.3.-Dnys of deficient discharge at the 2-year and 10-year recurrence Intervals, French Creek at Carters Corners, Pn. Circles represent discharge computed from figures 45.1 and 45.2.
45.2. The rn,tios used in the abscissa were obtained from low-flow frequency curves for each station such as n.re shown .in figure 45.1.
The computations for obtaining the curve for the 10-year recurrence interval in figure 45.3 are shown in the tn,ble below.
7 days SO days 60 days teo day.~ 10-year annual low flow from
fig. 45.1, in cfs ______________ 9. 4 12 16 23 Ratio of deficiency discharge to
annual low flow from fig. 45.2 for ar~ ttbscissa of 2.3 ________ 1. 16 1. 52 2. 27 3. 63
10-year deficiency dischttrge, in cfs, by multiplication ________ 10 .. 9 18. 2 36. 3 83. 5
~
The curve for the 2-year recurrence interval in figure 45.3 was computed in the same manner using a set of curves for the 2-year recurrence interval similar to those shown in figure 45.2. The equations for the 10-year curves in figure 45.2 and the equations for the 2-year curves, whi~h ar~ not shown, are as follows:
Length of period (days)
7 _____________________ _ 30 ____________________ _ 60 ____________________ _
120 _____ ~--------------
Recurrence interval
£-year
y = 1.027 xo .158 Y= 1.159X0.41a Y= 1.432Xo.7ao Y=2.20X0.958
10-year
y = 1.02XO .154 Y = 1. 096X0 .384 y = 1.30XO .660 Y= 1.76Xo.854
In these equations, Y is the ratio of deficiency discharge to annua1 low flow at the indicated recurrence interval, and X is the ratio of the 120-day to the 30-day annual low flow at the 2-year recurrence interval which is used as an index ratio. The standard error of estimate by these equations ranges from about 5 percent for the 7 -day periods to about 20 percent for. the 120-day periods.
Comparison of the standard errors of estimate of the results by the equations presented here and the standard error of the previously mentioned relation lines between observed deficiency discharge and observed annual low flow for each station shows that the results obtained by using the equations are more accurate than those obtained by using the relation lines when the relation lines are based on less than 15 years of record. For observed records longer than 15 years, the relations based on observed record give a more accurate estimate.
The method presented here for estimating the number of days the flow of a stream can be expected to remain less than a given amount should be applicable to streamgaging stations in the States along the Atlantic seaboard from New York to Georgia. Data for 2 stations in Alabama and 5 in Indiana indicate that the. equations may be applicable as far west as the Mississippi River.
46. DETERMINATION OF TIDE-AFFECTED DISCHARGE OF THE SACRAMENTO RIVER AT SACRAMENTO, CALIFORNIA
By S. E. RANTZ, Menlo Park, Calif.
Work done in coopcmtion with California Departntent of Water Resources
The computation of momentary discharge of a tideaffected stream has been greatly simplified by the use of electronic computors (Baltzer and Shen, 1961), but
the need still remains for a simple method for making reasonably accurate "on-the-spot" determinations of streamflow. A method of this kind is required, for
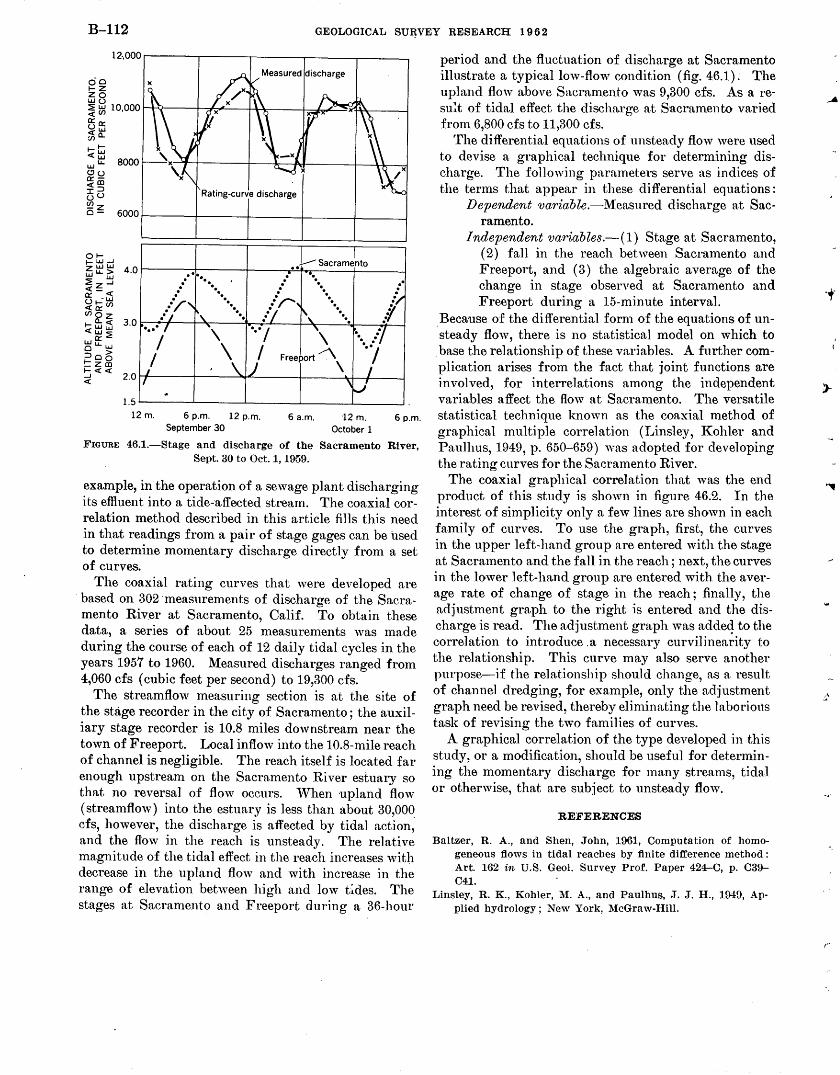
B-112 GEOLOGICAL SU~VEY RESEARCH 1 9 6 2
12-,000 r-----,----,------,-----,---~
Measured discharge
1.5 .___ __ _,.L ___ L_ __ _J_ ___ l_ _ __j
12m. 6 p.m. 12 p.m. 6 a.m. 12 m. 6p.m. September 30 October 1
FIGURE 46.1.-Stage and discharge of the Sacramento River, Sept. 30 to Oct. 1, 1959.
~xample, i~ the op~ration of a sewage plant discharging Its effluent Into a tide-affected stream. The coaxial correlation method described in this article fills this need in that readings from a pair of stage gages can be used to determine momentary discharge directly from a set of curves.
The coaxial rating curves that were developed are based on 302 measurements of discharge of the Sacramento River at Sacramento, Calif. To obtain these data, a series of about 25 measurements was made during the course of each of 12 daily tidal cycles in the years 1957 to 1960. Measured discharges ranged from 4,060 cfs (cubic feet per second) to 19,300 cfs.
The streamflow measuring section is at the site of the stage recorder in the city of Sacramento; the auxiliary stage recorder is 10.8 miles downstream near the town of Freeport. Local inflow into the 10.8-mile reach of channel is negligible. The reach itself is located far enough upstream on the Sacramento River estuary. so that no reversal of flow occurs. When upland flow (streamflow) into the estuary is less than about 30,000 cfs, however, ~he discharge is affected by tidal action,' and the flow In the reach is unsteady. The relative magnitude of the tidal effect in the reach increases with decrease in the upland flow and with increase in the range of elevation between high and low tides. The stages at Sacramento and Freeport during a 36-hour
period and the fluctuation of discharge at Sacramento illustrate a typical low-flow condition (fig. 46.1). The upland flow above Sacramento was 9,300 cfs. As a resu~t of tidal effect the discharge at Sacramento varied from 6,800 cfs to 11,300 cfs.
The differential equations of unsteady flow were used to devise a graphical technique for determining discharge. The following parameters serve as indices of the terms that appear in these differential equations:
Dependent variable.-Measured discharge at Sacramento.
Independent variables.- ( 1) Stage at Sacramento, (2) fall in the reach between Sacramento and Freeport, and ( 3) the algebraic average of the change in stage observed at Sacramento and Freeport during a 15-minute interval.
_Beca·use of the differential form of the equations of unsteady flow, there is no statistical model on which to
. base the relationship of these variables. A further complication arises from the fact that joint functions are involved, for interrelations among the independent variables affect the flow at Sacramento. The versatile statistical technique known as the coaxial method of graphical multiple correlation (Linsley, Kohler and Paulln~s, 1949, p. 650-659) was adopt~d for developing the rating curves for the Sacramento River.
The coaxial graphical correlation that was the end product of this study is shown in figure 46.2. In the interest of simplicity only a few lines are shown in each family of curves. To use the graph, first, the curves in the upper left-hand group are entered with the stage at Sacramento and the fall in the reach; next, the curves in the lower left-hand group are entered with the average rate of change of stage in the reach; finally, the adjustment graph to the right is entered and the dis-charge is read. The adjustment graph was added to the correlation to introduce .a necessa.ry curvilinea~ity to the relationship. This curve may also serve another purpose-if the relationship should change, as a result of channel dredging, for example, only the adjustment graph need be revised~ thereby eliminating the laborimts task of revising the two families of curves.
A graphical correlation of the type developed in this study, or a modification, should be useful for determining the momentary discharge for many streams, tidal or otherwise, that are subject to unsteady flow.
REFERENCES
Baltzer, R. A., and Shen, John, 1961, Computation of homogeneous flows in tidal reaches by finite difference method: Art. 162 in U.S. Geol. Survey Prof. Paper 424-C, p. 039-041. .
Linsley, R. K., Kohler, M. A., and Paulhus, J . .J. H., 1949, Applied hydrology; New York, McGraw-Hill.
r"
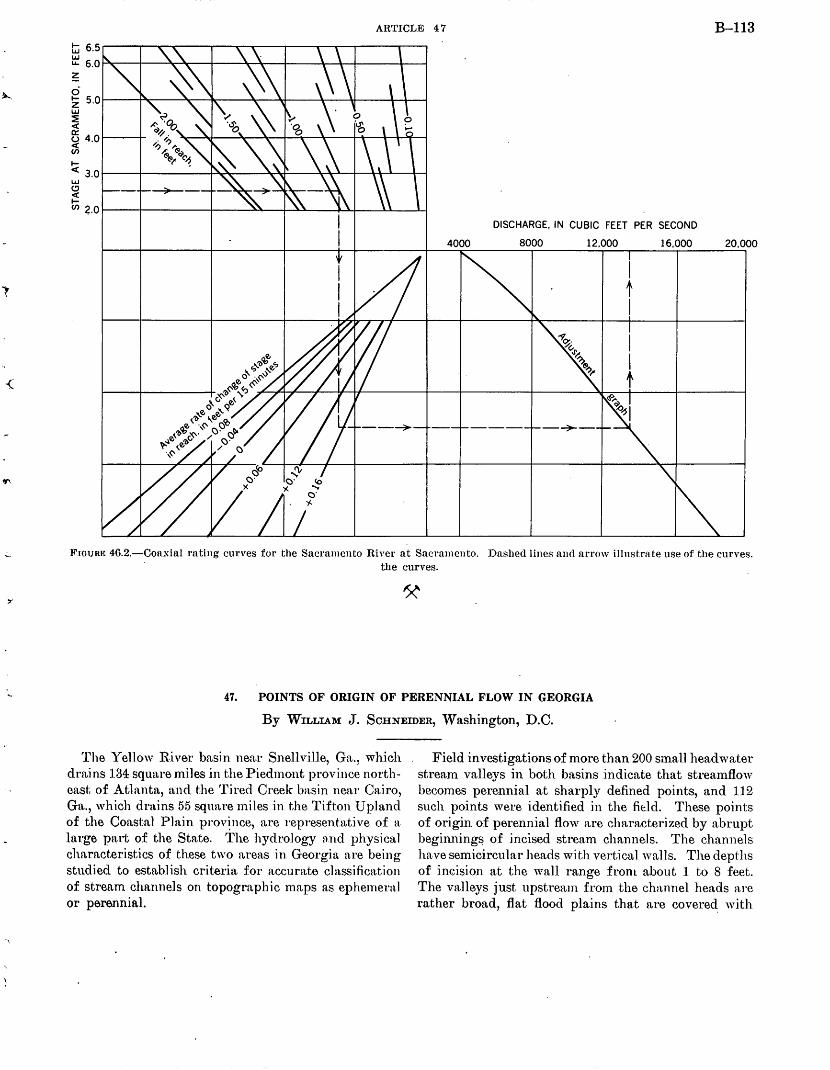
'\
ARTICLE 47 B-113 ~ 6.5~---r~~~---r--,-~--~--~~~-r-----r--~
~ 6.0 ~---+--~~~-+--~~tr---1------\---\---J------\--~ ~ ci ~ 5.0~--~~--~~~~--~--4&----~--~----+-+-~ UJ :E <( 0:: ~ 4.0 C/)
I-<( 3.0 1----+---------+:Y,.~--~~~--~rl--+-~r+-.L...---+---i UJ (!) <( 1-C/) z.o ~---+----------1-----~lo.--+~L---~~-----l...l..__ __ L-j
DISCHARGE, IN CUBIC FEET PER SECOND
8000 12,000 16,000 20,000
]f'IOUJU~ 46.2.-Coaxial rating curves fol' the Sacramento River at Sacramento. Dashed lines and arl'OW illustrate use of the curves. the curves.
47. POINTS OF ORIGIN OF PERENNIAL FLOW IN GEORGIA
By WILLIAM J. ScHNEIDER, Washington, D.C.
The Yellow River basin nea.r Snellville, Ga .. , which drains 1.34 square miles in the Piedmont province. northcast of Atlanta, and the Tired Creek basin near Cairo, Gn .. , which drains 55 sqwtre miles in the Tifton Upland of the Coastal Plain provjnce, are representative of a. large part of the State. The hydrology nnd physical charncteristics of these two areas in Ge01·gin. are being studied to establish criteria for accurate classification of stream channels on topographic maps as ephemeral or perennial.
Field investigations of more than 200 small headwater stream valleys in both basins indicate that streamflow becomes perennial at sharply defined points, and 1.1.2 such points were identified in the fidd. These points of origin of perennial flow are characterized by abrupt beginning~ of incised stream channels. The channels have semicircular heads with vertical walls. The depths of incision at the wall range from about 1. to 8 feet. The valleys just upstream from the channel heads are rather broad, flat flood plains that are covered. with
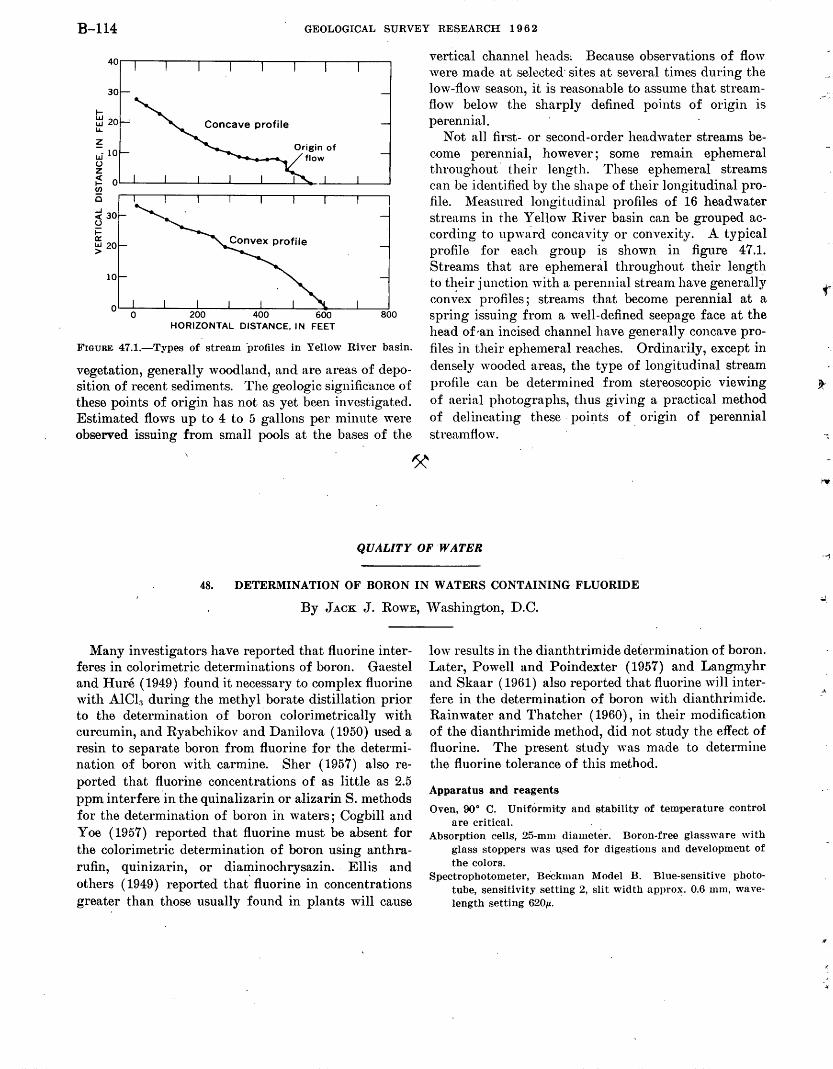
B-114 GEOLOGICAL SURVEY RESEARCH 1 9 6 2
Concave profile
o~~--~--~--~--~----~--~---L--~ 0 wo ~0 600 800
HORIZONTAL DISTANCE, IN FEET
FIGURE 47.1.-Types of stream -profiles in Yellow River basin.
vegetation, generally woodland, and are areas of deposition of recent sediments. The geologic significance of these points of origin has not as yet been investigated. Estimated flows up to 4 to 5 gallons per minute were observed issuing from small pools at the bases of the
vertical channel heads; Because observations of flow were made at selected- sites at several times during the low-flow season, it is reasonable to assume that streamflow below the sharply defined points of origin is perennial.
Not all first- or second-order headwater streams become perennial, however; some remain ephemeral throughout· their length. These ephemeral streams can be identified by the shn pe of their longitudinal profile. l\feasured longitudinal profiles of 16 headwater streams in the Yellow River basin can be grouped according to upward concavity or convexity. A typical profile for each group is shown in figure 47.1. Streams that are ephemeraJ throughout their length to their junction with a perennial strean1 have generally con~ex profiles; streams that become perennial at a spring issuing from a well-defined seepage face at the head of ,an incised channel have generally concave profiles in their ephemeral reaches. Ordinarily, except in densely wooded areas, the type of longitudinal stream profile can be determined from stereoscopic viewing of aerial photographs, thus giving a practical method of delineating these points of_ origin of perennial streamflow.
QUALITY OF WATER
48. DETERMINATION OF BORON IN WATERS CONTAINING FLUORIDE
By JACK J. RowE, Washington, D.C.
Many investigators have reported that fluorine interferes in colorimetric determinations of boron. Gaestel and Hure (1949) found it necessary to complex fluorine with A1Cl3 during the methyl borate distillation prior to the determination of boron colorimetrically with curcumin, and Ryabchikov and Danilova ( 1950) used a resin to separate boron from fluorine for the determination of boron with carmine. Sher ( 1957) also reported that fluorine concentrations of as little as 2.5 ppm interfere ·in the quinalizarin or alizarin S. methods for the determination of boron in waters; Cogbill and Yoe (1957) reported that fluorine must be absent for the colorimetric determination of boron using anthrarufin, quinizarin, or diaminochrysazin. . Ellis and others (1949) reported that' fluorine in concentrations greater than those usually found in plants will cause
low results in the dianthtrimide determination of boron. Later, Powell and Poindexter (1957) and Langmyhr and Skaar ( 1961) also reported that fluorine will interfere in the determination of boron with dianthrimide. Rain water and Thatcher ( 1960), in their modification of the dianthrimide method, did not study the effect of fluorine. The present study was made to determine the fluorine tolerance of this method.
Apparatus and reagents
Oven, ooo C. Uniformity and stability of temperature control are critical.
Absorption cells, 25-mm diameter. Boron-free glassware with glass stoppers was u.sed for digestions and development of the colors.
Spectrophotometer, Beckman Model B. Blue-sensitive phototube, sensitivity setting 2, slit width appro~. 0.6 mm, wavelength setting 620JL.
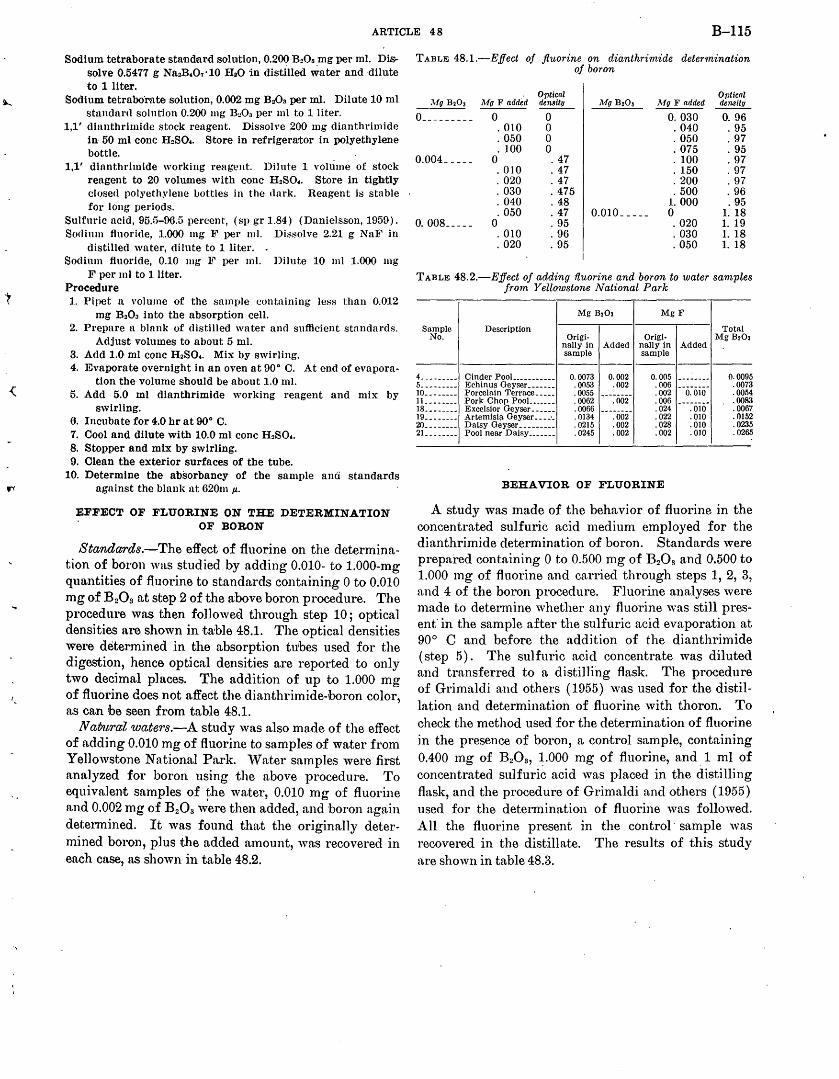
{
'·
ARTICLE 48 B-115
Sodium tetraborate standard solUJtion, 0.200 B~Os mg per ml. Dissolve 0.5477 g NfuJBc07·10 HaO in distilled water and dilute to lliter.
Sodium tetraborate solution, 0.002 mg BaOs per m.l. Dilute 10 ml stnndnrd solution 0.200 mg n~oa per ml to 1 liter.
1,1' <linnthrhni<le stock reagent. Dissolve 200 mg dianthrimide in- 50 ml cone 1-InSO.. Store in refrigerator in polyethylene bottle.
1,1' dlnnthrhnide worldng reagent. Dilute 1 voltime of stock reagent to 20 volumes with cone HnSO.. Store in tightly closed polyethylene bottles in the dark. Reagent is stable for long periods.
Sulfuric ncid, 95.G-00.5 percent, (sp gr 1.84) (Danielsson, 1959). Sodium fluoride, 1.000 mg 1!"' per ml. Dissolve 2.21 g NaF in
distilled water, dilute to 1 liter. . Sodium fluoride, 0.10 mg 1!.., per mi. Dilute 10 ml 1.000 mg
F per ml to 1liter. Procedure 1. Pipet a volume of the sample containing less than 0.012
mg B203 into the absorptiQn cell. 2. Prepare a blank of distilled water and sufficient standards.
Adjust volumes to about 5 ml. 8. Add 1.0 ml cone H2SO.. Mix by swirling. 4. Evaporate overnight in an oven at 90° C. At end of evapora
tion the volume should be about 1.0 ml. 5. Add 5.0 ml dlantbrimide worldng reagent and mix by
swirling. 6. Incubate for 4.0 hr at 90° C. 7. Cool and dilute with 10.0 ml cone H2SOc. 8. Stopper and mix by swirling. 9. Olean the exterior surfaces of the tube.
10. Determine the a·bsorbancy of the sample and standards agninst the blank nt 620m p..
EFFECT OF FLUORINE ON THE DETERMINATION . OF BORON
Standards.-The effect of fluorine on the determination of boron was studied by adding 0.010- to 1.000-mg quantities of fluorine to standards containing 0 to 0.010 mg of B20s at step 2 of the above boron procedure. The procedure was then followed through step 10; optical densities are shown in truble 48.1. The optical densities were determined in the absorption tubes used :for the digestion, hence optical densities are reported to only two decimal places. The addition o:f up to 1.000 mg of fluorine does not affect the dianthrimide-horon color, as can he seen from table 48.1.
N aflural waters.-A study was also made of the effect of adding 0.010 mg of fluorine to samples of water from Yellowstone National Park. Water samples were first analyzed for boron using the above procedure. To equivalent samples of Fhe water, 0.010 mg of fluorine and 0.002 mg o:f B20s were then added, and boron again determined. It was found that the originally determined boron, plus the added amount, was recovered in each case, as shown in table 48.2.
TABLE 48.1.-E.ffect of fluorine on dianthrimide determination of boron
MgB203 Mo F added Optical densit.TJ llfg B203 llfg F added
Optical dens it!!
o _________ 0 0 0. 030 0. 96 . 010 0 . 040 . 95 . 050 0 . 050 . 97 . 100 0 . 075 . 95
0.004_ ---- 0 . 47 . 100 . 97 . 010 . 47 . 150 . 97 . 020 . 47 . 200 . 97 . 030 . 475 . 500 . 96 . 040 . 48 1. 000 . 95 . 050 . 47 0.010 _____ 0 1. 18
0. 008 _____ 0 . 95 . 020 1. 19 . 010 . 96 . 030 1. 18 . 020 . 95 . 050 1. 18
TABLE 48.2.-E.ffect of adding fluorine and boron to water samples from Yellowstone National Park
MgB203 MgF
Sample Description Total No. Origi- Origi- MgB203
nally in Added nally in Added sample sample
---· ----------4_ -- ·----- Cinder PooL _________ 0. 0073 0.002 0.005 o. 0095 5_- ------- Echinus Geyser _______ .0053 .002 .006 .0073 10_ ------- Porcelain Terrace_---· .0055 .002 0.010 .0054 }}_ _______ Pork Chop PooL _____ .0062 .002 .006 .0083 18 __ ------ Excelsior Geyser_----- .0066 .024 .010 .0067 19 ________ Artemisif\ Geyser ____ ._ .0134 .002 .022 .010 .0152 20_ ------- Daisy Geyser _________ . 0215 .002 .028 .010 .0235 21_ _______ Pool near Daisy_. _____ . 0245 .002 .002 .010 .0265
BEHAVIOR OF F'LUORINE
A study was made of the behavior of fluorine in the concentrated sulfuric acid medium employed for the dianthrimide determination of boron. Standards were prepared containing 0 to 0.500 mg of B 20 3 and 0.500 to 1.000 mg of fluorine and carried through steps 1, 2, 3, and 4 of the boron procedure. Fluorine analyses were made to determine whether any fluorine was still present' in the sample after the sulfuric acid evaporation at 90° C and before the addition of the dianthrimide (step 5). The sulfuric acid concentrate was diluted and transferred to a distilling flask. The procedure of Grimaldi and others (1955) was used for the distillation and determination of fluorine with thoron. To check the method used for the determination of fluorine in the presence of boron, a control sample, containing 0.400 mg of B20a, ~.000 mg of fluorine, and. 1 ml of concentrated sulfuric acid was placed in the distilling flask, and the procedure of Grimaldi and others (1955) used for the determination of fluorine was followed. All the fluorine present in the control· sample was recovered in the distillate. The results of this study are shown in table 48.3.
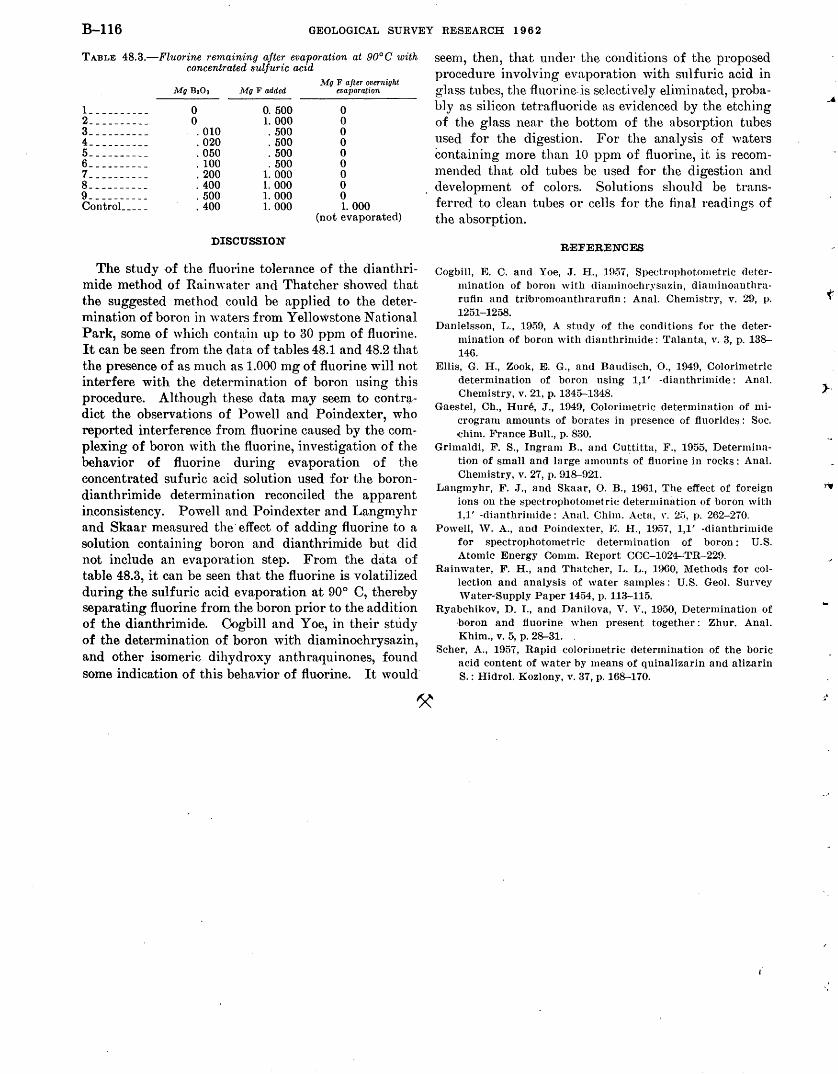
B-116 GEOLOGICAL SURVEY RESEARCH 1 9 6 2
TABLE 48.3.-Fluorine remaining after evaporation at 90°C with concentrated sulfuric acid
l _________ _ 2 _________ _ 3 _________ _ 4 _________ _ 5 _________ _ 6 _________ _ 7 _________ _ g _________ _ g _________ _ ControL ___ _
0 0 . 010 . 020 . 050 . 100 . 200 . 400 . 500 . 400
Mo F added
0. 500 1. 000 . 500 . 500 . 500 . 500
1. 000 1. 000 1. 000 1. 000
DISCUSSION
Mo F after ovemioht evaporation
0 0 0 0 0 0 0 0 0 1. 000
(not evaporated)
The study of the fluorine tolerance of the dianthrimide method of Rainwater and Thatcher showed that the suggested method could be applied to the determination of boron in waters from Yello,vstone National Park, some of which cont~in up to 30 ppm of fluorine. It can be seen from the data of tables 48.1 and 48.2 that the presence of as much as 1.000 mg of fluorine will not interfere with the determination of boron using this procedure. Although these data may seem to contr~dict the observations of Powell and Poindexter, who reported interference from fluorine caused by the complexing of boron with the fluorine, investigation of the behavior of fluorine during evaporation of the concentrated sufuric acid solution used for the borondianthrimide determination reconciled the apparent inconsistency. Powell and Poindexter and Langmyhr and Skaar measured the· effect of adding fluorine to a solution containing boron and dianthrimide but did not include an evaporation step. From the data of table 48.3, it can be seen that the fluorine is volatilized during the sulfuric acid evaporation at 90° C, thereby separating fluorine from the boron prior to the addition of the dianthrimide. Cogbill and Y oe, in their study of the determination of boron with diaminochrysa.zin, and other isomeric dihydroxy anthraquinones, found some indication of this behavior of fluorine. It would.
seem, then, that under the conditions of the proposed procedure involving evaporation with sulfuric acid in glass tubes, the fluorine. is selectively eli1ninated, probably as silicon tetrafluoride as evidenced by the etching of the glass near the bottom of the absorption tubes used for the digestion. For the analysis of waters containing more than 10 ppm of fluorine, it is recommended that old tubes be used for the digestion and development of colors. Solutions should be transferred to clean tubes or cells for the final readings of the absorption.
R:EFERENCES
Cogbill, E. C. and Yoe, .J. H., 1957, Spectrophotometric determination of boron with diaminochrysazin, diaminoanthrarufin and tri1bromoanthrarufin: Anal. Chemistry, v. 29, p. 1251-1258.
Danielsson, L., 1959, A study of the conditions for the determination of boron with dianthrimide: 'l'alanta, v. 3, p. 138-146.
Ellis, G. H., Zook, E. G., and Baudisch, 0., 1949, Colorimetric determination of boron using 1,1' -dianthrimide: Anal. Chemistry, v. 21, p. 1345-1348.
Gaestel, Ch., Hure, J., 1949, Colorimetric determination of microgram amounts of borates in presence of fluorides: Soc. ~chim. France Bull., p. 830.
Grimaldi, F. S., Ingram B., and Cuttitta, F., 1955, Determination of small and large amounts of fluorine in rocl{S: Anal. Chemistry, v. 27, p. 918-921.
Langmyhr, F .. J., and Skaar, 0. B., 1961, The effect of foreign ions on the speetrophotometric determination of boron with 1,1' -dianthrimide: Anal. Chim. Acta, , .. 2ii, p. 262-270.
Powell, ,V. A., and Poindexter, K H., 1957, 1,1' -diantbrimide for spectrophotometric determination of boron: U.S. Atomic Energy Comm. Report CCC-1024-:'l~R-229.
Rainwater, F. H., and Thatcher, I... I..., 1960, Methods for col~lection and analysis of water samples: U.S. Geol. Survey Water-·Supply Paper 1454, p. 113-115.
Ryabchikov, D. 1., and Danilova, V. V., 1950, Determination of 'boron and fluorine when present together: Zhur. Anal. Khim., v. 5, p. 28-31. .
Scher, A., 1957, Rapid colorimetric determination of the boric acid content of water by means of quinalizarin and alizarin S.: Hidrol. Kozlony, v. 37, p. 168-170.
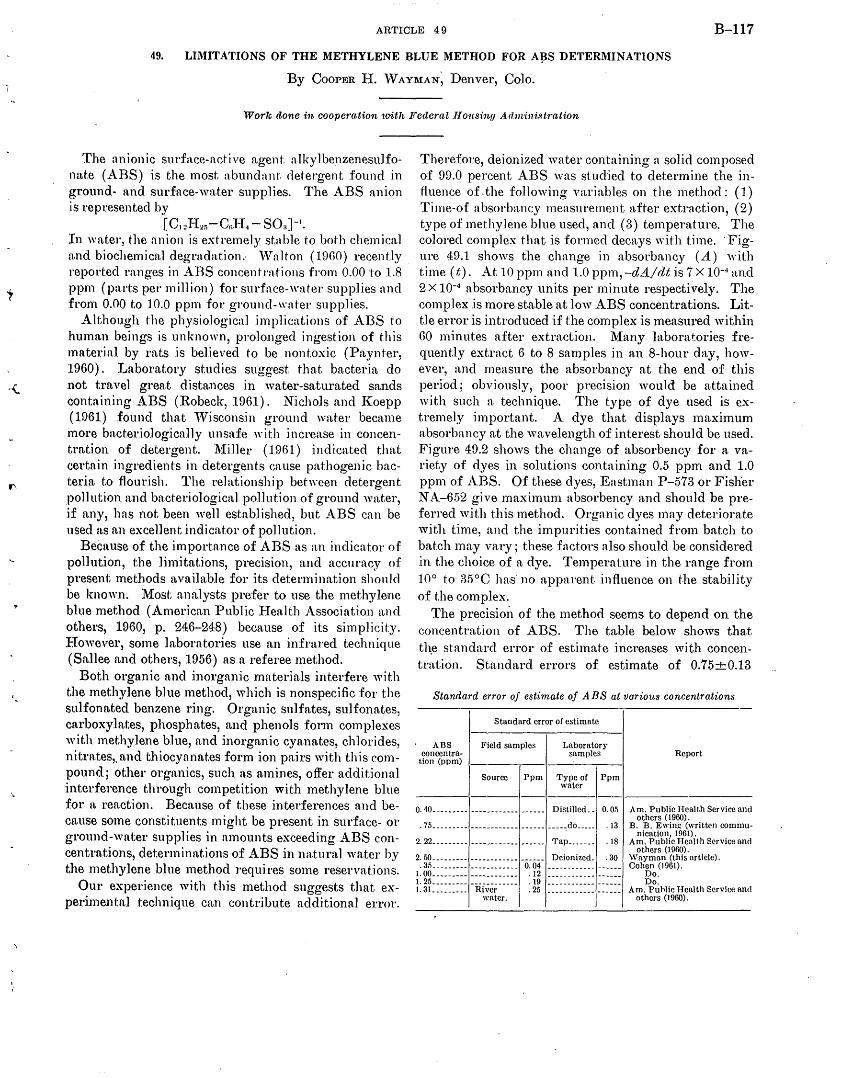
ARTICLE 49 B-117
49. LIMITATIONS OF THE METHYLENE BLUE METHOD FOR A~S DETERMINATIONS
By CooPER H. WAYl\IAN~ Denver, Colo.
Work done in cooperation with Federal .Tiou.sing Adm·inistration
The anionic surface-active agent. a.lkylbenzenesu1fonat.e (ABS) is the most abundnnt detergent found in ground- a.nd surface-water supplies. The ABS aniOn is represented by
[Gt:!}I2a-GJI4- SOH]-1•
In water, the anion is exh·emely stable to both chemical n.ncl biochemica.l degradation.· 'Vn lton ( lDHO) recently reported ranges in ABS concentrations from 0.00 to 1.8 ppm (parts per million) for surface-water supplies nncl from 0.00 to 10.0 ppm for ground-water supplies.
All;hough t·he physiological implications of ABS to human beings is unknown, prolonged ingestion of this material by rats is believed to be nontoxic (Paynter, 1960). Laboratory studies suggest that bacteria do not travel great distances in water-saturated sands containing .ABS (Robeck, 1961). Nichols and ICoepp (1D61) found that 'Visconsin ground water became more bacteriologically unsafe with increase in concentration of detergent. ~fi1ler (19Hl) indicated that certain .ingredients .in detergents cause pathogenic bacteria to flourish. The relationship between detergent pollution and bacteriological pollution of ground water, if any, has not been well established, but .ABS can be used as an excellent indicator of pollution.
Because of the importance of ABS as an indicator of pollution, the limitations, precision, and accuracy of present methods available for its determination should be known. 1\iost analysts prefer to use the methylene blue method (American Public }lealth .. Association and others, 1960, p. 246-248) because of its simplicity. 1-:Iowever, some laboratories use an infrared technique (Sallee and others, 1956) as a referee method.
Both organic and inorganic materials interfere with the methylene blue method, which is nonspecific for the sulfonated benzene ring. Organic sulfates, sulfonates, carboxylates, phosphates, and phenols form complexes with methylene blue, a.nd inorganic cyanates, chlorides, nitrates,. and thiocyanates form ion pairs with this compound; other orgn.nics, such as amines, offer additional interference through competition with methylene blue for a. reaction. Because of these interferences and because some constituents might be present in surface- or ground-water supplies in amounts exceeding ABS concentrntions, determinations of ABS in natural water by the methylene blue method requires some reservations.
Our experience with this method suggests that experimentnJ technique can contribute additional error.
Therefore, deionized water containing a solid composed of 99.0 percent ABS was studied to determine the influence of. the following variables on the method: ( 1) Time-of absorbancy measurement after extraction, (2) type of methylene blue used, and (3) temperature. The colored complex that is formed decays with time. ·Figure 49.1 shows the change in absorbancy (A) with time ( t). At 10 ppm and 1.0 ppm, -dA/dt is 7 X 10⁻⁴ and 2 X 10⁻⁴ absorba.ncy units per minute respectively. The complex is more stable a.t low ABS concentrations. Little error is introduced if the complex is measured within 60 minutes after extraction. ~{any laboratories frequently extract 6 to 8 samples in an 8-hour clay, however, and measure the absorbancy at the end of this period; obviously, poor precision would be attained with such a technique. The type of dye used is extremely important. A dye that displays maximum absorb::mcy at the wavelength of interest should be used. Figure 4D.2 shows the change of absorbency for a variety of dyes in solutions containing 0.5 ppm and 1.0 ppm of ABS. Of these dyes, Eastman P-573 or Fisher NA-652 give maximum absorbency and should be preferred with this method. Organic dyes may deteriorate with time, and the impurities contained from batch to batch may vary; these factors also should be considered in the choice of a dye. Temperature in the range from 10° to 35°C has no apparent influence on the stability of the complex.
The precisim1 of the method seems to depend on the eoncentration of ABS. The table below shows that tl\e standard error of estimate increases with concentration. Standard errors of estimate of 0.75+0.13
Standard error of estimate of A BS at va.rious concentrations
Standard error of estimate
A BS Field samples Laboratory samples concentra
tion (ppm) 1---~--1--_:_-..,.---1
Source Ppm Type of Ppm water
0.10 .................. ----·---·--- ............ Distilled .... 0. O.'i
Report
Am. Public Health Service and others (1960).
. 75 ............................................................... do ____ _ . 13 B. B. Ewin~ (written communication, 1961).
. 18 Am. Public Henlt.h Service and others (1960).
2. 22 _________ ----·---·--- ·----- Tap ______ _
2. 50.................. ....................... ............ Deionized. . 30 . 35 ................. --------·--- 0. 04 ------------ -·----
1. oo _________ ------------ . 12 ---------·-- _____ _ 1. 25 .. ________ ------------ .19 ------------ ------]. 31.. .............. River . 25 ----------·· ------
water.
Wayman (this article). Cohen (1961) .
Do. Do.
Am. Puhlic Health Service and ot.hers (1960).
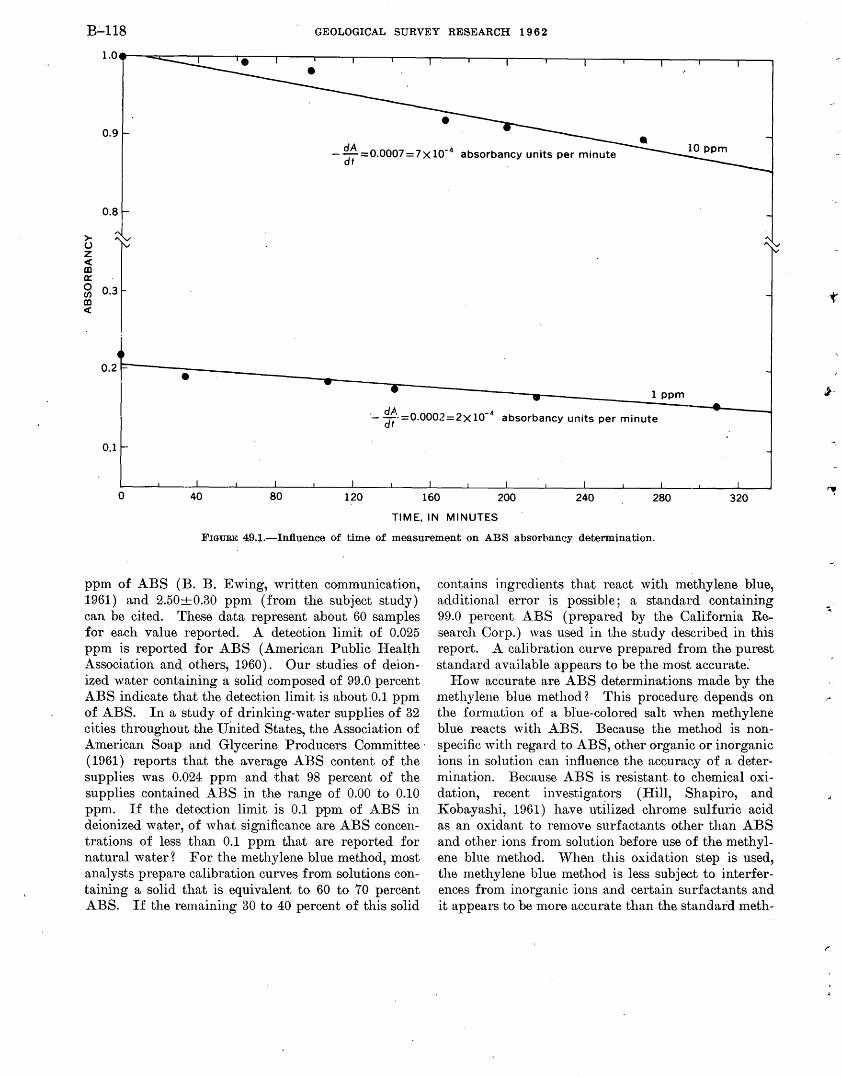
B.:...l18 GEOLOGICAL SURVEY RESEARCH 1 9 6 2
0.9
- dA = 0.0007 = 7 X 10⁻⁴
dt
> (.) z <{ III 0:::
g 0.3 III <{
0.2r----· --~-----~_j I 1 ppm
·- ~~··=0.0002=2X10- 4 absorbancy units per minute
0.1
0 40 80 120 . 160 200 240 280 320
TIME, IN MINUTES
FIGURE 49.1.-Infiuence of time of measurement on ABS absorbancy determination.
ppm of ABS (B. B. Ewing, written communication, 1961) and 2.50+0.30 ppm (from the subject study) can be cited. These data represent about 60 samples for each value reported. A detection limit of 0.025 ppm is reported for ABS (American Public Health Association and others, 1960). Our studies of deionized water containing a solid composed of 99.0 percent ABS indicate that the detection limit is about 0.1 ppm of ABS. In a study of drinking-,vater supplies of 32 cities throughout the Ui1ited States, the Association of American Soap and Glycerine Producers Committee· ( 1961) reports that the average ABS content of the supplies was 0.024 ppm and that 98 percent of the supplies contained ABS in the range of 0.00 to 0.10 ppm.. If the detection limit is 0.1 ppm of ABS in deionized water, of what significance are ABS concentrations of less than 0.1 ppm that are reported for natural water? For the methylene blue method, most analysts prepare calibration curves from solutions containing a solid that is equivalent to 60 to 70 percent ABS. If the remaining 30 to 40 percent of this solid
contains ingredients that react with n1ethylene blue, additional error is possible; a standard containing 99.0 percent ABS (prepared by the California Research Corp.) was used in the study described in this report. A calibration curve prepared from the purest standard available appears to be the most accurate.'
IIow accurate are ABS determinations made by the methylene blue 1nethod? This procedure depends on the formation of a blue-colored salt when methylene blue reacts with ABS. Because the method is nonspecific with regard to ABS, other organic or inorganic ions in solution can influence the accuracy of a determination. Because ABS is resistant to chemical oxidation, recent investigators (Hill, Shapiro, and Kobayashi, 1961) have utilized chrome sulfuric acid as an oxidant to remove surfacta.nts other than ABS and other ions from solution before use of the methylene blue method. vVhen this oxidation step is used, the methylene blue method is less subject to interferences from inorganic ions and certain surfactants and it appears to be more accurate than the standard meth-
>-(.) z
· ... { <( a:l 0:: 0 C/) a:l <(
·~·
ARTICLE 49 B-119
0.280.----.----.----.----~--~----~--~----~--------~---.----~---.----~---.------.
0.260
0.240
0.220
0.200
0.180
0.160
0.140
0.120
EASTMAN KODAK P573
FISHER NA-652 FISHER NA-653
FISHER A-766
FISHER SO-M-78
CONCENTRATION OF ABS, IN PARTS PER MILLION
FIGURE 49.2.-Effect of dye type on absorbency determination ..
B-120 GEOLOGICAL SURVEY RESEARCH 1 9 6 2
ylene blue method. Another modification of the standard method ("\Vebster and Halliday, 1959) is reported to give results comparable to those for infrared for river water and sewage. Because of the purported improved accuracy of the two modified methylene blue methods, these methods should be investigated further or perhaps combined into a single method.
Certain limitations regarding the precision, accuracy, and experimental technique in use of the standard methylene blue method are indicated. For those analysts making ABS deter1ninations on surfacewater, ground-water, and public-water supplies, concentrations of less than 0.1 ppm should be reported with some reservation.
REFERENCES
American Public Health Association and others, 1960, Standard methods for the examination of water and wastewater: 11th ed., New York, Am. Public Health Assoc., Inc., 626 p.
Association of American Soap and Glycerine Producers, 1961, ABS in drinking water in the United States: Am. "\Vater 'Yorks Assoc .. Jour., v. 53, p. 2~)7-300.
Cohen, J. M., 1961, Detergent detection: The Sanitarian, v. 23, no. 4, p. 194-197.
Hill, H. H., Shapiro, l\L A., and Kobayashi, Y., 19tH, Determination of alkylbenzenesulfonate in water: Am. Chern. Soc. Natl. Mtg., 140th, Chicago, 1!)61, DiY. of Water and 'Vaste Chemistry, Paper 5, 16 p. (presented Sept. 4)
Miller, B. ,V., 1961, Syndets and pathogens: Am. "'ater 'Vorks Assoc. Ann. Mtg., Detroit, 1961 (Jlaper presented .June 6) ; Detroit l!,ree Press, June 7, H)6l.
Nicholas, M. S., and Koepp, E., 1961, Synthetic detergents as a criterion of Wisconsin ground-water pollution: A.m. W'"ater 'Vorks Assoc. Jour., v. 53,}). 303-306.
Paynter, 0. E., 1960, The chronic toxicity of dodecylbenzene sodium sulfonate: U.S. Public Health Service Conference on Physiological Aspects of "'ater Quality Proc., "\Vashington, D.C., Sept. 8-9, 1960, p. 17G-179.
Robeck, G. G., 1961, Ground water contamination studies at the Sanitary Engineering Center: U.S. Public Health Service Symposium on Ground-"'ater Contamination, Robert A. Taft Sanitary Engineering Center, Cincinnatti, 1961. (paper presented at meeting)
Sallee, E. M., Fairing, .J. D., Hess, R. ,V., and others, 1956, Determination of trace amounts of alkylbenzenesulfonate in water: Anal. Chemistry, v. 28, p. 1822-1826.
"'alton, G., 1!)60, ABS contamination: Am. 'Vater Works Assoc .. Jour., v. 52. p. 1354-1362.
'Vebster, H. L., and Halliday, .J .. 1959, Determination of alkylbenzenesulfonate in river waters and sewage: The Analyst. v. 84, p. 552--559.
50. HYDROCHEMICAL FACIES IN THE "400-FOOT" AND "600-FOOT'' SANDS OF THE BATON ROUGE AREA, LOUISIANA
By C. 0. MoRGAN and M. D. WINNER, JR., Baton Rouge, La.
Work done iw cooperation with the Louisiana Department of PubUc Wo1·ks and the Depa1·t1nent of Conservation, Lo1tisiana Geological Siwvey
The "400-foot'' and "600-foot" sands, t-wo major aquifers of the Baton Rouge area, Louisiana, crop out and are recharged in East Feliciana and 'Vest Feliciana Parishes north of Baton Rouge (Morgan, 1961). The principal artificial discharge area of these artesian aquifers is in the industrial district of East Baton Rouge Parish.
The "400-foot" and "600-foot" aquifers in the re-. charge area have been considered early Pleistocene by a nmnber of writers (Doering, 1958; Rollo, 1960, pl. 2; Morgan, 1961), whereas others have correlated equivalents of these sediments with the Citronelle Formation of Pliocene age (Stringfield and LaMoreaux, 19~7).
The water-analysis diagram in figure 50.1 is modified after Back (1961, p. D-381), who described the ground waters of the Atlantic Coastal Plain in terms of hydro-
chemical facies (Back, 1960). In the investigation described herein, chemical analyses were 1nade of water from selected wells in an a.rea extending from the recharge area in East Feliciana and 'Vest Feliciana Parishes to beyoi1d the salt-water interface in East Baton Rouge Parish (fig. 50.2'). The chemical constituents are plotted ju percent of total eq-i.1ivalents per 1nillion on the water-analysis di-agram (fig. 50.3).
Analyses of water from the recharge area show the cation facies in the ground water to be Na,Ca and the anion facies to be Cl + S04 ,HCO:l. The pH of the ground water in this area usually is less than 6.0; the lowest was 5.2 (fig. 50.2, sample 5). This low pH is attributed to solution of C0 2 fron1 abundant decaying vegetation in the soil zone. Dissolved solids range fr01n a low of 27 ppm (parts per million) in smnple 4.to 83
ji J'·
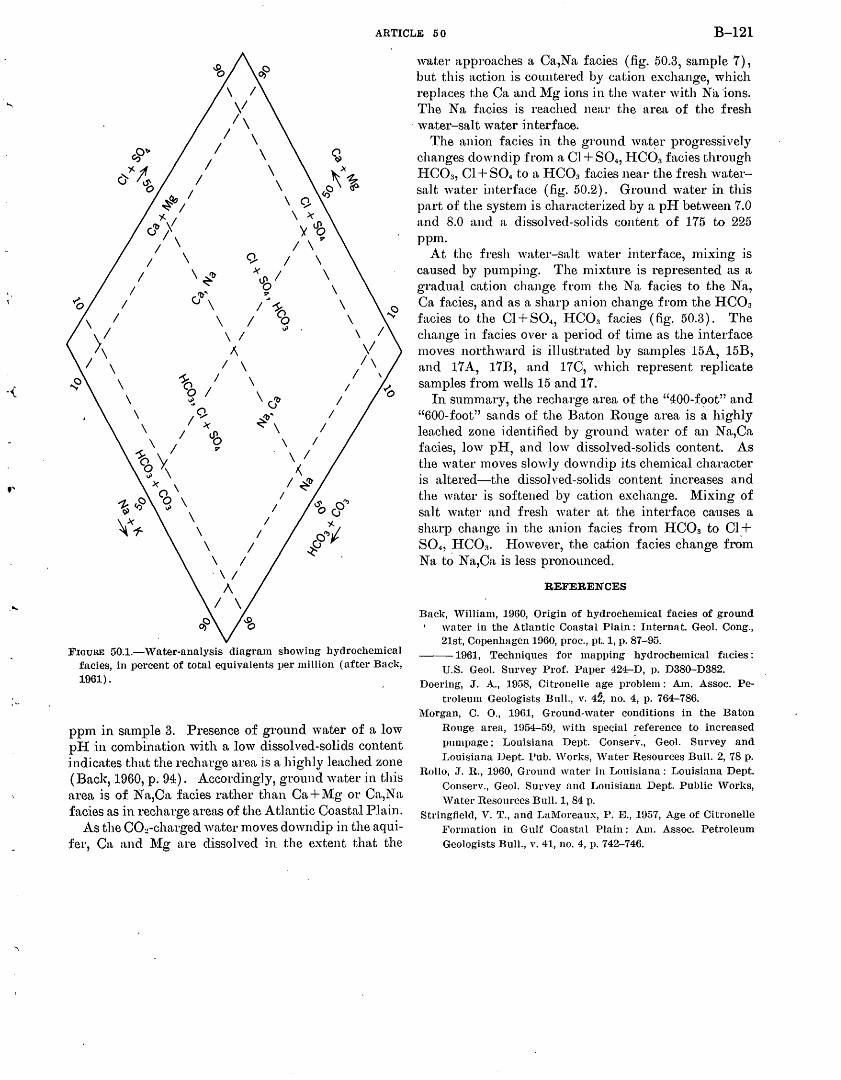
-{
, ...
."'-
ARTICLE 50 B-121
\ I \I 1\
I \ I \
I \ I \
I ~~I \ C). '~--I \ x
ur& ~ X t£> I\ \ 17
I I I \ C). I \
I \ ~r& x..n I \ I r&" 9 \
~ I u \ 1 ... ~ \ I \ I ~ \
\ I \ 1 u) \ I
\ ~ v I \ I \ 1\
\ -5o I \ II
\ ~ I \ e;r& I \ C). r&" I
\ I x ~ \ I I t£> \ I 17 \ I
1:: \, \ I co Y. ' u) \ '\
)( I~ o' "" 't:.tS> 0 \ I c:>) ," ul I
\.X \ I ~ "f- \ I
\ I \ I . \I
A I \
Ji.,IOUltE 50.1.-)Vater-annlysis diagram showing hydrochemical fncies, in percent of total equivalents per million (after Back, 1001).
ppm in sam.ple 3. Presence of ground \Vater of a low pii in combination with a low dissolved-solids content :indicates that the recharge area is a highly leached zone (Back, 1960, p. 94). Accordingly, ground water in this area is of Na,Cn. :facies rather than Ca+~ig or Ca,Na facies as in recharge areas of the Atlantic Coastal Plain.
As the CO:!-charged water moves down dip in the aqui:f:er, Ca and ~ig are dissolved in the extent that the
wttter approaches a Ca,Na facies (fig. 50.3, sample 7), but this action is countered by cation exchange, which replaces the Ca. and Mg ions in the water with Na 'ions. The Na facies is reached near the area of the fresh water-salt water interface.
The anion facies in the ground wat~r progressively changes down dip from a Cl + 804, HC03 facies through HC03, Cl + 804 to n. HC03 facies near the fresh watersalt water interface (fig. 50.2). Ground water in this part of the system is characterized by a pH between 7.0 and 8.0 and a dissolved-solids content of 175 to 225 ppm.
At the fresh wa.ter-salt water interface, mixing is caused by pumping. The mixture is represented as a gradual cation change from the Na facies to the Na, Ca facies, and as a sharp anion change from the HC03 facies to the Cl + 804, H C03 facies (fig. 50.3) . The change in facies over a period of time as the interface moves northward is illustrated by samples 15A, 15B, and 17 A, 17B, and 17C, which represent replicate samples fr01n wells 15 and 17.
In summary, the recharge area of the "400-f<;>ot" and "600-foot" sands of the Baton Rouge area is a highly leached zone identified by ground water of an N a,Ca facies, low pH, and low dissolved-solids content. As the water moves slowly downdip its chemical character is altered-the dissolved-solids content increases and the water is softened by cation exchange. Mixing of salt water and fresh water at the interface causes a sharp change in the anion facies from HC03 to Cl + 804, HC03. However, the cation facies change from Nu. to Na,Ca is less pronounced.
REFERENCES
Back, William, 1960, Origin of hydrochemical facies of ground water in the Atlantic Coastal Plain: Internat. Geol. Cong., 21st, Copenhagen1960, proc., pt. 1, p. 87-95.
--1961, Techniques for mapping hydrochemical facies : U.S. Geol. Survey Prof. Paper 424-D, p. D380-D382.
Doering, J. A., 19iJ8, Citronelle age problem: Am. Assoc. Petroleum Geologists Bull., v. 4~, no. 4, p. 764-786.
Morgan, C. 0., 1961, Ground-water conditions in the Baton Rouge area, 1954-59, with spec;ial reference to increased pumpage; Louisiana Dept. Conser.v., Geol. Survey and Louisiana Det)t. Pub. \Vorl\:s, \Vater Resources Bull. 2, 78 p.
Rollo, J. R., 1960, Ground water in J.1ouisiana: Louisiana Dept. Conserv., Geol. Survey and Louisiana Dept. Public \Vorks, \Vater Resources Bull. 1, 84 p.
Stringfield, V. T., and LaMoreaux, P. E., 1957, Age of Citronelle Formation in Gulf Coastal Plain: Am. Assoc. Petroleum Geologists Bull., v. 41, no. 4, p. 742--746.
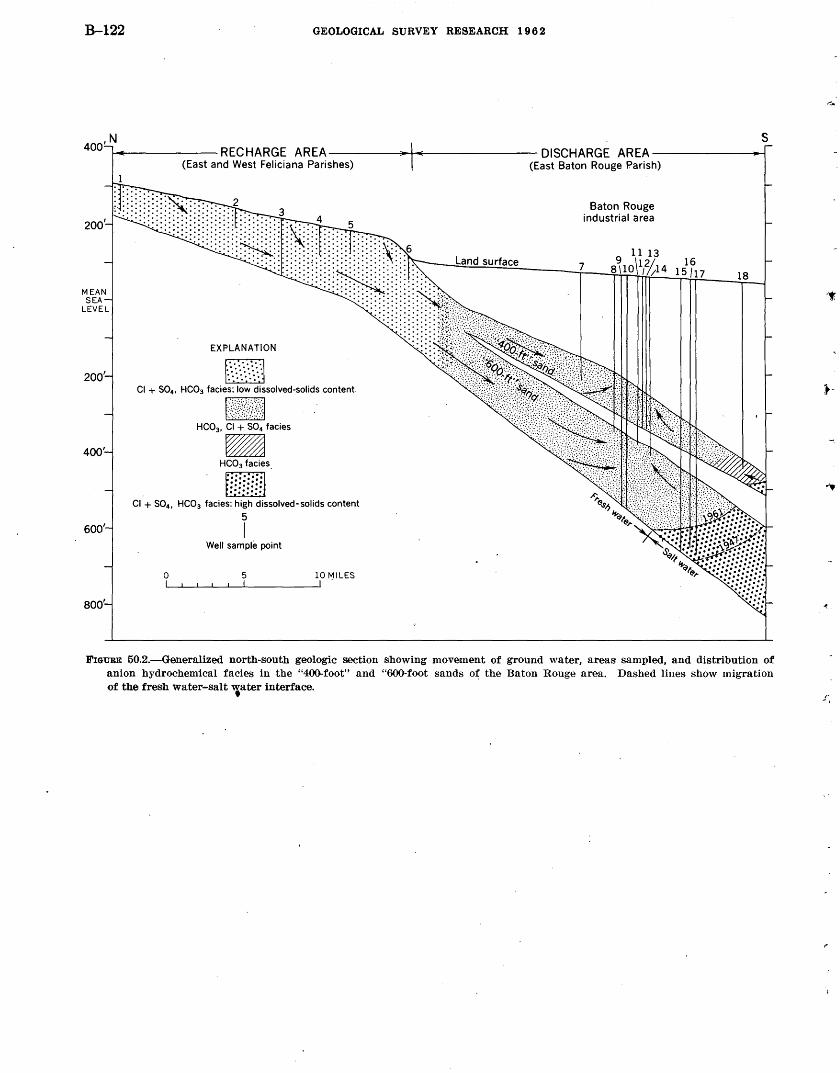
B-122 GEOLOGICAL SURVEY RESEARCH 1 9 6 2
s 400'N ~-----RECHARGE AREA-----:-)-+~~(------- DISCHARGE AREA -----------i-1
(East and West Feliciana Parishes) (East Baton Rouge Parish)
200'
200'
400'
600'
800'
EXPLANATION
Em Cl + S04 , HC03 facies; low dissolved-solids content.
~ HC03 , Cl + S04 facies -HC03 facies.
~ ~
Cl + S04 , HC03 facies; high dissolved-solids content
5
I Well sample point
0 5 10 MILES
Land surface
Baton Rouge industrial area
7
FIGURE 50.2.-Generalized. north-south geologic section showing movement of ground water, areas sampled, and distribution of anion hydrochemical facies in the "400-foot" and "600-foot sands o~ the Baton Rouge area. Dashed lines show migration of the fresh water-salt later interface.
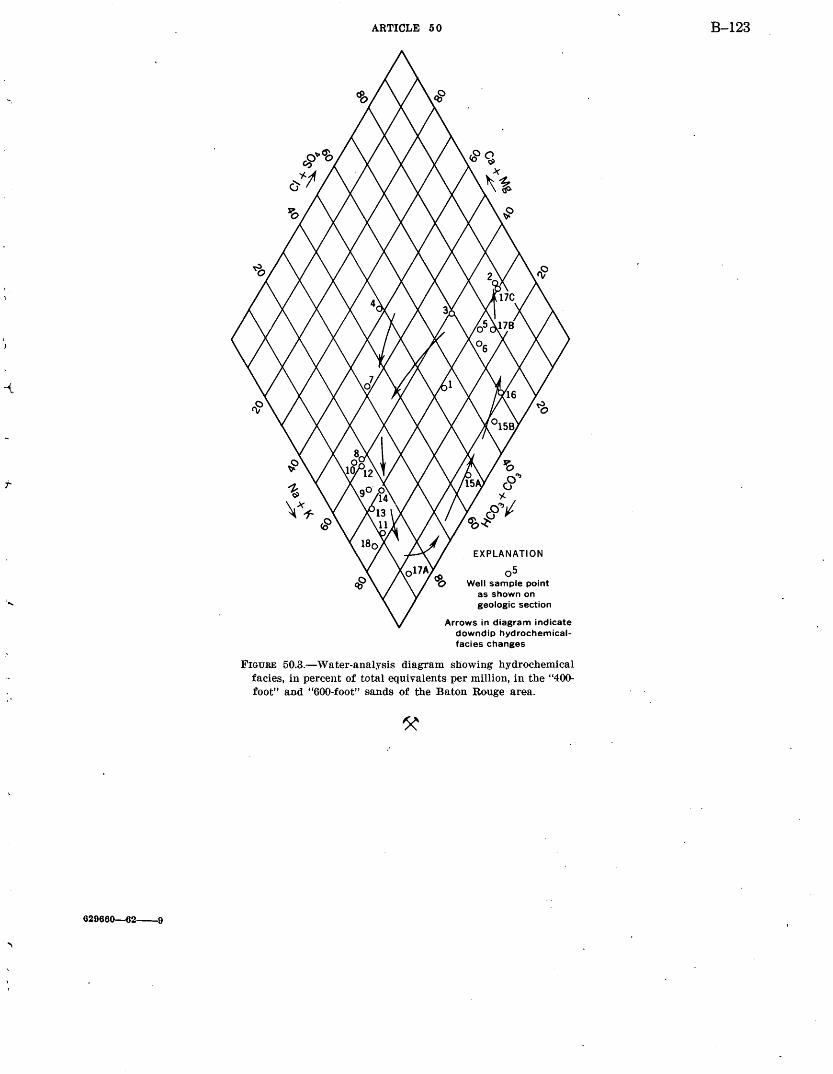
-{
t
629660--62--9
ARTICLE 50
EXPLANATION
o5 Well sample point
as shown on geologic section
Arrows in diagram indicate downdip hydrochemicalfacies changes
FIGURE 50.3.-Water-analysis diagram showing hydrochemical facies, in percent of total equivalents per million, in the "400-foot" and "600-foot" sands of the Baton Rouge area.
B-123
B-124 GEOLOGICAL SURVEY RESEARCH 1 9 6 2
51. CATION HYDROCHEMICAL FACIES OF GROUND WATER IN THE ENGLISHTOWN FORMATIO~, NEW JERSEY
By PAuL R. SEABER, Trenton, N.J.
Work d,one in cooperat~on with the New Jersey Division ot Water Policy and Supply
The sandy part of the Englishtown Formation of Late Cretaceous age has been utilized as an aquifer throughout approximately 1,100 square miles of the Atlantic Coastal Plain of New Jersey. The greatest ground-water development from this aquifer is in the shore communities of l\1:onmouth and Ocean Counties.
The chemical cl1aracter of the water in the Englishtown Formation indicates a relation between topography of the coastal pl~in, the lithology, and ground-water movement (fig. 51.1). The concept of hydrochemical facies has been used by Back (1960) to demonstrate a regional relation between these same factors in the Atlantic Coastal Plain.
A hydrochemical facies may be thought of as a diagnostic chemical aspect of ground water indicative of the relative proportions of the anions or cations. Variations in the relative proportions of Ca, Mg, Na, and I<: reflect environmental effects and can be used as diagnostic indicators of hydrochemical relations. Concentrations of I<: and Mg do not vary significantly in the Englishtown, but they are included to conform to the terminology previously used by Back ( 1961). HC03 is the predominant anion of the ground water in the Englishtmvn Formation; eye;n in the coastal area there is no indication of a high Cl content. The dissolved-solids content (residue on evaporation) of the ground water ranges from 14 to 243 ppm.
The topographic highs of the coastal plain lie 5 to 10 miles southeast of the outcrop of the Englishtown Formation (fig. 51.1A). The northern and southern topographic highs are separated by a topographic low.
The Englishtown Formation, where exposed in the northeast part of the area, is a conspicuous unit of dominantly light-colored well-sorted medium-grained sand that is slightly micaceous and sparingly glauconitic and lignitic. The unit contains a few laminae and discontinuous lenses of clay and silt and some fine gravel. The formation thins southwestward along the strike, but appears to thicken do-\vndip. Minard and Owens ( 1960) suggest that most of the pre-Quaternary formations in the coastal plain of New Jersey have similar depositional characteristics. The sandy part of the formation forms a wedge that thins southwestwa.rd (fig. 51.1B). The sandy unit becomes increasingly clayey and silty and the sand becomes finer grained southwestward along ·the strike as well as
southeastward downdip. In the southern part of the Atlantic Coastal Plain of New Jersey, the Englishtown Formation is composed entirely of clay and silt.
The formation appears to be of continental and · deltaic origin in the northeastern part of the outcrop
area, and of marine origin in the south. Groot and Glass (1960) reported that kaolinite is the predominant clay mineral in the nonmarine sediments and that montmorillonite is predominant in the marine deposits of the coastal plain.
Recharge to the Englishtown occurs mostly by leakage from overlying sediments. The piezometric highs correspond to topographic highs (fig. 51.10), which are separated by a piezometric low that corresponds to the topographic low in the same area. The outcrop functions as a natural-discharge area throughout its extent. Increased pump age along the Atlantic coast has resulted in interception of most of the flow that formerly discharged through the submarine outcrop northeast of Sandy Hook Bay. A discharge area in the southern part of the system has not. been defined, but ground water may move upward into the overlying formations.
The cation hydrochemical facies characterized by water of more than 90 percent Ca+Mg (in equivalents per million) forms a belt that corresponds to the topographic highs and the piezometric highs (fig. 51.1D). This facies results from solution of calcareous materials in the overlying formations by ground water, which enters the Englishtown Formation in the areas of the piezometric highs. Both updip and downdip from this belt the Ca cqntent is lower, updip the Na content is about the same. This presumably is due chiefly to infiltration of water that contains less Ca and about an equal amount of N a. Down dip to the southeast, the water contains more than 90 percent N a+ IC This cation hydrochemical facies results from ion exchange in which Ca of the water is absorbed by montmorillonite, and N a of the montmorillonite is taken into solution. The water contains more N a than could be released by exchange with the amount of Oa in solution in waters coming from areas of higher head. This indicates another source of Ca, presumably from solution of calcareous fossils at depth in the formation. The high proportion of N a in the ground water downdip from the recharge area suggests the presence of sodium mont-
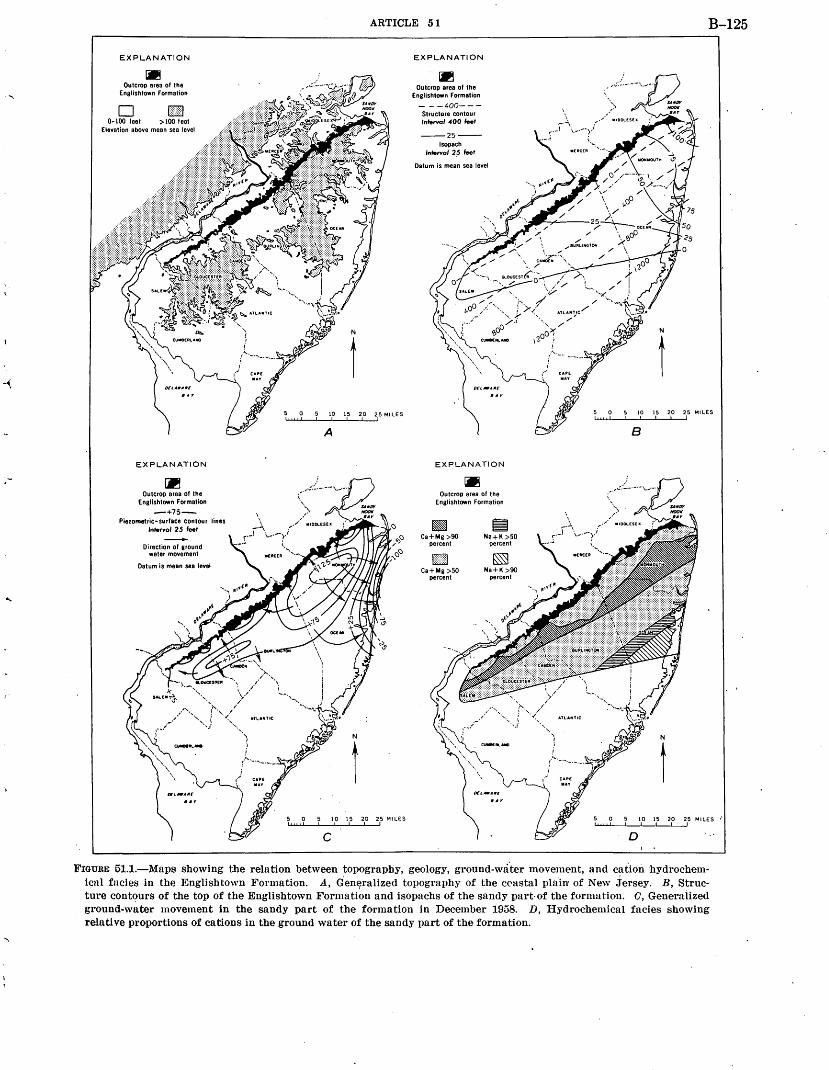
,-
EXPLANATION
~ Outcrop area of the
Englishtown Formation
0 0-100 feet > 100 feet
Elevation above meon sea level
EXPLANATION
~ Outcrop area of the
Englishtown Formation
-+75-Piezometric-surface conlour lines
lnlftrvol 2 5 feel -Direction of ground water movement
Dot um is mean sea level
ARTICLE 51
N
t 10 15 20 25 Ml LES
A
N
t 10 15 20 25 MILES
c
EXPLANATION
~ Outcrop area of the
Englishtown Formation
~- -400--Structure contour Interval 400 feel
--25-lsopach
lnlftrval 2 5 feel
Datum is mean sea level
EXPLANATION
Outcrop area of the Englishtown Formation
~ Ca+Mg >90
percent
[]] Ca+Mg >50
percent
~ Na+ K >50
percent
~ Na+K >90
percent
B-125
N
t 10 15 20 25 Ml LES
B
N
t 10 15 20 25 MILES
D
FIGUI~E 51.1.-Maps showing the relation between topography, geology, ground-wa.ter movemEc'nt, and cation hydrochemicnl facies in the lDnglishtown Formation. A., Gen~ralized topography of the cC'astal plain of New Jersey. B, Structure cont~urs of the top of the Englishtown Formation and isopachs of the sandy part· of the formation. 0, Generalized ground-water 1novement in the sandy part of the formation in December 1958. D, Hydrochemical facies showing relative proportions of cations in the ground water of the sandy part of the formation.
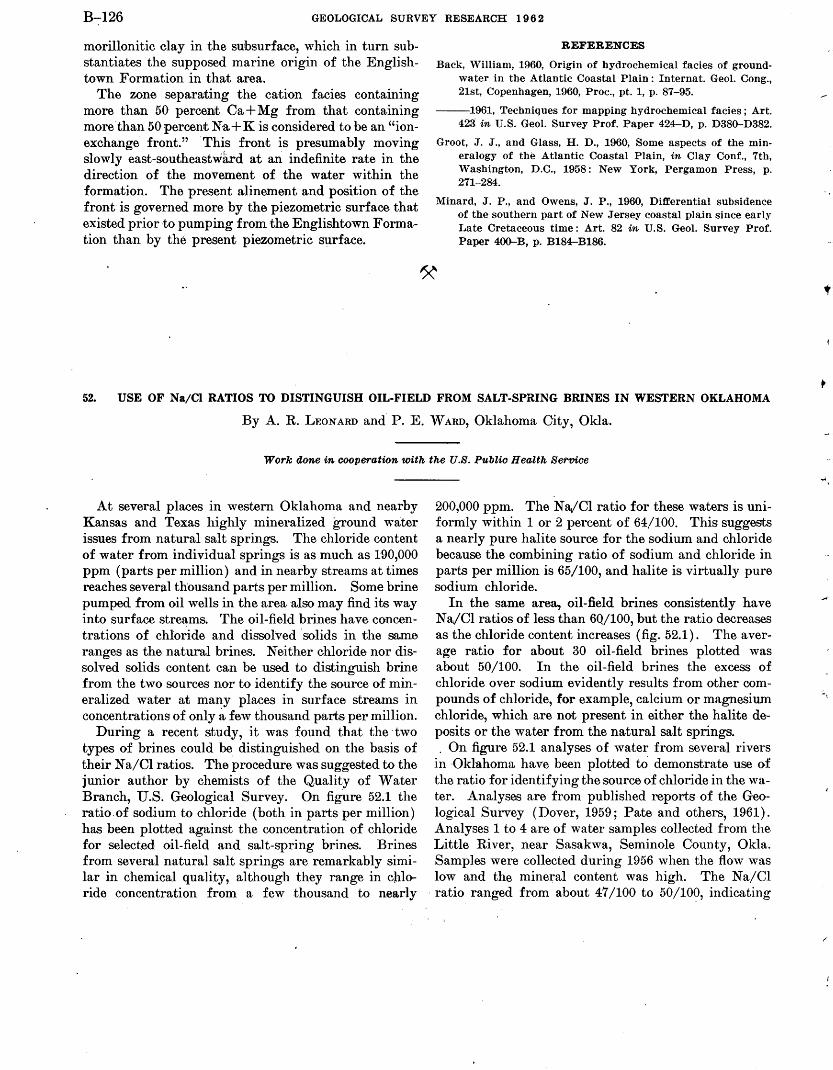
B-126 GEOLOGICAL SURVEY RESEARCH 19 6 2
morillonitic clay in the subsurface, which in turn substantiates the supposed marine origin of the Englishtown Formation in that area.
The zone separating the cation facies containing more than 50 percent Ca + Mg from that containing more.than 50 percent Na+ K is considered to be an "ionexchange front." This front is presumably moving slowly east-southeastward at an: indefinite rate in the direction of the movement of the water within the formation. The present alinement and position of the front is governed more by the piezometric surface that existed prior to pumping from the Englishtown Formation than by the present piezometric surface.
REFERENCES
Back, 'Villiam, 1960, Origin of hydrochemical facies of groundwater in the Atlantic Coastal Plain : Internat. Geol. Cong., 21st, Copenhagen, 1960, Proc., pt. 1, p. 87-95.
--1961, Techniques for mapping hydrochemical facies ; Art. 423 in U.S. Geol. Survey Prof. Paper 424-D, p. D380-D382.
Groot, J. J., and Glass, H. D., 1960, Some aspects of the mineralogy of the Atlantic Coastal Plain, in Clay Conf., 7th, \Vashington, D.C., 1958: New York, Pergamon Press, p. 271-284.
Minard, J. P., and Owens, J. P., 1960, Differential subsidence of the southern part of New Jersey coastal plain since early Late Cretaceous time: Art. 82 in U.S. Geol. Survey Prof. Paper 400--B, p. B184-B186.
52. USE OF Na/Cl RATIOS TO DISTINGUISH OIL-FIELD FROM SALT-SPRING BRINES IN WESTERN OKLAHOMA
By A. R. LEONARD and P. E. WARD, Oklahoma City, Okla.
Work done in cooperation with the U.S. Public Health Service
At several places in western Oklahoma and nearby Kansas and Texas highly mineralized ground water issues from natural salt springs. The chloride content of water from individual springs is as much as 190,000 ppm (parts per million) and in nearby streams at times reaches several thousand parts per million. Some brine pumped from oil wells in the area also may find its way into surface streams. The oil-field brines have concentrations of chloride and dissolved solids in the same ranges as the natural brines. Neither chloride nor dissolved solids content can be used to distinguish brine from the two sources nor to identify the source of mineralized water at many places in surface streams in concentrations of only a few thousand parts per million.
During a recent study, it was found that the ·two types of brines could be distinguished on the basis of their N a/Cl ratios. The procedure was suggested to the junior author by chemists of the Quality of Water Branch, U.S. Geological Survey. On figure 52.1 the ratio.of sodium to chloride (both in parts per million) has been plotted against the concentration of chloride for selecwd: oil-field and salt-spring brines. Brines from several natural salt springs are remarkably similar in chemical quality, although they range in chloride concentration from a few thousand to nearly
200,000 ppm. The Na/Cl ratio for these waters is uniformly within 1 or 2 percent of 64/100. This suggests a nearly pure halite source for the sodium and chloride because the combining ratio of sodium and chloride in parts per million is 65/100, and halite is virtually pure sodium chloride.
In the same area, oil-field brines consistently have N a/Cl ratios of less than 6Q/100, but the ratio decreases as the chloride content increases (fig. 52.1). The average ratio for about 30 oil-field brines plotted was about 50/100. In the oil-field brines the excess of chloride over sodium evidently results from other compounds of chloride, for example, calcium or magnesium chloride, which are not present in either the halite deposits or the water from the natural salt springs. . On figure 52.1 analyses of water from several rivers
in ·Oklahoma have been plotted tO demonstrate use of the ratio for identifying the source of chloride in the water. Analyses are from published reports of the Geological Survey (Dover, 1959; Pate and others, 1961). Analyses 1 to 4 are of water samples collected from the. Little River, near Sasakwa, Seminole County, Okla. Samples were collected during 1956 when the flow was low and the miner~l content was high. The N a/Cl
· ratio ranged from about 47/100 to 50/10~, indicating
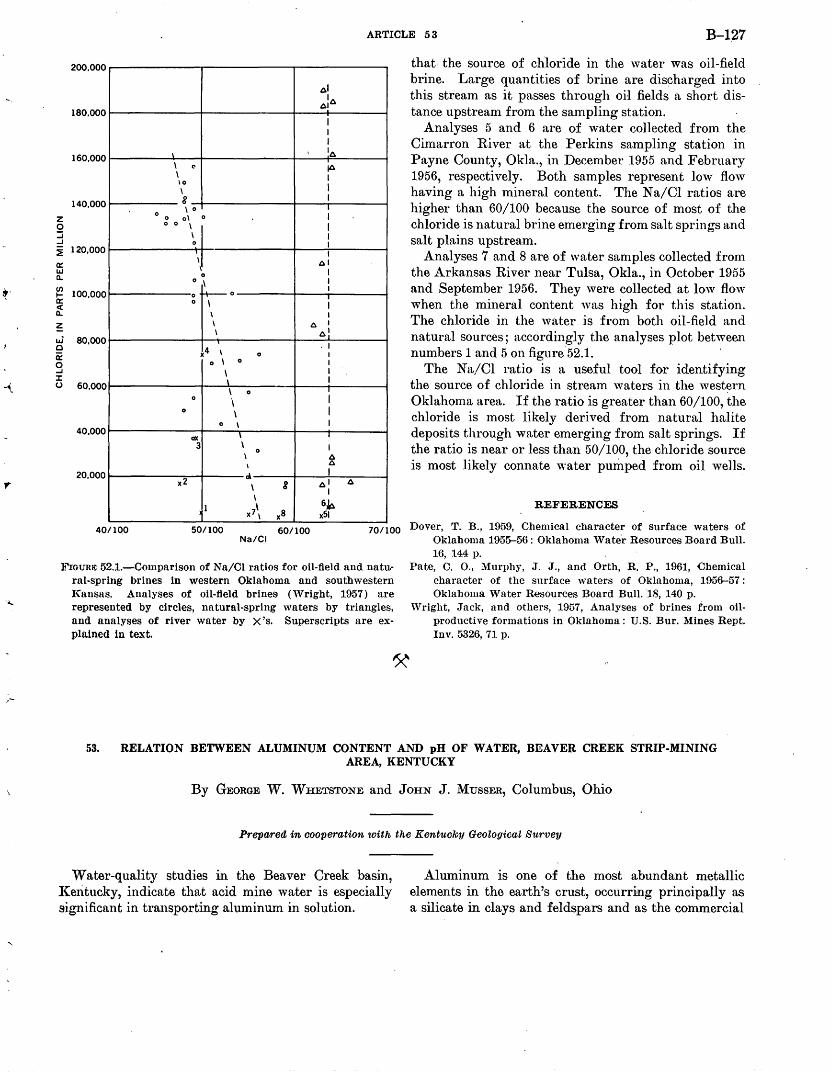
~-
-\
ARTICLE 53 B-127
200,000
~I
~:~ 180,000
I I I
160,000
140,000
z 0
\ I I~
\ (' ~ \ I IO
I \ 0 I 0
0 \ 0 I
0 o\ 0 I 0 0 \ I
:::i -l
~ 120,000
\ I 0 I
I a: !'-' ll. (/)
100,000 1-a: c(
\ ~I ~ I 0
0 \ I
+--o I 0
l 0 \ ll. \ I
~ LJ 80,000 c a: 0 -l J: u 60,000
\ ~ I
\ ~:
x4 . I
I 0 I 0 \ 0 I
\ I \ I \ 0 I 0 \
0 \ I
40,000 0 \ I
ox \ I
3 \ I 0 \ ~
20,000 I ~
ci I x2
\ 8 ~I ~
I \
6,b 1 \ x7 \ x8 x51
40/100 50/100 60/100 70/100 Na/CI
l!.,munE 52.1.-Comparison of Na/Cl ratios for oil-field and natural-spring brines in western Oklahoma and southwestern Kunsus. Analyses of oil-field brines (Wright, 1957) are represented by circles, natural-spring waters by triangles, and analyses of river water by X 's. Superscripts are explained in text.
that· the source of chloride in the water was oil-field brine. Large quantities of brine are discharged into this stream as it passes through oil fields a short distance. upstream from the sampling station.
Analyses 5 and 6 are of water collected from the Cimarron River at the Perkins sampling station in Payne County, Okla., in December 1955 and February 1956, respectively. Both samples represent low flow having a high mineral content. The N a/Cl ratios are higher than 60/100 because the source of most of the chloride is natural brine emerging from salt springs and salt plains upstream.
Analyses 7 and 8 are of water samples collected from the Arkansas River near Tulsa, Okla., in October 1955 and September 1956. They were collected at low flow when the mineral content was high for this station. The chloride in the water is from both oil-field and natural sources; accordingly the analyses plot between numbers 1 and 5 on figure.52.1.
The N a,/Cl ratio is a useful tool for identifying the source of chloride in stream waters in the western Oklahoma area. If the ratio is greater than 60/100, the. chloride is most likely derived from natural halite deposits through water emerging from salt springs. If the ratio is near or less than 50/100, the chloride source is most likely connate water pumped from oil wells.
REFERENCES
Dover, T. B., 1959, Chemical character of surface waters of Oklahoma 1955-56: Oklahoma ·water Resources Board Bull. 16, 144 p.
Pate, C. 0., Murphy, J. J., and Orth, R. P., 1961, Chemical character of the surface waters of Oklahoma, 1956-57: Oklahoma Water Resources Board Bull.l8, 140 p.
Wright, Jack, and others, 1957, Analyses of brines from oilproductive formations in Oklahoma: U.S. Bur. Mines Rept. Inv. 5326, 71 p.
53. RELATION BETWEEN ALUMINUM CONTENT AND pH OF WATER, BEAVER CREEK STRIP-MINING AREA, KENTUCKY
By GEORGE W. WHETSTONE and JoHN J. MussER, Columbus, Ohio
Prepa;rea in cooperation with the Kentucky Geological Survey
Water-quality studies in the Beaver Creek basin, Ketitucky, indicate that acid mine water is especially significant in transporting aluminum in solution.
Aluminum is one of the most abundant metallic elements in the earth's crust, occurring principally as a silicate in clays and feldspars and as the commercial
B-128 GEOLOGICAL SURVEY RESEARCH 1962
ore bauxite, an impure hydrate oxide. The element is amphoteric in behavior and can be in solution either as a cation or as a part of a complex anion, as illustrated in the following equation:
Al+3 +30H-1=;{ AJ~~W,a }AlQ2-1 + H+1 + H 20
Aluminum hydroxide is only slightly dissociated and is nearly insoluble in natural water, for which the pH generally ranges from 5.5 to slightly more than 8. The aluminum concentrations of natural water usually are less than 1 or 2 ppm (parts per million) and much of this probably is colloidal and undissociated. Dissociated aluminum as Al+3 occurs in amount.'l of more than 2 or 3 ppm only in solutions in which the pH is less than about 4. Aluminate ions (Al02- 1 ) are rarely found in natural water because, theoretically, they can be in solution in measurable amounts only at pH values of more than 9.
Nat ural surface water in the Beaver Creek basin is poorly buffered. A marked reduction in the pH of the· water is caused by small amounts of sulfuric acid derived from the oxidation of pyrite and from hydrolysis involving sulfate, in the spoil banks of strip mines.
Median values of pH and the range of aluminum concentrations are shown in the table below for two nonpolluted streams in the Beaver Creek basin-Helton Branch and West Fork Cane Branch-and for Cane Branch, which was polluted by acid mine waters.
In the Beaver Creek basin, surface water free of acid mine water generally has a pH ranging from 5.0 to 7.3 and an aluminum concentration of 0.4 ppm or less. Water in Cane Branch from January to June 1956, before the spoil bank was leveled, had a pH ranging
Median values of pH and r,ange of aluminum concentration in surface water in Beaver Creek Basin, Kentucky, January 1956 to September 1958
pH Aluminum (in parts per million)
Stream --Median Maxi- Median Mini-
mum mum ------
West Fork Cane Branch _________ 6. 0 0. 2 0. 1 0. 0 Helton Branch __________________ 6. 7 .4 . 1 .0 Cane Branch ___________________ 3. 2 85 5. 5 .0
90
0
80
z 70 Oz ~0 .:t::; 60 O::..J ...... -z~ w Ua:: 50 zw Oa..
:.
u C/) 40
~ ...... :::::>0::: ~~ 30 ~
0
:::::>Z ..J-<t
20
10
0 2.0 2.5
0
!a ~ 0
~ -~ ) 0 0
0 ~0 '"'o to 1n c
3.0 3.5 4.0 4.5 5.0 5.5
pH FIGURE 53.1-Solubility of aluminum as a function of pH in
Cane Branch, 1956-58.
from 4.0 to 6.8 and an aluminum concentration less than 5.0 ppm.
From June 1956 to September 1958, the pH of Cane Branch water generally was less than 4.15, and the aluminum concentration was greater than 5.0 ppm (fig. 53.1). The maximum aluminum concentration was 85 ppm. Aluminum concentrations were highest for pH values less than 3.0.
Aluminum concentrations in the ground water in the Beaver Creek area followed a pattern similar to that of the surface water. Water from coal test holes and springs had pH values greater than 5.0 and contained less than 0.2 ppm of aluminum. Water within the spoil bank frequently had pH values less than 2.8 and had as much as 46 ppm of aluminum. Water from pools on the spoil bank had a pH less than 3 and an aluminum concentration up to 50 ppm.
·~
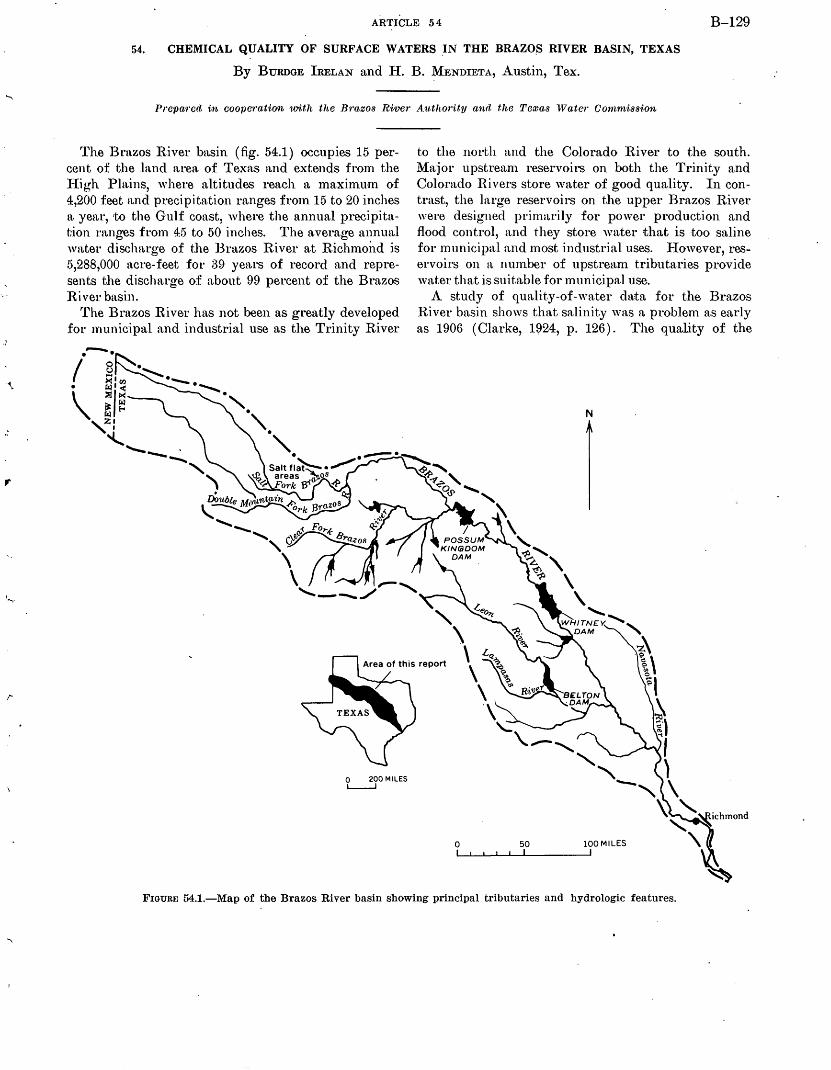
,~
ARTICLE 54 B-129
54. CHEMICAL QUALITY OF SURFACE WATERS .IN THE BRAZO.S RIVER BASIN, TEXAS
By BuRDGE IRELAN and H. B. MENDIETA, Austin, Tex.
Prepm·c(t in, C007Jet'ati01'~> with the B·razos R-iver A.1tthority arul the Tamas Water· Comrnissi01'~>
The Brazos River basin (fig. 54.1) occupies 15 percent of the land area of Texas and extends from the I-Iigh Plains, where altitudes reach a maximum of 4,200 feet and precipitation ranges fr01n 15 to 20 inches n. year, to the Gulf coast, where the annual precipitat·ion ranges from 45 to 50 inches. The average annual water discha.rge of the Brazos River at Richmoi1d is 5,288,000 acre-feet for 39 years of record and represent:.s the discharge of about 99 percent of the Brazos River basin.
T'he Brazos River ha.s not been as greatly developed for municipal and industrial use as the Trinity River
.--. I
0 200 MILES L---.J
to the north and the Colorado River to the south. Major upstream reservoirs on both the Trinity and Colorado Rivers store water of good quality. In contrast, the large reservoirs on the upper Brazos River were designed primarily for power production and flood control, and they store water that is too saline for municipal and most industrial uses. IIowever, reservoirs on a number of upstrmun tributaries provide water that is suitable for municipal use.
A study of quality-of-water data for the Brazos River basin shows that salinity was a problem as early as 1906 (Clarke, 1924, p. 126). The quality of the
0 I
50 I
N
100 MILES I
1!""munE fi4.1.-Map of the Brazos River basin showing principal tributaries and hydrologic features.
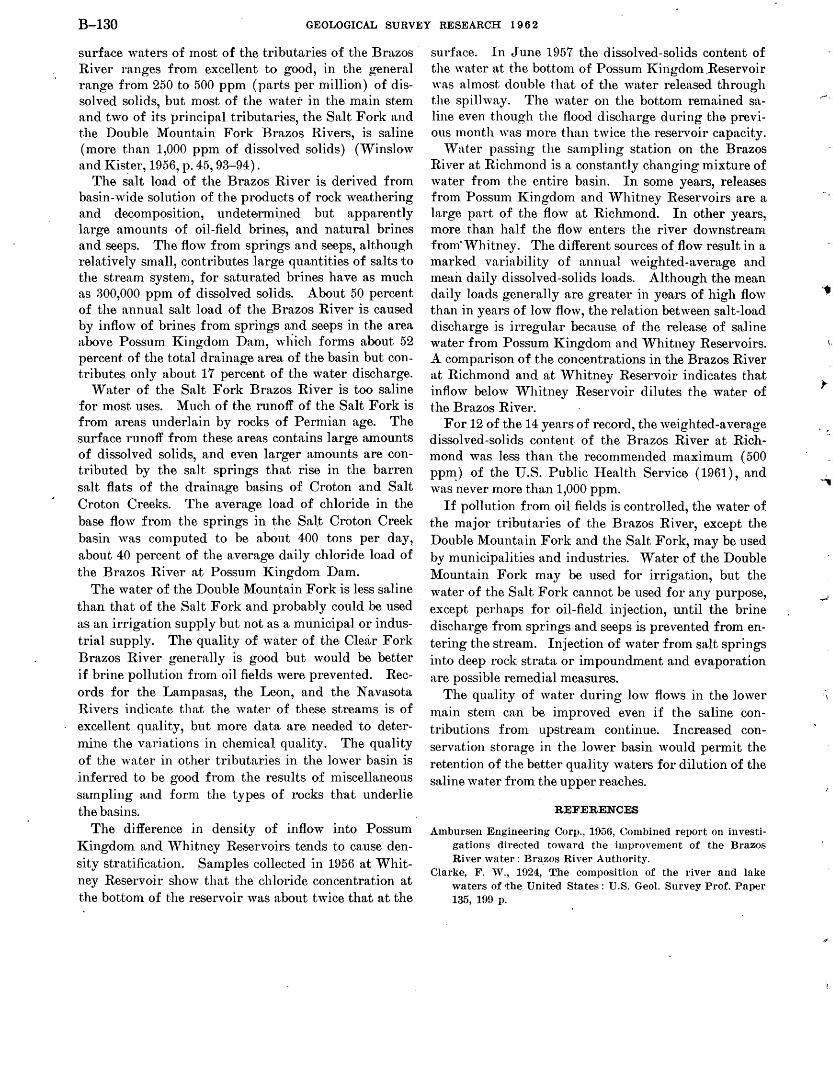
B-130 GEOLOGICAL SURVEY RESEARCH 1 9 6 2
surface waters of most of the tributaries of the Brazos River ranges from excellent to good, in the general range from 250 to 500 ppm (parts per million) of dissolved solids, but most of the water in the main stem and two of its principal tributaries, the Salt Fork and the Double Mountain Fork Brazos Rivers, is saline (more than 1,000 ppm of dissolved solids) (Winslow and Kister, 1956, p. 45, 93-94).
The s·alt load of the Brazos River is derived from basin-wide. solution of the products of rock weathering and decomposition, undetermined but apparently large amounts of oil-field brines, and natural brines and seeps. The flow from springs and seeps, although relatively small, contributes large quantities of salts to the stream system, for saturated brines have as much as 300,000 ppm of dissolved solids. About 50 percent of the annual salt load of the Brazos River is caused by inflow of brines from springs and seeps in the area above Possum l{ingdom Dam, wl1ich forms about 52 percent. of the total drainage are.a of the basin but contributes only about 17 percent of the water discharge.
Water of the Salt Fork Brazos River is too saline for most uses. Much of the runoff of the Salt Fork is from areas underlain by rocks of Permian age. The surface runoff from these areas contains large amounts of dissolved solids, and even larger amounts are contributed by the salt springs that rise in the barren salt flats of the drainage basins of Croton and Salt Croton Creeks. The average load of chloride in the base flow from the springs in the Salt Croton Creek basin was computed to be about 400 tons per day, about 40 percent of the average daily chloride load of the Brazos River at Possum Kingdom Dam.
The water of the Double Mountain Fork is less saline than that of the Salt Fork and probably could be used as an irrigation supply but not as a municipal or industrial supply. The· quality of water of the Clear Fork Brazos River generally is good but would be better if brine pollution from oil fields were prevented. Records for the Lampasas, the Leon, and the Navasota Rivers indicate that the water of these streams is of excellent quality, but more data are needed to determine the variations in chemical quality. The quality of the water in other tributaries in the lower basin is inferred to be good from the results of miscellaneous sampling and form the types of rocks that underlie the basins.
The difference in density of inflow into Possum Kingdom and "\Vhitney Reservoirs tends to cause density stratification. Samples collected in 1956 at Whitney Reservoir show that the chloride concentration at the bottom of the reservoir was about twice that at the
surface. In June 1957 the dissolved-solids content of the wa'ter at the bottom of Possum J{ingdom .Reservoir was almost double that of the water released through the spillway. The water on the bottom remained saline even though the flood discharge during the previous month was more than twice the reservoir capacity.
"\Vater passing the sampling station on the Brazos River at Richmond is a constantly changing mixture of water from the entire basin. In some years, releases from Possum Kingdom and Whitney Reservoirs are a large part of the flow at Richmond. In other years, more than half the flow enters the river downstream from' Whitney. The different sources of flow result in a marked variability of annual weighted-average and mean daily dissolved-solids loads. Although the mean daily loads generally are greater in years of high flow than in years of low flow, the relation between salt-load discharge is irregular because of the release of saline water from Possum Kingdom and Whitney Reservoirs. A comparison of the concentrations in the Brazos River at Richmond and at Whitney Reservoir indicates that inflow below Whitney Reservoir dilutes the water of the Brazos River.
For 12 of the 14 years of record, the weighted-average dissolved-solids content of the Brazos River at Richmond was less than the recommended maximum ( 500 pp~) of the U.S. Public Health Service (1961), and was never more than 1,000 ppm.
If pollution from oil fields is controlled, the water of the major tributaries of the Brazos River, except the Double Mountain Fork and the Salt Fork, may be used by municipalities and industries. "\Vater of the Double Mountain Fork may be used for irrigation, but the water of the Salt Fork cannot be used for any purpose, except perhaps for oil-field injection, until the brine discharge from springs and seeps is prevented from entering the stream. Injection of water from salt springs into deep rock strata or impoundment and evaporation are possible remedial measures.
The quality of water during low flows in the lower main stem can be improved even if the saline contributions from upstream continue. Increased conservation storage in the lower basin would permit the retention of the better quality waters for dilution of the saline water from the upper reaches.
REFERENCES
Ambursen Engineering Corp., 1956, Combined report on investigations directed toward the improvement of the Brazos River water: Brazos River Authority.
Clarke, F. "\V., 1924, T,he composition of the river and lake waters of the United States: U.S. Geol. Survey Prof. Paper 135, 199 p.
I,
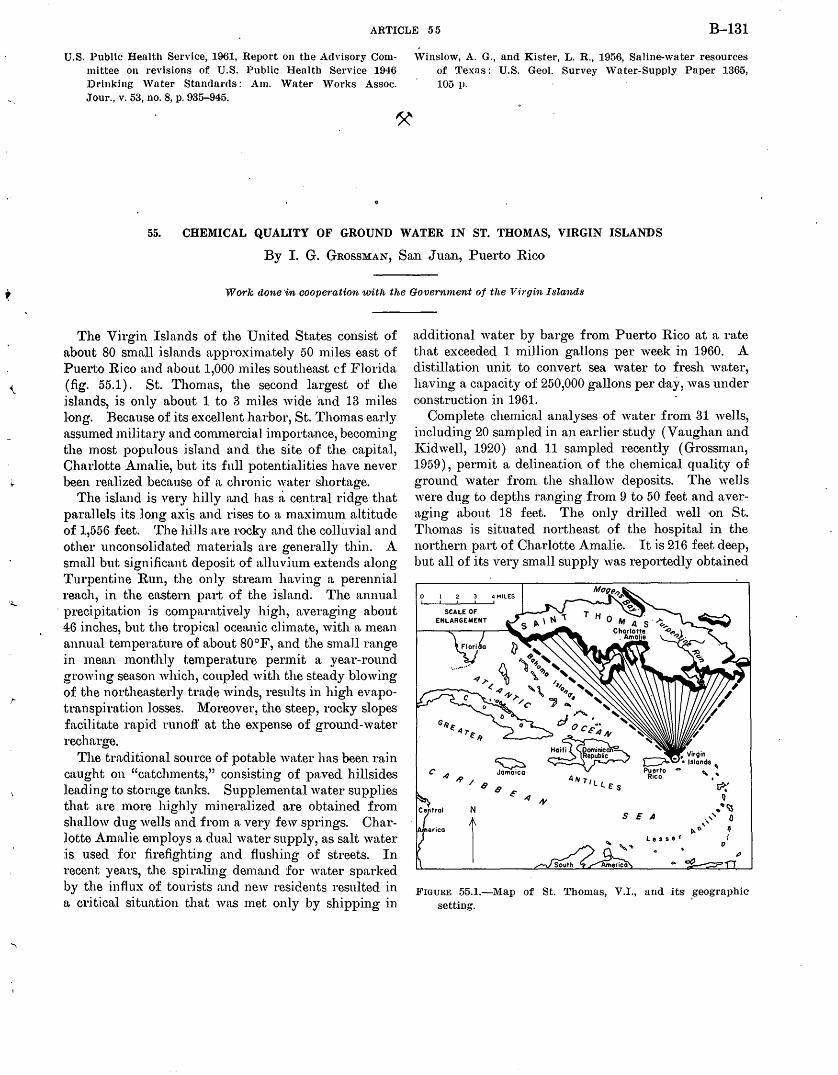
'Ol..
ARTICLE 55 · B-131
U.S. Public Health Service, 1961, Report on the Advisory Committee on revisions of U.S. Public Health Service 1946 Drinking Water Standards: Am. Water Works Assoc. Jour., v. 53, no. 8, p. 935-945.
Winslow, A. G., and Kister, L. R., 1956, Saline-water resources of Texas: U.S. Geol. Survey 'Vater-Supply Paper 1365, 105 v.
55. CHEMICAL QUALITY OF GROUND WATER IN ST. THOMAS, VIRGIN ISLANDS
By I. G. GROSSMAN, San Juan, Puerto Rico
Work done ·in cooperation with the Government of the Virgin Islands
The Virgin Islands of the United States consist of about 80 small :islands approximately 50 1niles east of Puerto Rico and about 1,000 miles southeast cf Florida (fig. 55.1). St. Thomas, the second largest of the islands, is only about 1 to 3 miles wide ·and 13 miles long. Because of its excellent harbor, St. Thomas early assumed militnry and conunercial imporUt.nce, becoming the most populous island and the site of the capital, Charlotte Amalie, but its full potentialities have never been realized becn.use of a chronic water shortage.
The island is very hilly a,nd has a centra.J ridge that parallels its long axis and rises to a maxin1um altitude of 1,556 feet. The hills are IIOCky and the colluvial and other unconsolidated materials are generally thin. A small but significant deposit of alluvimn extends along Turpentine Run, the only stream having a perennial reach, in the eastern part of the island. The annual
· precipitation is cmnparatively high, averaging about 4.6 inches, but the tropical ocen.nic climate, with a mean annual te1nperature of about 80°F, and the small range in 1nen.n n1onthly temperature permit a year-round growing season which, coupled with the steady blowing of the northeasterly trade winds, results in high evapotranspiration losses. 1\{oreover, the steep, rocky slopes faci1itu.te rapid runoff at the expense of ground-water recharge.
The traditional source of potable water has been rain caught on "catchments," consisting of paved hillsides leading to storage tanks. Supplemental wn.ter supplies that are m.ore highly minern.lized are obtained fron1 shn.llow dug weUs and from a very few springs. Charlotte An1alie employs a dun.l water supply, as snit water is used for .firefighting and flushing of streets. In recent years, the spiraling demand for water spn.rked by the :influx of tourists and new residents resulted in u. critical situation that was met only by shipping in
additional wn.ter by barge from Puerto Rico n.t a rate that exceeded 1 million gallons per week in 1960. A distillation unit to convert sea water to fresh water, having a capacity of 250,000 gallons per day, was under construction in 1961.
Complete chemical analyses of water from 31 wells, including 20 sampled in n.n earlier study (Vaughan and J(idwell, 1920) and 11 sampled recently (Grossman, 1959), permit a delineation of the chemical quality of ground water from the shallow deposits. The ·wells were dt~g to depths ranging from 9 to 50 feet and averaging a,bout 18 feet. The only drilled well on St. Thomas is situated northeast of the hospital in the northern pa.rt of Chn.rlotte Amalie. It is 216 feet deep, but all of its very small supply was reportedly obtained
N
ico
1 rf>;
0 .•c;s
S E A ·'' ~ ~ (\,, ~
FIGURE 55.1.-Map of St. Thomas, V.I., and its geographic setting.
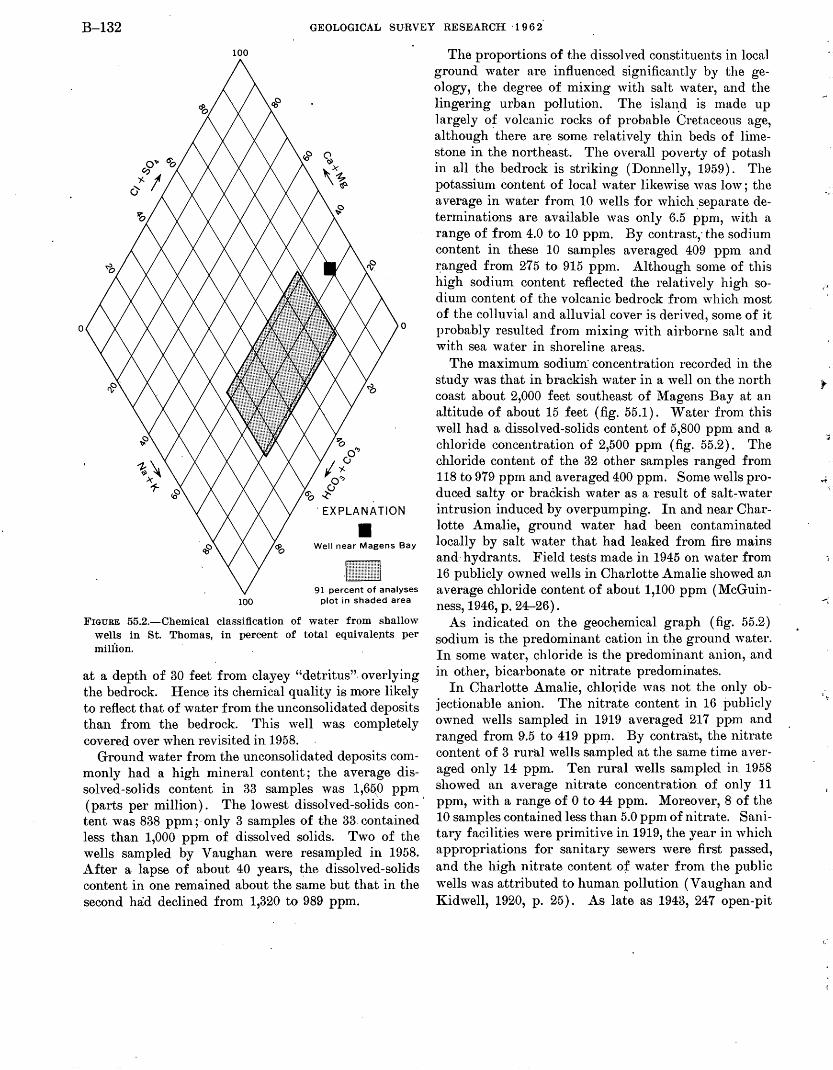
B-132 GEOLOGICAL SURVEY RESEARCH ·1 9 6 2
100
0
100
o"' I 'J.(j
O"' ~(j
0
. EXPLANATION
• Well near Magens Bay
91 percent of analyses plot in shaded area
FIGURE 55.2.-Chemical classification of water from shallow wells in St. Thomas, in percent of total equivale;nts per miliion.
at a depth of 30 feet from clayey "detritus". overlying the bedrock. Hence its chemical quality is more likely to reflect that of water from the unconsolidated deposits than from the bedrock. This well was completely covered over when revisited in 1958.
Ground water from the unconsolidated deposits commonly had a high mineral content; the average dissolved-solids content in 33 samples was 1,6Q,O ppm (parts per million). The lowest dissolved-solids con-· tent was 838 ppm;· only 3 samples of the 33. contained less than 1,000 ppm of dissolved solids. Two of the wells sampled by Vaughan were resampled in 1958. After a lapse of about 40 years, the dissolved-solids content in one remained about the same but that in the second had declined from 1,320 to 989 ppm.
The proportions of the dissolved constituents in local ground water are influenced significantly by the geology, the degree of mixing with salt water, and the lingering urban pollution. The isla1~d is made up largely of volcanic rocks of probable Cretaceous ao-e
. b ' although there ar~ some relatively thin beds of lime-stone in the northeast. The overall poverty of potash in all the bedrock is striking (D01melly, 1959). The potassium content of local water likewise was low; the average in water from 10 wells for which .separate determinations are available was only 6.5 ppm, with a range of from 4.0 to 10 ppm. By contrast; the sodium content in these 10 samples averaged 409 ppm and 1:anged from 275 to 915 pp1n. Although some of this high sodium content reflected the relatively high sodium content of the volcanic bedrock from which most of the colluvial and alluvial cover is derived, some of it probably resulted from mixing with airborne salt and with sea water in shoreline areas.
The maximum sodium· concentration recorded in the study was that in brackish water in a well on the north coast about 2,000 feet southeast of Magens Bay at an altitude of about 15 feet (fig. 55.1). W n.ter from this well had a dissolved -solids content of 5,800 ppm and a chloride concentration of 2,500 ppm (fig. 55.2). The chloride content of the 32 other samples ranged from 118 to 979 ppm and averaged 400 ppm. Some wells produced salty or brackish water as a result of salt-water intrusion induced by overpumping. In and near Charlotte Amalie, ground water had been contaminated locally by salt water that had leaked from fire mains and· hydrants. Field tests made in 1945 on water from 16 publicly owned wells in Charlotte Amalie showed an average chloride content of about 1,100 ppm (McGuinness, 1946, p. 24-26).
As indicated on the geochemical graph (fig. 55.2) sodium is the predominant cation in the ground water. In some water, chloride is the predominant anion, and in other, bicarbonate or nitrate predominates.
In Charlotte Amalie, chloride was not the only objectionable anion. The nitrate content in 16 publicly owned wells sampled in 1919 averaged 217 ppm and ranged from 9.5 to 419 ppm. By contra·st, the nitrate content of 3 rural wells sampled at the same time averaged only 14 ppm. Ten rural wells sampled in 1958 showed an average nitrate concentration of only 11 ppm, with a range of 0 to 44 ppm. Moreover, 8 of the 10 samples contained less than 5.0 ppm of nitrate. Sanitary facilities were primitive in 1919, the year in which appropriations for sanitary sewers were first passed, and the high nitrate content of water from the public wells was attributed to human pollution (Vaughan and Kidwell, 1920, p. 25). As late as 1943, 247 open-pit
i'
,_-
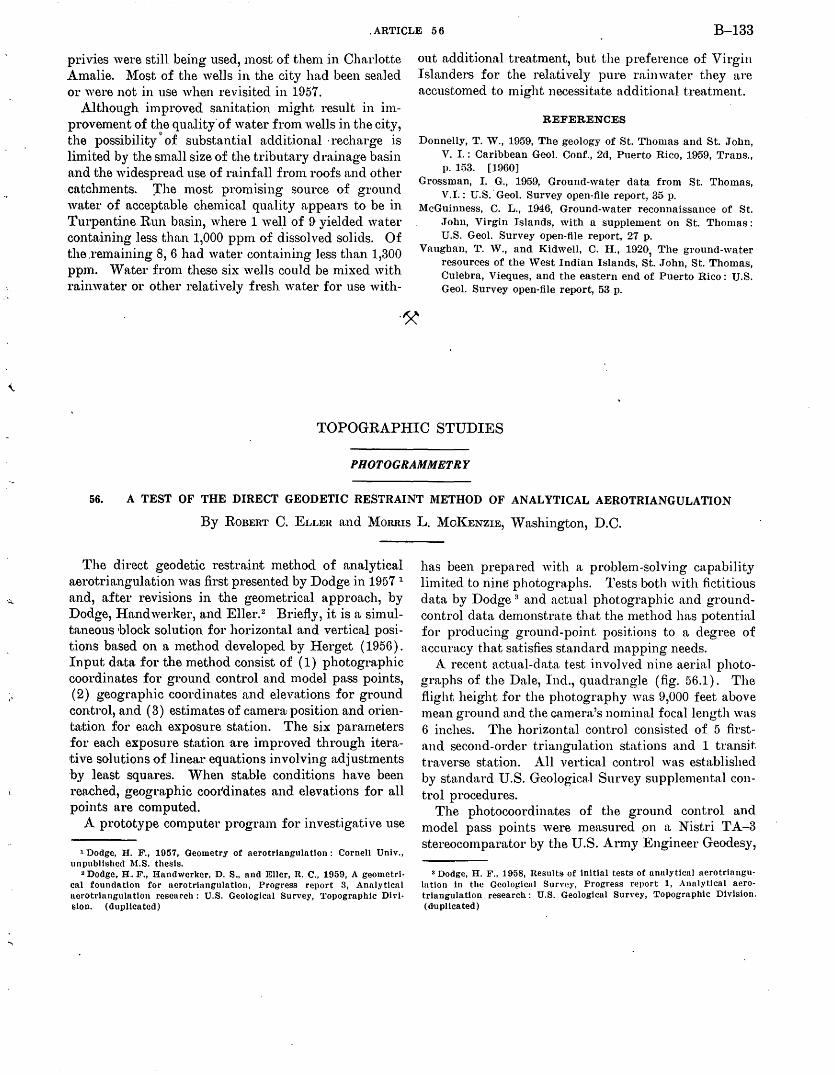
.ARTICLE 56 B-133
privies were still being used, most of them in Charlotte Amalie. l\1ost of the wells in the city had been sealed or were not in use when revisited in 1957.
Although i1nproved sanitation 1night result in improvement of the quality'of water fron1 wells in the city, the possibility o of substantial additional ·recharge is limited by the small size of the tributary drainage basin and the widespread use of rn,infall frmn roofs and other catchments. :The most promising source of ground water of acceptable chemical quality appears to be in Turpentine Run basin, where 1 well of 9 yielded water containing less than 1,000 ppm of dissolved solids. Of the .remaining 8, 6 had water containing less than 1,300 pp1n. Water from these six wells could be mixed with rainwater or other relatively fresh water for use with-
out additional treatment, but the preference of Virgin Islanders for the relatively pure rainwater they are accustomed to might necessitate additional treatment.
REFERENCES
Donnelly, T. ·w., 1959, The geology of St. Thomas and St. John, V. I. : Caribbean Geol. Conf., 2d, Puerto Rico, 1959, Trans., p. 153. [1960]
Grossman, I. G., 1959, Ground-water data from St. Thomas, V.I. : U.S.· Geol. Survey open-file report, 35 p.
McGuinness, C. L., 1946, Ground-water reconnaissance of St. John, Virgin Islands, with a supplement on St. Thomas: U.S. Geol. Survey open-file report, 27 p.
Vaughan, T. W., and Kidwell, C. H., 1920, 'rhe ground-water resources of the West Indian Islands, St. John, St. Thomas, Culebra, Vieques, and the eastern end of Puerto Rico: U.S. Geol. Survey open-file report, 53 p.
·~
TOPOGRAPHIC STUDIES
PHOTOGRAMMETRY
56. A TEST OF THE DIRECT GEODETIC RESTRAINT METHOD OF ANALYTICAL AEROTRIANGULATION
By RoBERT C. ELLER and MoRRis L. MoKENZIE, Washington, D.C.
The direct geodetic restraint method of analytical aerotriangulation was first presented by Dodge in 1957 1
and, after revisions in the geometrical approach, by Dodge, I-Iandwerker, and Eller. 2 Briefly, it is a simultaneous block solution for horizontal and vertical positions based on a method developed by Herget ( 1956). Input data for the method consist of ( 1) photographic coordinates for ground control and model pass points, (2) geographic coordinates and elevations for ground control, and ( 3) estimates of camera- position and orientation for each exposure station. The six parameters for each exposure station are improved through iterative solutions of linear equations involving adjustments by least squares. When stable conditions have been reached, geographic coot1dinates and elevations for all points are computed.
A prototype computer program for investigative use
1 Dodge, H. F., 1957, Geometry of aerotriangulatlon: Cornell Univ., unpublished 1\:l.S. thesis.
u Dodge. H .. F., Handwerker, D. S .. , and Eller, R. C., 1959, A geometrical foundation for ucrotrlnngnlatlon, Progress report 3, Analytical t\.et·ott·lnngulatlon research: U.S. Geological Survey, 'l'opographic Division. (duplicated)
has been prepared with a problem-solving capability limited to nin~ photographs. Tests both with fictitious data by Dodge 3 and actual photographic and groundcontrol data demonstrate that the method has potential for producing ground-point positions to a degree of accuracy that satisfies standard mapping needs.
A recent actual-data test involved nine aerial photographs of the Dale, Ind., quadrangle (fig. 56.1). The flight height for the photography was 9,000 feet above mean ground and the c.c'lmera's nominal focal length was 6 inches. The horizontal control consisted of 5 firstand second-order triangulation stations and 1 transit. traverse station. All vertical control was established by standard U.S. Geological Survey supplemental control procedures.
The photocoordinates of the ground control and model pass points were measured .on a Nistr·i TA-3 stereocomparator by the U.S. Army Engineer Geodesy,
s Dodge, H. F., 1958, Results of initial tests of analytical aerotriangulation in the Geological Survey, Progt·ess re)Jort 1, Analytical aerotriangulation research: U.S. Geological Survey, Topographic Division. (duplicated)
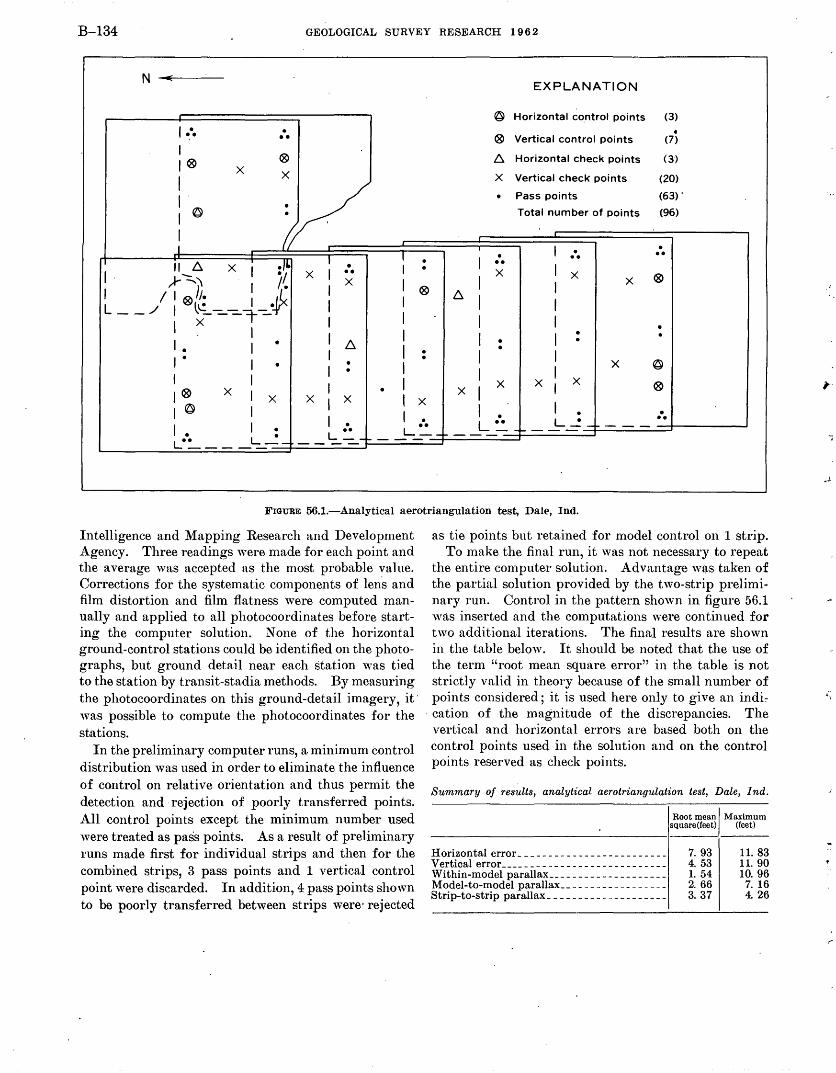
B-134 GEOLOGICAL SURVEY RESEARCH 1 9 6 2
N
I ~·· I I® X
. .. ® X
I I@ I I I ~
II 6. x 1 ~~~ I ;r~~ I i~ I I I ® } 1: 1 .'L L __ ./ I l~-=---=-t--=-*"'
I X - I I • I •
X I I I I I I I I I
• .. X
I I I I I I I I I
. .
EXPLANATION
@ Horizontal control points (3)
® Vertical control points
6. Horizontal check points
X Vertical check points
• Pass points
Total number of points
I :. I X
I I I I I I I I
. .. X
X
I I I • . I
X I
. . X
X
• (7)
(3')
(20)
(63).
(96)
. ..
• . @
® I I® I@
X X X I X
I I X I . ..
I X X I
I • L •• _._
I . L • -r-
. .. I • •
L •_ L . .. L ---I-
FIGURE 56.1.-Analytical aerotriangulation test, Dale, Ind.
Intelligence and Mapping Research and Development Agency. Three readings were made for each point and the average was accepted as the most probable value. Corrections for the systematic components of len-s and film distortion and film flatness were computed manually and applied to all photocoordinates before starting the computer solution. None of the horizontal ground-control stations could be identified on the photographs, but ground detail near each station was tied to the station by transit-stadia methods. By measuring the photocoordinates on this ground-detail imagery, it· was possible to compute the photocoordinates for the stations.
In the preliminary computer runs, a minimum control distribution was used in order to eliminate· the influence of control on relative orientation and thus permit the detection and rejection of poorly transferred points. All control points except the minimum number used were treated as pass points. As a result of preliminary runs made first for individual strips and then for the combined strips, 3 pass points and 1 vertical control point were discarded. In addition, 4 pass points shown to be poorly transferred between strips were· rejected
as tie points but retained for model control on 1 strip. To make the final run, it was not necessary to repeat
the entire computer solution. Advantage 'vas taken of the partial solution provided by the two-strip preliminary run. Control in the pattern shown in figure 56.1 was inserted and the computations were continued for two additional iterations. The final results are shown in the table below. It should be noted that the use of the term "root mean square error" in the table is not strictly valid in theory because of the small number of points considered; it is used here only to give an indi:-
. cation of the magnitude of the discrepancies. The vertical and horizontal errors are based both on the control points used in the solution and on the control points reserved as check points.
Summary of results, analytical aerotriangulation test, Dale, Ind.
Horizontal error ______________ -- ________ _ Vertical error ___________________________ _ Within-model parallax _________ -- ________ _ Model-to-model parallax _________________ _ Strip-to-strip parallax ___________________ _
Root mean Maximum square(feet) (feet)
7. 93 4. 53 1. 54 2. 66 3. 37
11. 83 11. 90 10. 96
7. 16 4. 26
~-
,.
~·
ARTICLE 57, B-135.
The photography ·used for this test was intended for the preparation of 1: 24,000-scale standard topographic quadrangle maps. The accuracy standards for such n1aps require that 90 percent of all discrete points tested fall w.ithin 40 feet of true horizontal position and that 90 percent of all elevations tested be correct within onehalf a contour interval ( 5 feet in this case). The attainment of these sbwdard n,ccuracies in the finished n1ap requires that the photogrammetric control established by aerotriangulation be considerably more ac- · curate than the finished map. The horizontal accuracy
of the network of points determined in the test is considered to meet this requirement, but vertical accuracy needs improvement. More accuracy should result from the use of polyester base or similar aerial film, targeted horizontal and vertical control, apd vertical control of greater accuracy.
REFERENCE
Herget, P. P., 1956, Computational extension of control along a photographed strip: Ohio State Univ. Research Found., Mapping and Charting Research Lab., Tech. Paper 201.
57. RESEARCH ACTIVITY WITH THE U~O ORTHOPHOTOSCOPE
By MARVIN B. ScHER, Washington, D.C.
The function ·of an orthophotoscope is to convert conventional perspective photographs into uniform-scale photographs that portray all images in their correct orthographic positions. The value of a photograph upon which precise horizontnl-distn.nce men.surements can be made without applying corrections for image displacements due to tilt and relief has long been apprecin,ted. Such photogntphs simplify the problem faced by the geologist or engineer when he needs to record his scientific fi.eld observations in their correct orthographic positions. The ort.hophotmnosaic is an accurate assembly of orthophotographs which can be substituted for a planimetric ma.p. A mosaic of this sort often permits scientific field activity to. proceed without the delay otherwise imposed by inadequate map covern,ge :in an area of interest.
An orthophotoscope may be describe!f as a photogrammetr.ic restituting enlarger that magnifies the different images on a perspective photograph inversely as their scale. Fabrication of the U-60 orthophotoscope, the third in a series of such instruments developed during the pn,st decade in the research laboratory of the Topographic Division, U.S.-. Geological Survey, was completed by the Property Mai~1tenance Shop in Silver Spring, Md., early in 1960. . ·
The design of the U-60 benefite.d fr01i1'the experience gained :in the development and use of the preceding orthophotoscopes. The structur~tl design has been altered to accommodate the st1pporting bar for ICelshtype projectors as well as the ellipsoidal-reflector type shown in figure 57.1. The flat film-supporting platform
of the earlier instruments has been replaced with a 12-inch-diameter cylinder around which the blue-sensitive film is attached. The cylinder and its concentric lighttight outer envelope are alined with their longitudinal axis horizontal and parallel to the w direction of the instrument. The platen carriage containing the scanning aperture is mounted ·on a track that extends the entire 32-inch length of the outer drum. The entire assembly of the drums, platen ca,rriage, and track can · be raised or lowered as a unit by manual control. The emulsion of the film is exposed through the scanning
· aperture to small differential areas of the stereoscopicmodel surface as the platen carriage moves along its track. Although the film is exposed to both the red and· blue projected rays which create the anaglyphic model, only the blue rays have an actinic effect on the blue-sensitive film.
The direction of travel of the platen carriage is reversed upon comi)letion of each successive scan. Two automatic, synchronized motions occur when the end of a scanning path is reached : The inner cylinder is rotated about its longitudinal axis and the assembly of the drums and platen carriage is translated in the y direction. The amount of cylinder rotation 1nust be precisely controlled to place the unexposed section of· film bordering upon the film area previously . exposed into correct position under the path of the scanning aperture. The assembly translation must be such that the scanned area across the stereoscopic model will be contiguous with that of the previous scan. This modification permits the operator to have an improved view
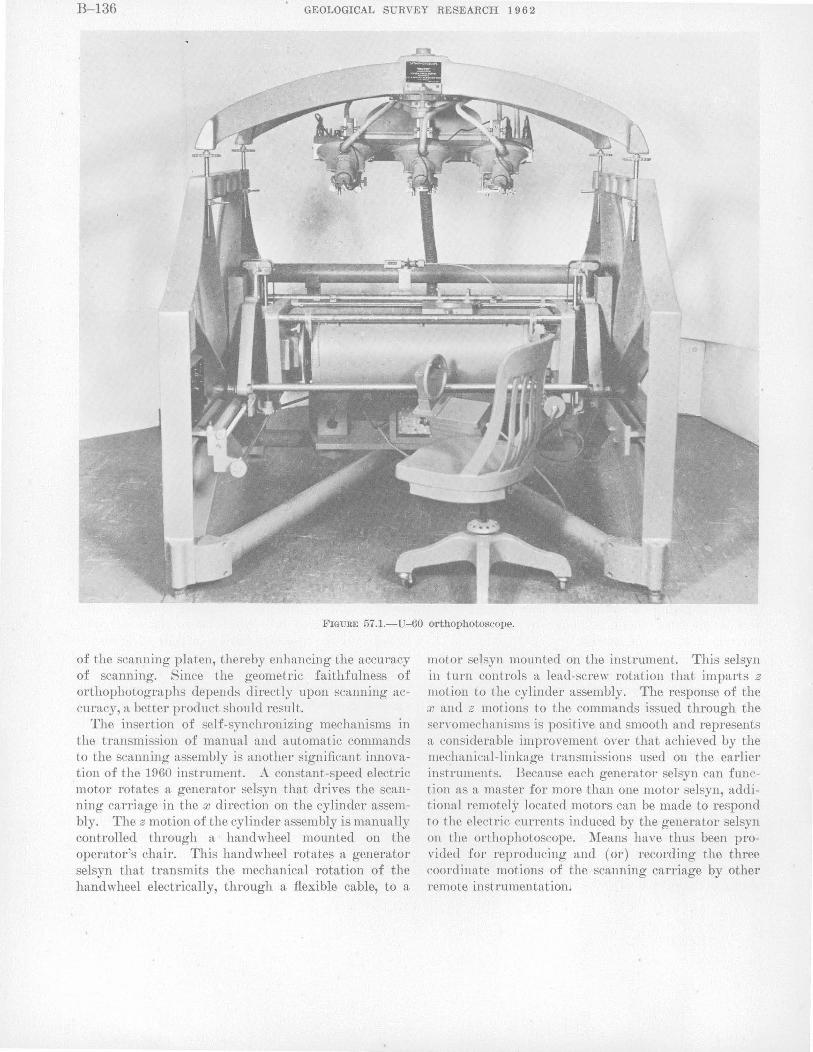
B-136 GEOLOGICAL SURVEY RESEARCH 1 9 6 2
FIGURE 57.1.-U-60 orthophotoscope.
of the scanning platen, thereby enhancing the accuracy of scanning. Since the geometric faithfulness of orthophotographs depends directly upon scanning accuracy, a better product should result.
The insertion of self -synchronizing mechanisms in the transmission of manual and automatic commands to the scanning assembly is another significant innovation of the 1960 instrument. A constant-speed electric motor rotates a generator selsyn that drives the scanning carriage in the x direction on the cylinder assembly. The z motion of the cylinder assembly is manually controlled through a handwheel mounted on the operator's chair. This handwheel rotates a generator selsyn that transmits the mechanical rotation of the handwheel electrically, through a flexible cable, to a
motor selsyn mounted on the instrument. This selsyn in turn controls a lead-screw rotation that imparts z motion to the cylinder assembly. The response of the x and z motions to the commands issued through the servomechanisms is positive and smooth and represents a considerable improvement over that achieved by the mechanical-linkage transmissions used on the earlier instruments. Because each generator selsyn can function as a master for more than one motor selsyn, additional remotely located motors can be made to respond to the electric currents induced by the generator selsyn on the orthophotoscope. Means have thus been provided for reproducing and (or) recording the three coordinate motions of the scanning carriage by other remote instrumentation.
·<
ARTICLE 58 B-137
Performance testing of the U-60 model began in ~{arch 1960 n,t the Topographic Division's Branch of Uesearch and Design, in Arlington, Va. Tests designed to determine the geometric faithfulness of the produced orthonegatives led to further investigation :into: ( 1.) the geometric relationship between the rotation of the film-carrying drum and the translation .of the scanning carriage in the y direction, (2) the relationship between the width of the scanning aperture and the translation of the scanning carriage, (3) the parttllel ism of successive scanning paths, and ( 4) the perpendicularity of the z. motion of the scanning carriage to the plane def-ined by the. w and y axes of the .instrument.. Appropria,te adjustments were made to· .improve these features.
Efforts to enhance the photographic quality of the ol.'thonegat.ives included the checking, adjusting, and (or) coi-rection of: ( 1) the shn.pe of the scanning ·aperture to reduce to insignificance, if not eliminate, scan lines; (2) excessive instrument vibration; and (3) light leaks that would cause unintentional exposure of the orthonegative. During these testing activities it was determined tlutt the original platen lacked the stability needed to insure a constant width of exposure for suc·cessive]y scanned stt·ips. 'Vhen a platen of sturdier design was machined and installed on the instrtlment, this difliculty was overcome.
Studies were made to detern1ine the effect on image definition in the orthonegative caused by varying tl~e dimension of the scanning nperture parallel to the direction of scan. A reduction in this dimension has the effect of n, ~ho1ter exposure time for each segment
of the orthonegative. vVhen this dimension had been reduced to a va.lue of 0.3 mm, it was noted that harmonics in the horizontal motion of the scanning carriage were registering photographically on the orthonegative. A value of 0.4 mm was then determined to be optimum for the present scanning speed of the instrument.
Several minor features were added to the instrument to facilitate operational procedure. A scale was added to indicate the y setting of the scanning carriage. Safelights were installed in appropriate locations. Clamps were added to the x and y motions of the center projector of the three-projector group so that the center projector can be locked in position directly above thecenter of the area traversed by the scanning carriage. A mercury switch was installed on the carriage to illuminate automatically either the right-end or the left-end projector, depending on the position of the scanning carriage along the scanning track. This provision makes feasible the continuous scanning of two adjacent stereomodels in the x direction. . The first production assignment of the U-60 orthophotoscope involved the prepa1·ation of 1 :~0,000-scaJe orthophotomosaics of three standard 71f2-minute quadrangles in Idaho. Seventeen orthonegatives were required to cover the area; nine of these negatives were exposed with the U-60 and the remainder with an earlier orthophotoscope. Comparison of the products of the two instruments demonstrated the superior appearance of the orthophotographs prepared with the newer instrument.
FIELD CONTROL
58. RESEARCH ON TARGET DESIGN FOR PHOTOIDENTIFICATION OF CONTROL
· By DAVID· LANDEN, Washington, D.C.
A research project to improve the design o~ targets used for photo.identificat.ion was carried out by the U.S. Geological Survey in 1960 ~~nd 1961. A large tra~t of land in the Dulles International Airport property at ChantiBy, Va., was made available through the cooperation of the Federal A v.iation Agency for use as a testing range. Targets of various sizes, patterns, and ma-
terials were laid out, then standard vertical aerial photographs of the area were made. In addition, supplemental black-and-white and color photographs were taken with a short-focal-length 35-mm camera. The targets were evaluated by observation in a stereomodel to determine the best target configurations, minimum sizes, and most ·suitable m.a,terials.
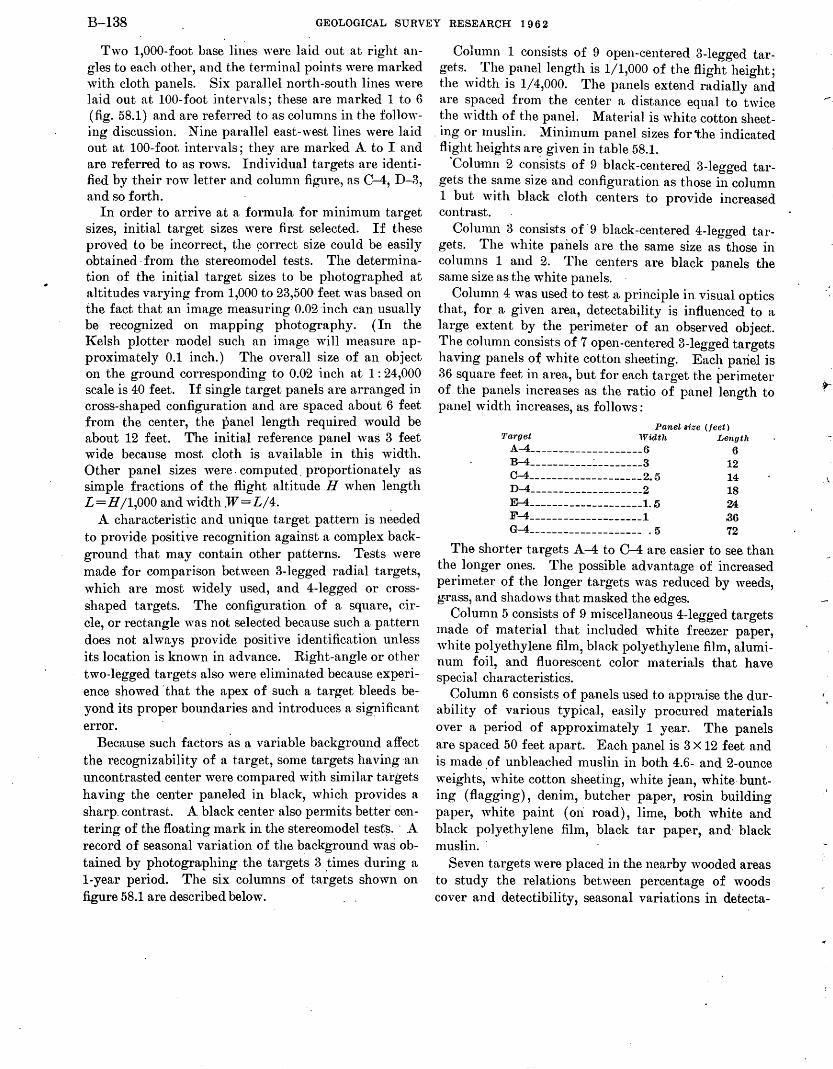
B-138 GEOLOGICAL SURVEY RESEARCH 1 9 6 2
Two 1,000-foot base lines were laid out at right angles to each other, and the terminal points were marked with cloth panels. Six parallel north-south lines were laid out at 100-foot intervals; these are marked 1 to 6 (fig. 58.1) and are referred to as columns in the following discussion. Nine parallel east-west lines were laid out at 100-foot intervals; they are marked A to I and are referred to as rows. Individual targets are identified by their row letter and column figure, as C-4, D-3, and so forth.
In order to arrive at a formula for minimum target sizes, initial target sizes were first selected. If these proved to be incorrect, the ~orrect size could be easily obtained ·from the stereo model tests. The determination of the initial target sizes to be photographed at altitudes varying from 1,000 to 23,500- feet was based on the fact that an image measuring 0.02 inch can usually be recognized on mapping photography. (In the l{elsh plotter model such an image will measure a pproximately 0.1 inch.) The overall size of an object on the ground corresponding to 0.02 inch at 1 : 24,000 scale is 40 feet. If single target panels are arranged in cross-shaped configuration and are spaced about 6 feet from the center, the panel length required would be about 12 feet. The initial reference panel was 3 feet wide because most cloth is available in this width. Other panel sizes were. computed. proportionately as simple fractions of the flight altitude H when length L=H/1,000 and width .W=L/4. .
A characteristic and unique target pattern is needed to provide positive recognition against a complex background that may contain other patterns. Tests were made for comparison between 3-legged radial targets, which are most widely used, and 4-legged or crossshaped targets. The configuration of a square, circle, or rectangle was not selected because such a pattern does not always provide positive identification unless its location is known in advance. Right-angle or other two-legged targets also were eliminated because experience showed 'that the apex of such a target bleeds beyond its proper boundaries and introduces a significant error.
Because such factors ~s a variable background affect the recognizability of a target, some targets having an uncontrasted center were compared with similar targets having the center paneled in black, which provides a sharp_ contrast. A black center also permits better centering of the floating mark in the stereomodel tests. · A record of seasonal variation of the background was obtained by photographing the targets 3 .times during a 1-year period. The six columns of targets shown on figure 58.1 are described below.
Column 1 consists of 9 open-centered 3-legged targets. The panel length is 1/1,000 of the flight height; the width is 1/4,000. The panels extend radially and are spaced from the center a distance equal to twice the width of the panel. Material is white cotton sheet-
. ing or muslin. Minimum panel sizes for ~the indicated flight heights are given in table 58.1.
'Column 2 consists of 9 black-centered 3-legged targets the same size and configuration as those in column 1 but with black cloth centers to provide increased contrast.
Colunm 3 consists of· 9 black-centered 4-legged targets. The white panels are the same size as those in columns 1 and 2. The centers are black panels the same size as the white panels. ·
Column 4 was used to test a principle in vismtl optics that, for a given area, detectability is influenced to a large extent by the perimeter of an observed object. The column consists of 7 open-centered 3-legged targets having panels of white cotton sheeting. Each pariel is 36 squa.re feet in area, but for each target the perimeter of the panels increases as the ratio of panel length to panel width increases, as follows :
Panelsi.ze (feet) Target Width Length
A-4 ____________________ 6 6
B-4-----------~--------3 12 C-4--------------------2.5 14 ])-4 ____________________ 2 18
~--------------------1.5 24 F-4 ____________________ 1 86 G-4 ____________________ . 5 72
The shorter targets A -4 to C-4 are easier to see than the longer ones. The possible ad vantage of increased perimeter of the longer targets was reduced by weeds, g-rass, and shadows that masked the edges.
Column 5 consists of 9 miscellaneous 4-legged targets made of material that included white freezer paper, white polyethylene film, black polyethylene film, aluminum foil, and fluorescent color materials that have special characteristics.
Column 6 consists of panels used to appraise the durability of various typical, easily procured materials over a period of approximately 1 year. The panels are spaced 50 feet a.pa.rt. Each panel is 3 X 12 feet and is made ,of unbleached muslin in both 4.6- and 2-ounce weights, white cotton sheeting, white jean, white bunting (flagging), denim, butcher p:tper, rosin building paper, white paint (mi road), lime, both white and black polyethylene film, black tar paper, and· black muslin. ·
Seven targets were placed in the nearby wooded areas to study the relations between percentage of woods cover and detectibility, seasonal variations in detecta-
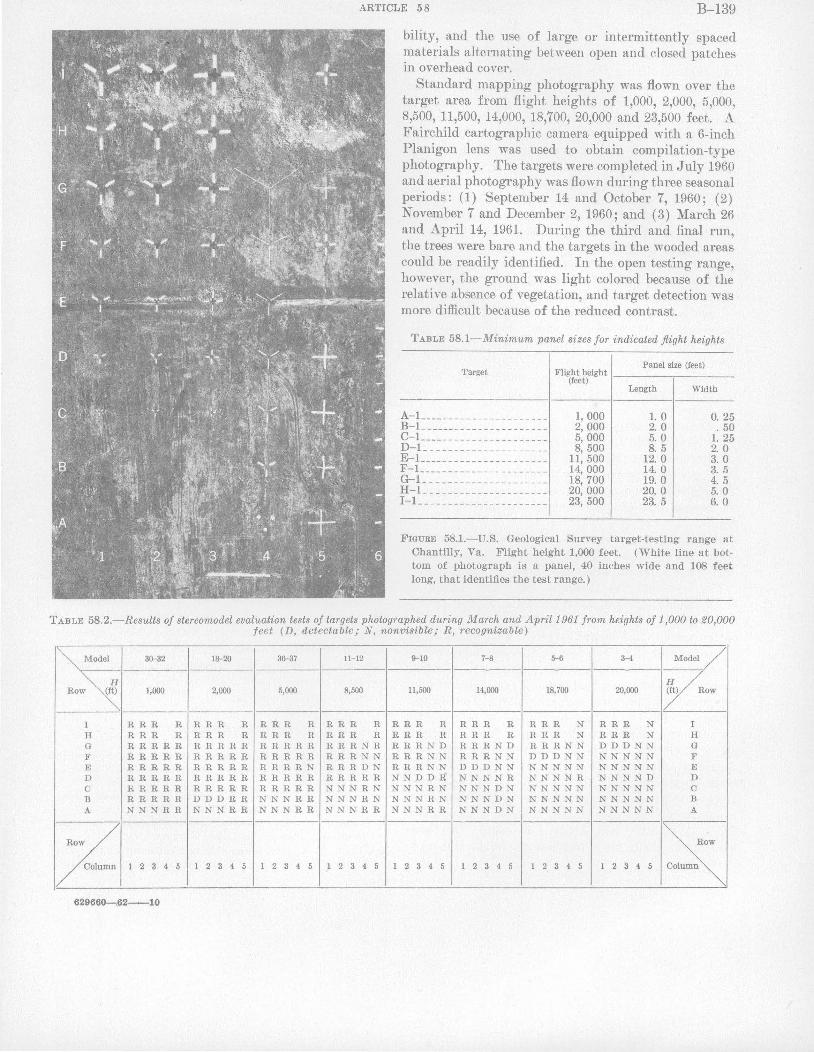
ARTICLE 58 B-139
bility, and the use of large or intermittently spaced materials alternating between open and closed patches in overhead cover.
Standard mapping photography was flown over the target area from flight heights of 1,000, 2,000, 5,000, 8,500, 11,500, 14,000, 18,700, 20,000 and 23,500 feet. A Fairchild cartographic camera equipped with a 6-inch Planigon lens was used to obtain compilation-type photography. The targets were completed in July 1960 and aerial photogr~phy was flown during three seasonal periods: (1) September 14 and October 7, 1960; (2) November 7 and December 2, 1960; and ( 3) March 26 and April 14, 1961. During the third and final run, the trees were bare and the targets in the wooded areas could be readily identified. In the open testing range, however, the ground was light colored because of the relative absence of vegetation, and target detection was more difficult because of the reduced contrast.
TABLE 58.1-_Minimum panel sizes for indicated flight heights
Target
A-1 _____________________ _ B-1 _____________________ _ C-1 _____________________ _ D-1 ____________________ _ E-1 _____________________ _ F-1 _____________________ _ G-1 ____________________ _ Il-l ____________________ _ I-1 _____________________ _
Panel size (feet) Flight height !-----:------
(feet)
1, 000 2, 000 5, 000 8, 500
11, 500 14,000 18, 700 20,000 23, 500
Length Width
1. 0 2. 0 5. 0 8. 5
12.0 14.0 19. 0 20.0 23. 5
0. 25 . 50
1. 25 2. 0 3. 0 3. 5 4. 5 5. 0 6. 0
FIGURE 58.1.-U.S. Geological Survey target-testing range at Chantilly, Va. Flight height 1,000 feet. (White line at bottom of photograph is a panel, 40 inches wide and 108 feet long, that identifies the test range.)
TABLE 58.2.-Results of stereomodel evaluation tests of targets photographed during March and April1961 from heights of 1,000 to 20,000 teet (D, detectable; N, nonvisible; R, recognizable)
~ /
3(}-32 18-20 36--37 11-12 9-10 7-8 5-6 3-4 Model / ----- {t;)?::w
Row ~ 1,000 2,000 5,000 8,500 11,500 14,000 18,700 20,000
/ I RRR R RRR R RRR R RRR R RRR R RRR R RRR N RRR N I H RRR R RRR R RRR R RRR R RRR R RRR R RRR N RRR N H G RRRRR RRRRR RRRRR RRRNR RRRND RRRND RRRNN DDDNN G F RRRRR RRRRR RRRRR RRRNN RRRNN RRRNN DDDNN NNNNN F E RRRRR RRRRR RRRRN RRRDN RRRNN DDDNN NNNNN NNNNN E D RRRRR RRRRR RRRRR RRRRR NNDD:R' NNNNR NNNNR NNNND D c RRRRR RRRRR RRRRR NNNRN NNNRN NNNDN NNNNN NNNNN c B RRRRR DDDRR NNNRR NNNRN NNNRN NNNDN NNNNN NNNNN B A NNNRR NNNRR NNNRR NNNRR NNNRR NNNDN NNNNN NNNNN A
~w/ ~ ~olumn 1 2 3 4 5 1 2 3 4 5 1 2 3 4 5 1 2 3 4 5 1 2 3 4 5 1 2 3 4 5 1 2 3 4 5 1 2 3 4 5 c
629660-,62--10
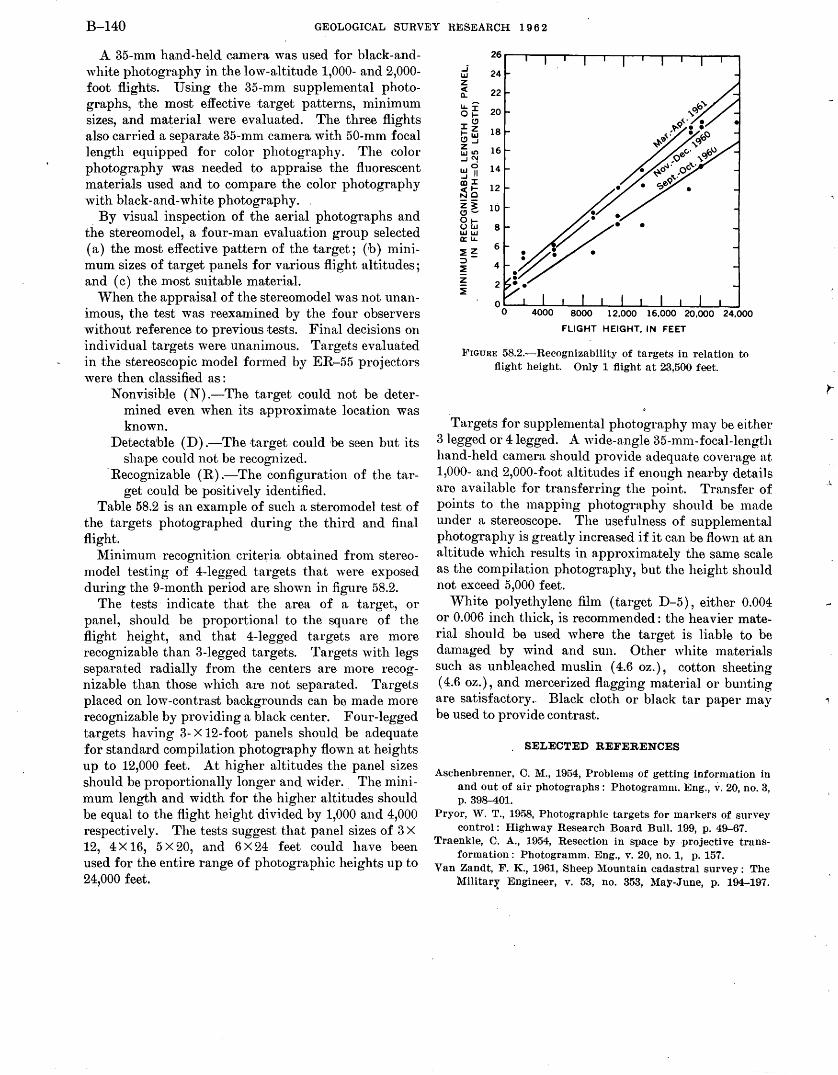
B-140 GEOLOGICAL SURVEY RESEARCH 1 9 6 2
A 35-mm hand-held camera was used for black -andwhite photography in the low-altitude 1,000- and 2,000-foot flights. Using the 35-mm supplemental photographs, the most effective :target patterns, minimum sizes, and material were evaluated. The three flights also carried a separate 35-mm camera with 50-mm focal length equipped for color photography. The color photography was needed to appraise the fluorescent materials used and to compare the color photography with black-and-white photography ..
By visual inspection of the aerial photographs and the stereomodel, a four-man evaluation group selected (a) the most effective pattern of the target; (b) minimum sizes of target panels for various flight altitudes; and (c) the most suitable material.
When the appraisal of the stereomodel was not unanimous, the test was reexamined by the four observers without reference to previous tests. Final decisions on individual targets were unanimous. Targets evaluated in the stereoscopic model formed by ER-55 projectors were then classified as :
Nonvisible (N) .-The target could not be determined even when its approximate location was known.
Detectable (D) .-The target could be seen but its shape could not be recognized.
·Recognizable (R) .-The configuration of the target could be positively identified.
Table 58.2 is an example of such a steromodel test of the targets photographed during the third and final flight.
Minimum recognition criteria obtained from stereomodel testing of 4-legged targets that were exposed during the 9-month period are shown in figure 58.2.
The tests· indicate that the area of a target, or panel, should be proportional to the square of the flight height, and that 4-legged targets are more recognizable than 3-legged targets. Targets with legs separated radially from the centers are more recognizable than those which are not separated. Targets placed on low-contrast backgrounds can be made more recognizable by providing a black center. Four-legged targets having 3- X 12-foot panels should be adequate for standard compilation photography flown at heights up to 12,000 feet. At higher altitudes the panel sizes should be proportionally longer and wider. The minimum length and width for the higher altitudes should be equal to the flight height divided by 1,000 and 4,000 respectively. The tests suggest that panel sizes of 3 X
12, 4 X 16, 5 X 20, and 6 X 24 feet could have been used for the entire range of photographic heights up to 24,000 feet.
~ UJ z < Q..
u..i' 01-I<!' 1-z (!'~ z UJIO -lC\o!
UJ'TI -l mi <I-NO z~ (!' ....... 01-()[/J U.IUJ a::u..
~~ ::J
~ z ~
26
18
16
14
12
10
6
4
2
8000 12,000 16,000 20,000 24,000
FLIGHT HEIGHT, IN FEET
l!.,IGURE 58.2.-Recognizability of targets in relation to flight height. Only 1 flight at 23,500 feet.
Targets for supplemental photography may be either 3legged or 4legged. A wide-angle 35-mm-focal-length hand-held camera should provide adequate coverage at 1,000- and 2,000-foot altitudes if enough nearby details are available for transferring the point. Transfer of points to the mapping photography should be made under a stereoscope. The usefulness of supplemental photography is greatly increased if it can be flown at an altitude which results in approximately the same scale as the compilation photography, but the height should not exceed 5,000 feet.
White polyethylene film (target D-5), either 0.004 or 0.006 inch thick, is recommended: the heavier material should be used where the target is liable to be damaged by wind and sun. Other white materials such as unbleached muslin ( 4.6 oz.), cotton sheeting ( 4.6 oz.), and mercerized flagging material or bunting are satisfactory.. Black doth or black tar p~t.per may be used to provide contrast.
. SELECTED REFERENCES
Aschenbrenner, C. M., 1954, Problems of getting information in and out of air photographs: Photogramm. Eng., v. 20, no. 3, p. 398-401.
Pryor, ,V, T., 1958, Photographic targets for markers of survey control: Highway Research Board Bull. 199, p. 49-67.
Traenkle, C. A., 1954, Resection in space by .projective transformation: Photogramm. Eng., v. 20, no. 1, p. 157.
Van Zandt, F. K., 1961, Sheep Mountain cadastral survey: The Militar~ Engineer, v. 53, no. 353, May-June, p. 194-197.
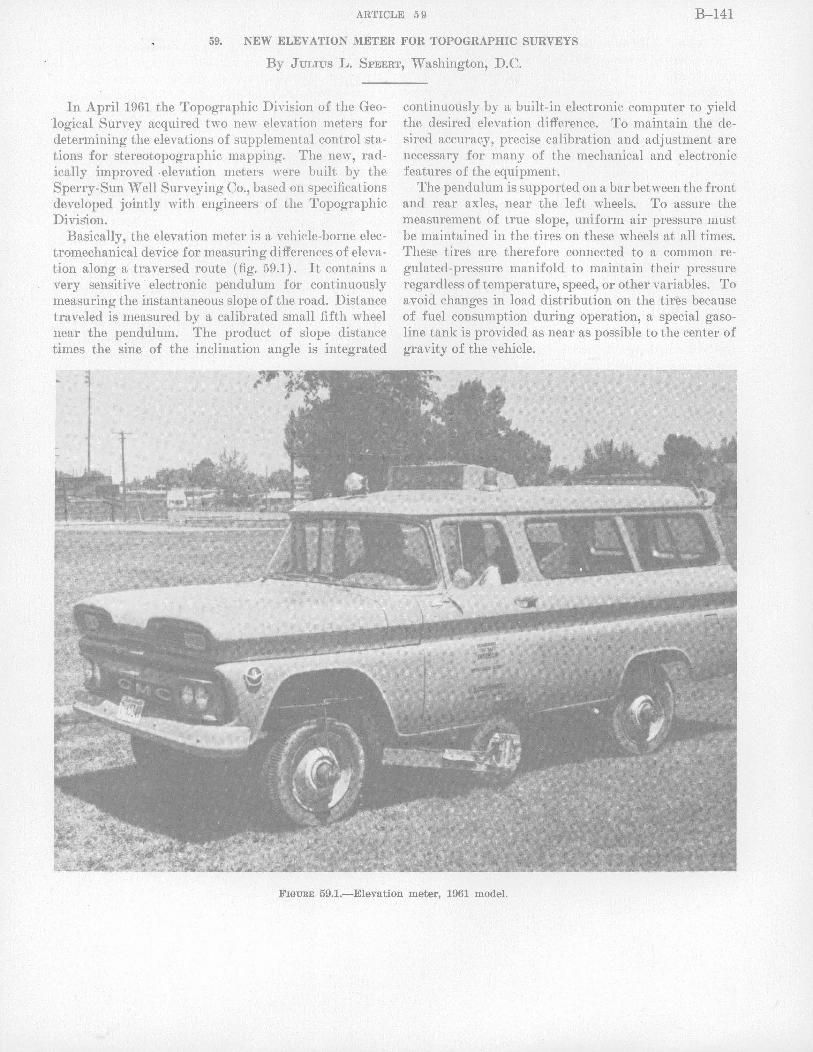
ARTICLE 59 B-141
59. NEW ELEVATION METER FOR TOPOGRAPHIC SURVEYS
By JULius L. SPEERT, Washington, D.C.
In April 1961 the Topographic Division of the Geo-1ogical Survey acquired two new elevation meters for determining the elevations of supplemental control stations for stereotopographic mapping. The new, radically improved ·elevation meters were built by the Sperry-Sun Well Surveying Co., based on specifications developed jointly with engineers of the Topographic Division.
Basically, the elevation meter is a vehicle-borne electromechanical device for measuring differences of elevation along a traversed route (fig. 59.1). It contains a very sensitive · electronic pendulum for continuously measuring the instantaneous slope of the road. Distance traveled is measured by a calibrated small fifth wheel near the pendulum. The product of slope distance times the sine of the inclination angle is integrated
continuously by a built-in electronic computer to yield the desired elevation difference. To maintain the desired accuracy, precise calibration and adjustment are necessary for many of the mechanical and electronic features of the. equipment.
The pendulum is supported on a bar between the front and rear axles, near the left wheels. To assure the measurement of true slope, uniform air pressure must be maintained in the tires on these wheels at all times. These tires are therefore connected to a common regulated-pressure manifold to maintain their pressure regardless of temperature, speed, or other variables. To a void changes in load distribution on the tires because of fuel consumption during operation, a special gasoline tank is provided as near as possible to the center of gravity of the vehicle.
FIGURE 59.1.-Elevation meter, 1961 model.
B-142 GEOLOGICAL SURVEY RESEARCH 1 9 6 2
To a void false slope measurements on crowned roads and on curves, it is essential that the rear wheels traverse exactly the same path as the front wheels. This is accomplished by steering with all four wheels when the meter is in operation. The rear axle is therefore a duplicate of the front axle. Four-wheel drive is also available for use on soft roads.
All the electronic circuits are transistorized and are printed ~n pluggable boards, to reduce power requirements and field maintenance problems and to improve reliability. In many cases, troubleshooting in the field consists merely of replacing circuit boards, in turn, until the faulty one is located.
Precise adjustment of the pendulum is, of course, essential to accurate measurement of elevation. The p~ndulum base is first alined with the line connecting the axles. The pendulum itself is then calibrated on a special tilting stand for various slope angles between -15° and + 15°. After these mechanical adjustments, the meter is driven around a closed loop and a further electronic adjustment is made, if necessary, to bring the loop closure to zero.
Precision of elevation determination is a direct function of precision of distance measurement. The fifth wheel is therefore calibrated periodically to compensate for wear, and its tire pressure is maintained constant by connection with the regulated-pressure tank. Effects of centrifugal force on the wheel circumference are compensated electronically. This compensation is calibrated both at very slow speeds and at higher, operating speeds.
The danger of inaccurate recording is overcome in the new elevation meter. by an .automatic printing recorder. The vehicle is stopped for each elevation reading, to avoid dynamic effects on the pendulum, and the following information is automatically printed on adding-machine tape at the push of a button: The sta.tion designation (preset manually at each s~ation), the
elevation of the starting point on the line (preset manually at the beginning of the run), the increment in elevation, the elevation of the new point, and the distance from the starting point. This distance is compared visually with that on a mechanical counter, as a check on the electronic measurement of distance and elevation.
A small builders' level and a level rod are used to tie to bench marks and other off-road points. The level is supported on a sp~cial bracket so that the operator may take a rod reading on a side point without leaving his seat.
The cab of the vehicle is air conditioned to assure dust-free operation of the delicate equipment. Numerous other features are included for comfort, convenience, and efficiency. A number of safety devices are included to reduce traffic hazards. The vehicle is equipped with a full set of replaceable spare parts, necessary handtools, calibration and test equipment, and other survey equipment that might be needed on an assignment. A special electrical-analog adjuster is included so that a least-squares adjustment may be applied to survey networks in the field if desired.
In normal operations over good roads, the elevation meter may be driven at speeds up to 25 miles per hour. On soft or rough roads it is necessary to reduce the speed to protect the equipment, to maintain accuracy, and to avoid driver strain. Average survey mileage ranges from 30 to 50 miles per day, with a maximum of 102 miles recorded in a single day over good roads. Adjusted elevations accurate within 1 or 2 feet are readily attainable with proper controls on planning and execution of the work. Lines may be double run for greater accuracy. The elevation meter is used most effectively on large projects with a fairly dense network of passable roads. It is not economical on small projects or where good roads are sparse.
·r
SUBJECT INDEX
[Fol' major topic headings, such as "Econo~ic Geology," "Stratigraphy" "Ground Water" see d St t , , un er a e names or refer to "Table of Contents"]
A
ABS determinations, methylene blue method ------'------
Aerotriangulation, analytical, direct geodetic restraint method -------------
Alaska, eastern, stratigraphy ______ _ Alluvial fans, relation of morphology
to drainage-basin characteristics ----------
Alluvium, movement of ground water in ------------
Alu!llinum, in surface water, rela-tion to pH __________ _
Ammonites, Cretaceous, Colorado __ _ Cretaceous, Montana _________ _
South Dakota ___________ _ Jurassic, California __________ _ Triassic, California ___________ _
Antarctica, geochemistry, Taylor Glacier ------------~
Arizona, geomorphology, Colorado River system--~------
ground-water, Flagstaff ar~a __ _ Artesian water, rate of upward
leakage -------------
B
Basalt, index of refraction meas-urements ------------
Belt Series) Idaho, stratigraphy ___ _ Beryl, in veins in limestone _______ _ Boron; determination of, in water
containing fluorine ___ _ Brines, oil-field; Na/Cl ratios ______ _
c
California, geomorphology, San Joaquin Valley, l!..,resno
County -------------geomorphology, San Joaquin
Valley, Los Banos-Kettleman City ·area __
geophysics, Coast Ranges, north-
ern -----------------Great Valley ____________ _ Klamath. Mountains ______ _
paleontology, Klamath Moun-tains, southern ______ _
Sierra Nevada, Kings River area ----------------
stratigraphy, Sierra Nevada, Kings River area _____ _
Sierra Nevada, American River area __________ _
surface water, Sacramento River, Sacramento ___ _
Carbon dioxide, in sea water and sediment ------------
Chloride, in ground water_ ________ _ in surface water ____________ _
Cinnabar, in fault zones _________ _ Clay, relation of content in sediments
to volumetric shrink-
age -----------------
Article
49
56 11
19
37
53 22 22 22
6 23
28
18 89
40
29 5 2
48 52
19
16
25 25 25
23
7
7
6
46
33 33 52
2
16
Article Clay balls, deposition and formation_ 14
'colorado, geomorphology, Larimer
County ------------- 17 ground water, Las Animas_____ 44 paleontology, Boulder County__ 22
Otero County_____________ 22 Pueblo County------------ 22
stratigraphy, Larimer County__ 17 Colorado Plateau, alluviation and
erosion ------------·- 18 Colorado Shale, Fall River Sandstone
Member, Co I or ado, phosphate nodules____ 12
Cretaceous, Black Hills, dip directions in crossbedding_______ 13
Black Hills, new stratigraphic
unit ---------------- 8 Colorado, Haresiceras__________ 22 Montana, faulting_____________ 3
Haresiceras ------------- 22 South Dakota, Haresiceras_____ 22
Crystalline rocks, effect of weathering on water-yielding prop-erties --------------- 43
D
Dakota Sandstone, Colorado, aquifer
tests ---------------- 44 Detergents, in water, ABS determina-
tions --------------- 49 Dewey Lake Redbeds, New Mexico
and Texas, correlations and stratigraphic rela-tions .--------------- 9
Dianthrimide method, determination of boron_____________ 48
E
Elevation meter, fo.r topographic surveying ----------
Englishtown Formation, New Jersey, hydrochemical facies __
Entrada Sandstone, Colorado, aquifer
tests ----------------Eocene, New Jersey, marginal sea __ _ Evaporation, from salt-flat areas ___ _ Evaporites, prospecting for ________ _
F
Faults and faulting, as ore controls __ detachment faults------------effect on movement of ground
water ---------------relation to ground water_ ____ ""_
Fluorescence analysis, lanthanum ox-Ide as an absorber ___ _
Fluoride, determination of boron in presence of __________ _
Fluorite, in veins in limestone ____ _ Foraminifera, Eocene, New Jersey __ _ "400-foot sands," Louisiana, hydro-
chemical facies ______ _
59
51
44 21 40
2
1 3
4 39
31
48 2
21
50
G
Garnet, vanadium-rich Geochronology, radioca-rb~~-d-at;;=== Georgia, ground water, Georgia Nu-
clear Laboratory _____ _ surface water, Tired Creek,
Cairo area __________ _
Yellow River, Snellville
area ----------------Glasses, determination of silica in __
. Gold, in veins in rhyolite ______ .:_ __ _ Granite, riebeckite, thorium and uran-
ium content_ ________ _ Greenland, Centrum SJ'l, geophysics __ ,
H
Haresiceras, recent discoveries, in Colorado and South
Dakota ------------Ha wail, engineering geology and
geomorphology, Kilauea
Volcano -------------geophysics, Kilauea Volcano ___ _ petrography, Kilauea _________ _
Hydrochemical facies, relation to rock type ___________ _
Hydrothermal activity, along faults_
I
Idaho, geochemistry, Madison Range,
southern -----------paleobotony, Madison Range,
southern -----------petrology and stratigraphy, Idaho
batholith, Big Creek
Article
26 11
43
47
47 30
2
27 24
22
20 20 29
50,51 4
10
10
area ---------------- 5 stratigraphy, Madison Range,
southern ------------ 10 Index of refraction measurements,
basalt -------------- 29 Iron, in diorite___________________ 2 Islands, aquifers on_______________ 55
J
Jurassic, California, unconformities__ 6 California, metamorphic rocks__ 7
K
Kansas, southwestern, quality of
water --------------- 52 Kentucky, Beaver Creek area, quality
of water_____________ 53
L
Lakota Formation, South Dakota and Wyoming, dip directions in crossbedding_______ 13
Lanthanum oxide, as an absorber in fluorescence analysis___ 31
Louisiana, quality of water, Baton Rouge area___________ 50
B-143
B-144
Low flow, surface water, estimation of continuous defi-
Article
ciency -------------- 45
M
Magnetism, earth, in areas of ultra-mafic rock __________ _
Manganese ore, determination of thal-lium in _____________ _
Mapping, aerotriangulation ________ _ classification of stream channels
on topographic maps __ _ elevation meter--------------orthophotoscope -------------target design for photoidentifica-
tion of controL _____ _ Mesozoic, California, angular uncon
formity ------------See also Triassic, Jurassic, Cre
taceous. Metamorphism, of uranium-vanadium
deposits -------------of volcanic rocks ____________ _
Methylene blue method, ABS determinations ----------
Montana, geochemistry, Madison Range, southern _____ _
geochemistry, Bearpaw Moun-tains, Suction Creek __ _
paleobotony, Madison Range, southern ------------
paleontology, Carter County ___ _ sedimentary petrology and sedi
mentation, Bear p·a w Mountains, S u c t i o n Creek ________ : _____ _
stratigraphy, Black Hills uplift_ Madison Range, southern __ _
structural geology, Gallatin County, Tepee Creek quadrangle ---------
Morrison Formation, Colorado, aqui-fer tests ____________ _
N
Nevada, economic geology, Humboldt
Range -------------economic geology, Taylor district,
Ely -----------------ground water, East Range,- Hum-
boldt and Pershing Counties -----------
Humboldt River, Humboldt
County -------------structural geology, East Range,
Humboldt and Pershing Counties ------------
Schell Creek Range _______ _ New Jersey, geochemistry, coastal
plain, Monmouth and Ocean Counties ______ _
quality of water, coastal plain, Monmouth and Ocean Counties -----------
Mullica River, Wharton
Tract --------------paleontology and stratigraphy,
coastal plain, Camden
County -------------New Mexico, ground water. Mor-
tandad Canyon, Los Alamos area ________ _
mineralogy, Laguna mining district ---------------
sedimentary petrology, R i o Puerco area _________ _
stratigraphy, southeastern ____ _
25
32 56
47 59 57
58
6
26 5
49
10
12
10 22
12 8
10
3
44
2
1
4
15
4 1
51
51
36
21
37
26
14 9
SUB.JECT INDEX
Article New York, ground water, Long Is-
land, Champlin Creek__ 38 Niobrara Formation, Colorado, Hare-
siceras -------------- 22 North Pacific, C02 content of water
and sediments________ 33
0
Ohio, ground water, Miami River,
Dayton -------------Oil-field brines, Na/Cl ratios ______ _ Oklahoma; western, quality of water_ Oligocene, Idaho and Montana, vol-
canic rocks __________ _
Ore controls, faults and faulting ___ _ stratigraphic -----------------
Orthophotoscopes, new developments_
p
Packers, inflatable, use in water wells --------------
Paleobotany, Oligocene rocks, Mon-tana and Idaho ______ _
Paleozoic, California, angular unconformity ------------
See also Silurian, Permian. Pennsylvania, French Creek, surface
water --------------Perlite, prospecting for ___________ _ Permafrost, in stratified sand _____ _ Permian, Colorado, aquifer tests ___ _
New Mexico, southeastern _____ _ Texas; western ______________ _
Perennial flow, surface water, origin_ pH, of surface water, relation to
aluminum content_ ___ _ Phosphate, nodules, origin ________ _
sedimentary, origin ___________ _ Photogrammetry. See Mapping. Pierce Canyon. Redbeds. See Dewey
Lake Redbeds. Pierre Shale, Red Bird Silty Metmber,
Black Hills uplift_ ___ _ Colorado and South Dakota,
H aresiceras __________ _ Pleistocene, Arizona, Colol·ado River
system ______________ _ Colorado, glacial tilL ________ _ Utah, Colorado River system __ _
Pollen, Idaho ·and Montana, Oligocene volcanic rocks _______ _
Pollution control, surface water ___ _ Porosity, estimating from specific
gravity-------------of saprolite------------------
Prairie Divide Till, Colorado, correla-tion and extent_ _____ _
Precambrian, Idaho, metavolcanic rocks----------------
Prospecting. See specific mineral name.
Purgatoire Formation, Cheyenne Sandstone Member, Col-orado, aquifer tests __ _
Q
Quaternary. See Pleistocene, Recent.
R
Radiocarbon dates, volcanic ash ___ _ Recent, Arizona, Colorado River sys-
·te'm -----------------Utah, Colorado River system __ _
Reservoirs, effect on ground-water levels----------------
41,42 52 52
10 1 1
57
44
10
6
45 2
24 44
9 9
47
53 12 12
8
22
18 17 18
10 54
15 43
17
5
44
11
18 18
35
Rock analysis, by X-ray fluorescence_ Runoft', control by aquifer permea-
.b111ty _______________ _
control by head differentiaL __ _ sources and variation ________ _
s
Sailor Canyon Formation, California,
Article 31
38 38
38,42
unconformity at base-- 6 Salt springs, Na/Cl ratios__________ 521 Salt water, movement in coastal aqui
fers__________________ 34 Salts, in ice platforms_____________ 28
rate of accumulation by evapora-tion ----------------- 40
Sand and gravel, locating deposits__ 2. Saprolite, hydrologic .properties_____ 43 Scheelite, in veins in limestone_____ 2 Sea level, effect on salt-water level in
aquifers-------------- 34 Sea water, C02 content____________ 33 Sediment, deep-sea, C02 content____ 33 Severinghaus electrode, determination
of C02 content of water and sediments________ 33
Shoo Fly Formation, California, un-conformity at top_____ 6
Silica, determination of, in tektites and glasses___________ 30
Sillcate rocks, X-ray fluorescence analysis______________ 31
Sillciflcation, as an ore control----- 1 Silurian, California, angular uncon-
formity -------------- 6 Silver, In rhyolite_________________ 2
in silicified bodies_____________ 1 in veins in limestone__________ 2
"600-foot sands," Louisiana, hydro-chemical facies_______ 50
Sodium, in ground water__________ 52 in S!Jrface water______________ 52
South Dakota, paleontology, Meade County -------------- 22
sedimentation, B 1 a c k Hills, northern_____________ 13
stratigraphy, Black Hills upllfL 8 Specific gravity, relation to porosity_ 15 Specific yield, of saprolite'--------- 43 Stibnite, in fault zones------------ 2 Streamflow, analysis_______________ 45
relation to movement of ground water________________ 36
Strea•m profiles, ty·p~s------------- 42 Subsidence, land, relation to clay
content of sediments__ 16 near-surface, alluvial-fan depos-
its__________________ 19 Syenite, nepheline, thorium and ura-
nium content_________ 27
T
Tektites, determination of silica in__ 30 Temperature, ground ______________ 16, 24
ground water _________________ 41, 42 Temperature-depth relations, ground
water________________ 42 Tertiary. See Eocene, Oligocene. Texas, geochemistry, Big Bend Na
tional Park-----------geochemistry, western ________ _ quality of water, Brazos River
basin----------------quality of water, western ______ _ stratigraphy, western _________ _
Thatlium, determination by X-ray fiuorescene ___________ _
in manganese ore ____________ _
27 52
54 52
9
32 32
,..
~L'horium, In uJknllc Igneous rockS--~l'ldes, effect ou surfnce-wu ter dh;-
Article 27
churge --------------'l'rlnsslc, Cullfornln, metu•morpblc
46
rocks---------------- 7 Cnllforuln, new fossll collections_ 23 Colorado, a(JlllfCI' tests_________ 44
u
Ultrnmu.fic rocks, magnetic anomalies
OVCl' ---------------UnderflOW, ground-water, benettth
riverS----------------Uranium, ln nlknllc Igneous rocks--Urnnlum·vnnndlum deposits, effect
of metnmorpbism on __
25
36 27
26
Artlcl~ Abrahams, J. H., Jr_______________ 3.7 Adler, Isidore-------------------- 31 Aker~ J. P--~------------------- 89
Baltz, E. H---------------------- 311 Bath, G. D----------------------- 25 Bedinger, 1\f. 8-------------------- 35 Brown, R J--------------------- 40 Bull, \V. B----------------------- 19
Cuemmerer, Allee ----------------- 27 Carron, l\:1. IL-------------------- 3.0 Clnrk, L. D---------------------- 6 Cobbun, W. A-------------------- 8, 22 Cohen, Phtllp -------------------- 4, 15 Cooley, 1\:f. Jll _____________ _:_:______ 18
Coope~ J. B---------------------- 9 Crippen, J. R-------------------- 45 Curtis, W. 1!'--------------------- 14 Cuttlttn, l!"'rnnl<------------------- 30
Dodge, F. C---------------------- 7 Drewes, Harald----------------~-- 1
Eller, R C----------------------- 56
li'ahnestocl<, R K----------------- 17 Fcrnnld, A. T-------------------- 11 Il'cth, J. H----------------------- 40 Flunngan, F. J------------------- 81, 8~ Fros~ I. C----------------------- 28
Glll, J. R------------------------ 8, 22 Gottfried, David__________________ 27
Grossman, I. G------------------- 55
SUBJECT INDEX
Article-Utah, geomorphology, Colorado Rivet·
system_______________ 18 ground water, Great Salt Lake
area------~---------- 40
v Valley trains, ground water in _____ 41, 42 Vnnudium, ln garnet______________ 26 VIrgin Islands, St. Thomas, quality
of water_____________ 26 Virginia, Augustn County, geochem-istry ________________ _
Volcunlc ash, radiocarbon dating __ _ Volcanic rocks, chemical analyses __ _
metamorphosed --------------Volcanoes, measurement of growth-Volumetric shrinkage, sediments, re
lation to clay content_
AUTHOR INDEX
27 11 10
5 20
16
Article Hamilton, \Varren ---------------Haugen, R. T-------------------Hardlson, C. H------------------Harris, D. V --------------------Hayes, P. C----------------------Henrn, B. C., Jr _________________ _
Henry, H. R----------------------Herrlck, S. 1\L--------------------
10,28 20 45 17 28 12 34 21
Imlay, R. W ---------------------- 6 Irelan, Burdge___________________ 54 Irwin, J. H---------------------- 44 Invin, W. P --------------------- 23, ·25
Jenkins, E. D-------------------- 44 Johnson, A. 1--------------------- 16 Kantrowitz, I. H----------------- 38 Koopman, F. C------------------- 44 Krlnsley, D. B-------------------- 24
Landen, David------------------- 58 Lang, S. M----------------------- 36 Leonard, A. R-------------------- 52 Leonard, B. F-------------------- 5 Leopold, E. ~-------------------- 10
:McKenzie, M. L------------------ 56 1\fcl\:Iath, V. E-------------------- 6 l\:lapel, W. J ---------------------- 13 Mendieta, H. B------------------- 54 Milton, Charles------------------- 12 Moench, R. H-------------------- 26 l\ioore, G. VV--------------------- 33 Moore, J. 0---------------------- 7, 20 Moore, Roosevelt_________________ 27
l\forgan, C. 0-------------------- 50
B-145
w Article
Weathering, effect on water-yielding· properties of crystalline rocks-------~-------- 48
Wyoming, sedimentation, Black Hills, northern ------------- 13
stl'Utlgrapby, eastern, Bla.ck Hills UtpltfL--------------- 8
X
X-ray fluorescence, analysis of silicate rocks ----------------
thallium ln mungnnese ore ____ _
y
Yukon Territory, southern, stratigra-phy _________________ _
31 32
1l
Article. Morris, D. A--------------------- 16 Musser, J. J______________________ 53
Nordin, C. F., Jr_________________ 14 Norris, S. E---------------------- 41, 42 Nygren, H. D--------------------- 3·3
Pecora, W. T--------------------Pillmore, C. L-------------------Pluhowski, E. L----------------Purtymun, W. D------------------
Rantz, S. E---------------------Reed, J. E-----------------------Richter, D. H-------------------Roberson, C. E------------------Rhodebamel, E. C---------------Rose, H. J ., Jr -------------------Rowe, J. J ______________________ _
Scher, M. B----------------------Schneider, W. J __________________ _
Scott G. R----------------------Seaber, P. R----------------------Silberllng, N. J -------------------Speert, J. L ____________________ _
S[Jieker, A. 1\f-------------------Stewart, D. B-------------------Stewart, J. W --------------------
1'atlock, D. B--------------------
\Vallace, R. E--------------------\Vnrd, P. E----------------------Wayman, C. H--------------------\Vhetstone, G. \V ________________ _ Winner, 1\I. D., Jr _______________ _
\Vitkind, I. J--------------------
12 1& 38 g,7
46 85 20 33 36
81,32 48
57 47 22 51
6,23 59
41,42 29 43
2
2 52 49 58-50
3·
U.S. GOVERNMENT PRINTING OFFICE : 1962 Q-629660