Embed Size (px)
Citation preview

geology and
geochemistry of
oil and gas
DEVELOPMENTS IN PETROLEUM SCIENCE 52
i

Volumes 1-7, 9-18, 19b, 20-29, 31, 34, 35, 37-39 are out of print.
8 Fundamentals of Reservoir Engineering
19a Surface Operations in Petroleum Production, I
30 Carbonate Reservoir Characterization: A Geologic-Engineering Analysis, Part I
32 Fluid Mechanics for Petroleum Engineers
33 Petroleum Related Rock Mechanics
36 The Practice of Reservoir Engineering (Revised Edition)
40a Asphaltenes and Asphalts, I
40b Asphaltenes and Asphalts, II
41 Subsidence due to Fluid Withdrawal
42 Casing Design – Theory and Practice
43 Tracers in the Oil Field
44 Carbonate Reservoir Characterization: A Geologic-Engineering Analysis, Part II
45 Thermal Modeling of Petroleum Generation: Theory and Applications
46 Hydrocarbon Exploration and Production
47 PVT and Phase Behaviour of Petroleum Reservoir Fluids
48 Applied Geothermics for Petroleum Engineers
49 Integrated Flow Modeling
50 Origin and Prediction of Abnormal Formation Pressures
51 Soft Computing and Intelligent Data Analysis in Oil Exploration
52 Geology and Geochemistry of Oil and Gas
DEVELOPMENTS IN PETROLEUM SCIENCE 52
ii

geology and
geochemistry of
oil and gas
DEVELOPMENTS IN PETROLEUM SCIENCE 52
G.V. Chilingar, L.A. Buryakovsky, N.A. Eremenko
& M.V. Gorfunkel
Amsterdam – Boston – Heidelberg – London – New York – Oxford
Paris – San Diego – San Francisco – Singapore – Sydney – Tokyoiii
ELSEVIER B.V. ELSEVIER Inc. ELSEVIER Ltd ELSEVIER Ltd
Radarweg 29 525 B Street, Suite 1900 The Boulevard, Langford Lane 84 Theobalds Road
P.O. Box 211, 1000 AE San Diego, CA 92101-4495 Kidlington, Oxford OX5 1GB London WC1X 8RR
Amsterdam, The Netherlands USA UK UK
© 2005 Elsevier B.V. All rights reserved.
This work is protected under copyright by Elsevier B.V., and the following terms and conditions apply to its use:
Photocopying
Single photocopies of single chapters may be made for personal use as allowed by national copyright laws. Permission
of the Publisher and payment of a fee is required for all other photocopying, including multiple or systematic copying,
copying for advertising or promotional purposes, resale, and all forms of document delivery. Special rates are available
for educational institutions that wish to make photocopies for non-profit educational classroom use.
Permissions may be sought directly from Elsevier's Rights Department in Oxford, UK: phone (+44) 1865 843830, fax
(+44) 1865 853333, e-mail: [email protected]. Requests may also be completed on-line via the Elsevier
homepage (http://www.elsevier.com/locate/permissions).
In the USA, users may clear permissions and make payments through the Copyright Clearance Center, Inc., 222
Rosewood Drive, Danvers, MA 01923, USA; phone: (+1) (978) 7508400, fax: (+1) (978) 7504744, and in the UK
through the Copyright Licensing Agency Rapid Clearance Service (CLARCS), 90 Tottenham Court Road, London W1P
0LP, UK; phone: (+44) 20 7631 5555; fax: (+44) 20 7631 5500. Other countries may have a local reprographic rights
agency for payments.
Derivative Works
Tables of contents may be reproduced for internal circulation, but permission of the Publisher is required for external
resale or distribution of such material. Permission of the Publisher is required for all other derivative works, including
compilations and translations.
Electronic Storage or Usage
Permission of the Publisher is required to store or use electronically any material contained in this work, including any
chapter or part of a chapter.
Except as outlined above, no part of this work may be reproduced, stored in a retrieval system or transmitted in any
form or by any means, electronic, mechanical, photocopying, recording or otherwise, without prior written permission
of the Publisher.
Address permissions requests to: Elsevier's Rights Department, at the fax and e-mail addresses noted above.
Notice
No responsibility is assumed by the Publisher for any injury and/or damage to persons or property as a matter of products
liability, negligence or otherwise, or from any use or operation of any methods, products, instructions or ideas contained
in the material herein. Because of rapid advances in the medical sciences, in particular, independent verification of
diagnoses and drug dosages should be made.
First edition 2005
ISBN-10: 0 444 52053 8
ISSN: 0376-7361 (Series)
The paper used in this publication meets the requirements of ANSI/NISO Z39.48-1992 (Permanence of Paper).
Printed in The Netherlands.
ISBN-13: 978-0-444-52053-1
iv

DEDICATION
This Book is dedicated to
His Highness Sheikh Hamad Bin Khalifa Al Thani
The Emir of the State of Qatar
And
Her Highness Sheikha Mozah Bint Nasser Al Missned
For their global vision and dedication to democratic reform,
education, and
valiant efforts in promoting peace in the region
v

This page intentionally left blank
vi

FOREWORD
The geology and geochemistry of petroleum are becoming ever more important as
the demand for fossil fuels increases worldwide. We must find new hydrocarbon
reserves that are hidden in almost inaccessible areas. Our knowledge of petroleum
geology and geochemistry is the best intellectual tool that we have for the never-
ending search for rich new deposits of hydrocarbons. The geology of the rocks under
deep oceans and on continental shelves has become much more important as
advances in technology permit drilling in these areas. Developments in petroleum
geology and geochemistry, and advances in seismic and well-logging measurements,
provide a better understanding of the evolution of subsurface sedimentary deposits
and the migration, entrapment, and production of hydrocarbons.
This book touches upon the great strides that are being made through electronic
innovations in instrumental measurements of geologic and geochemical systems. The
structure of the book is actually a balance of four topical sections. The fundamental
aspects of petroleum geology, geochemistry, and accumulation, evaluation, and
production of subsurface fluids are discussed in the first three sections followed by
the fourth section on mathematical modeling of geologic systems.
Chapters 1–3 introduce a systematic approach to understanding sedimentary
rocks and their role in the evolution and containment of subsurface fluids. This is
discussed in relation to the physical conditions of hydrocarbon reserves (e.g., at very
high temperatures and pressures).
Chapters 4–6 discuss the physical and chemical properties of subsurface waters,
crude oils and natural gases. The physical and chemical properties are especially
important to production engineering and mathematical simulation because they
impact the relative motions of fluids as saturation changes during production: (1)
wettability of rocks affects production characteristics and ultimate recovery; (2)
relative permeability affects fluid movement to the production wells; (3) density
differences between immiscible fluids affect gravity drainage from one part of the
reservoir to another as the reservoir fluids are depleted; (4) viscosity of fluids affects
the relative mobility of each fluid; and (5) fluid chemistry affects the absorption,
ultimate recovery and monetary value of the produced hydrocarbons.
Chapters 7–10 discuss the formation and accumulation of crude oils and natural
gases: (1) changes in the chemical composition of hydrocarbons that originate from
the debris of living plants to form crude oils; (2) the origins of hydrocarbons in
different areas of a single reservoir; also, the conditions which determine the
distribution of water, oil, and gas in the reservoir; (3) migration of subsurface fluids
until they eventually accumulate in isolated geologic traps; and (4) a discussion of the
oil traps as a function of sedimentary geology.
vii

Chapter 11 explains the analytical and statistical approaches to modern
mathematical modeling of both static and dynamic geologic systems. Modeling of
static systems (i.e., simulation of the structure and composition of geologic systems) is
done regardless of time to develop a basis for geologic exploration and hydrocarbon
reserve estimation, whereas dynamic models capture any changes taking place with
respect to time for use in studying production and field development.
This book is recommended to the geologists, geochemists, petroleum engineers,
and graduate university students studying petroleum geology, engineering, and
geochemistry.
E.C. Donaldson
Managing Editor of Journal of
Petroleum Science and Engineering
Wynnewood, Oklahoma
FOREWORDviii
PREFACE
The progress in the oil and gas industry is related closely to the acceleration of
discovery rates, exploration, development, and production of hydrocarbon resourc-
es. Exploration, development, and production of hydrocarbon resources must be
based on reliable information, which helps to predict subsurface conditions and
properties of oil- and gas-bearing formations.
Main oil and gas reserves are found in sedimentary basins composed of ter-
rigenous (siliciclastic), carbonate, and, sometimes, volcanic or volcaniclastic rocks.
Preservation of high reservoir pressure and good properties of reservoir rocks and
seals (caprocks) in these basins depends greatly on their origin and further evolution.
The process of sedimentation, and the following processes of diagenesis (i.e., phys-
ical, chemical and biochemical processes, which occur in the sediments after sed-
imentation and through lithification at near-surface temperature and pressure) and
catagenesis (or epigenesis) (i.e., physical and chemical processes, which occur in the
sedimentary rocks at high temperatures and pressures after lithification and up to
metamorphism), cause alterations, which may enable one to predict oil and gas
potential.
Considering an interest demonstrated by petroleum geologists and reservoir en-
gineers, this book discusses the major theoretical and practical problems of petro-
leum geology and geochemistry as they are viewed at the end of the 20th century and
the beginning of the 21st century. The treatment of the material is non-uniform in
the sense that the accepted scientific concepts are treated cursorily, just to maintain
the completeness and continuity of the story, whereas the disputable and innovative
issues are handled in more detail. The discussion is conducted from a position of
the science of petroleum geology, geochemistry, and other related disciplines. For
instance, in describing oil-bearing sequences, the main brunt is on depositional
environments and such features as reservoir and fluid-sealing properties.
A considerable attention is devoted to the transformations within the rock–
water–organic matter system of the Earth’s crust with changes in the subsurface
temperature and pressure. New reservoir and accumulation types are identified and
their exploration/development features are defined.
A variety of common reservoir engineering problems can be solved during field
development and production by the integration of geological, geochemical, and en-
gineering studies. For example, such studies can identify reservoir compartment-
alization, allocate commingled production, identify completion problems (such as
tubing leaks or poor casing cementing jobs), predict fluid properties (viscosity, den-
sity) prior to production tests, characterize induced fracture geometry, monitor the
waterflood process and water encroachment, or explain the causes of produced sludge.
ix

Discussions in this book are based on the systems approach to the specific ge-
ologic systems. Along with this approach, mathematical modeling of the static and
dynamic geologic systems is described as well. The use of mathematical methods and
computer techniques increases the scope of problems that can be solved on the basis
of integrated geological, geophysical, geochemical and engineering information.
Mathematical methods using computer processing of the current information ac-
celerate the process of regional and local prediction of oil and gas potential that, in
general, increases the economical and geologic efficiency of exploration, develop-
ment, and production of oil and gas.
George V. Chilingar, Leonid A. Buryakovsky
PREFACEx

NOMENCLATURE
Ada diffusion–adsorption factor
At absolute geological age
B ‘‘benzine’’ (gasoline) content
Bel bulk volume elasticity
Bf fracture spacing
C classification
Ccarb carbonate cement content
Ccl clay cement content
D depth
d water density at 3.981C
d diameter
dw wellbore diameter
dact actual wellbore diameter
dnom nominal wellbore diameter
dch pore-channel diameter
dp,ave average pore diameter
dp,Me median pore diameter
E expectancy
F formation resistivity factor
Fp,t formation resistivity factor at reservoir conditions
F 0 resistivity index
F 0p,t resistivity index at reservoir conditions
G geothermal gradient
Go oil pressure gradient in reservoir
Gw initial water pressure gradient in seal
DG Gibbs free-energy difference
H entropy of information
Hmax maximum entropy
Hr relative entropy
H0 zero hypothesis
h thickness
heff effective (net) thickness
hsh shale thickness
Dhseal seal thickness
Dh accumulation column
I quantity of information
DI g relative GR factor
xi
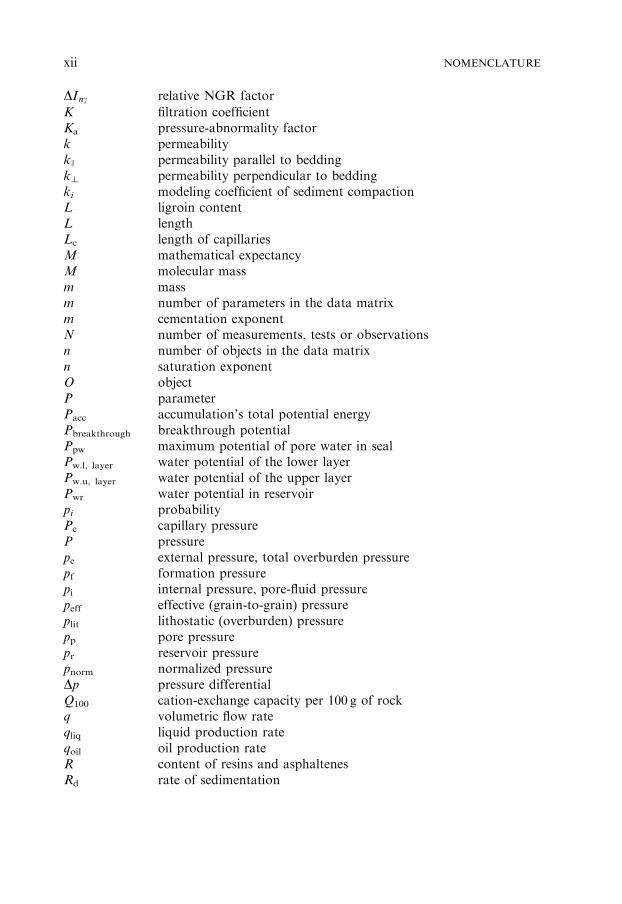
DIng relative NGR factor
K filtration coefficient
Ka pressure-abnormality factor
k permeability
kJ permeability parallel to bedding
k? permeability perpendicular to bedding
ki modeling coefficient of sediment compaction
L ligroin content
L length
Lc length of capillaries
M mathematical expectancy
M molecular mass
m mass
m number of parameters in the data matrix
m cementation exponent
N number of measurements, tests or observations
n number of objects in the data matrix
n saturation exponent
O object
P parameter
Pacc accumulation’s total potential energy
Pbreakthrough breakthrough potential
Ppw maximum potential of pore water in seal
Pw.l, layer water potential of the lower layer
Pw.u, layer water potential of the upper layer
Pwr water potential in reservoir
pi probability
Pc capillary pressure
P pressure
pe external pressure, total overburden pressure
pf formation pressure
pi internal pressure, pore-fluid pressure
peff effective (grain-to-grain) pressure
plit lithostatic (overburden) pressure
pp pore pressure
pr reservoir pressure
pnorm normalized pressure
Dp pressure differential
Q100 cation-exchange capacity per 100 g of rock
q volumetric flow rate
qliq liquid production rate
qoil oil production rate
R content of resins and asphaltenes
Rd rate of sedimentation
NOMENCLATURExii

R(z) vertical water density change
R electric resistivity
Ra apparent resistivity
Ra(AO) apparent resistivity from lateral sonde of AO size
Rcr cut-off (critical) resistivity of oil-saturated reservoir
Rg,r resistivity of gas-saturated reservoir
Roil oil resistivity
Ro,r resistivity of oil-saturated reservoir
Rsh shale resistivity
Rt true resistivity of rock
Rt,min minimum true resistivity
Rw water resistivity
Ro resistivity of water-saturated reservoir
Rm drilling-mud resistivity
Rmf mud-filtrate resistivity
RIL resistivity from induction log
r correlation coefficient
r radius
rc radius of capillaries
So oil saturation
So/g oil/gas saturation
So,r residual oil saturation
Sw water saturation
Sw,r residual water saturation
Scarb homogeneity of carbonates
Ssort sorting factor
Ssh sorting of shales
Sss sorting of sandstones
sb specific surface area of pore space per unit of bulk volume
sg specific surface area of pore space per unit of grain volume
sp specific surface area of pore space per unit of pore volume
shf shape factor for pores
SG specific gravity
T temperature
DT interval transit time
t time
ta probability index at confidence level a
U relative change in volume of sediments
DUSP relative SP factor
V volume
Vc volume of capillaries
VAHFP rate of AHFP formation
Velast rate of creation of elastic stress
Vrelax rate of stress relaxation
NOMENCLATURE xiii

Vs seismic velocity
v specific volume
vl variation of anisotropy
vR variation of resistivity
zo altitude of comparison surface with equal normalized pressure
a level of significance (confidence level)
aSP SP reduction factor
b modulus of elasticity
bc irreversible compaction factor (compressibility factor)
g density
go oil density
gw water density
Zcl relative clay content in rock
Zp pore-pressure gradient
Zsh pore-pressure gradient in shales
Zr formation-pressure gradient in reservoir rocks
l anisotropy coefficient
m dynamic viscosity
n kinematic viscosity
s stress; tension
s standard deviation, or mean square error
sR standard deviation of resistivity
sr standard deviation of correlation coefficient
t electrical tortuosity of pore channels
tw thickness of pore-water film
f porosity
f0 ‘‘residual’’ porosity
feff effective porosity
fsh shale porosity
wsh relative content of argillaceous (shale) beds
o frequency or probability
So cumulative frequency or cumulative probability
S macroscopic cross-section of thermal neutron capture (absorption)
NOMENCLATURExiv
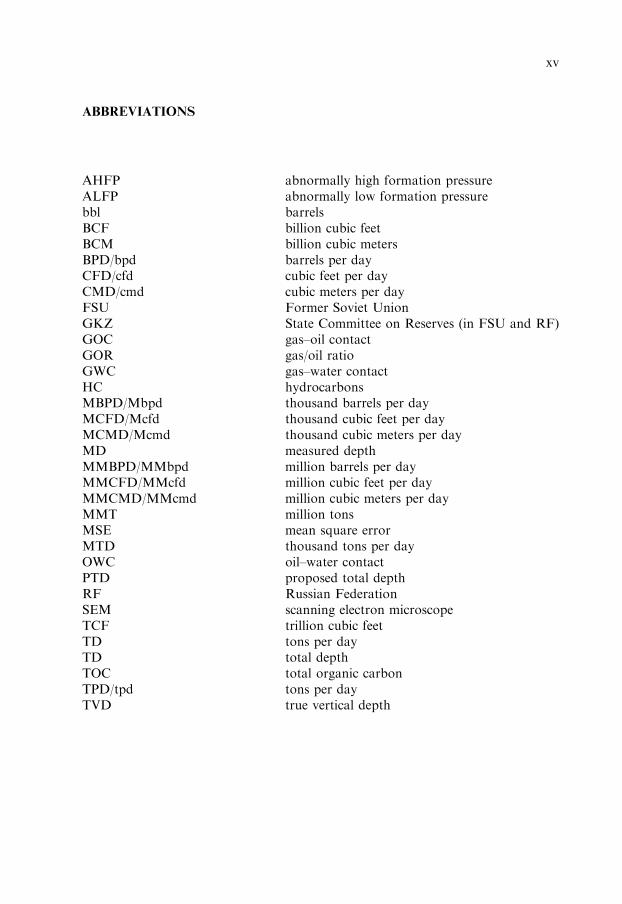
ABBREVIATIONS
AHFP abnormally high formation pressure
ALFP abnormally low formation pressure
bbl barrels
BCF billion cubic feet
BCM billion cubic meters
BPD/bpd barrels per day
CFD/cfd cubic feet per day
CMD/cmd cubic meters per day
FSU Former Soviet Union
GKZ State Committee on Reserves (in FSU and RF)
GOC gas–oil contact
GOR gas/oil ratio
GWC gas–water contact
HC hydrocarbons
MBPD/Mbpd thousand barrels per day
MCFD/Mcfd thousand cubic feet per day
MCMD/Mcmd thousand cubic meters per day
MD measured depth
MMBPD/MMbpd million barrels per day
MMCFD/MMcfd million cubic feet per day
MMCMD/MMcmd million cubic meters per day
MMT million tons
MSE mean square error
MTD thousand tons per day
OWC oil–water contact
PTD proposed total depth
RF Russian Federation
SEM scanning electron microscope
TCF trillion cubic feet
TD tons per day
TD total depth
TOC total organic carbon
TPD/tpd tons per day
TVD true vertical depth
xv

This page intentionally left blank
xvi
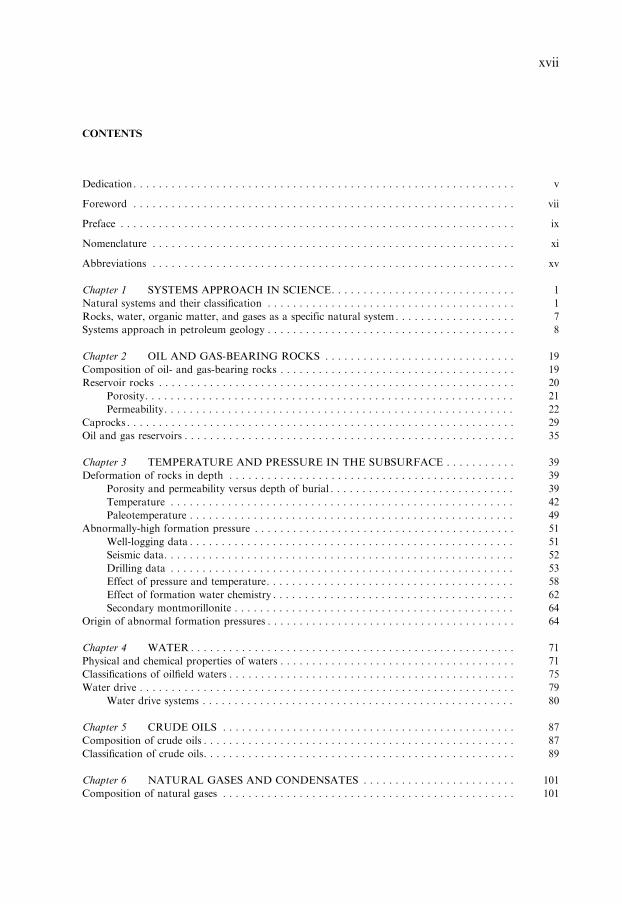
CONTENTS
Dedication. . . . . . . . . . . . . . . . . . . . . . . . . . . . . . . . . . . . . . . . . . . . . . . . . . . . . . . . . . . . v
Foreword . . . . . . . . . . . . . . . . . . . . . . . . . . . . . . . . . . . . . . . . . . . . . . . . . . . . . . . . . . . . vii
Preface . . . . . . . . . . . . . . . . . . . . . . . . . . . . . . . . . . . . . . . . . . . . . . . . . . . . . . . . . . . . . . ix
Nomenclature . . . . . . . . . . . . . . . . . . . . . . . . . . . . . . . . . . . . . . . . . . . . . . . . . . . . . . . . . xi
Abbreviations . . . . . . . . . . . . . . . . . . . . . . . . . . . . . . . . . . . . . . . . . . . . . . . . . . . . . . . . . xv
Chapter 1 SYSTEMS APPROACH IN SCIENCE. . . . . . . . . . . . . . . . . . . . . . . . . . . . . 1
Natural systems and their classification . . . . . . . . . . . . . . . . . . . . . . . . . . . . . . . . . . . . . . . 1
Rocks, water, organic matter, and gases as a specific natural system. . . . . . . . . . . . . . . . . . . 7
Systems approach in petroleum geology . . . . . . . . . . . . . . . . . . . . . . . . . . . . . . . . . . . . . . . 8
Chapter 2 OIL AND GAS-BEARING ROCKS . . . . . . . . . . . . . . . . . . . . . . . . . . . . . . 19
Composition of oil- and gas-bearing rocks . . . . . . . . . . . . . . . . . . . . . . . . . . . . . . . . . . . . . 19
Reservoir rocks . . . . . . . . . . . . . . . . . . . . . . . . . . . . . . . . . . . . . . . . . . . . . . . . . . . . . . . . 20
Porosity. . . . . . . . . . . . . . . . . . . . . . . . . . . . . . . . . . . . . . . . . . . . . . . . . . . . . . . . . . 21
Permeability. . . . . . . . . . . . . . . . . . . . . . . . . . . . . . . . . . . . . . . . . . . . . . . . . . . . . . . 22
Caprocks . . . . . . . . . . . . . . . . . . . . . . . . . . . . . . . . . . . . . . . . . . . . . . . . . . . . . . . . . . . . . 29
Oil and gas reservoirs . . . . . . . . . . . . . . . . . . . . . . . . . . . . . . . . . . . . . . . . . . . . . . . . . . . . 35
Chapter 3 TEMPERATURE AND PRESSURE IN THE SUBSURFACE . . . . . . . . . . . 39
Deformation of rocks in depth . . . . . . . . . . . . . . . . . . . . . . . . . . . . . . . . . . . . . . . . . . . . . 39
Porosity and permeability versus depth of burial . . . . . . . . . . . . . . . . . . . . . . . . . . . . . 39
Temperature . . . . . . . . . . . . . . . . . . . . . . . . . . . . . . . . . . . . . . . . . . . . . . . . . . . . . . 42
Paleotemperature . . . . . . . . . . . . . . . . . . . . . . . . . . . . . . . . . . . . . . . . . . . . . . . . . . . 49
Abnormally-high formation pressure . . . . . . . . . . . . . . . . . . . . . . . . . . . . . . . . . . . . . . . . . 51
Well-logging data . . . . . . . . . . . . . . . . . . . . . . . . . . . . . . . . . . . . . . . . . . . . . . . . . . . 51
Seismic data. . . . . . . . . . . . . . . . . . . . . . . . . . . . . . . . . . . . . . . . . . . . . . . . . . . . . . . 52
Drilling data . . . . . . . . . . . . . . . . . . . . . . . . . . . . . . . . . . . . . . . . . . . . . . . . . . . . . . 53
Effect of pressure and temperature. . . . . . . . . . . . . . . . . . . . . . . . . . . . . . . . . . . . . . . 58
Effect of formation water chemistry . . . . . . . . . . . . . . . . . . . . . . . . . . . . . . . . . . . . . . 62
Secondary montmorillonite . . . . . . . . . . . . . . . . . . . . . . . . . . . . . . . . . . . . . . . . . . . . 64
Origin of abnormal formation pressures . . . . . . . . . . . . . . . . . . . . . . . . . . . . . . . . . . . . . . . 64
Chapter 4 WATER . . . . . . . . . . . . . . . . . . . . . . . . . . . . . . . . . . . . . . . . . . . . . . . . . . . 71
Physical and chemical properties of waters . . . . . . . . . . . . . . . . . . . . . . . . . . . . . . . . . . . . . 71
Classifications of oilfield waters . . . . . . . . . . . . . . . . . . . . . . . . . . . . . . . . . . . . . . . . . . . . . 75
Water drive . . . . . . . . . . . . . . . . . . . . . . . . . . . . . . . . . . . . . . . . . . . . . . . . . . . . . . . . . . . 79
Water drive systems . . . . . . . . . . . . . . . . . . . . . . . . . . . . . . . . . . . . . . . . . . . . . . . . . 80
Chapter 5 CRUDE OILS . . . . . . . . . . . . . . . . . . . . . . . . . . . . . . . . . . . . . . . . . . . . . . 87
Composition of crude oils . . . . . . . . . . . . . . . . . . . . . . . . . . . . . . . . . . . . . . . . . . . . . . . . . 87
Classification of crude oils. . . . . . . . . . . . . . . . . . . . . . . . . . . . . . . . . . . . . . . . . . . . . . . . . 89
Chapter 6 NATURAL GASES AND CONDENSATES . . . . . . . . . . . . . . . . . . . . . . . . 101
Composition of natural gases . . . . . . . . . . . . . . . . . . . . . . . . . . . . . . . . . . . . . . . . . . . . . . 101
xvii
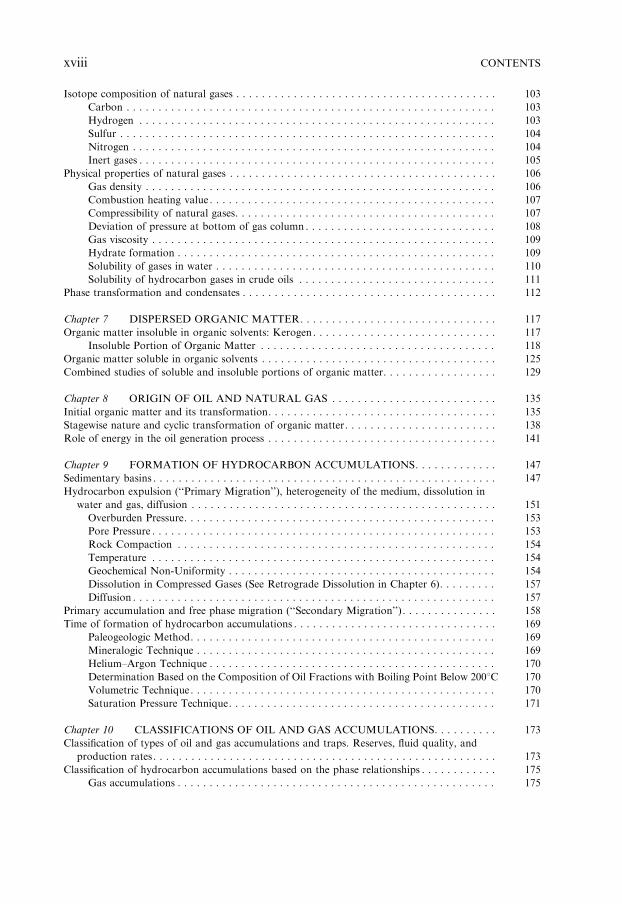
Isotope composition of natural gases . . . . . . . . . . . . . . . . . . . . . . . . . . . . . . . . . . . . . . . . . 103
Carbon . . . . . . . . . . . . . . . . . . . . . . . . . . . . . . . . . . . . . . . . . . . . . . . . . . . . . . . . . . 103
Hydrogen . . . . . . . . . . . . . . . . . . . . . . . . . . . . . . . . . . . . . . . . . . . . . . . . . . . . . . . . 103
Sulfur . . . . . . . . . . . . . . . . . . . . . . . . . . . . . . . . . . . . . . . . . . . . . . . . . . . . . . . . . . . 104
Nitrogen . . . . . . . . . . . . . . . . . . . . . . . . . . . . . . . . . . . . . . . . . . . . . . . . . . . . . . . . . 104
Inert gases . . . . . . . . . . . . . . . . . . . . . . . . . . . . . . . . . . . . . . . . . . . . . . . . . . . . . . . . 105
Physical properties of natural gases . . . . . . . . . . . . . . . . . . . . . . . . . . . . . . . . . . . . . . . . . . 106
Gas density . . . . . . . . . . . . . . . . . . . . . . . . . . . . . . . . . . . . . . . . . . . . . . . . . . . . . . . 106
Combustion heating value . . . . . . . . . . . . . . . . . . . . . . . . . . . . . . . . . . . . . . . . . . . . . 107
Compressibility of natural gases. . . . . . . . . . . . . . . . . . . . . . . . . . . . . . . . . . . . . . . . . 107
Deviation of pressure at bottom of gas column . . . . . . . . . . . . . . . . . . . . . . . . . . . . . . 108
Gas viscosity . . . . . . . . . . . . . . . . . . . . . . . . . . . . . . . . . . . . . . . . . . . . . . . . . . . . . . 109
Hydrate formation . . . . . . . . . . . . . . . . . . . . . . . . . . . . . . . . . . . . . . . . . . . . . . . . . . 109
Solubility of gases in water . . . . . . . . . . . . . . . . . . . . . . . . . . . . . . . . . . . . . . . . . . . . 110
Solubility of hydrocarbon gases in crude oils . . . . . . . . . . . . . . . . . . . . . . . . . . . . . . . 111
Phase transformation and condensates . . . . . . . . . . . . . . . . . . . . . . . . . . . . . . . . . . . . . . . . 112
Chapter 7 DISPERSED ORGANIC MATTER. . . . . . . . . . . . . . . . . . . . . . . . . . . . . . . 117
Organic matter insoluble in organic solvents: Kerogen. . . . . . . . . . . . . . . . . . . . . . . . . . . . . 117
Insoluble Portion of Organic Matter . . . . . . . . . . . . . . . . . . . . . . . . . . . . . . . . . . . . . 118
Organic matter soluble in organic solvents . . . . . . . . . . . . . . . . . . . . . . . . . . . . . . . . . . . . . 125
Combined studies of soluble and insoluble portions of organic matter. . . . . . . . . . . . . . . . . . 129
Chapter 8 ORIGIN OF OIL AND NATURAL GAS . . . . . . . . . . . . . . . . . . . . . . . . . . 135
Initial organic matter and its transformation. . . . . . . . . . . . . . . . . . . . . . . . . . . . . . . . . . . . 135
Stagewise nature and cyclic transformation of organic matter. . . . . . . . . . . . . . . . . . . . . . . . 138
Role of energy in the oil generation process . . . . . . . . . . . . . . . . . . . . . . . . . . . . . . . . . . . . 141
Chapter 9 FORMATION OF HYDROCARBON ACCUMULATIONS. . . . . . . . . . . . . 147
Sedimentary basins . . . . . . . . . . . . . . . . . . . . . . . . . . . . . . . . . . . . . . . . . . . . . . . . . . . . . . 147
Hydrocarbon expulsion (‘‘Primary Migration’’), heterogeneity of the medium, dissolution in
water and gas, diffusion . . . . . . . . . . . . . . . . . . . . . . . . . . . . . . . . . . . . . . . . . . . . . . . . 151
Overburden Pressure. . . . . . . . . . . . . . . . . . . . . . . . . . . . . . . . . . . . . . . . . . . . . . . . . 153
Pore Pressure . . . . . . . . . . . . . . . . . . . . . . . . . . . . . . . . . . . . . . . . . . . . . . . . . . . . . . 153
Rock Compaction . . . . . . . . . . . . . . . . . . . . . . . . . . . . . . . . . . . . . . . . . . . . . . . . . . 154
Temperature . . . . . . . . . . . . . . . . . . . . . . . . . . . . . . . . . . . . . . . . . . . . . . . . . . . . . . 154
Geochemical Non-Uniformity . . . . . . . . . . . . . . . . . . . . . . . . . . . . . . . . . . . . . . . . . . 154
Dissolution in Compressed Gases (See Retrograde Dissolution in Chapter 6). . . . . . . . . 157
Diffusion . . . . . . . . . . . . . . . . . . . . . . . . . . . . . . . . . . . . . . . . . . . . . . . . . . . . . . . . . 157
Primary accumulation and free phase migration (‘‘Secondary Migration’’) . . . . . . . . . . . . . . . 158
Time of formation of hydrocarbon accumulations . . . . . . . . . . . . . . . . . . . . . . . . . . . . . . . . 169
Paleogeologic Method. . . . . . . . . . . . . . . . . . . . . . . . . . . . . . . . . . . . . . . . . . . . . . . . 169
Mineralogic Technique . . . . . . . . . . . . . . . . . . . . . . . . . . . . . . . . . . . . . . . . . . . . . . . 169
Helium–Argon Technique . . . . . . . . . . . . . . . . . . . . . . . . . . . . . . . . . . . . . . . . . . . . . 170
Determination Based on the Composition of Oil Fractions with Boiling Point Below 2001C 170
Volumetric Technique. . . . . . . . . . . . . . . . . . . . . . . . . . . . . . . . . . . . . . . . . . . . . . . . 170
Saturation Pressure Technique. . . . . . . . . . . . . . . . . . . . . . . . . . . . . . . . . . . . . . . . . . 171
Chapter 10 CLASSIFICATIONS OF OIL AND GAS ACCUMULATIONS. . . . . . . . . . 173
Classification of types of oil and gas accumulations and traps. Reserves, fluid quality, and
production rates. . . . . . . . . . . . . . . . . . . . . . . . . . . . . . . . . . . . . . . . . . . . . . . . . . . . . . 173
Classification of hydrocarbon accumulations based on the phase relationships . . . . . . . . . . . . 175
Gas accumulations . . . . . . . . . . . . . . . . . . . . . . . . . . . . . . . . . . . . . . . . . . . . . . . . . . 175
CONTENTSxviii

Oil accumulations. . . . . . . . . . . . . . . . . . . . . . . . . . . . . . . . . . . . . . . . . . . . . . . . . . . 177
Classification of oil and gas reservoirs based on drive mechanism . . . . . . . . . . . . . . . . . . . . . 183
Solution gas drive. . . . . . . . . . . . . . . . . . . . . . . . . . . . . . . . . . . . . . . . . . . . . . . . . . . 184
Gas-cap drive. . . . . . . . . . . . . . . . . . . . . . . . . . . . . . . . . . . . . . . . . . . . . . . . . . . . . . 187
Water drive . . . . . . . . . . . . . . . . . . . . . . . . . . . . . . . . . . . . . . . . . . . . . . . . . . . . . . . 188
Gravity drainage . . . . . . . . . . . . . . . . . . . . . . . . . . . . . . . . . . . . . . . . . . . . . . . . . . . 191
Combination-drive reservoirs. . . . . . . . . . . . . . . . . . . . . . . . . . . . . . . . . . . . . . . . . . . 191
Open combination-drive reservoirs . . . . . . . . . . . . . . . . . . . . . . . . . . . . . . . . . . . . . . . 191
Closed combination-drive reservoirs . . . . . . . . . . . . . . . . . . . . . . . . . . . . . . . . . . . . . . 193
Classification of hydrocarbon accumulations based on the type of traps . . . . . . . . . . . . . . . . 194
Vertical zonation of hydrocarbon accumulations . . . . . . . . . . . . . . . . . . . . . . . . . . . . . . . . . 198
Chapter 11 MATHEMATICAL MODELING IN PETROLEUM GEOLOGY . . . . . . . . 205
Principles of mathematical modeling of geologic systems . . . . . . . . . . . . . . . . . . . . . . . . . . . 205
Models of static geologic systems. . . . . . . . . . . . . . . . . . . . . . . . . . . . . . . . . . . . . . . . . . . . 209
Analytical approach . . . . . . . . . . . . . . . . . . . . . . . . . . . . . . . . . . . . . . . . . . . . . . . . . 210
Entropy of geologic systems . . . . . . . . . . . . . . . . . . . . . . . . . . . . . . . . . . . . . . . . . 210
Anisotropy of sedimentary rocks . . . . . . . . . . . . . . . . . . . . . . . . . . . . . . . . . . . . . . 215
Petrophysical relationships . . . . . . . . . . . . . . . . . . . . . . . . . . . . . . . . . . . . . . . . . . 217
Statistical approach . . . . . . . . . . . . . . . . . . . . . . . . . . . . . . . . . . . . . . . . . . . . . . . . . 221
One-dimensional models . . . . . . . . . . . . . . . . . . . . . . . . . . . . . . . . . . . . . . . . . . . . 221
Rock properties . . . . . . . . . . . . . . . . . . . . . . . . . . . . . . . . . . . . . . . . . . . . . . . 221
Crude oil properties . . . . . . . . . . . . . . . . . . . . . . . . . . . . . . . . . . . . . . . . . . . . 225
Two-dimensional models. . . . . . . . . . . . . . . . . . . . . . . . . . . . . . . . . . . . . . . . . . . . 227
Reservoir rocks . . . . . . . . . . . . . . . . . . . . . . . . . . . . . . . . . . . . . . . . . . . . . . . 227
Crude oil . . . . . . . . . . . . . . . . . . . . . . . . . . . . . . . . . . . . . . . . . . . . . . . . . . . . 230
Natural gas . . . . . . . . . . . . . . . . . . . . . . . . . . . . . . . . . . . . . . . . . . . . . . . . . . 236
Formation water . . . . . . . . . . . . . . . . . . . . . . . . . . . . . . . . . . . . . . . . . . . . . . 237
Multidimensional models . . . . . . . . . . . . . . . . . . . . . . . . . . . . . . . . . . . . . . . . . . . 240
Reservoir rocks . . . . . . . . . . . . . . . . . . . . . . . . . . . . . . . . . . . . . . . . . . . . . . . 240
Crude oil . . . . . . . . . . . . . . . . . . . . . . . . . . . . . . . . . . . . . . . . . . . . . . . . . . . . 241
Models of dynamic geologic systems . . . . . . . . . . . . . . . . . . . . . . . . . . . . . . . . . . . . . . . . . 249
Analytical approach . . . . . . . . . . . . . . . . . . . . . . . . . . . . . . . . . . . . . . . . . . . . . . . . . 250
Statistical approach . . . . . . . . . . . . . . . . . . . . . . . . . . . . . . . . . . . . . . . . . . . . . . . . . 251
Combination of analytical and statistical approaches . . . . . . . . . . . . . . . . . . . . . . . . . . 256
Sediment compaction . . . . . . . . . . . . . . . . . . . . . . . . . . . . . . . . . . . . . . . . . . . . . . 256
Simulation of rock properties . . . . . . . . . . . . . . . . . . . . . . . . . . . . . . . . . . . . . . . . 257
Prediction of rock properties . . . . . . . . . . . . . . . . . . . . . . . . . . . . . . . . . . . . . . . . . 265
Prediction of hydrocarbon reserves . . . . . . . . . . . . . . . . . . . . . . . . . . . . . . . . . . . . 265
Evolution of pore-fluid (formation) pressure . . . . . . . . . . . . . . . . . . . . . . . . . . . . . . 270
Simulation of oil/water mobility . . . . . . . . . . . . . . . . . . . . . . . . . . . . . . . . . . . . . . 271
Algorithm of accelerated exploration for hydrocarbon accumulations . . . . . . . . . . . . . . . . . . 273
Concluding remarks . . . . . . . . . . . . . . . . . . . . . . . . . . . . . . . . . . . . . . . . . . . . . . . . . . . . . 273
Appendix A (Wettability and Capillarity) . . . . . . . . . . . . . . . . . . . . . . . . . . . . . . . . . . . . . . 275
Appendix B (Permeability) . . . . . . . . . . . . . . . . . . . . . . . . . . . . . . . . . . . . . . . . . . . . . . . . 289
Appendix C (Glossary) . . . . . . . . . . . . . . . . . . . . . . . . . . . . . . . . . . . . . . . . . . . . . . . . . . . 295
References and Bibliography . . . . . . . . . . . . . . . . . . . . . . . . . . . . . . . . . . . . . . . . . . . . . . . 345
Index . . . . . . . . . . . . . . . . . . . . . . . . . . . . . . . . . . . . . . . . . . . . . . . . . . . . . . . . . . . . . . . 361
CONTENTS xix

This page intentionally left blank
xx

Chapter 1
SYSTEMS APPROACH IN SCIENCE
1.1. NATURAL SYSTEMS AND THEIR CLASSIFICATION
Despite political, economical, and military crises, oil and natural gas usage in the
world is growing. Ecological problems are becoming more serious. Any concerns
about the future cannot undermine humankind’s drive to the technical progress
provided by using oil and natural gas. The environmentalists are preventing the
construction of nuclear power generating plants, and the alternative sources of en-
ergy, probably will not satisfy more than 15–20% of the world energy demand. Thus,
the demand for oil and natural gas will grow.
Usually such a statement is accompanied by another statement on the limited
amount of these mineral resources. This should be clarified. From the viewpoint of
inorganic origin of hydrocarbons, the process of hydrocarbon accumulation is con-
tinuing. A possible resource replacement due to inorganic synthesis, however, has
not been discussed here, because most scientists reject the possibility of hydrocarbon
accumulation via this process. Some proponents of the organic theory (Weber et al.,
1966; Miller, 1991; Hunt, 1979) believe that hydrocarbons could have formed in
Pleistocene and Quaternary sediments. Hunt (1979) stated that inasmuch as about
9% of hydrocarbons entered the sediments directly from the living organisms; they
may have originated hydrocarbon accumulations in the Quaternary. Such amounts
of resources cannot be disregarded.
In addition to the irreplaceability, or rather a very low replaceability, of the
hydrocarbon resources it is also very difficult to discover new ones. Most of the
‘‘easy’’ accumulations (shallower than 4000m and associated with the most common
anticlinal traps in mature basins) have been already discovered. Discovery of ac-
cumulations associated with non-conventional traps and those present at great
depths and in the offshore basins required non-conventional exploration techniques.
This resulted in an accelerated development of geophysical (mainly seismic), geo-
chemical and, even, space exploration techniques.
Technology of exploratory drilling was simultaneously progressing: (1) the drill-
ing penetration rate increased, (2) core and fluid sampling techniques became avail-
able without interrupting the drilling process, (3) logging and measuring-while-
drilling methods were developed, and (4) horizontal drilling in the productive res-
ervoirs became a reality. The time has come to reconsider the old theoretical con-
cepts in view of the progress achieved in allied scientific disciplines (physics,
chemistry, geochemistry, geotectonics, lithology, geomathematics, etc.). The basis
for this reconsideration is the systems approach.
Intuitive systems approach was introduced in natural sciences by two prominent
biologists and philosophers: Jean Baptiste Lamarck (1744 –1829), in the book en-
titled Zoological Philosophy (1809), and Charles Darwin (1809 –1882), in the book
1
entitled The Origin of Species by Means of Natural Selection, or the Preservation of
Favored Races in the Struggle for Life (1859). Intuitive approach, however, is sub-
jective. Objective description of this phenomena could only be achieved through the
development of scientific methodologies.
The foundation of objective approach was developed by English politician, phi-
losopher, and essayist Francis Bacon (1561–1626), and French mathematician, sci-
entist, and philosopher Rene Descartes (1596 –1650). The former, in his most
important philosophical work entitled Instauratio Magna (1620), redefined the task
of natural science, seeing it as a means of empirical discovery and a method of
increasing human power over nature, and maintained that only a sound method
results is a true knowledge. The latter, in his books entitled Meditation on First
Philosophy (1641), Discourse on Method (1637), and Principles of Philosophy (1644),
ignored accepted scholastic philosophy and stated that the person should doubt all
sense experiences and that only the axioms or postulates that are beyond any doubt
may be used as a basis for scientific logical constructions. Both concepts are still
unshakable and were used for the development of a systems (system-structural)
approach in science.
As Dmitriyevskiy correctly noted, ‘‘systemity is a general pattern in the structure
of material universe’’ (1993, p. 2). At the same time, even the perfect study meth-
odology does not guarantee the true knowledge. A lot depends on (1) the reliability
of empirical base, (2) the availability of sufficiently differentiated and in-depth the-
oretical apparatus, (3) the scientist’s qualifications, and (4) materialistically under-
stood factors, such as intuition and creative imagination (Lopatin, 1983, p. 22).
There are numerous definitions of a ‘‘system’’. All of them, however, are vague.
For example, according to one of the definitions: ‘‘The system is a set of interacting
elements’’ (Afanasyev, 1973, p. 39), or a clearer definition: ‘‘The system is a complex
of interconnected elements that form some integrity’’ (Gvishiani, 1980). Vagueness
here is hidden in ‘‘a complex of interconnected elements’’ and in ‘‘some integrity’’.
The following questions arise: Which elements and how are they interconnected? Are
the elements uniform, variable in size, or heterogeneous? What type of connections:
physical or logical? What kind of integrity: logical, mechanical, energetic, or their
absence?
We understand that it is easier to criticize than to create. Thus, let us develop a
definition of ‘‘geologic system’’ best suited for studying theoretical problems of
petroleum geology.
It may be stated that the geologic system is an aggregate of interrelated natural
elements of lithosphere that form an integral whole, with specific properties changing
with time. This definition is similar to the definition given by Buryakovsky et al.
(1990): ‘‘Interrelated elements are involved in the naturally occurring processes
eventually resulting in profound changes in the component elements and in sub-
stantial changes of the whole system, i.e., practically, the appearance of a new sys-
tem’’.
Many authors provide only the most general methodological recommendations
for using the system-structural analysis when studying systems. This may be accepted
if structural analysis is broadly understood as a process of explaining the interaction
SYSTEMS APPROACH IN SCIENCE2

patterns not only between the system’s components (internal patterns), but also
between the systems (external patterns). Still, this does not provide a practical way of
applying stated methodological recommendations to geologic systems, in particular
to the development of geologic classifications (hierarchical or genetic). At the outset
of development of any scientific branch, there must be a certain classification (C).
Cognition of the observed natural objects, turning them into subjects of study is the
first and unavoidable step in the process of classification (C).
‘‘C facilitates the transition of science or a technical branch from the stage of
empirical accumulation of knowledge to the level of theoretical synthesis (i.e., sys-
tems approach). Such an approach is only possible if there is a theoretical compre-
hension of multiplicity of facts. The practical need in C is an incentive for the
development of theoretical aspects of science and technology. The development of C
is a quantum leap in the evolution of knowledge. Not only does C, when it is based
on strict scientific basis, represent a broad reflection of the state of science (tech-
nology), but C also enables scientists to generate substantiated forecasts regarding
not yet known facts or patterns. One such example is the forecast of properties for
yet unknown chemical elements using Mendeleyev’s system’’ (Yakushin, 1975).
There are two ways to develop C — deductive and inductive.
The first approach consists of setting initial general concepts in the process of
subdivision and then identifying subordinate notions within the subdivisions. The
unity of subdivision principles and the stability of C are ensured by the method of its
development. The second approach is based on perception of individual subjects and
their aggregates, which are joined into classes. Using the second approach, it is more
difficult to ensure logical unity and stability of C than it is with the first approach.
Deduction is preferred for systematizing the branches of knowledge, whereas in-
duction is more convenient for processing actual data. These two approaches are
reflections of the two ways of exploration in natural sciences — analysis and syn-
thesis. ‘‘It is important to emphasize, however, that, methodologically, sequence of
actions is more or less stable: first, analysis and then (based on it), synthesis’’
(Kedrov, 1980).
Earth sciences in general and petroleum geology in particular are substantially
lagging behind other natural sciences dealing with synthesis as a way of ‘‘overcom-
ing’’ analysis. Let us briefly review the causes of this lagging.
Development of C, following the formal logic, requires application of rules of
subdividing volume of a concept. These rules are as follows (after Kosygin, 1978):
(1) Classified objects must be defined, rigidly or even loosely. The reasons for this
are (a) each object may be distinguished from any other object and (b) sim-
ilarities between the objects could be identified.
(2) Allocating the objects into classes, subclasses, etc., must be conducted using
such parameters that can be uniquely identified.
(3) All objects of a divisible aggregate must participate in C.
(4) Each object of a divisible aggregate must fit into one (and only one) class,
subclass, etc.
(5) In case of a subsequent subdivision of a class, objects in that class must be
redistributed among no less than two subclasses.
NATURAL SYSTEMS AND THEIR CLASSIFICATION 3

Thus, the rules of formal logic demand a deductive approach to development of C.
In geological sciences, C usually developed using an inductive approach. The total of
all objects within a ‘‘species’’ creates a new ‘‘genus’’,1 with all properties and phe-
nomena pertinent to this ‘‘genus’’. In the process, some ‘‘species’’ may disappear and
some previously non-existing ‘‘species’’, appear. Some ‘‘species’’ (e.g., certain sec-
ondary minerals) may be selected that may exist, as objects, only on a level of a
‘‘genus’’ concept.
Kosygin (1978) noted that development of C comprises the following steps:
(1) Identification of some aggregate of objects (object domain) that is subject to the
taxonomic analysis.
(2) Identification of parameters of objects.
(3) Establishing the distribution of parameters among the objects.
(4) Grouping the objects into taxons according to this distribution.
(5) Determination of subordination of taxons (within the hierarchical C).
In the above process, the following formal conditions are implicit or explicit:
(1) The taxons must be discrete, i.e., any object may belong only to one single-rank
taxon.
(2) Parameters of objects may be represented as discrete parameters.
(3) Possibility (in principle) to arrive at an apodictic (categorical) and reliable
opinion about a parameter (P) belonging to an object (O).
(4) Possibility (in principle) to arrive at a similar opinion about correspondence of
the parameter P in the object O1 to the same parameter P in the object O2.
If all five steps in developing C and four conditions above were fulfilled when
classifying natural objects, there would have been no problems with the classifica-
tion. In reality, not a single one of the stated four conditions is fulfilled. Moreover,
when developing a C, we are forced to neglect some formal rules of subdividing
the volume of concepts. The rule of consistency as a basis for subdivision is often
not applicable. The requirement for consistent and commensurate subdivision
(for classes not to overlap) may often be satisfied only by stretching. Striving to
comply with the discrete nature of classes leads to a progressive taxon fragmentation,
with the taxons having overlapping parameters. The requirement for classes not
to overlap is disrupted by hybrids. No formal rules can account for the common
(and apparently unavoidable) subdivision of rocks into sedimentary, volcanic, and
metamorphic. The parameters that are believed to have been observed, in reality are
often inferred by analogy. That is why, opinions that these parameters belong to a
given object have a probabilistic nature. ‘‘The actual or potential polymorphism of
the parameters results in our characterization of taxons not by the presence or
absence of a parameter, but by the frequency of its occurrence’’ (Kosygin 1978).
Thus, there is a disagreement between the way of developing C as recommended by
formal logic (deductive approach) and the way it is done in geologic sciences (in-
ductive approach). Any attempt to use formal logic for the evaluation of inductively
1Herein after the words ‘‘species’’, ‘‘genus’’, and ‘‘class’’ are used only in the narrow sense of subordinated
taxons.
SYSTEMS APPROACH IN SCIENCE4

created C must yield a negative result. The writers failed to find any publication that
contained rules (or just recommendations) for the inductive development of C. It
appears that in order to overcome the transition step from analysis to synthesis one
needs to develop corresponding branches in formal logic.
One reason that makes the application of formal logic in geology so difficult is the
nature (properties) of studied objects. Geology studies objectively existing things
(bodies). These bodies are reflected in the subject studied only to some extent of
reliability, which is sometimes quite low. Formal logic, on the other hand, deals with
abstract concepts (products of thought) that are clearly delineated by the corre-
sponding terminology and definitions.
Let us consider a ‘‘set’’, one of the founding concepts in formal logic. Any C
begins with the selection and description of a set. To classify, the set must be selected
and somehow delimited. Within a whole set, mathematical logic considers some
population of objects that have at least one common essential parameter. Nobody
would try to combine into a single set items such as an oil accumulation, a solar
eclipse, a geologic structure, and time. Such a ‘‘set’’ would be incorrect from the
viewpoint of formal logic. At the same time, for some reason, it is believed as quite
feasible to consider the following as a single set: oil (or gas) accumulation, trap, field,
region, prospect, area, basin, province, and tectonic structure (starting with the
region, prefixed with a word ‘‘petroleum’’). Despite a significant mess with defini-
tions in petroleum geology and absence of a clear-cut terminology, it is still possible
to conclude that the above ‘‘set’’ includes:
(a) substance (accumulation), which has quantitative and qualitative parameters;
(b) surface (area, territory, etc.), which can be measured, e.g., in square meters;
(c) geologic structure, i.e., spatial configuration of the Earth’s layers (here, even
volume does not reflect the essence); and
(d) time (for the cases when a basin or a province is considered in the process of
evolution).
It is obvious that a C (especially a hierarchical one) developed for such a ‘‘set’’ is
an absurdity. Nevertheless, the C’s developed for such a ‘‘set’’ or portion thereof is
accepted by petroleum geologists. The very definition of the concept of the ‘‘set’’ in
formal logic is an ‘‘aggregate of objects’’, which implies the discrete nature of the
‘‘set’’. In geology, on the other hand, what is classified is ‘‘continuity’’, a unity of
interconnected processes or their outcomes. They are just conditionally separated for
the purpose of analysis. Also, when one follows the steps of the geologic hierarchy, a
qualitative quantum leap occurs, as new properties appear and old ones disappear.
In the above ‘‘set’’, genetic associations may be established among many of its
constituents. We do mean associations, not transitions (i.e., changes in the properties
of one object depend on the status and properties of some other object). Thus, we
can observe numerous attempts to develop genetic C’s, sometimes natural C’s, at the
time when no methodology exists in the formal logic as to how it should be done.
The concept of a ‘‘set’’, as defined in formal logic, may be used only quite con-
ditionally in geologic sciences. As an example, let us discuss the ‘‘minerals’’ set.
Minerals are an open population, characterized by complex combinations and nu-
merous patterns in their association and neoformations that change with time in the
NATURAL SYSTEMS AND THEIR CLASSIFICATION 5

Earth’s crust. For this set (‘‘minerals’’) even its very volume is difficult to define due
to continuous evolution in nature. Some minerals combine to form a new mineral.
Therefore, the total volume of the set decreases. In some other cases, a mineral may
decompose into several minerals, and the volume of the set would increase. Upon
transformation, some minerals can acquire new properties (or transfer into other sets
located at different rungs of the hierarchical ladder). For instance, either chemical
elements (a rung down) or a rock may form (a rung up).
A set of bituminous minerals (beginning with antraxolites at the one end and
ending with oil and gas, at the other end) may be considered as an ‘‘open popu-
lation’’ in petroleum geology. In general, ‘‘open population’’ is a population (or set)
that can be expanded or reduced to some extent. It is distinguished from the ‘‘open
system’’ the main property of which is the exchange of the matter, energy, and
information with environment.
It is very difficult to select a significant parameter that could be used for a clas-
sification of such ‘‘open population’’ in compliance with the laws of formal logic.
The reasons for that are numerous: (1) complex interrelations; (2) different genesis;
(3) formation of different minerals (such as oil and gas) in the same environment;
conversely, one mineral (such as gas) can form in totally different environments; (4)
complex alterations and transformations when natural temperature and pressure
change. Even if, in order to create an accumulation type classification ‘‘by the com-
position’’, one narrows down the above ‘‘open population’’ to just three elements
(oil, gas, and condensate), the development of a natural classification will be very
difficult. There is a continuous series of objects present; there are endless numbers of
natural kinds and transition forms when habitat changes (including technological
changes, such as production). All these circumstances result in overlapping classes
and violations of the rules of formal logic of subdividing the whole concept.
Genetic parameters in geology and in particular, in petroleum geology, may play a
significant role. But how would one take them into account? A recommendation of
formal logic to define the particular through the general (or, as it is sometimes used
in natural sciences, to define species through the genus) is of little use in this sit-
uation.
If there is a natural hierarchical classification constructed in compliance with the
rules of subdividing the whole concept, then each species identified within a genus
(subset within a set) preserves the significant parameters of the genus. Conversely,
each species included in the genus preserves its significant species features. What
actually occurs is a formal addition or division of objects. This principle intrinsic to
the concept of naıve materialism of ancient Greeks was preserved in formal logic
from the Aristotle’s times.
Everything is much more complicated in the hierarchy of geologic bodies. There,
the situation is tampered by genetic processes evolving under their own laws and
resulting in profound qualitative changes. Elements composing minerals (or other
chemical compounds), considerably change their properties. For instance, is there
any similarity in properties of gaseous oxygen and hydrogen with the same elements
forming a solid mineral or water? From the viewpoint of formal logic it would be
expected that simple summation of the lower rank objects will result in higher rank
SYSTEMS APPROACH IN SCIENCE6

objects. This does not happen, however. Let us consider constituents (minerals) of
granite. Regardless of the duration of their joint occurrence, the granite as a rock will
not form until the occurrence of certain genetic processes that will combine these
minerals into a rock. To transform these components into granite, high temperature
and pressure are needed. Moreover, the newly formed rock may be different: not a
granite but a gneiss, because some constituents of granite may have been generated
in the process of its formation.
Thus, one may conclude that classification C in geology and particularly, in pe-
troleum geology, covers qualitatively different sets. These sets are combined not by
the unity of formally chosen parameters but by transformation (genetic) processes
characterized by quantum leaps. Formal logic so far does not have the appropriate
techniques of developing such genetic C’s. Under these circumstances, to develop
geologic hierarchical C’s one can try the systems approach.
1.2. ROCKS, WATER, ORGANIC MATTER AND GASES AS A SPECIFIC NATURAL SYSTEM
The systems approach is natural and useful when dealing with geologic domain. A
system should not be considered as a certain aggregate of constituent (composite)
elements. A system as an entity is always in a state of perpetual development, with
changes in the interrelations and mutual transitions among the system’s elements,
and interactions with the outside environment. Such changes are implemented
through various processes, which are, commonly, physicochemical. The important
characteristic of a natural system is its energetic state. The energetic state is the most
significant parameter of a system. It appears that a general approach to the problem
must consider the energetic state of the system as a whole, and not of its individual
elements or kinds of energy. According to Komarov (1984, p. 163), the geoid’s
source of evolution is a contradictory unity of its substratum shells, including the
core. All systems identified in the Earth’s crust should be recognized as open systems,
at least from the energy viewpoint. The total energy (E ) of open geologic systems is
the sum of the potential energy (P ) (including elastic and surface energies), kinetic
energy (K ) and free (chemical) energy (F ). This total energy (E ) in the Earth’s crust
is not constant:
E ¼ Pþ K þ Faconst.
Between terms of this inequality there are complex transitions. There are only a
few geologic systems for which even the most general trend in transition may be
identified.
The first step in the systems analysis is identification or delimiting of a system’s
boundaries. Setting the system’s boundaries is an important stage of a system-
structural analysis. These boundaries define the ‘‘postulate’’ (Descartes, 1950), which
is a basis for logical constructions. Besides, this postulate determines to a significant
degree the ‘‘true’’ method leading to the cognition (Bacon, 1938). A sedimentary
sequence (formation) or a sedimentary basin is the most commonly selected main
(reference) system in petroleum geology. This is an unavoidable stage on the way of
ROCKS, WATER, ORGANIC MATTER AND GASES AS A SPECIFIC NATURAL SYSTEM 7

cognition in many petroleum geology problems or in development of hierarchical
systems.
It is advisable to begin the analysis with construction of a simple system that
includes the simplest constituents. Subsequently, depending on the major task of
investigation, many other systems or subsystems may be identified. At the first stage,
however, it is recommended to identify a geologic system comprising the following
elements: rocks, water, organic matter (or its transformation products), and gases. A
general basis for their separation as a common system is their simultaneous and
regular presence within a limited geologic space. The primary element of the system
is the rock (mineral) portion. However, the other constituents are not neutral in the
system’s evolution. They interact with one another and with the surrounding matrix
(rock), and are unequal in terms of their mass. The rocks usually constitute tens of
percents of the mass and volume of the system (coal and peat are excluded). Water
and water vapor fill the pores in rocks and compose a few tens of percent to infinitely
small amounts in the system. Organic matter or its transformation products are
usually within a few percentage points, rising sometimes up to 10% (coal, peat) or
dropping to infinitely small amounts. Natural gases are mostly dissolved in the
liquids of the system. Individual elements of this system and the system as a whole
are exceptionally sensitive to changes in the temperature, pressure, and geochemical
environment.
1.3. SYSTEMS APPROACH IN PETROLEUM GEOLOGY
The objects of study in geologic sciences are geologic bodies (systems). A concept
of the geologic system covers the entire domain of specific geologic terms related to
particular geologic bodies. There are various definitions of a ‘‘geologic system’’. For
instance, ‘‘geologic system is such a system that is formed by interaction of the
planet’s near-surface layers; this interaction includes the effect of both the Earth and
the Universe that became exterior to the planet. The geologic system includes the
Earth’s crust in its structure’’ (Kurazhkovskaya, 1970).
Within the framework of applied geology, a geologic system is a well-organized
natural assembly of interconnected and interacting elements of lithosphere having
common development history and comprising a single natural unit with properties
that are not inherent in their individual elements (Buryakovsky and Dzhafarov,
1983).
Thus, it is possible to define specific systems depending on their natural properties
(for natural bodies) or on the objective of their creation (for engineering and natural
systems). As an example, let us consider compaction of deposits occurring in a
complex laminated system of rocks saturated with various fluids and subjected
to numerous diagenetic processes. Buryakovsky and Dzhevanshir (1987) proposed
a concept of lithofluidal system, which is useful for understanding compaction
processes. They stated that the lithofluidal system is a well-organized natural as-
sembly of interacting solid, liquid and gaseous elements of lithosphere having
SYSTEMS APPROACH IN SCIENCE8

common development history and a distinguishing set of physical and chemical
properties that manifest themselves both individually and jointly.
An engineering-natural system may be defined as a complex of spatially ordered
and temporally interconnected natural and engineering elements, the emergent
property of which is utilization of natural elements to satisfy needs of human society.
It follows from the above that a geotechnical system may be defined as a complex of
spatially ordered and temporally interconnected natural and engineering elements,
the emergent property of which is the recovery of mineral resources from the sub-
surface.
As opposed to the above statements, ‘‘The Mining Encyclopedia’’ (1986) provides
a narrower definition: ‘‘a geologic system is a natural-engineering aggregation of
interacting natural and artificial objects’’. This definition does not clarify the major
property of such a system.
Thus, a geologic system, as any other system, is distinguished first of all by its
special defining property, which manifests itself in the system’s integrity as a material
entity. The identification of the defining property of a system differs from the simple
superposition of the properties of its elements (that is obtained through techniques of
logical analysis and synthesis), which is a difficult problem.
A variety of viewpoints regarding the substance of the systems approach and a
variety of the system definitions manifests the complexity of the real world, i.e., the
diversity of various systems. System classification is methodologically important in
technical and natural-science disciplines, which include earth sciences with their
practical applications (see Afanasyev, 1980, pp. 48–52).
All known system classifications are in essence classifications of the systems’
properties as well as properties of the elements composing a particular system. That
is the reason why the classification presented in Table 1.1 includes not the classes of
systems, but the classes of major properties of systems used for their identification.
Systems are studied utilizing techniques of formal (mathematical) logic. The ex-
tent of formal and mathematical description form of a specific scientific knowledge
or methodological research depends on the completeness of abstraction of real con-
cepts. It is noteworthy that system studies within the framework of a particular
scientific discipline may be conducted along two distinctive paths similar to the
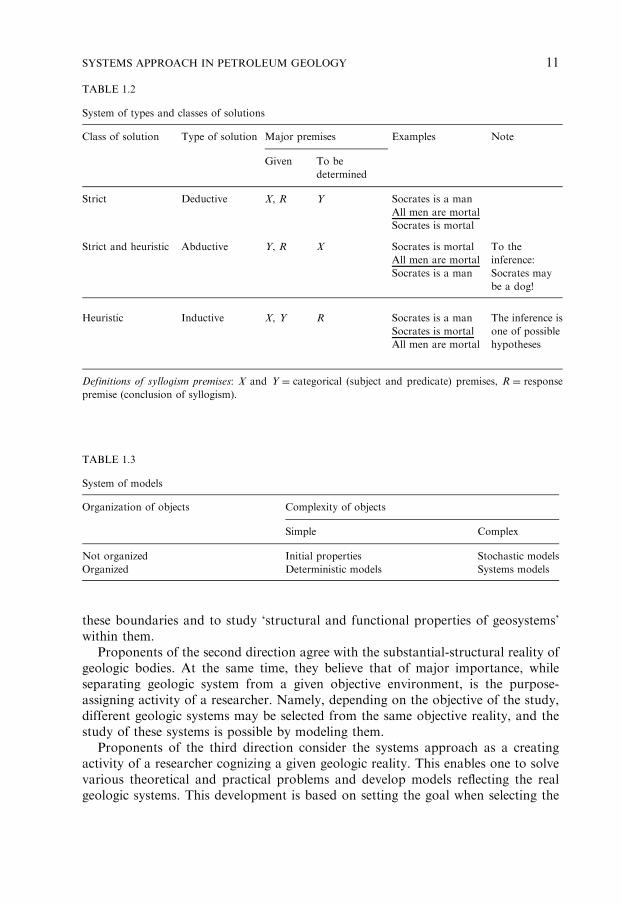
inductive and deductive avenues of deriving new knowledge and developing scientific
theories. System of types of solutions (deductive, abductive, inductive) shown in
Table 1.2 is based on the variation of well-known syllogism of Aristotle: ‘‘All men
are mortal, Socrates is a man, therefore Socrates is mortal’’. The nature of models
depends on the complexity of the studied objects and the extent of their organization
(Table 1.3). Description of system models involves the use of appropriate mathe-
matical instruments. The most complex objects are ranked as systems and are stud-
ied within the framework of the systems approach.
Currently, three directions are known in the modern geologic sciences for the
system identification: (1) natural-objective, (2) goal-oriented, and (3) system-creating
(see Systems Approach in Geology, 1983).
Proponents of the first direction believe that geologic system exists as the objective
reality within the natural geologic boundaries. The goal of a researcher is to find
SYSTEMS APPROACH IN PETROLEUM GEOLOGY 9
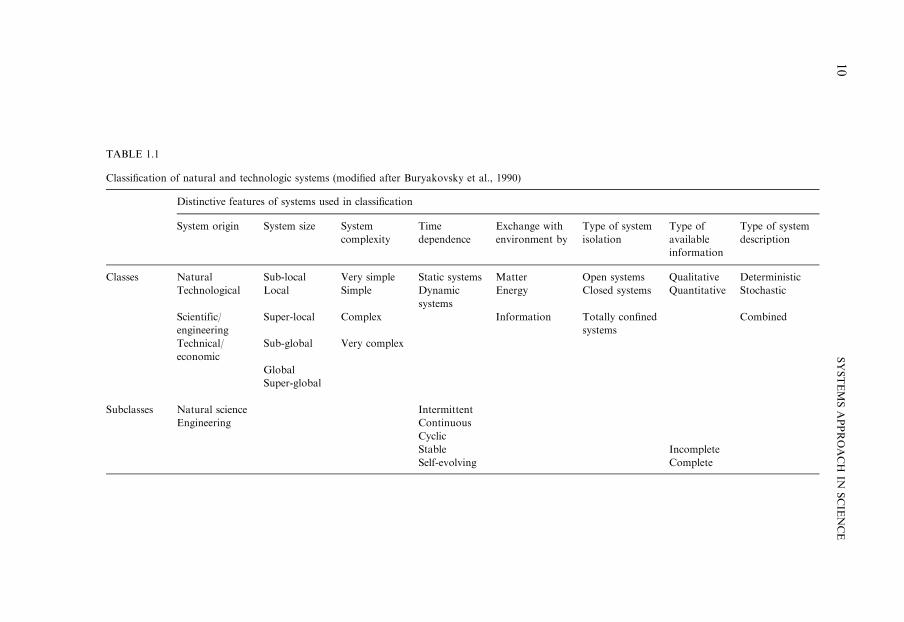
TABLE 1.1
Classification of natural and technologic systems (modified after Buryakovsky et al., 1990)
Distinctive features of systems used in classification
System origin System size System
complexity
Time
dependence
Exchange with
environment by
Type of system
isolation
Type of
available
information
Type of system
description
Classes Natural Sub-local Very simple Static systems Matter Open systems Qualitative Deterministic
Technological Local Simple Dynamic
systems
Energy Closed systems Quantitative Stochastic
Scientific/
engineering
Super-local Complex Information Totally confined
systems
Combined
Technical/
economic
Sub-global Very complex
Global
Super-global
Subclasses Natural science Intermittent
Engineering Continuous
Cyclic
Stable Incomplete
Self-evolving Complete
SYSTEMSAPPROACH
INSCIE
NCE
10
these boundaries and to study ‘structural and functional properties of geosystems’
within them.
Proponents of the second direction agree with the substantial-structural reality of
geologic bodies. At the same time, they believe that of major importance, while
separating geologic system from a given objective environment, is the purpose-
assigning activity of a researcher. Namely, depending on the objective of the study,
different geologic systems may be selected from the same objective reality, and the
study of these systems is possible by modeling them.
Proponents of the third direction consider the systems approach as a creating
activity of a researcher cognizing a given geologic reality. This enables one to solve
various theoretical and practical problems and develop models reflecting the real
geologic systems. This development is based on setting the goal when selecting the
TABLE 1.2
System of types and classes of solutions
Class of solution Type of solution Major premises Examples Note
Given To be
determined
Strict Deductive X, R Y Socrates is a man
All men are mortal
Socrates is mortal
Strict and heuristic Abductive Y, R X Socrates is mortal
All men are mortal
Socrates is a man
To the
inference:
Socrates may
be a dog!
Heuristic Inductive X, Y R Socrates is a man
Socrates is mortal
All men are mortal
The inference is
one of possible
hypotheses
Definitions of syllogism premises: X and Y ¼ categorical (subject and predicate) premises, R ¼ response
premise (conclusion of syllogism).
TABLE 1.3
System of models
Organization of objects Complexity of objects
Simple Complex
Not organized Initial properties Stochastic models
Organized Deterministic models Systems models
SYSTEMS APPROACH IN PETROLEUM GEOLOGY 11

object of a study, engineering the systems-related object of activity and optimizing
the process of activity, management, and control.
It is important that the three aforementioned directions are not antagonistic to
each other, but represent the sequential stages in studying geologic systems. First, the
geologic system is identified and studied as a natural geologic body. Then, mostly in
the process of its engineering-technological utilization, it is analyzed and modeled in
order to understand its functions as a natural-engineering system. Eventually, the
system-creating approach merges the analytical and synthetic stages in studying and
developing systems, and is the methodological basis for a cognitive and creative
activity.
The identification of geologic systems and delineation of their boundaries, there-
fore, should be conducted based on the goal stated for each particular situation and
each particular objective of the study. The boundaries of geologic systems may be set
based on different considerations: genetic, regional, the method of engineering-tech-
nological activity, economics, etc. Hence, one of the major tenets of natural sciences,
the relativity principle, manifests itself in the procedure of identifying geologic sys-
tems.
The tentativeness of the geosystem identification follows from the fact that it is an
open system that exchanges matter, energy, and information with the environment.
The information exchange is a determining property of not only geosystems but also
of any natural and engineering-technological (i.e., natural and artificial) systems.
Studies of the structure and behavior of the systems, enables one to obtain scientific
knowledge needed for the engineering-technological utilization of these systems.
As mentioned above, geosystems are open systems. At the same time, closed (but
not isolated) systems are widely used in theoretical and practical geologic studies. In
fact, any theory serving as a model of a geologic phenomenon or process represents a
tentatively closed (quasi-closed) system. Almost all laboratory experiments in ge-
ology, geochemistry, and geophysics are conducted in the framework of quasi-closed
systems, where a researcher has to neglect the effect of environment. An economic
mineral deposit, especially a solid one, is always considered as a closed system. When
developing oil and gas accumulations, one is dealing with quasi-closed systems. This
is especially true if the oil production occurs without the advance of the oil–water
contact (e.g., reservoirs with depletion drive). The concept of the quasi-closed system
allows one to simplify the solution of scientific problems.
An important property of any system is hierarchy of its components. As a rule, it
involves only one characteristic of the classification, namely, its scale. Hierarchically
subordinated components of a system usually differ not in their physical nature, but
in scale. For example, the petroleum basin system may be subdivided into subsys-
tems of oil- and gas-bearing regions, fields, and accumulations consecutively encl-
uded into one another. In this subordination, each one of the subsystems preserves
the general geological and physical features inherent with the system of petroleum
basin.
On the other hand, a unified system (including a geologic system) can contain
elements of different nature, diverse aggregate state, and distinctive physical nature.
As an example, the system of petroleum basin, as well as the subsystems of oil and
SYSTEMS APPROACH IN SCIENCE12

gas regions, fields, and accumulations, contains such components as (1) reservoirs;
(2) seals (caprocks); (3) formation fluids (oil, gas, water); (4) tectonic, stratigraphic,
lithologic, and other barriers, etc. In the above short list, no attempt was made to
compare the system components for their complementarity, which would be nec-
essary in order to emphasize their physical distinctions. Obviously such system’s
components are also the subsystems of the original system. Such hierarchy would be
substantially different from a hierarchy based on the subsystem’s scale and, to some
degree, its complexity. One example of such an approach to the hierarchy of a
megasystem is the classification of oil and gas accumulation traps (Fig. 1.1)
(Kerimov, 1985).
If geology is defined as a complex of scientific disciplines dealing with the com-
position, structure and evolution of the Earth’s crust and the Earth as a whole, then
it would be natural to subdivide the objects of geologic science disciplines into
the static and dynamic ones depending on time considerations. In static, matter-
structural problems, the time is set, whereas in dynamic problems, the time changes,
in a discrete or continuous way, non-periodically or cyclically depending on the
specific geologic process of interest.
The existence and functioning of dynamic geologic systems is controlled by var-
ious processes, which depend on diverse natural factors. The dynamic systems, which
Fig. 1.1. Oil and gas area static system (modified after Kerimov, 1985).
SYSTEMS APPROACH IN PETROLEUM GEOLOGY 13

possess relatively stable inherited structure, evolve and change with time. At a given
moment in geologic time, such systems are stable integral structures in a state of
dynamic equilibrium with the environment. This equilibrium is caused by a com-
bined effect of a set of natural factors.
Forecast of the structure and behavior of dynamic systems in time is the matter of
systems forecasting. A specific feature of the systems forecast in geology is the
necessity and feasibility to forecast the behavior and structure of the geologic system
both in time and space. On the basis of the structure of the space–time continuum of
lithosphere, it is possible to identify changes in geologic system with depth and time.
Thus, the geologic forecast is actually a ‘‘retrocast’’, directed back in time and in
depth. According to Kosygin and Solovyev (1969), the dynamic and retrospective
geologic systems are actually dynamic systems with the forward and reverse time
count.
The cognition of geologic systems is based on their modeling. Modeling in ge-
ology is a creation of a physical, matter-structural object reflecting major properties
of the system studied in an isomorphic way. It may also be a logical-mathematical
construction reflecting equally the structure and behavior of the system being stud-
ied. Modeling in geology is commonly utilized for a brief characterization of systems
as well as for the forecast of their behavior and structure in time and space (Bury-
akovsky et al., 1982).
A specific feature of mathematical modeling of dynamic geologic systems and
geologic processes is the necessity to take into account the time factor. The modeling
of dynamic geologic systems uncovers the unity of such opposite methodological
approaches as the systemic-structural and genetic-historical. The merger of the
structural and historical approaches enables one to consider a geologic system as a
natural structure, which (1) is relatively stable during a specific time period, and (2) is
evolving and changing over a long interval of geologic time.
Inclusion of geologic time into mathematical models is difficult. This is caused by
the existence of both absolute and relative geologic time, which are totally different
in nature. The origin (zero point) of the absolute time is identical for the entire Earth,
whereas the relative time is determined using the stratigraphic and paleontologic
techniques with no zero-point time count. It is not possible to use the relative ge-
ologic time in mathematical geologic models. An opinion that the absolute time
cannot be used as the input parameter in mathematical modeling of dynamic ge-
ologic systems is totally ungrounded.
Description of a geologic system or selection of the mathematical tools for
modeling depends on the nature of system studied (mainly on its complexity and
organization). Geologic systems belong to the realm of complex and supercomplex,
poorly organized (non-uniform) natural structures. The stochastic-statistical tech-
niques used predominantly in modeling static geologic systems cannot be used in
modeling dynamic systems, where time is the major variable (the geologic time is
measured in millions of years).
A possible approach to modeling dynamic geologic systems involves mathemat-
ical analysis techniques, i.e., differential equations, in combination with stochastic-
statistical methods of assigning the numeric values of variables. On the one hand,
SYSTEMS APPROACH IN SCIENCE14

this approach allows a deterministic analytical description of major features in the
evolution of a geologic system. On the other, it enables one to consider the stoc-
hastic-statistical nature of various geologic parameters (variables) causing changes in
the system. The analytical solution can be obtained by using the Monte Carlo tech-
nique. This synthetic approach allows one to solve numerous theoretical and prac-
tical problems in petroleum geology (Buryakovsky et al., 1982, 1983).
The proposed general classification (Table 1.1) identifies the following major fea-
tures of the geologic systems. These systems belong to the natural or natural-
engineering systems on a scale ranging from sublocal to global, and are complex to
supercomplex. In terms of their evolution in time, they are usually dynamic (in some
specific cases, they are static). Interaction with the environment is achieved through
the exchange of matter, energy, and information. Available information of the sys-
tem depends on the stage of the system’s exploration and may range from zero (when
the system has not yet been identified) to complete quantitative information. For the
description of a system, any modeling techniques can be used.
Theoretical studies in geology have the objective of cognition of real geologic
systems as well as development of the theories of geologic processes that result in the
studying of existing system and transformation of one system into another.
TABLE 1.4
System of scientific knowledge and scientific activity
Subsystem Type of knowledge Logical form Type of inference Logical estimate
Theory (T) Knowledge of laws of
nature, function and
evolution of objects
Sentence Deduction True/False. Definite set of
parameters
Fact (F) Knowledge of properties
of and interrelations
among the objects
selected for experiment
Sentence Induction True/False. Indefinite set of
parameters
Method
(M)
Knowledge of
procedures required for
acquiring new
knowledge
Standard Implemented or
unimplemented
Subject (S) Formulation of
purposes and objectives
of cognition
Question Intuition Feasible or unfeasible
Result (R) Knowledge of properties
of, interrelation among,
and evolution of objects
expressed in subsystems
T, F, M, S at the new
cognition level
Sentence True/False. Definite set of
parameters
SYSTEMS APPROACH IN PETROLEUM GEOLOGY 15

Fig. 1.2. Flowchart of geologic knowledge system.
SYSTEMSAPPROACH
INSCIE
NCE
16
Following the general scheme of scientific knowledge (Table 1.4), a schematic
image of the construction of geologic knowledge or geologic theory was developed
(Fig. 1.2).
Subsystem T (Theory) includes a priori geologic concepts covering such funda-
mental properties of geologic systems as their structure, material composition, dy-
namics (function), and history.
Subsystem M (Method) is subdivided into a number of purely geologic study
techniques and those adapted from other scientific disciplines.
Subsystem F (Fact) is the derivative of two subsystems described above and
includes results of experimental and field observations (measurements) conducted in
various ways according to a priori set of geologic concepts.
Subsystem S (Subject) is the assignment of goal for the study of specific geologic
bodies. The primary models of geologic bodies obtained as a result of direct ob-
servations and measurements (maps, profiles, cross-sections, tables, graphs, etc.)
should be understood and accepted as a subject in geology.
Subsystem R (Result) contains the newly derived knowledge that either enters
directly as a practical implementation or serves as a further development of the-
oretical and methodological concepts (a posteriori theoretical concepts).
The system of oil and gas reserves estimation may serve as an example of con-
struction of geologic knowledge system. It includes the following five subsystems:
(1) Geologic conditions of subsurface reservoir occurrence: type of traps, structural
elements, depth of occurrence, type of reservoir, type of reservoirs, type of
sealing rocks, type of hydrocarbon accumulation, and type of formation fluids.
(2) Reservoir structure and parameters: folding and faulting features, porosity,
permeability, fluid saturation, wettability of rocks, and compressibility.
(3) Reservoir drive mechanism: solution gas drive, gravity drainage, water drive,
gas-cap drive, compaction drive, or combination drive.
(4) Hydrocarbon reserves estimation: volumetric, statistical and material balance
techniques.
(5) Evaluation of effectiveness of reserve estimation: accuracy of estimate, reliability
of reserves, proportion of various reserve categories, and value of reserves.
Thus, the in-place and recoverable reserves are estimated based on the detailed
simulation of oil and gas reservoir. The estimated amount of reserves is used for
justification of capital investments in oil and gas field development and production.
The reserve estimation system is a key step dictating the transfer from exploration to
production. Geologic system ‘‘oil and gas reservoir’’ at the stage of production is
transformed into geologic-engineering system (‘‘producing oil and gas reservoir’’).
SYSTEMS APPROACH IN PETROLEUM GEOLOGY 17

This page intentionally left blank
18

Chapter 2
OIL- AND GAS-BEARING ROCKS
2.1. COMPOSITION OF OIL- AND GAS-BEARING ROCKS
A leading role in the rock–water–organic matter system belongs to rocks. The
rocks containing oil and gas alternate in the Earth’s crust with the rocks that do not
contain hydrocarbons. The former rocks are called petroleum sequences or petro-
leum systems. Such sequences in the sedimentary cover comprise a relatively limited
combination of rocks, but form numerous diverse combinations. Eremenko and
Ulyanov (1960) identified 15 individual lithofacies among the sedimentary rocks:
1. Limestones, dolomites.
2. Limestones and dolomites with clay (shale) interbeds.
3. Limestones and dolomites with sand (sandstone), and clay (shale) interbeds.
4. Clays (shales) with limestone interbeds and lenses.
5. Clays (shales) and sandstones (sands) with limestone (dolomite) interbeds.
6. Clays with limestone (dolomite), sandstone (sand), and marl interbeds.
7. Clays (shales) and marl with sandstone and sand interbeds.
8. Clays (shales) with sandstone and sand interbeds and lenses.
9. Clays (shales) with sand, sandstone, and conglomerate interbeds.
10. Sandstones with conglomerate interbeds.
11. Sandstones and sands.
12. Coaliferous sediments.
13. Salt- and gypsum-bearing sediments (evaporites).
14. Variegated (showing variations of colors or tints) sediments.
15. Flysh facies.
Sometimes, highly compacted (devoid of intergranular, effective porosity, and
permeability) fractured rocks are encountered. Oil can only move through fractures
in such rocks. The production of oil and gas found in the matrix of such rocks is
practically impossible. Thus, an additional group of petroleum sequences is the tight
fractured rocks. Another group is formed by the volcanic and metamorphic rocks,
which often contain oil and/or gas in fractures and, sometimes, in vugs and caverns
formed by weathering and dissolution.
A term ‘‘geologic formation’’ gained common acceptance during the recent years.
This well-forgotten term was introduced by Abraham George Werner as far back as
in 1781. Khain (1973) defined formation as follows: ‘‘ya formation is a natural and
regular combination of rocks (sedimentary, volcanic, intrusive) related by the com-
mon environment of their origin and emerging at certain evolutionary stages of the
major structural zones in the Earth’s crust’’.
Based on this definition, the lithofacies listed above may be considered as for-
mations. Generally speaking, if we treat facies as an environment in which rocks
were formed, it is possible to view formations as the product of such environments.
19

The most common lithofacies are: limestones and dolomites (1); and clays (shales)
with sandstone and sand interbeds (2). Less common are the petroleum sequences,
which are formed by such lithofacies as sandstones with conglomerate interbeds (10),
and clays (shales) with limestone interbeds and lenses (4). Most common facies are
marine sedimentary sections, the coaliferous facies, and the variegated deposit facies.
Petroleum sequences composed of carbonate lithofacies (1–3) prevail on the plat-
forms. Sequences comprising sandy–clayey lithofacies with carbonates (4–5), and
sandy (10–11), variegated (14), coaliferous (12) and salt-bearing (13) lithofacies are
about equally represented on platforms and in geosynclines (including foredeeps).
Petroleum sequences composed mostly of clayey (6–9) and flysh (15) lithofacies are
found predominantly or exclusively in geosynclines (including the foredeeps).
It terms of their occurrence, Bakirov (1976) subdivided petroleum sequences into:
(a) regional (i.e., developed within the entire petroleum provinces or their major
regions),
(b) subregional (i.e., developed within individual areas of petroleum provinces or
regions)
(c) zonal (occurring in an oil and gas generation zone), and
(d) local (found within individual oil or gas fields).
With respect to the fluids contained in a petroleum sequence, the rocks may be
subdivided into two classes, reservoirs and seals (caprocks), with numerous tran-
sitional forms. This is a rather tentative classification as one and the same rock can
behave differently toward different fluids. For instance, most clays permeable to
water (although sometimes with great difficulty) are impermeable to oil and gas.
Some water-saturated clays are permeable to oil but impermeable to gas (capillary
pressure at the gas–water contact is higher than at the oil–water contact). Hydro-
philic rocks with small pores prefer water to oil, whereas hydrophobic rocks behave
conversely. Depending on subsurface temperature and pressure, the salts may either
act as seals or reservoirs. Fluid flow through a rock depends not only on the rock
properties but also on fluid properties, which are very sensitive to changes in the
temperature and pressure.
2.2. RESERVOIR ROCKS
Oil and/or gas reservoir rock is understood as not only a rock that can contain
but also yield these fluids during the development and production in a given
temperature–pressure and geochemical (physicochemical) environment. The latter
statement is very important in preventing a researcher from using the various reservoir-
rock properties obtained in the laboratory. Even those determinations obtained at
reservoir conditions should be taken with a grain of salt, if the core was first exposed to
surface conditions. Physical and chemical conditions may cause alterations, such as
irreversible precipitation of salts out of solution (water, oil, gas) or, conversely, dis-
solution of salts, etc. One must keep in mind that most of such processes exhibit
hysteresis. Exposure to air (oxidation) also changes the wettability of rocks (oil-wet
versus water-wet). Logs can provide continuous record of petrophysical properties,
OIL- AND GAS-BEARING ROCKS20
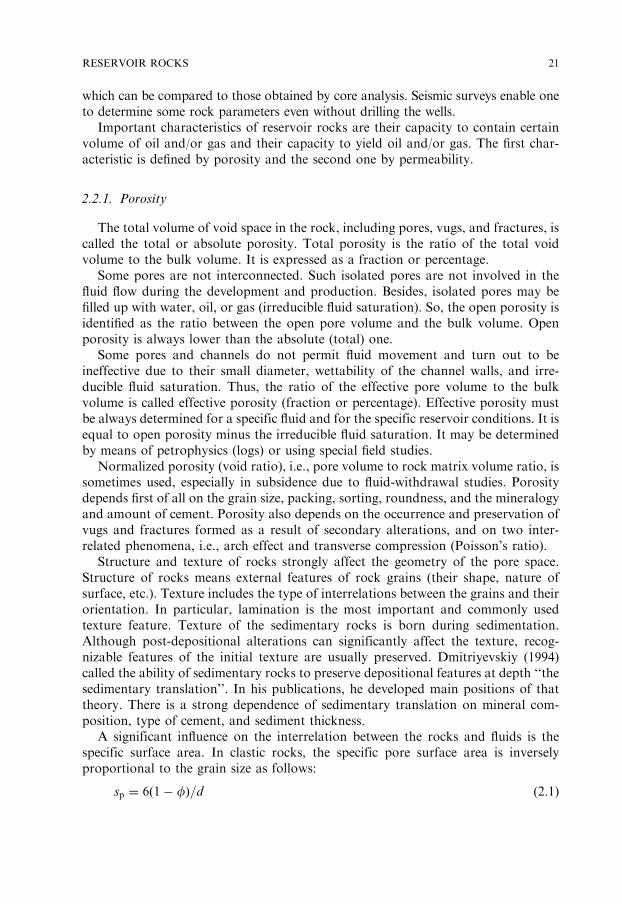
which can be compared to those obtained by core analysis. Seismic surveys enable one
to determine some rock parameters even without drilling the wells.
Important characteristics of reservoir rocks are their capacity to contain certain
volume of oil and/or gas and their capacity to yield oil and/or gas. The first char-
acteristic is defined by porosity and the second one by permeability.
2.2.1. Porosity
The total volume of void space in the rock, including pores, vugs, and fractures, is
called the total or absolute porosity. Total porosity is the ratio of the total void
volume to the bulk volume. It is expressed as a fraction or percentage.
Some pores are not interconnected. Such isolated pores are not involved in the
fluid flow during the development and production. Besides, isolated pores may be
filled up with water, oil, or gas (irreducible fluid saturation). So, the open porosity is
identified as the ratio between the open pore volume and the bulk volume. Open
porosity is always lower than the absolute (total) one.
Some pores and channels do not permit fluid movement and turn out to be
ineffective due to their small diameter, wettability of the channel walls, and irre-
ducible fluid saturation. Thus, the ratio of the effective pore volume to the bulk
volume is called effective porosity (fraction or percentage). Effective porosity must
be always determined for a specific fluid and for the specific reservoir conditions. It is
equal to open porosity minus the irreducible fluid saturation. It may be determined
by means of petrophysics (logs) or using special field studies.
Normalized porosity (void ratio), i.e., pore volume to rock matrix volume ratio, is
sometimes used, especially in subsidence due to fluid-withdrawal studies. Porosity
depends first of all on the grain size, packing, sorting, roundness, and the mineralogy
and amount of cement. Porosity also depends on the occurrence and preservation of
vugs and fractures formed as a result of secondary alterations, and on two inter-
related phenomena, i.e., arch effect and transverse compression (Poisson’s ratio).
Structure and texture of rocks strongly affect the geometry of the pore space.
Structure of rocks means external features of rock grains (their shape, nature of
surface, etc.). Texture includes the type of interrelations between the grains and their
orientation. In particular, lamination is the most important and commonly used
texture feature. Texture of the sedimentary rocks is born during sedimentation.
Although post-depositional alterations can significantly affect the texture, recog-
nizable features of the initial texture are usually preserved. Dmitriyevskiy (1994)
called the ability of sedimentary rocks to preserve depositional features at depth ‘‘the
sedimentary translation’’. In his publications, he developed main positions of that
theory. There is a strong dependence of sedimentary translation on mineral com-
position, type of cement, and sediment thickness.
A significant influence on the interrelation between the rocks and fluids is the
specific surface area. In clastic rocks, the specific pore surface area is inversely
proportional to the grain size as follows:
sp ¼ 6ð1� fÞ=d (2.1)
RESERVOIR ROCKS 21
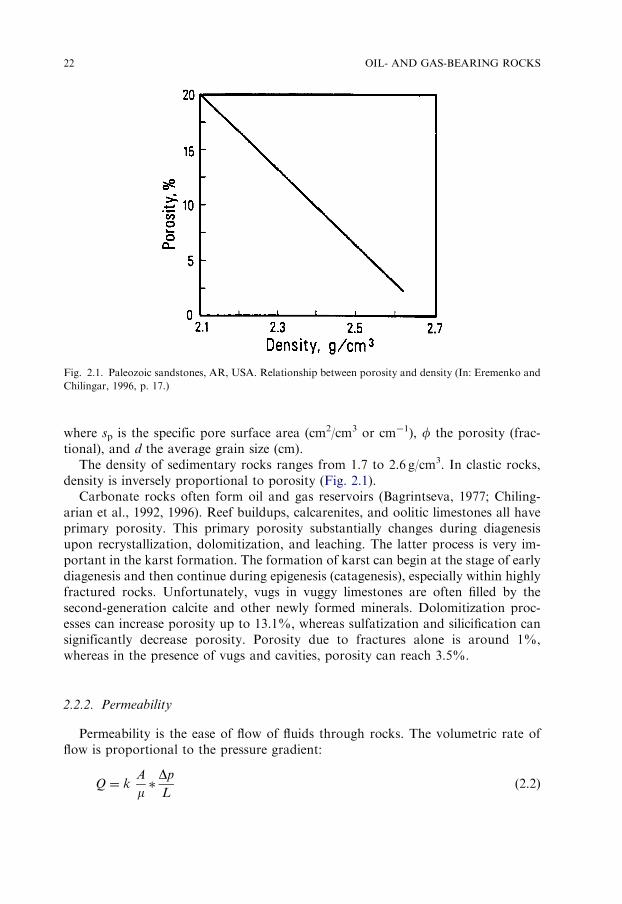
where sp is the specific pore surface area (cm2/cm3 or cm�1), f the porosity (frac-
tional), and d the average grain size (cm).
The density of sedimentary rocks ranges from 1.7 to 2.6 g/cm3. In clastic rocks,
density is inversely proportional to porosity (Fig. 2.1).
Carbonate rocks often form oil and gas reservoirs (Bagrintseva, 1977; Chiling-
arian et al., 1992, 1996). Reef buildups, calcarenites, and oolitic limestones all have
primary porosity. This primary porosity substantially changes during diagenesis
upon recrystallization, dolomitization, and leaching. The latter process is very im-
portant in the karst formation. The formation of karst can begin at the stage of early
diagenesis and then continue during epigenesis (catagenesis), especially within highly
fractured rocks. Unfortunately, vugs in vuggy limestones are often filled by the
second-generation calcite and other newly formed minerals. Dolomitization proc-
esses can increase porosity up to 13.1%, whereas sulfatization and silicification can
significantly decrease porosity. Porosity due to fractures alone is around 1%,
whereas in the presence of vugs and cavities, porosity can reach 3.5%.
2.2.2. Permeability
Permeability is the ease of flow of fluids through rocks. The volumetric rate of
flow is proportional to the pressure gradient:
Q ¼ kA
m�Dp
L(2.2)
Fig. 2.1. Paleozoic sandstones, AR, USA. Relationship between porosity and density (In: Eremenko and
Chilingar, 1996, p. 17.)
OIL- AND GAS-BEARING ROCKS22

where Q is the flow rate (m3/s), m the dynamic viscosity (Pa � s), Dp the pressure
gradient along the length L (in m, Pa/m), A the cross-sectional area (m2), and k the
permeability (m2).
Permeability is a function of the pore size and shape, pore throat and/or channel
diameter, grain size and shape, grain packing density, tortuosity, sorting, cementing,
fracturing, and residual fluid saturation. The above definition of permeability in-
dicates that its value should not be affected by the nature of a liquid moving through
the porous medium. Actually, however, permeability changes depend on the type of
flowing fluid. These changes are sometimes greater than 100%. According to def-
inition, permeability also should not change with time. Experiments, however, often
demonstrate permeability drop of up to 50% within 1 h. There are different expla-
nations of the reasons causing permeability change in time, and the effect of fluid
properties on permeability. If fluids flow through loose reservoir rocks that include
some fine sands, rock grains may change their positions (a phenomenon called
‘‘suffusion’’), and the pore channels may become plugged with fine material. Col-
loidal particles suspended in oil may precipitate and plug the pores. Resins and
asphaltenes present in crude oil may also precipitate, and result in a decrease of the
cross-sectional area of pore channels, throats, and canals. Wettability of rocks (oil-
wet versus water-wet) also changes the relative permeability to water and to oil (see
Chilingarian et al., 1992, 1996).
When water flows through reservoir rocks that include clay minerals, many of the
clay minerals swell, which also results in a decrease in the cross-sectional area of pore
channels. Water in contact with silica may give rise to colloidal silica in porous
space, which may lead to plugging of the pore channels. When CO2 is released from
water, CaCO3 precipitates within reservoirs according to the following reaction:
ðHCO3Þ2Ca ! CO2 " þCaCO3 # þH2O
decreasing the pore throat and canal diameters.
Based on experiments, Khanin (1976) recorded a substantial decline in gas per-
meability of sandy rocks with the cement content of 4–10% (see also Fig. 2.2).
Dutton and Diggs (1992) also reported drastic permeability changes in the Upper
Cretaceous sandstones of eastern Texas having similar cementation ranges. Bury-
akovsky (1985) provided quantitative relationships between permeability and ce-
mentation (both due to argillaceous cement and calcareous cement) based on
laboratory analyses of cores recovered from the Pliocene Productive Series of the
onshore and offshore Azerbaijan.
It is established that the Darcy’s law may be applied for the description of a steady
fluid flow only within certain limits. The upper applicability boundary is associated
with inertia forces at high velocity flow and is defined by the critical value of the
Reynolds number (Recr ¼ 7:5–9). The lower applicability boundary, typical for low-
velocity flow (for instance, in clays) is associated with fluid interactions with the
porous medium (non-Newtonian rheological properties of liquids). Some liquids (oil,
water) can form colloidal films on the surface of a porous medium that may totally
obstruct the liquid movements through the pores. In this case, in order for the
movement to begin, an additional force should be applied (the initial pressure
RESERVOIR ROCKS 23
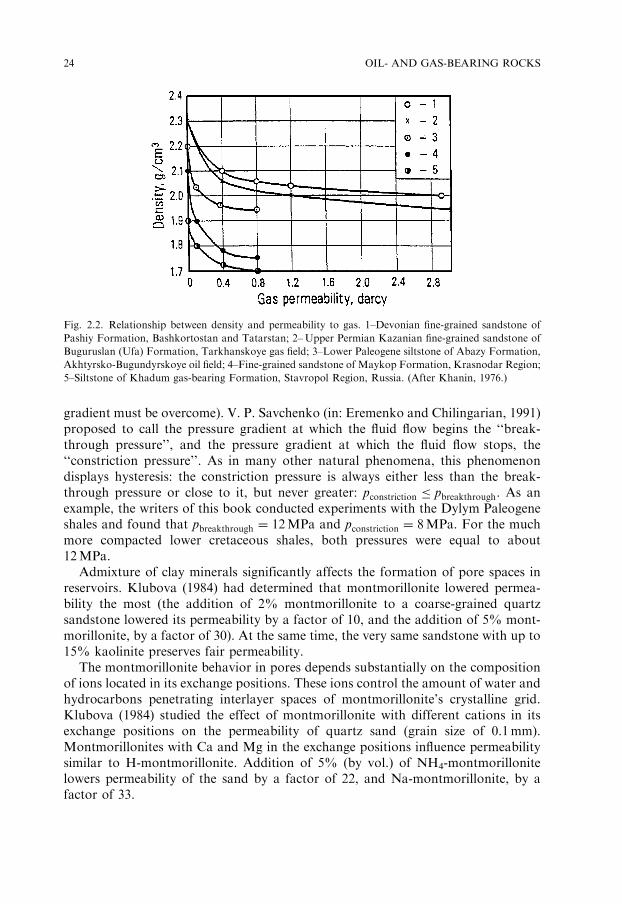
gradient must be overcome). V. P. Savchenko (in: Eremenko and Chilingarian, 1991)
proposed to call the pressure gradient at which the fluid flow begins the ‘‘break-
through pressure’’, and the pressure gradient at which the fluid flow stops, the
‘‘constriction pressure’’. As in many other natural phenomena, this phenomenon
displays hysteresis: the constriction pressure is always either less than the break-
through pressure or close to it, but never greater: pconstriction � pbreakthrough. As an
example, the writers of this book conducted experiments with the Dylym Paleogene
shales and found that pbreakthrough ¼ 12MPa and pconstriction ¼ 8MPa. For the much
more compacted lower cretaceous shales, both pressures were equal to about
12MPa.
Admixture of clay minerals significantly affects the formation of pore spaces in
reservoirs. Klubova (1984) had determined that montmorillonite lowered permea-
bility the most (the addition of 2% montmorillonite to a coarse-grained quartz
sandstone lowered its permeability by a factor of 10, and the addition of 5% mont-
morillonite, by a factor of 30). At the same time, the very same sandstone with up to
15% kaolinite preserves fair permeability.
The montmorillonite behavior in pores depends substantially on the composition
of ions located in its exchange positions. These ions control the amount of water and
hydrocarbons penetrating interlayer spaces of montmorillonite’s crystalline grid.
Klubova (1984) studied the effect of montmorillonite with different cations in its
exchange positions on the permeability of quartz sand (grain size of 0.1mm).
Montmorillonites with Ca and Mg in the exchange positions influence permeability
similar to H-montmorillonite. Addition of 5% (by vol.) of NH4-montmorillonite
lowers permeability of the sand by a factor of 22, and Na-montmorillonite, by a
factor of 33.
Fig. 2.2. Relationship between density and permeability to gas. 1–Devonian fine-grained sandstone of
Pashiy Formation, Bashkortostan and Tatarstan; 2–Upper Permian Kazanian fine-grained sandstone of
Buguruslan (Ufa) Formation, Tarkhanskoye gas field; 3–Lower Paleogene siltstone of Abazy Formation,
Akhtyrsko-Bugundyrskoye oil field; 4–Fine-grained sandstone of Maykop Formation, Krasnodar Region;
5–Siltstone of Khadum gas-bearing Formation, Stavropol Region, Russia. (After Khanin, 1976.)
OIL- AND GAS-BEARING ROCKS24

The fluid flow through the reservoir rocks is also affected by the type of clayey
cement distribution in the pore space. On assuming uniform distribution of cement,
the finer are the rock grains (and the poorer is their sorting), the greater is the effect
of the clay, i.e., the more complex is the structure of pore space, the greater is the
effect of the clay. Studies of thin sections of the reservoir rocks with different dis-
tribution of cement showed that the allothigenic minerals do not cover the clastic
grains uniformly. Thus, they form peculiar swollen coagulants on the salient parts of
rock-forming minerals and convert initially large pores into small, dead-end ones.
When the clay cement is uniformly distributed, the number of dead-end pores is very
high and the intercommunicating pores become geometrically complex. This ham-
pers the movement of oil through the reservoir. The greater the amount of a clay, the
more complex are pore outlines, and the more constricted is the fluid flow through
the reservoir.
The effective pore diameter in a reservoir with clay cement decreases also due to
sorption of some portion of hydrocarbons on the active centers of clay minerals.
High-molecular-weight hydrocarbons are especially prone to be sorbed.
Correlation between the two major reservoir parameters, porosity and permea-
bility, is a difficult task. Permeability correlates most closely with the size and shape
of pores, whereas porosity does not depend on the pore size. Numerous attempts
have been undertaken to theoretically determine the correlation between the porosity
and permeability. Sometimes, the specific surface area is used. F. I. Kotyakhov (in:
Eremenko and Chilingarian, 1991) proposed the following equation:
k ¼ 49� 106f3=sp (2.3)
where sp is the specific pore surface area (cm2/cm3), k the permeability (cm2), and f
the porosity (fractional).
Levorsen (1967), in turn, proposed the following equation:
k ¼ 2� 10�7f3=ð1� f2Þs2p (2.4)
Buryakovsky (1985) provided quantitative relationships between permeability and
porosity based on laboratory analyses of cores recovered from the Pliocene Pro-
ductive Series of the onshore and offshore Azerbaijan.
A fuzzy correlation is illustrated by experiments conducted by Kerans et al. (1994)
on outcrop samples of Permian carbonates with leaching pores (Fig. 2.3). A log–log
graph shows some correlation between the porosity and permeability at porosity
below 20%.
Presence of a fracture in the rock drastically increases its permeability and only
slightly affects the porosity (Bagrintseva, 1977; Chilingarian et al., 1992, 1996). The
liquid flow velocity through a fracture is determined by the Boussinesq equation:
V ¼w2
2mDp (2.5)
where w ¼ the fracture opening, m ¼ the viscosity, and Dp ¼ the pressure drop.
For a laminar gas flow, taking gas compressibility into account, Eq. 2.5 can be
presented in the following form:
RESERVOIR ROCKS 25

V g ¼k
2mDp2 (2.6)
where k is the gas permeability.
If the fracture opening is at least 10 mm, fractured reservoir permeability may be
calculated using the following equation:
k ¼ 8:5� 10�4w3=b (2.7)
where b is the spacing between the fractures (m).
The classical hydrodynamic equation for narrow linear channels (fractures) is
q ¼ w3aDp=12mL (2.8)
where q is the volumetric rate of flow (cm3/s), w the height of fracture (cm), a the
width of fracture (cm, a � w½ �), L the length of fracture (cm), Dp the pressure drop
(dyn/cm2), and m the viscosity (dyn/cm2).
For laminar flow, Witherspoon et al. (1980) proposed the following equation:
q ¼ 5:11� 106ðw3Dpa=lmÞ (2.9)
where q is the volumetric rate of flow in (bbl/day), w the width (or aperture) of a
fracture (in); Dp the pressure drop (psi), a the width of fracture face (f), l the length
of the fracture (f), and m the viscosity of the fluid (cP).
Jones et al. (1988) suggested the following equations for open, rough fractures
with single-phase flow:
q ¼ 5:06� 104aðDpw3=flrÞ0:5 (2.10)
k ¼ 5:39� 105mðwl=DprÞ0:5 (2.11)
where q ¼ the volumetric rate of flow (bbl/day), k ¼ the permeability (darcys),
r ¼ the density of flowing fluid (lb/ft3), and f ¼ the friction factor (dimensionless).
Fig. 2.3. Permian carbonate outcrops. Relationship between the permeability and porosity due to di-
ssilution (leaching) (after Kerans et al., 1994). Porosity (%): 1–0-5; 2–6-10; 3–11-30.
OIL- AND GAS-BEARING ROCKS26

Detailed procedure of determining friction factor ( f ) is discussed by Chilingarian
et al. (1996, pp. 4–8).
If permeability of porous reservoir rocks is proportional to the square of pore
diameter, in fractured ones it is proportional to cubed fracture opening.
A very good correlation between the porosity and permeability was established by
Chilingarian et al. (1992) by introducing two additional variables, irreducible fluid
saturation and specific surface area.
If fractures form in an anisotropic (laminated) medium, its permeability will differ
in different directions. Moreover, in some cases both porosity and permeability near
the fracture may significantly decrease. Studies conducted by Antonellini and Aydin
(1994) on samples from outcrops in the Utah National Park indicated that perme-
ability and porosity in the fault zone drops almost to zero (Fig. 2.4). Within the
compaction zone further from the fault porosity was less than 10% and permeability
was about 10mD. Farther out, at a distance of just 5–6mm, porosity was 26% and
permeability was 1,200 mD (average matrix values).
Fig. 2.5 displays permeability change in the direction perpendicular to the lam-
ination. Within the narrow zones adjacent to the destruction zones, the parallel
permeability kjj shows positive peaks, whereas the perpendicular permeability k?displays negative peaks, i.e., a decrease in the destruction zone.
Thus, not every fault causes an increase in porosity and permeability. In the
transition zone from the elastic to the plastic deformation, a decrease in both po-
rosity and permeability is observed. Drastic permeability anomalies emerge at the
boundary between plastic and rupturing deformations. Depending on the lithology,
direction, and type of the fault, these anomalies may have different signs. Perme-
ability and porosity in fault zones also depend on the conditions and the extent of
Fig. 2.4. Mesozoic Entrada sandstone, UT, USA. Permeability and porosity across a fault zone (after
Antonellini and Aydin, 1994). (Courtesy of the American Association of Petroleum Geologists.)
RESERVOIR ROCKS 27
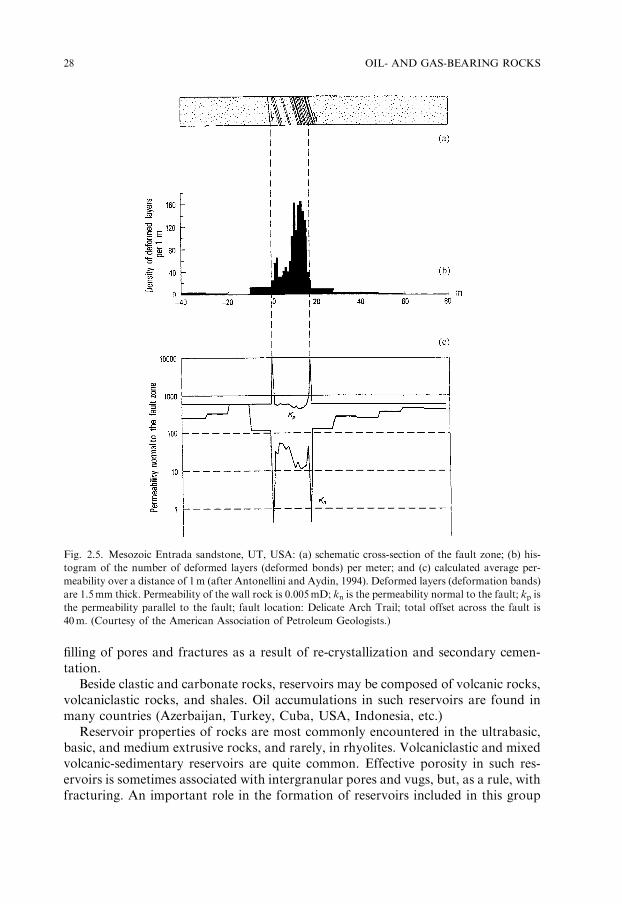
filling of pores and fractures as a result of re-crystallization and secondary cemen-
tation.
Beside clastic and carbonate rocks, reservoirs may be composed of volcanic rocks,
volcaniclastic rocks, and shales. Oil accumulations in such reservoirs are found in
many countries (Azerbaijan, Turkey, Cuba, USA, Indonesia, etc.)
Reservoir properties of rocks are most commonly encountered in the ultrabasic,
basic, and medium extrusive rocks, and rarely, in rhyolites. Volcaniclastic and mixed
volcanic-sedimentary reservoirs are quite common. Effective porosity in such res-
ervoirs is sometimes associated with intergranular pores and vugs, but, as a rule, with
fracturing. An important role in the formation of reservoirs included in this group
Fig. 2.5. Mesozoic Entrada sandstone, UT, USA: (a) schematic cross-section of the fault zone; (b) his-
togram of the number of deformed layers (deformed bonds) per meter; and (c) calculated average per-
meability over a distance of 1m (after Antonellini and Aydin, 1994). Deformed layers (deformation bands)
are 1.5mm thick. Permeability of the wall rock is 0.005mD; kn is the permeability normal to the fault; kp is
the permeability parallel to the fault; fault location: Delicate Arch Trail; total offset across the fault is
40m. (Courtesy of the American Association of Petroleum Geologists.)
OIL- AND GAS-BEARING ROCKS28

belongs to the fractures formed as a result of weathering and leaching (in particular,
hydrothermal leaching). High-quality reservoirs in such sequences, however, are
sporadic. One may encounter very diverse oil flow rates in the adjacent wells, from
almost nil in one well to a few thousand tons a day in the next one.
Shaly sequences are very common. The shales serve as a confining medium or
local seal, whereas the reservoir rocks within the shales consist of lenses and inter-
beds of sands, sandstones, and carbonates. At the beginning of the 20th century,
oil and gas flows were obtained from fractured schists in California, in some other
areas of the world, and from the bituminous shales of Bazhenov Formation in
western Siberia. As a rule, shales serving as reservoir rocks were significantly altered
during catagenesis and are in effect in-between shales and schists. Klubova (1984)
stated that these shales/schists ‘‘are mostly composed of illite, include significant
amounts of dispersed organic matter, and are silicified. Commercial capacity of
these rocks is due to the presence of a rigid silica frame and of organic matter sorbed
by clay minerals. Organic matter makes the surface of clay mineral monocrystals
hydrophobic, thereby making the contacts between these crystals and with
other rock microcomponents easy to separate, with subsequent release of the con-
tained oil’’.
With respect to the Bazhenov shales in particular, Klubova concludes that mi-
crotextural non-uniformity of the Bazhenov shales results in the presence of weak-
ness zones and resulting porosity. Zones of weakness are clearly observable in thin
sections and are sometimes misinterpreted as fractures. The separation of the rocks
along these zones of weakness causes rock fragmentation, i.e., leads to the same
results as fracturing. Despite a rather rigid silica frame in Bazhenov shales, their
plasticity is quite high, resulting in a low degree of fracturing (o10 fractures/m)
(Klubova, 1984).
Zones of weakness in the Bazhenov Formation have been finalized at the dia-
genetic stage, whereas the separation of these zones and the appearance of poro-
sity (fractures) occurred in tectonically active areas during the catagenetic stage
(Klubova, 1984).
Of course, the catagenesis (or epigenesis2) affects the reservoir properties not only
of shales but also of many other reservoir rocks. A systems treatment involves an
analysis (effects of individual factors) first and, then, synthesis. Before doing this,
however, one must review one more component of petroleum sequences, namely,
seals (caprocks).
2.3. CAPROCKS
For a long time, the only force causing the movement of oil and gas in the sub-
surface was believed to be buoyancy. If so, then to form oil and gas accumulation,
their migration paths must have been stopped by a roof, i.e., caprock (seal). Clays,
shales, carbonates, evaporites, and their combinations can form caprocks. Dobrynin
2Epigenesis includes all processes that affect already formed sedimentary rocks after diagenesis.
CAPROCKS 29

and Serebryakov (1989) determined that the lowermost limit of permeability in the
reservoirs was 10�15–10�16m2, whereas the permeability in young argillaceous cap-
rocks was 10�20m2.
The same rocks react differently to different fluids. In some cases, rocks serve as
satisfactory or good conduits for water, but form barriers for oil or gas movement.
In some other situations rocks yield oil but stop gas movement, etc. This is deter-
mined by capillary forces, the magnitude of which depends on fluid and rock prop-
erties (fluid density, fluid viscosity, rock structure, rock wettability) and pore size
(capillary forces almost disappear when the pore diameter exceeds 0.5mm). Ac-
cording to the Laplace’s law,
pc ¼ 2d=r (2.12)
where pc ¼ the capillary pressure, d ¼ the surface tension, and r ¼ the surface cur-
vature radius (at a pore diameter o 0.1mm). For fractures, the equation has the
following form:
pc ¼ 2d cos a=w (2.13)
where w is the fracture opening (width) and a is the contact angle.
All aforementioned rock and fluid properties are strongly affected by the sub-
surface temperature and pressure and geochemical environment.
The writers propose the following definition of caprock: caprock is a rock that
prevents the flow of a given fluid at a certain temperature and pressure and geo-
chemical conditions. Therefore, the necessary properties of a rock to act as a seal will
be different for different fluids. The same rock with different fluids may or may not
have sealing properties up to a complete inversion (caprock - reservoir). I. M.
Mikhailov, B. I. Yakovlev and N. A. Eremenko (in: Eremenko, 1978) proposed the
following three types of caprocks.
Type I caprocks are typical for argillaceous sequences in a state of continuing
compaction; they are developed in areas of young subsidence of Earth’s crust, with
abnormally high pore water pressure. Sealing properties of these rocks are deter-
mined by the amount of capillary pressure at the contact of the reservoir and cap-
rock, the pore pressure of water saturating the caprock, initial pressure gradient of
water and the variation of hydraulic forces in the section. Sealing property,
or caprock breakthrough potential (Pbreakthrough), may be presented as follows
(Fig. 2.6):
Pbreakthrough ¼ Pb ¼ Ppw þ Pc þ Gwah (2.14)
where Ppw ¼ the maximum pore water potential in caprock, Pc ¼ the capillary
pressure of breakthrough into the caprock, Gw ¼ the initial water pressure gradient
in caprock, h ¼ the seal thickness, and
a ¼1
2
Pw:u:layer � Pw:l:layer
Gwhþ 1
� �
OIL- AND GAS-BEARING ROCKS30

is the coefficient determining the distance between the base of the caprock and the
surface of maximum pore pressure. In this expression, Pw.u.layer and Pw.l.layer are,
respectively, the water potentials of the upper and lower layers.
Oil and gas accumulations have higher potential energy than that of the formation
water. These accumulations can be stable only if this energy is equal to or less than
the caprock breakthrough energy, i.e., Pb � Pa, where Pa is the total potential energy
of the accumulation. Total potential energy of the accumulation may be determined
from the following equation:
Pa ¼ Pwr þ
Z h
0
DgðhÞH � GoH (2.15)
Fig. 2.6. Diagrams of caprock breakthrough potential: (a) Type 1; (b) Type 2; and (c) Type 3. (In:
Eremenko and Chilingar, 1996.)
CAPROCKS 31
where Pa ¼ the total potential energy of the accumulation, Pwr ¼ the water potential
in the reservoir rock, Dg ¼ the difference in fluid densities, Go ¼ the initial oil pres-
sure gradient in the reservoir rock, and H ¼ the height of accumulation column.
Maximum possible height of accumulation column may be determined from
equality of the breakthrough potential and the accumulation energy by solving to-
gether the above two equations. Provided the reservoir fluid densities are constant,
the maximum height (H) of the oil column is equal to
H ¼Pa � Pwr þ Goahþ Pc
Dg� Go
(2.16)
Pore water pressure in compacting argillaceous beds is always greater than the
pressure in the adjacent reservoir beds. As a result, sealing capability of the Type I
caprocks is determined by hydraulic sealing, by the amount of capillary pressure,
and by the pressure at which water begins to flow through caprocks. Just the cap-
illary pressure alone in such caprocks (groups A and B, of Khanin, 1976) may exceed
100 kg/cm2. This means that the Type I caprocks is capable of confining an oil
accumulation having almost any column height. Dobrynin and Kuznetsov (1993,
p. 106) proposed the following correlation between the accumulation column height
Dha and caprock thickness Dhseal:
Dha ¼ f ðDhsealÞ (2.17)
where f depends on temperature. At 401C in gas accumulations, f � 4, whereas in oil
accumulations, f � 17. At 601C in gas accumulations, f � 2 and in the oil accu-
mulations, f � 7.
It appears that a statement by Buryakovsky et al. (1990, p. 186) that ‘‘sealing capabil-
ity of argillaceous caprocks does not depend on their thickness’’ describes only the
aforementioned caprock type. Similar statements were made by Kontorovich et al.
(1975) and Nesterov and Rylkov (1986).
Type II caprocks are associated with rocks compacted beyond the plasticity limit
and having lost ability to swell on contact with water. Such rocks do not contain
swelling clay minerals, and interstitial water contains surfactants. Consequently,
pore water in these rocks does not have initial pressure gradient. This type of cap-
rocks is encountered mostly in the Paleozoic and Mesozoic sediments of young and
old platforms. There are no clear-cut overpressure environments there, but there is a
relatively clear hydrodynamic subdivision in the section. The breakthrough potential
(Pb) for the Type II caprocks is a sum of capillary pressure (Pc) and hydrodynamic
forces:
Pb ¼ Pw:u:layer þ Pc (2.18)
where Pw.u.layer is the water potential of the upper layer (i.e., layer above the cap-
rock).
Maximum accumulation column height H can be determined as follows:
H ¼Pw:u:layer � Pw:l:layer þ Pc
Dg� Gw
(2.19)
OIL- AND GAS-BEARING ROCKS32
Eq. 2.19 shows that the hydrodynamic environment may improve or lower the
sealing capability of caprocks. In an extreme case, the water potential in the reservoir
may exceed the water potential of the bed overlying the caprock by the value of
capillary pressure (Pc). In such a situation, the caprock will be open for the vertical
flow of hydrocarbons, and the trap will not exist even when potential distribution in
the reservoir bed is favorable.
Type III caprocks are typical for rocks with a rigid matrix and intense fracturing.
Such caprocks are mainly developed over the old platforms in regions of low tectonic
mobility, with no detectable hydrodynamic breakdown of the section. Formation
water potential in such regions is practically equal throughout the section and cor-
responds to the calculated hydrostatic potential. The breakthrough potential for
such caprocks is determined solely by the capillary pressure:
Pb ¼ Pwr þ Pc (2.20)
The possible height of accumulation column is
H ¼Pc
Dg� Go
(2.21)
The equation above indicates that even at a low capillary pressure the accumu-
lation column height may be significant when Go is close to Dg (the gradient of
Archimedes buoyancy force). If these gradients are equal, the accumulation may be
preserved even in the absence of a definitive lithologically identifiable caprock. Pc in
the equations above may be calculated using the Laplace equation.
Major conclusions from the studies of correlation between clay mineralogy and
their sealing properties have been summarized by Klubova (1984) as follows:
The permanency in the composition of the silicate layer is a characteristic of the kaolinite
group minerals. As a result, replacements within the lattice are very rare and the charges
within a layer are compensated. The connection between silicate layers in the C-axis di-
rection is implemented through hydrogen atoms, which prevents the lattice from expanding,
ruling out the penetration of water and polar organic liquids.
The silicate layer in the montmorillonite mineral group is variable due to a common iso-
morphic replacement in octahedral and narrower tetrahedral sheets. This replacement results
in the disruption of the lattice neutrality. Extra charge that occurs with such replacements is
compensated by exchange ions. Ion properties that maintain lattice neutrality in montmo-
rillonite minerals (valence, size of the ion radius, polarization, etc.) define the capability of the
lattice to expand along the C-axis. As a result, water and polar organic liquids can penetrate
the interlayer spaces. This, in turn, leads to an increase in the volume, which drastically lowers
permeability and some other properties, but at the same time improves sealing capabilities.
The silicate layer of the illite mineral group is similar to the montmorillonite one. However,
the excessive negative charge of the lattice is due mainly to the isomorphic replacements
within tetrahedral sheets. The proximity between the source of negative charge and basal
surfaces causes a stronger connection between the silicate layers of illite group compared to
montmorillonite’s.
Admixture of sand and silt degrades the sealing properties of clays. Especially
important are the textural changes due to this admixture.
Not only the mineral composition of a rock and organic matter content, but also
the pore water are important in forming the major sealing properties of clays, such as
CAPROCKS 33

degree of swelling and compressibility. The relatively low-temperature pore water is
retained in argillaceous rocks up to a temperature of 100 1C to 150 1C. The temper-
ature of water removal is higher when the concentration of dissolved components is
higher. Pore water is located within pores of argillaceous rocks, and at the surfaces
and along the edges of individual microblocks and microaggregates that comprise
clays. The interlayer water causes swelling in montmorillonites and in degraded illites.
The order in water molecules positioning, relative to the clay–mineral blocks and
aggregates, is rapidly altered with an increase in distance between these blocks and
aggregates. Thus, a very important information for the evaluation of the role water
plays in the formation of sealing properties is the knowledge of the structural status
of the layer in an immediate contact with the particles’ surface, and the role the
cations having different charge density play in the preservation of water molecules’
structure.
Exchange ions play a leading role in the formation of ‘‘water clouds’’ around
microaggregates and microblocks of montmorillonite minerals and an insignificant
role, with kaolinite minerals. The role played by the illite group minerals occupies an
intermediate position.
Carbonates caprocks include micro- and fine-grained, massive and laminated
limestones. Almost all limestones are dolomitized to some extent and are subject to
fracturing. This adversely affects their sealing properties (Bagrintseva, 1977). Car-
bonates with a substantial clay content have laminated texture. As a rule, this results
in a deterioration rather than an improvement of sealing properties due to the
emergence of weakness zones at the contact between different lithologies.
Evaporite seals, which are common, include salt, anhydrite, and sometimes shales.
It is a common (and probably erroneous) belief that such seals are the best and most
reliable. Brittleness of these rocks at the surface conditions contradicts that belief.
Besides, cores recovered in the Dnieper-Donets Basin and North Caspian Basin
display macro- and microscopic fractures, which sometimes cut monolithic salt
crystals. The fractures may be healed by secondary salt, but often contain traces of
oil and sometimes gas bubbles. Sometimes core samples are completely saturated
with oil. Permeability measured at the surface conditions can reach 100–150mD and
even higher. It was established, however, that these rocks easily become plastic even
at a relatively low hydrostatic or, even, uniaxial pressure (o100MPa) and the
properties change with temperature. Allen and Allen (1993, pp. 364, 368) considered
plasticity as an important sealing property. In this connection, they believe that salt
has the best sealing properties. They also believe that the reliability of caprock is not
directly related to its thickness.
Thus, properties of evaporites as seals change widely during the catagenesis (and
in time). Similar changes also affect the other types of seals albeit not so obviously.
Inclusions, such as organic matter, silt, clay or carbonate particles degrade sealing
properties of evaporites due to the formation of zones of weakness around such
inclusions (Klubova, 1984). A careful study of numerous logs from Dnieper-Donets
Basin showed the presence of clay interbeds between the top of accumulation and the
evaporite sequence in all cases. It appears that these interbeds in most cases act as
caprock.
OIL- AND GAS-BEARING ROCKS34
2.4. OIL AND GAS RESERVOIRS
The natural subsurface reservoir is a container of oil, gas, and water where they
can move, and its shape is determined by the relationship between the reservoir rock
and its surrounding poorly permeable rocks (Brod, 1950, 1957). Levorsen (1967)
defines the subsurface reservoir as only that part of the reservoir rocks where the oil
and natural gas can form an accumulation. Many authors tend to tie the notion of
oil and gas reservoir to its content of hydrocarbons (Trofimuk et al., 1980;
Kuznetsov, 1992). This appears redundant to the writers because the presence of oil
or gas is not a vital property of the subsurface reservoir. The natural reservoir
remains as such regardless of the type of the contained fluids, or even if it is dry. A
comparison can be made with the overpressure. The presence of fluids is necessary
for the overpressure. No fluids of different densities, no surplus pressure. As for the
reservoirs, the writers agree with Kuznetsov who stated that ‘‘they possess two
important attributes: spatial limitation (which determines the volume and bound-
aries of the reservoir), and an internal structure that defines the type and nature of
inter-reservoir migration’’ (Kuznetsov, 1992, p. 15).
Indeed, these properties should be included in any definition of the reservoir as
well as in the classifications being developed. Some attempts have been made to
classify the oil and gas reservoirs on the basis of their relative size (local, zonal,
basin-wide, regional, etc.) (Burlin et al., 1976; Kontorovich, 1991) or their absolute
size (Weber, 1986; Allen and Allen, 1993).
Three types of reservoir limitations can be identified: reservoir roof lateral, and reservoir base (bottom).
The reservoir roof (top) may cover the reservoir (1) in normal stratigraphic suc-
cession, (2) with some depositional hiatus, and (3) may change its age along the
strike. It is improbable but not impossible that a reservoir may be capped by the
surface of an impermeable overthrust. It should be kept in mind the selectivity
toward different fluids by caprock and a possibility of its transformation into a
reservoir rock during epigenesis. Consequently, it is always important to indicate the
exact nature of the fluid. The transformation of the caprock into a reservoir rock
results in either disappearance of the reservoir or its conversion into a new reservoir
(if there is another caprock above).
Lateral limitations are caused by lithologic alterations (including cementation)
and the permeability. Small accumulations may be laterally limited by faults. This is
possible, but not typical, for the larger reservoirs, because the fault zones in their
evolution can become migration paths for various fluids (oil, water, or gas). Fault
zones are actually ‘‘communication windows’’ with the other reservoirs.
The importance of the presence of the base (bottom) as a necessary reservoir
component was not always clearly recognized, because it was believed that the ac-
cumulations were formed exclusively by the buoyancy (Archimedes forces). One
must always keep in mind that the reservoir is an inseparable part of the hydro-
dynamic system. This system may be open or with a restricted communication to the
OIL AND GAS RESERVOIRS 35

surface (artesian), or of ‘‘elision’’ type (i.e., with an inverse pattern of hydrostatic
pressure). It is not possible for such energy system to exist without a base (bottom).
Often, no distinction is made among the terms: ‘‘reservoir rock’’, ‘‘reservoir’’, and
‘‘trap’’. These terms are defined below:
Reservoir rock is a rock capable of containing oil and gas and yielding them
during production. The reservoir rock is characterized by: rock type; permeability
type (intergranular, fracture, and/or combination of the two); the total, intercom-
municating, and effective porosity; specific surface area; wettability of rock (oil-wet
versus water-wet); fracture type (width, etc.); and fracture distribution.
Reservoir is a natural subsurface container for oil, gas, and water. Its existence is
predicated on the relationships between the reservoir rock and associated poorly
permeable rocks. Reservoir is characterized by reservoir-rock type, relationship with
impermeable rocks, reservoir capacity, its hydrodynamic conditions, reservoir en-
ergy, and structure.
Trap is part of the subsurface reservoir where an oil or gas accumulation can form
and be preserved. Its parameters include the reservoir type, reservoir-rock type,
conditions of its formation, structure, and capacity. In a special case where the
reservoir is lithologically limited from all directions, its parameters may coincide
with those of the trap (i.e., the entire reservoir is represented by a single trap).
The following features are used in describing a reservoir: (1) type of the reservoir
rock comprising the reservoir; (2) relationship between the reservoir and the sur-
rounding impermeable rocks; (3) reservoir capacity; and (4) depositional environ-
ment. In terms of the relationship between the reservoir and its surrounding
impermeable rocks, Brod (1957) proposed to identify three major types of the res-
ervoirs: bedded, massive, and lithologically limited in all directions. A similar clas-
sification, with characterization of the reservoir energy, was proposed by Eremenko
(1941, Table 2.1).
Bedded reservoir is a reservoir that is restricted at its top and base by low-
permeable rocks. The reservoir rock thickness in such a reservoir is more or less
TABLE 2.1
Classification of reservoirs
Reservoir type Stratigraphic position Direction of oil and gas
flow
Possible maximum
energy accumulated in
oil and gas
Bedded Consistent with
stratigraphy
Along the bedding Insignificant
Bedded, fault blocks
(differentiated)
Consistent with
stratigraphy
Restricted but possible
in any direction
Much greater than in the
bedded; may be even
major
Massive Inconsistent with
stratigraphy
Vertical Significant, rarely
insignificant
Lithologically limited
from all directions
Consistent with
stratigraphy
Locally restricted Major
OIL- AND GAS-BEARING ROCKS36

constant over significant areas. Still, a substantial thickness change can occur locally
or at the edge of the reservoir development, which may result in a pinch-out of the
reservoir rock. The reservoir rocks in bedded reservoirs are usually lithologically
continuous, but may have a more complex nature. A bedded reservoir may have a
single hydrodynamic system.
Reservoir energy in bedded reservoirs is distributed in accordance with the hy-
drostatic or hydrodynamic environment of the artesian basins. However, reservoirs
with that kind of energy distribution are typical only for the uppermost portion of
the sediment cover. As a result of subsidence and sediment compaction and various
secondary geochemical processes, reservoirs may be separated into diverse portions
as a consequence of previously described phenomena.
Leaving aside changes in the sediment composition, drastic changes occur in the
major reservoir-rock properties (porosity and permeability). Even if prior to sub-
sidence the reservoir rocks were reasonably uniform in terms of porosity and per-
meability, subsequent to subsidence non-uniformities appear between various
portions of reservoir so that they may turn out to be totally separated from one
another. An indication of such a change may be a change in a hydrodynamic drive
from artesian to ‘‘elision’’ type and the appearance of abnormally high pressure. The
beginning of the process involves (1) lateral fluid migration, and (2) gradual change
in the reservoir energy. Potential energy of the accumulations relative to the total
energy of the reservoir is small. As the sheet-type reservoir differentiates, lateral
migration becomes increasingly more obstructed, with formation of numerous hy-
draulic fractures. Fluid migration from the reservoir to other favorable zones (if they
are available) may become prevalent. An increase in the elastic potential energy is
observed (Abnormally-High Formation Pressure, AHFP). Energy distribution be-
comes discrete. The difference in potential energy between the accumulations and the
reservoir as a whole becomes smaller, and within some zones (blocks) they become
identical.
Thus, it is reasonable to recognize a separate type, i.e., differentiated sheet-type
reservoir, which under certain circumstances becomes a bedded reservoir.
Massive reservoir is a thick permeable sequence overlain at the top and restricted
from the sides by low-permeable rocks. Its bottom may be at a depth that has not yet
been penetrated by wells (e.g., Tengiz Field, Kazakhstan). Reservoir rocks com-
prising massive reservoirs may be homogeneous or heterogeneous. Homogeneous
massive reservoir rocks may be carbonates and metamorphic or volcanic rocks.
Their porosity and permeability is due to the presence of vugs and fractures. Porous
and permeable zones in massive reservoir rocks are not stratigraphically related.
Isolated high-porosity and high-permeability zones cutting through stratigraphic
surfaces within a body of a massif are common.
Buried reefs are often assigned to this reservoir type. Among the best examples are
the Ishimbay group of fields in Bashkortostan, Russia, and Rainbow Oilfield in
Alberta, Canada. Usually, the thickness (height) of massive reservoirs is greater than
the width. The length of possible vertical fluid migration is similar or greater than the
lateral migration within the beds. The flanks of the reservoir and its contacts with the
contemporaneous sediments are steep (thus, the biostromes should be classified as
OIL AND GAS RESERVOIRS 37

the sheet-type (bedded) rather than the massive-type reservoirs). Inasmuch as the
bioherms are very similar to reef buildups, they should be considered as massive
reservoirs.
To form a trapping mechanism, beside the caprock, the massive reservoirs require
isolating steep lateral limitations. As an example, numerous present-day coral reefs
in the Indian Ocean do not form subsurface reservoirs not only because of the
absence of caprock, but also due to the absence of lateral barriers (lateral isolation).
Fresh water accumulating within such bodies floats on the surface of heavier sea-
water.
The hydrodynamic system of the massive reservoirs is poorly studied. It is possible
that they communicate at depth with the bedded (sheet-type) reservoirs and are, in
effect, just a veriety of a sheet-type reservoir.
Reservoirs lithologically limited from all directions include all types of reservoirs
where the liquid or gaseous hydrocarbons present from the time of formation of the
reservoir are surrounded from all directions with practically impermeable rocks.
Fluid movement within such reservoir is limited by its size. There is some superficial
similarity between the massive reservoirs and the differentiated sheet-type reservoirs.
The similarity is in the limitation (lithologic isolation). The difference is in the timing
of the emergence of the latter. The massive reservoir is a result of depositional
processes, whereas the differentiated sheet-type reservoir is a result of stresses during
the basin subsidence. The former type is originally small (certainly, any bed is a large
lens, but this approach is not used here). The latter type is a separate portion of a
previous, possibly large hydrodynamic system. Prevalent elastic energy is typical for
both, but the latter type of reservoirs has a greater stress level. The capacity of any
type of reservoir is defined by its size and reservoir-rock properties. Energy of a
reservoir is associated with its capacity, and the energy is what is important for the
extraction of oil and gas (and associated water).
The identification of the above four reservoir types is tentative, because such well-
rooted concepts as reservoir rock and caprock (fluid barrier) are also tentative. Even
in the same state, the same rock may be a fluid barrier to one fluid and a reservoir
rock to the other, depending on the physicochemical properties of fluids and rocks
(especially, wettability), and on the subsurface temperature and pressure. For in-
stance, a prominent projection of a massive reservoir may be just a complication of a
regional sheet-type reservoir and be a part of the same hydrodynamic system. This
phenomenon is especially common in carbonate sequences. It is possible to imagine a
conversion of a sheet-type differentiated (block) reservoir into a massive reservoir if
the caprock loses its sealing properties over a fault or flexure. The hydrocarbon
accumulation may then occur underneath another, shallower caprock.
OIL- AND GAS-BEARING ROCKS38

Chapter 3
TEMPERATURE AND PRESSURE IN THE SUBSURFACE
3.1. DEFORMATION OF ROCKS IN DEPTH
3.1.1. Porosity and permeability versus depth of burial
Porosity and permeability of the uncompacted rocks decreases, and density
increases with depth. Compaction of the South Louisiana Tertiary sands (Fig. 3.1) is
a classical example. Sediments experience the total pressure of the overburden (rocks
plus fluids), pt, upon burial. Terzagi determined the overburden pressure (accounting
for lateral compression) as follows:
pt ¼1
3Drg 1þ
2d
ð1� dÞ
� �
(3.1)
where D ¼ the depth, r ¼ the density, g ¼ the gravitational acceleration, and
d ¼ the Poisson’s ratio. If, to take lateral stress into account, water is taken as a bed
model (its Poisson’s ratio is 0.5), Eq. 3.1 is simplified to
pt ¼ Drg (3.2)
This equation is most common in practical applications.
The rocks under overburden pressure tend to compact, whereas formation
pressure (fluid pressure) resists such compaction. Thus, compaction occurs due to
effective pressure (pe), which is equal to the total overburden pressure (pt) minus the
fluid or pore pressure (pp):
pe ¼ pt � pp (3.3)
Fig. 3.1. South Louisiana, USA. Compaction of unconsolidated Tertiary sands with admixture of clay
(after P. A. Allen and J. E. Allen, 1990).
39

The effective stress (pe) determines the degree of compaction. Of importance here
is the escape of water occupying the pore space (mainly upward). This process is
determined by the permeability that changes with degree of lithification. Naturally,
during burial different rocks compact differently. Fig. 3.2 shows compaction for
different rock types. Sometimes, argillaceous rocks are more compactable than
sandstones (also see Rieke and Chilingarian, 1974; Chilingarian and Wolf, 1975,
1976). Shale compaction is significantly affected by mineralogy. Fig. 3.3 shows
changes occurring in montmorillonite, illite, and kaolinite clays upon compaction.
Numerous experiments established that the most rapid water loss (hence
compaction) occurs during the initial burial of sediments to a depth of 25–30m.
During this stage, the sediments lose 50–60% of their originally contained water.
Consequently, the compaction rate significantly slows down. Most of the sediment
compaction occurs at a depth of 600–800m. After that, the process becomes almost
imperceptible. Moreover, reservoir pressure increases due to the decrease in
permeability and consequent decrease in the rate of water escape. Thus, under-
compacted rocks form in some areas. Their major characteristic is the anomalously
high pressure. The change in the clay’s water content causes modifications in the clay
texture. Mutual orientation of mineral microblocks and microaggregates changes.
Also, the deflocculated clays are capable of plugging pores, pore throats, and canals,
thereby significantly decreasing the reservoir–rock permeability.
Carbonates in the process of compaction also lose water, and rapidly change from
the domain of plastic deformations into the domain of disruptive deformations. This
results in microfracturing, and the rock that was a seal may become a reservoir. The
carbonates with argillaceous and organic matter components usually have laminated
Fig. 3.2. Compaction of clays and sandstones (after Allen and Allen, 1990) 1 – Oklahoma (clay);
2 – Venezuela (clay); 3 – North Sea (clay); 4 – North Sea (sandstone); 5 – South Louisiana (sandstone).
TEMPERATURE AND PRESSURE IN THE SUBSURFACE40

Fig. 3.3. Compaction history of various clays when deposited in marine environment and its probable relation to release of hydrocarbons from shales (after
Powers, 1967, Fig.3, p. 1245).
DEFORMATIO
NOF
ROCKSIN
DEPTH
41

texture. This on the one hand, improves their sealing capacity due to increased
plasticity. On the other, non-uniform mineral composition and lamination result in
the increased anisotropy and deterioration of their sealing capacity.
Experiments conducted by Savchenko and Bereto (1977) showed increased
plasticity of evaporites under hydrostatic and, even, uniaxial pressure (Fig. 3.4).
Much higher plasticity of salt compared to anhydrite was recorded. Evaporite
plasticity increases as temperature increases. An example of the effect of temperature
on salt plasticity is presented in Fig. 3.5.
3.1.2. Temperature
Temperature affects the physical (see Fig. 3.5) and physicochemical properties of
rocks. It distorts the molecular bonds up to a total disruption, accelerates the
Fig. 3.5. Salt deformation diagram under non-uniform triaxial stress (after Pavlova, 1970). 1–3 —
Effective stress: 1–25MPa at 201C; 2–50MPa at 501C; 3–100MPa at 1001C.
Fig. 3.4. Stress vs. strain in: (1) salt and (2) anhydrite (after Savchenko, 1977). Circled figures are
confining (hydrostatic) pressures (MPa). 1 ¼ upper curve, 2 ¼ lower curve.
TEMPERATURE AND PRESSURE IN THE SUBSURFACE42

molecular motion, overcomes the temperature threshold of reactions, and increases
the rate of chemical reactions. Thus, temperature affects the results of postdeposi-
tional processes in rocks during diagenesis and catagenesis.
With increasing temperature, different minerals (aggregates) comprising the rock
expand differently according to their particular heat expansion coefficients. This
phenomenon causes diverse consequences. The pore diameter and volume of pores
should decrease causing a decrease in porosity and permeability. This, however, does
not usually happen. T.T. Klubova (personal communication) believes that this is due
to compaction of pore cement. Cement in the pores is supported by the rock particles
and only slightly reacts to the net overburden pressure (effective stress). If cement
does not completely fill the pores, it may have experienced only the reservoir
(hydrostatic) pressure. When the temperature increases, cement compacts releasing
the water. As a result, the pore volume increases exceeding its slight decrease caused
by the temperature expansion of component minerals (heat expansion coefficients of
rocks are very low).
On the other hand, heat expansion coefficients for liquids and gases are several
times greater than those for rocks. The expanding fluids must either move into a
different space (if available) or compress according to their compressibility, i.e., in
fact to accumulate the elastic potential energy. This is how abnormally-high
formation pressure (AHFP) occurs. Comparing AHFP with the excess pressure, one
must distinguish the difference in their emergence and existence. AHFP emerges due
to the accumulation of elastic potential energy and disappears when the stress is
relieved (the energy dissipates). The emergence of the excess pressure is associated
with the gravity division of fluids (water, oil, and gas) with different densities, and
disappears when the density difference disappears (e.g., removal of one of the fluids
and mutual dissolution at high temperature). This process occurs in the formation in
a non-uniform way because of lithological variability. As a result, energy non-
uniformity (difference in energy potentials) arises. One should recall that porosity
and permeability change upon formation of fractures (Fig. 2.4). Porosity and
permeability drastically decrease within the plastic deformation zone, and the rock
becomes non-uniform energy-wise. The difference of energy potential, which is the
major cause of fluid flow, causes additional stresses in the rocks. Thus, some changes
in the texture of subsurface rocks is possible. Energy-wise, the rock particles will
attempt to occupy a more favorable position in the new energy environment.
Changes in the orientation of mineral aggregates in the rock will affect its magnetic
properties.
Klubova (1984) conducted experiments on bentonite samples under different
confining pressures. Natural moisture content of the samples was 12.5%. The
original sample was subjected to a confining stress of 50MPa at 201C. The particles
in the compacted sample became flatter and lost their original texture. The changes
were even more pronounced in the sample compacted at 200MPa. There was a
further microblock separation and development of a more orderly texture. Klubova
found that changes in the texture and an increase in zones of weakness in clays
studied were affected more by the changes in temperature rather than changes in
pressure.
DEFORMATION OF ROCKS IN DEPTH 43

Formation of AHFP lowers the effective pressure and results in the emergence of
undercompacted rock zones. AHFP is non-uniformly and discretely distributed in
rocks. That is why mapping of AHFP using uniform interpolation (and even more
so, extrapolation) is not recommended.
It may be stated that
VAHFP ¼ V elast � V relax (3.4)
where VAHFP ¼ the rate of formation (or destruction) of AHFP, Velast ¼ the rate of
formation of elastic stresses and Vrelax ¼ the rate of stress relaxation.
This equation clearly shows all conditions for the formation or destruction of
AHFP. It can only exist while the conditions for the formation of elastic stresses are
present, and the rate of the formation (accumulation) of elastic energy is greater than
the relaxation rate. A horizontal stress of 10MPa at a depth of 1000m will dissipate
after 1 million years only due to diffusion (at a very low diffusion rate of 10�7) (V.A.
Sokolov and V.F. Lipetskiy, personal communication).
If stress in the rock matrix exceeds the plastic limit, the rock begins to fracture. As
mentioned before, despite an insignificant decompaction (the fracture porosity is
low), the permeability will drastically increase. In her compaction experiments using
hydrostatic compaction apparatus, N.N. Pavlova (personal communication) found
only 10–12% decompaction and increase in permeability.
Stress relaxation in rock matrix occurs through fracturing whereas reservoir
pressure dissipation is due to the emigration of fluids through the fractures (and
diffusion, but more slowly). The role of the fluids per se in the formation of fractures
also should not be forgotten. Of particular significance here is water, which is a
medium with the lowest compressibility. As a result, a very slight increase in the
amount of water within the same pore volume results in a significant increase in
pressure. The low compressibility of water makes it play a very important role in the
formation of hydraulic fractures.
It was long and erroneously believed that a high pressure is necessary for
hydraulic fracturing (overburden pressure plus additional pressure to overcome the
rock strength3). This would be correct if the rocks had rigid, non-deformable matrix.
The information derived from the practical applications of hydraulic fracturing (tens
of thousands) indicates that hydraulic fracturing may be achieved at just 0.5–0.75 of
the overburden pressure. The reason is that the rocks compress under the effective
pressure. Rocks compact as a result of (1) decrease in the volume of water-filled
pores, (2) temperature increase, and (3) relative increase in the volume of water due
to its slow escape (low permeability). As a result, reservoir pressure significantly
increases, causing hydraulic fracturing. The orientation of fractures is determined by
zones of weakness in rocks (most often, bedding planes) and by the spatial position
of a zone with the minimum (hydrostatic) reservoir pressure. Most commonly,
fracturing occurs in the overlying or underlying reservoir rocks. The emerging
difference in the reservoir pressure between the shales and reservoir rocks may be, as
Buryakovsky et al. (1990, p. 187) pointed out, an additional reservoir energy source
3Young’s modulus for sedimentary rocks is in the range of 3–9� 10�14 g/cm2.
TEMPERATURE AND PRESSURE IN THE SUBSURFACE44

for the field development (compaction drive). Transitional zones may form at the
boundary, involving additional compaction in the reservoir rocks and under-
compaction in the caprocks.
Rocks are quite heterogeneous and are in an unstable state in the subsurface.
They are further destabilized because of non-uniform temperature distribution. Even
on considering formation temperature as resulting from the heat flow, and even if the
heat flow in the area is constant, the temperature of rocks will differ in different parts
of the area. Heat flow is related to the temperature drop as follows:
ql ¼ ldT
dD(3.5)
where ql ¼ the conductive heat flow (MW/m2), l ¼ the heat conductivity (W/m 1C),
dT and dD ¼ the temperature and depth differences (1C and m, respectively).
Heat conductivity depends not only on the properties of rocks, but also on their
oil- or water-saturation, temperature, and pressure. As an example, the heat
conductivity of dry rocks in Belorussia was as follows: clays — 1.02–1.56W/m 1C;
sandstones — 1.34–2.12W/m 1C; limestones — 1.67–3.44W/m 1C (Sergiyenko,
1984). Consequently, the temperature of rocks also changes depending on the
properties of minerals composing the rock and on the water and oil saturations, with
all other variables being equal.
The above discussion shows that temperature affects the sealing properties of
rocks. Table 3.1 shows changes for the most reliable caprocks (Dobrynin and
Kuznetsov, 1993, p. 106). As the table indicates, the necessary caprock thickness
over the oil accumulations at the given temperatures is always higher than over the
gas accumulations. This is mainly due to different interfacial tensions at the oil/water
and gas/water contacts. Some improvement in sealing capacity at 601C as compared
to 401C is due to a decrease in pore diameter and, consequently, to a lower
permeability.
Interfacial tension also depends on temperature:
d ¼ d0½1� oðT � T0Þ� (3.6)
where o is the temperature expansion coefficient (0.002 for the water) and (T�T0) is
the temperature difference (1C).
TABLE 3.1
Type of Dhreservoir ¼ f ðDhcaprockÞ relationship for most reliable argillaceous caprocks of gas and oil
accumulations
T (1C) Accumulation Equation
40 Gas Dhreservoir ¼ 4DhcaprockOil Dhreservoir ¼ 17Dhcaprock
60 Gas Dhreservoir ¼ 2DhcaprockOil Dhreservoir ¼ 7Dhcaprock
Dhreservoir ¼ reservoir thickness;Dhcaprock ¼ caprock thickness:
DEFORMATION OF ROCKS IN DEPTH 45

Changes in temperature strongly affect such rock property as sorption, which
decreases with increasing temperature.
Certain zoning in porosity and permeability distribution is observed in the Earth’s
crust. According to Eremenko et al. (1986), the following vertical zones may be
identified for the platforms:
I. Karst zone
II. Calcite cementation zone
III. Decompaction zone
IV. Gravitational compaction and silica/silicate generation/regeneration zone.
Of greater interest is Zone III, because it contains major oil reserves of the world
and is present in all sedimentary basins.
Fig. 3.6 shows the distribution of the optimum reservoir–rock properties and oil
accumulations in the geologic section. This distribution was presented by Maksimov
and Minskiy in 1972, but is still valid today. Despite some oil and gas discoveries at
great depths, the bulk of the reserves is concentrated between the depths of 1 and
3.0–3.5 km.
The top of Zone III is located at a depth of 1.8 km (average of 32 regions of the
world). Reservoir rocks in that zone are formed mostly due to calcite dissolution,
and the newly-formed fractures are not cemented with calcite. Another favorable
factor is the montmorillonite-to-illite transformation, which is quite intense in Zone
III. Calcite dissolution is due to the decrease in pH of water and the simultaneous
aggressive action of CO2, concentration of which in formation water increases.
Fig. 3.6. Depth distribution of areas of (1) reservoir rocks (OR) and (2) oil accumulations (OA) with
optimum properties (after Maksimov and Minskiy, 1972).
TEMPERATURE AND PRESSURE IN THE SUBSURFACE46

A lower pressure, as compared with the surrounding shales, forms within the
upper portion of the Zone III during subsidence. As mentioned before, the
montmorillonite-to-illite transformation is accompanied by the release of water and
shale loosening, after which shales compact further. Released water (that had been
previously chemically bonded) is chemically aggressive and dissolves various salts as
well as hydrocarbons in the surrounding rocks.
Pressure inversion occurs in Zone IV down the section. Reservoir pressure exceeds
the pore pressure in shales. Silicified reservoir rocks become fluid barriers, whereas
compacted argillaceous rocks experience fracturing and become reservoir rocks.
The described phenomena that occur at elevated subsurface pressures and
temperatures is significantly complicated and intensified because of some other
energy sources. These sources include tectonic stresses, seismic activity, changes in
the energy and magnetic fields, and exothermal reactions of mechanochemical
nature. Minskiy (1975, p. 128) pointed out that ‘‘Domains where reservoir rocks
have optimal properties are most favorable for the phase transitions of hydrocarbons
due to the decline of pore pressure in reservoir rocks. Salt concentration in formation
water changes, which,y, facilitates the release of hydrocarbons as a free phase and
the concentration of its emulsions.’’
Obviously such processes vary in different regions. Fig. 3.7 illustrates this process
for the Lower Cretaceous Travis Peak Formation, Texas (Dutton and Diggs, 1992).
As a result, porosity decreased from 40% to a few percent and permeability
decreased from over 100 to 0.0001mD at a depth of 3500m. At the same time,
cement content increased from about 20% at a depth of 2000m to 35% at 3500m.
Most of the chemical reactions occurring during postdepositional processes in
water are substantially affected by the hydrogen ion concentration (pH) and
oxidation/reduction potential (Eh), which are related as follows:
Eh ¼ DZ=nF � yðpHÞ (3.7)
Fig. 3.7. Travis Peak Sandstone, East Texas, USA. Relationship between porosity and depth of burial
(after Dutton and Diggs, 1992). g ¼ 0.76; n ¼ 89.
DEFORMATION OF ROCKS IN DEPTH 47

where DZ ¼ the free energy of reactions; n ¼ the number of electrons taking part in
the reaction; F ¼ the Faraday constant (96,520C/g-eq.); and y ¼ the constant for a
given reaction.
The above equation shows that as alkalinity of the environment declines, a less
reducing environment is needed for the reduction4 of the same components. It
appears that a strongly alkaline environment is not necessary and may even be
detrimental for the transformation of organic matter into hydrocarbons. Minerals
participating in the processes have significantly different pH and Eh stability limits.
For instance, at a stage of syngenesis and early diagenesis (po10MPa, To60–701C),
the pH stability limits for various minerals are (after Minskiy, 1975, pp. 147–150):
anhydrite 8.4 calcite 7.8–8.7
halite 7.8 kaolinite 3.5–5.6
hematite 7.4 quartz 7.8
illite 7.8 montmorillonite 7.8–8.2
clay 8.7 pyrite 5.0–6.2
dolomite 8.4 siderite 6.2–7.2
Besides the pressure and temperature, postdepositional processes are affected by a
number of factors, which include the appearance and redistribution of the cement,
changes in the structural (textural) orientation of rock-forming minerals, and
dissolution of minerals unstable in a given environment. The intensity of these
processes is affected not only by the aforementioned factors, but also by the
permeability at a given time. As an example, Fig. 3.8 shows relationship between
the permeability of quartz sands and clay mineral content (Klubova, 1984, p. 151).
The most drastic changes in the permeability occur when the clay content increases
within just a few percentage points. Further increase in clay content between 10%
and 80% does not significantly affect the sand’s permeability.
As indicated previously, rock properties are significantly affected by the
formation of authigenic minerals. Newly-formed authigenic minerals reduce the
porosity and permeability due to fineness of grains and swelling of some minerals.
A significant role in the postdepositional alterations of carbonate rocks belongs to re-
crystallization and dissolution. These processes usually result in increased porosity. In
some cases, however, the emerging pores are easily filled-up with secondary (authigenic)
minerals, mostly calcite and dolomite. In 1954, Chilingar and Terry have shown that
dolomitization of limestones creates additional porosity (up to the theoretical value
of 12.1%) (also see Chilingarian et al., 1992, 1996). Some researchers (Minskiy, 1975,
p. 27) question this because dolomitization is occurring along the grain contacts. Actual
field data, however, supports the findings of Chilingar and Terry (1954).
Reservoir–rock properties of carbonates are substantially affected by the presence
of organic matter, which sometimes gives rise to laminated texture. Organic matter
4Oxidation is a reaction in which the electrons are lost, whereas reduction is a reaction where electrons are
gained.
TEMPERATURE AND PRESSURE IN THE SUBSURFACE48

also changes the chemistry of the ongoing processes because of (1) changing pH, (2)
reactions with CO2 forming as a result of organic matter transformations, (3) direct
effect on the temperature (as a result of endothermic and exothermic processes), and
(4) pressure changes due to increase in volume after the formation of new
compounds.
3.1.3. Paleotemperature
The study of evolution of a sedimentary basin is incomplete without a sufficient
knowledge of its paleotemperature regime. The probability of occurrence of
some mineral resources in basins is to a great extent controlled by the temperature,
which determines feasibility and direction of various chemical reactions. Usually,
the products of chemical reactions are what we are looking for, i.e., mineral
resources.
The preservation and destruction of migrating mineral resources (such as oil and
gas) also depend to a great extent on the temperature evolution of a basin.
Thermodynamic boundaries for some reactions or formation of some compounds,
Fig. 3.8. Relationship between the clay content and permeability of quartz sand fractions:
(a) 0.35–0.50mm and (b) 0.08–0.12mm (after Tsvetkova, modified by Klubova, 1984). Clays:
1 – montmorillonite; 2 – polymictic; 3 – kaolinite.
DEFORMATION OF ROCKS IN DEPTH 49
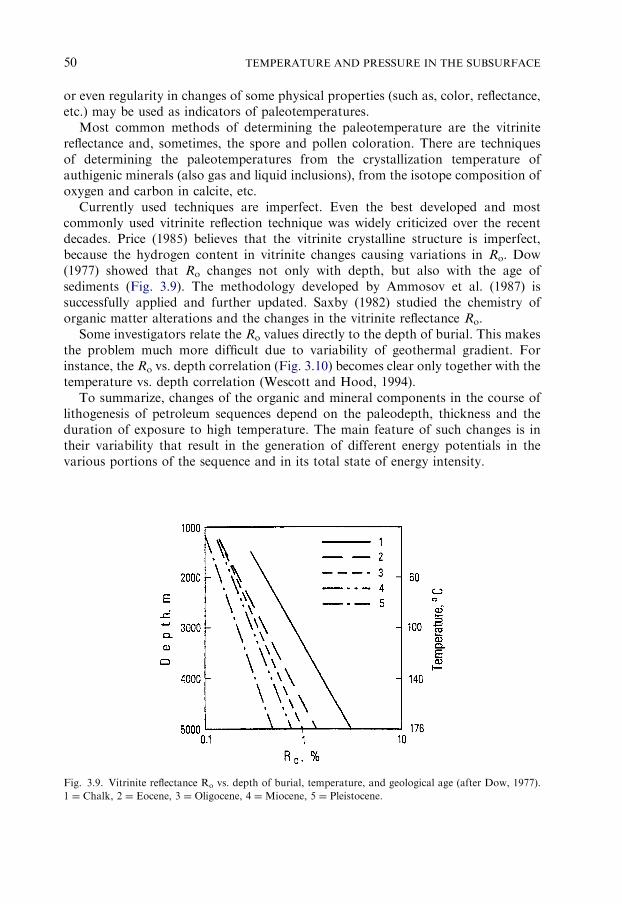
or even regularity in changes of some physical properties (such as, color, reflectance,
etc.) may be used as indicators of paleotemperatures.
Most common methods of determining the paleotemperature are the vitrinite
reflectance and, sometimes, the spore and pollen coloration. There are techniques
of determining the paleotemperatures from the crystallization temperature of
authigenic minerals (also gas and liquid inclusions), from the isotope composition of
oxygen and carbon in calcite, etc.
Currently used techniques are imperfect. Even the best developed and most
commonly used vitrinite reflection technique was widely criticized over the recent
decades. Price (1985) believes that the vitrinite crystalline structure is imperfect,
because the hydrogen content in vitrinite changes causing variations in Ro. Dow
(1977) showed that Ro changes not only with depth, but also with the age of
sediments (Fig. 3.9). The methodology developed by Ammosov et al. (1987) is
successfully applied and further updated. Saxby (1982) studied the chemistry of
organic matter alterations and the changes in the vitrinite reflectance Ro.
Some investigators relate the Ro values directly to the depth of burial. This makes
the problem much more difficult due to variability of geothermal gradient. For
instance, the Ro vs. depth correlation (Fig. 3.10) becomes clear only together with the
temperature vs. depth correlation (Wescott and Hood, 1994).
To summarize, changes of the organic and mineral components in the course of
lithogenesis of petroleum sequences depend on the paleodepth, thickness and the
duration of exposure to high temperature. The main feature of such changes is in
their variability that result in the generation of different energy potentials in the
various portions of the sequence and in its total state of energy intensity.
Fig. 3.9. Vitrinite reflectance Ro vs. depth of burial, temperature, and geological age (after Dow, 1977).
1 ¼ Chalk, 2 ¼ Eocene, 3 ¼ Oligocene, 4 ¼ Miocene, 5 ¼ Pleistocene.
TEMPERATURE AND PRESSURE IN THE SUBSURFACE50
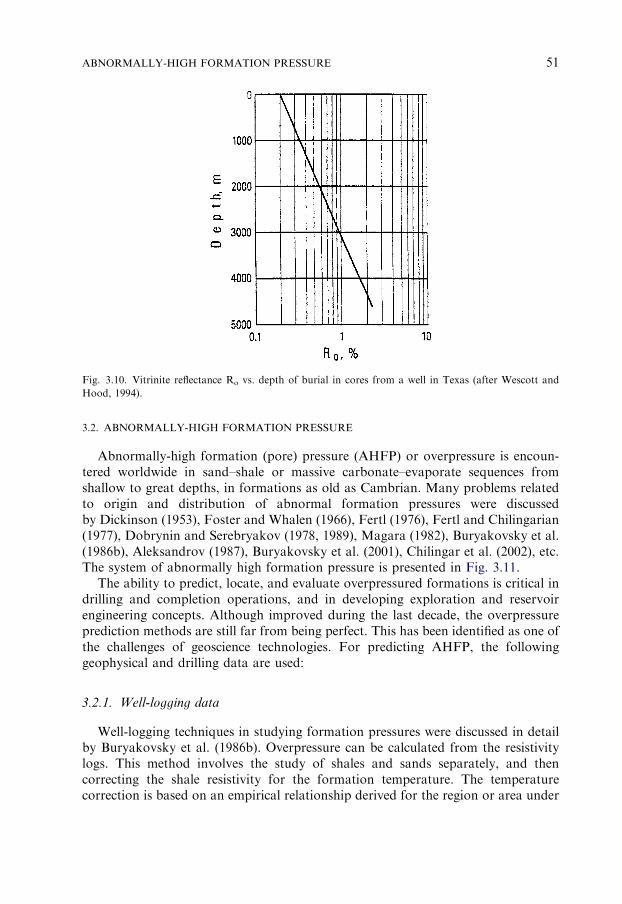
3.2. ABNORMALLY-HIGH FORMATION PRESSURE
Abnormally-high formation (pore) pressure (AHFP) or overpressure is encoun-
tered worldwide in sand–shale or massive carbonate–evaporate sequences from
shallow to great depths, in formations as old as Cambrian. Many problems related
to origin and distribution of abnormal formation pressures were discussed
by Dickinson (1953), Foster and Whalen (1966), Fertl (1976), Fertl and Chilingarian
(1977), Dobrynin and Serebryakov (1978, 1989), Magara (1982), Buryakovsky et al.
(1986b), Aleksandrov (1987), Buryakovsky et al. (2001), Chilingar et al. (2002), etc.
The system of abnormally high formation pressure is presented in Fig. 3.11.
The ability to predict, locate, and evaluate overpressured formations is critical in
drilling and completion operations, and in developing exploration and reservoir
engineering concepts. Although improved during the last decade, the overpressure
prediction methods are still far from being perfect. This has been identified as one of
the challenges of geoscience technologies. For predicting AHFP, the following
geophysical and drilling data are used:
3.2.1. Well-logging data
Well-logging techniques in studying formation pressures were discussed in detail
by Buryakovsky et al. (1986b). Overpressure can be calculated from the resistivity
logs. This method involves the study of shales and sands separately, and then
correcting the shale resistivity for the formation temperature. The temperature
correction is based on an empirical relationship derived for the region or area under
Fig. 3.10. Vitrinite reflectance Ro vs. depth of burial in cores from a well in Texas (after Wescott and
Hood, 1994).
ABNORMALLY-HIGH FORMATION PRESSURE 51

study. Once the temperature correction is applied, a normal compaction trend for
shales is established for the well. The overpressured zones are identified by the
deviation from the normal trend of pore-pressure gradient. The same method can be
applied for determining the overpressure from sonic or neutron logs (see Chilingar
et al., 2002).
If different wells exhibit different and distinct pressure gradient patterns, each well
represents a separate pressure compartment. Layering and variations in the
overpressure are sometimes due to the fact that pressure builds up in the shales
and then bleeds off into the associated permeable sands and sandstones. An excellent
prediction criteria and sensitivity analysis of formation pressure in sealed layers were
proposed by Dobrynin and Serebryakov (1978, 1989) and Khilyuk et al. (1994).
3.2.2. Seismic data
Pore pressure and fracturing pressure can be determined using the seismic velocity
and empirical relationships among seismic velocity, rock density, and Poisson’s
ratio. A typical methodology can be summarized as follows:
(1) the stacking velocity from seismic data is calibrated using well velocities;
(2) the normal pressure gradient curve is calculated for the sonic velocity curves;
(3) the pore pressure is determined from the seismic velocity data using the normal-
trend curve; thus, the pore pressure distribution in a section is established; and
(4) the fracture-pressure gradient is determined from the (a) pore-pressure gradient,
(b) interval velocities, and (c) empirical relationships among velocity, density,
and Poisson’s ratio.
Fig. 3.11. System of abnormally-high formation pressure (AHFP).
TEMPERATURE AND PRESSURE IN THE SUBSURFACE52

3.2.3. Drilling data
Overpressure can be estimated using drilling data. To predict pressure from the
drilling data, a fuzzy logic has been used by Aminzadeh et al. (1994). This method
was first applied to the data from South Caspian Basin. Drilling parameters such as
the bit weight, rate of penetration, and changes in the rate of penetration were used
for this purpose. The information obtained from pressure prediction is used to
choose the required drilling mud density. Also, lithology can be predicted from the
pressure data (Aminzadeh et al., 1994; Dunan, 1996; Lee, 2000).
Many factors contribute to the magnitude of abnormal formation pressure. These
include:� Compaction of the rocks with a change in porosity.� Mass transfer fluxes.� Temperature changes.� Diagenetic and catagenetic transformations.� Chemistry of intertstitial fluids.� Lithology and mineralogy.� Sand/shale ratio.� Distribution of porosity and permeability in associated sands and shales.
The abnormally-high formation pressures in the argillaceous sequences may
substantially affect the geological processes at depth. They evidently have played an
important role in folding, clay diapirism, mud volcanism, earthquakes, and
diagenesis–catagenesis. The models of these phenomena are described by the
Coulomb’s law and by the rheological models of various theoretical bodies.
According to the Coulomb’s law, resistance to shearing in shales is the first power
function of normal compressive stress. As abnormal pore pressure in shales
increases, the intergranular stress (effective stress) decreases, down to very low values
under certain conditions. Resistance to shearing, determined by friction, decreases
correspondingly. This leads to an intergranular sliding and facilitates, to a
considerable extent, the development of shearing. In such instances, plastic
argillaceous sequences become quite mobile at high pore pressure in shale and are
displaced. Depending on the subsurface environment and duration, this process
may lead to the development of folds, diapirs, mud volcanoes, or earthquakes. In
the South Caspian Basin and onshore of Azerbaijan, such geologic setup is
quite typical of thick Paleogene to Miocene argillaceous sequences with extremely
high, quasigeostatic values of AHFP, with shale pore pressure gradients of
0.020–0.023MPa/m (Buryakovsky et al., 1986, 1995, 2001).
Development of abnormal pore pressures in shales of the South Caspian Basin
and onshore of Azerbaijan has been experimentally demonstrated by elastic
compression of hermetically sealed cores of Cenozoic shales. Fig. 3.12 shows
that the pore pressure (pp) in the core rises with increasing external confining
pressure (total overburden load, s) and then decreases as the confining pressure
decreases, but always remaining higher than in the case of increasing load, evidently
as a result of residual (irreversible) deformation of the rock (see Rieke and
Chilingarian, 1974).
ABNORMALLY-HIGH FORMATION PRESSURE 53

In studying the abnormally-high formation pressure, of special interest are the
young sedimentary basins, which are characterized by the presence of thick, rapidly
accumulated sand/shale sequences. A vivid example is the South Caspian Basin,
which is distinguished by a diverse and rather unique association of the following
features:� an exceptionally high rate of sedimentation (up to 1.3 km/my) (my ¼ million
years);� a very thick (up to 25 km) sedimentary column; thickness of the Quaternary –
Pliocene sand–silt–shale sediments up to 10 km;� argillaceous rocks make up 50–95% of the section and play a key role in
determining the mineralogic, lithologic, geochemical, and thermodynamic
characteristics of the basin;� abnormally-high pore pressure in shales (average factor of abnormality5 up to
Ka ¼ 1:8);� low heat flow and low formation temperature (at depths around 6 km, the
temperature is approximately 105–1101C);� an inverted character of the water chemistry and total salinity profile (the
chemistry of water changes with depth from calcium chloride and magnesium
chloride to sodium bicarbonate type, and water salinity decreases with depth);� wide development of mud volcanism.
Fig. 3.12. Experimentally determined relationship between the pore pressure (pp) and the total stress (s)
for an argillaceous rock core (after Buryakovsky et al., 1995, Fig. 6, p. 207). Arrows show increasing and
decreasing total overburden stress (confining pressure).
5Abnormality factor Ka ¼ pa=pn, where pa is abnormally-high formation pressure and pn is the normal
hydrostatic pressure.
TEMPERATURE AND PRESSURE IN THE SUBSURFACE54

The abnormally-high formation (pore) pressures (AHFP) in reservoirs are known
to be caused by several diverse factors. It appears, however, that the most probable
mechanism of AHFP development in regions with thick sedimentary rocks
(sand–shale sequence) is a rapid sedimentation and gravitational compaction. This
leads to significant underconsolidation (undercompaction) of rocks and to a
development of AHFP. Abnormal pressures in reservoir rocks are often caused by
the influx of water from the overpressured shales. Pressures in sandstones and shales
approach each other only in moderately thick beds. The reservoirs of regional extent
have a better pressure distribution, than those in shales; consequently, their pore
pressure usually is lower than that in the enclosing shales (Fig. 3.13).
In the South Caspian Basin, the drilled Pliocene siliciclastic section is 6.5 km thick,
with unevenly distributed AHFP, both vertically and laterally. Presence and
magnitude of AHFP are determined by studying the lithofacies of the oil- and gas-
bearing rocks, structure of the uplifts, sand/shale thickness ratio, influx of water
from the shales into sands, integrity of caprocks, distribution of faults and fractured
zones, etc.
Fig. 3.13. Relationship between the pore-pressure gradient and relative clay content (after Buryakovsky
et al., 1995, Fig. 5, p. 207). 1-3 — Argillaceous rocks from three different areas; 4 – aquifers, 5 – oil-bearing
sandstones and siltstones, 6 – gas-bearing sandstones and siltstones.
ABNORMALLY-HIGH FORMATION PRESSURE 55

An important regional feature of AHFP is a very high porosity of argillaceous
rocks (undercompaction), much higher than those at similar depths in the other
areas of the world (Buryakovsky et al., 1982; Dzhevanshir et al., 1986). Porosity of
Pliocene shales in the South Caspian Basin at depths of 4.0–5.5 km is several times
higher than in the consolidated shales present in other regions at the same depth.
Such a difference is the effect of young geologic age, relative contents of clay and
sand, formation temperature, and other factors. The abnormally-high porosity of
shales is primarily the result of slower rate of compaction compared to the
subsidence rate, due to the slow pore water removal from the compacting
argillaceous rocks during rapid sedimentation.
It should be noted that AHFP in argillaceous sequences is often attributed to the
montmorillonite dehydration as it is altered to illite (hydromica). As shown in Table 3.2,
practically unaltered montmorillonite is present in the deposits of the South Caspian
Basin at depths down to 6km, i.e., throughout the entire drilled section. That indicates
a subordinate role of montmorillonite dehydration in the total process of AHFP
development in the region.
Montmorillonite and illite–montmorillonite (mixed layered) minerals may be
transformed to illite during the diagenesis and catagenesis, as described for almost all
major sedimentation basins throughout the world. These changes in clay minerals
during catagenesis are most probable (not simply possible, as in diagenesis), due to
an increase in temperature and pressure as the sediments are buried. Consequently,
during late catagenesis, the clay–mineral assemblage consists of two components
(illite and chlorite), regardless of the initial composition. This is true in many parts of
world.
On the other hand, virtually unaltered montmorillonite has been observed in
Azerbaijan, at great depths and in large amounts (Kheirov, 1979). Kerimov
explained the almost unaltered montmorillonite found at a depth of 6026m in the
Pliocene beds of the Baku Archipelago as due to specific sedimentation conditions,
TABLE 3.2
Clay-mineral composition in the Absheron Archipelago Rocks (average values are presented in the
denominator)
Depth range (m) Content of clay minerals (%)
Montmorillonite Illite Kaolinite Chlorite Mixed-layered
1000–2000 10245
32
35265
44
15220
18
5210
6
Traces
2000–3000 35270
45
20240
35
0215
13
0210
7
Traces
3000–4000 15250
36
30260
42
5220
14
5215
7
025
14000–5000 15270
40
10260
38
0220
12
0210
6
0230
45000–6000 5265
39
20265
39
0230
16
0215
5
0215
246000 5270
36
20260
38
10225
16
0210
4
0225
7
TEMPERATURE AND PRESSURE IN THE SUBSURFACE56

the composition of the initially deposited clays, and the abnormally low
temperatures, i.e., these sediments lie in the early diagenetic zone. In some cases,
absence of potassium ion in the pore water of sediments could explain the absence of
montmorillonite-to-illite transformation.
Of great importance is the study of (1) regularities in the distribution of clay
minerals over the entire section, (2) identification of basic factors influencing the
transformation of montmorillonite to illite, and (3) prediction of catagenetic changes
at greater depths not yet reached by boreholes. It is not always possible to determine
the origin of clay minerals, i.e., whether they are primary or secondary. For example,
Milleau (1968, see Buryakovsky et al., 1989) noted that the montmorillonite formed
at the final stage of illite degradation does not differ from the primary
montmorillonite, as evidenced by the X-ray analysis.
Photomicrographs of fresh broken surfaces of argillaceous rocks of the
Productive Series of the Baku Archipelago (depths of 1400–5200m) were taken
with scanning electron microscope (SEM) (Buryakovsky et al., 1986, 1988). The
surfaces were examined in sections cut parallel, perpendicular, and oblique to the
bedding. The mineral compositions of these rocks are generally the same throughout
this depth range. The main clay minerals are illite and montmorillonite, with small
amounts of kaolinite and chlorite. The rocks have a honeycomb-like texture, which
is clearly seen in oblique sections.
The SEM results indicate that there are both ‘‘forward’’ and ‘‘reverse’’
clay–mineral transformations, which occur simultaneously as the rocks are buried.
The cores from the depths of 1400–1800m show only very slight changes in the clay
minerals, although one can identify damaged sublayers (twisting) at the edges, as
well as secondary pores and cracking in some illite grains. There are also
microcavities formed by diagenetic processes. Cores from depths greater than
4000m show greater evidence of transformation. Illite and montmorillonite
predominate, with the montmorillonite being of both primary and secondary origin.
The secondary montmorillonite occurs in the interstices between the illite grains, at
their edges, and in cracks. The primary montmorillonite is disrupted or twisted at the
edges and the secondary pores are present.
These Pliocene beds show degradation not only of the primary montmorillonite
but also of the illite, which changes to montmorillonite. Probably, these
transformations are largely responsible for the retention of the same illite-to-
montmorillonite ratio at depth.
Transformation of clay minerals during catagenesis is a complex process,
proceeding over a long period of geologic time under the influence of interrelated
and interdependent factors. It is extremely difficult to determine the effect of various
factors, i.e., to give a quantitative estimate of the intensity of influence of each
one. The solution to this problem probably lies in future investigations. The effect
of subsurface temperature and pressure and hydrochemical factors on the
postsedimentary (diagenetic and catagenetic) alteration of these Pliocene clays
should be studied using the data on chemical analyses of formation waters (e.g.,
availability of potassium ion), formation temperatures, and pore pressures
determined from logs.
ABNORMALLY-HIGH FORMATION PRESSURE 57

3.2.4. Effect of pressure and temperature
The abnormally low temperatures may be responsible for the absence of clear-cut
clay–mineral transformation. Khitarov and Pugin (1966) and Magara (1982) have
indicated that temperature is a major factor influencing montmorillonite degrada-
tion. Also of interest is the effect of illite degradation on the geothermal gradient.
Inasmuch as hydration of clays is an exothermic reaction, there may be elevated
gradients at depth ranges where the illite is transformed to montmorillonite, all other
conditions being equal.
In the areas of South Caspian Basin, the average geothermal gradient is
approximately 161C/km, and the temperature at a depth of about 6 km does not
exceed 1101C. A characteristic feature is that the geothermal gradient becomes lower
at a depth of approximately 4 km (Table 3.3). Table 3.3 includes also the data on
pore-pressure gradient in these areas.
The increased geothermal gradient at a depth of about of 4 km may be related to
the illite-to-montmorillonite transformation, which releases heat. At a depth of
about of 4 km, the transformation rate exceeds some limit, which causes hydration to
predominate over dehydration. One should, therefore, consider the effects of
temperature on diagenetic and catagenetic processes.
An increase in temperature may accelerate the process of montmorillonite
transformation into non-swelling minerals (illite and chlorite). Consequently,
sections with high geothermal gradient should be characterized by a small
montmorillonite content. On the other hand, inasmuch as a temperature decrease
retards the process of montmorillonite transformation, sections with low geothermal
gradient should be characterized by a high montmorillonite content.
Fig. 3.14a shows the dependence of montmorillonite content on the geothermal
gradient in shales of the South Caspian Basin. The highest montmorillonite contents
are found in the shales of the Baku Archipelago and Lower Kura Depression, which
are characterized by a low geothermal gradient (161C/km). The Absheron Peninsula
TABLE 3.3
Variation of geothermal gradient and pore pressure gradient with depth (average values are presented in
the denominator)
Depth range (m) Geothermal gradient (1C/km) Pore-pressure gradient (MPa/m)
1000–2000 10215
12
0:01220:020
0:0162000–3000 10212
11
0:01320:021
0:0173000–4000 8211
10
0:01420:022
0:0184000–5000 15219
17
0:01520:023
0:0195000–6000 21223
22
0:01520:023
0:01946000 15225
20
0:01620:024
0:020
TEMPERATURE AND PRESSURE IN THE SUBSURFACE58

and the adjacent offshore areas, which have a higher geothermal gradient
(24.0–28.51C/km), are characterized by lower montmorillonite contents.
Low temperature apparently does not favor the transformation of montmor-
illonite to illite. Under otherwise equal conditions, this transformation increases with
depth, which means that some additional factors must be influencing the
transformation. One of these factors, discussed by Serebryakov et al. (1995), is the
lack of potassium ion in interstitial water.
Inasmuch as the transformation of montmorillonite into illite proceeds with the
removal of interlayer water from montmorillonite, conditions at which the desorbed
water can enter the pore space without hindrance will be favorable for the
development of this process. Factors opposing the withdrawal of interlayer water
from clays, may lead to slowing down or cessation of the transformation of
montmorillonite into illite or chlorite. The writers believe that such a factor is the
abnormally high pore pressure. The fluid pressure gradients in shales at
1000–6000m, which are based on more than 2000 determinations, range from
0.012 to 0.024MPa/m, with a mean of 0.018MPa/m (see Fig. 3.15 and Table 3.3).
The dependence of montmorillonite content on the pore-pressure gradient in
shales is shown in Fig. 3.14b. There is a close correlation between these two
parameters. In regions of the Baku Archipelago and Lower Kura Depression,
characterized by intense development of AHFP (pore pressure gradients in shales of
0.018–0.019MPa/m), the montmorillonite content in shales reaches an average of
53%. In regions with moderate development of AHFP (Absheron Archipelago and
the South Absheron Offshore Zone), the montmorillonite content decreases to 17%.
There is no adequate discussion in the literature on the effect of pore pressure in
shales on the clay–mineral diagenesis and catagenesis. Theoretically, the rising
pressures reduce the dehydration rates. The production of illite in shales involves an
increase in the volume of free water as a result of the release of bound water, which is
denser than the free water. Factors opposing this increase in volume (such as high
pore pressure in shales) will reduce the dehydration rate.
Fig. 3.14. Dependence of the montmorillonite content on the geothermal gradient (a) and on the pore-
pressure gradient (b) in shales (after Buryakovsky et al., 1995, Fig. 7, p. 211).
ABNORMALLY-HIGH FORMATION PRESSURE 59

On the other hand, AHFP can lead to transformation of illite to secondary
montmorillonite by the absorption of water. At AHFP, the smaller particle size of
clay minerals favors the transformation of illite, as shown by the relationship between
the pore size (determined from SEM data) and depth (Table 3.2 and Fig. 3.16).
The writers propose the following scheme for the relationship between the
clay–mineral transformation and the formation temperature and pressure.
In a basin where the subsidence rate is equal to the rate of accumulation of
sediments, the depth at which diagenetic (and catagenetic) transformation
(desorption of water) begins remains more or less the same and is largely determined
Fig. 3.15. Pore fluid pressure gradient (Z) in shales (small circles, 1) and in reservoir rocks (large circles, 2)
in the Baku Archipelago, South Caspian Basin (after Buryakovsky et al., 1995, Fig. 2, p. 205).
TEMPERATURE AND PRESSURE IN THE SUBSURFACE60

Fig. 3.16. Pore size distribution for argillaceous rocks from the Productive Series of Baku Archipelago,
South Caspian Basin (after Buryakovsky et al., 1986). a — Duvanny Deniz Field, Well No. 529, depth
intervals 1415–1420m/4642–4659 ft and 1450–1455m/4757–4774 ft; b – same but depth intervals are
1700–1705m/5577–5594 ft and 1785–1790m/5856–5873 ft; c – same field, Well No. 275, depth interval
3323–3328m/10902–10919 ft; d – Sangachal Field, Well No. 534, depth interval 4295–4303m/
14091–14117 ft; e – Bulla Deniz Field, Well no. 537, depth interval 4993–5000m/16381–16404 ft; f –
same field, Well No. 15, depth interval 5128–5132m/16824–16837 ft.
ABNORMALLY-HIGH FORMATION PRESSURE 61

by the geothermal gradient. Inasmuch as the desorbed (interlayer) water is added to
the interstitial water, abnormally high pore pressures may develop if the water
cannot escape. Under some conditions, the rising pore pressure in shales may reduce
the montmorillonite dehydration rate and release of water. The result will be similar
to that arising from a low geothermal gradient, i.e., reduction in the rate of illite
formation. Under favorable conditions, the illite may be hydrated, which is
accompanied by a release of heat and its transformation to secondary montmor-
illonite. The relative intensity of dehydration (illite formation) and the illite
hydration (formation of secondary montmorillonite) may determine the pore
pressure.
The sedimentation rate and the sediment sources do not remain constant
with time. Thus, different zones may differ in the dehydration rate because of
changes in the sedimentation rate or type of sedimentary material. Transitions from a
zone with normal pressures and normal dehydration rate to an AHFP zone may
indicate either the effect of diagenetic and catagenetic processes or a lag in the
development of these processes. The montmorillonite content may remain the same
or even increase with depth. This, however, does not mean that the process
of dehydration of montmorillonite to illite is replaced by the illite hydration, although
this is possible. Instead, it could mean that dehydration process in the AHFP zones is
slow; therefore, these zones may be characterized by higher (or equal) montmor-
illonite contents than those in the younger zones with normal shale pore pressure.
3.2.5. Effect of formation water chemistry
The formation water chemistry has a significant influence on the intensity of
postsedimentary transformations. Thus, it is important to ascertain the nature of
hydrochemical scenario observed in the Cenozoic sequence of the South Caspian
Basin, namely: whether it is a consequence of diagenetic and catagenetic processes in
shales and the transformation of clay minerals, or it is formed predominantly as a
result of the action of other factors (e.g., compaction). In this connection, the
problem presenting the greatest interest is the origin of inverted hydrochemical
profile in the section of the South Caspian Basin, i.e., with depth, calcium chloride
waters are replaced by less saline sodium bicarbonate waters. The writers obtained
numerous data from the laboratory analyses and field observations, indicating a
decrease in the salinity of pore waters in sands with depth. Replacement of calcium
chloride water by alkaline sodium bicarbonate water is characteristic for the AHFP
zones in the South Caspian Basin areas (Buryakovsky, 1974). Analogous data on the
decrease of formation water salinity with increasing pressure were also noted in the
Gulf of Mexico (Fertl, 1976).
The appearance of hydrochemical inversion in the stratigraphic section of
the South Caspian Basin may be explained by the genetic relationship between
the hydrochemical environment and the development of abnormally high pore
pressures in shales. The water of primarily sodium bicarbonate type characterizes the
TEMPERATURE AND PRESSURE IN THE SUBSURFACE62

most pronounced AHFP zones in the Baku Archipelago and Lower Kura
Depression.
According to Chilingar (1957), the relationship between the chemical composition
of the Absheron Peninsula waters and the stratigraphic depth is subject to the
following rules:
(1) The total salinity of formation waters decreases with stratigraphic depth (also see
Samedov and Buryakovsky, 1966; Rieke and Chilingarian, 1974, pp. 265–269).
(2) The Cl�, Ca2+ and Mg2+ contents decrease with depth.
(3) (Na++K+) and (HCO3�+CO3
2�+H++K+) contents gradually increase with
depth.
(4) The transition from hard-to-alkaline waters occurs at maximum concentration,
not exceeding 0.1 g-eq. per 100 g of water (5–6.51Be). As a rule, the waters are
hard at concentration above 0.1 g-eq.
(5) The HCO3� content (in g-eq.) does not exceed the Cl� content.
(6) Usually, the waters do not contain SO42� anion. If present, however, its
concentration does not exceed 0.0004 g-eq. per 100 g of water.
Mekhtiev (1956) (in: Rieke and Chilingarian, 1974, pp. 265) also showed that in the
Azerbaijan oilfields water salinity is decreasing with stratigraphic depth and calcium
chloride waters (rCl��rNa+)/rMg2+41, where r is percent-equivalent, are gradually
replaced by bicarbonate waters: (rNa+�rCl�)/rSO42�41. For magnesium chloride
water, (rCl��rNa+)/rMg2+o1. For details on classification of waters, see Chilingar
(1956, 1957, 1958), Samedov and Buryakovsky (1966), and Buryakovsky (1974).
According to Chilingarian et al. (1994), the chemistry of pore water is determined
mainly by the compaction of argillaceous rocks and squeezing-out of pore water.
The formation water chemistry, in turn, influences the diagenetic and catagenetic
transformation (of clay minerals) processes.
Fig. 3.17 shows the dependence of montmorillonite content on the total salinity of
formation water for the calcium chloride and sodium bicarbonate types of pore
waters in sands of the South Caspian Basin. As shown, a direct relationship exists for
the sodium bicarbonate type of water, i.e., with increasing water salinity, the
conditions for preservation of montmorillonite are improved and its content in
the clays increases. Increase in the total salinity of water is caused by an increase in
the content of carbonate and bicarbonate salts of alkali-earth metals. Sodium
bicarbonate-type waters are present in the Baku Archipelago and the Lower Kura
Depression, as well as in the rocks from the Lower Productive Series of Absheron
Peninsula and adjacent offshore area, i.e., sections in which the argillaceous rocks
are characterized by higher montmorillonite content. There is an inverse relationship
between the montmorillonite content and the presence of calcium chloride type of
waters. The chloride content [in particular sylvite (KCl)] increases with increasing
water salinity. Thus, alkaline medium is apparently favorable for the formation and
preservation of montmorillonite.
Thus, the geochemical environment at great depths in the South Caspian Basin
deposits not only conducive to the preservation of allothigenic montmorillonite, but
possibly allows the transformation of illite into secondary montmorillonite.
ABNORMALLY-HIGH FORMATION PRESSURE 63

3.2.6. Secondary montmorillonite
According to the data cited above, a rather close relation exists between the
various clay mineral contents and the formation temperature, pressure, and water
chemistry in the stratigraphic section of the South Caspian Basin. The stability of
montmorillonite at great depths depends on many parameters. In the section of Baku
Archipelago at depths greater than 4–5 km, formation of secondary montmorillonite
from illite was observed using SEM. This is explained by the relatively low
temperatures, abnormally high pore pressures in shales, and the alkaline pore water
enriched in K+, Na+and HCO�3 , ions (see Buryakovsky et al., 2001).
The postsedimentary (diagenetic and catagenetic) transformation of Middle
Pliocene shales of the South Caspian Basin is characterized by the retardation of the
process of transformation of montmorillonite into illite or chlorite at great depths,
and the substitution of this process by the process of transformation of illite into
highly swelling minerals of the montmorillonite (smectite) group. These processes are
closely related to the low geothermal gradient and increasing pressure at depth and
inverted hydrochemical profile of these deposits.
3.3. ORIGIN OF ABNORMAL FORMATION PRESSURES
Various origins of abnormally-high formation pressure (AHFP) and abnormally-
low formation pressure (ALFP) are discussed in detail by Chilingar et al. (2002). The
Fig. 3.17. Relationship between the montmorillonite content and total salinity of formation water (after
Buryakovsky et al., 1995, Fig.9, p. 213). Water type: 1 – sodium bicarbonate, 2 – calcium chloride.
TEMPERATURE AND PRESSURE IN THE SUBSURFACE64

classifications of origin of AHFP are presented in Table 3.4 and those of ALFP, in
Table 3.5.
Abnormally-high formation pressure (or overpressure) may be created by several
mechanisms including:
(1) Stress-related mechanisms (disequilibrium compaction – vertical loading stress)
and tectonic stress (lateral compressive stress).
(2) Fluid volume increase mechanisms, i.e., temperature increase (aquathermal
expansion), mineral transformation – water release due to mineral diagenesis
(gypsum to anhydrite transformation, montmorillonite-to-illite transformation),
hydrocarbon generation (kerogen maturation – oil or gas generation), oil and
bitumen to gas cracking.
(3) Fluid movement and buoyancy mechanisms, i.e., osmosis and hydraulic head.
(4) Hydrocarbon buoyancy (density contrasts).
Some of the above listed mechanisms are responsible for creating large amounts of
AHFP in sedimentary basins. The most common mechanisms, however, are
disequilibrium compaction due to rapid loading of fine-grained sediments in
relatively young basins, and the volume expansion associated with gas generation.
Mineral transformation (dehydration) may also create AHFP in rocks. Where part
of the rock matrix is converted into free fluid (e.g., oil and gas during kerogen
maturation or water as a result of montmorillonite-to-illite transformation), the pore
fluid will tend to assume that portion of the overburden previously carried by the
rock matrix.6
Gas generation seems to be a viable mechanism to create regional AHFP by
increasing pore pressure. Gas may generate from gas-prone source rocks or can
result from the oil to gas cracking.
Other mechanisms, which rely on increased volume of pore fluids, include
smectite-to-illite transformation, oil generation, and gypsum-to-anhydrite transfor-
mation. AHFP’s can be created locally as a result of these processes. The local effect
may be additive to other simultaneously acting mechanisms, e.g., regional
disequilibrium compaction.
Osmosis may create minor amounts of AHFP if conditions are favorable. Shales
do not act as ideal membranes and the amount of AHFP is limited, even at high
salinity contrasts (see Chilingar et al., 2003).
Abnormally low formation pressure (or underpressure) as a geological
phenomenon is less well known than AHFP. There are several natural events
presumably capable to create the ALFP, including:
(1) Differential discharge – groundwater flow
(2) Differential gas flow
(3) Rock dilatancy
(4) Osmosis
(5) Thermal effects
6Total overburden load (pt) is supported by the grain-to-grain stress (effective stress) (pe) plus the pore
(fluid) pressure (pp): pt ¼ pe þ pp.
ORIGIN OF ABNORMAL FORMATION PRESSURES 65

TABLE 3.4
Types of mechanisms responsible for generating abnormally-high formation pressures (AHFP) (after Chilingar et al., 2002)
Type of changes Description of process
Changes in the rock pore volume
Vertical loading (undercompaction) Rate of sedimentation and deposition. High depositional rates in clastic sequences and high shale/sand ratios
(undercompaction)
Massive areal rock salt deposition. Presence of impermeable salt (NaCl) beds. For example, massive salt deposits in
USA, Russia, North Africa, Middle East, North Germany, etc.
Paleopressures. Sealed-off reservoir rocks experiencing a depth change due to either uplifting or erosion
Lateral tectonic loading Tectonic activities. Local and regional faulting, folding, lateral sliding, and slipping; squeezing caused by down-
dropping of fault blocks; diapiric salt, sand, or shale movements; earthquakes; etc. The pore volume is reduced by
horizontal tectonic compression of rock
Secondary cementation Cementation. Calcium sulfates, sodium chloride, dolomite, siderite, calcite, silica, etc., may act as sealing barriers
(‘‘pressure caps’’), and directly cause increased pore pressure by decreasing pore space due to crystal grows within
closed reservoirs (e.g., NaCl in Markovo oil pool in the Osinskiy Series, Russia)
Changes in the volume of interstitial
fluids
Temperature change (aquathermal
expansion)
Thermodynamic effect. Formation temperature increase causes expansion of fluids with consequent increase in the
fluid pressure
Mineral transformation Diagenetic and catagenetic processes. Postdepositional alterations (release of bound water): (1) montmorillonite and
mixed-layer clays altered to illites (smectite dehydration); (2) gypsum to anhydrite dehydration
TEMPERATUREAND
PRESSURE
INTHESUBSURFACE
66

Hydrocarbon generation Conversion of organic material/kerogen to petroleum. Generation of oil and gas from kerogen (maturation) results in
a significant increase in volume
Decomposition of hydrocarbons
(thermogenic)
Breakdown of hydrocarbons. About 2- to 3-fold volume increase caused by breakdown of hydrocarbon long-chained
molecules into shorter-chained molecules. Such reactions generally occur at depths below 2–4 km and temperatures
greater than 70–120 1C. Thermal cracking of organic molecules is initiated at temperatures of 120–140oC depending
upon the depth of rocks. At temperatures greater than 180 1C, almost all the hydrocarbons are converted in to
methane
Migration of fluids Gas migration. Upward migration of hydrocarbon gases from lower to upper horizons along faults. This can result in
overpressuring of upper horizons
Changes in fluid pressure (hydraulic
head); movement of fluids
Osmosis Osmosis. Contrasts in the brine concentration of formation fluids can induce the transfer of fluids across a
semipermeable membrane. On regional basis, e.g., San Juan Basin, New Mexico; Western Sedimentary basin,
Canada; San Joachim Valley, CA, USA, Gulf Coast; and Paradox Basin, IL, USA
Fluid pressure head Piezometric fluid level. Effect of regional potentiometric surface, e.g., artesian water system. Examples would include
the Artesian Basin, FL, USA, Great Artesian Basin, Australia; and North Dakota Basin, USA
Structure of permeable reservoir. Pressure transmission to a shallower part of reservoir. Large anticlines, steeply
dipping beds, etc
Oilfield production operations Repressuring of reservoir rocks. Can occur as a result of massive fluid injection or fluid influx into the formation, i.e.,
massive water injection program (secondary recovery). Pressure increase may occur across faults, or behind casing
Permafrost environment Formation of frost heaves (pingos). Permafrost environment: trapping of unfrozen zone in practically closed system.
Freeze-back pressures around shut-in arctic wells. Gas hydrate reservoirs (e.g., Mackenzie Delta, Canada)
Difference in specific weight Density difference. Difference between the weight of gas column and that of a fluid (oil or water) column
ORIG
INOF
ABNORMAL
FORMATIO
NPRESSURES
67

TABLE 3.5
Types of mechanisms responsible for generating abnormally-low formation pressures (ALFP) (after Chilingar et al., 2002)
Type of changes Description of process
Changes in the rock pore volume
Rock dilatancy Increase in pore volume. During erosion of shallow-buried, clay-rich lithology, dilation of the pores can occur
Tectonic movements Local and regional faulting, earthquakes, etc. With increase in tension of the formation, the pore volume may
increase
Increase in pore volume Dissolution of cementing material. Dissolution of cementing materials such as CaCO3 can increase the pore volume
Changes in the volume of interstitial
fluids
Temperature change Thermodynamic effects. Cooling of the formation (e.g., due to uplift or erosion) can cause the contraction of fluids
and, thus, decrease the fluid pressure
Changes in fluid pressure (hydraulic
head); movement of fluids
Osmosis Osmosis. Contrast in the brine concentration of formation fluids can result in the transfer of fluids across a
semipermeable membrane. This can result in a loss of fluids across a semipermeable membrane with a resultant drop
in the fluid pressure, in the upstream side of the system
Production of fluids (gas, oil, and/or
water)
Depressuring of reservoir rocks. Can occur as a result of massive fluid production from the formation that is not
replaced by an influx of fluids from the adjoining formations, i.e., massive water depletion of producing formations
Migration of gases Gas migration. During uplift, gas is often able to come out of solution as the temperature and confining pressure is
reduced. The freed gas may then escape toward the surface by diffusion or along faults, reducing the pore pressure
of the rock
Groundwater movement Fluid movement. Difference between the permeabilities of discharge and recharge areas, as more fluids are leaving
the system than entering it
TEMPERATUREAND
PRESSURE
INTHESUBSURFACE
68

Reservoirs with ALFP have been recognized mainly in the low-permeability, gas-
saturated reservoirs in uplifted basins. The mechanisms for generating under-
pressured reservoirs relate to changes in the rock and fluid properties during
erosional uplift, e.g., as a result of reduction in temperature, rock dilatancy, gas
solubility, and groundwater discharge.
ORIGIN OF ABNORMAL FORMATION PRESSURES 69

This page intentionally left blank
70

Chapter 4
WATER
4.1. PHYSICAL AND CHEMICAL PROPERTIES OF WATERS
In the environment of the Earth’s upper crust, water plays a vital role. Even
subaerial deposits became enriched in water content during diagenesis and
epigenesis. Water reaches a maximum density at +4 1C. Its critical temperature is
374 1C and its critical pressure is 21.8MPa. Water density declines as its composition
changes from hard to alkaline. Water viscosity is 1.789 cp at 0 1C and 0.282 cp at
100 1C. Water viscosity decreases with increasing temperature and increases with
increasing density and content of calcium and magnesium. Water can reach its
critical pressure at a depth of about 2000m, which affects some features of the
hydrocarbon habitat in the Earth’s crust (for instance, hydrocarbon dissolution).
Water is a stable chemical compound. Noticeable decomposition of water occurs at a
temperature of greater than 2,000 1C.
At great depth (about 100 km), when pressure is nearly 1,000MPa and
temperature is 600–900 1C, electrons are totally or in part torn-off from the atoms;
the atoms are close together and are tightly packed. In such an environment, water
as a chemical compound, H2O, cannot exist. Water dissociation into H+ and OH�
ions under standard conditions is low — a mere 10�7. The amount of free hydrogen
ions in water substantially affects its properties as solvent and catalyst for various
chemical reactions. The pH is the negative logarithm of H+ concentration. Alkalis
and alkaline earth’s metals increase the pH. At pH ¼ 7, the medium is neutral; when
pH is greater than 7, it is alkaline, and when pH is lower than 7, it is acidic.
The pH of the ground water ranges from 5.6 to 8. The pH is strongly affected by
CO2 content in water and much less affected by H2S, HCl, and some other volatile
components. An increase in CO2 content in the water lowers pH. Consequently, at
depth, the stability domain for various minerals shifts.
The interfacial tension between the water and oil is highest for hard water
(22.671–5N/cm) and lower, for the alkaline water (4.471–5N/cm). The greater the
time of contact between the oil and water, the lower is the interfacial tension. In case
of bacterial infestation, a clear interface between the oil and water may be absent.
Water compressibility is very low. Bulk volume elasticity coefficient for the oilfield
formation water lies between 3� 10�4 and 5� 10�4MPa. Dissolved gases in the
water and increasing temperature drastically raise the bulk volume elasticity
coefficient. In petroleum engineering, the formation volume factor (FVF) is
calculated by dividing the water volume at reservoir conditions by its volume under
standard conditions (0.1MPa, 20 1C).
Heat conductivity of water depends on the concentration of dissolved salts and
temperature and can be determined by logging (see Khilyuk et al., 2000).
71

Radioactivity of formation water is determined by the presence of dissolved
radium, uranium, radon, and thorium compounds. Their content in oilfield
formation water is as low as 10�7–10�11.
The capability of water to dissolve gaseous hydrocarbons is reviewed in Chapter 6.
Liquid hydrocarbons under standard conditions (0.1MPa and 20 1C) are almost
insoluble in water. A film of surface tension is clearly observed between water and
liquid hydrocarbons. This solubility increases as temperature and pressure increase.
This process is especially clear at a temperature of about 150 1C and near-critical
pressure (21.8MPa). The critical point of the water–oil binary solution is not studied
well. Besides, such a solution can hardly be called ‘‘binary,’’ because the oil itself is a
complex system of interacting components with very diverse critical temperatures
and pressures.
The study of critical temperature of oils is not easy, because their flash points are
often below their critical temperatures. There is a drastic increase in the solubility of
liquid hydrocarbons in water with increasing temperature and upon exceeding the
critical pressure of water.
If oil is not completely dissolved in water, chemical composition of the dissolved
oil may be substantially different from that of the original oil. Light oil is more
soluble in water than the heavy oil, and its critical temperature is lower than that of
the heavy oil. Possibly, the relatively light oils may have a high solubility at lower
temperatures (below 100 1C). The reason for the latter supposition is that the
solubility of hydrocarbons belonging to the same chemical type decreases with
increasing molecular weight. With the same number of carbon atoms in the
molecule, aromatic hydrocarbons are more soluble than the other hydrocarbons.
The writers did not analyze here the colloidal–emulsion solution mechanism of
hydrocarbons in water (although sometimes this type of solubility may be higher
than the true solubility). The reason is that the colloidal–emulsion solution
mechanism appears to play a very limited role in the hydrocarbon transfer in nature.
Beletskaya (1990, p. 40) lists the following reasons for this:
(1) difficulties associated with the micelle movement in the pore space of rocks;
(2) destruction of colloids with temperature increase;
(3) adsorption of surfactants by rocks and the destruction of micelles and
emulsions;
(4) electric barrier — hydrocarbon micelles are negatively charged, are hydrophilic,
and move with difficulty along the mineral surfaces;
(5) the need for the presence of surfactants at reservoir conditions to a degree
sufficient to overcome the barrier of the critical micelle-formation concentration.
Beletskaya (1990) stresses the fact that surfactants lose their properties with
increasing temperature. In the experience of writers, water-in-oil emulsions break at
higher temperatures.
On basis of the aforementioned fact, it is reasonable to suggest the absence, in
many cases, of a clear-cut oil–water contact (OWC) and the presence of a transition
zone. A stable oil–water emulsion can form within a transition zone as a transitional
state between the two immiscible liquids. The thickness of the transition zone
depends on the chemical properties of oil and water and on the subsurface
WATER72

temperatures and pressures. It may be suggested that in some specific situation the
transition zone can actually extend over the entire thickness of the accumulation.
The following accumulations may be placed in this group:
(a) those where the OWC was determined from logs at the level of 50% oil
saturation (a quite frequent case); or
(b) those where the OWC was determined at the depth of perforated interval that
produced water-free oil, which is not rare.
In the latter case, one may also anticipate the effect of relative permeability. The
relative permeabilities to oil and to water depend on the rock properties (oil-wet
versus water-wet), alkalinity7 of water, and the presence of polar substances in oil.
The relative permeability to oil increases with increasing amount of polar substances
in the oil, whereas the relative permeability to water decreases (Langnes et al., 1972,
pp. 228–230). In the presence of alkaline water, the relative permeabilities both to oil
and to water increase (Fig. 4.1).
A typical relationship between the relative permeability and capillary pressure, as
well as the effect of these two parameters on productivity, is illustrated in Fig. 4.2.
Despite numerous studies, the structure of the liquid water represents an unsolved
problem. Most scientists believe that there are two types of water: (1) the first type
forms a tetrahedral grid and (2) a portion of molecules of the second type is located
within the tetrahedral frame and are connected with it by n-bonds. These n-bonds
completely disintegrate upon reaching the critical temperature. When the ice melts, a
Fig. 4.1. Relative permeability curves for polar oil+alkaline water (curves 1 and 10) and for polar
oil+hard waters (curves 2 and 20) (modified after G. A. Babalyan, in: Langnes et al., 1972, p. 229).
7For alkaline water. rNa+/rCl�41; (rNa+�rCl�)/rSO42�41; (rNa++rCl�)4rSO4
2�; rHCO3�4r-
Ca++rMg+; rNa++rK+4rCl�+rSO42�. For hard water, rNa+/rCl�o1; (rCl��rNa+)/rMg+41;
rCl�+rSO42�4rNa++rK+ (r ¼ %-equivalent).
PHYSICAL AND CHEMICAL PROPERTIES OF WATERS 73

portion of molecules leave the frame and move into the pores, thereby increasing the
water density.
The structure of water solutions depends on the structure of water and the
dissolved substances. There may be a positive and negative hydration. The former
one increases, whereas the latter decreases the n-bonds in solution. The solubility of
Fig. 4.2. Reservoir-rock productivity as determined from capillary pressure and relative permeability
curves (modified after J. J. Arps by R. L. Jodry, in: Chilingar et al., 1972, p. 53). Smallest pore throats
effective at any pressure level are shown on scale to the right of capillary pressure curve.
WATER74

liquid and gaseous non-electrolytes declines when charged ions appear in the
solution, which facilitates their precipitation out of solution.
Hydrogen and oxygen in water may have different isotopic composition. Three
hydrogen isotopes (protium H, deuterium D, and tritium T) are encountered in
water. The first one predominates. The D/H ratio ranges from 1/8,400 to 1/3,800.
Only tritium is radioactive; it is very scarce (T/H ratio is usually negligible — about
10�18).
Six oxygen isotopes are known: 14O, 15O, 16O, 17O, 18O, and 19O. The 14O, 15O,
and 19O isotopes are radioactive, but with a short half-life. The most common
isotope is 16O.
Water density r depends on the isotope composition of water (r ¼ 10�6d, where d
is the water density at 3.98 1C in g/cm3). Surface water and the water within the free
circulation zone are of normal density. Water density increases within the zones of
stagnation (limited circulation).
The amount of dissolved and colloidal substances in the water is represented by its
salinity. The salts are chlorides, sulfates, and bicarbonates of alkaline and alkaline-
earth metals. It is assumed that these salts totally dissociate in water into the equal
number of cations and anions. This assumption forms the basis for the ion-
equivalent presentation format of the water composition. This is true for weak
solutions, but is not justified when the concentration of salt is high. This is important
to remember when interpreting electric log; there is no straight-line relationship
between the water salinity and the electric conductivity of water.
Mineral composition of ground water may be expressed in terms of weight (mass) (as
g/l, g/kg, g/100 g), or in terms of equivalents. To obtain the latter, the weight is divided
by the ion-equivalent value. The sums of anion and cation equivalents are considered to
be equal to 100%, and the ion percent-equivalent is calculated on this basis.
4.2. CLASSIFICATIONS OF OILFIELD WATERS
Waters can be classified in a number of ways. Most commonly they are grouped
according to the following criteria:
(1) water origin — meteoritic, connate, or juvenile waters,
(2) water chemistry, e.g., bicarbonate, sulfate, or chloride waters, and
(3) total water salinity, i.e., fresh water, saline water, or brine water.
Many chemical classifications have been proposed or discussed by Tolstikhin
(1932), De Sitter (1947), Durov (1948), Sulin (1948), Vassoyevich (1954), Chebotarev
(1955), Krejchi-Graf et al. (1957), Gorrell (1958), Rainwater and White (1958),
Chave (1960), and Eremenko (1960), to mention just a few investigators. For
example, see Table 4.1 (in: Eremenko and Chilingar, 1996). The water classifications
have been reviewed in Chilingar (1957, 1958), Chilingar and Degens (1964), and
Samedov and Buryakovsky (1966).
As an example, the classification scheme of N. I. Tolstikhin (in: Vassoyevich, 1954,
p. 112) is presented in Fig. 4.3. It is based principally on the distribution of the most
abundant cations (Na+, Mg2+, Ca2+) and anions (HCO3�, Cl�, SO4
2�). In following
CLASSIFICATIONS OF OILFIELD WATERS 75

this scheme, one may chemically classify water, for instance, as sodium bicarbonate
type, or calcium chloride type, depending on the position the prospective water
occupies in the diagram. The representative oilfield waters fall within the dashed area.
Additional information on the chemistry of petroleum brine waters and their genetic
coefficients is presented in Table 4.2 and Fig. 4.4.
TABLE 4.1
Comparison of Three Different Classifications of Water based on Ionic Content (in: Eremenko and
Chilingar, 1996)
After V. A. Sulin After O. A. Aleksin After M. G. Valyashko
Bicarbonate-sodium rHCO3�4(rCa2++rMg2+) Carbonate
Sulfate-sodium rHCO3�4(rCa2+ +rMg2+)o(rHCO3
�+rSO42�) Sulfate type, sodium subtype
Chloride-magnesium (rHCO3�+rSO4
2�)o(rMg2++rCa2+) Sulfate type, magnesium subtype
HCO3� is absent, water is acidic
Chloride-calcium (rHCO3�+rSO4
2�)o(rCa2++rMg2+) Chloride
HCO3� is absent, water is acidic
Fig. 4.3. Graphical representation of chemical composition of oilfield waters: vertically lined areas
represent calcium chloride waters; horizontally lined areas represent alkaline waters (after Tolstikhin, in:
Vassoyevich, 1954, p. 112). Sampling areas: (1) Lake Onega; (2) Darasun mineral springs; (3) Lake Baikal;
(4) Okha oilfield waters, Sakhalin Island; (5) World Ocean; (6) Usol’e Sibirskoye; (7) Ukhta oilfield waters,
Russia; and (8) Grozny oilfield waters, Russia.
WATER76

TABLE 4.2
Comparison of Chemical Composition of Marine and Oilfield Waters of Azerbaijan (after Mekhtiev, 1956, p. 303)
Location Percent-equivalent (r) Palmer’s salinity and alkalinity coefficients
Cl� SO42� HCO3
� Ca2+ Mg2+ Na++ K+ S1 S2 A a
Karachukhur (NKP) — 0.39 5.82 0.08 0.69 49.23 89.76 — 10.52 1.52
Balakhany-Sabunchi-Ramany (PK) 31.77 — 19.23 0.81 1.01 48.18 60.06 — 36.38 3.56
Bibieibat (unit VII) 49.58 — 0.42 4.44 5.35 40.21 80.40 18.80 — 0.80
Neftechala 49.74 0.23 0.03 11.02 4.70 34.28 66.96 32.98 — 0.06
World Ocean 45.22 4.62 0.16 1.77 8.92 39.31 78.60 21.10 — 0.30
Caspian Sea 34.58 14.51 0.91 3.81 13.81 32.28 64.56 33.62 — 1.82
CLASSIF
ICATIO
NSOFOIL
FIE
LD
WATERS
77
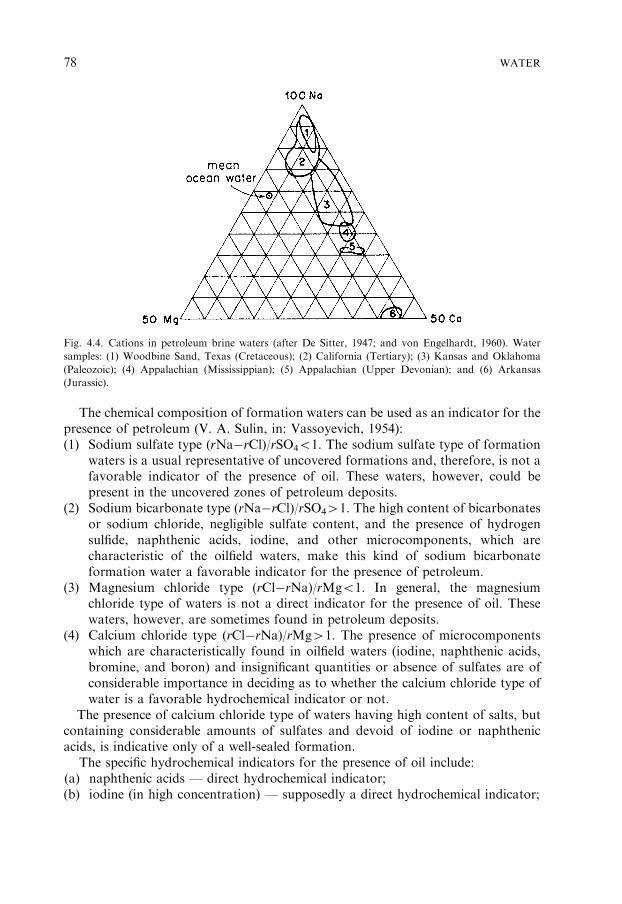
The chemical composition of formation waters can be used as an indicator for the
presence of petroleum (V. A. Sulin, in: Vassoyevich, 1954):
(1) Sodium sulfate type (rNa�rCl)/rSO4o1. The sodium sulfate type of formation
waters is a usual representative of uncovered formations and, therefore, is not a
favorable indicator of the presence of oil. These waters, however, could be
present in the uncovered zones of petroleum deposits.
(2) Sodium bicarbonate type (rNa�rCl)/rSO441. The high content of bicarbonates
or sodium chloride, negligible sulfate content, and the presence of hydrogen
sulfide, naphthenic acids, iodine, and other microcomponents, which are
characteristic of the oilfield waters, make this kind of sodium bicarbonate
formation water a favorable indicator for the presence of petroleum.
(3) Magnesium chloride type (rCl�rNa)/rMgo1. In general, the magnesium
chloride type of waters is not a direct indicator for the presence of oil. These
waters, however, are sometimes found in petroleum deposits.
(4) Calcium chloride type (rCl�rNa)/rMg41. The presence of microcomponents
which are characteristically found in oilfield waters (iodine, naphthenic acids,
bromine, and boron) and insignificant quantities or absence of sulfates are of
considerable importance in deciding as to whether the calcium chloride type of
water is a favorable hydrochemical indicator or not.
The presence of calcium chloride type of waters having high content of salts, but
containing considerable amounts of sulfates and devoid of iodine or naphthenic
acids, is indicative only of a well-sealed formation.
The specific hydrochemical indicators for the presence of oil include:
(a) naphthenic acids — direct hydrochemical indicator;
(b) iodine (in high concentration) — supposedly a direct hydrochemical indicator;
Fig. 4.4. Cations in petroleum brine waters (after De Sitter, 1947; and von Engelhardt, 1960). Water
samples: (1) Woodbine Sand, Texas (Cretaceous); (2) California (Tertiary); (3) Kansas and Oklahoma
(Paleozoic); (4) Appalachian (Mississippian); (5) Appalachian (Upper Devonian); and (6) Arkansas
(Jurassic).
WATER78

(c) bromine — does not have a genetic relationship to oil; however, many oilfield
waters characteristically contain high concentrations of bromine;
(d) boron — supplementary hydrochemical indicator, which is more common in the
bicarbonate type of waters;
(e) ammonium — indirect hydrochemical indicator; and
(f) barium and strontium — supplementary indicators, which do not have genetic
relationship to petroleum.
The presence of organic components is the most typical feature of oilfield water.
The presence of liquid and gaseous hydrocarbons in water facilitates reduction
processes (especially near the hydrocarbon accumulations) and the appearance of
various organic substances in water.
The reduction of sulfate ions results in the formation of hydrogen sulfide. The
generated hydrogen sulfide diffuses into the surrounding rocks and reacts with the
oxides of iron, forming pyrite and siderite. The rocks even change in color from
reddish and greenish to gray and dark-gray. These indications are considered as
favorable in exploration. The presence or absence of sulfates in the subsurface water is
not an indicator: concentration of sulfates in water depends not only on the reduction
processes but also on the input of the SO42� ions from the surrounding rocks. The
sulfate reduction is possible at rather high temperatures (300–500 1C). The writers
believe that the sulfate reduction may occur at lower temperatures, at a slow rate, in
the low-pH environments. Microorganisms can reduce sulfates at temperatures even
as low as 70 1C. For example, Desulfovibrio desulfuricans in injection waters can
reduce sulfates to sulfides and convert ‘‘sweet’’ oilfield waters into ‘‘sour’’ ones.
Oilfield waters are highly reduced. The extent of the reduction is evaluated from
the amount of oxidizing substance, potassium iodate or permanganate. The oilfield
waters are also enriched in volatile and non-volatile phenols and fatty and
naphthenic acids. Up to a temperature range of 120–150 1C, liquid hydrocarbons are
barely soluble in water. Currently, the only compound that was clearly identified was
benzene, which is typical for water in the accumulations of highly aromatic
condensates. When water is moving, gaseous hydrocarbons soluble in water form, in
terms of their concentration, front and back effects. Same effects are typical for all
other geochemical indicators.
Oilfield waters contain iodine, bromine, boron, aluminum, and mercury. Gas and
gas-condensate accumulations usually have elevated amounts of iodine in brines.
High-salinity brines contain bromine, whereas alkaline water is enriched in boron.
Formation water of gas accumulations contains mercury. Various nitrogen-rich
substances (such as amines and complex heterocyclic compounds including pyridine)
are also found in brines.
4.3. WATER DRIVE
Subsurface water is encountered in a solid state (‘‘ice’’), liquid state, and steam (at
high temperature). Interstitial water may be free to move or is bonded (residual,
irreducible water). Free water is subdivided into gravity water and capillary water.
WATER DRIVE 79

Gravity water can move as a result of gravity force, obeying the Darcy’s law; it
transmits the hydrostatic pressure. Surface tension affects the water not as strongly
as the gravity force, and has only slight effect on permeability. With increasing role
of interfacial tension, water can be classified as ‘‘capillary.’’ Thus, gravity can be in
equilibrium with interfacial tension. Capillary water can also transmit hydrostatic
pressure, but very slowly (within the lower limit of applicability of Darcy’s law). A
further increase in the role of interfacial tension results in the appearance of loosely
bonded water (film water, physically bonded water).
The properties of film water are quite different from that of free water. It moves
according to the law of diffusion toward equalization of the film concentration on
the grain surfaces. Firmly bonded water (adsorption water) is retained in place by
surface tension (41,100MPa), but is easily removed as steam with increasing
temperature. Upon thermolysis, the first peak occurs at a temperature above 100 1C.
Some authors (see e.g., Beletskaya, 1990; Simonenko, 1988) call this firmly bonded
water a ‘‘sub-melted’’ water layer, 0.01–0.006 mm thick. This layer can move
somewhat easier than the physically bonded water. The molecule orderliness,
viscosity, and shear strength in such ‘‘sub-melted’’ water are less that in the
irreducible water (Tsarev, 1978).
When a hydrocarbon accumulation is formed, hydrocarbons push the free water
out of the accumulation, whereas the capillary water is retained. After the oil and gas
are produced, the equilibrium in the reservoir changes. The ‘‘sub-melted’’ and some
capillary water is produced and may account for between a fraction of one percent
and a few dozen percents of the production. The content of such water depends on
surface phenomena, and that is why this content is greater in beds with greater active
surface. In a clay–sand–carbonates series, the content of such water decreases in the
reservoirs as well as in the produced fluids. Gas produced from carbonate reservoirs
may contain as low as 1% of water.
There are transitions between the aforementioned types of water. Sometimes more
detailed subdivisions are used, such as mono- and poly-molecular layers (i.e., the
number of molecules in a layer), in the water film surrounding the grains. If bonded
water becomes free, its general properties change: density increases, and the solution
capacity decreases. Thus, the released bonded water is fresher and aggressive.
Chemically bonded water is a constituent part of minerals. It includes the crystal-
hydrate (zeolite) and constitution waters. The amount of crystallization water in
minerals is not constant and may be removed by heating to 450–500 1C. Interlayer
montmorillonite water is the crystallization water. A mineral does not necessarily
decompose after the removal of crystallization water. It may only change its form
(e.g., gypsum-anhydrite; montmorillonite-illite). The removal of the constitution
water, on the other hand, results in the destruction of mineral. It occurs when
temperature exceeds about 500 1C.
4.3.1. Water drive systems
The studies of water drive systems in the oil (gas) fields and basins followed the
studies of hydraulic systems in artesian basins. The term ‘‘oil/gas basin’’ was adopted
WATER80
from the latter studies because some writers tied-in the very formation of oil and gas
accumulations with the development of artesian systems.
As long as the shallow and relatively young hydrodynamic basins were being
studied, there were no significant contradictions. Water intake (recharge) and
possible discharge areas were identified in most cases. Abundant rains in the
Caucasus Black Mountains resulted in raising the static water levels in wells of the
Old- and New-Grozny oilfields after 1–1.5 months. By adding tracers to water,
the movement of water sometimes could be recorded up to a few dozen kilometers.
Such basins have the water (infiltration) drive. Water moves from the recharge
areas (nearby hilly or mountainous regions) to the discharge areas (open: e.g.,
springs and rivers, or concealed: such as, cross-flow into different horizons). Water
velocity is quite high (in tens of meters per year), depending on the hydraulic head
drop from the recharge to the discharge area. No overpressure or abnormally-high
pressure is observed in the associated oil and gas accumulations. The water has low
salinity. The environment is oxidizing, especially in the first few hundred meters from
the surface (although the free oxygen disappears after less than a few tens of meters).
Some geologists believe that the presence of infiltration drive is unfavorable for
the oil and gas generation. The presence of numerous accumulations (some of them
quite large) in such cases is believed to be due to subsequent migration. The writers,
however, believe that a conventional view of the accumulations being destroyed by
the infiltration water is somewhat exaggerated.
The oil accumulations can be destroyed in several ways:
(1) Washing-out of the oil from accumulations by the way of tangential
transmission of water movement, layer-by-layer, up to the static oil accumula-
tion. This process is unlikely at reservoir environment because it requires a very
high speed of water movement. P. A. Antonov (in: Eremenko and Chilingarian,
1996, p. 53) calculated that velocity will be over 20 cm/s for a permeability of
500mD, which is impossible in a basin.
(2) Chemical dissolution of liquid hydrocarbons in water and their delivery to the
surface. As previously mentioned, solubility of liquid hydrocarbons in water at
surface or near-surface environments is very low, so that it would take a few tens
of millions of years to destroy even a medium-size accumulation.
(3) Oxidation of the oil in accumulations through the action of aggressive water. In
such a case, a layer of oxidized oil forms between the oil and water. This layer
protects the accumulation from further destruction. It is similar to the asphalt
plug in an oil-bearing bed at its surface exposure; the difference is that the light
fractions of oil cannot be vented into the atmosphere.
(4) Squeezing-out the oil deposit out of the trap owing to the pressure drop at the
contour (Hubbert’s principle; see also Savchenko, 1977). Although this is
plausible, the process is very slow and is controlled by the reservoir permeability
and by the inclination angle of the barrier. In order for the accumulation to be
destroyed, the water/oil separation dip angle must be greater than that of the
inclination angle of the barrier.
A totally different situation occurred in the deeply buried basins, where
compaction and squeezing-out of water from the rocks are still continuing (see the
WATER DRIVE 81
sections on rocks: squeezing-out of water, different heat expansion rates, and
neoformations). Water-head distribution in such basins is inverted. Water-head
decreases from the deepest portion toward the edges. N. B. Vassoyevich (in:
Eremenko and Chilingar, 1996, p. 53) proposed to call such basins ‘‘elision’’ basins.
The water-head in such a basin reflects the potential energy distribution, i.e., an
opportunity for reservoir water to move from the basin center to its periphery. This
can happen, but slowly. The distribution of anomalous pressure, which forms,
follows a certain pattern: higher in the center, decreasing upslope to a total
disappearance at the edges.
Reservoir water is saline, sometimes with the geochemical inversion (salinity
decreases with depth) and the reducing environment. The best oil and gas potential
exists in the ‘‘elision’’ water-head complexes. Oil and gas accumulations, formed
during the formation of stratigraphic sequences, are associated with the periphery of
present-day and ancient depressions, separated by highs and with major swells
present in the way of possible underground water movement (Bars, 1984). This
overconfident statement may well be true but is difficult to prove: comparable
amounts of hydrocarbons are known in basins with different hydrodynamic regimes.
Further evolution in such basins may create reservoirs cut into blocks, which
changes basin parameters. Inasmuch as the individual fault blocks are isolated from
one another, the anomalous pressure in each one is distinct. This also stops or at
least substantially limits the lateral migration. Numerous faults along and across the
strike make the vertical migration within the formation, and sometimes outside
of it, easier. The water composition does not change gradually but rather in a
stepwise manner. Changes in the water composition are easier to identify in the
section rather than in a lateral direction. The communication with the surface occurs
along the basin periphery where the thickness is lower. A typical infiltration drive
arises there.
This kind of a combination/isolated differential drive is quite common but has not
been named yet. Together with the infiltration and ‘‘elision’’ drives, Beletskaya
(1990, p. 34) distinguishes the thermohydrodynamic (deep subsurface) drive. She,
however, does not provide its description. The Mesozoic sequence of the North
Caucasus region is a typical example. Gas accumulations there are encountered at
the transition boundary between the block-isolated (deep subsurface) drive and the
infiltration drive. Before some other basins are studied in this respect, it is difficult to
tell at this time to what extent this phenomenon is common for the basins with
combination/isolated drive.
The appearance (or the preservation) of the infiltration drive is quite possible in
the basins with a typical ‘‘elision’’ drive. Such may be the Paleozoic basins in the
Volga-Ural Province. This, however, does not involve the entire basins. The deepest
portions of basins may preserve the ‘‘elision’’ drive with its characteristic anomalous
pressure. Still, this anomalous pressure is usually significantly lower than that at an
equal depth in typical younger ‘‘elision’’ basins.
At this time there is no technique or reliable parameters available to distinguish
between the preserved infiltration drive and the re-infiltration drive. It is quite
possible, however, to eventually develop such technique.
WATER82
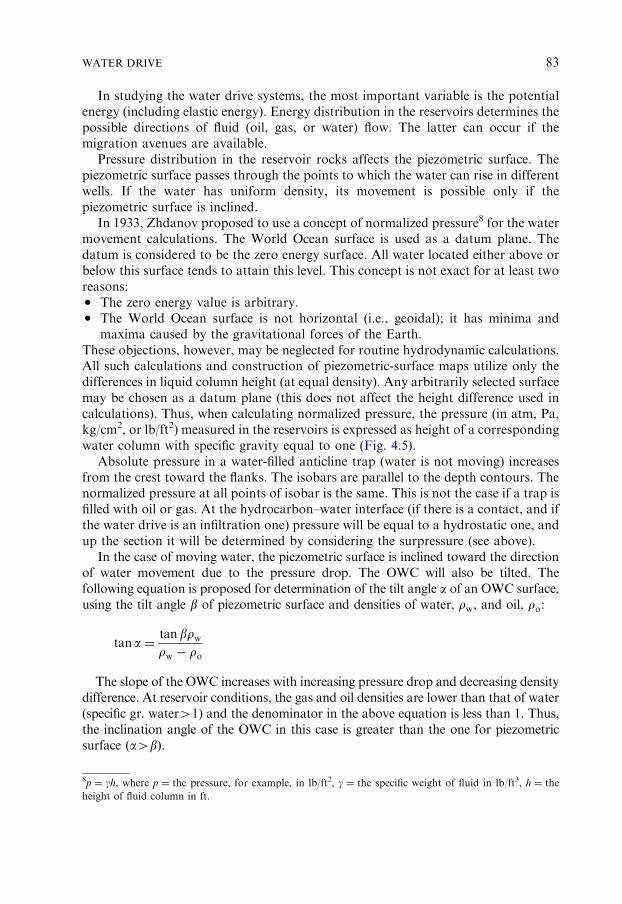
In studying the water drive systems, the most important variable is the potential
energy (including elastic energy). Energy distribution in the reservoirs determines the
possible directions of fluid (oil, gas, or water) flow. The latter can occur if the
migration avenues are available.
Pressure distribution in the reservoir rocks affects the piezometric surface. The
piezometric surface passes through the points to which the water can rise in different
wells. If the water has uniform density, its movement is possible only if the
piezometric surface is inclined.
In 1933, Zhdanov proposed to use a concept of normalized pressure8 for the water
movement calculations. The World Ocean surface is used as a datum plane. The
datum is considered to be the zero energy surface. All water located either above or
below this surface tends to attain this level. This concept is not exact for at least two
reasons:� The zero energy value is arbitrary.� The World Ocean surface is not horizontal (i.e., geoidal); it has minima and
maxima caused by the gravitational forces of the Earth.
These objections, however, may be neglected for routine hydrodynamic calculations.
All such calculations and construction of piezometric-surface maps utilize only the
differences in liquid column height (at equal density). Any arbitrarily selected surface
may be chosen as a datum plane (this does not affect the height difference used in
calculations). Thus, when calculating normalized pressure, the pressure (in atm, Pa,
kg/cm2, or lb/ft2) measured in the reservoirs is expressed as height of a corresponding
water column with specific gravity equal to one (Fig. 4.5).
Absolute pressure in a water-filled anticline trap (water is not moving) increases
from the crest toward the flanks. The isobars are parallel to the depth contours. The
normalized pressure at all points of isobar is the same. This is not the case if a trap is
filled with oil or gas. At the hydrocarbon–water interface (if there is a contact, and if
the water drive is an infiltration one) pressure will be equal to a hydrostatic one, and
up the section it will be determined by considering the surpressure (see above).
In the case of moving water, the piezometric surface is inclined toward the direction
of water movement due to the pressure drop. The OWC will also be tilted. The
following equation is proposed for determination of the tilt angle a of an OWC surface,
using the tilt angle b of piezometric surface and densities of water, rw, and oil, ro:
tan a ¼tan brwrw � ro
The slope of the OWC increases with increasing pressure drop and decreasing density
difference. At reservoir conditions, the gas and oil densities are lower than that of water
(specific gr. water41) and the denominator in the above equation is less than 1. Thus,
the inclination angle of the OWC in this case is greater than the one for piezometric
surface ða4bÞ.
8p ¼ gh, where p ¼ the pressure, for example, in lb/ft2, g ¼ the specific weight of fluid in lb/ft3, h ¼ the
height of fluid column in ft.
WATER DRIVE 83

The above analysis enables one to formulate the main condition for the
preservation of an accumulation within a hydrodynamic trap. The inclination angle
of the OWC must be lower than the dip angle of the trapping flank. If these two
angles are equal (and even more so, if their magnitudes are reversed), the
accumulation can be squeezed-out of the trap down-dip. The speed of squeezing is
determined by the speed of water flow, which is rather slow in a porous medium
(Darcy law). All this is true when the water density remains constant.
If the subsurface water density changes only vertically and remains constant along
any horizontal plane, the A. I. Silin-Beckchurin or M. Hubbert equation9 can be
used to calculate the normalized pressure (pnorm):
pnorm ¼ pþ
Z z
z0
grðzÞ dz
where rðzÞ ¼ the water density changing in the vertical direction, zo ¼ the elevation
of a comparison (reference) surface (horizontal datum plane) with equal normalized
pressure, and g ¼ the gravitational acceleration.
Fig. 4.5. The concept of normalized pressure. HA is the height of the liquid column at point A (pressure
head at point A), HB the height of the liquid column at point B (pressure head at point B), hA ¼ the
normalized height of liquid column at point A (normalized pressure head at point A), hB ¼ the normalized
height of liquid column at point B (normalized pressure head at point B). ðHA þ zAÞ�
ðHB þ zBÞ ¼ hA � hB, where zA is the potential head at point A, zB the potential head at point B. pAðpressure at pointAÞ ¼ gfHB; pB ðpressure at pointBÞ ¼ gfHB, where gf is the specific weight of fluid. If
specific weight is in lb/ft3 and H is in ft, then pressure is in lb/ft2.
9F ¼ gðz� zoÞ þ ðp� poÞ=r. If the datum plane is taken at sea level [zo ¼ 0 and po ¼ 0 (atmospheric
pressure)], the equation becomes F ¼ gzþ p=r.
WATER84

If in the above equation the density is changing linearly, and zo is at the sea level,
then:
pnorm ¼ pþgðrþ roÞ
2z
If the water density does not remain constant both horizontally and vertically,
neither of the above techniques is applicable. In such a case, a vector of the filtration
force for limited bed volume is calculated.
As Gattenberger (1984) stated, ‘‘the possibility of obtaining objective information
on the subsurface water movements based on the analysis of static levels (Hubbert’s
potentials) or normalized pressure is available only if the changes in the static levels,
potentials, or normalized pressure drops are greater than their combined calculated
error.’’
In order to better define the role of hydrochemical and geochemical studies in the
field surveys (and production), the following formation water classification is
presented below:
1. Lower edge water. The lower edge water resides within the same reservoir as the
accumulation outside the OWC/GWC. In case of hydrodynamic drive, such
water is the main source of the potential energy pushing oil (and, to some extent,
gas) toward the well. This is clearly observed at depths with pressures close to the
critical one for water (2–2.5 km). Approximately at that depth a distinct water–oil
(gas) separation disappears to be replaced by a transition zone (see above). All
previously developed concepts and practical recommendations as to the
‘‘contour’’ behavior at these conditions must be reconsidered.
2. Upper edge water. The upper edge water occurs within the same reservoir as the oil
(gas) accumulation, up-dip of it in a monocline or the flank of a structure. It is rare,
which may be simply due to the lack of knowledge: it was believed that such an
occurrence is impossible. As Confucius remarked, ‘‘no sense in trying to catch a
black cat in a dark room if the cat is not there.’’ The first mention of such a water
goes back to the early 20th century when it was encountered (Gubkin, 1915) in the
so-called ‘‘inlet-like’’ oil accumulations in the Maykop Formation (Krasnodar
Region, Russia). At that it did not receive a due attention (‘‘a black cat’’). The
existence of such water may be explained by the change in porosity, and
the capillary forces. This explanation, however, was not valid in the case of San
Juan Field in Alberta, Canada. There, a gas accumulation in a 3,000-ft-high
syncline (surplus pressure of over 30MPa), is trapped by the upper edge water
with a simultaneous increase in the porosity up-dip from 14% to 25% and increase
in the average pore diameter. The pressure increases from the syncline flanks
to its trough. Two possible explanations were proposed: (a) change in the
wettability of rock properties from hydrophilic to hydrophobic and (b) the volume
of currently forming gas exceeds the gas loss due to migration through the upper
edge water.
3. Bottom water. The bottom water occurs within the same reservoir as the oil (gas)
underneath the entire accumulation or its near-edge portions. Reservations
expressed above (No. 1) are applicable.
WATER DRIVE 85

4. Formation water. Usually, a well producing 1–2% of water is called ‘‘water free;’’
100% water-free wells are rare. Formation water has diverse origins, potential
energy, and chemistry. If this water is fresh or has very low salinity, its origin
could be due to condensation out of the gas phase (if present), when the
formation pressure or the bottomhole pressure drops. Formation water may have
been earlier isolated in hydrodynamic traps (small interbeds, lenses, etc.) or may
have been present throughout the reservoir. When the water coning or fingering
occurs, such water can substantially accelerate the water encroachment process.
5. Intermediate water. The intermediate water is associated with thin interbeds
within an oil/gas-producing interval. When the volume of such water is low it is
possible to assign it to the previous category.
6. Upper water. The upper water is associated with independent overlying aquifers.
7. Lower water. The lower water is associated with independent underlying aquifers.
The identification of water category encountered or expected in an accumulation is
very important. It affects the field development strategy, well pattern, production
techniques, reservoir management, drilling, and workover. These issues are solved
taking into account hydrogeologic conditions not just in a single accumulation but in
the entire field. Especially important is the information about changing hydro-
geologic environment in that field. The information about the pre-development
hydrogeologic (hydrodynamic and hydrochemical) environment is crucial.
Hydrogeologic studies during the petroleum exploration are also very important
and data for solving the aforementioned problems should be collected during this
stage.
Significant issues during the exploration stage include:
(1) the identification of independent hydrogeologic systems in the basin being
studied;
(2) hydrodynamic drives occurring in each one;
(3) their hydrodynamic and geochemical evolution;
(4) the identification of hydrodynamic and geochemical anomalies as indicators of
cross-flows between various horizons;
(5) the distribution of the normalized pressure within the identified hydrogeologic
stages, in the section and laterally;
(6) the identification of locations for possible hydrocarbon traps and patterns in
their distribution; and
(7) analyzing the concepts of hydrocarbon migration in the basin and the formation
and destruction of hydrocarbon accumulations.
As previously mentioned, the saturation pressure (elastic pressure) is an important
exploration indicator of gas fields. If the gas-saturation pressure is close to the
reservoir pressure, any uplifted area of the reservoir may be gas-bearing.
WATER86

Chapter 5
CRUDE OILS
5.1. COMPOSITION OF CRUDE OILS10
Crude oil is a natural multicomponent mixture. Its major part is composed of
hydrocarbons (alkanes, naphthenes, and aromatics). Their content in oils ranges
between 30% and 100%. Most important among the non-hydrocarbon components
are resins and asphaltenes. The other non-hydrocarbon compounds are metal–po-
rphyrin complexes and trace elements; their content is usually low. Some compounds
in oils lost structural features of the parent organic matter, whereas some other
molecules preserved these features. They are called ‘‘relic hydrocarbons’’ or ‘‘chem-
ical fossils’’.
Alkane hydrocarbons (C5 –C40) include normal and branched molecules (is-
oprenoids). Carbon number distribution in the normal alkanes reflects the compo-
sition of the original organic matter. For example, lipids of the continental biomass
are dominated by normal C25 –C33 alkanes that consequently are inherited by the oil.
The pristane/phytane ratio is used as a genetic criterion for the isoprenoids. The
pristane is associated with the continental deposits, whereas the phytane is associated
with the marine deposits.
Cyclic paraffins (naphthenes) include monocyclic (5–6 carbon atoms) as well as
polycyclic molecules. The latter molecules may contain 1–6 rings. This feature was
probably inherited from the parent organic matter (naphthene index). But most
polycyclic naphthenes (such as steranes) were not present in the parent organic
matter and have been formed during catagenesis (Petrov, 1984).
Arenes (aromatic hydrocarbons) are usually not as important as the other classes
of hydrocarbons in crude oils. Aromatic compounds may include exclusively aro-
matic rings, or may contain complex structures with naphthene rings. Some arenes
are directly related to the parent organic matter.
Polishchuk and Yashchenko (2003) showed that there are cyclic changes in the
chemical properties of oils (contents of paraffin, asphaltenes, resins, and sulfur) with
geologic age of rocks. This cyclicity is controlled by the cyclicity of ocean trans-
gressions and processes of formation and development of paleo-oceans in the ge-
ological history of the Earth.
Recently developed equipment and techniques drastically increased the informa-
tion on oil composition. The researchers are now able to determine not only the
group hydrocarbon composition, but also the composition of individual hydrocar-
bons and their structure. The new techniques include gas and liquid chromato-
graphy, spectral and isotope methods, and nuclear magnetic and paramagnetic
resonances. Among the new highly sensitive equipment are chromatographs,
10After T.A. Botneva (in: Eremenko and Chilingar, 1996).
87

chromato-mass spectrometers, and infrared, ultraviolet, quasi-linear, and isotope
spectrometers.
A heightened interest in the molecular- and atomic-level information on the oil
composition was caused by two factors: technological and geochemical.
Petroleum hydrocarbons currently serve as a source of wide spectrum of synthetic
substances used for the manufacturing of various goods in food industry and other
industries. This required detailed studies of the composition of individual hydro-
carbons. The current technology provides an opportunity to obtain information
on the detailed composition and structure of hydrocarbons found in the high-boiling
oil fractions. Such information covers carbon atom distribution in the paraffin
chains and in the naphthene and aromatic rings. Lately, this information also be-
came insufficient.
The emergence of such analytical techniques as the gas–liquid chromatography
and chromato-mass spectrometry enabled scientists to
(1) obtain new information on the composition and structure of petroleum hydro-
carbons,
(2) study in detail their homological series, and
(3) determine the distribution patterns of normal and branched alkanes, methyl-
alkanes, and isoprenoid alkanes in oils.
In studying naphthenes, new techniques led to the elucidation of the proportions
of mono-, bi-, tri-, and tetracyclic naphthenes, steranes and tri-terpanes (hopanes).
Detailed studies of aromatic hydrocarbons in crude oils (using various techniques
including spectral) resulted in the establishment of the presence and proportions of
not only mono-, bi-, and tricyclic, but also polycyclic (4–6 cycles) hydrocarbons that
were almost impossible to identify earlier. The latter include hydrocarbons such as
perylene, 1,12-benzoperylene, 3,4-benzopyrene and their homologes.
Nuclear-magnetic and paramagnetic resonance techniques developed in the 1950s
enabled to study the properties of nuclei in different states. This is important in
studying the free radicals (kinetically independent), atoms and atom groups, and
chain reactions (polymerization, pyrolysis) in biochemical processes, in which the
free radicals actively participate.
A new approach in studying the crude oil hydrocarbons involves the stereo-
chemistry of saturated aliphatic and alicyclic hydrocarbons.
Stereochemical studies of the normal and branched alkanes and mono-, bi-, tri-,
and tetracyclic hydrocarbons (including hopanes) are becoming more important in
geochemical studies. It was shown that the transformations (aging) of biomolecules
in the Earth’s crust is closely related to the changes in their stereochemistry (Petrov,
1984).
There is an increase in the trace element studies. Contents of the trace elements in
crude oils vary significantly. Most of the iron series elements are found in crude oils
in amounts below the clarke amounts (sedimentary rock clarke). Some elements
(zinc, nickel, copper, arsenic, and silver) are found in near-clarke amounts, and four
elements (vanadium, molybdenum, bromine, and mercury) are present in the
amounts an order of magnitude above the clarke. This offers an opportunity of their
recovery directly from crude oils. The recovery of trace elements from crude oils is
CRUDE OILS88

technically complex and had not been commonly used, although scientific exper-
imentation is in progress.
On the basis of the extensive knowledge of composition and structure for all
classes of hydrocarbons, the presence of biomarkers directly related to the parent
biomass had been established. Genetic relationship of crude oils and parent organic
matter, genetic uniformity (or nonuniformity) of oils in different stratigraphic se-
quences have been established. Transformations of the specific hydrocarbons within
the catagenetic, weathering, etc. zones had been elucidated. This information is
important in the petroleum exploration as it enables to (1) forecast the type and
composition of hydrocarbon fluids, (2) identify the potential cross-flow zones, and
(3) determine the paths of lateral and vertical migration.
5.2. CLASSIFICATION OF CRUDE OILS
Many methods of classification of crude oils have been devised. Systems based on
a superficial inspection involving some physical property, such as specific gravity, are
easily applied and specific gravity is actually used to a large extent in expressing the
quality of crude oils.
Specific weight (or specific gravity) of liquids are compared to that of fresh water
(Table 5.1). For example, if a brine is 1.04 times heavier than fresh water, its specific
gravity is 1.04 and the pressure gradient is equal to 0.45 psi/ft ( ¼ 1.04� 0.434). The
relationship between the pressure gradient and salt content in water is presented in
Fig. 5.1. If the API gravity of the oil is given, its specific gravity (SG) at 601F can be
determined as follows:
SG ¼ 141:5=ð131:5þ oAPIÞ
For example, the specific gravity of oil at 371API is equal to
SG ¼ 141:5=ð131:5þ 37Þ ¼ 0:84.
A more rational basis of classification is found in some expression of the com-
position of the oils. In American practice, crude oils long have been roughly clas-
sified as (a) paraffin base, (b) naphthenic or asphaltic base, and (c) mixed base if they
contain both paraffin and asphalt. (Fig. 5.2). This system was derived on the basis of
differences in the nature of the lubricating oil portion of the crude after a non-
destructive distillation. In other words, the crude oil is carefully distilled and the
portion boiling in the lubricating oil range is examined. If this portion is waxy and
has the physical properties of paraffins, the crude oil is termed paraffin base. On the
other hand, if the lubricating oil portion contains little or no wax and contains
asphaltic material, the crude oil is termed asphaltic. Crude oils, lubricating oil frac-
tion of which contains both paraffins and asphalts, are termed mixed base.
Using this basis for the classification of petroleum, it has been found that crude oil
occurring in various sections of the United States can also be classified. The Penn-
sylvania type of crude oil is paraffinic. This type of crude oil is found in the eastern
states of USA: Pennsylvania, West Virginia, New York, Michigan, and Ohio.
CLASSIFICATION OF CRUDE OILS 89

TABLE 5.1
Fluid weight conversion table (modified after Zaba and Doherty, 1956)
Gravity (oAPI) Specific gravity
or (g/cm3)
Specific weight Fluid head Buoyancy factor
(totally immersed)
(lb/gal) (lb/cu.
ft)
(lb/bbl) Pressure
(lb/sq. in/ft)
Height
(ft/lb)
60.0 0.739 6.16 46.1 259.0 0.320 3.13 0.906
59.0 0.743 6.20 46.4 260.0 0.322 3.11 0.905
58.0 0.747 6.23 46.6 262.0 0.324 3.09 0.905
57.0 0.751 6.26 46.8 263.0 0.325 3.08 0.904
56.0 0.755 6.30 47.1 265.0 0.327 3.06 0.904
55.0 0.759 6.33 47.4 266.0 0.329 3.04 0.903
54.0 0.763 6.36 47.6 267.0 0.330 3.03 0.903
53.0 0.767 6.40 47.9 269.0 0.332 3.01 0.902
52.0 0.771 6.43 48.1 270.0 0.334 2.99 0.902
51.0 0.775 6.46 48.3 271.0 0.336 2.98 0.901
50.0 0.780 6.51 48.7 273.0 0.338 2.96 0.901
49.0 0.784 6.54 48.9 275.0 0.340 2.94 0.900
48.0 0.788 6.57 49.2 276.0 0.341 2.93 0.900
47.0 0.793 6.61 49.5 278.0 0.343 2.92 0.899
46.0 0.797 6.63 49.8 279.0 0.345 2.90 0.898
45.0 0.802 6.69 50.0 281.0 0.348 2.88 0.898
44.0 0.806 6.72 50.3 282.0 0.349 2.87 0.897
43.0 0.811 6.76 50.6 284.0 0.351 2.85 0.897
42.0 0.816 6.81 50.9 286.0 0.354 2.82 0.896
41.0 0.820 6.84 51.2 287.0 0.355 2.81 0.896
40.0 0.825 6.88 51.5 289.0 0.357 2.80 0.895
39.0 0.830 6.92 51.8 291.0 0.359 2.79 0.894
38.0 0.835 6.96 52.1 292.0 0.362 2.76 0.894
37.0 0.840 7.01 52.4 294.0 0.364 2.75 0.893
36.0 0.845 7.05 52.7 296.0 0.366 2.73 0.892
35.0 0.850 7.09 53.0 298.0 0.368 2.72 0.892
34.0 0.855 7.13 53.3 299.0 0.370 2.70 0.891
33.0 0.860 7.17 53.6 301.0 0.372 2.69 0.891
32.0 0.865 7.21 53.9 303.0 0.375 2.67 0.890
31.0 0.871 7.26 54.3 305.0 0.377 2.65 0.889
30.0 0.876 7.31 54.7 307.0 0.380 2.63 0.889
29.0 0.882 7.36 55.1 309.0 0.382 2.62 0.887
28.0 0.887 7.40 55.4 311.0 0.384 2.60 0.887
27.0 0.893 7.45 55.7 313.0 0.387 2.58 0.886
26.0 0.898 7.49 56.0 315.0 0.389 2.57 0.886
25.0 0.904 7.54 56.4 317.0 0.392 2.55 0.885
24.0 0.910 7.59 56.8 319.0 0.394 2.54 0.884
23.0 0.916 7.64 57.2 321.0 0.397 2.52 0.883
22.0 0.922 7.69 57.5 323.0 0.399 2.51 0.883
21.0 0.928 7.74 57.9 325.0 0.402 2.49 0.882
20.0 0.934 7.79 58.3 327.0 0.405 2.47 0.881
19.0 0.940 7.84 58.7 329.0 0.407 2.46 0.880
18.0 0.946 7.89 59.0 331.0 0.410 2.44 0.879
17.0 0.953 7.95 59.5 334.0 0.413 2.42 0.879
16.0 0.959 8.00 59.8 336.0 0.416 2.40 0.878
15.0 0.966 8.06 60.3 339.0 0.419 2.39 0.877
CRUDE OILS90

Table 5.1 (continued )
Gravity (oAPI) Specific gravity
or (g/cm3)
Specific weight Fluid head Buoyancy factor
(totally immersed)
(lb/gal) (lb/cu.
ft)
(lb/bbl) Pressure
(lb/sq. in/ft)
Height
(ft/lb)
14.0 0.973 8.11 60.7 341.0 0.421 2.38 0.876
13.0 0.979 8.16 61.0 343.0 0.424 2.36 0.875
12.0 0.986 8.22 61.5 345.0 0.427 2.34 0.874
11.0 0.993 8.28 61.9 348.0 0.430 2.33 0.874
10.0 1.00 8.34 62.4 350.0 0.433 2.31 0.873
Pure water 1.00 8.34 62.4 350.0 0.433 2.31 0.873
1.01 8.4 62.8 353.0 0.436 2.29 0.872
1.03 8.6 64.3 361.0 0.447 2.24 0.869
1.06 8.8 65.8 370.0 0.457 2.19 0.866
1.08 9.0 67.3 378.0 0.468 2.14 0.862
1.10 9.2 68.8 386.0 0.478 2.09 0.860
1.13 9.4 70.3 395.0 0.488 2.05 0.856
1.15 9.6 71.8 403.0 0.499 2.00 0.853
Salt water 1.154 9.625 72.0 404.0 0.500 2.00 0.853
1.18 9.8 73.3 412.0 0.509 1.96 0.850
1.20 10.0 74.8 420.0 0.519 1.93 0.847
1.22 10.2 76.3 428.0 0.530 1.89 0.844
1.25 10.4 77.8 437.0 0.540 1.85 0.841
1.27 10.6 79.3 445.0 0.551 1.81 0.838
1.29 10.8 80.8 454.0 0.561 1.78 0.835
1.32 11.0 82.3 462.0 0.571 1.75 0.832
1.34 11.2 83.8 470.0 0.582 1.72 0.829
1.37 11.4 85.3 479.0 0.592 1.69 0.826
1.39 11.6 86.8 487.0 0.603 1.66 0.823
1.41 11.8 88.3 496.0 0.613 1.63 0.820
1.44 12.0 89.8 504.0 0.623 1.61 0.817
1.46 12.2 91.3 512.0 0.634 1.58 0.814
1.49 12.4 92.8 521.0 0.644 1.55 0.810
1.51 12.6 94.3 529.0 0.655 1.53 0.808
1.53 12.8 95.8 538.0 0.665 1.50 0.804
1.56 13.0 97.3 546.0 0.675 1.48 0.801
1.58 13.2 98.7 554.0 0.686 1.46 0.798
1.61 13.4 100.0 563.0 0.696 1.44 0.795
1.63 13.6 102.0 571.0 0.706 1.42 0.792
1.65 13.8 103.0 580.0 0.717 1.39 0.789
1.68 14.0 105.0 588.0 0.727 1.38 0.786
1.70 14.2 106.0 596.0 0.738 1.36 0.783
1.73 14.4 108.0 605.0 0.748 1.34 0.780
1.75 14.6 109.0 613.0 0.758 1.32 0.777
1.77 14.8 111.0 622.0 0.769 1.30 0.774
1.80 15.0 112.0 630.0 0.779 1.28 0.771
1.82 15.2 114.0 638.0 0.790 1.27 0.768
1.85 15.4 115.0 647.0 0.800 1.25 0.765
1.87 15.6 117.0 655.0 0.810 1.23 0.762
1.89 15.8 118.0 664.0 0.821 1.22 0.759
CLASSIFICATION OF CRUDE OILS 91

Midcontinent type of crude oil is mixed base and is found in Kansas, Oklahoma,
all of Texas except the Gulf Coast area, northern Louisiana, and Arkansas. It in-
cludes also eastern Colorado, parts of New Mexico, and Arizona.
The Gulf Coast type of crude is asphaltic and naphthenic in nature and is found in
the area lying in southern Louisiana and southern Texas.
Tissot and Welte (1978) classification of crude oils is presented in Fig. 5.3.
Botneva (1987, in: Eremenko and Chilingar, 1996, p. 62, 65) studied more than
400 crude oil samples in Russia and identified nine types. Six of these have been
subdivided according to their gasoline fraction composition and three, devoid of
these fraction, by the paraffin/naphthene and naphthene/aromatic ratios. The fol-
lowing chemical types (on the basis of paraffin/naphthene ratio) were identified:
Type I. Paraffin (paraffin/naphthene ratio 41).
Type II. Paraffin-naphthene (paraffin/naphthene ratio of 0.99–0.7).
Type III. Naphthene-paraffin (paraffin/naphthene ratio of 0.69–0.5).
Type IV. Naphthene-paraffin-aromatic (paraffin/naphthene ratio of 0.49–0.41).
Type V. Naphthene-aromatic (paraffin/naphthene ratio of 0.4–0.3).
Type VI. Naphthene (paraffin/naphthene ratio of o0.3).
Type VII. Dominance of paraffin-naphthene hydrocarbons (paraffin-naphthene/
naphthene-aromatic (PN/NA) 42).
Fig. 5.1. Relationship between pressure gradient and percent of salt water in water–oil mixture (after
Trash and Brown, 1965, p. 8, chart 1). If SG ¼ 1.07, then the pressure gradient ¼ 1.07� 0.434 ¼ 0.465.
Pressure gradient of oil+salt water mixture ¼ [(%salt water/100)� (water gradient)]+[(%oil/100)� (oil
gradient)]. For example, in the case of 50:50 oil–water mixture, if oil is 421API (0.354 psi/ft pressure
gradient) and specific gravity of water is 1.07 (0.465 psi/ft pressure gradient), then the pressure gradient of
a mixture ¼ (0.50)(0.354)+(0.50)(0.465) ¼ 0.41 psi/ft.
CRUDE OILS92

Type
VIII.
A near-equal contents of paraffin-naphthene and naphthene-aromatic
hydrocarbons (PN/NA ¼ 1).
Type IX. Dominance of naphthene-aromatic hydrocarbons (PN/NA o1).
Oils belonging to types VII–IX are devoid of gasoline fraction.
The distribution of the above-described crude oil types by density and sulfur
content is presented in Tables 5.2 and 5.3. The most commonly occurring in nature
are type I crude oils, whereas the least common are types IV and IX (Table 5.4).
A number of classifications based on the identification of chemical types first on
the contents of normal alkanes and isoprenoids, and then on the cycloalkanes and
arenes (Petrov, 1984). Petrov subdivided all crude oils into two categories (A and B),
with two subtypes within each of them (Table 5.5).
Recent developments in the petroleum geochemistry resulted in the introduction of
genetic and geochemical classifications. Both classifications provide useful information
for the petroleum potential forecast. Geochemistry plays an important role in fore-
casting the quality of crude oil in the accumulation. The information important during
the field development includes the possible communication between the productive
formations, oil cross-flows, possible crude alterations at the oil/water contact, etc.
Fig. 5.2. Chemical composition of some crude oils plotted on a triangular diagram (after Nelson, 1949,
Fig. 7, p. 87).
CLASSIFICATION OF CRUDE OILS 93

Fig. 5.3. Ternary diagram showing the composition of six classes of crude oils from 541 oil fields (after
Tissot and Welte, 1978, p. 373).
TABLE 5.2
Distribution of crude oil types by density (after T.A. Botneva, in: Eremenko and Chilingar, 1996, p. 66)
Crude oil (density in g/cm3) Type of oil (in %)
I II III IV V VI VII VIII IX
Light (0.850) 70.9 69.5 60.0 36.8 18.7 18.7 7.7 2.7 12.5
Medium (0.851–0.870) 19.3 18.2 21.5 42.1 37.5 21.8 — 2.7 —
Heavy (0.871–0.900) 5.9 7.5 15.3 21.1 37.5 37.7 41.0 — 12.5
Very heavy (40.900) 3.9 4.8 3.2 — 6.3 21.4 51.3 54.3 75.6
TABLE 5.3
Distribution of sulfur content in various types of crude oil (after T.A. Botneva, in: Eremenko and
Chilingar 1996, p. 66)
Crude oil (sulfur content in %) Type of oil (in %)
I II III IV V VI VII VIII IX
Low-sulfur oils (o0.5) 59.7 60 78.7 60 76.4 72.2 43.7 40.0 16.6
Medium-sulfur oils (0.5–2.0) 39.1 36 18.1 40 33.6 37.6 56.3 56.0 33.6
High-sulfur oils (42) 1.2 4 3.2 — — — — — 49.8
CRUDE OILS94

Problems associated with the petroleum forecasting may not be solved, unless the
genetic uniformity/nonuniformity of the crude oils in a given field and region is
determined.
In order to subdivide the crude oils into genetic types, the criteria for the iden-
tification of genetic types have been developed. The genetic indicators in crude oils
are associated with the organic matter composition of the source rocks. There is
some disagreement among petroleum geologists as to what these genetic parameters
are. According to one school of thought, there are just a few genetic types of crude
oils. These types are the same in all petroleum provinces worldwide and are defined
by the facies-genetic type of organic matter (sapropelic, humic and their combina-
tions) and by the degree of oxidation or metamorphism of the organic matter. The
other approach is that the crude oil genetic type is defined by the specific charac-
teristics of the composition of parent organic matter and the chloroform-extractable
bitumen that are specific for each source rock within each petroleum basin. It was
found that changes in the biomass composition occurred in the Phanerozoic:
(1) the number of taxons increased;
(2) the diversity of forms grew, as well as the replacement of some forms by the
others; and
(3) changes occurred in the biochemical composition of organisms (changes were
caused by the evolution of the living matter in Phanerozoic, as well as by the
TABLE 5.4
Frequency of occurrence (% of total samples analyzed) of various crude oil types (after Botneva, 1987)
Chemical type % Chemical type %
I 39.7 VI 6.1
II 16.4 VII 7.4
III 12.4 VIII 6.8
IV 3.6 IX 1.5
V 6.1
TABLE 5.5
Content of various hydrocarbons in 200–4301C boiling fraction (after Petrov, 1984)
Hydrocarbons Content in oils of different types (%)
A1 A2 B1 B2
Alkanes 15–60 (25–50) 10–30 (15–25) 5–30 (10–25) 4–40 (6–10)
n-Alkanes 5–25 (8–12) 0.5–5 (1–3) 0.5 Not found
Isoprenoids 0.05–6 (0.5–3) 1–6 (1.5–3) 0.5–6 (0.2–2) Not found
Cycloalkanes 15045 (25–40) 20–60 (35–55) 20–70 (35–55) 20–70 (50–65)
Arenes 10–70 (20–40) 15–70 (20–40) 20–80 (20–45) 25–80 (25–50)
Note: Most commonly encountered values are in parentheses.
CLASSIFICATION OF CRUDE OILS 95

difference in living environment in different basins at the same geologic time
interval).
According to the proponents of the first concept, genetic types of crude oils are
rigidly associated with the facies-genetic type of organic matter. For example, a
marine, sapropelic type of organic matter always (at any geologic period and in any
basin) generated the same genetic oil type (e.g., type A). This approach does not take
into consideration the evolution of living matter. It is doubtful that the sapropelic
(marine) type of organic matter was identical in the Paleozoic, Mesozoic, and
Cenozoic sediments of different sedimentary basins, e.g., Siberia (platform) and
Caucasus (geosyncline).
The second approach is based on the concept of multiple genetic types of crude
oils and their uniqueness within each petroleum province. The contention here is that
any sedimentary basin has its own specific biomass. Besides, organic matter in the
source rocks of the same facies-genetic type (e.g., the sapropelic type) could, due to
evolution, substantially change from one geologic time interval to the next, acquiring
specific hydrocarbon composition and structure.
The identification of biomarkers that are not present in the other crude oils is of a
particular genetic interest. There are certain compounds discovered only in partic-
ular crude oils (Petrov, 1984):
(a) 1,2- and 1,3-methylalkanes, in East Siberia;
(b) the biotriocoxan, in Indonesian crude oils;
(c) the C25 hopane, in a Siberian crude oil;
(d) the dyno-methyl-adiantanes, in North Sea crude oils;
(e) the cyclic isoprenoids with an irregular structure and trimethyl-alkyl-cyclohex-
anes with an isoprenoid chain, in the Buzachi Peninsula (North Caspian,
Kazakhstan) crude oils; and
(f ) the hopane-type six-cyclic monoaromatic hydrocarbons, in the inter-salt Pripyat
deposits (Belarus).
The genetic classification of crude oils of T. A. Botneva and N. A. Eremenko is
based on several concepts. These include (a) each oil/gas source rock in a given
petroleum province generates a specific type of oil; (b) the set of genetic types is
rather limited and changeable; and (c) the set of genetic criteria may change in
different petroleum provinces. In some cases, the crude oils belonging to different
genetic types may be different in the structure of their paraffins. In some other cases,
the difference may be in
(1) naphthene index,
(2) mono- or polycyclic aromatics,
(3) the metal and its content in the porphyrin complexes,
(4) the pristane/phytane ratio (or the other isoprenoids), and
(5) the composition of light gasoline fraction (C5+C6/C7+C8; cyclohexane/cycl-
opentane; toluene/benzene, etc.; see Chakhmakhchev, 1982).
The genetic type of crude oil is indicative of the initial properties of the fluid, its
homologous series of hydrocarbons, and the configuration of carbon atoms; how-
ever, the crude oil composition, as determined in the laboratory, is a result of its long
evolution in the Earth’s crust. Depending on the geologic/geochemical scenario,
CRUDE OILS96

crude oil in the accumulation may be affected by various secondary factors, such as
catagenesis, hypergenesis, and migration. These factors may change the crude oil
composition. Determination of the trend and the scale of these changes and their
controlling factors may be very important for the development of hydrocarbon
accumulations and for the forecast of their chemical composition. The effect of
secondary (i.e., subsequent to the formation of accumulations) factors on the crude
oil composition is the basis of geochemical oil classification.
It is difficult to select the criteria, which would help to determine the role of
processes controlling the changes in crude oil composition (i.e., role of catagenesis,
hypergenesis, and migration). The reason for this is that some parameters changed
similarly in response to different processes. For instance, an increase in the density of
crude oil or content of resins may occur as a result of hypergenesis or of migration
resulting in the selective adsorption. Decrease in density, decrease in the resin con-
tent, and increase in the paraffins content may be caused by catagenesis as well as by
the ‘‘filtration’’ during migration.
The geochemical classification of crude oils includes the following types:
Type 1. Catagenetically altered crude oils.
Type 2. Hypergenetically altered crude oils.
Type 3. Crude oils which underwent various alterations during migration.
The following are typical for type 1: (a) lowering of the crude oil density; (b)
lowering of the content of resins plus asphalthenes; (c) simplification of complex
hydrocarbon structures; (d) lowered role of high-molecular hybrid molecules; (e)
lowering, sometimes to zero, of metal–porphyrin complexes; and (f ) increase in the
content of gasoline fraction.
Type 1 crude oils are mostly encountered in geosynclines and, only rarely, in
platforms. The scope of the catagenetic effect on crude oil composition is determined
by the following two factors.
The first one is related to the temperature and pressure. Catagenetic alterations of
the crude oil composition are caused not just by a simple increase in the formation
temperature, when the temperature exceeds the oil generation temperature in the
source rock. It is believed that the maximum generation of oil occurred within the
temperature interval of 60–1201C. Oil accumulations formed at a lower temperature
after the hydrocarbons have migrated from the structural lows (high-temperature
generation foci) to the uplifted areas (traps). In the process of the further geologic
evolution an accumulation may enter into zones of higher-than-generation temper-
ature. If the oil stays there long enough it may be subjected to the aforementioned
catagenetic alterations, up to the transformation to gas-condensate mixtures. This,
however, does not occur frequently.
The second factor is associated with the structural characteristics of the hydro-
carbon molecules. The composition of oil from 140 accumulations has been studied
by T.A. Botneva. The accumulations were selected from different petroleum prov-
inces of Russia, Azerbaijan, and Belorussia. These accumulations were stratigraph-
ically diverse (Pliocene, Eocene, Jurassic, and Devonian) and over 4 km in depth. No
CLASSIFICATION OF CRUDE OILS 97
pattern was found in the compositional changes with increasing depth and temper-
ature. In some cases, the indications of catagenic changes (low density, high gasoline
content, high content of paraffins, and low degree of paraffin cyclicity) were obvious,
whereas in others they were barely noticeable or non-existent.
Infrared spectroscopy studies enables determination of the ratio of long to short
paraffin chains, the degree of their branching, and the number of CH2 and CH3
groups. In some crude oils with catagenetic alterations, the fraction of long chains in
the paraffin-naphthene crudes decreases, and of short ones, increases. This is an
indication of destruction of long-chain paraffins. In another group of crude oils,
exposed to the similar temperature and pressure, the number of long chains did not
decrease. Possibly, the resistance to destruction of paraffins in the latter case was
greater. In general, the catagenetically altered crude oils are rare.
Hypergenetic alteration affects the crude oils composition in the accumulation
more profoundly. The geochemical types of hypergenetically altered crude oils in-
clude (1) oxidized, (2) biodegraded, and (3) degassed. Hypergenetic processes include
(1) oxidization (on contact with oxygen); (2) bacterial reduction of sulfates; and (3)
loss of the light hydrocarbon fractions. The hypergenetic alterations are more pro-
nounced when several processes are operative (for instance, degassing plus chemical
and bacterial alteration).
Hypergenetically altered oils are usually heavier (lower oAPI gravity), higher in
resins and asphaltenes contents, and lower in the gasoline boiling point fraction. A
very informative criterion is found on infrared spectrograms of crude oils: the pres-
ence and intensity of the 1710 cm�1 absorption band that reflects the content of
oxygen-containing carbonyl groups. Modeling of hypergenetic processes due to ox-
idation, sulfate reduction, etc. showed that the crude oils that had not been subjected
to hypergenesis do not have the 1710 cm�1 absorption band in their infrared spec-
trograms.
On the other hand, the crude oils that underwent hypergenetic alterations have
1710 cm�1 absorption band ranging from 0.01 to 0.5 and even higher. The oils with
1710 cm�1 absorption band within a few hundredths do not display any significant
changes in their properties and composition. Such oils are usually found near the
oil–water contact. The crude oils with 1710 cm�1 absorption band of a few tenths do
display significant changes in their properties and composition. As a rule, those are
heavy oils with a very low content of low boiling point fractions.
The distribution of differently hypergenetically altered crude oils is presented in
Table 5.6. As shown, 86% of the very oxidized crude oils are found at depths
shallower than 400m. Most of them in Russia occur in the Cretaceous and Jurassic
rocks of the North Caspian and North Caucasus-Mangyshlak petroleum provinces.
Alterations during migration result in changes in the composition of crude
oils. Depending on the type of migration, these alterations may be quite significant.
Some experiments (Mileshina et al., 1983) showed that the composition of crude
oil flowing through rocks changes (depending on the lithology, temperature, and
pressure).
Upon migration of crude oil through sands and sandstones, the number of par-
affin structures increases, whereas the role of naphthene cycles declines. The degree
CRUDE OILS98

of cyclization in naphthenes decreases and the aliphaticity coefficient (Cp/Cn) dras-
tically increases. Similar alterations in crude oils occur during the migration through
carbonate rocks (e.g., microgranular limestones and dolomites). However, an in-
crease in the density and in the contents of asphaltenes and resins, and naphthene-
aromatic hydrocarbons was recorded for carbonates. These alterations may have
been caused by the oxidation of naphthene hydrocarbons and by the appearance of
ester groups instead of the ethyl ones in the paraffin chains. The great diversity in
physical properties of rocks through which the crude oil migrates affects the nature
and scale of the migration-associated alterations. The effect on the composition of
crude oil as a result of migration decreases in the following order: clays-silts and
sands-limestones-dolomites-anhydrite. It may be very difficult to determine the
geochemical type of migration-altered oil, because many parameters may exhibit
similar changes from other processes. The resins/asphaltenes ratios (and other sim-
ilar ones) were proposed as a criterion for the identification of migrated crude oils
(this particular ratio drastically increases, up to 40%, upon migration). Mileshina
et al. (1983) believe that one of the best criterion of the migrated crude oils is an
increase in the degree of aliphaticity of paraffinic and aromatic hydrocarbons (and
even in tars) by a factor of 1.5.
Determination of a geochemical type for the migration-altered crude oils is im-
portant in evaluating the type and direction of migration. For instance, in the dif-
ferential entrapment (accumulation of oil and gas in interconnected traps), assigning
the crude oil to the migration-altered type (rather than oxidized) may enable one to
determine the direction of regional migration.
TABLE 5.6
Distribution of crude oils with different degree of oxidation at various depth intervals
Depth Interval (m) Crude oil
No oxidation Slightly oxidized Strongly oxidized
300–999 12.3 (17.0) 32.2 (38.1) 86.6 (44.9)
1,000–1,999 33.7 (62.5) 21.5 (34.3) 4.6 (3.2)
2,000–2,999 29.8 (52.4) 28.7 (43.5) 5.9 (4.1)
3,000–3,999 12.9 (52.2) 13.4 (43.1) 2.9 (4.7)
4,000–4,999 9.6 (70.8) 4.6 (29.2) Not found
5,000–5,999 1.7 (75) 0.1 (25) Not found
Note: In parentheses: percent of crude oil samples having different degree of oxidation at a certain depth
interval.
CLASSIFICATION OF CRUDE OILS 99

This page intentionally left blank
100

Chapter 6
NATURAL GASES AND CONDENSATES
6.1. COMPOSITION OF NATURAL GASES
Natural gases are a naturally occurring mixture of hydrocarbon and non-hydro-
carbon gases found in porous formations beneath the Earth’s surface, often in as-
sociation with crude oil. Their chemical composition and physical properties are
quite diverse. Most common among gaseous chemical compounds are hydrocarbons,
H2, CO2, CO, N2, H2S, NH3, O2, etc. On the basis of their origin, Belousov (1939)
classified gases into (1) biochemical; (2) aerial; (3) associated with natural chemical
reactions occurring at ambient or high temperature; and (4) radioactive. There are
many other classifications, which are either highly specialized (e.g., for volcanic
gases) or incorporate the above classification.
Primarily, natural gas is a mixture of hydrocarbon molecules belonging to the
paraffin series. The simplest hydrocarbon is methane, CH4; followed by ethane,
C2H6; propane, C3H8; butane, C4H10; and heavier components as shown in Table
6.1. These compounds have the chemical formula of CnH2n+2.
Natural gas is principally composed of methane with decreasing amounts of
ethane, propane, and heavier components. It normally is partially or completely
saturated with water vapor and many contain nitrogen and inert gases such as
helium and argon, and acid gases such as carbon dioxide, hydrogen sulfide, and
mercaptans.
In the Earth’s crust, gases are mostly dissolved (in water or in oil) or sorbed, and
often form free accumulations. Free gas accumulations may be formed by hydro-
carbons, sometimes by nitrogen, and rarely by carbon dioxide, but usually by mix-
tures (in various proportions) of these gases. The other compounds are present in the
form of an admixture, although sometimes a significant one (e.g., up to 20% of
H2S).
Hydrocarbon gases may contain a fraction of 1% to a few percentage points of
CO2 (sometimes its content is much higher). The CO2 content in the South Semi-
vodskoe gas-condensate field (West Siberia) is 73.1%, and that of the Braden South
Field (U.S.) is 86.6%. The CO2 presence is typical in the solution gases of young
(Paleogene, Neogene) crude oils. Some increase in the CO2 content is noted in the
natural gases of foredeeps. Average nitrogen content in hydrocarbon gases ranges
from 0.5 to 12%. The lowest nitrogen concentrations (fractions of 1%) are found in
the areas of deep basement subsidence, foredeeps, and intermontane depressions.
Gases on young platforms usually contain less than 5% nitrogen, and those on
ancient platforms (such as Russian or American) contain 5–7%. The nitrogen con-
tent in the natural gases drastically increases in the western Volga-Ural province,
where it may exceed 95%.
101

TABLE 6.1
Composition of natural gases
Component Type of gas field Natural gas separated from crude oil
Dry gas, Los Medanos,
California (mol%)
Sour gas, Jumping
Pound, Canada (mol%)
Gas-condensate, Paloma,
California (mol%)
Ventura, California
400 lb� (mol%) 50� lb (mol%) Vapor (mol%)
Hydrogen sulfide 0 3.3 0 0 0 0
Carbon dioxide 0 6.7 0.68 0.30 0.68 0.81
Nitrogen and air 0.8 0 0 0 0 2.16
Methane 95.8 84.0 74.55 89.57 81.81 69.08
Ethane 2.9 3.6 8.28 4.65 5.84 5.07
Propane 0.4 1.0 4.74 3.60 6.46 8.76
Isobutane 0.1 0.3 0.89 0.52 0.92 2.14
n-Butane trace 0.4 1.93 0.90 2.26 5.02
Isopentane 0 0 0.75 0.19 0.50 1.42
n-Pentane 0 0 0.63 0.12 0.48 1.41
Hexane 0 0.7 1.25 0 0 0
Heptane 0 0 0 1.05 1.05 4.13
Octane 0 0 6.30 0 0 0
Nonane 0 0 0 0 0 0
Total 100 100 100 100 100 100
�Separator pressure in psi (pounds per square inch).
NATURAL
GASESAND
CONDENSATES
102
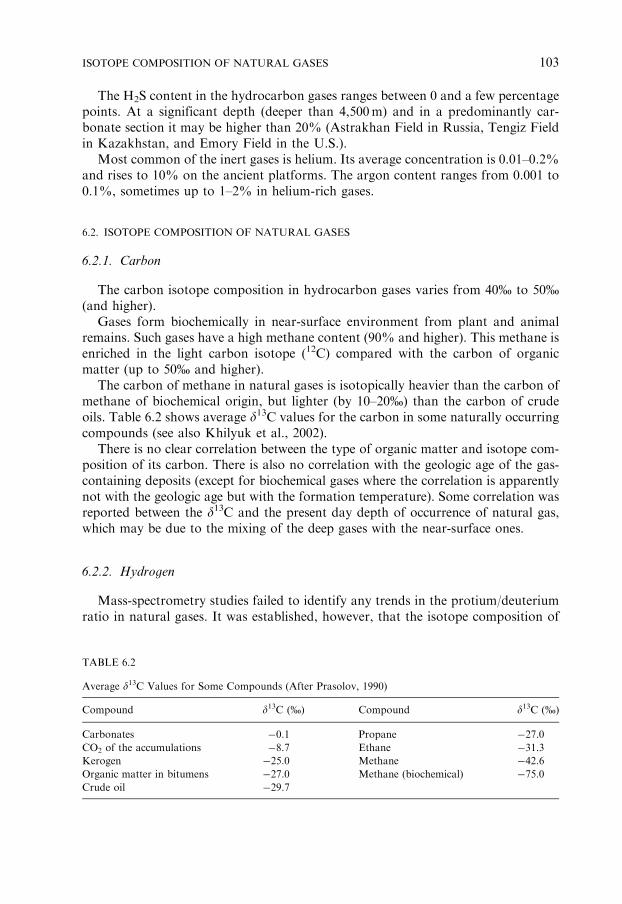
The H2S content in the hydrocarbon gases ranges between 0 and a few percentage
points. At a significant depth (deeper than 4,500m) and in a predominantly car-
bonate section it may be higher than 20% (Astrakhan Field in Russia, Tengiz Field
in Kazakhstan, and Emory Field in the U.S.).
Most common of the inert gases is helium. Its average concentration is 0.01–0.2%
and rises to 10% on the ancient platforms. The argon content ranges from 0.001 to
0.1%, sometimes up to 1–2% in helium-rich gases.
6.2. ISOTOPE COMPOSITION OF NATURAL GASES
6.2.1. Carbon
The carbon isotope composition in hydrocarbon gases varies from 40% to 50%
(and higher).
Gases form biochemically in near-surface environment from plant and animal
remains. Such gases have a high methane content (90% and higher). This methane is
enriched in the light carbon isotope (12C) compared with the carbon of organic
matter (up to 50% and higher).
The carbon of methane in natural gases is isotopically heavier than the carbon of
methane of biochemical origin, but lighter (by 10–20%) than the carbon of crude
oils. Table 6.2 shows average d13C values for the carbon in some naturally occurring
compounds (see also Khilyuk et al., 2002).
There is no clear correlation between the type of organic matter and isotope com-
position of its carbon. There is also no correlation with the geologic age of the gas-
containing deposits (except for biochemical gases where the correlation is apparently
not with the geologic age but with the formation temperature). Some correlation was
reported between the d13C and the present day depth of occurrence of natural gas,
which may be due to the mixing of the deep gases with the near-surface ones.
6.2.2. Hydrogen
Mass-spectrometry studies failed to identify any trends in the protium/deuterium
ratio in natural gases. It was established, however, that the isotope composition of
TABLE 6.2
Average d13C Values for Some Compounds (After Prasolov, 1990)
Compound d13C (%) Compound d13C (%)
Carbonates �0.1 Propane �27.0
CO2 of the accumulations �8.7 Ethane �31.3
Kerogen �25.0 Methane �42.6
Organic matter in bitumens �27.0 Methane (biochemical) �75.0
Crude oil �29.7
ISOTOPE COMPOSITION OF NATURAL GASES 103

both hydrogen and carbon in natural gases depends on their origin (Shen et al., 1988;
see also Khilyuk et al., 2002).
6.2.3. Sulfur
Numerous studies in the former Soviet Union showed that the d34S content in
natural gases ranges between 18 and 20%. The gases in younger deposits (Neogene,
Paleogene) are richer in the heavy sulfur isotopes than the sulfur in crude oils,
whereas in the older (Carboniferous) gases the isotope content of gases and oils is
similar or even lower in gases. This fact casts doubt on the conclusion that there is a
genetic relation between the sulfur present in oil and in gas. Interesting results were
obtained in the experiments on microbial reduction of sulfates. It was found that the
resulting H2S might have sulfur of different isotope composition depending on the
amount and speed of the introduction of sulfates into water. When the sulfate supply
is constant and high, the sulfur in the H2S is lighter. When the rate of sulfate
introduction is equal to that of its destruction, the formation water may become
almost totally sulfate-free and the isotope composition of sulfur in the H2S may be
equal or slightly lower than in the introduced sulfate. Krouse et al. (1988) had found
that the sulfur in the gas accumulations rich in H2S are enriched in 34S.
6.2.4. Nitrogen
Nitrogen isotope composition in the natural environments ranges between �30
and +30%. The d15N content in the natural gases ranges from �15 to �30%.
Prasolov (1990) reported the following d15N variations for large tectonic units (%):
Russian Platform �10 (Kolliyar, C1t) to +26.5 (Orenburg, P1)
Timan-Pechora +0.4 (Dzhebed, D3) to +26.9 (Vuktyl, C1)
North Caspian Basin +27.8 (Listvinskoye, P1)
Dnieper-Don Basin �6.5 (Rybalskoye, P2) to +0.4 (Glinsko-Rozbyshev, C1)
Siberian Platform �5.3 (Kuimba, R) to �1.3 (Ust’ Vilyuy, R)
Vilyuy Syneclise �8.6 (Middle Tyunga, P2) to �1.8 (Mastakh, P2)
West Siberia �14 (Urengoi, K1) to �3 (Kharstovey, K1)
Considerable variations in the d15N content in natural gases are due to (1) the
presence of intrinsic nitrogen in the Earth’s crust and (2) fractionation (and mixing
of gases with various d15N content) during migration. The latter has been established
by Hoering and Moore (1958) — the d15N becomes lighter in the direction of mi-
gration.
Apparently, sedimentary rocks, which are the richest in nitrogen, serve as
the major source of nitrogen. These rocks include nitrogen in their minerals and in
the organic matter. Metamorphic rocks, coals, crude oils, volcanic rocks, and the
atmospheric air also may have been sources of nitrogen. Compared to the associated
crude oils, nitrogen in the natural gases is lighter by 3–15%.
NATURAL GASES AND CONDENSATES104

Mixing of nitrogen in sedimentary rocks with the nitrogen coming from the
mantle is quite possible, but cannot be proved at the current level of analytical
techniques. Prasolov (1990) who studied the problem mentioned that the mantle
nitrogen in most cases cannot be identified against the background of the crustal and
atmospheric nitrogen.
6.2.5. Inert gases
Inert gases of a predominantly radioactive origin may form in the Earth’s crust as
well as in the upper mantle. According to Prasolov (1990), the mantle helium is
present in the natural gases of the Earth’s crust. Its content is minimal (o1%) in the
gases of sediment cover. The mantle helium dominates only in gases associated with
the present-day volcanism and rifting. The same writer estimated the current gas
composition in the upper mantle taking into account the vapor pressure and isotopic
composition:
CO2/He CH4/He N2/He 40Ar/He 36Ar/He 3He/He
100 10 4 1 10-4 10-5
On the basis of the above, the mantle CO2 may be expected in gas accumulations
of the sediment cover, in addition to negligible amounts of methane and other gases.
The age of the gas can be determined from the He/Ar ratio, taking into account
their radioactive origin. For instance, Fig. 6.1 shows the evolution in time of the He/
Ar ratio. Table 6.3 illustrates distributions of 4He/40ArB and 40ArP/40ArB in gas
accumulations of tectonic units of different age.
Fig. 6.1. Variation of 4He/40Arp ratio with time. 1 — In gases being formed in rocks t years ago; 2 — in
gases formed between 4.5 billion years ago to time t; 3 — in gases formed between the time t and present
time. t — abscissa. (After Prasolov, 1990.)
ISOTOPE COMPOSITION OF NATURAL GASES 105
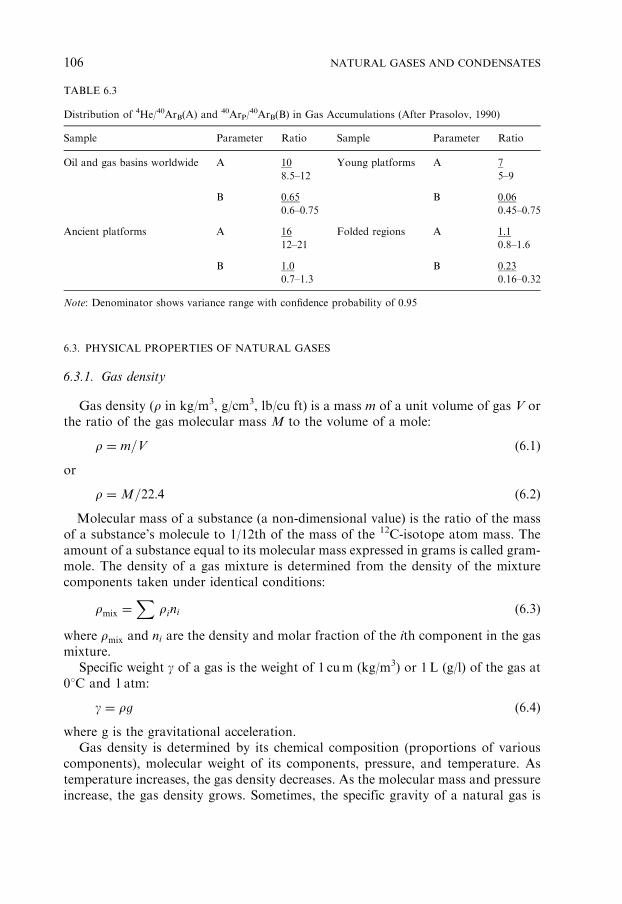
6.3. PHYSICAL PROPERTIES OF NATURAL GASES
6.3.1. Gas density
Gas density (r in kg/m3, g/cm3, lb/cu ft) is a mass m of a unit volume of gas V or
the ratio of the gas molecular mass M to the volume of a mole:
r ¼ m=V (6.1)
or
r ¼ M=22:4 (6.2)
Molecular mass of a substance (a non-dimensional value) is the ratio of the mass
of a substance’s molecule to 1/12th of the mass of the 12C-isotope atom mass. The
amount of a substance equal to its molecular mass expressed in grams is called gram-
mole. The density of a gas mixture is determined from the density of the mixture
components taken under identical conditions:
rmix ¼X
rini (6.3)
where rmix and ni are the density and molar fraction of the ith component in the gas
mixture.
Specific weight g of a gas is the weight of 1 cum (kg/m3) or 1L (g/l) of the gas at
01C and 1 atm:
g ¼ rg (6.4)
where g is the gravitational acceleration.
Gas density is determined by its chemical composition (proportions of various
components), molecular weight of its components, pressure, and temperature. As
temperature increases, the gas density decreases. As the molecular mass and pressure
increase, the gas density grows. Sometimes, the specific gravity of a natural gas is
TABLE 6.3
Distribution of 4He/40ArB(A) and 40ArP/40ArB(B) in Gas Accumulations (After Prasolov, 1990)
Sample Parameter Ratio Sample Parameter Ratio
Oil and gas basins worldwide A 10 Young platforms A 7
8.5–12 5–9
B 0:65 B 0:06
0.6–0.75 0.45–0.75
Ancient platforms A 16 Folded regions A 1:112–21 0.8–1.6
B 1:0 B 0:230.7–1.3 0.16–0.32
Note: Denominator shows variance range with confidence probability of 0.95
NATURAL GASES AND CONDENSATES106
used: a dimensionless value equal to the ratio of gas density to the air density. The air
density under standard conditions is 1.293 kg/m3.
Although many authors believe that the buoyancy forces (Archimedes principle)
are the main cause of gas movements and distribution in the accumulations, other
forces also cause fluid movements in the reservoir rocks. Pressure in the gas portion
of an accumulation is higher than in a similar water-filled trap by the amount of the
surplus pressure, which is equal to
psurplus ¼ ðrw � rgÞgH (6.5)
where rw is the water (or oil) density, rg the gas density, g the gravitational ac-
celeration, and H the height of accumulation column. For precise calculations, one
must take into account changes in the gas density depending on the height of ac-
cumulation column and the gas composition.
As the above equation shows, the surplus pressure is proportional to the density
difference and the height of accumulation column. The surplus pressure should not be
confused with abnormal, or abnormally-high formation pressure (AHFP). The rea-
sons for their emergence and existence are different. The surplus pressure is caused by
the existence of the accumulation with fluids of different density. On the other hand,
AHFP is an expression of the elastic energy accumulated in a limited volume; its
existence is defined by the relaxation conditions and is not associated with the presence
or absence of a hydrocarbon accumulation. Strictly speaking, when determining
AHFP, the surplus pressure should be subtracted although it is usually impractical.
6.3.2. Combustion heating value
The heat-generating capacity is the amount of heat (e.g., in joules) that is released
during the total combustion of a unit volume (e.g., 1m3) of a natural gas. Part of the
combustion heat is expended to evaporate the water contained in the flue gas and the
water contained in the gas itself (if any). Thus, the uppermost (gross) Qup and
lowermost (net) Qlow heating values are distinguished. The difference is the latent
heat of vaporization of water vapor in the flue gas. The hydrocarbon heat-generating
capacity grows as the molecular weight increases.
6.3.3. Compressibility of natural gases
Compressibility takes into account the deviation of the behavior of natural gases
from that of ideal gases. In estimating gas reserves it is important to compare the gas
volumes at reservoir conditions to those at standard conditions. Theoretically, the
van der Waals’ equation may be used for the natural gases:
ðpþ a=V2ÞðV � bÞ ¼ RT (6.6)
where p is the pressure in MPa, T and V are the absolute temperature (1C) and the
volume (cm3) of 1 g-mol of the gas, respectively, and R is the gas constant (8.32 J/
mol T). The a/V2 value (‘‘internal pressure’’) accounts for the mutual attraction of
molecules, and b is the volume of molecules.
PHYSICAL PROPERTIES OF NATURAL GASES 107

In practice, however, the Clapeyron equation with the compressibility factor Z
(due to intermolecular attraction) is used:
pV ¼ ZmRT (6.7)
where m is the mass of gas, R ¼ the gas constant, T ¼ the absolute temperature, and
Z ¼ the compressibility of the natural gas (which is a function of pressure, temper-
ature, and gas composition). For ideal gases, Z ¼ 1. The compressibility of a gas
mixture may be computed as a weighted average of compressibility of all components.
6.3.4. Deviation of pressure at bottom of gas column
If point 2 (in a gas column) lies at distance DL below point 1 ( p1 in psi), the
pressure at point 2 ( p2 in psi) is equal to
p2 ¼ p1 þ ðgDLÞ=144 (6.8)
where g is the specific weight of gas in lb/cu ft.
On using the equation of state and considering 1 lb of gas,
pv ¼ ZNRT (6.9)
where p is the absolute pressure in lb/sq ft, v ¼ the specific volume in cu ft/lb,
Z ¼ the compressibility factor, N ¼ the number of moles of gas, R ¼ the universal
gas constant, and T ¼ the absolute temperature in 1R.
Thus,
v ¼ ZNRT=p (6.10)
In as much as
v ¼ 1=g (6.11)
and
g ¼ p=ZNRT (6.12)
On substituting Eq. 6.12 into Eq. 6.8,
p2 ¼ p1 þ ð p=144ZNRT ÞDL (6.13)
Rearranging,
p2 � p1 ¼ ð p=144ZNRT ÞDL (6.14)
and
dp=p ¼ dL=144ZNRT (6.15)
In integral form, Eq. 6.15 becomesZ pbc
ps
dp=p ¼
Z L
0
ð1=144ZNRTÞdL (6.16)
Thus,
lnð pbc=psÞ ¼ L=144ZavNRTav (6.17)
NATURAL GASES AND CONDENSATES108
and
pbc=ps ¼ expðL=144ZavNRTavÞ (6.18)
or
pbc ¼ ps expðL=144ZavNRTavÞ (6.19)
where Zav is the average compressibility factor computed at Tav and pav, N is the
number of moles of gas, R the universal gas constant, which is equal to 10.7 for 1 lb.
mol of gas, ps is the pressure at surface in psia, pbc is the pressure at bottom of gas
column in psia, L is the length of gas column in ft, and Tav the average temperature
in gas column in 1R.
On simplifying the exponent and considering 1 lb of gas,
pbc ¼ ps expðLGg=53:3ZavTavÞ (6.20)
where Gg is the gravity of gas as compared to that of air (SGair ¼ 1).
The average temperature in the gas column can be computed from the following
equation:
Tav ¼ T s þ ðD=2ÞðdT=dLÞ þ 460� (6.21)
where Ts is the temperature at the surface in 1F, D is the vertical length of gas column
in ft, and dT/dL is geothermal gradient, which is around 21F/100 ft. Geothermal
gradient, however, varies with locality.
6.3.5. Gas viscosity
Gas viscosity increases with temperature. The reason is the increase in speed of
molecules and in the number of their collisions. If, however, the pressure also in-
creases, the gas viscosity stops increasing and then even declines at pressures specific
for each gas. At high pressures, viscosity of the natural gas increases with increasing
molecular weight. At the same pressure and temperature, the hydrocarbon gases
possess lower viscosity than the non-hydrocarbon gases. The viscosity of hydrocar-
bon gases increases with increasing pressure at the same temperature (1001C) as
shown in Fig. 6.2. In the presence of N2, CO2, and H2S, the viscosity of hydrocarbon
gases slightly increases.
6.3.6. Hydrate formation
At certain pressure and temperature, hydrocarbon gases combine with water,
forming crystalline hydrates. Crystalline hydrates are solid solution of gas in water.
Water molecules form a 3D frame invaded by very mobile gas molecules. Only light
hydrocarbons through pentane are capable of forming gas hydrates. The following
empirical formulae were established for the gas hydrates: methane, CH4 � 7H2O;
ethane, C2H6 � 8H2O; propane, C3H8 � 18H2O. Critical hydrate-formation temper-
ature for methane is 21.51C; for ethane, 14.51C; for propane, 5.51C; for i-butane,
2.51C; and for n-butane, 11C. The heavier the hydrocarbon gas, the easier it forms
PHYSICAL PROPERTIES OF NATURAL GASES 109

the crystalline hydrate. At a given temperature and pressure, a unit volume of hy-
drate contains several times more gas than in the case of free gas. When the con-
ditions are favorable, gas hydrates form accumulations in the Earth’s crust. A gas-
hydrate accumulation is present in the Arctic West Siberia. The proof of this ac-
cumulation is indirect, because of discrepancy between the trap volume and the
amount of produced gas. Of course, there is a possibility of communication through
a fault between this accumulation and a deeper, large gas accumulation.
The only favorable environment for the formation of gas-hydrate accumulations
on land is the permafrost environment. Rather favorable conditions are encountered
in the marine deposits. For instance, gas hydrates were discovered in the Caspian Sea
deposits (L. Lebedev, in: Eremenko and Chilingar, 1996, p. 79). There are wide-
spread occurrence of gas hydrates in the oceans (such as near the eastern coast of
New Zealand).
6.3.7. Solubility of gases in water
At temperatures and pressures substantially below the critical, the hydrocarbon
gas solubility in water roughly obeys the Henry’s law. An increase in water salinity
results in a decrease in hydrocarbon gas solubility, whereas the saturation of water
with gases leads to a decrease in solubility of liquid hydrocarbons.
Colloidal solubility of hydrocarbons in water can be one or two orders of mag-
nitude higher than the molecular solubility. For the former to occur, however, the
critical concentration for the micelle-formation must be reached, which is unusual in
natural environments. As the concentration of surfactants in a solution increases, so
Fig. 6.2. Relationship between viscosity and pressure for some hydrocarbon gases (at 1001C). 1 —
Methane; 2 — ethane; 3 — propane; 4 — n-butane. (After T.A. Botnieva, in: Eremenko and Chilingar,
1996, p. 76.)
NATURAL GASES AND CONDENSATES110

does the solubility of hydrocarbons. The presence of CO2 increases the hydrocarbon
solubility in water and in gases.
Water solubility in hydrocarbon gases at low pressure (o15–20MPa) and at
temperatures below 501C is insignificant — just decagrams per cubic meter. The
situation substantially changes in the presence of compressed gases. The content of
water in a compressed gas slightly increases with increasing pressure and drastically
increases with increasing temperature. A phase diagram of the methane–water sys-
tem (see Fig. 6.3) shows that at 3001C and a pressure below 340MPa, the liquid–gas
boundary curves do not become closer. At 3521C the methane–water system has a
double critical point.
At the same temperature and pressure, mixtures of methane and its homologs
contain less water than the pure methane. With increasing molecular weight of
hydrocarbons, the water content in the gas phase decreases somewhat. The result is
the same if the water contains salts.
6.3.8. Solubility of hydrocarbon gases in crude oils
The gas solubility in crude oils depends on the pressure, temperature, and com-
position of gas and oil. The gas solubility in crude oil increases with increasing
pressure and decreases with increasing temperature. The denser the crude oil, the
lesser the gas solubility. Same effect is observed with increasing content of naphthene
and aromatic hydrocarbons in crude oils.
The pressure at which the given oil is fully saturated with associated gas is called
the saturation pressure. When the reservoir pressure drops below the saturation
pressure, the dissolved gas is released from solution. If the reservoir pressure
is higher than the saturation pressure, the oil is undersaturated. As temperature
Fig. 6.3. Relationship between pressure and methane content in gas-water and methane-water systems
(Sultanov, Skripka, Namiot, personal communication, 1971. In: Eremenko and Chilingar, 1996, p. 80.).
Dashed line connects critical points. Numbers are temperatures in 1C.
PHYSICAL PROPERTIES OF NATURAL GASES 111

increases, the saturation pressure increases. The gas solubility in the crude oil in-
creases with depth as the pressure increases. In as much as the heavier hydrocarbons
dissolve first, the gas in gas caps becomes lighter. A totally different scenario occurs
with gas compression and increase in temperature: liquid hydrocarbons in crude oil
begin to dissolve in the natural gas.
The Palvantash and Izbaskent fields of the Fergana Basin (Uzbekistan), however,
show the opposite trend in the natural gas enrichment in heavy components (see
Fig. 6.4). The data from the Izbaskent field clearly indicate an inverse solution,
which will be discussed in the next section.
6.4. PHASE TRANSFORMATION AND CONDENSATES11
Changes in the reservoir pressure and temperature results in the redistribution of
crude oil components between the liquid and gas phases. Gas–oil systems have a very
complex composition. In order to simplify the discussion, the patterns in phase
transformation for the simple binary systems (mixtures of methane and liquid hy-
drocarbon) are discussed.
Fig. 6.5 is a phase diagram of the methane–liquid hydrocarbon binary system of
constant composition. The ACB curve enveloping the two-phase domain describes a
constant composition system. Any change in the composition will affect its shape.
The ACB curve consists of two branches: the bubble point curve AC and the dew
point curve BC. When pressure is higher than the AC curve, the system is a single-
phase liquid. Below the AC curve, vapor bubbles appear in the liquid and are
maintained in a state of equilibrium with it. As the pressure in the system decreases,
the amount of vapor increases. As the pressure rises above the dew point curve,
liquid hydrocarbons drop out of the gas phase. The two-phase domain shows curves
indicating iso-concentrations of the liquid phase in the system.
Fig. 6.4. Variation of CH4/C2H6+ ratio with depth in (a) Palvantash and (b) Izbaskent fields. 1 — Gas in
solution; 2 — free gas. (After T.A. Botnieva, in: Eremenko and Chilingar, 1996, p. 80.)
11Modified after Zhuze and Sushilin (1984).
NATURAL GASES AND CONDENSATES112

As opposed to a single-component system, the critical temperature Tcr and critical
pressure pcr for a binary system are not maximal at the critical point C12. At Tcr and
pcr, two phases may still coexist. Maximal points for a binary system are the crico-
denbar pm and cricodentherm Tm. When the temperature and pressure range be-
tween Tcr and Tm, and also when temperature changes within the pressure interval
between pcr and pm (see Fig. 6.5), anomalous phenomena known as retrograde con-
densation occurs in the system. For instance, if the system at point F is isothermally
compressed (at temperature TE), then starting at point E, the liquid hydrocarbon will
be released from the gas. The amount of the released liquid hydrocarbon increases,
reaches a maximum and then declines to zero (at point G where the vertical line
again intersects the vapor curve). This phenomenon is called isothermal retrograde
evaporation. As the phase diagram shows, anomalous phenomena also occur within
the pcr to pm pressure interval when temperature increases or decreases.
The critical temperature of the oil mixture may be approximately determined
using the following equation:
T cr ¼X
T cr:imi, (6.22)
where Tcr.i is the critical temperature of component i and m is its mass fraction in the
system.
Fig. 6.5. Phase diagram of pressure versus temperature for a methane-liquid hydrocarbon binary system.
(After Zhuze and Sushilin, 1984.)
12Critical point: where material cannot be condensed regardless of the amount of pressure applied. The
liquid and vapor phases merge at the critical point so that one phase cannot be distinguished from the
other.
PHASE TRANSFORMATION AND CONDENSATES 113

The additive rule is inapplicable for the calculations of pcr for gas–oil systems: pcrof the mixture is usually much higher than pcr of any component. The greater the
difference in molecular mass and nature of the mixture components, the greater the
difference between the actual pcr and the pcr calculated using the additive rule.
All the above is true for a single equilibrium oil–gas system (in this case, methane-
liquid hydrocarbon). The situation drastically changes if the system is not in equi-
librium (for instance by increasing the molar fraction of methane). First of all, the
shape of the ACB curve (see Fig. 6.5) changes. Besides, the excess of methane forms
an independent gas phase (a gas cap at reservoir conditions). Thus, a transition may
be observed in the reservoir between the equilibrium gas–oil system and the gas cap.
This transition is gradual, with no distinct boundaries.
Numerous accumulations in West Siberia and North Caucasus, in terms of their
phase state, are within the curve ACB (see Fig. 6.5). It means that they are in a
transition vapor–liquid state, without a clear-cut gas–oil contact and gas cap (if it
exists). Such ‘‘transition type’’ accumulations, depending on their position within the
ACB curve, may be described differently on the basis of the well test results: (1) as
gas-condensate accumulations with or without an oil leg or (2) as oil accumulations
with a high gas/oil ratio (GOR) and a gas cap (with high condensate content), albeit
the presence of a gas cap may not be confirmed later. The OWC (the interface) may
be clearly definable at temperatures which are not high. At high temperatures (near
the critical temperature), a distinct OWC is replaced by a transitional water–oil zone.
The phase diagram given in Fig. 6.5 clearly demonstrates mutual solubility of the
liquid and gas phases, which was a subject of a number of in-depth studies (e.g.,
Zhuze, 1986). Fig. 6.6 shows the solubility isotherms of normal paraffin hydrocar-
bons C3–C7 in methane. Left parts of the curves describe the normal condensation
area of liquid hydrocarbons from the gas phase as the pressure in the system in-
creases (e.g., Fig. 6.4 in the case of Palvantash Field). Right portions of the curves in
Fig. 6.6 show the dissolution of liquid hydrocarbons in gas as the pressure in the
system increases (e.g., Izbaskent Field; Fig. 6.4). With increasing molecular weight of
liquid hydrocarbons, their solubility in compressed gases decreases (at the same
temperature and pressure). The solubility of liquid hydrocarbons in gas increases
with increasing branching arrangement. A significant increase in temperature and
pressure also increases the solubility of liquid hydrocarbons in gas (with pressure
having a more significant effect).
Liquid hydrocarbons dissolved in compressed gas are called the condensate. The
gas and condensate in a gas-condensate accumulation exist in a single-phase state
and obey the law of retrograde condensation. The condensate is composed of a
mixture of gasoline and heavier oil factions. The average boiling point temperature
of condensate is below 200oC. Sometimes, however, it may reach 350–5001C (ap-
parently when condensate is mixed with oil). Condensate differs from the gasoline
fraction separated from the associated gases: gasoline has a boiling point temper-
ature of 130–1601C, whereas condensate has a higher boiling point temperature.
Condensate content in gas ranges widely from several cm3/m3 (Rudki Field) to
300–500 cm3/m3 (Vuktyl and Russkiy Khutor Fields) and even to 1,000 cm3/m3 (e.g.,
Talalayev Field). (The latter fields are in Russia.)
NATURAL GASES AND CONDENSATES114
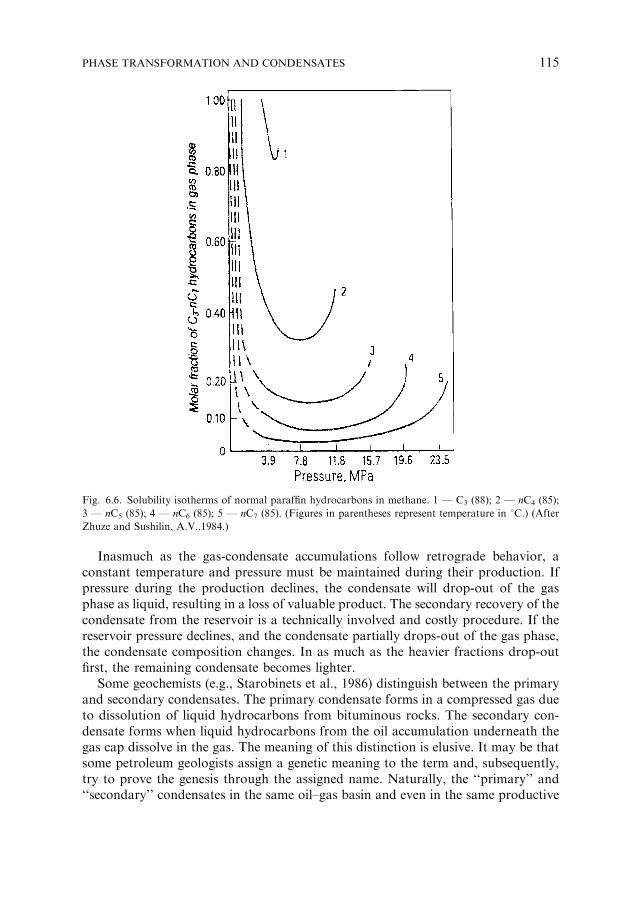
Inasmuch as the gas-condensate accumulations follow retrograde behavior, a
constant temperature and pressure must be maintained during their production. If
pressure during the production declines, the condensate will drop-out of the gas
phase as liquid, resulting in a loss of valuable product. The secondary recovery of the
condensate from the reservoir is a technically involved and costly procedure. If the
reservoir pressure declines, and the condensate partially drops-out of the gas phase,
the condensate composition changes. In as much as the heavier fractions drop-out
first, the remaining condensate becomes lighter.
Some geochemists (e.g., Starobinets et al., 1986) distinguish between the primary
and secondary condensates. The primary condensate forms in a compressed gas due
to dissolution of liquid hydrocarbons from bituminous rocks. The secondary con-
densate forms when liquid hydrocarbons from the oil accumulation underneath the
gas cap dissolve in the gas. The meaning of this distinction is elusive. It may be that
some petroleum geologists assign a genetic meaning to the term and, subsequently,
try to prove the genesis through the assigned name. Naturally, the ‘‘primary’’ and
‘‘secondary’’ condensates in the same oil–gas basin and even in the same productive
Fig. 6.6. Solubility isotherms of normal paraffin hydrocarbons in methane. 1 — C3 (88); 2 — nC4 (85);
3 — nC5 (85); 4 — nC6 (85); 5 — nC7 (85). (Figures in parentheses represent temperature in 1C.) (After
Zhuze and Sushilin, A.V.,1984.)
PHASE TRANSFORMATION AND CONDENSATES 115

formation may be somewhat different [because the sources (oils or bitumens)
are different in composition]. The established distinctions may be utilized to reach
certain geochemical conclusions within the oil- and gas-producing sequences in the
same basin. Transposition of the established patterns outside of the oil and gas
deposits (and even more so outside of the productive basin) is fraught with possible
errors due to different compositions of compressed gases, oils, and bitumens.
It may be assumed that the ‘‘primary’’ gas-condensate mixtures are always un-
dersaturated compared to the ‘‘secondary’’ ones. However, all ‘‘secondary’’ gas-
condensates in the West Siberia were undersaturated regardless of their position
above the oil accumulations (or oil rims). This phenomenon is still awaiting an
explanation. The most likely reason is gravity separation. As mentioned earlier,
gravity separation was observed in very thick gas accumulations. If the density range
is wide, the gravity separation is likely. It may be expected that this situation will be
maintained until the accumulation approaches its critical stage, when the role of
gravity becomes insignificant. Until such time, samples obtained from different
depths within the transition zone will show different saturation of oil in gas. Thus,
the higher the sample location within the transition zone, the greater the difference.
NATURAL GASES AND CONDENSATES116

Chapter 7
DISPERSED ORGANIC MATTER
7.1. ORGANIC MATTER INSOLUBLE IN ORGANIC SOLVENTS: KEROGEN
The content of kerogen in the rock–water–organic matter system is insignificant
and varies between fractions of 1% and a few percentage points. However, its sig-
nificance is greater than its content and may be compared to that of the accessory
minerals in petrography: kerogen enables one, albeit not always, to solve various
geochemical problems, including the oil and gas genesis.
The major part of the organic matter (OM) is represented by carbon, which is
usually used as the basis for geochemical calculations. There is a correlation between
the organic carbon content and lithology. The clarke values of the total organic
carbon (TOC) are: clays – 0.9%; siltstones – 0.45%; sandstones – 0.2%; and car-
bonates – 0.2% (Vassoyevich, 1984). This is a reflection of the depositional envi-
ronments at the time of original organic matter accumulation in sediments.
Historically, the appearance of organic matter in sediments goes back to
the origin of life on the Earth. Organic carbon is present in rocks as old as 4 to 4.5
billion years. Sidorenko (1978) suggested that the oldest accumulations of organic
carbon-rich formations occurred 3.7 to 3.5 billion years ago. He identified the
Priazov Series (Ukrainian Shield), Kola Series of the Kola Peninsula and the graph-
ite gneiss of the Siberian Platform as such formations. Traces of organic matter
are omnipresent in the Phanerozoic deposits. The dispersed organic matter can be
divided into two categories: (1) soluble in organic solvents and (2) insoluble in
organic solvents.
All living organisms comprise various combinations of the same carbon
compounds: lipids, proteins, carbohydrates and lignin (for higher plants). In 1920,
Potonie classified caustobioliths, according to their genesis, into humites and sa-
propelites. The humites are lignin-cellulose substances and liptobioliths, which form
from tar, wax, spore shells, and cuticles. The sapropelites are transformation prod-
ucts of the simplest plant and animal remains, with or without preservation of
original form. Same classification is applied to the dispersed organic matter. A
weakly substantiated is the assignment of the humites to the continental genesis and
the formation of various coals, and of the sapropelites to the major source matter for
the oil and gas formation. Ammosov et al. (1987) proposed one more class: organo-
fluidoliths, which are solid substances forming during migration of fluids (hydro-
carbons or coaly fluids).
Dispersed organic matter of rocks may be classified into insoluble and soluble in
organic solvents (chloroform, benzene, alcohol, methanol, acetone, ethanol, and
their mixtures).
117

Insoluble Portion of Organic Matter
Some authors (Tissot and Welte, 1981) name the portion that is insoluble in either
organic solvents or alkalis, the kerogen (the definition excludes bitumen). This in-
soluble portion is similar to coal. Chemically and petrologically, it includes the same
components as coal. The microcomponents of coals are presented in Table 7.1.
Major components of insoluble portion of organic matter are carbon, hydrogen,
and oxygen. Nitrogen and sulfur are present in a lesser amount. Tissot and Welte
(1981), using Van Krevelen’s (1961) graphs, identified three kerogen types on the
basis of their elementary composition; they attribute a genetic meaning to their
classification (Fig. 7.1).
Type I kerogen has a high initial H/C atomic ratioX1.5; the O/C ratio is o1. The
kerogen is composed mostly of a lipid matter. Oxygen is present mostly in the ester
bonds. When pyrolyzed, the volatile and extractable compounds including oil are
produced. This kerogen type forms from the lipid-enriched organic matter.
Type II kerogen has a relatively high initial H/C atomic ratio (1–1.5) and a low
O/C ratio. Polyaromatic molecule cores, heteroatomic groups of ketones, and car-
boxylic acids are of great importance. The bitumen associated with this kerogen
includes many cyclic structures, and its sulfur content is higher than in the other
component parts.
Type III kerogen has a relatively low H/C atomic ratio (o1.0) and a high O/C
ratio (0.2–0.3). It comprises a substantial extent of polyaromatic cores, heteroatomic
and carboxylic groups, but does not contain ester groups. Apparently, the land
plants constitute its main source.
All these kerogen types played different roles in the formation of oil, as discussed
later.
As shown in Table 7.1, many microcomponents can be utilized to determine
paleotemperatures. Main alteration in organic matter buried with the sediments is in
the creation and, sometimes, preservation of substances that are stable during dia-
genesis and catagenesis. It is assumed that changes occur mostly due to the effect of
heat. These processes are slow (millions of years), which is the case for most geologic
processes (Ammosov et al., 1987). Although the duration of natural processes is
long, the speed of specific reactions may vary significantly. Role of the time factor in
the natural processes needs to be understood better. For instance, as Lopatin (1971)
pointed out, a temperature increase of 10oC causes the speed of kinetic reaction to
double.
This simplified model has been utilized to reconstruct the geochemical evolution of
many petroliferous basins. A number of writers, however, disagree with this concept.
For example, Allen and Allen (1993, p. 284) believe that the above rule is app-
licable only in the temperature range of 50–60 1C, above which the speed of kinetic
reaction substantially changes (for instance, it is just 1.4 at 200 1C). Tissot et al.
(1987) have limited the applicability of the Lopatin’s technique by the activation
energy of no higher than 10–20 kcal/mol. Price (1985, pp. 233–240), on the other
hand, believes that alterations of heterogeneous compounds in nature follow more
complex laws.
DISPERSED ORGANIC MATTER118

TABLE 7.1
Microcomponents of coals (after Ammosov et al., 1987)
Brown coals Hard coals
Group Microcomponents Paleotemperature
determination
technique
Group Microcomponents Paleotemperature
determination
technique
Alginite Teloalginite F1 Alginite Teloalginite F1
Colloalginite ? Colloalginite ?
Algo-humite Saprohumite N/a2 Algovitrinite Saprovitrinite n/a2
Helinite, textinite,
caprohuminite,
ulminite
R3 Collinite R3
Huminite Textinite, ulminite R3 Vitrinite Tellinite R3
Attrinite, densinite ? Vitrodetrinite R3
Interohuminite Oxyhuminite n/a4 Interovitrinite Semivitrinite n/a4
Macrinite, micrinite n/a5 Macrinite, micrinite n/a5
Intertinite Semifusinite,
fusinite,sclerotinite,
interdetrinite
n/a5 Fusinite (intertinite) Semifusinite, fusinite,
sclerotinite,
inertodetrinite
n/a5
Liptinite Spirinite, kuptinite,
resinite
F1 Liptinite Sporinite, cutinite F1
Liptodetrinite,
subdetrinite,
chlorfullinite
? Retinite, liptodetrinite ?
Note: 1 – stages of thermal transformation are determined from fluorescence (F) or from color and optical density in transmitted light; 2 – not suitable for paleo-
temperature determination; 3 – stages of thermal transformation are determined from vitrinite reflectance (R); 4 – reflectance is too high; not suitable for paleo-
temperature determination; 5 – react weakly to changes in temperature and pressure; not suitable for paleotemperature determination.
ORGANIC
MATTER
INSOLUBLEIN
ORGANIC
SOLVENTS:KEROGEN
119

Generally speaking, it would be unrealistic to expect a single energy threshold for
complex natural compounds and numerous chemical reactions they undergo. It is
obvious that both initial and final values of energy threshold (and speed of processes
and composition of end products) will change depending on the type of mixture.
According to Glesston et al. (1948), the energy threshold (activation energy) is a
natural boundary at which the reactions begin. Until that boundary is exceeded, the
system may be considered as practically stable under the existing energy environ-
ment.
As far as the field observations are concerned, Price (1983) noted that the effect of
time factor was overestimated, because the difference in geothermal gradients in
different regions was not taken into account. Koshman (1985), however, disagrees
with this view. Also, very intriguing results were obtained in the laboratory studies
by Rohrback et al. (1984). They studied the effect of temperature on various se-
diments and found that vitrinite reflectance changes from 0.2 to 3.0% on heating
from 35 to 550 1C during the time interval of 1 to 15,000 h (which is just a drumbeat,
geologically speaking).
Thus, one may suggest that the alterations in the coaly matter occur rapidly at
first, after which the matter may preserve its acquired properties for a long time. An
inference from the latter might be that the alterations of coaly matter occur not as
much from the amount of heat received but from reaching the necessary temper-
atures. Andreyev et al. (1958) indicated that the duration of achieving the stable state
for organic matter is always much lower than the residence of the system in stable
state. Moskvin (1981) reached a similar conclusion: time does not affect the degree of
alteration of organic matter. Allen and Allen (1993, p. 284), on the other hand, do
not exclude the effect of time on the organic matter alteration. Lopatin (1983),
summarizing ideas of the time and temperature effects on the organic matter trans-
formations, prepared a graph (Fig. 7.2). As shown later, heat flow is not the only
energy source in the subsurface (Shvetsov, 1974; Trofimuk et al., 1981).
Out of all the components of coals presented in Table 7.1, vitrinite is considered to
be the most suitable for determination of paleotemperatures. Paleotemperatures are
Fig. 7.1. Coal maceral evolution curves (modified after van Krevelen, 1961; also see Larsen and
Chilingar, 1967).
DISPERSED ORGANIC MATTER120

determined based on vitrinite reflectance as measured in oil (Ro) or in air (Ra). This,
however, poses some problems. One such problem is the selection of a reliable
sample and a suitable area of that sample for the determination of maximum re-
flectance. A number of Ro or Ra values can be determined for the same sample and a
maximum value must be selected. But there is no guarantee that the selected value is
indeed maximal: there may be some areas in the samples where these values are
greater. According to Ammosov et al. (1987, p. 23), the reason for that is the
non-uniformity and incompleteness of alterations of the solid substance and the
preservation of such a state indefinitely under given thermobaric conditions. Non-
uniformity of organic matter accumulation and distribution in any sample cannot be
argued. At the same time, studies by Yu. V. Stepanov (in: Ammosov et al., 1987,
p. 82) of alterations in a series coal-sandstone–siltstone–argillite indicate a certain
direction for increasing Ro. Price (1982), Price and Barker (1985), and Price et al.
(1986) recorded changes in the hydrogen content of kerogen. Hydrogen enters the
vitrinite and alters its reflectance. The coal samples from the same coal bed, con-
taining more hydrogen, display lower Ro.
Ammosov et al. (1987, p. 26) believe that some errors may have been caused in the
determination of vitrinite reflectance not in the true vitrinite but in the vitrinite
homologs, such as saprovitrinite, semivitrinite and, sometimes, pseudovitrinite,
which have been confused with true vitrinite. True vitrinite reflectance is lower than
that of semivitrinite and pseudovitrinite and higher than that of saprovitrinite. Ac-
cording to Ammosov, this might have caused erroneous conclusions by Price and
others.
Despite some disagreements, most authors are of the opinion that vitrinite may be
used as a maximum paleothermometer and for determining the degree of catagenesis
in the surrounding rocks. Table 7.2 is a comparison chart for regional temperatures,
stages of catagenesis, and vitrinite reflectance.
Lithogenesis includes diagenesis, epigenesis, and metamorphism. Vassoyevich
(1975) changed the term epigenesis to catagenesis and subdivided it into different
stages.
Fig. 7.2. Conceptual curve showing temperature and geologic age as coalification factors (modified after
Lopatin, 1983).
ORGANIC MATTER INSOLUBLE IN ORGANIC SOLVENTS: KEROGEN 121

Inasmuch as vitrinite alterations are irreversible and its reflectance is preserved
after a subsequent temperature drop, reflectance can be used for the determination of
paleotemperatures. Table 7.2 assumes a direct correlation between temperature and
Ro values. This correlation, however, is not always straightforward. For example,
Ammosov et al. (1987) presented graphs of vitrinite reflectance vs. depth for the
Jurassic deposits of the Pre-Caucasus region (Fig. 7.3) and of the present-day tem-
perature vs. depth for the same formations (Fig. 7.4). As shown by the graphs, there
is no correlation between Ra and either depth or temperature. The writers believe
that an attempt to explain this by the subsequent tectonic inversion with the pres-
ervation of Ra with the declining temperature is not convincing. One of the authors
of quoted publication, V.I. Gorshkov, is convinced that there is no correlation
between temperature and vitrinite reflectance. High reflectance gradients do not
necessarily correspond to the high paleotemperature gradients. Thus, one should be
cautious in using vitrinite reflectance for determining paleodepths of prospective
petroliferous rocks.
It is important to stress again that it is possible to obtain different Ra and Ro
values for the same rock sample. This is due not only on the spatial difference
(inclination angle) between the studied maceral elements, but also the degree of
catagenetic maturity of different organic matter components, which may differ in
their (1) initial composition, (2) current chemical composition, (3) syngenetic or
secondary origin, and (4) size. Ammosov et al. (1987) recognized that various com-
ponents react differently to thermobaric conditions in the subsurface and have
different ranges for the diagenesis, epigenesis, catagenesis, metagenesis, and meta-
morphism. Thus, boundaries of lithogenetic stages as determined from organic
matter or from sedimentary rocks in general are not precise (Ammosov et al., 1987,
p. 310). Saxby (1982) also suggested that some corrections must be made to the
kerogen transformation scale using Ro. According to him, the lower boundary for
the oil window should be moved up to Ro ¼ 1–2%, and for the gas window, to 5%.
TABLE 7.2
Comparison of regional temperatures with vitrinite reflectance (after Ammosov et al., 1987)
Paleotemperature
forecast (1C)
Vitrinite reflectance Ro
(%)
Paleotemperature
forecast (1C)
Vitrinite reflectance Ro
(%)
75 0.45 185 1.12
90 0.5 190 1.22
110 0.55 195 1.27
115 0.59 200 1.37
125 0.63 205 1.42
135 0.70 210 1.56
145 0.76 215 1.66
155 0.83 220 1.76
165 0.90 225 1.92
175 0.97 230 2.10
180 1.09 235 2.45
DISPERSED ORGANIC MATTER122
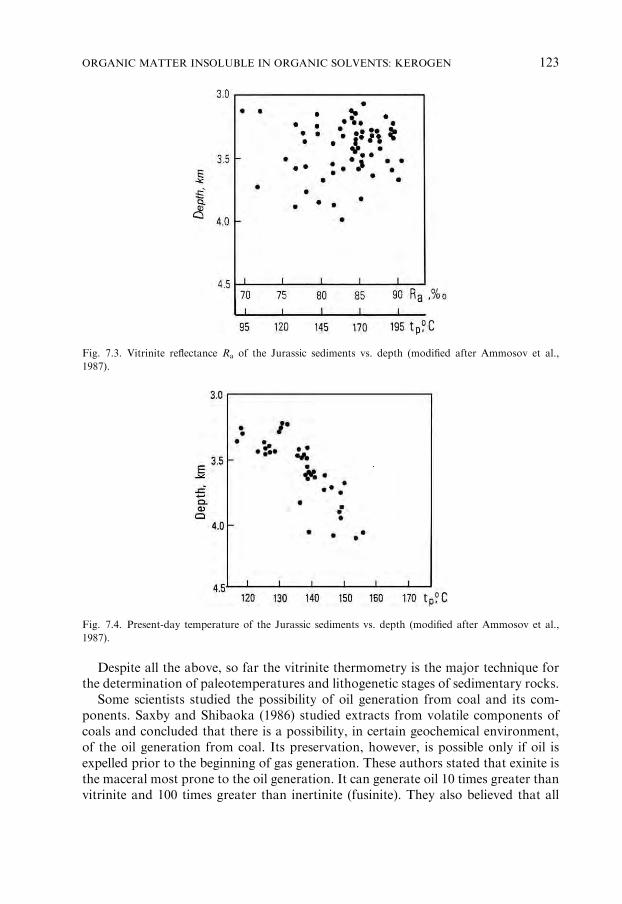
Despite all the above, so far the vitrinite thermometry is the major technique for
the determination of paleotemperatures and lithogenetic stages of sedimentary rocks.
Some scientists studied the possibility of oil generation from coal and its com-
ponents. Saxby and Shibaoka (1986) studied extracts from volatile components of
coals and concluded that there is a possibility, in certain geochemical environment,
of the oil generation from coal. Its preservation, however, is possible only if oil is
expelled prior to the beginning of gas generation. These authors stated that exinite is
the maceral most prone to the oil generation. It can generate oil 10 times greater than
vitrinite and 100 times greater than inertinite (fusinite). They also believed that all
Fig. 7.4. Present-day temperature of the Jurassic sediments vs. depth (modified after Ammosov et al.,
1987).
Fig. 7.3. Vitrinite reflectance Ra of the Jurassic sediments vs. depth (modified after Ammosov et al.,
1987).
ORGANIC MATTER INSOLUBLE IN ORGANIC SOLVENTS: KEROGEN 123

known oil reserves in the Gipsland and Cooper basins of Australia may have been
generated as a result of the thermal maturation of coals, even if just 1% of the
generated hydrocarbons was captured in the traps.
Baird (1986) suggested that liptinite was the main source maceral for oil, whereas
vitrinite was for gas. Inertinite was inert. Tissot and Welte (1981) believe that most
hydrocarbons of natural gases were generated as a result of thermal transformation
of kerogen during catagenesis. They also believe that the insoluble portion of the
organic matter (i.e., kerogen) has properties of a molecular sieve. This conclusion
was based on the following experiments: upon extraction, some samples were treated
with acid, and then extracted again. After second extraction with organic solvents,
bitumens with some hydrocarbons were released from the kerogen samples. Similar
studies with repeated extraction after treatment with the hydrofluoric acid have been
conducted by Akramkhodzhayev (1973), Akramkhodzhayev and Amirkhanov
(1977), and Akramkhodzhayev et al. (1978). They discovered not only saturated
but also unsaturated hydrocarbons in the second extracts. In the discussion that
followed these studies (Eremenko and Tverdov, 1980; Karimov and Kalapov, 1983)
it was found that unsaturated hydrocarbons may be retained by kerogen in sorbed
state, which is important for the problem of oil generation.
Ammosov et al. (1987), in discussing organic matter in the sedimentary rocks as a
whole, indicated that both humic and sapropelic organic matter is converted into
solid, liquid, and gaseous phases in the subsurface. Migrating liquid and gaseous
phases interact with the mineral and organic components of the surrounding rocks
and produce new compounds, called organofluidoliths. The genetic associations
(with either humic or sapropelic matter) are erased in an organofluidolith. Ammosov
et al. believe that the liquid and gaseous organofluidoliths participate significantly in
the oil generation.
It is interesting to review the distribution of oil reserves in the sedimentary rocks
as a function of Ro, Ra, and temperature. According to Ammosov et al. (1987),
major oil reserves are found with Ra ¼ 62–93, Ro ¼ 0.33–1.29, and temperature of
100 to 150 1C. As the temperature increases the process slows down. Above the
temperature of 200 1C, oil generation cannot occur (‘‘dead zone’’). Saxby (1982)
believed that the oil generation can proceed until Ro ¼ 2, the condensate generation
until Ro ¼ 3, and the gas generation until Ro ¼ 5. Price and Barker (1985) stated
that a limitation of the oil generation interval to the Ro range of 0.6–1.35 (which is
broader than the Ammosov’s) is wrong. The Ro value of vitrinite, which is usually
enriched in the invaded hydrogen, is suppressed. The correct value is about 3–5
notches higher, i.e., the Ro ¼ 6–8.
All aforementioned alterations in the composition of coals and coaly matter in the
sedimentary rocks are attributed by many authors to the thermal effects. All at-
tempts to find a correlation with the dynamic stress were either unsuccessful (Am-
mosov et al., 1987) or not clear (Ignatchenko, 1968; Stefanova and Shimorina, 1981).
It is important to mention here Strakhov’s (1960) opinion that not all natural proc-
esses are a result of changes in the thermodynamic conditions. Some are due to
internal energy of the system, which is released as a result of equilibration of the
system.
DISPERSED ORGANIC MATTER124

7.2. ORGANIC MATTER SOLUBLE IN ORGANIC SOLVENTS
Organic matter (OM) in a deposit includes a substantial amount of organic com-
pounds, which are easily dissolved in the organic solvents and are easily hydrolyzed.
Tissot and Welte (1981, p. 84) showed that some free and hydrolyzed organic com-
pounds contain fatty acids, hydrocarbons, sugars, and amino acids. Their total con-
tent is low and amounts to 15–40% of the organic matter even in the near-surface
layer of sediments. At a depth of 0–15m, they constitute 6% in the Saanich Bay,
British Columbia, 25% in the Bering Sea, and 40% in the central part of the Black
Sea. In all cases, their content rapidly decreases with depth due to the bacterial
activity and becomes less than 1% at a depth of 35m. Microbially processed organic
matter is transformed to an insoluble state through the condensation and polym-
erization during diagenesis to a depth of a few tens or a few hundreds of meters. Lipid
compounds (including hydrocarbons) are quite stable. They transfer from the living
matter into the sediments and, subsequently (after diagenesis), into rocks without or
with only slight changes. These compounds have a relatively high molecular weight.
Tissot and Welte (1981, p. 124) proposed to call ‘‘chemofossils’’ the molecules that
have been synthesized by the living plants or animals and enter into the sediments
with only slight changes and with the preserved molecular structure of hydrocarbons
or other lipids. Most important chemofossils are alkanes, fatty acids, terpenes, ster-
oids, and porphyrins. Quantitative hydrocarbon determinations in the present-day
sediments have been performed by Gorskaya (1950) (Black Sea) and Hunt (1981).
It was established in the laboratory that if subjected to the effects of temperature
or physicochemical reactions, kerogen is capable of releasing hydrocarbons. Usually,
these hydrocarbons have lower molecular weight and a simpler structure than
chemofossils. Thus, compounds extracted from rocks by organic solvents may have a
double origin: inherited from the original organic matter (chemofossils) and newly
formed compounds.
The soluble part of the dispersed organic matter is called bitumen. Petroleum
geochemists studied the bitumen in detail because of the established similarity of its
light portion with oil. The kerogen was studied in detail by the coal geochemists.
The kerogen-sorbed saturated and unsaturated hydrocarbons have been discov-
ered by Akramkhodzhayev (1973) while studying bitumens. They are of special
interest. The unsaturated hydrocarbon release-curve from a heated and solvent-
treated kerogen is bimodal. The first maximum is observed at 100 1C, whereas the
second one at 300 1C or above. The first maximum cannot be explained by the
thermal disintegration of complex hydrocarbon, ester, and other side chains of
kerogen (Nametkin, 1955). It contradicts a physicochemical law of an increase in the
intensity and speed of chemical reactions with increasing temperature. Of interest
is the total decrease in the released hydrocarbons in the temperature range of
100 –150 1C. This also cannot be explained by the hydrocarbon formation as a result
of the organic matter decomposition. The most plausible interpretation is desorption
of hydrocarbons from organic matter.
Thus, it may be suggested that the unsaturated hydrocarbons released from
kerogen at �100 1C (and even 300 1C) are products of biosynthesis and are inherited,
ORGANIC MATTER SOLUBLE IN ORGANIC SOLVENTS 125

together with other hydrocarbons, from the original organic matter. Some geo-
chemists cast doubt on such a hypothesis over a high reactivity and instability of
unsaturated hydrocarbons. The high reactivity and instability of unsaturated hy-
drocarbons in natural environments are relative, however. There are published data
on the presence of unsaturated hydrocarbons in crude oils of different geologic age
and at different depths. For instance, small amounts of hexylenes, octylenes, and
nonilenes have been identified in a Canadian crude oil. Unsaturated hydrocarbons
are present in the crude oils from the North Caucasus, Emba Area (Russia), and
Sakhalin Island (Nametkin, 1955). It may be further suggested that the preservation
conditions for the rock-sorbed unsaturated hydrocarbons may be even better than
those in the accumulations. This agrees with the idea of Burst (1969) that bonded
water has the preservation effect on hydrocarbons. This is supported by the presence
of unsaturated hydrocarbons in gases released during a vacuum degassing of rocks
not only in shallow but also in deep wells.
Various organic solvents are used to extract the bitumen. They include chloro-
form, benzene, acetone, and mixtures thereof. The most commonly used solvent is
chloroform. It usually extracts the maximum amount of bitumen from the ground
rocks. These bitumens are usually more reduced as compared with the bitumens
extracted with the other solvents.
Elementary (C, H, S, N, O) and group (lubricants, resins, asphaltenes) compo-
sition is studied in the extracted bitumens. All available techniques are applied for
their studies such as liquid and gas chromatography, mass spectrometry, X-ray, UV
and IR microscopy, and electromagnetic resonance. Bitumens have been studied to
the same depths as those for the crude oils.
With all the other conditions being same, the content of bitumens in the rocks
increases with increasing organic matter content. Simultaneously, their relative content
in the organic matter of rocks declines. This is especially apparent when the organic
matter content in rocks is low. Also, there is an increase in the reduced bitumens.
There is a correlation between the bitumen content and the lithology (Table 7.3,
based on calculations by Vassoyevich (1984) conducted in 1973). Since then, despite
a tremendous increase in the accumulated data, no appreciable changes in principle
have occurred.
As mentioned before, the bitumens are composed of oils, resins, and asphaltenes.
Most oils contain all compounds found in crude oils, the first being hydrocarbons.
The elementary composition of bitumens is also close to that of crude oils, except for
a higher content of heteroelements (O, N, S) in bitumens.
Table 7.3 also contains data for rocks with the concentrated forms of organic
matter. The content of both bitumens and hydrocarbons is rather high there. This is
just another indication that such rocks may have contributed to the oil generation
and, even more so, to gas generation. The absence of large commercial oil and gas
reserves in such rocks is explained in the subsequent sections.
Organic matter in the carbonates is more bituminous, and the degree of their
reduction increases with the increasing carbonate content (Vassoyevich, 1971).
Some geoscientists recorded the oxidation of bitumens in argillaceous deposits in
the proximity of reservoir rocks (whether up or down the section). Neruchev and
DISPERSED ORGANIC MATTER126

TABLE 7.3
Approximate subclarke values of organic matter (OM) components in various sedimentary rocks at catagenetic stages MC4 and lower (after Vassoyevich, 1973)
Rock TOC (%) Bitumen (chloroform-extractable bitumen) Hydrocarbon content (%)
Content (%) Total mass in continental deposits (1013 t) In rock In OM In bitumen
In rock In OM
Clays 0.9 0.06 5 36 0.02 1.7 30
Silts 0.45 0.03 5 5.7 0.01 1.7 30
Sands 0.2 0.016 6 2.6 0.005 1.9–1.95 40
Carbonates 0.2 0.03 11–12 6.3 0.012 1.9–1.95 32
Salts, sulfates 0.1 0.01 7.5–8 0.04 0.003 2.3 30
Coals 67 0.8 0.9–0.95 0.025 0.15 0.2–0.25 18–20
Oil shales 16.5 1 4.5–5 0.06 0.2 0.5–0.1 20
Dominikites, Bazhenovites 6 0.6 7.5–8 1.8 0.25 4–4.2 40–45
All continental rocks (excluding lavas) 0.62 0.045 5.4–5.8 52.5 0.0115 1.8–2 34–35
ORGANIC
MATTER
SOLUBLEIN
ORGANIC
SOLVENTS
127

Rogozing (1992), Kartsev (1984), Kontorovich (1991), and others explained this by
the migration of more reduced portion of bitumens into the reservoir rocks. Lab-
oratory modeling based on chromatographic studies (e.g., Yermakova et al., 1988)
showed that, after a slight thermal treatment (under 300 1C), the tar generates hy-
drocarbons, such as n-alkanes and isoprenoids. Reactions of hydrolysis of esters,
decarboxylation of acids, and dehydration of alcohol have also been established.
It was found that the composition and content of bitumen change in the section.
This was linked to the zonation of oil and gas generation in sedimentary section and
resulted in the development of concept of the ‘‘main phase of oil and gas generation’’
(oil and gas window).
Figure 7.5 shows conceptual diagrams of zonation of oil and gas generation. Most
stratigraphic sections exhibit a maximum in the bitumen content at a depth of
2–6 km. Also shown are maxima for the gas content and associated condensate
content. This depth interval corresponds to the mesocatagenetic stage. Almost all
schemes show a clear bitumen maxima at the mesocatagenetic stage, but the max-
imum’s boundary shifts somewhat from one scheme to the next, and not all of the
schemes include the upper gas peak. The evolution of the ‘‘main phase’’ concept
moved the studies of oil and gas source rocks forward. Their geochemical para-
meters, depositional environments, and temperature intervals (60–130 1C) have been
established in many parts of the world. Yet, some unanswered questions still remain.
Fig. 7.5. Conceptual diagrams of zonation of oil/gas generation in stratigraphic section (by Eremenko and
Tverdova, 1980, modified after Sokolov, 1965; Tissot, 1971; Kulbitskiy, 1973; Alekseyev, 1973;
Vassoyevich, 1975; Kontrovich and Trofimuk, 1976; Weber, 1978). Intensity of oil and gas generation: 1
– oil and bitumoids; 2, 3 – hydrocarbon gases: 2 – CH4 3 – C2H6-C5H12; 4 – hypothetical distribution of
resources when exploration has reached a depth of 1–3km. I – Diagenetic zone of intense gas generation
and gas-hydrates accumulation; II – upper zone of intense gas generation and accumulation; III – deep zone
of intense gas generation and accumulation; IV – main zone of oil generation. y Letters in parentheses in
this column denote the corresponding rank of coal. (In: Eremenko and Chilingarian, 1991, p. 536.)
DISPERSED ORGANIC MATTER128

Regardless of the age of rocks (therefore, the duration of geochemical processes),
all sedimentary basins of the world exhibit the bituminosity peak, which determines
the ‘‘main phase’’ of oil and gas generation (i.e., oil and gas windows), at about the
same depth. Why is that? It was found that the depth may change depending on the
heat flow. Some regions display a compressed, and some others, stretched geother-
mal zonation (changes in the geothermal gradient). This clarification, however, does
not answer the question.
Why is it that in different regions, regardless of the age of rocks, there is only one
‘‘main phase’’ of oil generation, occurring at present time (present-day sample col-
lection and analyses)?
Based on the restoration of depositional and geochemical processes, there must
have been several such phases in various basins. The present-day geochemical and
thermodynamic status of sedimentary basins is usually not unique and does not
contradict the appearance in the times past of similar geochemical and thermody-
namic environments. Lastly, why is it that the theory of the ‘‘main phase’’ considers
the heat flow as the only energy source? Are not there other energy sources in the
Earth crust?
In an attempt to evade all these questions, alternative concepts have been de-
veloped. One example is a concept of the oil and gas generation cycles. The entire
process of generation, existence of oil, and destruction of these accumulations was
called an oil- and gas-generation cycle (Maksimov et al., 1972). This concept is
discussed in the chapter devoted to the hydrocarbon generation.
The bitumen extracted from the samples of different ages reflects the depositional
environment of organic matter, diagenetic and catagenetic alterations, and the ex-
pulsion of most volatile-substances from it. The theory of the ‘‘main phase’’ stresses
the transformations during diagenesis and catagenesis. At the same time, the initial
conditions (the depositional environment) and the final conditions (the expulsion of
volatile substances) remain in the background.
If one accepts the alternative view of oil- and gas-generation cycles and its treat-
ment of the process as continuous, but varying in intensity, most of the above ques-
tions can be answered. Currently observed bitumen maxima may not reflect the ‘‘main
phase’’ but may reflect any other phase, and the main phase must be established for
each particular area. As stated before, temperatures in excess of 100 1C are most
favorable for the hydrocarbon desorption. Therefore, the hydrocarbons generated
within the corresponding rock intervals are easily removed. This is supported by the
coinciding minimum on Akramkhodzhayev’s (1973) curves reflecting the recovery of
additional hydrocarbons from the previously extracted rock samples. Neruchev and
Eremenko (1968) suggested a great role of the expulsion processes in such a situation.
7.3. COMBINED STUDIES OF SOLUBLE AND INSOLUBLE PORTIONS OF ORGANIC
MATTER
Determination of soluble (bitumen) and insoluble (kerogen) portions of the dis-
persed organic matter is necessary for its complete characterization. Chemical and
STUDIES OF SOLUBLE AND INSOLUBLE PORTIONS OF ORGANIC MATTER 129

physical techniques for studying the dispersed organic matter are complex or require
expensive, sophisticated equipment.
A technique that became very common over the last 10 to 15 years is a pyrolysis
technique introduced by Espitalie and others in 1971, which is called RockEval. It is
based on heating the kerogen sample to 550 1C, following a predetermined heating
program. The first peak (S1) of the curve corresponds to the free and adsorbed
hydrocarbons evaporated at a moderate heating to 200 1C–250 1C. The second peak
(S2) reflects hydrocarbons and other similar components generated at a higher tem-
perature due to pyrolysis of the insoluble portion of kerogen. Finally, the third peak
(S3) reflects CO2 and water.
Tissot and Welte (1981, p. 413) suggested that the value of S1 represents the
fraction of initial genetic potential that has been transformed into hydrocarbons.
The S2 value is the residual potential. The total S1+S2 (usually expressed in kg/ton)
indicates the total genetic potential. When S1+S2 is less than 2 kg/t, the rock is not
considered to be a source rock, whereas when S1+S2 is equal 2 to 6 kg/t, the rock is
considered to be a source rock with a moderate hydrocarbon generating potential. If
S1+S2 is greater than 6 kg/t, the rock has a high hydrocarbon generating potential.
A kerogen type is determined by two characteristic parameters: (a) the hydrogen
index (S2/Corg) and (b) the oxygen index (S3/Corg). There is a good correlation
between the hydrogen index and the H/Corg atomic ratio, as well as between the
oxygen index and the O/Corg atomic ratio.
It is recommended to use the ratio [S1/(S1+S2)] (transformation index) and
the temperature for determination of the organic matter maturity. It was found
that the transformation index does not depend on the type of organic matter. On
the other hand, the type of kerogen depends on the temperature, especially during
diagenesis and early catagenesis. Tissot and Welte (1981) stated that the temper-
ature is lower for the continental kerogen (type III) and higher for the marine or
lacustrine kerogen (type I and type II). Yet, the temperature is almost the same for
different kerogen types in the maximum oil generation zone and later in the gas
generation zone.
To characterize the components of S2 peak, gas-chromatography is utilized. It was
found that the source of chemofossils (long-chained normal alkanes) in the kerogen
of modern deposits is higher plants. Modern deposits are dominated by the mol-
ecules with odd numbers of carbon atoms. With depth, new alkanes with shorter
carbon chains are generated, and the odd/even ratio inequality levels off.
It was proposed to use the ratio [odd n-alkanes/even n-alkanes] or [odd n-alkanes/
(even n-alkanes+odd n-alkanes)] to characterize the degree of kerogen transforma-
tion or its maturity. The limitation here is the dependence of these parameters on the
kerogen type and the transformation conditions.
Another frequently used parameter is the isoprenoid distribution. It was shown
that the pristane/phytane ratio changes in the process of the thermal evolution of
coals. This ratio, therefore, can be used to characterize the Type III kerogen. This
has not been proved, however, for the kerogen of Types I and II.
Trofimuk et al. (1982) opposed the use of the above-mentioned parameters for the
identification of source rocks and determination of their potential. Trofimuk et al.
DISPERSED ORGANIC MATTER130

stated that S1 and, hence, the bitumen represent just a remnant preserved in rocks
after the hydrocarbon expulsion. This remnant may be continuously replenished to a
certain extent due to the continuity of processes. The degree of replenishment de-
pends on many factors including the composition of the original organic matter. The
type and the speed of reactions depend on the extent of coalification of the original
organic matter. As Neruchev et al. (1986) indicated, most stable components must
gradually accumulate in the organic matter.
Thus, the genetic potential (S1+S2) and the transformation coefficient are also in
doubt. Taking into account what was mentioned about the S1, the genetic potential
is incomplete, because a substantial (maybe even major) fraction of the chemically
active organic matter is not considered.
At the same time, S2 includes some components that cannot be converted into
hydrocarbons in the natural environments (and, probably to a large extent, in the
laboratory) and, therefore, cannot affect the hydrocarbon reserves. Hence it is quite
risky to associate this ‘‘potential’’ with actual hydrocarbon resource potential. The
same applies to the transformation index [S1/(S1+S2)], which probably cannot in-
dicate the degree of transformation of organic matter. Rather, it is just an indication
on the incompleteness of the processes of organic matter transformation.
It is important to determine whether the particular bitumen is autochtonous
or allochtonous. Comparisons have been made of the hydrocarbons in the crude oils
(in the reservoirs) and in the rocks. The former are enriched in the saturated hy-
drocarbons, moderately enriched in aromatics, and strongly impoverished in polar
(N, S, O) components.
Using thin sections, Larskaya (1983, p. 200) made an attempt to combine pet-
rographic and chemical parameters for a more reliable identification and description
of source rocks. Carbon isotopes were also used in studying bitumens and kerogen.
The bitumens are enriched in d13C by 2–3% compared with the kerogen. The crude
oil has the same carbon isotope composition or is slightly lighter (by 1–2%) than the
genetically associated bitumen.
Akramkhodzhayev et al. (1978) introduced a technique for determining whether
bitumen is autochtonous by comparing its carbon composition with that of the
bitumen extracted by heating kerogen.
Attempts have been made to evaluate the amount of hydrocarbon generation
from the changes in [S1=ðS1 þ S2Þ] ratio with depth. The formation of accumulations
must correspond to the abnormally high values of this ratio against the background
of an average curve. Such evaluations, however, did not gain any substantial rec-
ognition due to their inaccuracy.
Uspenskiy (1970) proposed to determine the amount of generated hydrocarbons
(oil source potential) from the elementary composition of kerogen. It is possible to
determine the composition of the initial and final kerogen using the kerogen from
the same formation obtained from different depths (corresponding to various
catagenetic stages). It is also possible to determine the losses of elements during the
formation of hydrocarbons and their removal due to heating (in the form of com-
pounds such as CO, CO2, H2O, CH4, and H2S). Thus, according to Uspenskiy, one
can calculate the amount of released hydrocarbons.
STUDIES OF SOLUBLE AND INSOLUBLE PORTIONS OF ORGANIC MATTER 131

The concept proposed by Uspenskiy, however, is questionable. He equated the
amount of volatile coalification products (that form when the dispersed organic
matter matures from one catagenetic stage to the next) with the difference in the
amount of volatiles per combustible mass in the technical analysis of coal. It was
found, however, that the adjacent points in the same rock sample may have a sub-
stantially different elemental composition. Consequently, the elemental analysis re-
sults for two samples collected at different depths within the same formation may
lead to totally different conclusions. This is due to non-uniform composition of the
accumulated organic matter (in terms of the number, composition and even the size
of particles) and the non-uniformity of the effect of geochemical factors that result in
different degrees of transformation of organic matter at different locations within the
rock. The organic matter itself also affects the geochemical environment. Thus,
determination of the true degree of transformation and the amount of released
hydrocarbons is a complicated problem. This pertains to all types of point (local)
determinations in rocks.
The above-presented concepts and parameters are commonly used for the iden-
tification of source rocks, determination of the degree of their maturity, and esti-
mating the amount of hydrocarbons formed during lithification. The ideas of
Potonie (1920) and Uspenskiy (1970) are still commonly accepted, and the sapropelic
organic matter is a preferred source for oil generation.
In their experiments, Rohrback et al. (1984) used deltaic (humic) and algal-
lagoonal (sapropelic) oozes and heated samples from 35 1C to 550 1C for 1 h to 625
days. The time and the composition of the input material affected the products.
Three stages have been identified:
1. Immature: C1 through C5+ hydrocarbons are released; C15+ hydrocarbons are
absent.
2. Mature: The bulk of the C15+ is released. The released CH4 is isotopically lighter
than in the input material.
3. Overmature: The amount of released C2–C5 hydrocarbons increases again. The
CH4 formed is isotopically heavier than in the input material.
Simultaneously, the Ro changed from 0.2 to 3%. Liquid hydrocarbons begin to
form at Ro ¼ 0:25%, maximum is reached at Ro ¼ 0:5% in the humic organic matter
and at 0.7%, in the sapropelic organic matter. Liquid hydrocarbons are formed
faster in the humic ooze. Tissot and Welte (1981, p. 421) also recorded a faster and
more complete formation of liquid hydrocarbons from the humic matter.
It is important to note sudden change in the carbon isotopic composition of
methane at Stage 2. A similarity may be observed here with the bacterial sulfate
reduction experiments by V. Mekhtiyeva (personal communication, 1994). In these
experiments, first the isotopically heavy H2S was formed, which became heavier
upon further experimentation. This phenomenon, however, was only observed in a
closed environment. When the new batches of the input material were supplied, the
increase in isotope composition of sulfur in H2S stopped.
Of course this comparison is tentative, because in one case the reactions were
chemical, whereas in the other, they were biochemical. Still, the concept arises that
the carbon in methane in natural environments does not have to become isotopically
DISPERSED ORGANIC MATTER132

heavier: the amount of initial matter in the experiments by Rohrback et al. (1984)
was limited by the size of the sample, whereas it does not have to be limited in
nature. In other words, when the amount of initial matter is sufficient, during the
formation of products (CH4 and H2S in these cases), the bonds with the matter are
severed first for the light isotopes, and only then for the heavier ones.
In the initial rock–water–organic matter system, the last link (OM) is highly
sensitive to the changes during diagenesis and subsequent catagenesis (epigenesis).
The direction of processes transforming the organic matter during diagenesis and
catagenesis and the resulting products are clear. Obviously, the most stable com-
ponents accumulate. It may be suggested that this link (OM) loses energy (increase in
entropy) during diagenesis and catagenesis. However, the organic matter transfor-
mation processes and their effect on the energy status of the entire system is not
clear. The potential role of the spontaneous reactions upon overcoming the energy
threshold is also not clear. The studies that have been initiated in the effects of
sources other than heat energy on the organic matter transformation are discussed
later in this book.
STUDIES OF SOLUBLE AND INSOLUBLE PORTIONS OF ORGANIC MATTER 133

This page intentionally left blank
134
Chapter 8
ORIGIN OF OIL AND NATURAL GAS
8.1. INITIAL ORGANIC MATTER AND ITS TRANSFORMATION
The studies of origin of oil always concentrated on the determination of organic
matter and establishing processes of its transformation. Discussions in the preceding
chapters clearly point to the organic origin of all discovered oil and gas accumu-
lations. Especially significant is Chapter 5 on the oil composition. Chemofossils are
present not only in oil but also in coal, oil shale, and bitumen, i.e., biomarkers of
organic compounds that preserve the structure of transitional bioorganic molecules.
More than 300 such hydrocarbons are described in crude oils. About the same
number of biomarkers were discovered in the sulfur- and oxygen-containing com-
pounds. Quite often, more than half of the crude oil is represented by biomarkers
that are, therefore, not an admixture but an integral constituent of oils.
The main concepts of the organic theory of oil generation [e.g., Mikhailovskiy,
1906; (in: Eremenko and Chilingar, 1996); Arkhangelskiy, 1954; Gubkin, 1915, 1932]
are simple. Organic matter is accumulated (mostly in a dispersed state) in predom-
inantly clayey marine deposits. There are two major types of organic matter: humic
and sapropelic. It was believed that the latter played a major role in oil generation,
whereas the decomposition of humic organic matter resulted in the formation of coal
and water-soluble (hence, easily dispersible) substances and gas.
The decomposition of sapropelic matter gives rise to the liquid and gaseous
compounds including hydrocarbons. The decomposition occurs as a result of heat
flow and the energy of the sun accumulated by the organic matter. The hydrocarbons
and some other substances formed from the decomposed organic matter are
squeezed together with water out of the shales into the reservoir rocks. The hydro-
carbons derived from the organic matter float in the water medium (gravitational
theory) and move until trapped in the reservoir.
Marine origin of oil source rocks appeared to be obvious, although it is unclear
why the first oil-bearing sequences developed in different countries were continental
or near-shore marine Paleogene and Neogene rocks. The studies of the present-day
sedimentation indicated that all marine and almost all continental deposits contain
organic matter. It was eventually recognized that only the presence of subaquatic
sediments, either of marine or continental origin, was required.
Potonie (1920) indicated that there were three ways for organic matter to ‘‘burn’’
in nature: combustion, smoldering, and rotting. The latter process was believed
(Mikhailovskiy, 1906; Potonie, 1920; Gubkin, 1932; Strakhov, 1960) to be respon-
sible for the organic matter formation in nature. This is an important issue for at
least two reasons: rotting occurs without the supply of oxygen; from the outset, the
process is believed to be isothermal.
135

Strakhov (1960) stressed the need for strongly reducing hydrogen sulfide geo-
chemical facies. As a result of his idea, pyritized sequences have been included
among the source rocks. Later, Strakhov changed his mind.
The quantitative presence of organic matter in rocks was reviewed first by Trask
and White (1915, in: Eremenko and Chilingar, 1996, p. 153). According to Arkh-
angelskiy (1954), sediments may be classified as source rocks if they contain organic
matter at least 2% or 43 kg/m3. The absolute amount of organic matter buried in
various genetic types of sediments depends on many factors, but mainly on the
biological productivity of source organisms and by the facies environment during
burial. Relative organic matter concentration also depends on the depositional
speed. For example, due to a very slow rate of deposition, organic matter content in
the Central Polar Basin reaches 1%. Generally, organic matter concentration in
sediments widely ranges between trace amounts and 100% (in peat).
Trofimuk et al. (1980, 1982) believed that the content of a dispersed organic
matter in source rocks may be even lower, because part of it had been spent to
generate oil and gas that have been expelled. Some other investigators believe that
less than 1% of organic matter is converted into oil; thus, the expulsion loss could
not significantly affect the residual carbon distribution in sediments.
Many scientists (e.g., Kontorovich et al., 1975; Nazarkin, 1994; Bordovskiy, 1974)
recognize the effect of depositional rate on the qualitative and quantitative outcome
of the organic matter transformation. First, the relative increase in the organic
matter concentration is observed. Then, the rate reaches 50–200 tons/km2/year and
the depositional rate decreases due to the organic matter dilution by minerals
(Nazarkin, 1994). Rieke and Chilingarian (1974) found that, with other conditions
being equal, the value and duration of AHFP also directly correlates with the de-
positional rate. The depositional rate in most known oil and gas basins is between
150 and 1000 tons/km2/year.
The major geologic factor in transforming organic matter into bitumen is the
compaction of rocks under the overburden pressure. Brod and Eremenko (1950)
stated that the oil and gas generation process is lengthy and continuous: ‘‘y Hy-
drocarbon compounds arise as a result of competition between two opposite trends:
when subsidence prevails over uplift, during small as well as large oscillations of a
given Earth’s crust area.’’
Oscillations of the Earth’s crust are the cause of relationships among the depos-
itional processes, rock formation, and structural development. Sedimentation is re-
sponsible for the accumulation of organic matter in deposits. Lithification is
responsible for the organic matter transformation, whereas the structural develop-
ment (tectonic activity) is responsible for the formation of combustible fossil fuel
accumulations, their metamorphism, and destruction.
‘‘Oil and gas generation is, therefore, an unalienable part of the Earth’s crust
evolution and involves dynamic processes. It is not just a simple mechanical
displacement but consists mainly of complex transformations. These transforma-
tions consist of biologic, geochemical, physicochemical, and other changes. They
manifest themselves jointly, but play different roles at different stages of oil and
gas generation’’.
ORIGIN OF OIL AND NATURAL GAS136
On the basis of laboratory studies, Zhuze (1957, in: Eremenko and Chilingar, 1996,
p. 154) developed a concept of clay-mineral transformation from montmorillonite to
kaolinite during rock compaction. He questioned the limitations imposed on the role
of clay minerals, as just catalysts in the transformations of organic matter. This
concept, in turn, has been questioned by Klubova (1973), who believed that such a
process could not proceed in nature due to insufficient supply of potassium in rocks.
A number of authors recorded the clay-mineral alterations during catagenesis. As an
example, Nazarevich et al. (1985) described montmorillonite alterations during meso-
catagenetic (MC) stage and cessation of this process upon reaching the MC4 substage.
Brilling (1984, in Eremenko and Chilingar, 1996, p. 154) noticed that in the process of
alterations, the particles (sheets) change their orientation, which results in locking-up or
opening of pores; hence, the filtration in clays acquires a random, unstable nature.
The following questions arise in studying the oil generation in source rocks
(mostly shales):
1. What is the nature of source rocks and where and how are they distributed in
sedimentary basins?
2. What is the physical state of hydrocarbons in source rocks?
3. What forces (and at what stage) cause them to move to the reservoir rocks
(primary migration/expulsion)?
4. When and how do hydrocarbons move within the reservoir rocks to form oil and
gas accumulations?
5. What is the relation between (a) the oil and gas composition in the accumulations
and (b) the environment of hydrocarbon generation and of formation of accu-
mulations?
Vassoyevich (1976) introduced the term ‘‘microoil’’: The origin of oil begins with
the living matter where the biochemical compounds are born that initiate formation
of petroleum hydrocarbons or, to a smaller extent, where these hydrocarbons are
born. Upon deposition at the bottom of a basin, and partially forming in the se-
diments due to the activity of organisms, these hydrocarbons and prehydrocarbons
form a young microoil.
Although Brod (1957) did not accept the term microoil, his views were similar to
those of Vassoyevich. According to Brod, while building their bodies, cellular mem-
branes and other cellular structural elements, plant and animal cells and, especially,
some bacteria synthesize hydrocarbons. After death of the organisms and inclusion
of their remains in the depositional cycle, the hydrocarbons contained in them may
be decomposed by the microbial activity. The relative rate of hydrocarbon decom-
position is lower than that of the other organic compounds. Thus, under favorable
conditions some hydrocarbons may accumulate.
Quoting Uspenskiy (1970), Vassoyevich stated that the components of oil were
not born all at once. In his view, it would be better to discuss not the source but the
hydrocarbon generation stages that would correspond to the stages of lithogenesis.
Brod (1957) also mentioned that hydrocarbon compounds dispersed in rocks do not
constitute crude oil. Various organic compounds formed from the moment of initial
deposition, whereas mixtures of liquid hydrocarbons (i.e., crude oils) apparently
formed during the formation of accumulations in reservoirs.
INITIAL ORGANIC MATTER AND ITS TRANSFORMATION 137

According to Brod, various components of oil could have formed at different
stages of organic matter transformation and at different lithogenetic stages. Thus, a
complex chemical system called crude oil formed within reservoirs in the process of
the formation of accumulation. That is why Brod could not accept the term microoil:
in his view, hydrocarbons and non-hydrocarbon organic compounds dispersed in
rocks are not macro- or microoil.
It appears that Vassoyevich (1976) was correct in concluding that integrated ge-
ological and geochemical studies of the modern and ancient sediments provide ev-
ergrowing body of data, which indicates that each stage of lithogenesis is
accompanied by its own characteristic hydrocarbon generation. It should also
be remembered that the parent organic matter is also changing simultaneously
(Maksimov et al., 1977).
The Vassoyevich’s concept of a relation between the hydrocarbon generation and
catagenetic stages was broadened into the doctrine of oil and gas generation cycles
(Eremenko et al., 1949, 1978; Maksimov et al., 1972, 1976). As discussed later, the
‘‘stagewise’’ and ‘‘cyclic’’ nature do not have the same meaning. In discussing the
organic matter transformation into crude oil, it is necessary to consider the trans-
formation factors.
The major error implicit in most hydrocarbons-to-crude oil transformation con-
cepts is the attribution of an exclusive role to a single factor. This will result in the
detachment from the natural environment where all these factors are operative and
intertwined. The transposition of laboratory experiments onto the natural environ-
ment, without a full account for its multifaceted character, always results in errors.
Besides, an active energy influence on the source organic matter is attributed to each
factor. At the same time, no serious consideration was given until recently to the
energy facet of the issue, although it is only natural that organic matter in itself has
the sufficiently high reserves of energy for the subsequent transformations.
It was suggested that the living matter accumulate the sun energy, which is sub-
sequently transferred to the organic matter. It appears that this is not accurate. The
heat of the Earth itself should not be forgotten. All geologically ‘‘live’’ planets,
including the Earth, release much more heat than they receive from the Sun. The
processes of life cannot ignore that energy source. One confirmation of the above is
the presence of life at great depth in the oceans, where the sunlight does not reach.
No doubt, the energy stored in the living organisms or in organic matter is much
greater than that in the oil or coal. The processes of transformation of matter with
loss of energy are very common in the Earth’s crust.
8.2. STAGEWISE NATURE AND CYCLIC TRANSFORMATION OF ORGANIC MATTER
The issue of stagewise transformation of organic matter was analyzed by many.
As the energy is concerned, there is no significant disagreement in the identification
of the organic matter transformation stages. There is some disagreement regarding
the stage boundaries (especially in the case of temperature), but this, in our opinion,
is of minor importance.
ORIGIN OF OIL AND NATURAL GAS138
The processes of oil and gas generation can be subdivided into four stages. During
the first two stages, the organic matter exhibited energy change from the higher forms
(biological and chemical energy) to the lower forms (heat and mechanical energy).
The initial organic matter for the oil generation was in a dispersed state. Its further
migration and the formation of accumulations represent the energy concentration
from the dispersed organic matter, which cannot occur due to its own internal energy.
If the first two stages of oil and gas generation may have occurred as a result of
mobilization of the internal energy, then the third stage required an external energy.
The source of this energy lies in geological processes (tectonic movements). Thus, the
third stage must be associated with (1) significant restructuring of the oil and gas
basins, (2) disruption of equilibrium in these basins, and (3) emergence of forces
causing changes in the potential energy of fluids that appeared within reservoirs by
that time. In such a case, the process of formation of accumulations may be taken as
a process accompanying the energy equalization in beds, in a general direction of the
process toward attainment of the surface of World Ocean (assumed zero level of the
potential energy of fluids).
The stagewise nature of the organic matter transformation cannot be compared
with the cyclicity of the oil and gas generation process any more than a ‘‘part’’ that
can be compared to the ‘‘whole’’: one is part of the other. The stages of the organic
matter transformation can be compared with the catagenetic cycles identified by
Vassoyevich (1975).
Vassoyevich used the coal ‘‘metamorphism’’ in Donyets Basin of Ukraine for his
classification of the oil-generating processes. Initially, the main generation phase was
placed between 801C and 1501C. Later, the temperature ranges have been modified.
Vassoyevich stated that the main stage (main phase) of the oil and gas generation
occurs as the source rocks reach the mesocatagenesis zone (minimum temperature of
601C). Generation of new hydrocarbons is significantly increased (including, for the
first time, low-molecular-weight hydrocarbons). The mesocatagenesis usually occurs
at a depth between 2.7 and 8 km and at a temperature between 2101C and 2801C
(Vassoyevich, 1975).
It is interesting to note that the depth/temperature of the mesocatagenetic zone
corresponding to the hydrocarbon window (main phase) does not coincide with the
zone of oil reserves encountered at a depth of 1–2 km. The gap is between 0.7 and
7 km. The thickness of some oil- and gas-producing formations does not exceed
300m. Thus, the proponents of the main phase would have to take position of the
mandatory vertical migration for the formation of hydrocarbon accumulations. The
writers do not rule out the possibility of formation of oil accumulations due to a
distant vertical migration, but believe, however, that the vertical migration usually is
limited to the oil- and gas-producing formation.
The writers agree with Vassoyevich (1975) that of primary interest to the petro-
leum geologists are depositional cycles, because the sedimentogenesis, i.e., birth
(genesis) of the sediment, is a crucial stage of lithogenesis. During sedimentogenesis,
sediment may become a source rock, good or poor reservoir, or a seal. Changes
during the diagenesis, catagenesis, methagenesis, and hypergenesis greatly depend on
the initial type of the deposit.
STAGEWISE NATURE AND CYCLIC TRANSFORMATION OF ORGANIC MATTER 139

If the organic matter transformation stages are associated with, or may be related
to, the lithogenetic stages, then the oil and gas accumulation must be associated with
the geotectonic evolution of large regions of the Earth with sedimentary cycles.
The transformation process of a given organic matter within a given lithological
sequence is irreversible. The cyclic nature of the oil and gas generation process
implies the repetitiveness, or its possibility, of the oil and gas generation for a given
region of the Earth’s crust, but for different lithological (sedimentary) sequences.
The concept of the main phase (oil window) is widely accepted. Evaluation of the
hydrocarbon potential of a basin, and the timing of hydrocarbon generation and
formation of accumulations were determined based on this concept. Lopatin (1971)
proposed to use a simplified form of the Arrhenius law,13 according to which the rate
of chemical reactions doubles when temperature increases by 101C.
The oil window concept is continuously evolving and improving, especially with
regard to the calculations of oil and gas source potential based on the elemental
composition. The main task is to develop a model of the dispersed organic matter
transformation that would realistically reflect the natural processes and balance the
mass of the original dispersed organic matter with the residual dispersed organic
matter and all gas, liquid, and solid generation products. In 1982, Neruchev and
Rogozina stated that such a model does not exist. Later, however, it was stated
(Neruchev and Rogozina, 1992) that such a model has been developed. In such a
model, however, one should consider the scatter of the elemental composition data,
even within a single sample. Thus, it would be easy to stack the analyses and show a
negative course for the catagenesis.
As Kontorovich (1991) indicated, the depositional rate and the heat flow change
in time depending on the processes occurring at depth. As a result, the rate of
hydrocarbon generation in oil and gas basins and the total mass of hydrocarbons
generated per unit of time sporadically change with time. Due to this, even within the
twin basins one may find somewhat different oil and gas areas and non-identical sets
of largest hydrocarbon accumulations. Besides, the transposition of coal thermolysis
laboratory experiments onto the dispersed organic matter in the natural environment
is quite tentative (Uspenskiy, 1970).
The above-presented ideas are similar to those mentioned before on the stress-
energy state of the sediment cover (and of the source rocks in particular). Such a
system tends to reach an equilibrium. Leveling of the energy non-uniformity occurs
by way of the energy redistribution within the system (source rocks) and its transfer
(together with fluids) into the adjacent beds with a lower potential energy. This
process is unavoidably accompanied by other plastic and fracture (hydrofracturing)
deformations.
In the case of a natural hydraulic fracture, the pressures are applied within the bed;
with all other conditions being equal, only the bed resistance to extension must be
overcome. Zheltov and Christianovich (1956, in: Eremenko and Chilingar, 1996, p. 159)
13Arrhenius’s rate equation provides the rate R of a thermally activated process: R ¼ R0 expðEa=ksTÞ,
where R0 ¼ a constant, Ea ¼ the activation energy, k ¼ the Boltzmann constant, and T ¼ the absolute
temperature.
ORIGIN OF OIL AND NATURAL GAS140

found such stress to be between 0.5 and 1.5MPa. At the same time, only because of
organic matter transformation in the adjacent zones, pressure gradient of several to
several tens of MPa may form in the source rocks. Thus, migration paths form non-
uniformly within the formation. Energy redistribution in the rock-water-organic matter
system occurs as a result of internal and external energy sources, within each limited bed
volume containing organic matter. High-energy saturated compounds, which formed
within the system, will most likely move, according to the laws of film migration,
toward the areas with a lower energy or into the adjacent reservoirs.
8.3. ROLE OF ENERGY IN THE OIL GENERATION PROCESS
The major stimulus for the evolution of process of oil generation is the internal
energy of the organic matter. The other factors serve as peculiar catalysts that
initiate the process, affect its speed, or influence the nature of the final products.
There is a major disagreement among petroleum geologists regarding the role of
internal energy in the course of organic matter-to-oil transformation processes.
Nesterov et al. (1992) studied the thermodynamic aspects of organic matter
transformation. Some petroleum geologists believe that a vertical or lateral move-
ment of the heated fluids (heat-mass transfer) may explain the appearance of heat
anomalies. They do not rule out the possibility of heating some sequences (or zones)
due to exothermal effect resulting from: (1) gas generation within the high-temper-
ature thermal-catalytic zone; (2) exothermal reaction of hydrocarbon generation
from the dispersed organic matter; and (3) specific hydration conditions by the
donor hydrogen in the course of radical thermal decomposition reactions. A problem
arises of how to determine the level of heat effect of oil generation and the role of
catagenetic transformation of organic matter in the presence of heat anomalies.
A thermodynamic solution of individual equations is insufficient due to the com-
plexity of geological system. Studies of the thermal dissociation of organic matter
showed that the endothermal reactions are usually dominant. Various factors de-
termine the expenditure of heat energy needed for kerogen decomposition. They
include the (1) number and type of broken chemical bonds, (2) formation of different
(based on mass) stable paramagnetic centers (PMC) and free radicals (FR), and (3)
desorption of volatile reaction products.
With increasing temperature, the weakest bridge bonds in kerogen are broken.
This results in loosening of the fragmental structure, redistribution of the electron
density, and an increase in the PMC concentration. The energy necessary for break-
ing the bonds ranges from 20–40 kcal/mol. As the temperature increases above
3501C, the number of stronger bonds broken (C–C, C–H and C–OH bonds) in-
creases. A breaking thermal dissociation above 450 to 5501C (at Ea ¼ 60–80 kcal/
mol) results in breaking of most alkide bonds (C–H, H–H). When the expended
energy is above 150 kcal/mol, the structure of the source organic matter is totally
destroyed. Heat release (exothermal reactions) occurs only on the condition of hy-
dration by hydrogen, formation of molecules through the recombination of FR,
polycondensation of unsaturated bonds, etc.
ROLE OF ENERGY IN THE OIL GENERATION PROCESS 141

Two options have been discussed by Nesterov et al. (1992). The first option
involved a continuous removal of reaction products from the reaction zone. This
enabled to model the generation and simultaneous expulsion of the volatile products
of decomposition. This thermal destruction model was referred to as a ‘‘tentatively
open’’ system. The second option involved heating the kerogen at the same rate of
temperature increase, but within vacuumed and then sealed quartz tubes. This op-
tion (‘‘closed system’’) involved the thermal destruction at a constant volume, with-
out the release of reaction products and with an increasing pressure, analogous to
the conditions of sealed pores or accumulations.
The study indicated that the thermal destruction of the kerogen and coaly in-
clusions with increasing temperature within a ‘‘tentatively open’’ system, regardless
of the type of the source organic matter, requires an input of thermal energy.
Continuous thermal alteration of kerogen under the ‘‘tentatively open’’ model,
with the continuous removal of reaction products, requires an input of thermal
energy. Thermal energy input for the decomposition of organic matter and for
the formation of products of the process occurs in the form of individual impulses
(endo-effects) associated with certain temperature intervals. Energy release due to
secondary recombination and molecule neoformation reactions (at the expense of
redistribution of hydrogen) is insignificant and does not compensate for the over-
whelming energy intake during the kerogen decomposition.
The thermal transformation of the organic matter and the catagenetic boundaries
of heat parameters coincide with the hydrocarbon generation phases. Thus, it is
likely that the hydrocarbon generation process in the source rocks increases to a
certain thermal boundary (to MC4–MC5 stages), above which the thermodynamic
kerogen decomposition occurs at a lower level of heat expenditures.
The writers suggests the following conclusion about the speed of thermal effect on
the source rocks. If the oil generating sequence subsides into the heating zone slowly
enough, then the thermal decomposition process required to reach the oil window
will occur at a lower level of activation energy (up to 40 kcal/mol), and at a heat
expenditure of 120 kcal/kg of kerogen.
Neruchev et al. (1992) also observed thermodynamic alterations in the process of
organic matter transformation. According to their experiments, as the depth and
temperature increase in the catagenetic zone, the complex structural transformation
of organic matter is accompanied by several alternating maxima and minima of heat
release that causes this transformation. The maxima are mostly associated with the
stages of intense transformation of organic matter molecules and the generation of
substantial volumes of volatile products. The minima (endothermic zones) mainly
correlate with the reshaping and stabilization of the structure of organic matter with
a small amount of generated volatile substances. As the depth and temperature
increases, the scale of heat released from the organic matter transformation de-
creases. The process progresses toward endothermic reactions, which is in compli-
ance with general principles of thermodynamics. Usually, exothermal reactions
occur at relatively low temperatures. As the temperature increases, the process shifts
toward endothermic reactions.
ORIGIN OF OIL AND NATURAL GAS142

As mentioned before, the rate of heating of organic matter must affect substan-
tially the yield and composition of the generated product. According to Urov (1992,
p. 126), at a low rate of heating the mobile hydrogen atoms from the cyclic areas of
kerogen have enough time to migrate to the periphery of micromolecules. The sep-
aration and transfer of hydrogen occurs; aliphatic side chains detach mostly as
saturated compounds, and the solid residue gradually loses hydrogen and is car-
bonized. Price et al. (1986) also mentioned that a hydrogen-rich organic matter
(sapropelic) requires higher temperatures for transformation.
The potential energy of oil and gas is the transformed solar energy buried with
organic matter. The accumulation and sometimes the release of potential energy is a
thermodynamically viable process for the entire Earth’s crust and, in particular, for
the sedimentary rocks. An example is the formation of argillaceous sequences (ac-
cumulation of the surface potential energy) and their subsequent transformation
with a loss of energy.
The energy of organic matter (buried solar energy) is insufficient for its trans-
formation into oil and gas. Thus, an input of additional energy is required to initiate
(and accelerate) chemical reactions. The input of additional energy could be the heat
of the Earth.
If the internal energy of organic matter is insufficient for the generation of oil and
gas, and the additional energy is required, then the 100-year-old controversy of the
organic vs. inorganic origins of petroleum becomes meaningless. The discussions on
this subject are fruitless (Zhabrev, 1993). Even the most common orthodox version
of the organic hypothesis by Vassoyevich (1975, 1976, 1979) with the ‘‘main phase’’
(heat of the Earth) appears to be dualistic. The fraction of inorganic hydrocarbons in
the Earth’s crust at this time, optimistically, is no more than a few percent, and most
likely just a few tens of 1% (Zhabrev, 1993, p. 12). Thus, the following two questions
arise:
1. What processes provide for the accumulation of potential chemical energy and
what traces of these processes can be identified in the oil?
2. What energy sources may have been utilized, and which ones are most likely?
Undoubtedly, the endogenic heat has been among the major energy sources.
However, many exothermal processes occur in the lithosphere, and their energy may
have been utilized to transform (and to move) organic matter and its derivatives.
Mostly, the heat field, which is one of many energy fields of the Earth, has been
studied with respect to its association with the oil and gas generation cycles. The
electromagnetic field is poorly studied in this respect. There are reasons to believe
that the electromagnetic forces directly affect chemical reactions and lower the ac-
tivation thresholds. They certainly affect the migration of petroleum. These forces
should be additionally studied based on the concepts of (1) the Earth as a capacitor
with the minus in the crust and the plus in the ionosphere; (2) the Earth as an electric
power generator (rotation of a conductor in the magnetic field).
Here, the writers would like to mention the term ‘‘electrodiagenesis’’ introduced
by Serruya et al. (1967). Movement of fluid (due to compaction of sediments, for
example) generates potential gradients, which in turn may affect the diagenetic
ROLE OF ENERGY IN THE OIL GENERATION PROCESS 143

processes. Electrical currents cause interstitial solutions to flow through practically
impervious muds (from positive to negative ‘‘electrode’’).
What are the possible effects of electric currents on the oil generation from or-
ganic matter? This question should be answered first by the experimental work in the
laboratory.
The Earth’s radioactive field is being carefully studied, especially during the recent
decades. The formation of hydrocarbons and other compounds from organic matter
as a result of radioactivity is established. A connection between radioactivity and oil
fields (and bituminous sequences, e.g., the Bazhenov Formation, Russia) has been
established. Additional work, however, is needed in this field.
There is a possibility of the low potential energy directly transforming into the
chemical high potential energy. During the recent years, the effect of mechanical
fields attracts evergrowing attention. Some authors attempted to apply it to the
problem of organic matter transformation in the Earth’s crust. Thus, the geody-
namic compaction and seismic activity may be considered as energy sources during
the oil-generation cycle.
It should be mentioned that Ignatchenko (1968) discussed the possible effect of
seismicity on the coals, quoting A. A. Gapeev’s experiments on the effect of impacts.
Ignatchenko stated that although there is no convincing evidence of the metamor-
phic effect of the elastic waves on organic matter, there is a need for further studies.
The energy, which causes elastic and plastic deformations of rocks, also signif-
icantly affects the entire complex of physicochemical processes of the organic matter
generation and accumulation. A field survey and a laboratory modeling (by Yu. A.
Pitsukha) indicate that during the tectonically caused plastic deformations of sed-
imentary rocks, these rocks are mechanically activated. As a result, various phy-
sicochemical processes occur. In the process, the tectonomechanical energy is
converted within the rock matrix into electric, heat and chemical forms of energy.
The released energy, with active participation of the chemically and physically ad-
sorbed water molecules, causes spontaneous processes, which result in the generation
of hydrocarbons and various organic-mineral compounds.
A laboratory study of seismic action on rocks (conducted by Siberian scientists:
N. V. Cherskiy, V. P. Tsarev, and T. I. Soroka) showed that certain changes occur in
response to weak elastic deformations at 30–40Hz frequency and temperature be-
tween 201C and 701C. They include an increase in carbon content and decrease in
hydrogen content within the insoluble portion of organic matter, and increase in the
role of aromatic structures. At the same time, hydrocarbon content significantly
increases in the soluble portion of organic matter (in: Eremenko and Chilingar, 1996,
p. 163).
Thus, mechanochemical reactions may help transform the source organic matter
and generate hydrocarbons in a low-temperature environment as a result of elastic
and plastic deformations.
One must be very careful when transferring laboratory results to the natural
environments. The Earth does not have thermodynamically isolated coats (covers).
The energy transfer occurs as conduction (heat) and convection (mass). Classical
hypotheses of organic origin of oil accept only the convection energy transfer into
ORIGIN OF OIL AND NATURAL GAS144

the sedimentary cover. Sh. F. Mekhtiyev, B. A. Sokolov, etc. (in: Eremenko and
Chilingar, 1996) allow some participation of the convection energy in the oil gen-
eration. This is quite plausible based on what we know about the Earth’s coats/
covers. The proponents of inorganic origin insist that the petroleum accumulations
form by convection only. This statement is ruled out by the majority of scientists
although neither side has a convincing proof.
It will be very hard to prove that the (gas, liquid?) flows that exist can form
hydrocarbon accumulations with a pressure of 50MPa or greater. At least, there are
no known gas deposits associated with subcrustal sources and containing enough
hydrocarbons at a sufficient pressure. A concept developed long ago by Stadnikov
(1931, 1937) suffered from the fact that there is insufficient amount of hydrogen in
the Earth’s crust. Crude oil differs from the living matter in its absence of oxygen
and over-abundance of hydrogen. Thus, Stadnikov (1937) had to introduce the
concept of hydrogenation by the hydrogen migrating from great depth.
Molchanov and Gontsov (1992) suggested that hydrocarbons can be synthesized
at room temperature and normal pressure in a medium capable of generating hy-
drogen. Hydrogen forms from the interaction between water and oxidizing minerals
that contain the sulfide of sulfur and protoxide of iron. Atomic hydrogen reacts with
the carbon (i.e., prior to the formation of H2 molecules). The energy source is the
dispersed mineral mass.
Molchanov and Gontsov (1992) consider the oil generation as a chain conjugate-
radical reaction initiated by the hydrogen at the moment of its ‘‘release’’. The
mechanism of radical reactions was first suggested by Maksimov et al. in 1959. This
proposal was later supported by the discovery of free radicals in crude oils (this was
not known in 1959). This concept was developed further by Galimov (1973). He
concluded that the reactions, which are thermodynamically impossible at given
temperatures, may actually take place. Thus, heat is not necessary and is not a
required precondition for the oil and gas generation (Galimov, 1973, p. 223). Price et
al. (1985), Rohrback et al. (1984), and Nesterov and Shpilman (1987) also stressed
the importance of radical reactions in the formation of hydrocarbons.
ROLE OF ENERGY IN THE OIL GENERATION PROCESS 145

This page intentionally left blank
146

Chapter 9
FORMATION OF HYDROCARBON ACCUMULATIONS
9.1. SEDIMENTARY BASINS
Oil and gas fields in any sedimentary basin are not distributed uniformly. They
form non-uniform assemblages, and each one of these assemblages usually has
stratigraphically similar oil- and gas-bearing deposits with similar regional geology
(exceptions to this rule, however, are known). Such assemblages can be called ‘‘oil
and gas accumulation zones’’. They may form (1) around a large field, (2) over a
large arch, (3) satellite fields, and (4) without a large field, thus composing an
‘‘association’’. Such assemblages may include a number of fields more or less of
equal size (depending on the size of traps) along (a) the structural swells, (b) some
pinch-out zones, or (c) stratigraphic unconformities on monoclines. Sometimes, in
the center of a massive plate, it may be quite difficult to identify a structural unit,
which controls association of several fields. It is not necessary for every hydrocarbon
field to be a member of an oil and gas accumulation zone. There could be an
independent ‘‘zone’’ with a single field.
Grouping of hydrocarbon fields associated with large structural unit determines
some common features of the environment of formation of accumulations and fields
within an oil and gas accumulation zone. This is predicated on the similarity of the
formation of sediment sequences, which, in turn, is based on the common tectonic
evolution of the region and on similar conditions of formation of traps of various
types. The identification of oil and gas accumulation zones at different exploration
stages ensures the success of exploration operations and enables one to forecast the
subsurface temperature, pressure, and phase composition of hydrocarbons.
The oil and gas accumulation zone is sometimes called a ‘‘trend’’. The latter,
however, is most commonly used to describe a linear distribution of fields with the
productive deposits of about the same age. It should not be confused with the term
‘‘play’’ that presupposes not so much the structural commonality as the
commonality of oil and gas sequence. Thus, two or more ‘‘plays’’ may be included
in a single oil and gas accumulation zone. As an example, in the northeastern
Caucasus, with its frontal ranges, there are two oil and gas accumulation zones,
which include four plays of Tertiary and Cretaceous age in each zone. On the other
hand, a single play may include the oil and gas deposits associated with different oil
and gas accumulation zones. In the above example, there are two plays (Tertiary and
Cretaceous) for the two oil and gas accumulation zones but each play involves both
zones.
Otis and Schneidermann (1997) evaluated four different concepts of exploration
based on the degree of knowledge about the specific geologic feature:
1. Basin concept. Basin concept involves an assessment of (1) the potential of source
rocks, (2) capacity of reservoirs, (3) capacity of traps, (4) sealing properties, (5)
147

proper timing of trap formation, and (6) proper timing of migration. This
assessment is a screening device only, and does not include commercial
considerations.
2. Petroleum system concept. Petroleum system concept involves a volume of
sedimentary rocks containing hydrocarbons, charged by a single source rock.
Application of this concept requires the presence of the manifestations of
hydrocarbons (seeps, shows, or a producing well); it is applicable in many
frontier basins only by analogy. Recognition of an active petroleum system also
serves as a screening device because it carries no volumetric and, therefore,
cannot estimate a commercial value of HC resources.
3. Play concept. The play is an elemental part of a petroleum system, and is
recognized as having one or more hydrocarbon accumulations identified by a
common (1) geological character of the reservoir, trap, and seal, (2) timing of
migration, (3) preservation, (4) location and environment, (5) fluids, and (6) flow
properties. Individual plays have unique geological and engineering features,
which can be used as a basis for commercial assessment.
4. Prospect concept. The prospect is an individual, potential accumulation. Each
prospect is perceived as belonging to an individual play, characterized by risk
components and a probabilistic range distribution of potential hydrocarbon
volumes within its trap confines.
Based on the position of an oil and gas accumulation zone, play, or prospect
within a larger structure (oil-gas basin) may help forecast some parameters of
hydrocarbon accumulations.
Many publications are devoted to the classification of sedimentary petroliferous
basins (see e.g., Eremenko and Chilingarian, 1991). Common features of all
definitions and classifications are (a) stressing the processes of oil and gas generation,
and (b) more rarely, the processes causing the formation and destruction of
hydrocarbon accumulations.
The formation and destruction of accumulation is affected not only by broad
events in the basin or its major portions (e.g., folding), but also by the local events
within the adjacent areas, such as the erosion of the crest of anticline or appearance
of a conducting fault. The authors do not believe that the ‘‘oil and gas basin’’ should
be identified as a distinct category. The identification of sedimentary basin would be
quite sufficient (Vassoyevich, 1975). A sedimentary basin may be petroliferous if it
contains commercial oil and gas accumulations. If the presence of commercial oil
and gas accumulations is only assumed, such basin is called the prospective basin. At
the same time, this basin may be coal-, gold-, uranium-bearing, etc.
Numerous attempts have been undertaken to find the pattern in the distribution
of accumulations in relation to the plate tectonics concept. The oil and gas
accumulations are discovered in the central and marginal parts of the tectonic plates,
with the greatest number of accumulations present at the margins.
No qualitative or quantitative patterns in the distribution of accumulation have
been discerned in the passive versus active margins. The passive margins appear to
have somewhat more reserves. The hypothesis of the hydrocarbon involvement in
the subduction zones with the subsequent transportation along the fault zones to the
FORMATION OF HYDROCARBON ACCUMULATIONS148

sedimentary basins, where they form oil and gas accumulations, is not supported by
field data. Many oil and gas basins do not have even a hypothetical connection with
the subduction zones (e.g., West Siberian, Michigan, and Paris basins).
Based on many oil and gas origin hypotheses, it may appear that the active
margins should have an advantage in terms of the amounts of hydrocarbons
generated (and their lighter, more alkane composition) because of (a) amplitude of
tectonic movements, (b) high thermal stress, and (c) convective supply of the matter
(and heat) from the mantle. No qualitative distinctions are recorded, however, and
the quantitative advantage belongs to the passive margins. The oil and gas
generation is occurring in both the active and passive margins, and the difference in
its intensity is insufficient to cause any apparent varieties.
The taphrogene is the major oil- and gas-producing complex of the passive
margins, whereas for the active margins, it is the riftogene complex (wherever the
rifts are established). Their similarity is apparently due to the way both complexes
form: accumulation occurred after the pronounced tectonic movements. The
advantage of the plate margins becomes obvious for the larger taxons, i.e.,
continents and oceans. The major hydrocarbon reserves are associated with the
continental margins and shelves. The second in importance are the central
continental areas. The central oceanic depressions have low potential.
Brod (1947) introduced a theory that petroliferous basins are associated
with stable subsidence. Tectonics determines the structure of basin with accumu
lations forming within the structural traps. The tectonic processes (oscillating
movements and lateral stresses) also control the facies of the sedimentary sequences
and the location of stratigraphic and lithologic traps. Until now, not much atten
tion was devoted to the uplifting movement occurring against the background of
general subsidence and its accompanying oscillations. Indeed, the uplifting
movement constitutes a force that creates positive structures and gives rise to
the changes in the pressure and temperature, which are major motivators for the
fluid migration.
The origin of a sedimentary basin, its depositional environments, and its tectonic
evolution affects its oil and gas potential.
As far the continents are concerned, petroleum geologists are interested in the
sedimentary basins of (a) internal and marginal platform (plate) areas, (b) foredeeps,
and (c) intermontane troughs. The folded zones are of interest wherever they are
thrust over the platform (plate) margins and wherever the oil and gas accumulations
are discovered underneath them (e.g., Rocky Mountains and Carpathians), or
assumed to be beneath them (e.g., Urals, Trans-Caucasus and Himalayas); also in
intermontane troughs.
Common feature of the large sedimentary basins underneath the World Ocean is
the emergence and evolution over the oceanic or transitional type crust. This affected
the tectonic evolution of the basins, tectonic movements, and the sediment cover, the
very nature of which is due to tectonogenesis. Another characteristic of such basins is
the formation of their sediment fill in deep basins. On the shelf and in the marginal
sea basins the depths are within 1–2.5 km. Over the rest of the World Ocean the
depth is, on average, 4–4.5 km, which rarely decreases to 1–2 km.
SEDIMENTARY BASINS 149

Provenance areas of clastic sediments were relatively close to the shelf and
marginal sea basins, whereas the other sediment accumulation areas are hundreds
and even thousands of kilometers away from the source. This pattern may be broken
outside the shelf area only by turbid flows of major rivers. Rate of deposition and the
total thickness of the sediments significantly decrease from the marginal to the
central parts of the ocean. The bulk of organic matter is deposited over the marginal
zones. With increasing distance from the marginal zone, the amount of organic
matter drastically declines. It enters the sediments in a significantly altered form due
to long travel. Finally, common to all oceanic basins is a total absence of
aerodynamic weathering.
The conditions for the formation of clastic reservoir rocks are quite favorable in
the oceanic sedimentary basins. A high pore pressure due to the high water column
prevents compaction of deposits. Thus, good reservoir-rock properties can be
preserved before the secondary cementation processes. It is well known that the
‘‘marine’’ reservoir rocks are superior to the ‘‘continental’’ ones.
If marine carbonates are sufficiently compacted (near-shore environment; shelf;
some intraoceanic highs) and in the presence of water movement carbonate reservoir
rocks can often form due to erosion. Fractured reservoirs may occur only in rocks
that reached a certain degree of rigidity.
Compaction can occur in the sediments of the shelf and marginal seas; also in
some exceptional situations in other portions of the World Ocean. The latter can
involve the uplift resulting in an increased compaction.
The formation of the seals (caprocks) is a somewhat more involved issue.
Argillaceous caprocks form only if sediments are sufficiently compacted, which is
unlikely when the pore pressure is high. That is why numerous wells drilled in the
World Ocean encountered only uncompacted sediments. The compacted deposits
forming caprocks are only found over the shelves, within marginal seas and,
sometimes, over the continental slope. Under favorable depositional conditions in a
specific area, the formation of seals from evaporites also requires some compaction.
Seals may form in the upper sediment section also due to gas hydrates. Although gas
hydrates were discovered in many locations of the World Ocean, hydrocarbon
accumulations were found underneath these seals. Thus, the oceanic environment is
favorable for the formation of reservoir rocks, whereas the conditions for the
formations of seals are possible only within the ocean’s margins.
Organic matter introduced into the water of oceans was deposited mostly in the
oceanic margins. Any organic matter and hydrocarbons in the internal basins would
be formed at the expense of biologic resources. The formation of hydrocarbon
accumulations, however, would be problematic. The reason for this statement is that
prior to the sediment compaction, the avenues for the vertical migration in those
sediments will prevail over the lateral migration, and the dispersion processes in the
water medium will prevail over the accumulation processes.
In conclusion, the World Ocean should not be included as the area of vast
undiscovered oil and gas reserves. Relatively high potential may be expected only
within about 15% of the World Ocean area (marginal zones), whereas interoceanic
basins have low to zero potential.
FORMATION OF HYDROCARBON ACCUMULATIONS150
Olenin (1984) presented a review of the definitions of ‘‘oil and gas province’’ term.
Mirchink et al. (1976) defined a petroliferous province as an oil and gas basin or the
association of adjacent basins, the structural position and tectonic evolution of
which were controlled by the same major structural element of the Earth’s crust. This
term (petroliferous province) can be considered equivalent to ‘‘geologic province’’
with oil and gas fields.
9.2. HYDROCARBON EXPULSION (‘‘PRIMARY MIGRATION’’), HETEROGENEITY OF THE
MEDIUM, DISSOLUTION IN WATER AND GAS, AND DIFFUSION
The formation of hydrocarbon accumulations occurs in the process of migration
of hydrocarbons. K. P. Kalitskiy (in: Eremenko and Chilingar, 1996) proposed an
idea of the in situ formation of oil and gas accumulations. This idea was soon
rejected due to the absence of substances that would be able, after their
transformation, to form an oil accumulation within the original volume. Thus,
accepting that concentration (gathering) of hydrocarbons was needed to form
accumulations, the petroleum geologists turned their attention to finding out which
area, or volume, would be involved in such migration. Usually, the energy-related
side of the issue remained ignored.
Starting with Illing (1934), it is believed that migration process includes an
independent stage: the expulsion (‘‘primary migration’’). The expulsion is a
detachment of most volatile components from organic matter and mineral matter
and their movement within the poorly permeable source rocks.
The secondary migration involves the movement of oil and gas in permeable rocks
through pores and fractures. In this case, displacement of matter is governed by the
laws of mechanics, whereas the role of the law of the matter transfer during
the expulsion processes is unclear. The detachment of newly-formed molecules from
the organic matter occurs at the molecular level and is governed by the laws of
molecular physics.
Where and how does that quantum leap occur from the molecular level to the
level of matter subjected to the laws of mechanics? The dissipation of newly-formed
molecules may occur spontaneously, due to the internal energy of the changing
matter. The temperature will accelerate the process. On the one hand, it will enable
the breakage of the bonds between the newly-formed molecules and organic matter.
Also, by increasing the unencumbered run of the molecules, it will help their
distancing from the organic matter.
Can we call these molecules detached from organic matter (mostly not
hydrocarbons) oil? Oil is a complex chemical mixture. Its components, mostly
hydrocarbons, continuously interact between themselves and with the surrounding
medium. Their specificity is defined by their common occurrence in the same matter.
In order to gather the individual molecules into a single mass, some additional
energy must be applied. What kind of energy is it? Unfortunately, there is no clear
answer to this question. In 1950, Brod and Eremenko proposed that the mobile
hydrocarbon and non-hydrocarbon substances that form in the rocks migrate into
HYDROCARBON EXPULSION (‘‘PRIMARY MIGRATION’’) 151

traps, accumulate in them through physicochemical interactions with one another,
and form a complex chemical mixture called oil. Unfortunately, this idea does not
answer the above question of the energy source and the mechanism of its action.
The concept of primary migration of oil (expulsion) as a result of the compaction
was widely accepted for a long time. Gubkin (1932) suggested that oil left the source
rock together with the last portions of the squeezed-out water. Thus, he suggested
that oil was generated in the source rocks. Early, in the course of lithogenesis, while
the organic matter has not yet been converted into hydrocarbons, mostly water was
squeezed out. At the initial stage of compaction, the squeezed-out water moved
mostly up, toward the lower pressure zone.
Koichi et al. (1985), in order to investigate the primary migration of oil, have
compacted the Na-montmorillonite clay (mixed with seawater and crude oil) for 25
days under a pressure of 1000 kg/cm2 and a temperature of 60oC. The amount of
expelled liquid from the clay was large at the early stage of compaction and
decreased gradually as compaction progressed. The proportion of oil in the expelled
liquid gradually increased with increasing time of compaction. Porosity of the
compacted sample decreased from 81% of original clay to E26%.
As the sediments compact and become rocks, the direction of the squeezed-out
fluid flow changes. Inasmuch as the permeability is usually higher in a lateral
direction, the main fluid flow also occurs in that direction. Thus, the main fluid flow
in a basin is directed toward the basin flanks. Upon compaction, because of low
permeability, the flow of fluids is hindered in clays with formation of abnormally
high formation pressure (AHFP).
Compaction of sediments was studied by many scientists, e.g., Rieke and
Chilingarian (1974), Chilingarian and Wolf (1975, 1976), Buryakovsky (1985a,b),
Beletskaya (1990), and Buryakovsky et al. (1991). It was established that the clay
structure changes upon losing water, which is especially noticeable in the case of
montmorillonite. During diagenesis, the montmorillonite is transformed into illite
(Powers, 1967). Its structure drastically changes and it loses up to 50% of its mineral
mass. As a result, earlier bonded interlayer water is released as free water resulting in
additional fracture porosity. Thus, the avenues for the primary migration are
created. In addition, the additional water for expelling organic matter transforma-
tion products becomes available.
The compaction and consolidation of carbonate oozes are accompanied by
crystallization and, often, with appearance of numerous microfractures. Upon
lithification, the mobile substances within the deposit in part become a component of
the rocks, and in part acquire the ability to move. Upon dolomitization
(Mg2++2CaCO3-MgCa(CO3)2+Ca2+), up to 13.1% porosity (mainly rhombo-
hedral with some microfractures) can form, creating further avenues for migration
(see Chilingarian et al., 1992, 1996).
Transformation of the montmorillonite to illite and the compaction of the other
clays are controlled by the temperature, composition of the interstitial fluids (e.g.,
presence or absence of potassium ion), and permeability changes in the section.
Temperature increases with the subsidence of rocks (whether carbonate or clastic).
Coefficient of temperature expansion is different for different rocks, water, oil, and
FORMATION OF HYDROCARBON ACCUMULATIONS152

gas. It is much greater for oil and gas than it is for the rocks. In addition, the physical
and chemical properties of mobile substances change with increasing temperature.
Their viscosity declines (except for gases) and they can evaporate, completely or in
part.
Thus, these changes promote migration. Kh. Watte (in: Eremenko and Chilingar,
1996) believed that the major force behind the oil expulsion is the temperature
changes in the Earth’s crust. According to him, the primary migration occurs by way
of hydrocarbon transfer by water (as an emulsion?), and a combination of
adsorption and diffusion due to temperature gradient. The issue of the nature of a
medium is highly important when looking for the external energy sources for the
migration and accumulation of the products of transformation of organic matter.
The issue of physical and geochemical uniformity of rocks is worth discussing. It
is especially important with respect to those sequences that are believed to be oil and
gas source rocks. Most authors, whether in an obscure or unambiguous form, base
their conclusions on a concept of uniform distribution of source organic matter in
rocks. The rock sequence, at least within the oil and gas generation zone, is more or
less uniform and the geochemical environment is maintained within a rigid range
with the same heat flow. Thus, there is a vertical zonation of catagenesis by
temperature intervals, with uniform compaction of the source-rock sediments. These
assumptions, which are based on the average organic matter content and on its
average transformation, are utilized in genetic method of the evaluation of
prognosticated reserves. But, is this correct? To answer this question, one must
review the type of changes in the major physical and geochemical parameters in a
source rock.
9.2.1. Overburden Pressure
The overburden pressure is determined by the thickness of overburden and the
rock density, both of which vary in any oil and gas basin. Even if smaller areas
within a source-rock sequence are selected, the above variables will change
substantially even if the surface topography is ideally plain. This occurs due to the
fact that:
(1) A thick source-rock sequence always includes lithofacies and thickness changes
of component formations. The boundaries of these formations do not have to
coincide with the hydrocarbon-generation zone boundaries (Nazarkin, 1979).
(2) The source-rock sediments are always deformed, which causes differences in
lithostatic pressure along them. Deformed sediments will respond differently to
the ‘‘arch effect’’ (Poisson’s ratio). Thus, the overburden pressure (pressure
potential) will differ within a source-rock sequence.
9.2.2. Pore Pressure
Source rocks usually have low permeability and usually display the ‘‘elision’’
regime with AHFP (see Chapter 3). The magnitude of pore pressure depends on the
HYDROCARBON EXPULSION (‘‘PRIMARY MIGRATION’’) 153

difference between the increase in the rate of fluid pressure increase and the rate of
relaxation. Both rates can vary significantly within the source-rock sequence. For
instance, the former one is determined by the (1) overburden pressure, (2) formation
temperature, (3) volume of the released interlayer water, mainly as a result of
montmorillonite-to-illite transformation, (4) volume of newly-formed substances
(due to organic matter transformations), and (5) osmotic pressure, etc. The rate of
relaxation, on the other hand, depends mainly on the permeability (because it is
determined by the diffusion and effusion phenomena). Thus, the variation in pore
pressure potential arises within a source-rock sequence. This variation is especially
pronounced in a heterogeneous source rock.
9.2.3. Rock Compaction
Rock compaction occurs mainly as a result of increasing effective pressure, which
is equal to the difference between the total overburden pressure and the pore (fluid)
pressure. Variable nature of these parameters has been discussed earlier (see Section
3.1). The non-uniform nature of source-rock compaction, with all ensuing
consequences, is obvious.
9.2.4. Temperature
The endogenous heat flow undoubtedly affects the rock–water–organic matter
system. Smirnov (1980) mentioned three types of the heat-flow anomalies: mantle,
crustal, and near-surface ones. The latter two types may be associated with the
occurrence of non-stationary heat sources in the Earth’s crust and the sedimentary
cover (Sergiyenko, 1995; Nazarkin, 1994). These authors described in detail the
arising non-uniformity and unsteadiness of the heating of sedimentary rocks. It is
sufficient to emphasize here the emerging variation in the potentials of temperature
within the sedimentary rocks (including source rocks).
9.2.5. Geochemical Non-Uniformity
Geochemical heterogeneity is caused not only by the original deposition of
chemically diverse sediments, but also by the combined effect of diagenetic and
catagenetic alterations. The recrystallization processes, the emergence of new
minerals, and the disappearance of the other ones are accompanied by appreciable
changes in temperature and pressure. These changes occur because endothermic and
exothermic processes may be happening at the same time within different parts of the
system. Just the geochemical heterogeneity alone can create a very strained
geochemical environment (see Section 3.1) within a sedimentary sequence (especially
within the source rocks). These phenomena increase in sedimentary sequences
enriched in the organic matter. Field data indicate (see Chapter 7) that the quality
and quantity of organic matter may significantly fluctuate even within a single
sample. The largest quantitative fluctuations of organic matter (both organic carbon
and bitumen) are observed within the oil and gas windows.
FORMATION OF HYDROCARBON ACCUMULATIONS154

The above discussion shows that during lithogenesis the source rocks reside in an
extremely stressed energy state. Such a system tends to achieve the state of
equilibrium. The energy is redistributed within the system (source rock) and is
transported (along with the fluids) to the adjacent beds with a lower potential energy
level. This results in the leveling of the energy non-uniformity. The process is
unavoidably accompanied by folding and faulting.
Thus, a particle of organic matter, with all the internal energy accumulated within
it, gets into a sedimentary sequence, which is in a highly stressed-energy state. In the
process, the organic matter is altered, first of all by way of losing various mobile
components, including relic hydrocarbons.
The detachment of individual molecules from the organic matter may be initiated
by various energy potentials. An excellent monograph on the primary oil migration
was published by Beletskaya (1990). The study is based on the analysis of data in the
literature and on the laboratory experiments. Beletskaya concluded (p. 277) that the
following factors cause the detachment of microoil from the source organic matter:
(a) desorption of the reservoir water, gas and hydrocarbons; (b) temperature increase
due to the sediment burial or due to endothermic processes in sediments; and (c)
possibly, diffusion processes.
Actually, the number of reasons may be greater than that. Beletskaya (1990) treats
organic matter as a passive object, whereas in fact it is one of the most active, energy-
saturated components of the system (see Chapter 7). To achieve the energy
equilibrium, it can expel the ‘‘extra’’ particles or molecules and can cause exothermic
reactions.
The compaction of sediments with the included organic matter begins at the stage
of diagenesis and continues during catagenesis. The compaction caused by the
increased pressure and changes in the structure of the substance drastically decrease
the surface of particles and, hence, their surface to energy. A decrease in the surface
energy makes it easier for particles (and molecules) to be detached from the
‘‘mother’’ (source) substance. If a water or hydrocarbon film covered the surface of
the solid substance, such film may have moved either to the adjacent particle with
higher surface energy or to the pore space. In the latter case, if hydrocarbons were
present, they may form a free phase (liquid or gas). Obviously, hydrophilic or
hydrophobic properties of the surfaces, or changes thereof, would affect the course
of the process.
Thus, individual organic matter components detaching from the source matter
may be considered as the first stage of expulsion process. The following second stage
would be the displacement (migration) of the released matter. The third stage is the
primary accumulation (i.e., the formation of a substance that is moving in the pores
according to the law of hydrodynamics). The nature and direction of the second and
third stages would depend of the physical state of migrating substance, which will
determine the physical or physicochemical processes providing for the displacement
of substance and the selection of the avenue of migration.
Hydrocarbon molecules detached from the source matter get into the surrounding
water and form a true (molecular) solution. The solubility of gas and liquid
hydrocarbons in water have been extensively studied (e.g., Chekalyuk and Filos,
HYDROCARBON EXPULSION (‘‘PRIMARY MIGRATION’’) 155

1977; Chekalyuk, 1986; Parker et al., 1986; Simonenko, 1988; Beletskaya, 1990;
Sariapo, 1993). The solubility was established for most mixtures (mostly binary,
however). It is important to mention that the high-molecular-weight compounds
found in crude oils are poorly soluble in water. The increase in solubility of liquid
hydrocarbons in water with increasing temperature becomes appreciable only above
160–1801C. Separation of liquid hydrocarbons from solution may occur when
temperature declines or the water salinity increases greatly.
The molecular solubility may play a significant role in the expulsion (and
migration) process only when the rocks are subjected to high temperature and
pressure (T4120–1801C, p420MPa). Water-soluble hydrocarbons can travel
together with water for a long distance and time. They can be ‘‘salted-out’’ only
after the solubility limit is exceeded. The total saturation of water with hydrocarbons,
however, is observed only in the immediate proximity of oil–water interface.
The liquid hydrocarbons are highly soluble in the colloidal-emulsion or micellar
form. This solubility is at least one order of magnitude higher than that in the case of
true solutions. Beletskaya (1990) stated that:
(1) Emulsions (water-in-oil) form spontaneously, due to the heat motions of
molecules.
(2) In order for the emulsion to form, there is no need to overcome the micelle-
formation critical barrier (enough of surfactants and emulsifiers are present in
the dispersed organic matter per se); however, an alkaline environment is
required.
(3) Inverse emulsions (water-in-oil) may form with the asphaltene-type surfactants;
such inverse emulsions have the external hydrocarbon phase (hydrophobic), are
floating in water, and when moving through rocks are capable of desorbing and
dissolving paraffins and asphaltenes. These emulsions are stable over a wide
range of pressure and temperature.
The emulsions are electrically charged and electrolytically active. Practically no
studies of the interaction between emulsions and both natural and artificial
electromagnetic fields have been conducted (Starobinets et al., 1986). The major
obstacles for the movement of colloidal solutions are the size of the particles
(0.1–0.001mm) and the electrostatic difficulty for the movement of negatively
charged particles (the surfaces of clays are negatively charged). According to
Eremenko and Chilingar (1996), the particles move unobstructed through the pores
where the pore throat (or canal) diameter is at least three times greater than the
particle size. When micelles form, the size of the resulting globules may be
comparable or even greater than the diameter of pore throats. At the same time, as
the water-in-oil emulsions, the gas-in-water emulsions can form.
Demulsification may occur upon changes in the water composition and pH and
when the emulsifier is catagenetically altered. The break-up of an emulsion may
cause the primary accumulation even within the source rocks. Owing to the low
permeability of rocks to emulsion, the latter can serve as a barrier.
The ‘‘submelted’’ water layers (see Chapter 4) are affected by the surface
forces and have different properties compared with free water. The difference is
first of all in their higher solving capability and their lower polarity. According to
FORMATION OF HYDROCARBON ACCUMULATIONS156

A. M. Bloch (in: Eremenko and Chilingar, 1996) and Simonenko (1988), such water
in limited pore space may create superconcentrated solutions (similar to melts) that
become unstable upon transition to larger pore space. When these solutions enter
such pore space with weak surface forces, hydrocarbons and other dissolved
components are ‘‘salted-out’’. The presence of elevated ore concentrations at the
contact of clays and sands may serve as an indirect confirmation of this
phenomenon.
The above explanation, which needs an experimental confirmation, may explain
the primary migration and accumulation of oil. Tsarev (1978) suggested that film of
microoil forms at the boundary of residual (irreducible) and ‘‘submelted’’ water. The
‘‘submelted’’ water layers, together with the microoil, have high mobility and will be
squeezed out of the rock first.
Kruglikov (1976) proposed a somewhat different mechanism of the film-type
migration of hydrocarbons. According to him, the forming gas bubbles, which are
enshrouded with an oil film, can migrate. The mobility of such an emulsion within
the rock may be quite difficult because of the similar size of gas bubbles (with an oil
film) and narrow canals.
9.2.6. Dissolution in Compressed Gases (See Retrograde Dissolution in Chapter 6)
A compressed free hydrocarbon gas, especially in the presence of methane
homologs and CO2, is capable of extracting hydrocarbons and other oil-like
substances from the organic matter (see e.g., Zhuze, 1986; Beletskaya, 1990).
According to Beletskaya, at a depth of about 1 km, a cubic meter of gas (a mixture of
methane+methane homologs+CO2 corrected to standard conditions) in a near-
static environment can dissolve 0.0012m3 of oil. This shows that the primary
migration of oil is quite possible in the presence of free gas.
Material balance calculations by Neruchev (1979) showed that the gas, released as
a result of decomposition of organic matter, can dissolve up to 40% of the generated
bitumen. Taking into account the phase composition of fluids migrating toward an
accumulation, the quantitative ratios and the solubility of released gases in water,
Neruchev concluded that only when the organic matter content in rocks exceeds 2%,
can some CO2 and methane form an independent phase and transport liquid
hydrocarbons. Therefore, this primary migration mechanism is possible when the
organic matter content in a rock exceeds 2%, but is an unlikely scenario for all oil
accumulations.
9.2.7. Diffusion
Dissipation of energy and matter is a common phenomenon in the Earth’s
crust. This phenomenon definitely occurs in the process of primary migration of
oil, but cannot in principle explain the primary and, even more so, the secondary
hydrocarbon accumulation because of its positive entropic nature (concentration
HYDROCARBON EXPULSION (‘‘PRIMARY MIGRATION’’) 157

equalization). Quantitatively, diffusion can be described by Fick’s law for gases:
Q ¼wAbðC1 � C2Þ
h
where Q ¼ the volumetric rate of diffusion, w ¼ the diffusion coefficient, A ¼ the
cross-sectional area, b ¼ the solubility or sorption coefficient, and h ¼ the bed
thickness. The bðC1 � C2Þ=h is called the gradient of concentration.
At least two indirect ways for diffusion to participate in the formation of
hydrocarbon accumulations have been proposed:
1. The water within a source rock is being saturated with liquid hydrocarbons. This
water, upon moving into a reservoir rock, with a different thermodynamic and
geochemical environment, releases the dissolved hydrocarbons. The dissolution is
possible if the water is (1) alkaline, (2) CO2-saturated, and (3) heated to 120–1501C.
A high concentration of hydrocarbons within the source rocks and their ability to
saturate the water at lower temperatures (o120–1501C) are in doubt. Besides, in
such a case the hydrocarbon-saturated water would be observed in the oil and gas
basins, especially next to the source rocks, which is not the case.
2. Thermal diffusion (Geodekian et al., 1984) results in fractionation of the
diffusion flow and in the concentration of heavier hydrocarbons near the cooler
edge. In the opinion of the writers, however, the thermal diffusion is in effect a
superposition of different phenomena: the thermal fractionation (separation) and
diffusive equalization of fractions. Thus, the diffusion proper equalizes the
composition. As far as the thermal fractionation is concerned, it is widely used in
refinery operations.
9.3. PRIMARY ACCUMULATION AND FREE PHASE MIGRATION (‘‘SECONDARY
MIGRATION’’)
A concept of the active liquid oil migration from the source rocks was extensively
discussed. It is not simply the squeezing-out of separate oil droplets, which is a
complex process in a natural environment. The concept assumes the release of liquid
phase as streams (Savchenko, 1977). Through this migration mechanism the
accumulation can occur already within the source rocks (possibly via the film
mechanism as described above). The major objection to this migration mechanism is
the absence in nature of source rocks (even assumed ones) with a high concentration
of residual oil.
Shklovskiy (in: Eremenko and Chilingar, 1996) developed a flow model for an
infinite cluster. Experimental studies by Efros (1982) indicated that the flow
threshold exists at about 15–20% of residual oil saturation. If oil and water are
present in a good reservoir rock, the relative permeability to oil tends to zero at the
oil saturation of 15–25% (depending on the oil and water viscosity under reservoir
conditions). Even in very good reservoir rocks, at least 25% of the oil is left behind
after production. In poorly permeable rocks (usually, the assumed source rocks
belong in this group) the residual oil saturation is over 70%.
FORMATION OF HYDROCARBON ACCUMULATIONS158

Magara (1981, 1982) estimated that the oil saturation should be at least 14.5% in
order for a continuous stream of oil to form in a rock. Cartmill (1979) proposed that
the minute oil droplets flocculate into clusters coated with water. If this migration
mechanism was operative, the oil might not have left any traces in the rock. Whether
or not the oil is able to move as such emulsions has not yet been studied. It is not
clear if it would be possible for such ‘‘clusters’’ to get through the pore throats and
canals. The stability of such emulsions under reservoir conditions is also unknown
(this is important for the primary accumulation).
Dickey (1975) proposed that a substantial volume of oil could migrate through a
hydrophobic rock. According to him, in such a case, the concentration barrier for
the phase migration of the oil may be as low as 1%. Actually, the rock does not have
to be hydrophobic. It must contain conductive channels lined with hydrophobic
organic substances (such as, residual asphaltenes) or minerals (sulfur, graphite,
talcum, and/or sulfides).
The concentration barrier for the oil movement may actually be lowered from
25% (at uniform saturation) to 1% (at non-uniform saturation). Eremenko (1985)
proposed a non-uniform spreading of the organic matter transformation within
rocks and non-uniform distribution of the products of this transformation. Within
each limited volume of rock containing organic matter, energy redistribution occurs
in the rock–water–organic matter system due to external and internal factors. High-
energy compounds formed as a result begin to move toward the areas with lower
energy or toward the adjacent reservoir rocks. This movement occurs most likely
according to the laws of film-type migration. The process develops with an increase
in the volume of organic matter (due to external energy). This results in the
appearance, movement and superposition of molecular films one over the other. As
the number of film layers increases, their molecular connections with the rock and
the source organic matter decreases. Eventually, they blend together and form a
single substance. Probably, Klubova (1975) observed such phenomena under the
microscope.
Other mechanisms of filling of fractures with fluids are possible. For instance, a
substance formed in pores may be squeezed out into a fracture. The process is non-
uniform in time and space. The degree of organic matter transformation at different
parts of the same sequence, especially if it is heterogeneous, differs. Non-uniformity
of primary accumulation process results in a sporadic distribution of primary
accumulations (streams) of hydrocarbons obeying the laws of mechanics.
The Shklovsky’s model (in: Eremenko and Chilingar, 1996) cannot be applied in
this case because there is no indefinite cluster and there is a directional change in
time. The saturation needed for the movement of a continuous phase (a stream) may
be reached in just a few channels (canals). The average saturation in rock may be
actually very low, just a fraction of one percent. In the proposed concept, the non-
uniformity of the medium, the processes occurring within the medium, and the
energy stress of the rock sequence are essential factors of the primary hydrocarbon
migration and accumulation.
From this position, a uniform organic matter accumulation within the uniform
sequences (such as the Maicopian and Bazhenov formations in Russia and the Green
PRIMARY ACCUMULATION AND FREE PHASE MIGRATION 159
River Formation of the United States) is an unfavorable factor for the formation of
hydrocarbons. Still, the hydrocarbon accumulations form because the uniformity of
these sequences and of their organic matter content is quite relative. However, the
accumulations turn out to be small compared with the huge volume of organic
matter concentrated in such sequences. In such cases, the bituminous sequences
formed in a sedimentary basin can contain relatively small hydrocarbon reserves
(relative to the organic matter content in the basin).
All of the above-described primary migration mechanisms can develop in nature
and act simultaneously. Relative predominance of a mechanism depends on the
specific subsurface temperature and pressure and geochemical environment.
Laboratory studies and field observations on the subject should be continued.
The same mechanisms can be operative during the secondary migration phase.
Changes in the intercommunication of pores occur during compaction. As a result,
part of the pores becomes isolated. As pointed out by Beletskaya (1990) and
Nazarkin (1994), organic matter transformation processes in such pores are unique.
Organic matter in the closed pores is enriched in all kinds of bitumens low in alkanes.
Nazarkin (1994) stated that this is one of the reasons why sequences (such as
bazhenites, domanikites, etc.) with abundant isolated pores do no generate large
volumes of hydrocarbons.
A heterogeneous sedimentary sequence with alternating reservoir and sealing
rocks exhibits differences in energy potentials. The other phenomena prevail in such
a case: (1) first of all buoyancy (the Archimedes principle), (2) hydraulic heads, and
(3) the elastic forces of fluids and rocks.
Oil and gas migration due to buoyancy force can occur only through fractures or
large pores. A number of forces resist the gravity-induced movement of oil and gas.
They include (1) friction, (2) interphase friction (caused by motions of oil, gas and
water relative to one another), (3) relative permeability, (4) viscosity (or internal
friction), and (5) molecular attraction between the rock walls and moving fluids
(capillary forces).
Droplets of oil or gas moving through the pores are subject to the Jamin effect14.
In order for a globule (minimum surface) to move through a narrow passage its
shape must change. Consequent increase in its surface results in the expenditure of
additional energy. The capillary pressure difference Dp (needed for the droplet
movement) at the opposite ends of the droplet is equal to
Dp ¼ sð1=R1 � 1=R2Þ (9.1)
where R1 and R2 are the radii of curvature of advancing and receding end of gas
bubble and s is the interfacial tension.
Although the Dp may be small for a single bubble, the cumulative resistance of
many bubbles may be large. Additional resistance to flow is created by the
polymolecular layers of oriented molecules of surface-active components in the oil,
which are adsorbed on the rock surface and may be thick (10�3–10�4 cm).
14Jamin effect is manifested as the restrictive force exerted upon the fluids flowing through narrow
passages by successive bubbles of gas.
FORMATION OF HYDROCARBON ACCUMULATIONS160

Buoyancy is more effective in the case of continuous oil and gas body (a stream)
rather than in the form of discrete droplets. Two questions arise here:
(1) What is the possible size of stream?
(2) What distance can the secondary migration overcome?
The length of the stream (l) depends on the density of oil and water (ro and rw),
the inclination angle of the barrier surface (a), and the capillary pressure at the start
of movement. Under the hydrostatic conditions (see Chapters 4 and 5),
ðro � rwÞg sin aþ Dp=l ¼ 2sð1=R1 � 1=R2Þ (9.2)
Levorsen’s (1954) calculations indicate a pronounced effect of buoyancy at a
length of 1 and 10m of the continuous phase.
As far as Question 2 is concerned, three conditions must be met for the secondary
migration to occur:
(1) Enough fluid must be available along the entire length of movement (migration).
(2) Avenues of migration for this fluid to move must be available.
(3) Availability of forces that could move the fluid along.
Most petroleum geologists believe that the main (maybe even the only) force that
causes the movement of oil and gas is buoyancy (gravitational force). The capillary
forces are considered to constitute the main obstacle to the movement (P. Allen and
J. Allen, 1993, p. 340).
According to the writers of this book, there are many natural forces that may
cause migration of oil and gas. Buoyancy is one of these forces and, quite often, is a
dominant one. One has to keep in mind, however, that buoyancy force decreases
with increasing depth, as physical properties of oil, gas, and water become closer.
Some hydrocarbon accumulations reach tens and even hundreds of kilometers in
length. Thus, the lateral migration (i.e., along the reservoir rock) might have
occurred at least along these distances. Mountainous and piedmont areas of the
folded regions encountered all over the world contain copious oil and gas shows. The
causes for that are twofold: (1) deformed areas include numerous avenues for oil and
gas migration (fractures and faults); and (2) these areas are subject to powerful
erosion, which exposes oil- and gas-saturated beds at the surface. In such cases, the
interreservoir oil and gas migration may be visually estimated to reach at least a few
kilometers. Thus, the knowledge of a specific geological scenario is needed to
establish the length of secondary migration.
The lateral migration in most cases is limited by the position of the axis of the
adjacent depression. The limitations may be associated with obstructions to flow
(often, lithological barriers). Vertical migration in most cases is limited by the
thickness of oil-saturated formations and by the length of faults. Migration is
observed even in such tectonically quiescent regions as West Siberia. According to
Kontorovich et al. (1975, p. 589), the vertical migration could have played a certain
role in the formation of oil and gas accumulations on the Siberian Plate. Examples
include Myldzhinskoye and South Cheremshanskoye fields.
Combination of vertical and lateral migrations is quite possible and the fluids
select the most energy-efficient route regardless of its direction. It appears that most
energy-efficient avenues are linear. Having once selected a route, the fluids tend to
PRIMARY ACCUMULATION AND FREE PHASE MIGRATION 161

use it repeatedly, because along this route they experience the least capillary
resistance and the least loss of matter (all sorption sites have already been saturated).
Along the way, heavier molecules tend to displace the lighter ones from the surfaces
of mineral particles, which results in some change in fluid composition.
Any migration along a relatively long distance results in the separation of oil and
gas from the oil–gas mixture. (The opposite phenomenon, i.e., mixing of the oil and
gas, also occurs in certain cases.) When the migration is dominated by buoyancy, the
oil and gas separation is most distinct. This is particularly distinct in the presence of
a chain of interconnected traps within a single structural trend. The principle of the
‘‘differential entrapment’’ of oil and gas has been presented simultaneously by
Gussow and Maksimov in 1954.
The following relationships may be observed as a result of regional uplift of a
reservoir bed with local highs separated by significant lows (Figs. 9.1 and 9.2).
Observations made by Gussow and Maksimov concern possible explanations for
the difference in the oil and gas content of adjacent or nearby traps. They suggest
that the nature of the hydrocarbons trapped in the reservoirs depends on the
proximity of the reservoirs to the source rocks. As oil migrates across basins and
encounters a series of traps, the process of differential entrapment becomes
operative. The theory states that a trap filled with oil and gas may eventually lose the
oil to another trap updip as oil and gas continue to migrate into the area. In Fig. 9.1,
during stage 1, trap A is an oil reservoir with a free gas. After trap A is filled and
additional oil cannot enter the trap, it spills updip to trap B, which contains oil only.
Fig. 9.1. Theory of differential entrapment: different stages in the migration and accumulation of oil and
gas in interconnected traps (after Gussow, 1968; courtesy of AIME).
FORMATION OF HYDROCARBON ACCUMULATIONS162

The migrating gas, however, will continue to be trapped in trap A during stage 1.
Traps C and D contain only water. In stage 2, trap A is completely filled with gas
and all the oil has been displaced to trap B, which is completely filled with oil. Oil is
starting to spill out to trap C. Trap D still contains only water. In stage 3, trap A
remained a gas reservoir and both oil and gas are bypassing it. Trap B now has a gas
cap and oil is bypassing it; oil is also expelled as the gas cap expanded. Trap C is now
filled with oil but still has no gas cap. Trap D is filled with water.
Gussow (1968) cited the oil and gas accumulations in the Leduc reefs on the
Acheson-Homeglen-Rimbey trend, Alberta, Canada, as a general illustration of this
process (Fig. 9.2). Homeglen-Rimbey is an oil reservoir with a very large gas cap.
Westerose South, immediately updip, is all gas. Farther up the trend, Westerose,
Bonnie Glen D-38, and Bonnie Glen D-3A are oil pools with free gas cap. Next come
Wizard Lake and Glen Park, oil pools without gas caps, and finally Leduc-
Woodbend, Yekau Lake, and Acheson, which have gas caps. The presence of gas
caps in the last three reservoirs, even though they are updip from the two pools that
do not have gas caps, can be explained by the large difference in depth of burial
between the two areas, which is approximately equal to 1000 ft. The lower pressure
in the shallower reservoirs allowed some of the gas to come out of solution and form
a gas cap.
Fig. 9.2. Profile of the Acheson-Homeglen-Rimbey-Leduc reef trend (after Horsefield, 1962; Hnatyuk
and Martinelli, 1967; courtesy of Pet. Soc. of CIM).
PRIMARY ACCUMULATION AND FREE PHASE MIGRATION 163
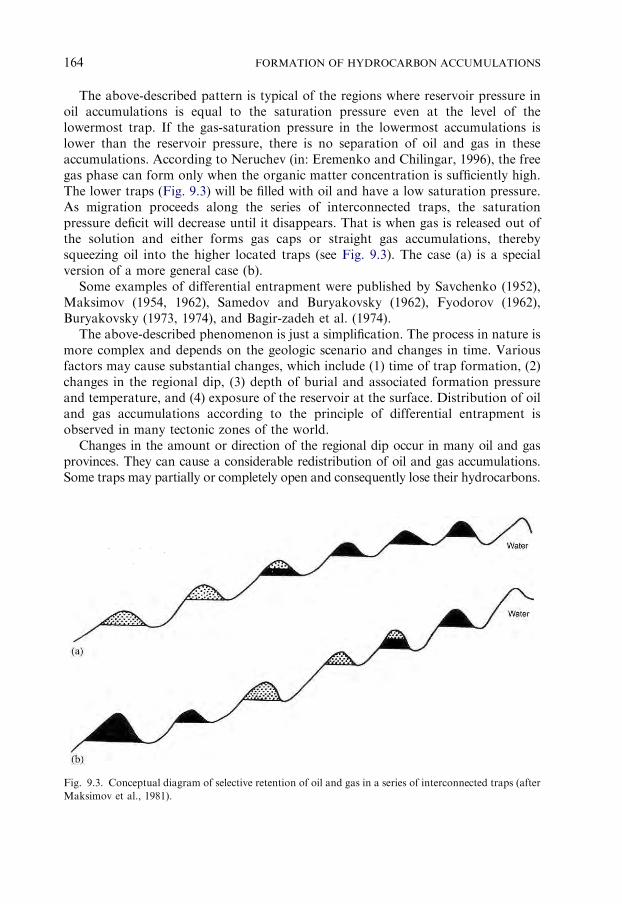
The above-described pattern is typical of the regions where reservoir pressure in
oil accumulations is equal to the saturation pressure even at the level of the
lowermost trap. If the gas-saturation pressure in the lowermost accumulations is
lower than the reservoir pressure, there is no separation of oil and gas in these
accumulations. According to Neruchev (in: Eremenko and Chilingar, 1996), the free
gas phase can form only when the organic matter concentration is sufficiently high.
The lower traps (Fig. 9.3) will be filled with oil and have a low saturation pressure.
As migration proceeds along the series of interconnected traps, the saturation
pressure deficit will decrease until it disappears. That is when gas is released out of
the solution and either forms gas caps or straight gas accumulations, thereby
squeezing oil into the higher located traps (see Fig. 9.3). The case (a) is a special
version of a more general case (b).
Some examples of differential entrapment were published by Savchenko (1952),
Maksimov (1954, 1962), Samedov and Buryakovsky (1962), Fyodorov (1962),
Buryakovsky (1973, 1974), and Bagir-zadeh et al. (1974).
The above-described phenomenon is just a simplification. The process in nature is
more complex and depends on the geologic scenario and changes in time. Various
factors may cause substantial changes, which include (1) time of trap formation, (2)
changes in the regional dip, (3) depth of burial and associated formation pressure
and temperature, and (4) exposure of the reservoir at the surface. Distribution of oil
and gas accumulations according to the principle of differential entrapment is
observed in many tectonic zones of the world.
Changes in the amount or direction of the regional dip occur in many oil and gas
provinces. They can cause a considerable redistribution of oil and gas accumulations.
Some traps may partially or completely open and consequently lose their hydrocarbons.
Fig. 9.3. Conceptual diagram of selective retention of oil and gas in a series of interconnected traps (after
Maksimov et al., 1981).
FORMATION OF HYDROCARBON ACCUMULATIONS164

At the first stage of formation of accumulations, the traps at great depth, in the
way of migrating hydrocarbons, are filled with gas and oil. The traps higher up the
slope are filled with water. If the regional structure changes later, the uplifted traps
may contain large hydrocarbon reserves. Peripheral accumulations may be totally
destroyed in the case of very significant uplifts. In the case of favorable scenario,
however, large oil fields or bitumen deposits could form (e.g. Devonian reservoirs in
the Romashkino Field in Russia and the Athabasca bitumens in Canada).
The density differentiation occurs easier in the moving fluids. Individual oil or gas
droplets float to the water surface, coalesce and, if the conditions are favorable, form
a large mass of hydrocarbons. The water is capable of displacing this mass by the
pressure of the hydraulic head.
It is important to elaborate here on the tilted water–oil contacts. Capillary
pressure curves, along with relative permeability curves, can be employed to explain
tilted water table conditions in the absence of hydrodynamic causes. In the
hypothetical example given by Arps (1964) in Fig. 9.4, the porosity and the
permeability of the formation decrease from left to right with resulting increase in
the transition zone thickness, as shown by the capillary pressure curves.
Some generalization of spatial pattern of changes in the properties of fluids (first
of all, density) was proposed by Buryakovsky (1973, 1974). The space pattern of
changes may be subdivided into the changes of the first and second order.
Fig. 9.4. Tilted oil–water contacts with lateral variation in rock characteristics (after Arps, 1964, Fig. 3;
courtesy of AAPG).
PRIMARY ACCUMULATION AND FREE PHASE MIGRATION 165
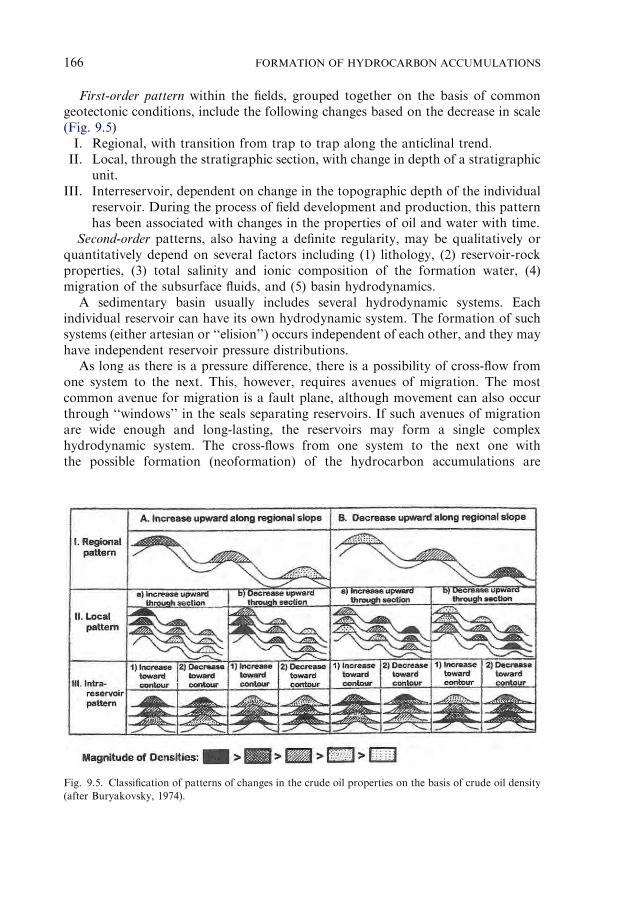
First-order pattern within the fields, grouped together on the basis of common
geotectonic conditions, include the following changes based on the decrease in scale
(Fig. 9.5)
I. Regional, with transition from trap to trap along the anticlinal trend.
II. Local, through the stratigraphic section, with change in depth of a stratigraphic
unit.
III. Interreservoir, dependent on change in the topographic depth of the individual
reservoir. During the process of field development and production, this pattern
has been associated with changes in the properties of oil and water with time.
Second-order patterns, also having a definite regularity, may be qualitatively or
quantitatively depend on several factors including (1) lithology, (2) reservoir-rock
properties, (3) total salinity and ionic composition of the formation water, (4)
migration of the subsurface fluids, and (5) basin hydrodynamics.
A sedimentary basin usually includes several hydrodynamic systems. Each
individual reservoir can have its own hydrodynamic system. The formation of such
systems (either artesian or ‘‘elision’’) occurs independent of each other, and they may
have independent reservoir pressure distributions.
As long as there is a pressure difference, there is a possibility of cross-flow from
one system to the next. This, however, requires avenues of migration. The most
common avenue for migration is a fault plane, although movement can also occur
through ‘‘windows’’ in the seals separating reservoirs. If such avenues of migration
are wide enough and long-lasting, the reservoirs may form a single complex
hydrodynamic system. The cross-flows from one system to the next one with
the possible formation (neoformation) of the hydrocarbon accumulations are
Fig. 9.5. Classification of patterns of changes in the crude oil properties on the basis of crude oil density
(after Buryakovsky, 1974).
FORMATION OF HYDROCARBON ACCUMULATIONS166
determined by the pressure gradients. Thus, the direction of flow may be either
upward or downward.
If two reservoirs are separated by a third one, with a higher or lower reservoir
pressure, the third reservoir hampers the cross-flow between the first two reservoirs.
However, it is possible to bypass the overpressured reservoir (AHFP) using the
concept developed by Eremenko (1961) which he called ‘‘the piston mechanism’’.
When a fracture is formed, vacuum is created and the fluids rush into the fracture.
Inasmuch as the fracture has a higher permeability than the bed with AHFP, the
fluids will flow along the fracture to reservoir with higher permeability, thus
bypassing the lower-permeability bed with AHFP. A similar concept was presented
later by Chepak (1984) and Solovyev (1986). This concept is not applicable to a bed
with ALFP (abnormally-low formation pressure), because such a bed is a receptacle
for the fluids. Thus, it will hinder the fluid movement in all directions.
The independent creation and existence of hydrodynamic systems may cause a
situation when the adjacent reservoirs in different parts of a basin exchange fluids in
the opposite directions. Elastic energy accumulated by the fluids (expressed in the
form of AHFP) cause fluid movements. This is especially evident in block-faulted
reservoirs. In such a situation, the fluids elastically compressed into a single phase
can cause their own movement. The separation of this phase into different phases
may occur later within a trap.
The diverse geological processes are not always mutually exclusive. These
processes and the associated forces often appear simultaneously within a single
geologic space. That is why it is very difficult to distinguish individual processes and
forces giving rise to them in a particular situation.
For example, in the process of formation of accumulations, buoyancy is most
active in the upper part of the Earth’s crust and within steeply dipping avenues of
migration (fractured zones, faults). With increasing depth, because the differences in
the physical properties of oil, gas and water tend to decrease, the action of buoyancy
declines up to a total disappearance (e.g., in ‘‘critical type’’ accumulations). The
capillary forces, which can either obstruct or cause migration (‘‘wick’’ effect, film
migration), increases to a depth of 700–1,000m and then decline to a total
disappearance in ‘‘critical type’’ accumulations. Elastic forces, which are insignificant
or absent in sediments, increase upon burial and are predominant in the ‘‘critical
type’’ accumulations. Pressure and temperature gradients in the sediments increase
with increasing energy stress, i.e., with depth and, especially, with increasing tectonic
stress.
Mutual solubility of fluids, as a factor promoting migration, significantly varies
with increasing temperature and pressure: first, a rather high solubility of
hydrocarbon gases in water and oil; then, an increased mutual solubility of gas
and oil; and lastly, almost complete mutual solubility of gas, oil and water in
‘‘critical type’’ accumulations.
The role of sorption and hydrophilic or hydrophobic properties of rocks decreases
with increasing temperature (i.e., depth). The role of AHFP in the migration
processes (either constructive or obstructive) increases from a depth of 300–500m up
to the emergence of energy-differentiated block-faulted reservoirs. Down the section,
PRIMARY ACCUMULATION AND FREE PHASE MIGRATION 167

within the metamorphic basement, which is fractured and possibly connected at a
distance with the surface (through an erosion surface or fractures), AHFP can
disappear.
Hydrocarbon accumulation begins to form at a location in the reservoir where
resistance to the fluid movement becomes greater than the forces causing this
movement. What is an oil (and/or gas) accumulation? The ‘‘Petroleum Reference
Book’’ (1984, p. 205–206) gives the following definition: ‘‘All writers define an oil
and gas accumulation as a single aggregation of these mineral resources. Sometimes
such accumulation is called elementary, local, isolated, or restricted from all sidesy
The major accumulation parameters are the quality and amount of oil, gas and
condensate. The shape and habitat of an accumulation are determined by the type of
reservoir and trap, temperature, pressure and natural drive (energy)’’. What is not
clear in this definition is the expression ‘‘single aggregation’’ and the ensuing idea of
the outline (contours) of the accumulation.
It is well established that all hydrocarbon accumulations contain some water, the
content of which may be 2% or ‘‘greater’’. What does ‘‘greater’’ mean? When
evaluating the hydrocarbon reserves, it is common to determine the oil–water
contact from the depth of perforations that produce a water-free oil, or (in the case
of log determinations) of the calculated oil saturation in excess of 50%. This is
actually quite definite. All oil accumulations contain at least 0.2–0.5% of water,
which is in no way a reflection of its true content, due to the relative permeability.
Even a reservoir with the oil saturation below 50% can yield the water-free oil
(depending on the fluid properties). The definition ‘‘log-calculated saturation of 50%
‘‘is also not clear. A flow of water-free oil as well as the flow of water alone can be
obtained from such a reservoir.
The issue of the contacts and fluid separations (w-o-g) in the reservoirs requires
further studies. It is especially important in the case of presence of emulsions in the
accumulations. This is observed in many small and medium size accumulations in the
Western Siberia and in the Eastern Pre-Caucasus (Sudarikov, 1978). How does one
interpret the concepts of ‘‘oil–water contact’’ and the fluid (w-o-g) ‘‘separation’’
surfaces, which are crucial in the appraisal, development and reserve calculation? Is
it possible that by changing the production technology we will be able to recover
commercial hydrocarbons outside the ‘‘contours’’?
A special category among the accumulations, the conditions of which deviate
from the average, are hydrocarbon accumulations at ‘‘great’’ depths with
temperatures above 120–1501C. Changes in the physical conditions at great depths
create a totally different environment.
Attempts to determine the speed of migration in the process of oil and gas
accumulation, assuming a uniform filling, were not successful. For example, during
the formation of the Anastasyev-Troitsk Field (North Caucasus) the length of
migration was 25 km, and the life of the structure was 15 MMY. Thus, the speed of
migration was 1.7mm/year (Maksimov et al., 1977).
Based on all the aforementioned, it can be stated that the fluids move non-
uniformly, and their speed may reach up to tens and even hundreds of meters per year
(established for water). According to Beletskaya (1990, p. 281), the most intensive
FORMATION OF HYDROCARBON ACCUMULATIONS168

hydrocarbon expulsion stage coincides in time with the maximum generation. The
following question arises here: When was it happening?
9.4. TIME OF FORMATION OF HYDROCARBON ACCUMULATIONS
There are many methods of determining the time of formation of hydrocarbon
accumulation (Mikhaylov, 1984):
9.4.1. Paleogeologic Method
The paleogeologic techniques enable the scientists to determine the time when an
accumulation began to form. Two seemingly clear-cut premises are valid here: (1) the
accumulations could not form prior to the rocks in which the accumulation is
located and (2) the accumulations began forming only after the formation of trap.
The latter premise, apparently clear, turns out to be indistinct when the time of
trap formation is determined. The most common way of determining the time of
formation of structures is based on the environment of lithofacies formation, as
proposed by Belousov in 1942. Unfortunately, the restrictions of the paleotectonic
technique proposed by Belousov (1942) are usually neglected. They include, in
particular, the limitations of the lateral size and the nature of facies. As a result, the
paleotectonic analysis of the formation of structures is reduced to the comparison of
thicknesses, which does not reflect either the timing or conditions of the structure
formation. As a consequence, different geologists arrive at quite different
conclusions regarding the same region.
The time of formation of a fault trap is bracketed by the time of the fault
formation. The formation time of a stratigraphic trap is determined by the age of
immediately overlying sediments.
An accumulation is formed as a result of migration of hydrocarbons. Migration
by buoyant force can begin only if there is a regional tilt. The steeper the slope, the
stronger the buoyant force. Could this be the reason for an early formation of oil
accumulations over the geosynclinal flank of the foredeeps?
9.4.2. Mineralogic Technique
The essence of the mineralogic technique is determining the sequence of post-
depositional alterations within the oil-saturated reservoir and within the same
reservoir outside the OWC. Liquid hydrocarbons cause retardation of catagenic
processes within the accumulation of hydrocarbons, compared with those outside of it.
Important in the application of this technique is to determine the morphologic
relations between the oil and authigenic minerals, as well as to find oil in the voids
having resulted from the dissolution of carbonates and sulfates at various stages of
catagenesis. The position of an old oil–water contact may be identified from the
mineralogical data (Sakhibgareyev, 1985), in order to determine the history of
accumulation.
TIME OF FORMATION OF HYDROCARBON ACCUMULATIONS 169

A negative aspect of this technique is usually obtaining overblown results due to
the incomplete conservation of the catagenetic processes in the presence of liquid
hydrocarbons.
9.4.3. Helium–Argon Technique
The helium–argon technique was developed by Savchenko in 1935 and published
in 1977. The technique is based on the ratio of the radioactive helium and argon of
cosmic origin of gases dissolved in water: t ¼ 77.1 He/Ar� 106, where t is the time
the water resides in rocks and He/Ar is the ratio of their contents in water in %, by
vol. The technique was improved in 1950 by Kozlov (taking the solubility into
account) and in 1955 by Cherepennikov (in: Eremenko and Chilingar, 1996)
(introduction of correction coefficients). Critical analysis by V. P. Yakutsina and V.
V. Tikhomirov (in: Eremenko and Chilingar, 1996) showed that helium and argon in
gases and water have several origins. Besides, the error in determining the He/Ar
ratio can exceed 60%.
9.4.4. Determination Based on the Composition of Oil Fractions with Boiling Point
Below 2001C
The technique based on the composition of oil fractions with boiling point below
2001C was introduced by A. N. Reznikov (1967, in: Eremenko and Chilingar, 1996)
and is based on the catagenetic transformation of oil:
Coil ¼ fAP3=N4 (9.3)
where Coil is the degree of catagenic transformation of oil; A, P, and N are the
contents of aromatic, paraphinic, and naphthenic hydrocarbons (in %). Coil ranges
from fractions of 1% in the Cenozoic oils to a few dozens of percent in the oils from
Paleozoic deposits.
The age of oil as determined by this technique reflects the time duration that the
oil resided within an environment at certain temperature interval. The effects on the
results obtained by the source organic matter and its catagenetic alteration, as well as
the effects of weathering on the generated oil, are unknown.
A number of techniques (mostly physical) were developed to help determine the
time of formation of oil and gas accumulations.
9.4.5. Volumetric Technique
The volumetric technique is based on the Boyle-Marriotte and Clapeyron
equations and has been proposed by A. Levorsen in 1958. Inasmuch as the reservoir
pressure by the end of formation of accumulation is assumed to be hydrostatic,
H f=g ¼ ðP0V 0=PfV f ÞðT fZf=T0Z0Þ (9.4)
where Hf is the thickness of overburden, Pf and P0 are the reservoir pressures at the
time of formation of accumulation and at present, Tf and T0 are the temperatures at
FORMATION OF HYDROCARBON ACCUMULATIONS170

the time of formation of accumulation and at present, and Zf and Z0 are the gas
compressibilities at the time of formation of accumulation and at present.
The calculation is conducted in two stages. At the first stage, the ratio TfZf/T0Z0
is assumed to be equal to 1 due to the unknown value of the numerator. The time of
formation of accumulation is determined from the stratigraphic section at depth Hf.
At the second stage, a more accurate Hf value is determined taking into account the
Tf and Zf values as determined from the previous Hf calculation.
This method was refined by K. M. Marchenko, V. A. Kirov, V. A.
Chakhmakhchev, etc. (in: Eremenko and Chilingar, 1996), but the imprecision due
to the ‘‘trial and error’’ approach has not been eliminated. Most acceptable results
were obtained when determining the accumulation age in several closely positioned
accumulations within the same productive formation (especially, if they had been
formed according to the differential entrapment principle).
9.4.6. Saturation Pressure Technique
The gas-saturation pressure method has been proposed by Gussow in 1953. The
assumption is that the gas-saturation pressure at the time of formation of
accumulation has been hydrostatic. With increasing overburden pressure, the
reservoir pressure increased, whereas the saturation pressure remained the same. The
time of formation of accumulation is determined using the depth of reservoir, where
the reservoir pressure is equal to the saturation pressure. The determinations are
usually made using cross-sections.
A drawback of this technique is the assumption of equality between the saturation
and reservoir pressures at the time of formation of accumulation. As previously
mentioned, at least 40% of the liquid hydrocarbons formed are initially under-
saturated.
The accumulations begin to be destroyed at the moment they begin to form. Their
very existence is a temporary phenomenon related to the dominance of accumulation
processes over those of destruction. Gas diffusion is associated with all gas
accumulations. The calculations by V. A. Sokolov and V. F. Linetsky (personal
communication, 1994) showed that any commercial gas accumulation (at a depth of
1,000m and initial pressure of 10MPa) would be destroyed through diffusion of gas
within a few million years. Apparently, gas accumulations are preserved due to their
replenishment. The effect of gas diffusion is much weaker in oil accumulations, but
still may cause substantial alterations in oil composition.
Eruptions cause significant destruction of oil and gas accumulations. This is
evidenced by the mud volcanoes (Buryakovsky, 1993; Buryakovsky et al., 2001) and
other massive oil and gas seeps associated with faults (Khilyuk et al., 2000). As
shown in Chapter 3, the fault zones are often less permeable than the adjacent
reservoirs. A fault may act as a seal in one location and may be highly permeable in
another location along its length. Also, permeability of fault zone can change with
time depending on the geologic conditions (including thermodynamic and
geochemical). Finally, the oil composition can change within the weathering zone
or the accumulation can be totally destroyed by erosion.
TIME OF FORMATION OF HYDROCARBON ACCUMULATIONS 171

This page intentionally left blank
172

Chapter 10
CLASSIFICATIONS OF OIL AND GAS ACCUMULATIONS
10.1. CLASSIFICATION OF TYPES OF OIL AND GAS ACCUMULATIONS AND TRAPS,
RESERVES, FLUID QUALITY, PRODUCTION RATES
Oil and gas fill the pores, vugs, and fractures in reservoir rocks. Usually, not the
entire reservoir but only its part called ‘‘trap’’ is filled with petroleum. There are
numerous classifications of traps depending on their relationships with the reservoir,
lithology, rock origin, tectonics, trap size and shape, and the type of energy dis-
tribution. Criterion of usefulness of a classification or a definition is its applicability.
Particular purpose, limited in scope, gives rise to incomplete classifications. The
development of a natural classification for the traps and/or reservoirs is very dif-
ficult, first of all, due to the lack of knowledge about the formation of hydrocarbon
accumulations at high pressures and temperatures.
The most definitions of a trap include the following concepts:� trap is a part of the reservoir where oil and gas can accumulate (Levorsen, 1954),� where relative equilibrium of movable components is maintained by the gravity
(Brod and Eremenko, 1950),� where the potential of oil and gas locally reaches a minimum, and� which is limited by a closed equipotential surface.
With increasing temperature and pressure, the effect of gravity on the fluid dis-
tribution decreases.
The existing trap classifications can be divided into three groups.
The first and the most common classification group is called the ‘‘Oil and gas
classifications’’ by many authors. Yet, these authors do not stress the parameters
(characteristics) of the accumulations, but instead of the crustal elements in which
they are housed, i.e., traps (their genesis, structure, shape, and type of reservoir).
The second classification group associate the trap shape with the conditions of its
formation: folds, faults, stratigraphic unconformities, lithological barriers, and
combinations of the above.
Finally, the third group of classifications stressed the hydrodynamic head.
In every case, the trap is considered to be a part of the reservoir, with substantial
emphasis on its geometry, which is undoubtedly important when selecting locations
for exploratory wells.
The accumulation represents a temporary accumulative stage against the back-
ground of migration, and the trap forms such part of the Earth’s crust (reservoir),
where this accumulative stage may occur under certain geologic environments (in-
cluding the thermobaric and thermodynamic conditions).
Not considering the genetic issues, the trap should be characterized by the� type of the reservoir it is associated with (including the lithology),
173

� shape, lateral extent, and height in relation with the positions of possible hydro-
carbon cross-flows, and� type of the barrier restricting the migration, which at the same time defines the
accumulation boundaries.
Any trap classification reflecting these conditions can be considered practical.
The accumulation of hydrocarbons, filling the trap, is an elementary accumula-
tion of hydrocarbons, the major parameters of which are their quality and quantity
and the accumulated energy. Besides, additional parameters must provide necessary
information for a successful appraisal and subsequent development of the accumu-
lation. Such parameters include the degree to which the traps are filled and the
nature of the gas–oil–water contacts. The former depends on the environment of
trap formation and the tectonic evolution of the basin. In many cases, certain pat-
terns in the degree to which the traps are filled can be identified in a basin for a
particular stratigraphic interval. This may be successfully used in exploration and
estimation of resources of a particular stratigraphic sequence.
The locations of the gas–oil–water contacts are important during the exploration
and development phases. The knowledge of the tilt of oil–water contact, if present,
may prevent drilling of unnecessary wells. The task gets more complicated if there
are no definite contacts, replaced by transitional zones. Besides, the contour must be
closed (also against a barrier).
If the amount of hydrocarbons in an accumulation is sufficient to conduct pro-
duction, the accumulation is called commercial. This concept is uncertain and de-
pends on many factors, such as the geographic location, available infrastructure,
depth, quality of hydrocarbons, and the presence of beneficial or harmful admix-
tures.
Most common classifications of the size of oil and gas accumulations in the US
and Russia are presented in Table 10.1. This table shows that in the US greater effort
is devoted to the development of small accumulations than in Russia. The reasons
for that include the following:
1. A more advanced oil and gas-producing equipment in the US enables to produce
economically from the smaller accumulations.
2. Smaller accumulations are neglected in Russia, and only larger accumulations are
developed because of economics and lower demand of oil than in US.
The classification of the accumulations by the average rate of production is also
quantitative. Kontorovich et al. (1975), for example, proposed the classification
presented in Table 10.2.
The class boundaries are tentative and may be changed to fit a specific situation
for a particular petroliferous province. It is important to keep in mind the fact
that the flow rates reflect not only the natural conditions of the accumulation
(lithology, fluid properties, energy of accumulation, etc.), but also the technology
(development techniques, well facilities, etc.). Besides, the boundary between the
low-rate and non-commercial classes is determined by the economical–technical
reasons. The price of the oil and gas determines the position of such boundary, and
the political situation (e.g., embargo) may impose the development of even very
small accumulations.
CLASSIFICATIONS OF OIL AND GAS ACCUMULATIONS174

10.2. CLASSIFICATION OF HYDROCARBON ACCUMULATIONS BASED ON PHASE
RELATIONSHIPS
An important factor in the qualitative characterization of an accumulation is the
phase relationships of the fluids present. This is more complicated, however, than
just the identification of liquid (oil) and gaseous (gas) phases.
10.2.1. Gas accumulations
Free gas accumulations containing only C1–C4 hydrocarbons are rare and en-
countered at shallow depths. As mentioned in Chapter 6, as the temperature and
TABLE 10.2
Classification of oil and gas accumulations on the basis of production rate
Class Accumulation category Production rate
Oil (TDa) Gas (CMDb)
1 High rate 4100 41,000,000
2 Medium rate 10–100 100,000–1,000,000
3 Low rate 2–10 20,000 – 100,000
4 Non-commercial o2 o20,000
aTD ¼ tons/day.bCMD ¼ m3/day.
TABLE 10.1
Classifications of oil and gas accumulations on the basis of size
Accumulation category Oil reserves (MMTa) Gas reserves (BCMb)
United States
A 46.85 48.5
B 3.42–6.85 4.2–8.5
C 1.37–3.42 1.7–4.2
D 0.14–1.37 0.2–1.7
E o0.14 o0.2
F Non-commercial
Russia
Unique 4300 4500
Large 300–30 500–30
Medium 30–10 30–10
Small o10 o10
aMMT ¼ million tons.bBCM ¼ billion cubic meters.
OIL AND GAS ACCUMULATIONS AND TRAPS 175

pressure increase, the retrograde phenomena cause dissolution in the gas of heavier
hydrocarbons (up to C15). Such accumulations become gas-condensate accumula-
tions. The assignment of an accumulation to the free gas (dry) or gas-condensate
category is highly important for the production purposes.
In order to prevent the loss of condensate in the reservoir, gas-condensate ac-
cumulations must be developed with pressure (desirably also temperature) mainte-
nance. The boundary between the dry gas and gas-condensate accumulation is
tentative and is set most often at 20–250 cm3 of condensate per 1m3 of gas. There is
an easy transition from gas to condensate (or vice versa) type of accumulation with
changing temperature and pressure. When the price of gas depends on its heating
value, a more detailed classification based on the condensate content can be prepared
for practical purposes.
The produced gas always contains some water. The water may be the water of
condensation (i.e., water dissolved in gas together with the heavier hydrocarbons),
and may be carried by the flowing gas. There are numerous sources of the conden-
sation water: (1) the capillary and ‘‘submelted’’ water (see Chapter 4); (2) beyond-
the-contour water; (3) bottom water; and (4) water coming from the water-saturated
lenses and interbeds within the gas-bearing formations. Even a slight decrease in the
pore throats of clastic reservoir rocks may create water blocks. Removal of water
blocks may occur as the reservoir conditions change during the development and
production.
The water may be retained for a long time within the fine-grained hydrophilic
lenses or interbeds; however, the water may begin to enter the flowing gas as the
pressure differential between the lenses (interbeds) and producing formation in-
creases. Mathematical models have been developed for calculating such phenomena.
As the temperature increases (due to increasing depth of burial or, rarely, due to
technological reasons) the interfacial tension decreases, which may result in an in-
crease in production water-cut. Water coning and fingering can occur in the water-
drive gas accumulations, i.e., accumulations underlain by water. Certain gas pro-
duction techniques must be designed to prevent this from occurring.
The nature of gas accumulation’s contact with the underlying fluids is of the
utmost importance. If the accumulation is totally underlain by water, it is called a
single-phase gas accumulation (although two phases, liquid and gas are actually
present). At shallow depth with a temperature of 60–801C and pressure below
10MPa, the accumulation has a rather clear-cut gas–water contact. When the tem-
perature increases to 120–130oC and if the gas enters the contact zone at a speed
greater than that of its dissolution in water, a gas–water emulsion forms (in the
transition zone). Sometimes, such a transition zone can constitute the entire accu-
mulation. Although the emulsions have been known for a long time, the emulsion-
type accumulations as a separate type was first identified by Kontorovich et al.
(1975, pp. 426–427).
As the temperature further increases beyond 1201C and the pressure increases
beyond 20MPa (critical pressure of water ¼ 21.8MPa), the water solubility in gas
drastically increases (retrograde evaporation and a decrease in interfacial tension).
These conditions are unfavorable for the preservation of gas–emulsion or gas–water
CLASSIFICATIONS OF OIL AND GAS ACCUMULATIONS176
accumulations (rims). The gas under these conditions, even if not underlain by oil,
extracts enough hydrocarbons from the reservoir rocks (primary condensate) to be
considered as a gas-condensate. A transition zone between the gas-condensate and
the water is a gas–water solution, which is not an emulsion because the droplets and
their bounding films are absent. Such a transition zone may constitute the entire
accumulation.
Thus, the following transformations of gas accumulations can occur with in-
creasing formation temperature and pressure: gas accumulation-gas-condensate
accumulation with an emulsion (gas–water) fringe-emulsion (gas–water) accumu-
lation-gas–water solution.
10.2.2. Oil accumulations
As with gas accumulations, oil occurs always with water. To be accepted for
refining or pipeline delivery, the oil should be ‘‘water-free,’’ i.e., water content must
be below 2%. The latter is a tentative boundary, which can be changed.
As in the case of gas accumulations, beside a small content of dissolved water,
other types of water may be present at moderate temperatures (no higher than
80–100oC) including: (1) capillary water; (2) ‘‘submelted’’ water; (3) water from
water-saturated lenses and interbeds within the accumulation; (4) water from water
coning and fingering; and (5) the bottom-water or edge-water. Influx of water into
the accumulation from the overlying or underlying aquifers due to poor cement job
and casing corrosion is not considered here.
At low and moderate temperatures, the oil–water contact is usually clear-cut
(distinct).15 If, however, the temperature is higher than 801C (sometimes lower,
depending on the water and oil composition), an emulsion forms the transition
zone. Its thickness can vary and can even comprise the entire accumulation, i.e.,
a stable emulsion is present throughout the entire accumulation (Kontorovich et al.,
1975).
Gas is always present in oil and even after a long period of weathering the oil still
contains gas. As an example, some formations of the Productive Series in Azerbaijan
(Buryakovsky, 1974; Buryakovsky et al., 2001) are exposed at the surface in the
Yasamaly Valley of the Absheron Peninsula. Despite a long (a few tens of thousands
of years) erosion, the hydrocarbon gas is continually seeping from these formations
together with oil (this prevents an open-pit development).
The pressure under which dissolved gas resides in the oil is of importance. When
the pressure is close to the atmospheric pressure, some gas is released at the free
surface of oil. This gas is usually non-commercial. Gas-saturated oil remains a sin-
gle-phase liquid until the saturation pressure (i.e., the pressure of the dissolved gas)
reaches the reservoir pressure, after which a gas cap can form.
CLASSIFICATION OF HYDROCARBON ACCUMULATIONS 177
15If anaerobic bacteria are present, they may destroy the oil–water contact and form a peculiar transition
zone. In such a case, a clear oil–water contact disappears.

Gas in a gas cap can behave differently (see Chapter 6):
(1) At low and moderate pressure, the gas solubility in oil is governed by the
Henry’s law.16
(2) At higher temperature and pressure (60–801C and 8–10MPa), retrograde phe-
nomena begin to occur, and the gas in a gas cap is converted into the gas-
condensate state. As mentioned in Chapter 6, the boundary beyond which the
retrograde phenomena occur is determined not just by the temperature and
pressure, but also by the chemical composition of oil and gas.
As the basin subsides, the nature of the gas–oil and oil–water contacts changes.
Clear (distinct) contacts are replaced by transition zones. The transition zones show
the high oil content in gas or water; then, they are replaced with emulsions which, in
turn, are replaced by gas–oil solutions involving the entire accumulation.
The issue of the phase state of fluids in the transition zone is still somewhat open.
It is possible that the emulsion forms only when the fluids enter the borehole (due to
the turbulent flow of fluids when they enter the well). Such accumulations have been
called ‘‘the transitional stage accumulations’’ (Vasilyev et al., 1966).
A further subsidence (temperature of about 280–3501C) results in the unlimited mu-
tual solubility of hydrocarbons and water. The upper gas–oil (or vapor–oil) transitional
zone merges with the lower, water–oil transitional zone, forming a single accumulation.
The unlimited mutual solubility is an indication that the fluids are in the super-
critical state or close to it. A drastic increase in the mutual solubility of the fluids that
have been insoluble in each other before occurs on approaching the critical point.
This is observed in chemically different oils and water even at 120–1501C and be-
comes pronounced at 1801C.
Oil accumulations that are undersaturated with gas may approach (through the
vapor phase) the described accumulation type. Apparently, they should be called
‘‘the critical-state accumulations’’. The liquid phase and vapor phase merge at the
critical point so that one phase cannot be distinguished from the other. Also, in-
terfacial tension disappears, diffusion stops, density and composition fluctuations
appear, relative permeabilities significantly decrease (there are no phases, just mol-
ecules of different sizes and composition), etc.
The boundaries of such a system are determined only by the available space, by
the thermodynamic conditions, and by the direction of migration (the availability of
migration avenues and by the system’s energy).
Inasmuch as the critical-state fluid system is characterized by the absence of
distinct phases and of the gravity separation, the major premises of the gravity
hypothesis of the formation of hydrocarbon accumulations and its practical appli-
cations are negated. The hydrocarbons may not move updip, toward the anticlinal
crests. The absence of phases and of interfacial tension makes the concept of the
hydrodynamic trapping unrealistic. The absence of capillary pressure converts some
seals into reservoirs.
16According to the Henry’s law, the amount of a gas absorbed by a given volume of liquid at a given
temperature is directly proportional to the pressure of gas. This law, which was first formulated in 1803 by
the English physician and chemist William Henry, holds only for dilute solutions and low gas pressures.
CLASSIFICATIONS OF OIL AND GAS ACCUMULATIONS178

The above discussion may explain the unsuccessful oil and gas exploration efforts
at great depths in many cases. Usually, the wells have been drilled over the crests of
the structures that may not be the best location for finding ‘‘critical-state’’ accu-
mulations, in the absence of fluid gravity separation. Most often, the well tests have
been conducted in sandstones. Yet, the reservoir rocks of the ‘‘critical-state’’ accu-
mulations may be argillaceous rocks, whereas the sandstones may have acted as
seals. Large pressure drawdown had been usually applied to cause the flow of fluids,
which may have closed the flow channels (pore throats and canals) around the
borehole due to the overburden pressure. In the case of fluid flow, an attempt is
made to maintain the pressure (which was already much higher than critical),
whereas the temperature should have been maintained.
The above discussion may explain the well test results in superdeep wells (around
30,000 ft or 10,000m), i.e., mostly weak flows of gas-cut water (sometimes oil-cut)
have been obtained. Inasmuch as the temperature and pressure change near the
boreholes, the flow conditions change (fractures close) and different phases separate
out. Thus, the main exploration tools are based on the state of system and its energy,
and the measurements of density, electric conductivity, seismic velocity, etc., may
become very important. A further subsidence of the accumulation, at very high
temperatures and pressures will result in the total decomposition of the system. It is
difficult to estimate the temperature at which this may occur; it may reach more than
10001C at pressures of hundreds of MPa’s.
As far as the classification of oil accumulations based on the phase transforma-
tions are concerned, two branches are present that merge in the ‘‘critical-state’’
accumulations.
Fig. 10.1 shows phase transformation at a relatively mild (Fig. 10.1a) and harsh
(Fig. 10.1b) conditions of temperature and pressure. The presence of a clear-cut contact
between the oil and gas is indicated by the K1-K2 line in Fig. 10.1a. On the other hand,
Fig. 10.1b shows gas–oil transitional zones (dashed lines) with definite contacts being
absent. Transitional zones to water (4, 5 and 6) appear at the base of accumulations.
With passage of time and as the environment becomes harsher, first a gas–oil tran-
sitional zone (3) and then the oil–water transitional zones appear. This is due to the
better mutual solubility of hydrocarbon gases and oil, compared to hydrocarbon gases
and water. The appearance of the oil–gas transitional zone is possible at temperatures
much below 120oC (i.e., within the limits shown in Fig. 10.1a), depending on the oil
and gas composition. Light paraffinic oils (densityo0.8 g/cm3) and wet gases can form
a transitional gas–oil zone at rather mild temperatures and pressures.
Zone 1a widens substantially due to vapor generation. The very existence of Zone
1 at higher temperature and pressure (Fig. 10.1b, oil without dissolved gas or vapor)
is in doubt. Zone 2 (dry gas) disappears and is replaced by the gas-condensate Zone
2a. The condensate content within this zone may vary significantly. If the ‘‘donor’’
oil is absent, the gas will dissolve bitumens from the rocks (‘‘primary condensate’’:
Starobinets et al., 1986; Chakhmakhchev, 1982). A complex gas–oil–water zone
(Zone 6) appears under conditions shown in Fig. 10.1b. As the conditions become
even more rigid (more severe), this zone becomes the major one, gradually forming
the ‘‘critical-state’’ accumulations.
CLASSIFICATION OF HYDROCARBON ACCUMULATIONS 179
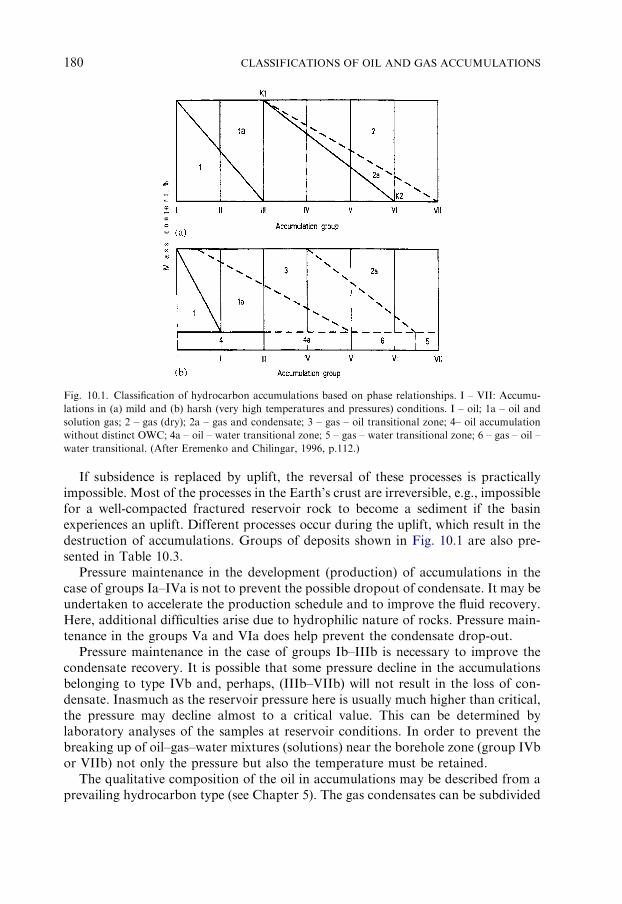
If subsidence is replaced by uplift, the reversal of these processes is practically
impossible. Most of the processes in the Earth’s crust are irreversible, e.g., impossible
for a well-compacted fractured reservoir rock to become a sediment if the basin
experiences an uplift. Different processes occur during the uplift, which result in the
destruction of accumulations. Groups of deposits shown in Fig. 10.1 are also pre-
sented in Table 10.3.
Pressure maintenance in the development (production) of accumulations in the
case of groups Ia–IVa is not to prevent the possible dropout of condensate. It may be
undertaken to accelerate the production schedule and to improve the fluid recovery.
Here, additional difficulties arise due to hydrophilic nature of rocks. Pressure main-
tenance in the groups Va and VIa does help prevent the condensate drop-out.
Pressure maintenance in the case of groups Ib–IIIb is necessary to improve the
condensate recovery. It is possible that some pressure decline in the accumulations
belonging to type IVb and, perhaps, (IIIb–VIIb) will not result in the loss of con-
densate. Inasmuch as the reservoir pressure here is usually much higher than critical,
the pressure may decline almost to a critical value. This can be determined by
laboratory analyses of the samples at reservoir conditions. In order to prevent the
breaking up of oil–gas–water mixtures (solutions) near the borehole zone (group IVb
or VIIb) not only the pressure but also the temperature must be retained.
The qualitative composition of the oil in accumulations may be described from a
prevailing hydrocarbon type (see Chapter 5). The gas condensates can be subdivided
Fig. 10.1. Classification of hydrocarbon accumulations based on phase relationships. I – VII: Accumu-
lations in (a) mild and (b) harsh (very high temperatures and pressures) conditions. I – oil; 1a – oil and
solution gas; 2 – gas (dry); 2a – gas and condensate; 3 – gas – oil transitional zone; 4– oil accumulation
without distinct OWC; 4a – oil – water transitional zone; 5 – gas – water transitional zone; 6 – gas – oil –
water transitional. (After Eremenko and Chilingar, 1996, p.112.)
CLASSIFICATIONS OF OIL AND GAS ACCUMULATIONS180

according to the chemical composition of hydrocarbons and quantity of H2S and,
sometimes, mercury (e.g., in Germany). Noteworthy is the high H2S content in deep
accumulations. For example, the H2S content in gas in the Astrakhan Field of
Russia (at a depth of 3000–4000m) reaches 24%.
Oil and oil-gas accumulations may be subdivided according to the nature of
admixtures in the oil, water, and gas. The most important admixture is sulfur and its
compounds.
An important parameter in producing oil is its viscosity. One can use the fol-
lowing classification: low-viscosity oil — viscosityo5mPa s, medium-viscosity oil —
5–10mPa s, high-viscosity oil — 10–30mPa s, and very high-viscosity oil — greater
than 30mPa s.
When discussing the formation of hydrocarbon accumulations, many authors
gave preference to gravity forces. It should be remembered, however, that any oc-
currence of gravity in the Earth’s crust is unavoidably accompanied by the elastic
phenomena. Inasmuch as a rule, all these forces are active in the reservoir, most
common drives are of a mixed nature. But the most important drives are the water
drive and the elastic drives of free and solution gas.
Various geochemical and bacteriological processes are most active near the
oil–water and gas–water contacts. Sulfate reduction and underground hydrocarbon
oxidation is possible there. Although the most obvious hydrocarbon oxidation in oil
accumulations occurs near the oil–water contacts, it is possible that the oil biode-
grading occurs within the entire accumulation volume (Petrov, 1984).
TABLE 10.3
Accumulation groups based on phase relations
Mild environment (a) Severe environment (b)
I. Oil accumulations with no dissolved gas;
oil–water contact is distinct.
I. Oil accumulations with no dissolved gas
(possibly nonexistent in this environment).
II. Oil accumulations with dissolved gas
(pres4psatur). Oil–water contact is distinct.
II. Oil accumulations with dissolved gas. Oil–water
contact is not distinct.
III. Oil accumulations saturated with gas
(pres ¼ psatur). Oil–water contact is distinct.
III. Oil accumulations saturated with gas
(pres ¼ psatur). Gas–oil transition zone appears in
the upper portion. Contact with water is not
distinct.
IV. Oil accumulations with gas cap (pres ¼ psatur).
Gas contains some condensate. Oil–water contact
is distinct.
IV. Oil accumulations; transition into gas–oil
mixture in the upper portion. Oil–water transition
zone instead of oil–water contact.
V. Gas accumulation with condensate underlain by
oil. Oil–water contact is distinct.
V. Gas accumulation with condensate. There is a
transition into oil–gas zone down the section.
Oil–water transition zone instead of oil–water
contact. Gas–oil–water zone at the base.
VI. Gas accumulation rich in condensate.
Gas–water contact is distinct.
VI. Gas accumulation with condensate and with
rim of oil–gas mixture.
VII. Gas accumulation. VII. Gas accumulation. Gas–water mixture
constitutes transition to water.
CLASSIFICATION OF HYDROCARBON ACCUMULATIONS 181
Often, there is some decrease in the oil and especially gas density in the clastic rocks
with increasing clay content. This statement may be erroneous, however, due to the
effect of relative permeability when fluids move from the reservoir into the wellbore.
Light and some heavy hydrocarbons dissolve in the reservoir edge water. De-
pending on the direction of groundwater movement, front and rear effects may occur
(see Chapter 4). One has to remember, however, that oil–water and gas–water tran-
sition zones may form in a more severe (high temperature and pressure) environment.
The composition of oil and gas may be affected by the presence of faults that may
be either fluid conductors or barriers. These properties, however, may change along
the fault and in time, i.e., different segments of the same fault may serve as either a
seal or a fluid conductor, which may change with time. The faults can give rise to the
mixing of fluids from different horizons, the penetration of chemically or bacterially
aggressive water into the accumulation, and a partial or complete loss of hydro-
carbons. That is why it is difficult to define clear patterns in the hydrocarbon ac-
cumulations in relation to faults. Levorsen (1954) noted that the accumulations are
most commonly formed at the hanging wall and only occur at the footwall of faults if
there is an additional anticlinal deformation there. As far as the reverse faults are
concerned, a somewhat uncertain inverse correlation was found to exist, i.e., the
accumulations are more frequently found at the footwall.
The time of fault formation may play a crucial role in the formation of hydrocarbon
accumulations. It is interesting to note the role of faults formed during catagenesis
(epigenesis) (sometimes the faults are of hydraulic origin). In the low-permeability
rocks such faults are not necessarily represented by a continuous surface but rather by
an intricate network of channels. The latter do not manifest the disruption of rock
integrity but rather accommodate the fluid breakthrough through the existing channel.
In this connection, Savchenko (1987) proposed two terms: the breakthrough pressure
and the pinch-out pressure (pressure necessary to close the channel).
Based on the experimental data, the hydraulic fracture pressure and, even more
so, the breakthrough pressure is always higher than the hydrostatic pressure and
lower than the total overburden pressure. On conducting hydraulic fracturing, it is
necessary to overcome the effective pressure and the fracturing strength pressure
(Young’s modulus, which is very low for the rocks). If the rock density is 2.5 g/cm3
and the water density is 1 g/cm3, the hydraulic fracturing pressure will start at about
1.5 times the hydrostatic pressure.
Breakthroughs and pinch-outs are natural valves controlling temperature and
pressure in a reservoir. When a fluid breaks through and leaves the reservoir, some
heat is removed thereby lowering the temperature. The entrance of the fluid into
another reservoir may create the temperature and/or pressure anomaly in that res-
ervoir. This is one of the reasons for the hydrocarbon accumulations to remain
within the estimated temperature and pressure range. The existence of reservoirs that
are not amenable to the natural hydraulic fracturing or breakthrough is theoretically
plausible. Accumulations with pressure equal to or temporarily even exceeding the
total overburden pressure (by the amount of tensile strength — Young’s modulus)
could have formed. This, however, is the domain of volcanology, and such accu-
mulations are yet to be discovered.
CLASSIFICATIONS OF OIL AND GAS ACCUMULATIONS182

Self-regulation of the temperature and pressure in an accumulation is one of its
most remarkable features. Similar phenomena occur in the upper portion of the
accumulation due to the surplus pressure (overpressure). It is especially true for the
gas accumulations. As a rule, some increase in the temperature and the heat flow is
recorded in the accumulations. This can be explained by the heat anisotropy of rocks
over the anticlines.
10.3. CLASSIFICATION OF OIL AND GAS RESERVOIRS BASED ON DRIVE MECHANISM
The classification of oil and gas reservoirs by producing mechanism17 is imper-
ative for a careful study of the technology of oil and gas recovery.
The potential energy sources available to move the oil and gas to the wellbore
include the following:
(1) gravitational energy of the oil, acting over the vertical distance of the productive
column,
(2) energy of compression of the free gas in the gas cap or within the oil-producing
section,
(3) energy of compression of the solution gas dissolved in the oil or the water,
(4) energy of compression of the oil and water in the producing section of the
reservoir,
(5) energy of compression of the waters peripheral to the production zone,
(6) energy of capillary pressure effects,
(7) energy of the compression of the rock itself.
All these forces are active during the productive life of a reservoir.
The predominant producing mechanism operating to produce the oil and gas
reflects the relative influence each energy sources has on reservoir behavior. The
major drive mechanisms are (1) solution-gas drive, (2) gas-cap expansion drive, (3)
water drive, and (4) gravity drainage. Each drive mechanism when effective in a pool
will give rise to a certain characteristic form of reservoir behavior. Although in
practice most pools behave in a manner that represents a combination (‘‘mix’’) of
two or more drive mechanisms, each mechanism will be described in the context of a
single-drive pool. The common characteristics of each drive mechanism can be dis-
cussed for clastic reservoirs having intergranular porosity and then placed in the
context of the observed behavior of carbonate reservoirs with other types of po-
rosity. The interest is centered on the record of performance: variation of oil, gas,
and water production rates, gas/oil and water/oil ratios, and reservoir pressure with
time. Movement of the water–oil contact and creation or expansion of a free gas cap
is also of great importance.
Natural drive mechanisms may be subdivided into the ones caused by the energy
intrinsic in the reservoir and by the energy external to the reservoir. The internal
energy is supplied by (1) gravity force, (2) pressure of free gas, (3) solution gas, and
17Originally prepared by H. H. Rieke, R. W. Mannon, G. V. Chilingar, and G. L. Langnes, in: Chilingar,
Mannon and Rieke, 1972. Also see Chilingarian et al. (1996, pp. 243–254).
CLASSIFICATION OF OIL AND GAS RESERVOIRS BASED ON DRIVE MECHANISM 183

(4) expansion of the compressed oil. The external energy is the pressure and elasticity
of the reservoir edge water and the elastic forces of the rocks. Figure 10.1 demon-
strates that the role of gravity drives declines from left to right. Outside the limits
shown in Fig. 10.1, in the ‘‘critical-state’’ accumulations the role of gravity force is
negligible, and the main active force is elasticity. A prolonged existence of the
‘‘critical-state’’ accumulations is possible only in the case of a strong preliminary
compression of fluids and rocks with the subsequent natural relaxation of stress in all
directions. Most favorable for the occurrence of the ‘‘critical-state’’ accumulations
are bedded (block-faulted) reservoirs. Gravity differentiation is more noticeable in
high column accumulations and at a relatively mild temperature and pressure. At
higher temperature and pressure, the effect of gravity is considerably lower on ap-
proaching the ‘‘critical-state’’ accumulations.
10.3.1. Solution gas drive
In solution gas drive, also called depletion drive, dissolved gas drive, or internal
gas drive, the major source to produce the oil and gas from a pool comes from the
evolution of dissolved gas from the oil with decline in pressure. No initial free gas
cap exists, and the free gas phase formed remains within the oil-producing section.
The reservoir is sealed off to a large extent from communication with contiguous
water zones by faults or permeability pinch-out. As a result, with declining pressure,
the water influx into the reservoir is minor.
Typical solution gas-drive performance is shown in Figs. 10.2 and 10.3. Initially,
there is no free gas phase and the instantaneous producing gas/oil ratio is equal to
the original solution gas/oil ratio. Except in case of undersaturated reservoirs, the
Fig. 10.2. Generalized performance of a solution gas-drive pool (after Torrey, 1961; courtesy of Prentice-
Hall, Inc.)
CLASSIFICATIONS OF OIL AND GAS ACCUMULATIONS184

Fig. 10.3. Performance of the Slaughter San Andres Limestone Pool in West Texas, under predominantly
solution gas drive (after Sessions, 1963; courtesy of AIME).
CLASSIFICATION OF OIL AND GAS RESERVOIRS BASED ON DRIVE MECHANISM 185

finite gas saturation quickly develops and continues to increase as depletion pro-
ceeds. At the time the gas saturation reaches the equilibrium value of 5–10%, the gas
phase has sufficient mobility and free gas is flowing to the wellbore along with the
oil. This results in a rather abrupt increase in the producing gas/oil ratio. The gas/oil
ratio continues to rise with increased gas saturation, reflecting the rapid increase in
gas flow rate and the attendant decrease in oil production rate. At a gas saturation of
20–30%, the flow of oil becomes negligible, and the gas/oil ratio reaches a peak and
then declines as the reservoir reaches the latter stages of depletion.
In undersaturated reservoirs, where the initial reservoir pressure is substantially
above the saturation pressure, the production mechanism is oil expansion. Under
these conditions, the producing gas/oil ratio will remain at a low level during the
time that the reservoir pressure is above the bubble-point pressure. It will approx-
imate the solution gas/oil ratio and ideally should actually decrease slightly as the
pressure falls, even though this is rarely observed in the field. The peak gas/oil ratio
before it begins to decline, reflecting ultimate reservoir depletion, will normally be
5–10 times as great as the solution gas/oil ratio.
In pure solution gas-drive pools with intergranular porosity, reservoir pressure
depends primarily on cumulative oil recovery. Neither reservoir pressure nor ulti-
mate oil recovery is sensitive to oil production rate, unless the production rate affects
the producing gas/oil ratio. A rapidly increasing gas/oil ratio, after equilibrium gas
saturation is reached, is characteristic of solution gas-drive pools in general. Re-
ducing the production rate will not serve to increase the ultimate oil recovery ap-
preciably. An exception to this rule is found when excessive drawdowns at individual
wells lead to excessive transient effects on the reservoir. Any tendency for the res-
ervoir to exhibit significant gravity drainage or water influx, or to form a secondary
gas cap, may make ultimate recovery sensitive to production rate.
Solution gas-drive performance is closely related to a number of physical pa-
rameters. The ratio of reservoir oil viscosity to reservoir gas viscosity (mo=mg), so-lution gas/oil ratio, formation volume factor, interstitial water saturation, and oil
and gas permeability relationships largely control performance. The close interre-
lationship among these parameters is indicated by the fact that a change in one
factor results in a change in one or more of the others. Some general and meaningful
observations can be made, however, regarding the effect of altering the value of a
single factor. As oil viscosity increases, there is corresponding rise in the instanta-
neous producing gas/oil ratio because of greater gas bypassing, which results in
lower solution gas-drive efficiency and lower oil recovery. Also, as the amount of gas
available to be in solution decreases, the oil recovery declines. Muskat (1944), how-
ever, found that doubling the solution gas/oil ratio resulted in only 10% increase in
ultimate recovery. The greater oil shrinkage at higher solution gas/oil ratios serves to
dampen somewhat the effect of increased oil solubility on oil recovery, but the
shrinkage effect is of only minor importance. An increase in the crude oil gravity
(1API) as an overall characteristic of the fluid system likewise results in an increase in
ultimate recovery. Again the effect is dampened at the higher gravity ranges owing to
the greater oil shrinkage, and the ultimate recovery will actually decrease with an
increase in oil gravity in the 40–501API range.
CLASSIFICATIONS OF OIL AND GAS ACCUMULATIONS186

10.3.2. Gas-cap drive
Oil pools with free gas caps are subject to a gas drive, which is external to the oil
zone and separate from the solution gas-drive mechanism. The oil expulsion mech-
anism is typically a combination of solution gas drive within the oil column plus the
added benefit of gas permeating and diffusing into the oil zone from the gas cap. The
idealized performance of a gas-cap-drive reservoir is presented in Fig. 10.4.
The decline in production rate and reservoir pressure is not as rapid as in solution
gas-drive reservoir. The gas/oil ratio performance is more favorable. Gas-cap-
drive reservoirs, however, are more sensitive to production rate than are solution
gas-drive pools.
Wells producing from intervals close to the gas cap must be produced at low rates
to prevent gas coning or recompleted to exclude these upper intervals. The overall
gas/oil ratio performance largely reflects such procedures. The performance of the
Goldsmith San Andres Dolomite Pool in West Texas (Fig. 10.5) early in its history
typifies gas-drive performance with a gradual increase in gas/oil ratio. The oil pro-
duction is curtailed, and no decline is evident.
Some gravity segregation of oil and gas takes place in virtually every gas-cap-drive
reservoir. More pronounced fluid segregation will promote the expansion of the gas
cap and downdip movement of the oil, with resultant higher oil recoveries. The size
of the gas cap will also affect the oil recovery. Normally, the thicker the gas cap, the
greater is the ultimate recovery. Notable exceptions are carbonate pools in the
Acheson–Homeglen–Rimbey reef trend, Alberta, Canada, which have large gas caps
underlain by thin oil bands. The estimated ultimate oil recoveries under primary
production are often very low (5–10%) owing to excessive gas and water coning
Fig. 10.4. Idealized performance of a gas-cap-drive reservoir (after Torrey, 1961; courtesy of Prentice-
Hall, Inc.)
CLASSIFICATION OF OIL AND GAS RESERVOIRS BASED ON DRIVE MECHANISM 187

problems. A comparison of the performance of these pools indicates that in the case
of thicker oil bands and correspondingly thinner gas caps the oil recoveries are
higher.
10.3.3. Water drive
A reservoir of high permeability, such as the fissured or cavernous limestone, in
contact with an aquifer of broad areal extent will normally have an active water
drive. The degree to which the reservoir withdrawals are replaced by water deter-
mines the efficiency of the water-drive mechanism. In complete water-drive systems,
which are not common, substantially all the fluid withdrawals are replaced by in-
truding water. Some excellent examples of complete water-drive pools in carbonate
rocks are the Arbuckle Limestone fields in Arkansas and Kansas.
If the reservoir is initially undersaturated, the natural maintenance of the pressure
by water influx may result in oil production above the bubble-point pressure for an
extended period. During this time a small portion of the reservoir voidage resulting
from production (withdrawals) is replaced by expanding oil. Later in the life of the
reservoir a free gas phase may form, which provide part of the energy for the oil
expulsion. The existence of the free gas will depend largely on the rate of withdrawal
of fluids.
In all types of water-drive reservoirs, including complete water-drive systems, an
initial pressure decline provides the necessary pressure differential at the reservoir
boundary to include water movement into the reservoir. This initial rapid decline
preceding water influx is illustrated in general by Fig. 10.6. The Schuler (Reynolds),
Magnolia, Buckner, and Midway fields are Smackover Limestone pools, and the
Fig. 10.5. Typical gas-cap-drive performance, Goldsmith San Andres Dolomite Pool in West Texas (after
Craze, 1950; courtesy of AIME).
CLASSIFICATIONS OF OIL AND GAS ACCUMULATIONS188

Hobbs and Yates pools produce from the Permian limestone. The remaining pools
are sandstone reservoirs. All of the pools, except the solution gas-drive Schuler Jones
Sand Pool, which is included for comparison purposes, are subject to at least sub-
stantial, if not complete, water drive (Elliot, 1946).
To summarize water-drive performance, the producing zone first of all is in
contact with broad aquifer, normally of high permeability. Decrease in production
capacity is minor until water begins to be produced. The produced gas/oil ratio
is substantially constant. Figures 10.7 and 10.8 illustrate this type of perform-
ance. Recovery factor depends on reservoir–rock characteristics such as pore size
and fracture distribution, values for mobility ratio (kwmo=komw), and pool geometry.
The rate at which the pool is produced may also affect recovery, particularly if
the pool is subject to only partial water drive. Reservoir withdrawal rates greatly
in excess of the rate of water influx can lead to performance similar to that of
solution gas-drive pools. Free gas saturation in the reservoir can develop in the
more permeable section to the extent that incoming water will bypass tighter sections
to move preferentially into areas of high gas saturation, with a resulting loss in
recovery.
Fig. 10.6. Pressure-production performance of some water-drive pools (after Elliott, 1946; courtesy of
AIME).
CLASSIFICATION OF OIL AND GAS RESERVOIRS BASED ON DRIVE MECHANISM 189

Fig. 10.7. Idealized water-drive performance (after Torrey, 1961; courtesy of Prentice-Hall, Inc.)
Fig. 10.8. Performance of a water-drive pool, Excelsior D-2 reef pool. Excelsior Field, Alberta, Canada.
(Date from Alberta Oil and Gas Conservation Commission.)
CLASSIFICATIONS OF OIL AND GAS ACCUMULATIONS190

10.3.4. Gravity drainage
In oil pool subject to gravity drainage, the gravity segregation of fluids during the
primary production process is clearly evident in the production history. Oil migrates
down-dip to maintain down-structure oil saturation at a high level, and free gas
accumulates high in the structure. If a primary gas cap exists, it will expand as a result
of the segregation process. A pool without a primary gas cap will soon form a
secondary gas cap. Early in the life of the pool, the gas/oil ratios of the structurally
high wells will increase rapidly. A program of shutting-in wells with high gas/oil ratios
and of overall discreet control of individual well rates will provide for maximum
benefit from gravitational fluid movement. Fig. 10.9 indicates the two cases of the
generalized performance of a gravity-drainage pool without (Fig. 10.9A) and with
(Fig. 10.9B) such control. The oil gravity, permeability of the zone, and formation dip
dictate the magnitude of the gravity drainage. The combination of low viscosity and
low specific gravity (high API gravity), along with the high zone permeability and
steeply dipping beds, accentuates the down-structure oil movement. Typically, in
gravity-drainage pools the water influx is minor and the down-dip wells produce at
the lowest gas/oil ratios and have the highest oil recovery. In cases of strict gravity
drainage, a major portion of the recovery occurs after complete pressure depletion,
when gravity is the primary dynamic force moving the oil to the wellbore.
10.3.5. Combination-drive reservoirs
Some reservoirs may produce under the influence of one or more of the drives
discussed above. Throughout the life of a pool a sequence such as solution-gas
drive–gravity drainage-water drive may develop, or two different drives may be
competing simultaneously (e.g., water-drive reservoir with a primary gas cap).
Combination-drive reservoir may be further classified as open or closed, as proposed
by Babson (1965).
10.3.6. Open combination-drive reservoirs
The performance of open combination-drive reservoirs is affected by the method
of operation and by individual well and pool rates. This type of reservoir is in open
communication with the aquifer. Sources of energy include water drive, gravity
drainage, and gas expansion. In uncontrolled operations, a gas-expansion stage may
occur first, accompanied by a rising gas/oil ratio and declining pressure. A gravity-
drainage stage may come next at a reduced reservoir pressure. The effect of a mod-
erate water influx will frequently be evident in the latter stages of the life of the pool.
Curtailing production rate will cause a buildup in reservoir pressure as water influx
exceeds fluid withdrawals. The performance of the D-3 Pool, Redwater Field in
Alberta, Canada, which is a typical open combination-drive pool, demonstrates this
effect in Fig. 10.10.
In order to facilitate gravity drainage, the rate of water influx into the reservoir can
be reduced by maintaining high water-withdrawal rates from the high-water/oil-ratio
CLASSIFICATION OF OIL AND GAS RESERVOIRS BASED ON DRIVE MECHANISM 191
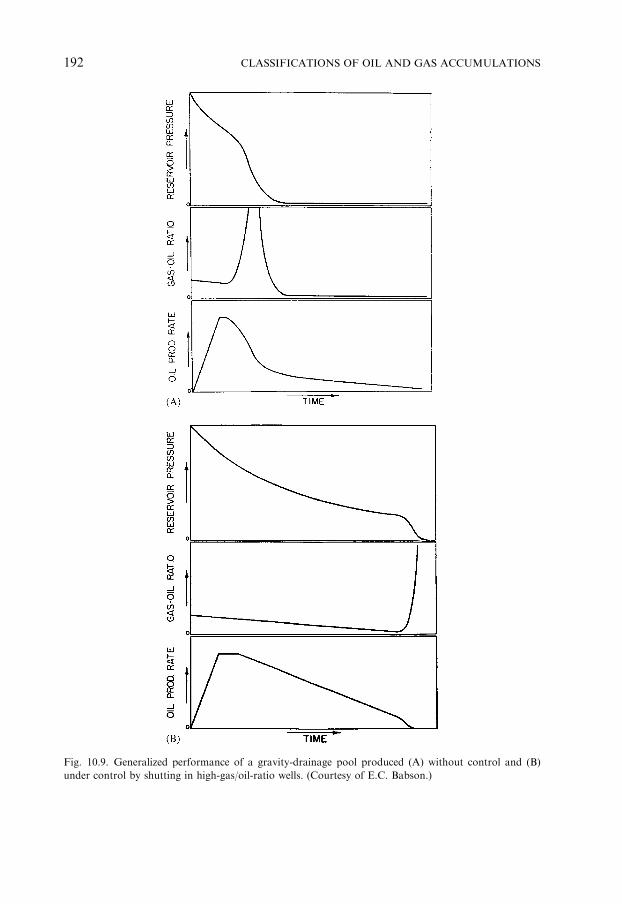
Fig. 10.9. Generalized performance of a gravity-drainage pool produced (A) without control and (B)
under control by shutting in high-gas/oil-ratio wells. (Courtesy of E.C. Babson.)
CLASSIFICATIONS OF OIL AND GAS ACCUMULATIONS192

wells close to the watertable and controlling the rates of the wells situated higher on
the structure. On the other hand, to take full advantage of the water influx, wells
producing at high water cuts should be shut in and rates on other wells carefully
regulated to reduce problems of non-uniform water influx and water coning.
The combined effect of water drive and an expanding gas cap serve as a very
effective oil displacement mechanism. For example, the Leduc D-3 Pool was under
both water and gas-cap injection, and flushing efficiencies in the gas cap and water
zone were about 80%.
When a pool with an initial free gas cap is subject to an active water drive, steps
must be taken to prevent oil movement into the primary gas cap. Oil encroaching
into the gas cap, even though subsequently displaced, will leave the residual oil
saturation, causing a substantial loss in ultimate recovery. Bruce (1944) cited the case
of the Mount Holly Pool in Arkansas, producing from the Smackover Oolite Lime-
stone. An oil recovery was �35% because of oil lost in the shrinking primary
gas cap. The recovery rate of the other Smackover pools in the area should be at
least 60%.
10.3.7. Closed combination-drive reservoirs
There is no significant water encroachment in closed combination-drive reservoirs
owing to the faulting and/or facies changes so common in carbonate rocks. A gas-
expansion stage is usually followed by gravity drainage. Reservoir pressure is low,
gas/oil ratios are falling, and updip wells produce very little fluid of any kind during
the secondary stage. The role that gravity drainage plays depends, of course, on the
net effect of the dip and permeability of the zone and the oil gravity, in addition to
the individual well rates. The control of production rates to allow for effective
Fig. 10.10. Performance of an open combination-drive pool, Redwater D-3 reef pool, Redwater Field,
Alberta, Canada. (Data from Alberta Oil and Gas Conservation Commission.).
CLASSIFICATION OF OIL AND GAS RESERVOIRS BASED ON DRIVE MECHANISM 193

gravity drainage is normally more critical than in the case of strict gravity-drainage
reservoirs because of a reduced tendency for downward oil migration. The gener-
alized performance of a closed combination-drive pool produced without control is
presented in Fig. 10.11. A good example of this type of reservoir is the Golden Spike
Field in Alberta, Canada.
10.4. CLASSIFICATION OF HYDROCARBON ACCUMULATIONS BASED ON THE TYPES OF
TRAPS
Although the classifications based on the form, type and genesis of oil and gas
accumulations are called the ‘‘hydrocarbon accumulation classifications’’ they are in
effect the trap classifications. These trap classifications may be grouped into three
major types and four subtypes.
I. Traps formed by folding (with or without faults). Accumulations formed as
a result of folding are usually associated with the bedded reservoirs. The
complexity of structure (sometimes even isometric), size, and especially height
are caused by the trap and reservoir position in the sedimentary basin. Over the
Fig. 10.11. Generalized performance of a closed combination-drive pool produced without control.
(Courtesy of E.C. Babson.)
CLASSIFICATIONS OF OIL AND GAS ACCUMULATIONS194

central areas of tectonic plates, the traps are gentle and sometimes very large.
Over the plate margins, transition zones and, especially, collision zones the
folds are higher, steeper and with a clearly expressed trend. The accumulations
may be classified using some other parameters (mentioned earlier), too. In
particular, oil–water contours in such accumulations are closed and, in plan
view, have oval or more intricate shapes, and form rings.
II. Traps formed within various buildups. Accumulations formed within various
buildups are usually associated with the massive-type reservoirs. Most common
are accumulations in biogenic buildups (reefs and bioherms). Sometimes, biost-
romes are mistakenly attributed to the same class. Included here are large
accumulations with huge flow rates due to the presence of fractures and vugs in
carbonates. Some investigators also include in this group the erosional projec-
tions of the metamorphic and volcanic rocks (fault-bounded or bounded by
erosional surfaces), which may contain accumulations, e.g., White Tiger Field
in Vietnam.
III. Traps that are limited by the depositionally imposed facies changes. Lithologic
and stratigraphic traps of Group III include facies pinch-outs, stratigraphic
unconformities, and contact of the reservoir with the impermeable rock upsec-
tion. Such traps may be associated with the bedded reservoirs on the monoc-
lines or on the flanks of anticlines. These traps may contain rather large
accumulations. They may be associated with bedded reservoirs confined on
every side. In such a case, they form large accumulations. Water saturation
contours impinge on the trap (impermeable barrier). This type of accumulations
is very common: about 50% of all known accumulations.
Accumulations of Types I, II, and III are formed in accordance with the grav-
itational (‘‘anticlinal’’) theory. By far, not all known accumulations, however, belong
in the described three types or combinations thereof. Also, not all of them formed in
accordance with the gravitational theory. These unconventional accumulations are
discussed below (Types IV through VII).
IV. Dominance of capillary forces over the gravity force. Oil or gas found in hy-
drophilic rocks occupy coarser-grained reservoir rocks, which are sealed by
water-saturated fine-grained reservoir rocks. Examples of such accumulations
associated with the relatively coarse-grained sandstone lenses (e.g., 100-ft sand-
stone in Appalachian oil and gas province, USA) were presented by Brod
(1957). The authors of this book reviewed large number of commercial accu-
mulations all over the world and have not been able to find another such clear-
cut example. Although the appearance of capillary forces is frequently ob-
served, the formation and preservation of the accumulations cannot be attrib-
uted to these forces. It should be kept in mind that water and gas lenses exist
within oil accumulations; water is sometimes encountered updip in pinched-out
reservoirs (e.g., Productive Series of the Absheron Peninsula in Azerbaijan, and
Maykopian sandstones in the Northwest Caucasus).
V. Dominance of hydraulic forces. The hydraulic forces (Fig. 10.12) can cause a tilt
in the oil–water interface. To determine that tilt, a trigonometric function (see
ACCUMULATIONS BASED ON THE TYPES OF TRAPS 195
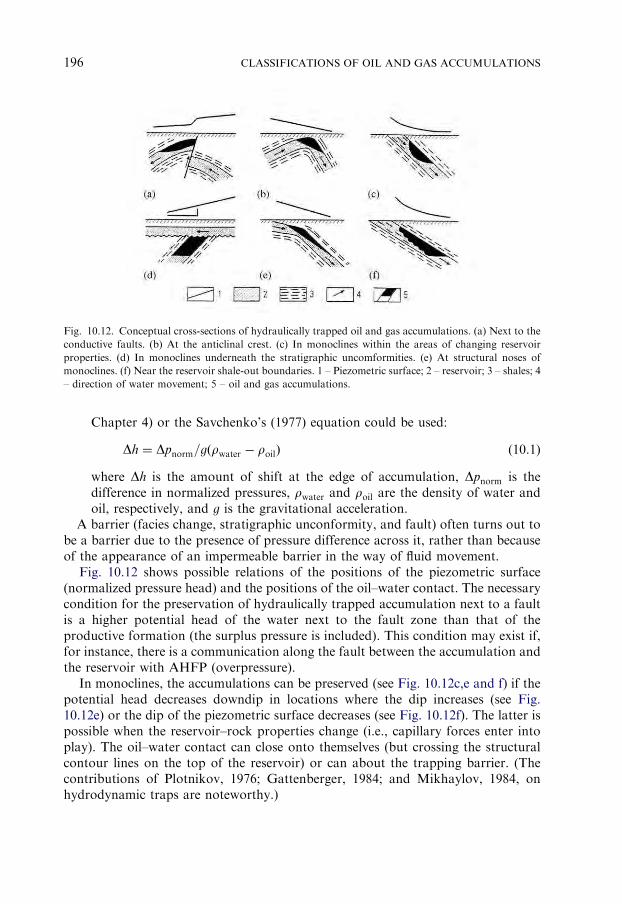
Chapter 4) or the Savchenko’s (1977) equation could be used:
Dh ¼ Dpnorm=gðrwater � roilÞ (10.1)
where Dh is the amount of shift at the edge of accumulation, Dpnorm is the
difference in normalized pressures, rwater and roil are the density of water and
oil, respectively, and g is the gravitational acceleration.
A barrier (facies change, stratigraphic unconformity, and fault) often turns out to
be a barrier due to the presence of pressure difference across it, rather than because
of the appearance of an impermeable barrier in the way of fluid movement.
Fig. 10.12 shows possible relations of the positions of the piezometric surface
(normalized pressure head) and the positions of the oil–water contact. The necessary
condition for the preservation of hydraulically trapped accumulation next to a fault
is a higher potential head of the water next to the fault zone than that of the
productive formation (the surplus pressure is included). This condition may exist if,
for instance, there is a communication along the fault between the accumulation and
the reservoir with AHFP (overpressure).
In monoclines, the accumulations can be preserved (see Fig. 10.12c,e and f) if the
potential head decreases downdip in locations where the dip increases (see Fig.
10.12e) or the dip of the piezometric surface decreases (see Fig. 10.12f). The latter is
possible when the reservoir–rock properties change (i.e., capillary forces enter into
play). The oil–water contact can close onto themselves (but crossing the structural
contour lines on the top of the reservoir) or can about the trapping barrier. (The
contributions of Plotnikov, 1976; Gattenberger, 1984; and Mikhaylov, 1984, on
hydrodynamic traps are noteworthy.)
Fig. 10.12. Conceptual cross-sections of hydraulically trapped oil and gas accumulations. (a) Next to the
conductive faults. (b) At the anticlinal crest. (c) In monoclines within the areas of changing reservoir
properties. (d) In monoclines underneath the stratigraphic uncomformities. (e) At structural noses of
monoclines. (f) Near the reservoir shale-out boundaries. 1 – Piezometric surface; 2 – reservoir; 3 – shales; 4
– direction of water movement; 5 – oil and gas accumulations.
CLASSIFICATIONS OF OIL AND GAS ACCUMULATIONS196

Neither of the described types, however, owes its existence to the hydraulic forces
exclusively. They can exist only under condition of the combined interaction of
several different forces: (1) hydraulic and gravity, (2) hydraulic and capillary, or (3)
hydraulic+capillary+gravity forces. The effect of hydraulic forces is commensurate
with that of gravity and capillary forces.
VI Gas accumulations in synclines or in monoclines devoid of structural highs. Ex-
amples of such accumulations have been presented by Masters (1979) and
Perrodon (1984). There is a gas accumulation in the Deep Basin monocline in
Alberta, Canada. The latter accumulation resides in the Mesozoic sandstone,
which is more than 3 km high (the thickness of individual gas intervals is
10–150m). The sandstone is water-saturated updip the gas accumulation, with
an improvement in petrophysical properties. The gas reserves here are nearly
11.3 TCM. The gas accumulation of Milk River Field (Canada), with 250BCM
of reserves, is another similar example. The gas accumulation of San Juan Field
(USA) resides in the Mesozoic sandstone in the synclinal part of the structure,
with reserves of 700 BCM. The sandstone is water-saturated over the flanks. The
porosity and permeability within the gas-saturated portion are 14% and 1mD,
respectively, whereas in the water-saturated portion, f ¼ 25% and k ¼ 100mD.
To explain this phenomenon, the following two explanations may be suggested:
(1) A rapid gas generation is currently occurring in the Mesozoic sandstones of
the Milk River and San Juan fields at a temperature of 85–921C. This gas is
entering the reservoir at a higher rate that it is being removed from the
reservoir.
(2) The reservoir rocks are hydrophobic (Bolshakov, 1986). Capillary forces
move the gas into the reservoir with finer pores and keep it there.
The authors of this book believe that both explanations are questionable, because
of the high surplus pressure and high capillarity within the water-saturated portions
of the accumulation. In the case of the first explanation above, if the gas-saturated
reservoirs are intercommunicated and form a single accumulation, the surplus pres-
sure in its upper portion should be around 30MPa. If f ¼ 25% and k ¼ 100mD, the
effect of capillary forces would be negligible and insufficient for retaining the ac-
cumulation. Also, if the porosity and permeability values are low along the axis of
syncline, a high rate of gas input would be doubtful.
The two explanations above assume that the gas is retained due to the change in
rock properties. In the first explanation the fast gas input from clays is assumed (and
from a larger area than the gas escape area). The second explanation subscribes to
the action of capillary forces in hydrophobic rocks. It is quite possible, however, that
the fluid properties change together with the changes in the reservoir–rock prop-
erties. A prolific gas generation occurred (and may still be occurring) in the
Mesozoic sequence. The gas dissolves in water as soon as it is formed. Thus, the
gas-saturated water enters the reservoir. In this case, the surplus pressure within
the upper portion of the accumulation would be tens of times lower than that for
the gas accumulations [the difference would be (rwater � rgas) in one case and
(rwater � remulsion) in the other case]. Updip, the pore size increases (as indicated
by the higher porosity and permeability), the capillary pressure and temperature
ACCUMULATIONS BASED ON THE TYPES OF TRAPS 197

decline, gas solubility in water drastically decreases (depending on changes in the
reservoir conditions), and gas is released as a free phase forming a gas-in-water
emulsion. A substantial portion of the released gas energy is spent for the formation
of emulsion. The emulsion has huge surface area and, correspondingly, huge surface
energy. Thus, the gas accumulation is insulated by the gas-in-water emulsion, which
is only slightly movable and is elastic at reservoir conditions.
Three major reasons have been proposed in the above three explanations to elu-
cidate the formation and existence of the accumulations: (1) the difference in the
speeds of immigration and emigration, (2) the capillary forces (and wettability), and
(3) changes in the fluid properties due to changes in the formation temperature and
pressure.
The problem is yet to be solved. How common are such (Type VI) accumulations?
What is their contribution to the total undiscovered resources? At this time there is
no answer to these questions. The existing exploration, testing and production
techniques are attuned almost exclusively to the accumulations where the gravity
forces predominate. Discoveries of Type VI accumulations in such conditions is
highly accidental. Their exploration, testing and production techniques must be
established after the known accumulations of this type are studied in detail.
VII The ‘‘critical-state’’ accumulations. The ‘‘critical-state’’ accumulations have been
described above. It is important to emphasize again that the name is tentative.
May be they should be called ‘‘near-critical to critical’’ accumulations.
10.5. VERTICAL ZONATION OF HYDROCARBON ACCUMULATIONS
A commonly accepted definition of an ‘‘oil and/or gas field’’ is still missing.
Commonly, a field is defined as all oil and/or gas accumulations (pools) associated
with some structural feature of the Earth’s crust (see Eremenko, 1991). The authors
of this book define an oil and/or gas field as an area of the Earth’s crust that contains
accumulations (pools) of oil and/or gas, the lateral extent of which is amenable for
arranging the infrastructure to develop the field in its totality. On the other hand, the
term ‘‘pool’’ refers to any elementary, single accumulation of oil and/or gas.
This definition of a field is quite different from the one previously proposed by
one of the authors (Eremenko, 1968, 1984). The new definition encompasses not
only all accumulations, but also the entire rock sequence comprising the field (in-
cluding ‘‘dry’’, i.e., water-saturated, hydrocarbon-free formations). Knowledge of
this information is of decisive importance for the development of a field. When the
accumulation characteristics are known, one can select the main target, the intervals
for joint production, and the intervals for the injection of produced water.
There may be an accumulation located on the flank of monocline far from the rest
of accumulations. Such an accumulation, depending on the development environ-
ment, may be treated as part of the same field or considered as a separate field. The
vertically overlapping accumulations, which belong to different structural elements,
are included in the same field. Such different structural conditions may include
abrupt unconformities, e.g., monocline over an anticline, rootless anticline over a
CLASSIFICATIONS OF OIL AND GAS ACCUMULATIONS198

monocline, or overthrusts and underthrusts. Therefore, ‘‘field’’ is not just a geologic
term but rather a geologic–technologic one. (See Kontorovich et al., 1975.)
An oil and/or gas field should be characterized first of all by the geological
structure of the area it is located in and by the types of traps. Usually, some ad-
ditional information to characterize the field is provided including:� location of the area relative to larger regional structures of the Earth’s crust;� the presence of different structural stages within the field;� the number of accumulations;� the amount of reserves and their density over the area;� hydrocarbon phase state in the accumulations;� vertical zonation of hydrocarbon distribution;� subsurface temperature and pressure; and� the number of target reservoirs.
There are numerous classifications of the local tectonic structures, including some
specifically petroliferous. The following are the most important parameters of the
classifications:
(1) Almost all classifications are based on general tectonic characteristics commonly
accepted as of the date of classification. They include the location of structures:
(1) the oceanic, continental or transitional crust; (2) the platform or geosyncline;
(3) the center or margin of a tectonic plate; and (4) the divergence and con-
vergence zones.
(2) In all classifications, the formation of crustal element associated with hydro-
carbon accumulation is treated in the context of evolution of the Earth’s crust as
part of the lithosphere (sometimes, astenosphere and rarely, mantle).
(3) Some structures of ‘‘cosmic’’ origin (meteorite impact structures) have been
found to be petroliferous. Donofrio (1981) stated that there are at least 3000
impact craters greater than 10 km in diameter on the Earth’s surface. King
(1979) described an impact structure as follows: An external circular swell is
comprised of loose rocks, which can form a good reservoir rock upon burial.
Bedrock underneath the swell is fractured. The internal depression is usually
filled up with breccia. In some cases, the depression may have a central high or a
ring structure surrounded by a circular depression. The rocks underneath the
crater are usually compacted and form a graben.
Donofrio (1981) considered the Newfield accumulation (USA) an impact structure
in the Carboniferous sediments. The diameter of swell is 5–6 km. An oil accumu-
lation (with about 17 million barrels of recoverable reserves) is found in the breccia
of the crater. The Red Wing Creek Field accumulation of Ordovician age (40–70
million barrels of recoverable reserves) resides in the breccia of central high, 6.5 km
in diameter.
A significant number of ring structures were discovered recently as a result of
surveys from space. Their origin is not clear. Some of them may be impact structures,
whereas most of them are probably of deep-seated origin. Attempts by some ge-
ologists to relate the distribution of hydrocarbon fields to rings are premature. The
assumption that the hydrocarbons migrated from the great depth in the Earth are
speculative.
VERTICAL ZONATION OF HYDROCARBON ACCUMULATIONS 199

Significant features of an oil–gas field include characterization of the rock se-
quence (see Chapter 2), distinct expression of the structure, and complexity of the
structure. Obviously, this characterization depends on the geologic evolution of a
specific region. The latter, in turn, is defined by the tectonic processes.
A structural element can be defined by its height and the steepness of its flanks.
The height is the difference in depth from the highest point of structure to the spill
point. The structural height controls the accumulation column, the possible gravity
differentiation of fluids in the accumulations, maximum values of the surplus pres-
sure, and the possibility of accumulation being ‘‘squeezed-out’’ from the trap
(Chapter 3). The steepness of flanks first of all affects the gravity buoyancy force ( f )
updip the reservoir:
f ¼ gDr sin a (10.2)
where g is the gravitational acceleration, Dr is the difference in the density of fluids,
and a is the dip angle.
Difference between the density of hydrocarbons (oil and/or gas) and that of water
in a reservoir can create an overpressure (Fig. 10.13). Obviously, in the case of gas,
the overpressure will be more pronounced.
The structural complexity of the area, where the hydrocarbon field is located, very
significantly affects the natural and technical conditions of the field. The natural
conditions are characterized by the formation and existence (within a specific area of
the Earth’s crust) of different hydrocarbon accumulations (different in terms of type,
shape, and fluid content) and their possible interrelations. The technical conditions
encompass the exploration, appraisal, testing, and production techniques. They also
depend on the geologic structure, including the characteristics of the rocks enclosing
the hydrocarbon accumulation, as discussed in Chapter 2.
One of the primary characteristics of the field is the number and type of deposits.
The number of deposits and their grouping among the separate structural elements
of the field (if they are clearly distinguishable) define the basis for the appraisal and
development of productive formations. The grouping of latter is necessary for plan-
ning commingled production and possible recompletions. The hydrocarbon reserves
and their commercial category must be determined for each field. Frequently, the
‘‘specific density of reserves’’ (tons of oil or cubic meters of gas per 1 km2 of the field
area) is used to characterize hydrocarbon fields. The higher the specific density, the
more efficient the field development (field facilities and the efficiency of their uti-
lization).
Several zones may be identified in the vertical section of each field, on the basis
of the oil and gas occurrence. The authors of this book propose to distinguish
five vertical zones on the basis of temperature, pressure, and phase relationships
(Table 10.4).
The depth boundaries in Table 10.4 are very tentative, because they depend on the
quality of fluids and the nature of heat flow. Temperatures are not specified, because
they will change for the selected depth and pressure intervals, depending on the heat
flow. Zone 3 is within the critical pressure range for water. In the case of a
‘‘stretched’’ heat flow, the temperature even at a depth of 4.5–5 km may be just
CLASSIFICATIONS OF OIL AND GAS ACCUMULATIONS200

90–1001C (South Caspian Basin). Rough estimates, however, indicate that the tem-
perature within Zone 3 is above 100–1201C and may increase to 160–1801C within
Zone 4, and higher in Zone 5. The vertical zonation controls the possible depth of
occurrence of crude oils with a certain phase composition and corresponding pres-
sures (normal and abnormal) and the temperature, hence the oil and gas properties
and the patterns of their change up the section.
Relationship between the pressure and depth is presented in Fig. 10.14. There are
three different scenarios of the reservoir pressure change with depth:
(a) Reservoir pressure changes according to the hydrostatic pressure gradient
(Line I).
(b) Within the intercommunicating accumulations, according to the surplus pres-
sure gradient (Line II, which is always steeper than Line I).
(c) Abnormally-high formation pressure (AHFP) (Line III, which is always flatter
than Line I).
Fig. 10.13. Cross-sectional view of an anticlinal reservoir sandwiched between two impervious shale
bodies, showing abnormal pressures in hydrocarbon accumulation in hydrostatic water environment.
g0 ¼ specific weight of oil (e.g., in lb/ft3); gw ¼ specific weight of water (e.g., in lb/ft3); z ¼ elevation (e.g.,
ft); p ¼ pressure (e.g., in lb/ft2); overpressure ½Dp ¼ ðpo1 � pw1Þ ¼ ðgw � goÞðz2 � z1Þ� in lb/ft2 (modified
after Hubbert and Rubey, 1959, p. 150; and Gretener, 1969, p. 267; in: Rieke and Chiligarian, 1974, Fig.
264, p. 310).
VERTICAL ZONATION OF HYDROCARBON ACCUMULATIONS 201

TABLE 10.4
Vertical zonation of oil and gas fields (After Eremenko and Chilingar., 1996, p.125.)
Zone Approximate depth
to the lower
boundary (km)
Pressure (MPa) Oil quality and
pattern of changes
Mutual solubility of
oil and gas
Drive mechanism Gas composition in
gas accumulations
1 0.5–0.8 5.5–9 Various
combinations are
possible; oxidized
and weathered crudes
having lost their light
fractions are
encountered.
Direct correlation.
Associated gas
becomes dryer with
depth.
Combination of any
drives is possible.
Dry gas dominates.
2 0.8–1.0 9–12 Lighter crudes Weak inverse
solubility is possible
depending on the oil
and gas quality.
Water drive is
common in oil
accumulations.
Elastic drive is also
observed.
Percentage of wet gas
increases.
3 2–2.5 Normal up to 30,
abnormal up to
35–40
Even lighter crudes
with even higher
content of paraffins
Inverse solubility
becomes clearer with
depth. Gas becomes
more wet.
Water and depletion
(elastic) drives are
most common.
Condensate is
common.
4 Up to 5 Normal up to 60,
abnormal up to 100
Light condensate-
type crudes
dominate.
Same as above Same as above Condensate is always
present
5 45–7 4100 Mostly gas–oil or
gas–oil–water
solution
Single phase Elastic drive Gas–oil–water
solution
CLASSIF
ICATIO
NSOFOIL
AND
GASACCUMULATIO
NS
202

In the intercommunicating gas accumulations (e.g., massive accumulation of the
Shebelinka Field, Ukraine), at r � 0 the Line I will be vertical. An increase in the
AHFP along the Line III will result in the formation of fault-block reservoirs with
different AHFP values.
From the locations of points in the graph, the connectivity of the productive
horizons can be determined.
There are some examples (e.g., East Siberia) of abnormally low formation pres-
sure (ALFP). These pressures are lower than the hydrostatic (Chilingar et al., 2002).
Water in some parts of such formations is found in solid state (due to the perma-
frost), whereas in some other areas the water is not present at all. In the absence of
water (ice instead of water), there is no hydrostatic piezometric surface.
Fig. 10.14. Three major patterns of variation of formation pressure with depth. 1 – Hydrostatic pressure
gradient (rw ¼ 1 g=cm3; 62.4 lb/cu. ft.; 0.433 psi/ft). 2 – total overburden pressure (1.0 psi/ft; 0.23 kg/cm2/
m). I – Hydrostatic pressure gradient (rw ¼ 1:25 g=cm3); II – pressure change in communicating accu-
mulation at overpressure; and III – abnormally high formation pressure. (After Eremenko and Chilingar,
1996, p.126.)
VERTICAL ZONATION OF HYDROCARBON ACCUMULATIONS 203

This page intentionally left blank
204

Chapter 11
MATHEMATICAL MODELING IN PETROLEUM GEOLOGY
11.1. PRINCIPLES OF MATHEMATICAL MODELING OF GEOLOGIC SYSTEMS
Exploration, development, and production of hydrocarbon resources must be
based on reliable information, which helps to predict the subsurface conditions and
properties of the oil- and gas-bearing formations. Consequently, both mathematical
modeling of the processes of deposition and evolution of sediments and concurrent
development of mathematical procedures for predicting reservoir pressures, oil and
gas composition, and petrophysical properties of reservoir rocks and seals are the
goals of high priority. The increase in depth of oil and gas occurrence with con-
sequent increase in the complexity of geological and environmental conditions that
affect the exploration for oil and gas, as well as development of new on- and offshore
fields requires application of a set of mathematical models to process geological,
geophysical, geochemical, and engineering data. This will aid in exploration, esti-
mation, and evaluation of oil and gas resources, and to achieve an efficient oil and
gas field development and production (Miller and Kahn, 1965; Krumbein and
Graybill, 1969; Krumbein et al., 1973; Harbaugh and Bonham-Carter, 1974;
Rodionov et al., 1987).
The use of mathematical methods and computer techniques increases the scope of
problems that can be solved on the basis of integrated geological, geophysical, geo-
chemical, and engineering information. Mathematical methods with computer
processing of the current information accelerate the process of regional and local
prediction of oil and gas potential, that, in general, increases the economic and
geologic efficiency of exploration, development, and production of oil and gas
fields (Buryakovsky et al., 1982, 1990, 1991; Buryakovsky and Agamaliyev, 1990;
Buryakovsky, 1992).
In the field of petroleum geology, the discovery and development of oil- and gas-
bearing basins, regions, zones, fields, etc. may be considered as dealing with integral
geologic systems, the evolution, structure, and behavior of which can be predicted.
Geologic system may be defined as follows:
Geologic system is a well-organized natural assembly of interconnected and interacting
elements of lithosphere having common development history and comprising a single nat-
ural unit with properties that are not inherent in its individual elements.
An important feature of these systems in petroleum geology (i.e., basins, regions,
zones, fields, etc.) is that division into subsystems of (1) reservoir (permeable) rocks
and (2) sealing (impermeable) rocks is possible. The presence of these two subsys-
tems defines oil and gas reservoir or trap. Absence of any one of these subsystems
(reservoir rock or seal) indicates the absence of reservoir or trap.
Geologic systems of oil- and gas-bearing basins, regions, zones, fields, etc. are
parts of the more extensive systems in the Earth’s crust. Owing to the absence of
205

distinct boundaries, these systems exchange matter, energy, etc. with the external
medium. The geologic systems also develop in time. They, however, provide the
certain stability and inherit main structural and behavioral features of the system.
Depending on the kind of exchange between the geologic system and external me-
dium (exchange of substance, energy, or information, separately or simultaneously),
one can construct various types of models of oil- and gas-bearing systems. The
classification of the main features of natural geologic and engineering-technologic
systems is shown in Fig. 11.1.
The systems’ approach to geology is both a sophisticated philosophy and a sci-
entific method for investigation of very complicated geologic systems. As applied to
petroleum geology, it includes the methodological base and technology of mathe-
matical simulation used for modeling geologic systems, the systems, which have been
previously investigated and estimated by using experimental or field data. Inasmuch
as geologic systems develop in time, it is very important to simulate them as dynamic
systems. The necessity of taking the geologic time factor into consideration does not
eliminate the possibility of developing, along with the dynamic models, also of the
static and structural models. It is imperative, however, to remember that geology is a
historic discipline, and the relative lack of success in its mathematization is associated
to a significant degree with difficulties in taking into consideration the time factor.
Scientific bases, simulation techniques, and mathematical models of both static
and dynamic geologic systems have been developed, and basic theoretical and
methodological principles of simulation and prediction of geologic systems (their
structure and behavior) have been defined (Buryakovsky, 1992). These principles are
as follows:
1. Principle of consideration of the system’s nature requires a separate simulation of
geologic, technologic, and experimental systems with different objectives required
by the ‘‘real world’’.
2. Principle of system’s development (evolution) requires the simulation of systems
considering the time factor and its subdivision into three time scales: (a) geologic,
(b) technologic, and (c) experimental.
3. Principle of consideration of comparative size and complexity of geologic, tech-
nologic, and experimental systems requires simulation of a sequence of systems
from an oil- and gas-bearing basin through oil and gas field to core sample scale.
4. Principle of consideration of the information growth requires simulation of the
activities of earth scientists. These include the successive phases of prediction of
oil and gas presence and existence of traps, and discovery, exploration, reserve
estimation, development, and production of oil and gas fields.
The definition of these principles provides the systems’ approach both in the
development of the scientific foundations and in the simulation technology of ge-
ologic systems. The relations among simulation principles are given as a flowchart in
Fig. 11.2. An important element of this chart is the feedback, which allows im-
proving the present and developing the new methods for investigation and simu-
lation of geologic systems.
The technological chart (Fig. 11.3) distinguishes three inlet blocks: (1) theoretical
foundations (basic principles), (2) initial information, and (3) technical means
MATHEMATICAL MODELING IN PETROLEUM GEOLOGY206

Fig. 11.1. Classification of natural-geologic and engineering-technologic systems.
PRIN
CIPLESOF
MATHEMATIC
ALMODELIN
GOFGEOLOGIC
SYSTEMS
207

Fig. 11.2. Flowchart of interrelations between information and principles of modeling petroleum geology
systems. Solid lines: directions of substance, energy or information flow; bold lines: directions of feedback
information flow.
Fig. 11.3. Flowchart of modeling petroleum geology systems.
MATHEMATICAL MODELING IN PETROLEUM GEOLOGY208

(facilities). This chart also contains the feedback, which provides improvement of
theoretical foundations for the simulation of geologic systems.
11.2. MODELS OF STATIC GEOLOGIC SYSTEMS
With increasing depth of exploration, one of the major problems is the estimation
of influence of natural factors (total overburden, pore (fluid) and effective pressures,
reservoir pressure, formation temperature, lithology, pore space geometry, etc.) on
the properties of sedimentary rocks and formation fluids (lithofluidal system). The
lithofluidal system can be defined as follows:
Lithofluidal system is the well-organized natural assembly of interacting solid, liquid and
gaseous elements of lithosphere having common development history and a distinguishing
set of physical and chemical properties, which manifest themselves both individually and
jointly.
Mathematical models of the processes which describe the influence of pressure,
temperature, and structural and lithological factors on the properties of sedimentary
rocks and formation fluids can be presented using two approaches: deterministic
(analytical) and probabilistic (statistical). Both of these approaches are mutually
dependent and their combination enables the generalization of studied processes.
Statistical methods can be used only in the case of the existence of sufficient data.
These data are obtained either at the stage of completion of exploration or during
subsequent development of a deposit. Obtaining the representative data can be very
expensive. Therefore, new procedures should be developed for prediction of rock and
fluid properties when data are sparse. Such studies are especially appropriate for the
exploration and development of oil and gas fields, which occur at great depths or in
harsh environments. At the latter case, the problems of drilling, coring, testing, and
logging do not allow the acquisition of reliable data for the evaluation of reservoir
rock and caprock properties, and formation fluid properties, especially at the early
stage of exploration.
The main principles used in mathematical simulation are as follows:
1. The most complete quantitative characteristics of the geological, geophysical,
and geochemical parameters are described by their statistical distributions.
2. The distributions of geological, geophysical, and geochemical parameters are
simulated on the basis of their mathematical descriptions (models), which may be
probabilistic or deterministic.
3. In the case of scarcity of data, the artificial distributions of model input data are
formed by means of their interval-probable presentation, and the Monte Carlo
technique is used for plotting such distributions.
4. For the purposes of predicting properties of rocks and formation fluids, simu-
lation of statistical distributions is required on the basis of models with variable
input data depending upon changes in the regional geologic environments.
5. For the purposes of identification of formations, simulation of more than one
statistical distribution and the determination of the cut-off points for the sim-
ulated parameters (which allows strata classification) are required.
MODELS OF STATIC GEOLOGIC SYSTEMS 209

The characteristic feature of construction of artificial distributions for solving
geologic modeling problems is that the decision about the influence of various nat-
ural factors upon the parameter under study is often made only at the range of their
variation, which indicates the presence of fuzzy data sets. In such a case, the interval-
probable determination of the input data and the subsequent calculation results
provide consideration of the indeterminate form of the basic factors.
11.2.1. Analytical approach
11.2.1.1. Entropy of geologic systems
A study of geologic systems, from the viewpoint of homogeneity/heterogeneity of
their structure, may be carried out with an aid of the theory of information. Any
communication is a sum total of information on some real system. In geologic
terminology, such may be the reports on the various analyses of rocks, oils, gases,
and formation waters, which have been conducted in the laboratory or obtained
from formation testing. Any one of these communications describes the state or level
of knowledge of some geologic system.
The entropy, a special index in the theory of information, is employed as a cri-
terion of the a priori (before the communications were received) indefiniteness of the
system. The concept of entropy, borrowed from the thermodynamics and statistical
physics, is a basic concept in the theory of information. The entropy, H, is deter-
mined by the following formula:
H ¼ �X
N
i¼1
pi log pi (11.1)
where pi is the probability of state of any one of the N components constituting the
system. The ‘‘minus’’ sign is introduced in order to make the entropy positive,
inasmuch as pip1 and log pip0.
The H entropy is related to the S entropy (commonly employed in thermody-
namics) using the Boltzmann’s constant k, namely:
S ¼ �kX
N
i¼1
pi log pi (11.2)
The entropy has the following properties:
(1) It becomes zero, if one of the states of the system is fully known (pk ¼ 1) and
the others are impossible ðp1 ¼ p2 ¼ � � � ¼ pk�1 ¼ � � � ¼ pn ¼ 0Þ.
(2) At a given number of states, it becomes maximum, if all the states are equally
probable, but increases with the increasing number of states.
(3) It is additive, i.e., it is possible to add up entropy of different systems.
In the theory of information, entropy is generally calculated in the binary system,
although natural or decimal logarithms are often more convenient to use. The shape
of the �p log p function, in natural and decimal logarithms, is presented in Fig. 11.4.
The quantity of information on the state of a real system is measured by the
decrease in the entropy of this system. The ultimate quantity of the information, I, is
equal to H (the total entropy of the system), namely
MATHEMATICAL MODELING IN PETROLEUM GEOLOGY210

I ¼ �X
N
i¼1
pi log pi (11.3)
Thus, the information I is the logarithm of probability of the general state, with
the reverse sign, weighted with respect to every state of the system. The information
may be recorded also as a mathematical expectancy:
I ¼ M½� log pi� (11.4)
If the states of the system have different probabilities, the information, by the
different communications, will not be equal. The fullest information is borne by the
communications about events, which are the least probable, a priori. The entropy of
a system increases with increasing indefiniteness of the system. In a fully definite
system (of which everything is known or which has the highest orderliness), the
entropy equals zero. Chaotic state, disorderliness, lack of sorting, heterogeneity, or
indefiniteness of the state increase the entropy of the system.
Consequently, magnitude of entropy, which expresses the degree of heterogeneity
or indefiniteness, may be used in geologic studies and graphic representations of
heterogeneity of various geologic systems. For example, zones with characteristically
high entropy (low information capacity) (i.e., zones where different facies are mixed
in approximately equal proportions) in facies maps will differ from areas occupied
by limited number of facies with high information capacity (smaller entropy). In the
case of a zone containing one facies only, the entropy of the system is equal to zero
and the information is at a maximum.
Relative entropy is the ratio of determined entropy to the maximum entropy,
obtained for a given number of components,
Hr ¼ �X
N
i¼1
pi log pi
!
=Hmax (11.5)
Fig. 11.4. The -plog p function plotted against p in (1) natural and (2) decimal logarithmic scales.
MODELS OF STATIC GEOLOGIC SYSTEMS 211
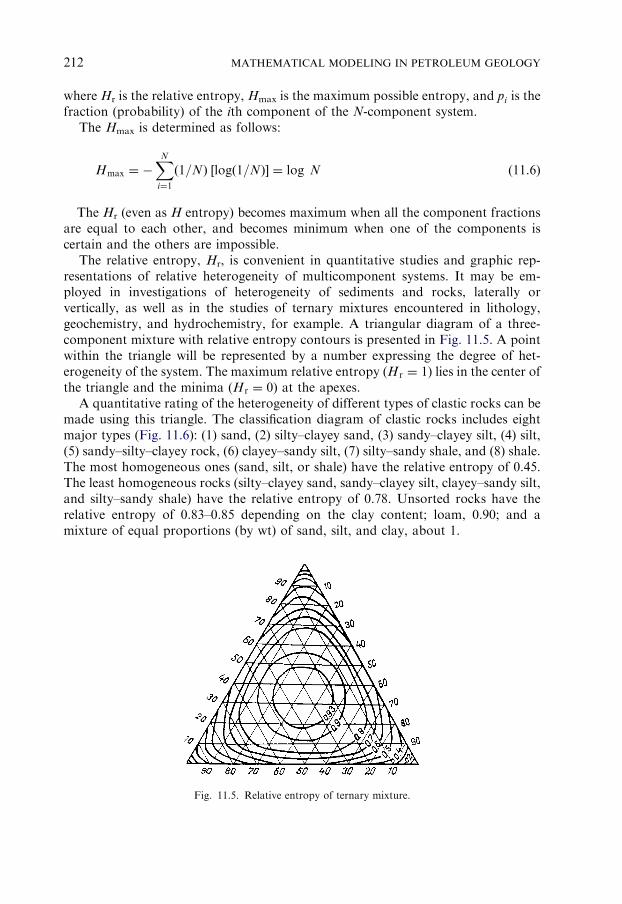
where Hr is the relative entropy, Hmax is the maximum possible entropy, and pi is the
fraction (probability) of the ith component of the N-component system.
The Hmax is determined as follows:
Hmax ¼ �X
N
i¼1
ð1=NÞ ½logð1=NÞ� ¼ log N (11.6)
The Hr (even as H entropy) becomes maximum when all the component fractions
are equal to each other, and becomes minimum when one of the components is
certain and the others are impossible.
The relative entropy, Hr, is convenient in quantitative studies and graphic rep-
resentations of relative heterogeneity of multicomponent systems. It may be em-
ployed in investigations of heterogeneity of sediments and rocks, laterally or
vertically, as well as in the studies of ternary mixtures encountered in lithology,
geochemistry, and hydrochemistry, for example. A triangular diagram of a three-
component mixture with relative entropy contours is presented in Fig. 11.5. A point
within the triangle will be represented by a number expressing the degree of het-
erogeneity of the system. The maximum relative entropy (Hr ¼ 1) lies in the center of
the triangle and the minima (Hr ¼ 0) at the apexes.
A quantitative rating of the heterogeneity of different types of clastic rocks can be
made using this triangle. The classification diagram of clastic rocks includes eight
major types (Fig. 11.6): (1) sand, (2) silty–clayey sand, (3) sandy–clayey silt, (4) silt,
(5) sandy–silty–clayey rock, (6) clayey–sandy silt, (7) silty–sandy shale, and (8) shale.
The most homogeneous ones (sand, silt, or shale) have the relative entropy of 0.45.
The least homogeneous rocks (silty–clayey sand, sandy–clayey silt, clayey–sandy silt,
and silty–sandy shale) have the relative entropy of 0.78. Unsorted rocks have the
relative entropy of 0.83–0.85 depending on the clay content; loam, 0.90; and a
mixture of equal proportions (by wt) of sand, silt, and clay, about 1.
Fig. 11.5. Relative entropy of ternary mixture.
MATHEMATICAL MODELING IN PETROLEUM GEOLOGY212

Thus, on the basis of their heterogeneity, the rocks can be classified and rated
quantitatively. A rock with the relative entropy below 0.5 can be considered as a very
homogeneous one, composed of grains of about similar size. The poorly sorted rocks
have a relative entropy higher than 0.5.
In calculating the entropy, only the frequencies (probabilities) of every component
of the system are taken into account; the absolute magnitudes of the components are
not considered. This may be a shortcoming when the properties of a mixture depend
upon the absolute contents of its components (or of their ratios); for example, where
the porosity of a mixture depends not only on the proportions of various fractions in
the rock, but also on the mean diameter of the grains in every fraction. In such a
case, the most heterogeneous rocks, with the lowest porosity, will not fall in the
center of the triangle but will be somewhere between the fractions with the largest
and smallest mean diameters of grains.
The merit of rating the indefiniteness or heterogeneity of a real system by means
of its entropy lies in its quantitative expression by one single number and not by
several numbers (three or even more).
The use of relative entropy has another advantage, because its magnitude has the
upper and lower limits (0pHrp1). The other parameters of heterogeneity of a
Fig. 11.6. Classification of Kirmaku (a, c) and Podkirmaku (b, d) clastic rocks in SE (a, b) and NW (c, d)
parts of Absheron Archipelago, Azerbaijan (after Buryakovsky et al., 2001). 1 – sand, 2 – silty-clayey
sand, 3 – loam, 4 – silt, 5 – unsorted sediments, 6 – clayey-loam, 7 – sandy-silty shale, 8 – shale.
MODELS OF STATIC GEOLOGIC SYSTEMS 213

system (range of variation, scattering, variations coefficient, etc.) have no upper
limit, so that the use of relative entropy makes it possible to rate the heterogeneity of
a rock without resorting to comparisons with the other parameters of heterogeneity.
As an example of application of the relative entropy in rating the heterogeneity of
rocks, the grain-size composition of rocks of the Kala Formation of the Absheron oil
and gas region of Azerbaijan was analyzed. The most homogeneous portion of this
formation was found in the Gum Deniz and Turkyany areas, whereas the least
homogeneous portion was present in the Karachukhur–Zykh area and in the south-
eastern part of the Absheron Archipelago. As determined from cores, the grain-size
heterogeneity (or microheterogeneity) of the various rock types (see Fig. 11.5) in-
dicates that the relative entropy is increasing with heterogeneity increase. A general
increase of the relative entropy, however, has no significant effect on variations in
the relative entropy of the whole area.
Heterogeneity in individual deposits can be extended to the areal variations in
lithology. Entropy contours are plotted on the map and then interpreted to decipher
the paleogeography of the area, sedimentation scenario, and subsequent diagenetic
and catagenetic alterations of sediments and rocks. For example, the homogeneity of
the Kala Formation increases with increasing depth of sediment deposition (under a
calm hydrodynamic regime) (Table 11.1).
With increasing burial depth in the Karachukhur–Zykh–Gousany–Gum
Deniz–Turkyany anticlinal trend, the relative entropy progressively decreases.
The entropy increases along the Gyurgyany Deniz–Chalov Adasi–Palchygh
Pilpilasi–Neft Dashlary anticlinal trend. The relative entropy progressively decreas-
es with burial depth in the offshore oil and gas fields of Absheron Archipelago. There
is an inverse depth–entropy relationship between individual areas.
As far as the basic relationship in spatial distribution of Hr as a criterium of
heterogeneity of the rocks is concerned, there is a decrease in Hr and a better sorting
TABLE 11.1
Evaluation of heterogeneity entropy for the Kala Formation of the Absheron Archipelago, Azerbaijan
(after Buryakovsky et al., 2001)
Area Number of
reservoirs
Average
depth (m)
Entropy Relative entropy
Without
microheterogeneity
With
microheterogeneity
Gyurgyany Deniz 56 2160 1.580 0.72 0.83
Chalov Adasi 120 720 1.933 0.88 0.92
Palchygh Pilpilasi 59 1130 1.699 0.77 0.87
Neft Dashlary 170 1010 1.904 0.87 0.90
Karachukhur–Zykh 64 2790 1.816 0.83 0.91
Gousany 180 4010 1.597 0.73 0.80
Gum Deniz 25 3500 1.410 0.64 0.65
Tyurkyany 65 3760 1.423 0.65 0.67
Kala Formation as a
whole
746 — — 0.71 0.76
MATHEMATICAL MODELING IN PETROLEUM GEOLOGY214

of rocks with increasing depth. This relationship is typical for both the individual
anticlinal zones and for the entire area of sedimentation during the Kala time.
Thus, the conclusions can be summarized as follows:
1. Entropy of a geologic system may serve as a criterion of its heterogeneity. This
makes it possible to use entropy as a quantitative rating of heterogeneity of rocks.
2. Relative entropy is a convenient measure of heterogeneity of rocks and can be
calculated using natural logarithmic tables.
3. Heterogeneity of different rocks with respect to their grain-size distribution, and
heterogeneity of formations with respect to the proportions of different rock
types in the section, may be expressed in entropy values.
4. In studying the heterogeneity of sediments, the concept of entropy may prove to
be useful not only in the fields of lithology and petrography, but also in the fields
of geochemistry and hydrochemistry.
11.2.1.2. Anisotropy of sedimentary rocks
The migration and accumulation of hydrocarbons in stratified heterogeneous
deposits differ from those in massive homogeneous reservoirs. The fluid motion
in various directions is subject to a considerable anisotropy, because the permeability
of the stratified rocks is dependent on the direction of flow. One needs to deter-
mine the anisotropy coefficients for such rocks in order to simulate hydrodynamic
scenarios.
For a three-component medium composed of layers of (1) good-quality reservoir
rocks, (2) low-quality reservoir rocks, and (3) non-reservoir rocks, the permeabilities
can be expressed as follows:
k2 ¼ ak1 and k3 ¼ bk1 (11.7)
where k1, k2, and k3 are the permeabilities of the above three classes of rocks,
respectively, whereas a and b are empirical factors which are less than 1.
The initial equations for the permeability parallel (kk) and perpendicular (k?) tothe bedding, using Eq. 11.7, are as follows:
kk ¼ ðk1h1 þ ak1h2 þ bk1h3Þ=ðh1 þ h2 þ h3Þ¼ k1ðh1 þ ah2 þ bh3Þ=ðh1 þ h2 þ h3Þ ð11:8Þ
and
k? ¼ ðh1 þ h2 þ h3Þ=ðh1=k1 þ h2=ak2 þ h3=bk3Þ¼ k1ðh1 þ h2 þ h3Þ=ðh1 þ h2=aþ h3=bÞ ð11:9Þ
where h1, h2 and h3 are the thicknesses of layers of good-quality reservoir rocks, low-
quality reservoir rocks, and non-reservoir rocks, respectively.
The anisotropy coefficient can be expressed as follows:
l ¼ ðkk=k?Þ1=2 ¼ ½ðh1 þ ah2 þ bh3Þðh1 þ h2=aþ h3=bÞ�1=2=ðh1 þ h2 þ h3Þ
(11.10)
MODELS OF STATIC GEOLOGIC SYSTEMS 215

or in terms of relative thicknesses,
l ¼ ½ðho1 þ aho2 þ bho3Þðho1 þ ho2=aþ ho3=bÞ�1=2 (11.11)
where hoi ¼ hi=P
hi and the hoi is the relative frequency of a layer having the per-
meability ki.
The last two equations show that the anisotropy coefficient is dependent on the
ratio of strata with a given thickness to the total thickness and on the empirical
factors. Inasmuch as the anisotropy coefficient is dimensionless, it is dependent on
the ratios of permeabilities and not on the permeability themselves.
The empirical factors a and b are constant for each particular formation or
a group of similar formations as a whole. For example, on assuming that
k1ave ¼ 61mD, k2ave ¼ 5mD, and k3ave ¼ 0:5mD, a ¼ 0:082 and b ¼ 0:0082, the
values of ki (i ¼ 1; 2; 3) and a and b average out the theoretical values of l. Meas-
urements of l, however, show that theoretically the thicknesses of the layer bands
have the major effect. Therefore, if only the hi for each stratigrafic–lithologic section
is known, one can calculate the anisotropy coefficients from Eq. 11.10 or 11.11.
This conclusion can be extended to multicomponent and multilayer media, as
shown by the following formulas:
l ¼ ½ðho1 þ aho2 þ bho3 þ � � � þ ohonÞðho1 þ ho2=aþ ho3=bþ � � � þ hon=oÞ�
1=2 (11.12)
or
l ¼X
n
i¼1
ðahoi ÞX
n
i¼1
ðhoi =aiÞ
" #1=2
(11.12a)
The median and the geometric-mean permeability is also used sometimes. From
Eq. 11.7, for a three-component multilayer medium, the geometric-mean permea-
bility (kgeom) is equal to
kgeom ¼ ðkkk?Þ1=2 ¼ k1½ðh1 þ ah2 þ bh3Þ=ðh1 þ h2=aþ h3=bÞ�
1=2 (11.13)
or in terms of relative thicknesses,
kgeom ¼ k1½ðho1 þ aho2 þ bho3Þ=ðh
o1 þ ho2=aþ ho3=bÞ�
1=2 (11.14)
The geometric-mean permeability differs from the anisotropy coefficient in being
dependent not only on the relative proportions of various strata and the empirical
coefficients, but also on the mean permeability (the base permeability). Thus, kgeomretains the dimensions of permeability.
In the case of a multicomponent multilayer medium, kgeom is equal to
kgeom ¼ kaveX
n
i¼1
ðaihoi Þ
,
X
n
i¼1
ðhoi =aiÞ
" #1=2
(11.15)
where kave is the average (mean) permeability of the reservoir. The hoi in Eqs. 11.12,
11.12a, and 11.15 is the relative frequency of any empirical factor.
MATHEMATICAL MODELING IN PETROLEUM GEOLOGY216

The Balakhany Formation of the Productive Series of the South Caspian Basin
was used as an example to show how the anisotropy was estimated. For this for-
mation, 356 measurements of permeability were made with corrections for the for-
mation pressure and temperature, because these rocks lie at a considerable depth
(3500–4500m). The permeability data were processed in order to determine
the anisotropy coefficients, average permeability, and variation of anisotropy
(Table 11.2).
The section of Productive Series of the South Caspian Basin is of rhythmic (cyclic)
nature: at the bottom, the rhythmic (cyclic) strata consist of thick and continuous
reservoir rocks with shale interbeds, whereas the reservoirs at the top are thin-
bedded. Formations can be grouped on the basis of similarity in the thicknesses of
individual layers. For example, one can combine formations at the base of the
rhythmic strata with thickness ranging from 3 to 20m (average ¼ 8m) into a single
group. The top units, which are made up of the thin layers (thickness ranges from 2
to 12m; average ¼ 5m), form another group. The anisotropy coefficients of thick
beds are high (l ¼ 4:4), whereas l ¼ 3:0 for thin beds. The mean anisotropy coef-
ficient for the entire Balakhany Formation is 3.9.
The value of l allows one to determine the sequence of thicknesses of beds from
thinner to thicker: the sequence can be based on anisotropy data obtained from logs
and cores. For example, Von Engelhardt (1964, in: Buryakovsky et al., 2001, p. 300)
presented laboratory results for the Dogger sandstones of Valanginian and Liassic
age (from the oil and gas fields in the Northern Germany). In all cases, the per-
meability parallel to the bedding was higher than the permeability perpendicular to
the bedding. On the average, the kk=k? ratio was 1.9, which gives a mean anisotropy
coefficient of 1.38. Mirchink’s (1948, in: Buryakovsky et al., 2001, p. 300) data for
sandstones in various USA oil fields show that the anisotropy coefficient increases
from 1.3 to 1.86 with a mean of 1.71, as the permeability increases from 3 to 770mD.
Generally, the median permeability of the clastic rocks varies from 10 to 100mD,
whereas the anisotropy coefficient fluctuates around 1.5. Thus, there is a numerical
sequence in the anisotropy coefficients, which ranges from microanisotropy (from
core data) with the median value of l ¼ 1:5 to macroanisotropy (from E-log data)
with the median value of l ¼ 3 for thin-bedded formations and l ¼ 4:4 for thick-
bedded ones.
11.2.1.3. Petrophysical relationships
Experimental and field studies of reservoir-rock properties at reservoir conditions
are of great importance. Successful development of oil and gas fields depends largely
on the knowledge of such reservoir-rock properties as porosity and permeability.
The permeability is one of the most important parameters describing a porous me-
dium, but permeability measurement has some restrictions and requires a rock
sample of suitable size and certain geometric shape. The requirement for measuring
the other petrophysical properties of rocks, such as porosity, grain-size distribution,
pore-size distribution, and specific surface areas, are less restricted. Correlation
between the permeability and other easier-to-measure quantities, therefore, have
been studied extensively both experimentally and theoretically.
MODELS OF STATIC GEOLOGIC SYSTEMS 217
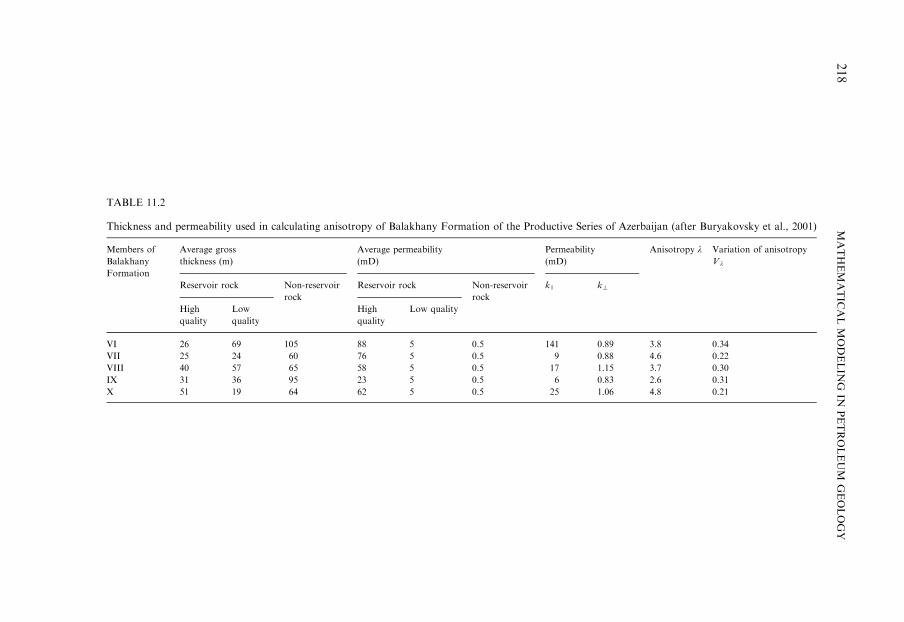
TABLE 11.2
Thickness and permeability used in calculating anisotropy of Balakhany Formation of the Productive Series of Azerbaijan (after Buryakovsky et al., 2001)
Members of
Balakhany
Formation
Average gross
thickness (m)
Average permeability
(mD)
Permeability
(mD)
Anisotropy l Variation of anisotropy
Vl
Reservoir rock Non-reservoir
rock
Reservoir rock Non-reservoir
rock
kJ k?
High
quality
Low
quality
High
quality
Low quality
VI 26 69 105 88 5 0.5 141 0.89 3.8 0.34
VII 25 24 60 76 5 0.5 9 0.88 4.6 0.22
VIII 40 57 65 58 5 0.5 17 1.15 3.7 0.30
IX 31 36 95 23 5 0.5 6 0.83 2.6 0.31
X 51 19 64 62 5 0.5 25 1.06 4.8 0.21
MATHEMATIC
ALMODELIN
GIN
PETROLEUM
GEOLOGY
218

If a reservoir is modeled by a bundle of capillary tubes, the rate of flow, q, can be
given by the Hagen–Poiseuille equation
q ¼ Npr4c Dp=8mLc (11.16)
where q is the volumetric flow rate (cm3/sec), N is the number of capillaries, rc is the
capillary radius (cm), Dp is the differential pressure across the capillaries (dyn/cm2),
m is the fluid viscosity (P) and Lc is the length of capillaries (cm).
The Darcy equation for rate of flow q is
q ¼ kADp=mLc (11.17)
where q is the volumetric rate of flow, k is the permeability (darcy), A is the total
cross-sectional area (cm2), Dp is the differential pressure (atm), m is the fluid viscosity
(cP), and Lc is the length of the flow path.
If, instead, viscosity is expressed in poises and differential pressure in dyn/cm2,
then
q ¼ 9:869� 10�9kDp=mLc (11.18)
The porosity f of this bundle of capillary tubes may be expressed as the capillary
volume Vc per unit of bulk volume, Vb:
f ¼ V c=Vb ¼ Npr2cLc=ALc ¼ Npr2c=A (11.19)
Thus, the total cross-sectional area A of the bundle of capillary tubes is
A ¼ Npr2c=f (11.20)
The average capillary tube radius rc may be found by combining Eqs. 11.16, 11.17,
and 11.20:
rc ¼ 2ð2k=fÞ1=2 (11.21)
The surface area per unit of pore volume sp is given by:
sp ¼ N2prcLc=Npr2cLc ¼ 2=rc (11.22)
On substituting the value of capillary tube radius from Eq. 11.21 into Eq. 11.22,
the specific surface area per unit of pore volume, sp, can be expressed as
sp ¼ ðf=2kÞ1=2 (11.23)
For the specific surface area per unit of grain volume of rock consisting of equal-
size spheres, the following formula was proposed (Buryakovsky et al., 2001):
sg ¼ A=V ¼ Npd2ð1� fÞ=V sph ¼ 6Npd2ð1� fÞ=Nd3p ¼ 6ð1� fÞ=d (11.24)
where A is the surface area, V is the bulk volume of rock, Vsph is the total volume of
spheres (cm3), N is the number of spheres per unit of grain volume, d is the diameter
of sphere (cm), and f is the porosity (fractional).
If spheres (grains) are not equal in size, then the specific surface area per unit of
grain volume of such a rock may be calculated using the following formula:
sg ¼ ½6ð1� fÞ=100�X
ðCi=d iÞ (11.25)
MODELS OF STATIC GEOLOGIC SYSTEMS 219

where d i is the average diameter of grains which constitute an ith grain-size fraction
with weight content of Ci in wt%. (Total grain-size distribution is expressed as
follows: C1 þ C2 þ � � � þ Ci þ � � � þ Cn ¼ 100%.)
Inasmuch as one of the main influences on the specific surface area is caused by
the clay content, Ccl, the empirical equation developed for the reservoir rocks is as
follows:
sg ¼ 75ð1� fÞCcl þ 532ð1� fÞð75Ccl þ 532Þð1� fÞ (11.26)
Assuming that fave ¼ 0:25, the average correlation between sg and Ccl will be as
follows:
sg ¼ 56:3Ccl þ 400 (11.27)
In order to determine the permeability from porosity and specific surface area, one
has to solve Eq. 11.23 for permeability
k ¼ f=ð2s2pÞ (11.28)
Inasmuch as a porous rock is more complex than a bundle of capillary tubes, a
constant Kcf is introduced. Thus, the equation for permeability becomes
k ¼ f=ðKcfs2pÞ (11.29)
Eq. 11.29 is the familiar Kozeny–Carman equation. Carman (1937, in: Bury-
akovsky et al., 2001, p. 304) noted that the constant Kcf is actually a complex
combination of two variables: shape factor for pores, shf, and tortuosity factor, t:
Kcf ¼ ðshf ÞðtÞ (11.30)
Tortuosity is equal to the square of the ratio of effective length Le to the length
parallel to the overall direction of flow of pore channels L:
t ¼ ðLe=LÞ2 (11.31)
Thus, the Kozeny–Carman constant Kcf is a function of both the shape of each
particular pore tube and its orientation relative to the overall direction of fluid flow.
Using the multivariable linear regression analysis, Chilingarian et al. (1990) de-
veloped an empirical expression for permeability in terms of porosity, specific sur-
face area, and irreducible fluid saturation for carbonate reservoir rocks, with very
high (40.9) coefficient of correlation between porosity and permeability.
This research resolved the age-long controversy whether there is a correlation
between porosity and permeability of carbonate rocks or not. By simply introducing
two additional variables (specific surface area and irreducible fluid saturation), there
is correlation between the porosity and permeability. Microfractures do not con-
tribute much to the porosity (fo1%) but are very permeable.
MATHEMATICAL MODELING IN PETROLEUM GEOLOGY220

11.2.2. Statistical approach
In terms of model dimension, the three types of probabilistic-statistical models are
defined as follows: (a) one-dimensional, (b) two-dimensional, and (c) multidimen-
sional.
11.2.2.1. One-dimensional models
11.2.2.1.1. Rock properties. The main petrophysical parameters characterizing the
properties of rocks are as follows: f — porosity (in %), k — permeability (in mD),
Ccl — clay content (in wt%), Ccarb — carbonate cement content (in wt%), relative
clay content, Z ¼ ð12fÞCcl=½ð12fÞCcl þ f�, Q100 — cation-exchange capacity (in
mg-eq. of exchangeable ions per 100 g of rock), and Ada — diffusion–adsorption
factor in mV.
Almost 4,000 analyses of sands, silts, and shales were made from more than 860
cores obtained from the Productive Series of Azerbaijan and adjacent offshore areas.
The cores from Baku Archipelago, South Absheron Offshore Zone, and Lower Kura
Depression were tested (Buryakovsky et al., 1986b, 2001). Fig. 11.7 shows the sta-
tistical distributions of various rock properties.
The surface activity parameters were determined for different types of rocks.
Table 11.3 gives the results of data processing of Ada parameter taking into
consideration the grain size. This table allows: (1) approximate determination of
lithology in studied sections, (2) estimation of an average Ada based on lithology, and
(3) analysis of Ada distribution in all types of rocks. The same types of rocks in the
offshore areas have lower Ada than in the onshore areas. This difference is largely
due to the grain size: sands — approximately 2.1–4.2 times lower; silts — 1.2–1.7
times lower; and argillaceous rocks — 1.1 times lower.
The grain-size characteristics alone, however, do not determine the surface activity
parameters. The mineralogy is also of great importance. The rocks of the North Baku
Archipelago and South Absheron Offshore Zone are composed of quartz and quartz
plus feldspar grains (these rocks belong to the oligomictic18 and mesomictic classes).
The rocks of the Lower Kura Depression belong mainly to polymictic and graywacke
classes having a low quartz content, high feldspar content, and different rock frag-
ments (shale, flint, effusive). Fig. 11.8 shows the tendency of Q100 and Ada parameters
to decrease with increasing quartz content. Close to zero Ada is predicted in oligomic-
tic rocks with quartz content higher than 75%. By decreasing quartz content to
30–40% and increasing feldspar content to 50–60%, Ada increases to 50mV.
In addition to the grain size and mineralogical composition, the surface activity is
greatly influenced by the content and type of clays, which are present mainly as a
cementing material in reservoir rocks.
The X-ray analyses of core samples from the Lower Kura Depression in Azerbaijan
are correlatable with the surface activity of these rocks. The main clay minerals are
18Oligomictic rock is a clastic sedimentary rock composed almost of quartz grains (more than 75%);
mesomictic is a sedimentary rock with quartz content between 50 and 75%; polymictic is a sedimentary
rock composed of many rock types with quartz content not more than 50%.
MODELS OF STATIC GEOLOGIC SYSTEMS 221
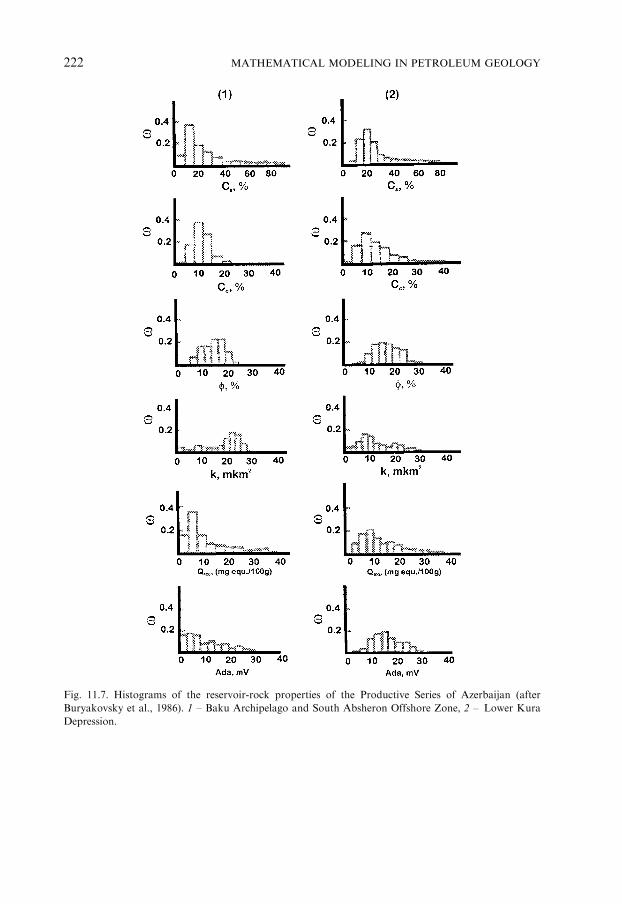
Fig. 11.7. Histograms of the reservoir-rock properties of the Productive Series of Azerbaijan (after
Buryakovsky et al., 1986). 1 – Baku Archipelago and South Absheron Offshore Zone, 2 – Lower Kura
Depression.
MATHEMATICAL MODELING IN PETROLEUM GEOLOGY222

TABLE 11.3
Distribution of Ada parameter in the various rocks of Baku Archipelago and Lower Kura Depression in Azerbaijan
Type of rock Baku Archipelago (Na ¼ 159) Lower Kura Depression (Na ¼ 196)
Frequency (in %) of Ada intervals (in mV) Mean Ada (mV) Frequency (in %) of Ada intervals (in mV) Mean Ada (mV)
0–15 15–30 30–45 45–60 460P
0–15 15–30 30–45 45–60 460P
Coarse sand 3.8 — — — — 3.8 7.5 — — — — — — —
Medium/fine sands 17.6 3.1 — — — 20.7 9.7 1.5 8.7 3.1 — — 13.3 24.2
Sandy loam 5.7 3.8 — — — 9.5 13.5 1.5 8.7 5.6 1.0 — 16.8 28.0
Chlidolite — — — — — — — 1.5 6.1 2.6 1.0 — 11.2 26.6
Sandy silt 11.3 0.6 — — — 11.9 8.3 — 1.5 4.6 0.5 — 6.6 35.1
Silt 4.4 11.3 3.2 — — 18.9 21.5 — 1.5 0.5 0.5 — 2.6 31.5
Clayey silt 0.6 7.6 12.6 0.6 — 21.4 30.9 0.5 8.7 18.4 11.2 0.5 39.4 38.5
Loam — 0.6 — — — 0.6 22.5 — 2.1 1.5 1.5 0.5 5.6 38.8
Sandy–silty shale — — 2.5 5.7 1.3 9.5 50.3 — — — 3.6 1.0 4.6 55.8
Shale — — — 3.1 0.6 3.7 55.0 — — — — — — —
Overall rocks 43.4 27.0 18.3 9.4 1.9 100 22.4 5.0 37.4 36.3 19.3 2.0 100 33.9
aN ¼ number of samples.
MODELSOFSTATIC
GEOLOGIC
SYSTEMS
223

Fig. 11.8. Dependence of surface activity parameters on the mineral composition of rocks in Azerbaijan
(after Buryakovsky et al., 1986). a - Bakhar Field, b - Sangachaly–Duvanny Deniz–Khara Zyrya Field.
MATHEMATICAL MODELING IN PETROLEUM GEOLOGY224

montmorillonite (40 to � 100wt%) and illite (0–35wt%). The content of kaolinite,
chlorite, and mixed-layered minerals is approximately equal to 0 to 15–20wt%. The
average content (in wt%) of clays are montmorillonite, 75%; illite, 12%; kaolinite,
5%; chlorite, 4%; and mixed-layered, 4%.
Difference in the content of montmorillonite and other clay minerals in these two
regions is quite low, except for clays present in the reservoir rocks. The montmo-
rillonite content in the clay cement of reservoir rocks of the Lower Kura Depression
is almost twice higher than in the reservoir rocks of the Baku Archipelago and South
Absheron Offshore Zone. This explains why the surface activity of reservoir rocks of
the Lower Kura Depression is higher than that in the offshore areas. The Ada is
practically the same when the montmorillonite content in clays is the same. It is well
known that the surface activity of montmorillonite clay is higher in comparison with
other clay minerals.
11.2.2.1.2. Crude oil properties. Crude oil is a complex natural system consisting of
various components with a considerable predominance of different hydrocarbon
groups. Many different classifications of crude oils have been devised. A rational
basis of classification is found in some expression of the composition of oils. Com-
position of oil is determined by separating it into fractions according to the boiling
point (molecular weight), followed by establishing the types of hydrocarbons present
in each fraction.
To determine the fractional composition of oil, one can use a method of separating
it into fractions according to the boiling point (fractional distillation). Fractional
composition reflects relative content in percent by weight (wt%) of different oil
fractions boiling within definite boiling-point ranges. In Russia, the following main
fractions are distinguished: (1) ‘‘benzine’’ fraction with boiling points ranging from
401C to 2001C, (2) ‘‘ligroin’’ fraction with boiling points ranging from 2001C to
3501C, and (3) residual oil with boiling points ranging from 3501C to 5001C.19
In order to evaluate the geochemical history, in addition to the fractional oil
composition, group-hydrocarbon composition of different fractions is also used, i.e.,
content of paraffinic, naphthenic, and aromatic groups of hydrocarbons. The group-
hydrocarbon composition of crude oil can be clearly presented on a mixture triangle.
Based on more than 100 samples of oils from the Absheron Archipelago fields of the
South Caspian Basin, the hydrocarbon-group composition of light fractions of crude
oil (gasoline and ligroin) was plotted on a triangular diagram in Fig. 11.9. Besides
hydrocarbon components, different non-hydrocarbon components are present in the
crude oil. Asphaltenes plus resins constitute the major portion of non-hydrocarbon
components.
Crude oil density and the contents of asphaltenes plus resins, gasoline, and ligroin
of the crude oil from Neft Dashlary oilfield in the Absheron Archipelago are pre-
sented as histograms in Fig. 11.10.
19In USA, the ‘‘benzine’’ fraction as used in Russia, includes light naphtha, gasoline, and heavy naphtha;
‘‘ligroin’’ fraction includes kerosene, stove oil, and light gas oil; and residua includes heavy gas oil,
lubricating oil, and vacuum gas oil.
MODELS OF STATIC GEOLOGIC SYSTEMS 225

In the northwestern part of the Absheron Archipelago (Darvin Bank, Pirallaghi
Adasi, and Gyurgyany Deniz fields), based on 1,642 analyses, average crude oil
parameters (with evaluation of their variation within 2s limits (95% of confidence))
can be presented as follows:
g ¼ 0:9137� 0:0240 g=cm3 gave ¼ 0:9137� 0:0006 g=cm3
R ¼ 37:2� 15:1% Rave ¼ 37:2� 0:37%
B ¼ 1:54� 1:20% Bave ¼ 1:54� 0:03%
L ¼ 7:4� 1:3% Lave ¼ 7:4� 0:03%
where g is the density, R is the content of asphaltenes plus resins, B is the ‘‘benzine’’
(gasoline) content, and L is the content of ligroin.
Based on 820 analyses, in the southeastern part of the Absheron Archipelago
(Chalov Adasi, Palchygh Pilpilasi, and Neft Dashlary oilfields) these crude oil pa-
rameters are equal to
g ¼ 0:8800� 0:0380 g=cm3 gave ¼ 0:8800� 0:0013 g=cm3
R ¼ 22:7� 11:8% Rave ¼ 22:7� 0:41%
B ¼ 7:4� 7:5% Bave ¼ 7:4� 0:26%
L ¼ 9:6� 8:0% Lave ¼ 9:6� 0:28%
The crude oil of the northwestern part of the Absheron Archipelago contains more
asphaltenes and resins and less low-boiling fractions; hence, its density is higher than
that of oil from the southeastern part of archipelago.
Using both numerical characteristics and histograms as they are or as frequency
polygons (related frequencies), one can solve different geological and geochemical
problems. For example, Fig. 11.11 shows the distribution of oil density in different
Fig. 11.9. Hydrocarbon-group composition of light fractions of crude oils from the Neft Dashlary Field
in Azerbaijan (after Buryakovsky et al., 2001). � ¼ ‘‘benzine’’ (gasoline); � ¼ ‘‘ligroin’’.
MATHEMATICAL MODELING IN PETROLEUM GEOLOGY226

formations of the stratigraphic section of Neft Dashlary Field. With increasing
stratigraphic depth, the density of crude oil increases. These trends, however, are not
present in the upper formations. The increase in the oil density in the upper for-
mations is related to the oxidation of oil by near-surface agents, which increases the
content of asphaltenes plus resins and decreases the gasoline content.
11.2.2.2. Two-dimensional models
11.2.2.2.1. Reservoir rocks. Correlations among the reservoir-rock properties in
the form of average (orthogonal) regression lines are shown in Figs. 11.12 and 11.13
for two regions of Azerbaijan: (1) Baku Archipelago and South Absheron Offshore
Zone and (2) the Lower Kura Depression. The correlation coefficient (r) is presented
Fig. 11.10. Histograms of crude oil density (a), content of resins plus asphaltenes (b), and ‘‘benzine’’
(gasoline) content (c) in the crude oils of Neft Dashlary Field of Azerbaijan (after Buryakovsky et al.,
2001). Formations (from section top to bottom): 1: – Balakhany, 2 – Fasila, 3 – Nadkirmaku sandy
(NKP), 4 – Kirmaku (KS), 5 – Podkirmaku (PK), 6 – Kala (KaS).
MODELS OF STATIC GEOLOGIC SYSTEMS 227

in all cases. The correlation coefficients and criteria of their significance (three times
the standard deviation sr) are presented in Table 11.4.
From 32 correlations studied, only one differs slightly from zero at a significance
level a ¼ 0:05 (when a ¼ 0:01, this correlation is significant). This correlation is
the dependence of permeability on the clay content of the rocks of Lower Kura
Depression. All other correlations are reliable enough and have a high statistical
Fig. 11.11. Variation of crude oil density from the top to bottom of the section in the Neft Dashlary
Field, Azerbaijan. Formations (from section top to bottom): (a) Balakhany, (b) Fasila, (c) Nadkirmaku
sandy (NKP), (d) Kirmaku (KS), (e) Podkirmaku (PK), (f) Kala (KaS). Fault blocks: 1 – II, 2 – IV, 3 – III,
4 – V.
MATHEMATICAL MODELING IN PETROLEUM GEOLOGY228

stability, i.e., they are controlled by geological factors. The relationships between the
surface activity parameters of rocks and their porosity and clay content (Q100 and
Ada vs. f, Csh and Z curves) and their relationships between each other (Q100 vs. Ada,
and f vs. Csh and Z) are very useful in petrophysical practice.
Sixteen correlations between variables (reservoir-rock properties and surface ac-
tivity parameters) are presented in Table 11.5. All these equations can be generalized
as the following single model:
F iðyÞ ¼ ai þ bif ðxiÞ þ cicðxiÞ (11.32)
where a, b, and c are the empirical coefficients.
Besides these equations, several empirical relationships were developed for the
entire Productive Series of Azerbaijan. Relationships between the permeability, k,
and clay content, Ccl, for various types of rocks are as follows:
Sand and silt : lg k ¼ 7:0� 0:222Ccl
Clayey silt : lg k ¼ 7:5� 0:182Ccl
Chlidolite : lg k ¼ 3:8� 0:200Ccl
Fig. 11.12. Correlations between properties of the Productive Series reservoir rocks of Azerbaijan (after
Buryakovsky et al., 1986). 1 – Baku Archipelago and South Absheron Offshore Zone, 2 – Lower Kura
Depression.
MODELS OF STATIC GEOLOGIC SYSTEMS 229

More sophisticated relationship between the permeability and clay cement content
and carbonate cement content was developed as follows:
k ¼ ð6700� 130CclÞ exp½�ð0:000172C2cl � 0:01172Ccl � 0:1ÞCcarb� (11.33)
where Ccl is the clay cement content (in wt%) and Ccarb the carbonate cement
content (in wt%).
Another relationship among the permeability, porosity, clay cement content, and
carbonate cement content may be expressed as follows:
lg k ¼ 3:935þ 0:02f� 0:075Ccarb � 0:05Ccl (11.34)
with a correlation coefficient of multivariable regression of 0.8.
11.2.2.2.2. Crude oil. There are relationships among the crude oil parameters and
its composition. These relationships can be studied by correlation and regression
Fig. 11.13. Relationships among the reservoir-rock properties, surface activity parameters, and relative
clay content (Z) of the Productive Series of Azerbaijan (after Buryakovsky et al., 1986). 1 – Baku Ar-
chipelago and South Absheron Offshore Zone, 2 – Lower Kura Depression.
MATHEMATICAL MODELING IN PETROLEUM GEOLOGY230

TABLE 11.4
Correlation coefficients between variables and their accuracy
Eq. No. Correlation between variables Baku Archipelago and South Apsheron Offshore Zone Lower Kura Depression
N 9r9 sr 3sr N 9r9 sr 3sr
1 f�Ccarb 287 0.192 0.057 0.171 524 0.490 0.033 0.099
2 k–Ccarb 167 0.390 0.060 0.180 254 0.510 0.016 0.140
3 f–Ccl 273 0.473 0.047 0.141 430 0.228 0.046 0.133
4 k–Ccl 165 0.442 0.063 0.189 198 0.131 0.062 0.186
5 f– Zcl 282 0.574 0.040 0.120 532 0.541 0.031 0.093
6 k– Zcl 162 0.555 0.054 0.162 237 0.570 0.044 0.132
7 k–f 162 0.530 0.057 0.171 252 0.715 0.031 0.093
8 Q100–Ccl 246 0.610 0.040 0.120 284 0.522 0.043 0.129
9 Ada–Ccl 163 0.718 0.038 0.114 199 0.256 0.066 0.198
10 Q100– Zcl 247 0.626 0.039 0.117 341 0.400 0.045 0.135
11 Ada– Zcl 161 0.715 0.039 0.115 252 0.397 0.053 0.159
12 Q100–f 243 0.433 0.052 0.156 284 0.381 0.051 0.151
13 Ada–f 157 0.631 0.048 0.144 203 0.418 0.058 0.174
14 Q100– k 150 0.360 0.071 0.213 151 0.351 0.071 0.213
15 Ada– k 99 0.576 0.067 0.201 139 0.468 0.066 0.198
16 Q100–Ada 157 0.670 0.044 0.132 169 0.408 0.064 0.192
Definitions of variables: N ¼ number of tests; 9r9 ¼ absolute value of correlation coefficient; sr ¼ standard deviation; f ¼ porosity; k ¼ permeability;
Ccl ¼ clay cement content; Ccarb ¼ carbonate cement content; Zcl ¼ relative clay content (Zcl ¼ (1–f)Ccl/[(1–f)Ccl+f]); Q100 ¼ cation-exchange capacity;
Ada ¼ diffusion–adsorption parameter.
MODELSOFSTATIC
GEOLOGIC
SYSTEMS
231

analyses. The correlation analysis shows the presence, strength, and sign of the
relationship among the correlated parameters, whereas the regression analysis
enables one to establish the type of relationship or to develop models. For example,
correlation matrices for different crude oils from offshore oilfields of the Absher-
on Archipelago in the South Caspian Basin were obtained from correlation
analysis. Several types of correlation matrices with different number of analyses and,
therefore, with different reliable values of the correlation coefficient, were deter-
mined. Table 11.6 is a generalized matrix of correlation coefficients for the oil
and gas fields of the Absheron Archipelago. Instead of numerical values of corre-
lation coefficients in this table, only the signs of coefficients with reliable values are
presented.
Owing to different relationships, estimation of a certain number of parameters of a
given crude oil may be sufficient to make a conclusion about values of other pa-
rameters. The simplest and at the same time one of the main properties of crude oil is
its density, which is closely dependent on the fractional composition and the content
of asphaltenes and resins in the crude oil. Relationships among the major crude oil
parameters is of great interest from the point of view of petroleum geochemistry, and
equations derived by regression analysis can serve as mathematical models of the
crude oils.
The influence of these components of crude oil on density can be studied by means
of correlation for four parameters: (1) g ¼ oil density (in g/cm3), (2) R ¼ content of
resins plus asphaltenes (in wt%), (3) B ¼ content of gasoline (in wt%), and (4)
L ¼ content of ligroin in (wt%). Based on 820 analyses, the correlation between the
oil density and content of resins plus asphaltenes was tabulated (Table 11.7) as an
example. Empirical equation of relationship (see Fig. 11.14) between the density and
content of resins plus asphaltenes in the crude oil in the form of regression R on g is
as follows:
g ¼ 0:826þ 0:00237R (11.35)
TABLE 11.5
Correlation equations among parameters of reservoir-rock properties in Azerbaijan
Eq. No. Equation Eq. No. Equation
1 f ¼ a32b3Ccarb þ c3C2carb
9 Ada ¼ a9 þ b9pCcl
2 lg k ¼ a42b4Ccarb 10 Q100 ¼ a142b14Zcl þ c14Z2cl
3 f ¼ a12b1 lgCcl 11 Ada ¼ 2a15 þ b15Zcl4 lg k ¼ a22b2Ccl 12 lgQ100 ¼ a102b10f
5 f ¼ a62b6Zcl 13 Ada ¼ a112b11f
6 lg k ¼ a72b7Zcl 14 Q100 ¼ a122b12 lg k
7 lg k ¼ a5 þ b5f 15 Ada ¼ a132b13 lg k
8 Q100 ¼ a8 þ b8Ccl 16 Ada ¼ 2a16 þ b16pQ100
See Table 11.4 for definitions of variables.
MATHEMATICAL MODELING IN PETROLEUM GEOLOGY232
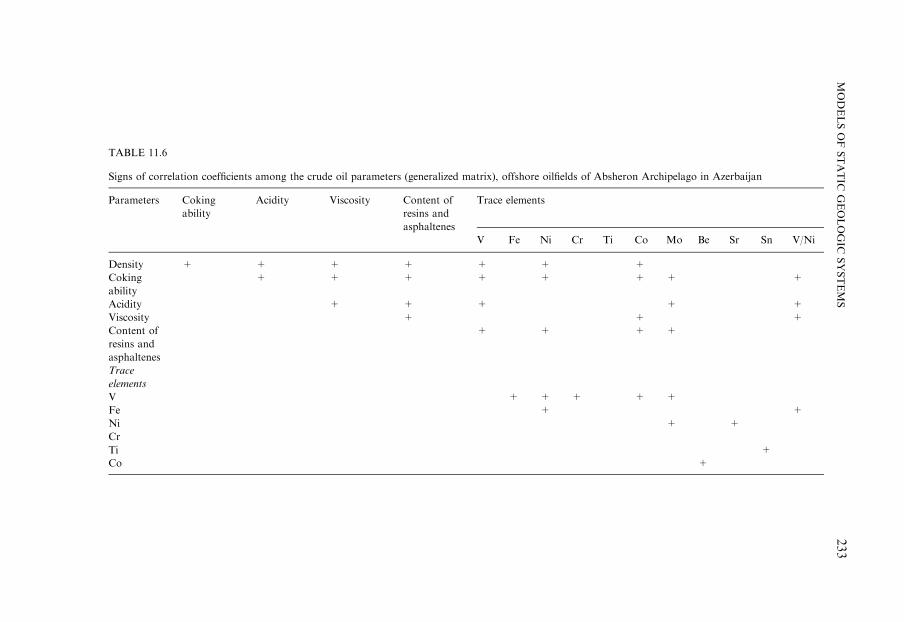
TABLE 11.6
Signs of correlation coefficients among the crude oil parameters (generalized matrix), offshore oilfields of Absheron Archipelago in Azerbaijan
Parameters Coking
ability
Acidity Viscosity Content of
resins and
asphaltenes
Trace elements
V Fe Ni Cr Ti Co Mo Be Sr Sn V/Ni
Density + + + + + + +
Coking
ability
+ + + + + + + +
Acidity + + + + +
Viscosity + + +
Content of
resins and
asphaltenes
+ + + +
Trace
elements
V + + + + +
Fe + +
Ni + +
Cr
Ti +
Co +
MODELSOFSTATIC
GEOLOGIC
SYSTEMS
233

or in the form of regression g on R:
R ¼ 212ðg� 0:778Þ (11.36)
The correlation coefficient between the R and g is 0.710.
Using the technique proposed by Buryakovsky et al. (1974), the equation of or-
thogonal regression can be written in the following form:
R ¼ 295ðg� 0:805Þ; g ¼ 0:0034Rþ 0:805 (11.37)
Both equations are equivalent. Conjugated equations of regression represent the
conjugated axes of the correlation ellipse.
According to the equations of orthogonal regression developed for Azerbaijan
crude oils, the crude oil having density of 0.805 g/cm3 does not contain resins and
asphaltenes. It is noteworthy that the value of 0.802 g/cm3 corresponds approxi-
mately to the density of ligroin obtained by refining crude oil from fields of the
Absheron oil and gas region of Azerbaijan. If the content of resins and asphaltenes
varies from 57% to 87%, the density reaches 1.0–1.1 g/cm3, i.e., crude oil is changing
into asphalt.
Conjugated and orthogonal lines of regression, the equations of which were given
earlier, are presented in Fig. 11.14a. Lines of equal probability of the pairs g and R
are drawn in accordance with the correlation table (see Table 11.7). As shown, the
form and the tightness of the contour lines along the main axis may also show a
TABLE 11.7
Correlation between the crude oil density and content of resins plus asphaltenes (after Buryakovsky and
Dzhevanshir, 1992)
Density (g/cm3) Content of resins plus asphaltenes (wt%) Ng
range Dg average gave 5–10 10–15 15–20 20–25 25–30 30–35 35–40 40–45 45–50
7.5 12.5 17.5 22.5 27.5 32.5 37.5 42.5 47.5
0.815–0.825 0.82 2 2
0.825–0.835 0.83 3 3 3 9
0.835–0.845 0.84 1 10 20 4 35
0.845–0.855 0.85 3 20 35 8 66
0.855–0.865 0.86 16 24 11 2 53
0.865–0.875 0.87 4 32 47 11 94
0.875–0.885 0.88 3 32 130 56 3 3 227
0.885–0.895 0.89 3 13 95 63 3 177
0.895–0.905 0.90 2 39 43 6 2 92
0.905–0.915 0.91 1 7 10 8 7 2 1 36
0.915–0.925 0.92 4 8 4 1 1 18
0.925–0.935 0.93 1 3 1 1 2 8
0.935–0.945 0.94 1 1 1 3
NR 9 59 162 341 191 32 18 4 4 820
Ng ¼ number of crude oil density determinations; NR ¼ number of determinations of resins plus as-
phaltenes content.
MATHEMATICAL MODELING IN PETROLEUM GEOLOGY234

sufficiently close relation between the density and content of resins plus asphaltenes
in crude oil. Variations in the parameters were as follows: vR ¼ 26:0% and
vg ¼ 2:2% for R and g, respectively. This shows that the content of resins plus
asphaltenes varies more than density.
The crude oil density is greatly affected by the content of low-boiling components.
With increasing content of gasoline and ligroin, the density of oil decreases. Based on
792 analyses of crude oil, equations for the relationship between the oil density and
gasoline content were determined as follows:
g ¼ 0:9063� 0:00380B (11.38)
and
B ¼ 143:7� 155g (11.39)
The equations of the line of orthogonal regression (the main axis of the correlation
ellipse) were presented as follows:
g ¼ 0:915� 0:0500B; B ¼ 200ð0:915� gÞ (11.40)
The correlation coefficient of �0.760 indicated a sufficiently close, reverse, linear
relation between g and B. At g ¼ 0:915 g=cm3, crude oil no longer contains gasoline
fraction. The coefficient of variation for distribution of gasoline content was 51.4%,
whereas for density it was 2.2%. Lines of equal probability form concentrically
situated ovals stretched along the main axis (Fig. 11.14b). Calculated values of
Fig. 11.14. Orthogonal and conjugated regression lines for relationships in crude oils from Neft Dashlary
Field, offshore Azerbaijan (after Buryakovsky and Dzhevanshir, 1992). (a) Oil density (g/cm3) versus
content of resins (R, %); (b) oil density versus ‘‘benzine’’ (gasoline) content (B, %). 1 – Regression of g on
R and B; 2 – regression of R or B on g, 3 – equal-frequency curve; 4 – ellipse of correlation; 5 – major axis
of the ellipse (line of orthogonal regression); 6 – minor axis of the ellipse.
MODELS OF STATIC GEOLOGIC SYSTEMS 235
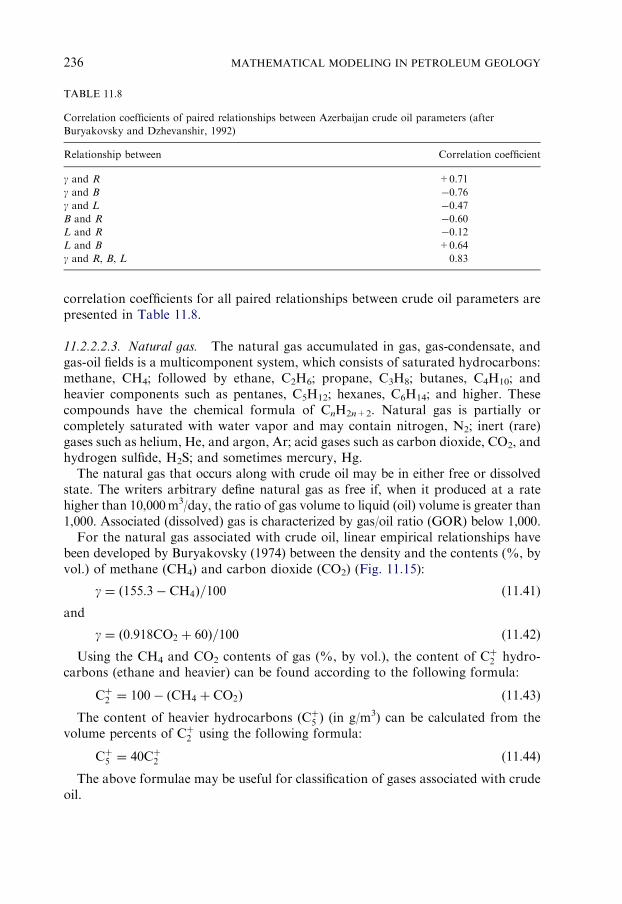
correlation coefficients for all paired relationships between crude oil parameters are
presented in Table 11.8.
11.2.2.2.3. Natural gas. The natural gas accumulated in gas, gas-condensate, and
gas-oil fields is a multicomponent system, which consists of saturated hydrocarbons:
methane, CH4; followed by ethane, C2H6; propane, C3H8; butanes, C4H10; and
heavier components such as pentanes, C5H12; hexanes, C6H14; and higher. These
compounds have the chemical formula of CnH2n+2. Natural gas is partially or
completely saturated with water vapor and may contain nitrogen, N2; inert (rare)
gases such as helium, He, and argon, Ar; acid gases such as carbon dioxide, CO2, and
hydrogen sulfide, H2S; and sometimes mercury, Hg.
The natural gas that occurs along with crude oil may be in either free or dissolved
state. The writers arbitrary define natural gas as free if, when it produced at a rate
higher than 10,000m3/day, the ratio of gas volume to liquid (oil) volume is greater than
1,000. Associated (dissolved) gas is characterized by gas/oil ratio (GOR) below 1,000.
For the natural gas associated with crude oil, linear empirical relationships have
been developed by Buryakovsky (1974) between the density and the contents (%, by
vol.) of methane (CH4) and carbon dioxide (CO2) (Fig. 11.15):
g ¼ ð155:3� CH4Þ=100 (11.41)
and
g ¼ ð0:918CO2 þ 60Þ=100 (11.42)
Using the CH4 and CO2 contents of gas (%, by vol.), the content of Cþ2 hydro-
carbons (ethane and heavier) can be found according to the following formula:
Cþ2 ¼ 100� ðCH4 þ CO2Þ (11.43)
The content of heavier hydrocarbons (Cþ5 ) (in g/m3) can be calculated from the
volume percents of Cþ2 using the following formula:
Cþ5 ¼ 40Cþ
2 (11.44)
The above formulae may be useful for classification of gases associated with crude
oil.
TABLE 11.8
Correlation coefficients of paired relationships between Azerbaijan crude oil parameters (after
Buryakovsky and Dzhevanshir, 1992)
Relationship between Correlation coefficient
g and R +0.71
g and B �0.76
g and L �0.47
B and R �0.60
L and R �0.12
L and B +0.64
g and R, B, L 0.83
MATHEMATICAL MODELING IN PETROLEUM GEOLOGY236

11.2.2.2.4. Formation water. The total salinity of formation waters and their com-
position depend on a number of subsurface processes, which are controlled by var-
ious natural factors. Because of different processes of formation and evolution of salt
content, subsurface waters in different oil and gas fields significantly differ in their
characteristics. That is why, the preparation of reliable formation water classifica-
tions for the formation water identification (and clarification of its origin and sub-
sequent evolution) is of great importance. In spite of significant variation in the salt
composition, it is possible to classify formation waters using an approach based on
mathematical simulation.
The main component of formation water in most oilfields is sodium chloride.
Thus, water salinity depends mainly on the content of chlorine anions or sodium
cations. Relationship between the content of chlorine rCl� or sodium rNa+ ions and
water salinityP
r can be described as a linear functionX
r ¼ a1rCl� þ a2
X
r ¼ b1rNaþ þ b2ð11:45Þ
Fig. 11.15. Relationships between the specific gravity of gas (compared to air) and the contents of CH4
and CO2.
MODELS OF STATIC GEOLOGIC SYSTEMS 237
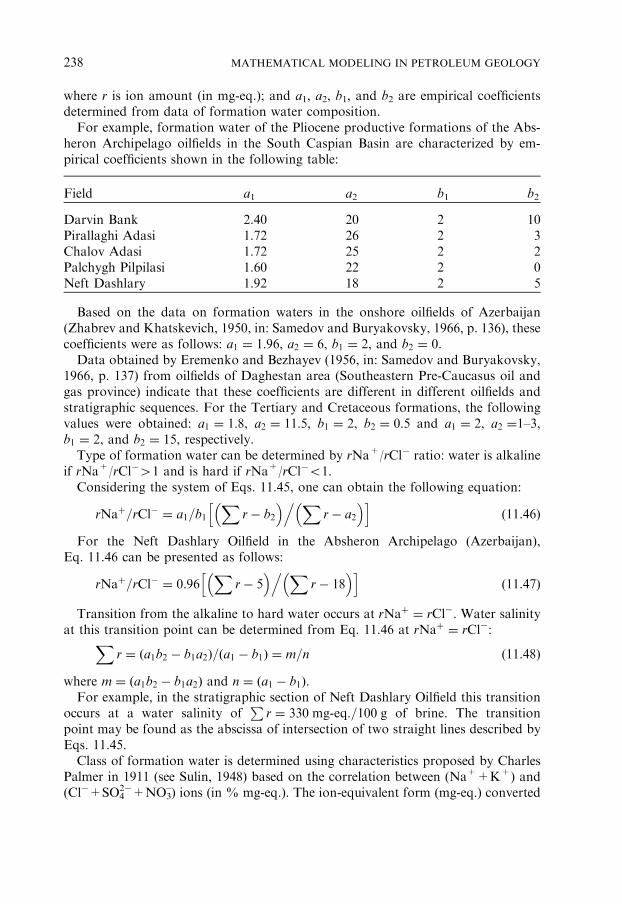
where r is ion amount (in mg-eq.); and a1, a2, b1, and b2 are empirical coefficients
determined from data of formation water composition.
For example, formation water of the Pliocene productive formations of the Abs-
heron Archipelago oilfields in the South Caspian Basin are characterized by em-
pirical coefficients shown in the following table:
Field a1 a2 b1 b2
Darvin Bank 2.40 20 2 10
Pirallaghi Adasi 1.72 26 2 3
Chalov Adasi 1.72 25 2 2
Palchygh Pilpilasi 1.60 22 2 0
Neft Dashlary 1.92 18 2 5
Based on the data on formation waters in the onshore oilfields of Azerbaijan
(Zhabrev and Khatskevich, 1950, in: Samedov and Buryakovsky, 1966, p. 136), these
coefficients were as follows: a1 ¼ 1:96, a2 ¼ 6, b1 ¼ 2, and b2 ¼ 0.
Data obtained by Eremenko and Bezhayev (1956, in: Samedov and Buryakovsky,
1966, p. 137) from oilfields of Daghestan area (Southeastern Pre-Caucasus oil and
gas province) indicate that these coefficients are different in different oilfields and
stratigraphic sequences. For the Tertiary and Cretaceous formations, the following
values were obtained: a1 ¼ 1:8, a2 ¼ 11:5, b1 ¼ 2, b2 ¼ 0:5 and a1 ¼ 2, a2 ¼1–3,
b1 ¼ 2, and b2 ¼ 15, respectively.
Type of formation water can be determined by rNa+/rCl� ratio: water is alkaline
if rNa+/rCl�41 and is hard if rNa+/rCl�o1.
Considering the system of Eqs. 11.45, one can obtain the following equation:
rNaþ=rCl� ¼ a1=b1X
r� b2
� �.
X
r� a2
� �h i
(11.46)
For the Neft Dashlary Oilfield in the Absheron Archipelago (Azerbaijan),
Eq. 11.46 can be presented as follows:
rNaþ=rCl� ¼ 0:96X
r� 5� �.
X
r� 18� �h i
(11.47)
Transition from the alkaline to hard water occurs at rNaþ ¼ rCl�. Water salinity
at this transition point can be determined from Eq. 11.46 at rNaþ ¼ rCl�:X
r ¼ ða1b2 � b1a2Þ=ða1 � b1Þ ¼ m=n (11.48)
where m ¼ ða1b2 � b1a2Þ and n ¼ ða1 � b1Þ.
For example, in the stratigraphic section of Neft Dashlary Oilfield this transition
occurs at a water salinity ofP
r ¼ 330 mg-eq:=100 g of brine. The transition
point may be found as the abscissa of intersection of two straight lines described by
Eqs. 11.45.
Class of formation water is determined using characteristics proposed by Charles
Palmer in 1911 (see Sulin, 1948) based on the correlation between (Na++K+) and
(Cl�+SO42�+NO3
–) ions (in % mg-eq.). The ion-equivalent form (mg-eq.) converted
MATHEMATICAL MODELING IN PETROLEUM GEOLOGY238
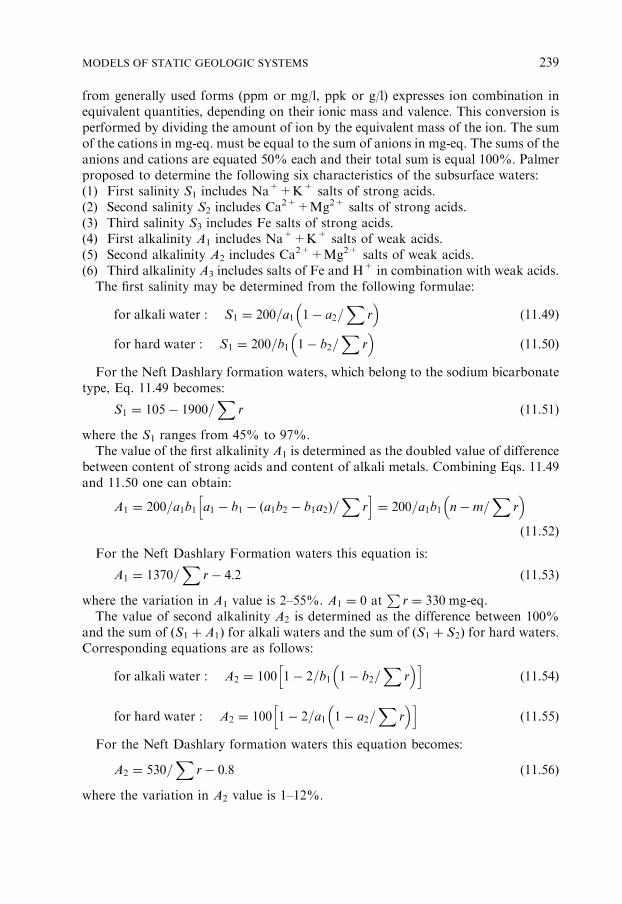
from generally used forms (ppm or mg/l, ppk or g/l) expresses ion combination in
equivalent quantities, depending on their ionic mass and valence. This conversion is
performed by dividing the amount of ion by the equivalent mass of the ion. The sum
of the cations in mg-eq. must be equal to the sum of anions in mg-eq. The sums of the
anions and cations are equated 50% each and their total sum is equal 100%. Palmer
proposed to determine the following six characteristics of the subsurface waters:
(1) First salinity S1 includes Na++K+ salts of strong acids.
(2) Second salinity S2 includes Ca2++Mg2+ salts of strong acids.
(3) Third salinity S3 includes Fe salts of strong acids.
(4) First alkalinity A1 includes Na++K+ salts of weak acids.
(5) Second alkalinity A2 includes Ca2++Mg2+ salts of weak acids.
(6) Third alkalinity A3 includes salts of Fe and H+ in combination with weak acids.
The first salinity may be determined from the following formulae:
for alkali water : S1 ¼ 200=a1 1� a2=X
r� �
(11.49)
for hard water : S1 ¼ 200=b1 1� b2=X
r� �
(11.50)
For the Neft Dashlary formation waters, which belong to the sodium bicarbonate
type, Eq. 11.49 becomes:
S1 ¼ 105� 1900=X
r (11.51)
where the S1 ranges from 45% to 97%.
The value of the first alkalinity A1 is determined as the doubled value of difference
between content of strong acids and content of alkali metals. Combining Eqs. 11.49
and 11.50 one can obtain:
A1 ¼ 200=a1b1 a1 � b1 � ða1b2 � b1a2Þ=X
rh i
¼ 200=a1b1 n�m=X
r� �
(11.52)
For the Neft Dashlary Formation waters this equation is:
A1 ¼ 1370=X
r� 4:2 (11.53)
where the variation in A1 value is 2–55%. A1 ¼ 0 atP
r ¼ 330 mg-eq.
The value of second alkalinity A2 is determined as the difference between 100%
and the sum of ðS1 þ A1Þ for alkali waters and the sum of ðS1 þ S2Þ for hard waters.
Corresponding equations are as follows:
for alkali water : A2 ¼ 100 1� 2=b1 1� b2=X
r� �h i
(11.54)
for hard water : A2 ¼ 100 1� 2=a1 1� a2=X
r� �h i
(11.55)
For the Neft Dashlary formation waters this equation becomes:
A2 ¼ 530=X
r� 0:8 (11.56)
where the variation in A2 value is 1–12%.
MODELS OF STATIC GEOLOGIC SYSTEMS 239
The first and second alkalinity exhibit simple correlation with the various
components of brine. The first alkalinity depends on the content of SO42� ion as
follows:
A1 ¼ c� drSO2�4 (11.57)
where c ¼ 30 and d ¼ 50 for Neft Dashlary Formation waters.
The second alkalinity depends on the content of Ca2+ and Mg2+ ions:
A2 ¼ erðCa2þ þMg2þÞ (11.58)
where e ¼ 0:375 for Neft Dashlary Formation waters.
There is also relationship between A2 and HCO3� content:
A2 ¼ frHCO�3 (11.59)
where f ¼ 0:085 for formation waters in Daghestan Mesozoic rocks, Eastern Pre-
Caucasus (Russia).
Relationships between the first alkalinity or second salinity and rNa+/rCl� ratio is
very useful. These relationships, however, are non-linear. A more convenient cor-
relation is the linear correlation between A1 or S2 and rCl�/rNa+ ratio:
A1 ¼ g ð1� rCl�=rNaþÞ (11.60)
S2 ¼ g ðrCl�=rNaþ � 1Þ (11.61)
where g ¼ 95.
Established analytical and statistical relationships may be expanded in the case
when besides chlorides the formation water also includes sulfates and other salts of
strong acids. In this case, r(Cl�+SO42�+NO3
�) should be substituted for rCl� in the
system of Equations 11.45.
The above analytical relationships may be useful for solving various problems
involving formation water hydrochemistry. They also allow inference on the various
formation water characteristics even in the case of the incomplete chemical analysis.
Similarly, the type of formation water and its characteristic coefficients may be
determined from the data on water salinity only. In this case, for example, numerical
values of Palmer’s characteristics may be found from the total water salinity
(Fig. 11.16).
11.2.2.3. Multidimensional models
11.2.2.3.1. Reservoir rocks. Within the Absheron Peninsula and the adjacent South
Caspian offshore areas, clastic rocks of Productive Series are composed mainly of
quartz, feldspar, and various rock fragments. The distribution of rock types in each
formation reflects the cyclic nature of the section. The section is composed of sand-
stones, siltstones, shales, unsorted sediments, and evaporites.
The mineral composition of the Middle Pliocene rocks of the South Caspian Basin
is characterized by several different associations of light and heavy minerals. Min-
erals of the light group include quartz, feldspar, and various rock fragments. Five
heavy mineral groups were identified: (1) ore minerals (pyrite, magnetite, limonite,
leucoxene), (2) stable minerals (garnet, zircon, tourmaline, rutile), (3) kyanite or
MATHEMATICAL MODELING IN PETROLEUM GEOLOGY240

disthene (disthene, staurolite, sillimanite), (4) micas (muscovite, biotite, chlorite),
and (5) glauconite. The distributions (contents) of these mineral groups in rocks are
presented in Fig. 11.17.
The triangular diagrams (see Fig. 11.18) show the rock composition (Productive
Series of the South Caspian Basin) with respect to quartz (Q), feldspar (FS), and
rock fragments (RF). Fig. 11.18 also shows the contour lines of equal concentration
of heavy minerals with respect to the overall mineral composition of host rocks. The
content of stable minerals generally ranges from 1% to 8% (the relative frequency of
this range is 63%). Content less than 1% is observed in 8% of the cases and more
than 8% in 28% of the cases. The content of stable minerals decreases from 10% for
rocks composed mostly of quartz to 4% for lithite. (Lithite is a rock composed of
sand-size rock fragments.) The kyanite group of minerals is absent in 68% of the
rocks studied. Their content is at a maximum in monomineralic quartz sandstones
(3.8%) and a minimum in lithite (0.2%). The relationship of reservoir-rock prop-
erties (clay content, porosity, and permeability) to mineral composition of rocks is
shown in Fig. 11.19. Petrographic and mineralogic multivariable composition and
reservoir-rock properties of terrigenous (siliciclastic) rocks discussed here are pre-
sented in Table 11.9.
11.2.2.3.2. Crude oil. When data on correlation coefficients for all paired relation-
ships or equations (see Table 11.8) are available, one can derive an equation of
multiple regression containing all three independent variables (resins plus asphalt-
enes content R, gasoline content B, and ligroin content L). The equation of multiple
regression is a linear function
g ¼ go þ aRþ bBþ cL (11.62)
where g is the density of crude oil, go is the density of crude oil when R ¼ B ¼ L ¼ 0,
and a, b, and c are empirical coefficients.
Fig. 11.16. Dependencies between Palmer’s characteristics and water salinity.
MODELS OF STATIC GEOLOGIC SYSTEMS 241

The general equation relating g, R, B, and L is as follows:
g ¼ 0:864þ 0:0021R� 0:0023B� 0:0014L (11.63)
As shown in Table 11.8, the coefficient of multiple correlation is higher than any
paired correlation coefficient. Thus, the equation of multiple correlation, which takes
into consideration the influence of every parameter, describes the experimental re-
lationships more reliably than the paired equations of regression. In deriving this
regression, some parameters were fixed at average levels.
To expedite the calculations, a nomogram (Fig. 11.20) was constructed according
to Eq. 11.63. For example, at given values of R ¼ 23%, B ¼ 7:2%, and L ¼ 7:0%,
the density of crude oil g ¼ 0:882 g=cm3.
Inasmuch as the dependence of density on variations in ligroin content in the
crude oil is weak, the term in the equation of multiple relationship corresponding to
Fig. 11.17. Statistical distribution of heavy-mineral content (%): (a) ore minerals, (b) stable minerals, (c)
kyanite/disthene group, (d) micas, (e) glauconite.
MATHEMATICAL MODELING IN PETROLEUM GEOLOGY242

the influence of ligroin on density may be replaced by a constant value. In this case,
the equation can be written as follows:
g ¼ 0:8707þ 0:0013R� 0:0027B (11.64)
The coefficient of multiple correlation is 0.830. Graphically this relationship is
presented in Fig. 11.21. As shown, the dependence of crude oil density on the content
of resins plus asphaltenes and gasoline, with ligroin influence being excluded, is
clearly expressed graphically and can be used in calculations.
Relationship among the viscosity, density, and temperature of crude oil (changing
simultaneously) has also been studied. In the Absheron oil and gas region depth of
burial of productive reservoirs varies from 500 to 3500m, whereas the reservoir
Fig. 11.18. Variation in heavy-mineral content (solid lines) depending on the contents of rock-forming
minerals (Q – quartz, FS – feldspar, RF – rock fragments). (a) Ore minerals, (b) stable minerals,
(c) kaynite/disthene group, (d) micas.
MODELS OF STATIC GEOLOGIC SYSTEMS 243

temperature ranges from 301C to 901C. Due to influence of various factors, density
of crude oils varies from 0.83 to 0.93 g/cm3 (Buryakovsky and Dzhevanshir, 1992).
Dynamic viscosity m (in cP and kinematic viscosity n (in cst) are related as follows:
n ¼ m=g (11.65)
where g is the specific gravity of liquid.
Table 11.10, which is based on 580 analyses, shows the dependence of crude oil
viscosity on density at five different temperatures: 101C, 201C, 301C, 401C, and 501C.
Fig. 11.22 shows the dependence of viscosity on temperature. Logarithmic scale was
used for viscosity, transforming asymmetric empiric distribution into symmetric one,
close to the normal law. This figure shows that viscosity and temperature are related
by logarithmic or power law.
Relationship among kinematic viscosity, density, and temperature is presented in
Fig. 11.23. This relationship is best described by an exponential function
n ¼ no expð�bTÞ (11.66)
Fig. 11.19. Variation in reservoir-rock properties (solid lines) depending on the contents of rock-forming
minerals (Q – quartz, FS – feldspar, RF – rock fragments). (a) Clay content, (b) porosity, (c) permeability.
MATHEMATICAL MODELING IN PETROLEUM GEOLOGY244

TABLE 11.9
Classification of terrigenous (siliciclastic) rocks of Azerbaijan based on mineralogic composition and reservoir parameters
Type of rock Content of light minerals (%) Content of heavy minerals (%) Reservoir properties
Quartz Feldspar Rock fragments Ore
group
Stable
group
Kyanite
group
Micas Glauconite Other Clay
content (%)
Porosity
(%)
Permeability
(mD)
Absheron Peninsula and Archipelago
Monomineralic 90–100 0–10 0–10 45–49 12–14 4.0–5.5 4.5 23–26 1–12 10–14 23–26 500–1000
Oligomictic 75–90 0–25 0–25 45–53 10–12 3.0–4.0 6.4 20–23 2–16 14–20 20–23 200–500
Polymictic 50–75 0–50 0–50 50–57 8–10 2.0–3.0 6.2 14–19 5–20 20–26 16–20 100–200
Graywacke 0–50 0–75 0–75 57–65 6–8 1.0–2.0 6.0 6–14 5–24 26–32 13–16 50–100
Lithite 0–25 0–25 75–100 65–72 4–6 0.5–1.0 5.8 2–6 9–23 32–40 10–13 10–50
Arkose 0–25 75–100 0–25 55–62 6–8 1.0–2.0 6.0 10–14 8–22 24–30 13–15 20–50
Baku Archipelago
Monomineralic 90–100 0–10 0–10 49–53 9.5–10 2.7–3.8 2.4 25–28 5–12 18–22 18–20 60–70
Oligomictic 75–90 0–25 0–25 51–68 8.7–9.5 2.2–2.7 4.4 22–25 4–14 22–28 15–18 45–60
Polymictic 50–75 0–50 0–50 54–67 7.5–8.7 1.5–2.2 4.3 15–21 0–17 28–34 13–15 30–45
Graywacke 0–50 0–75 0–75 65–75 5.0–7.5 0.5–1.5 4.1 6–15 0–21 34–43 8–13 0–30
Lithite 0–25 0–25 75–100 75–86 3.7–5.0 0.0–0.5 3.9 2–6 0–16 43–50 5–8 0
Arkose 0–25 75–100 0–25 65–70 6.0–8.0 1.0–1.5 4.0 12–15 3–13 30–38 10–12 10–30
MODELSOFSTATIC
GEOLOGIC
SYSTEMS
245
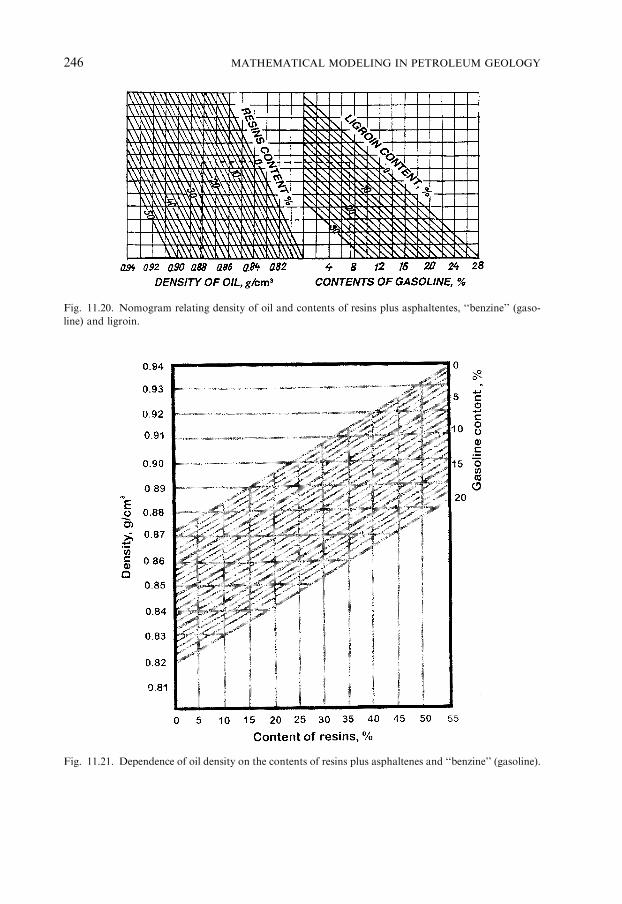
Fig. 11.20. Nomogram relating density of oil and contents of resins plus asphaltentes, ‘‘benzine’’ (gaso-
line) and ligroin.
Fig. 11.21. Dependence of oil density on the contents of resins plus asphaltenes and ‘‘benzine’’ (gasoline).
MATHEMATICAL MODELING IN PETROLEUM GEOLOGY246
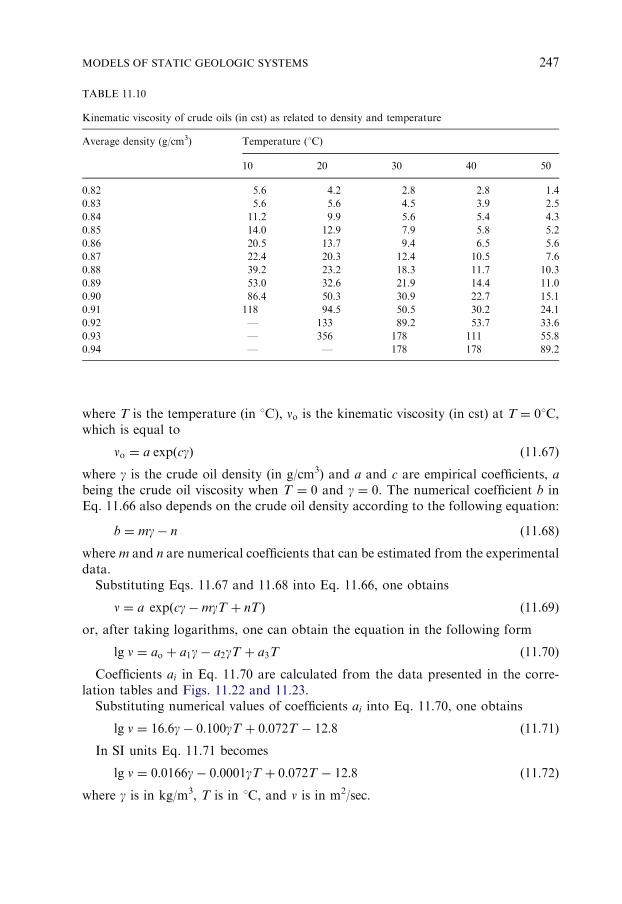
where T is the temperature (in 1C), no is the kinematic viscosity (in cst) at T ¼ 01C,
which is equal to
no ¼ a expðcgÞ (11.67)
where g is the crude oil density (in g/cm3) and a and c are empirical coefficients, a
being the crude oil viscosity when T ¼ 0 and g ¼ 0. The numerical coefficient b in
Eq. 11.66 also depends on the crude oil density according to the following equation:
b ¼ mg� n (11.68)
where m and n are numerical coefficients that can be estimated from the experimental
data.
Substituting Eqs. 11.67 and 11.68 into Eq. 11.66, one obtains
n ¼ a expðcg�mgT þ nTÞ (11.69)
or, after taking logarithms, one can obtain the equation in the following form
lg n ¼ ao þ a1g� a2gT þ a3T (11.70)
Coefficients ai in Eq. 11.70 are calculated from the data presented in the corre-
lation tables and Figs. 11.22 and 11.23.
Substituting numerical values of coefficients ai into Eq. 11.70, one obtains
lg n ¼ 16:6g� 0:100gT þ 0:072T � 12:8 (11.71)
In SI units Eq. 11.71 becomes
lg n ¼ 0:0166g� 0:0001gT þ 0:072T � 12:8 (11.72)
where g is in kg/m3, T is in 1C, and n is in m2/sec.
TABLE 11.10
Kinematic viscosity of crude oils (in cst) as related to density and temperature
Average density (g/cm3) Temperature (1C)
10 20 30 40 50
0.82 5.6 4.2 2.8 2.8 1.4
0.83 5.6 5.6 4.5 3.9 2.5
0.84 11.2 9.9 5.6 5.4 4.3
0.85 14.0 12.9 7.9 5.8 5.2
0.86 20.5 13.7 9.4 6.5 5.6
0.87 22.4 20.3 12.4 10.5 7.6
0.88 39.2 23.2 18.3 11.7 10.3
0.89 53.0 32.6 21.9 14.4 11.0
0.90 86.4 50.3 30.9 22.7 15.1
0.91 118 94.5 50.5 30.2 24.1
0.92 — 133 89.2 53.7 33.6
0.93 — 356 178 111 55.8
0.94 — — 178 178 89.2
MODELS OF STATIC GEOLOGIC SYSTEMS 247

Dynamic viscosity can be obtained combining Eqs. 11.65 and 11.69:
m ¼ ag expðcg�mgT þ nTÞ (11.73)
Substituting Eq. 11.37 into Eq. 11.69, one obtains an expression relating the
kinematic viscosity of crude oil to the content of resins plus asphaltenes
n ¼ a0 expðc0R�m0RT þ n0TÞ (11.74)
where a0, c0, m0, and n0 are empirical coefficients.
After taking logarithms of Eq. 11.74, one obtains
lg g ¼ 0:6þ 0:0565R� 0:00034RT � 0:083T (11.75)
Fig. 11.22. Statistical distribution (a) and cumulative probability (b) of oil viscosity at five different
temperatures (after Buryakovsky and Dzhevanshir, 1992).
MATHEMATICAL MODELING IN PETROLEUM GEOLOGY248

Thus, the empirical equations of the relationships among composition, properties
of the crude oil, and temperature may be derived using the experimental data. These
equations are not only of practical value, but also of theoretical interest.
From the practical point of view, extrapolation of graphical or analytical
models beyond the limits of the experimental data is of great interest. For example,
extrapolation of graphs in Fig. 11.23 or using Eq. 11.72 for temperatures above 501C
enables one to predict the viscosity of crude oils of different densities at temperatures
up to 100–1201C (at depths of 5500–6000m). Rocks at these depths are most likely to
contain gas-condensate fluids due to the low viscosity of fluids at such temperatures.
In the near-surface rocks (with an average annual temperature of +14.51C) crude
oil is degraded into an asphalt-like material with a density of 1.0–1.1 g/cm3. Such
deposits of bituminous sands are known to occur at outcrops of oil reservoirs in
different parts of the world.
11.3. MODELS OF DYNAMIC GEOLOGIC SYSTEMS
As a rule, geologic systems, with subsequent technologic impact change either in
‘‘geologic’’ or ‘‘technologic’’ time scale. Thus, in order to develop adequate dynamic
models of geologic and technologic processes, it is necessary to introduce time factor.
The time factor is of a special importance for the problems of any forecasting.
Such problems indeed call for the creation and application of the mathe-
matical models. The successful forecast may depend on the historical evaluation of
Fig. 11.23. Relationship among the kinematic viscosity (n), oil density (g), and temperature (after
Buryakovsky and Dzhevanshir, 1992).
MODELS OF DYNAMIC GEOLOGIC SYSTEMS 249
the geologic system under study (Buryakovsky et al., 1982; Buryakovsky and
Chilingarian, 1991b).
The necessity to take geologic time into account meets with significant difficulties.
One of the reasons for this difficulty is the use of absolute and relative geologic time
scales. The difference between them is substantial: the absolute time scale has the
beginning common for the entire Earth, which is not an attribute of the relative time
scale based on paleontology and stratigraphy. Another reason is the lack of repro-
ducibility of the geologic time in physical and chemical experiments.
Two methods in constructing the dynamic geologic models may be offered:
analytical and statistical. The better approach in modeling such systems is the
combination of mathematical analysis (i.e., differential equations) with the statistical-
probabilistic assignment of numerical values for the parameters, causing the change in
dynamic geologic systems. This approach allows the deterministic description of main
features of the dynamics of the geologic systems. At the same time, it allows to account
for the statistical-probabilistic nature of various geologic parameters, which cause the
evolution of the systems. The implementation of analytical solution is accomplished
using the statistical sampling technique or the so-called Monte Carlo method.
11.3.1. Analytical approach
Two important issues must be addressed before constructing analytical models:
1. The key properties of the system under study, as well as those of the surrounding
rocks, should be defined. These properties should be described by strictly defined
quantitative constraints.
2. The limitations assumed in describing these properties should be clearly delin-
eated and should reflect the substance of a particular geologic system.
It is natural to choose as the main parameters those properties of the system
and of the surrounding rocks, which would stimulate or restrain the course of the
geologic processes.
In the following discussion, the writers use as synonyms the properties of the
geologic system and their respective parameters. They may have a dual nature, i.e.,
they may be either deterministic or stochastic, depending on the formalization ap-
proach at each stage of simulation of a geologic system.
Two significant assumptions ought to be made while developing the differential
equations of geologic processes.
1. The rate of change of the geologic system, or the speed of the geologic process, is
proportional to the state of the system.
2. Influence of various natural factors is proportional to the product of the number
(or quantitative estimates) of the events accelerating the process by the number
(or quantitative estimates) of the events retarding the process.
The first assumption leads to the differential equation similar to
dx=dt ¼ �ðtÞ f ðxÞ (11.76)
where x is a variable (quantitatively measured natural factor) describing the
evolution of geologic system, �ðtÞ is a coefficient of proportionality (generally
MATHEMATICAL MODELING IN PETROLEUM GEOLOGY250

time-dependent), and f ðxÞ is any function of the variable x. In the case of a mul-
tiphase process, a system of Equations 11.76 type is written jointly.
The second assumption allows to put together a system of differential equations,
which takes into account the effects of interrelationships among variables:
dx1=dt ¼ �1ðtÞ f 1ðx1Þ þ g12ðtÞ f 1ðx1Þ f 2ðx2Þdx2=dt ¼ �2ðtÞ f 2ðx2Þ þ g21ðtÞ f 1ðx1Þ f 2ðx2Þ ð11:77Þ
where x1 and x2 are variables (natural factors) accelerating and retarding the proc-
ess, respectively; g12ðtÞ and g21ðtÞ are interdependency quotients of these variables (or
natural factors), which are generally time-dependent.
In some particular cases, the factors � and g may not be time-dependent, i.e., they
are constant. In those cases, Eq. 11.76 forms the so-called ‘‘model of proportional
effects’’, or an ‘‘organism growth model’’ (Volterra, 1976).
Various functions of the affecting parameters can be used in Eqs. 11.76 and 11.77.
This creates the necessary diversity in mathematical descriptions of the dynamics of
the geologic systems. For example, when f ðxÞ ¼ x, the process in Eq. 11.76 is de-
scribed by the exponential curve; when f ðxÞ ¼ xða� xÞ, where a is a constant, proc-
ess is described by the logistical curve (S-like or the Gompertz curve), etc.
The signs of � and g quotients in Eqs. 11.77 may vary. If the first equation has
positive �1 and negative g12, then the two sign combinations are possible for the �2and g21 in the second equation. In the case of negative �2 and positive g21, the
processes of system construction and destruction are antagonistic. In the case of
positive �2 and negative g21, the processes merge into a single process controlled by
the same natural factors, and the prevalence of the constructive component over the
destructive one depends on the relation between these factors.
Depending on the signs of � and g, the geologic processes can be stable or unstable
in time (Fig. 11.24). The former case is characterized by a point (center) or a con-
vergent spiral on the phase plane in the (x1, x2) coordinates. The latter case is
characterized by a saddle or a divergent spiral.
Taking into account the specifics of geologic time–space continuum, the math-
ematical models (Eqs. 11.76 and 11.77) allow to forecast the status, structure, and
behavior of a geologic system at depths not yet studied through geologic techniques,
assuming a normal stratigraphic succession of consecutive time intervals.
11.3.2. Statistical approach
Statistical approach, based on the empirical data, is simpler than the analytical
one and is justified from the viewpoint of lithosphere evolution. It is based on the
inference of interconnections through generalization, analysis, and comparison of
the structural–functional features of geologic systems at certain discrete moments of
the geologic time. Approximation of the discrete (discontinuous) data by a contin-
uous function allows to obtain an empirical equation for a parameter (or a set of
parameters) of the geologic system under study as a function of time.
MODELS OF DYNAMIC GEOLOGIC SYSTEMS 251

As an example, the equation expressing the relationship between shale (clay)
porosity and geologic age and taking into account burial depth and lithology, is
presented here (Buryakovsky et al., 1982, 1990).
The relationship between porosity of shales and depth of burial was studied by
numerous investigators (e.g., Rieke and Chilingarian, 1974). As shown in Fig. 11.25,
this relationship varies from one area to another. This is due to the fact that porosity
of argillaceous sediments is a complex function of numerous natural factors, often
superimposed on each other. These factors include:
(1) geologic age;
(2) effective stress (total overburden stress minus the pore pressure);
(3) lithology;
(4) mineralogy;
(5) tectonic stress;
(6) speed of sediment deposition;
(7) thickness of sedimentary formations;
(8) shape and sorting of grains;
(9) amount and type of cementing material;
(10) chemistry of interstitial fluids.
This multitude of variables complicates the quantitative evaluation of the influ-
ence of individual factors on the porosity of argillaceous sediments.
The following formula by Dobrynin (1970), for example, enables quantitative
evaluation of the role played by various factors in forming porosity of shale:
f ¼ fo expð�0:014bcDÞ (11.78)
where fo is the initial porosity of clay, f the porosity of shale at a depth D (in m),
and bc the coefficient of irreversible compaction (MPa�1).
Using this formula, the writers plotted a family of straight lines on a semiloga-
rithmic paper (Fig. 11.26). The actual compaction curves of argillaceous rocks are
superimposed on this figure. Inasmuch as the coefficient of irreversible compaction bc(in 10�3, MPa�1) for each one of the straight lines (Eq. 11.78) is known, it is possible
to determine graphically its average value for actual curves of different geologic age:
Fig. 11.24. Phase diagrams of the solution of Eqs. 11.77. I – IV – Specific areas of phase space. (a) �140,
�2o0, g12o0, g2140; (b) �140, �240, g12o0, g21o0.
MATHEMATICAL MODELING IN PETROLEUM GEOLOGY252
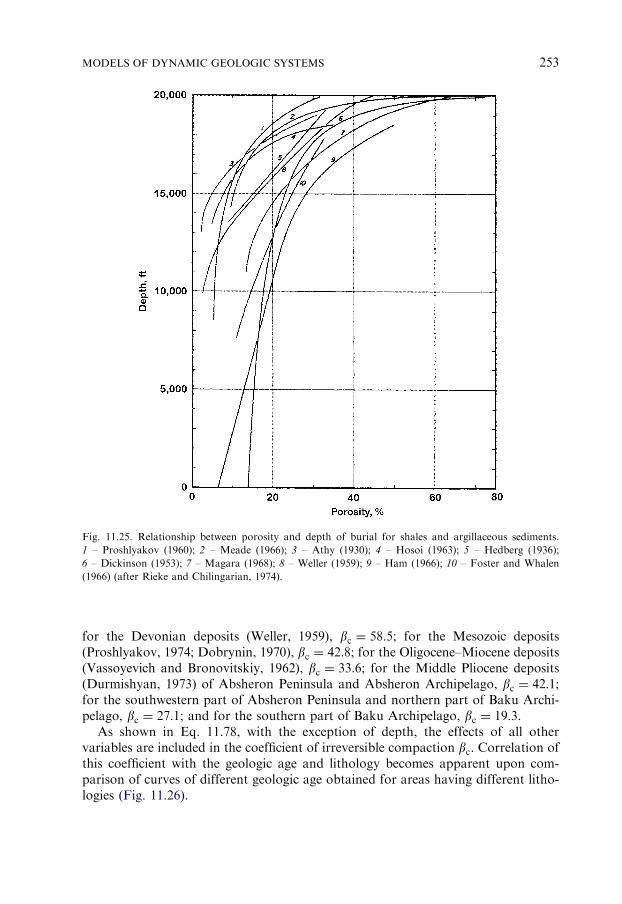
for the Devonian deposits (Weller, 1959), bc ¼ 58:5; for the Mesozoic deposits
(Proshlyakov, 1974; Dobrynin, 1970), bc ¼ 42:8; for the Oligocene–Miocene deposits
(Vassoyevich and Bronovitskiy, 1962), bc ¼ 33:6; for the Middle Pliocene deposits
(Durmishyan, 1973) of Absheron Peninsula and Absheron Archipelago, bc ¼ 42:1;for the southwestern part of Absheron Peninsula and northern part of Baku Archi-
pelago, bc ¼ 27:1; and for the southern part of Baku Archipelago, bc ¼ 19:3.As shown in Eq. 11.78, with the exception of depth, the effects of all other
variables are included in the coefficient of irreversible compaction bc. Correlation of
this coefficient with the geologic age and lithology becomes apparent upon com-
parison of curves of different geologic age obtained for areas having different litho-
logies (Fig. 11.26).
Fig. 11.25. Relationship between porosity and depth of burial for shales and argillaceous sediments.
1 – Proshlyakov (1960); 2 – Meade (1966); 3 – Athy (1930); 4 – Hosoi (1963); 5 – Hedberg (1936);
6 – Dickinson (1953); 7 – Magara (1968); 8 – Weller (1959); 9 – Ham (1966); 10 – Foster and Whalen
(1966) (after Rieke and Chilingarian, 1974).
MODELS OF DYNAMIC GEOLOGIC SYSTEMS 253

Although many other factors influence compaction, geologic age and lithology
(ratio of shales to the total thickness of rocks) affect the complex diagenetic proc-
esses occurring in a subsiding basin sediments, with a distinct geothermal gradient.
The coefficient of irreversible compaction, bc, is related to the geologic age and
lithology as follows:
bc ¼ ð26:61 log At � 8:42Þ � 10�3 (11.79)
bc ¼ ð14:0� 166:6 log wÞ � 10�3 (11.80)
where At is the geologic age in millions of years, and w a ratio of thickness of shales
to the total thickness of siliciclastics.
On combining Eqs. 11.78–11.80, an equation relating porosity to geologic age,
lithology, and depth is obtained:
f ¼ fo exp½�0:014ð13:3 log At � 83:25 log wþ 2:79Þ � 10�3D (11.81)
where fo is the initial porosity of argillaceous sediments, and D is the depth in
meters.
A nomogram, presented in Fig. 11.27, enables rapid solution of Eq. 11.81. This
nomogram was used to test the results obtained by (a) Hedberg (1926) for the
Tertiary shales of Venezuela, (b) Stetyukha (1964) for the Tertiary shales of the
Fig. 11.26. Relationship between porosity and depth of burial for various shales. 1 – Weller (1959);
2 – Aralsor super-deep well SG-1 (USSR); 3 – Vassoyevich and Bronovitskiy (1962); 4 – Absheron
Peninsula and Archipelago, Azerbaijan; 5 – southwestern part of Absheron and northern part of Baku
Archipelago, Azerbaijan; 6 – southern part of Baku Archipelago and Lower Kura Depression, Azerbaijan;
7 – family of calculated porosity/depth curves (after Buryakovsky et al., 1982).
MATHEMATICAL MODELING IN PETROLEUM GEOLOGY254
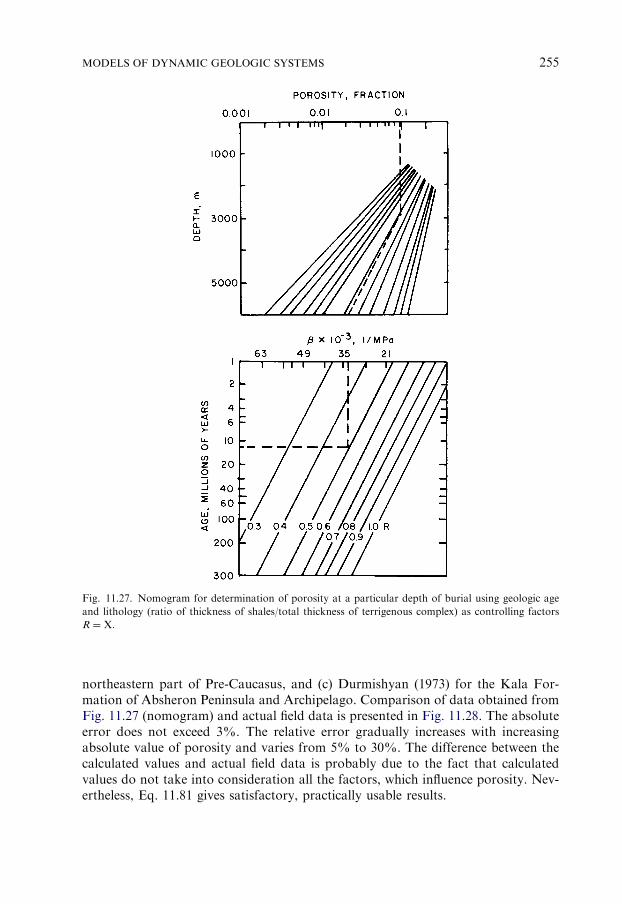
northeastern part of Pre-Caucasus, and (c) Durmishyan (1973) for the Kala For-
mation of Absheron Peninsula and Archipelago. Comparison of data obtained from
Fig. 11.27 (nomogram) and actual field data is presented in Fig. 11.28. The absolute
error does not exceed 3%. The relative error gradually increases with increasing
absolute value of porosity and varies from 5% to 30%. The difference between the
calculated values and actual field data is probably due to the fact that calculated
values do not take into consideration all the factors, which influence porosity. Nev-
ertheless, Eq. 11.81 gives satisfactory, practically usable results.
Fig. 11.27. Nomogram for determination of porosity at a particular depth of burial using geologic age
and lithology (ratio of thickness of shales/total thickness of terrigenous complex) as controlling factors
R ¼ X.
MODELS OF DYNAMIC GEOLOGIC SYSTEMS 255

11.3.3. Combination of analytical and statistical approaches
11.3.3.1. Sediment compaction
The rate of compaction of sediments depends on the lithology, rate of sedimen-
tation, and the tectonic regime of the sedimentation basin. One of the most impor-
tant properties determining the degree of compaction of sediments is the ease of
release (expulsion) of interstitial waters: sand gives up pore waters easier than clay.
The presence of thick strata of water-saturated clays in a sedimentary section retards
the compaction. A rapid rate of sedimentation also retards the compaction process.
On the other hand, intensive tectonic activity may result in rapid lithification.
An attempt was made by Buryakovsky et al. (1982) to describe systematically the
process of sediment compaction. The curves showing changes in the porosity with
depth may be described by the so-called ‘‘organism-growth model’’, equivalent to the
‘‘model of proportional effects’’.
The difference between the ‘‘model of organism growth’’ and the ‘‘model of pro-
portional effects’’ is as follows: the former is based on the equality of the rate of change
in variable y to the value of this variable reached by a certain moment of time t, i.e.,
dy=dt ¼ cy (11.82)
which leads to an exponential dependence of the variable y on time t:
y ¼ yoect (11.83)
where c is the factor of proportionality.
Fig. 11.28. Comparison of actual porosity and that obtained from nomogram (after Buryakovsky et al.,
1990). (a) Venezuela, (b) Pre-Caucasus Region, (c) Absheron Peninsula and Archipelago. 1 – Actual
porosity, 2 – calculated porosity.
MATHEMATICAL MODELING IN PETROLEUM GEOLOGY256

The second model is derived from the equality of absolute change in the variable y
to the value of this variable reached by a certain moment of time, i.e.,
dy ¼ cy (11.84)
resulting in an exponential dependence of the variable y on the factor of propor-
tionality c:
y ¼ yoec (11.85)
If the process is affected by the sum of different factors, then the equation becomes
y ¼ yo expX
n
i¼1
ci
!
(11.86)
This model can be transformed into a model of multiplication
y ¼ yo
Y
n
i¼1
X i (11.87)
where X i ¼ expðciÞ, andQn
i¼1X i is a generalized measure of the change in variable y.
Based on the principle of equality of the rate of evolution of compaction process
to the obtained value of some parameter characterizing this process, the writers
obtained a number of models:
(a) Model of sediment compaction (compaction model by Terzaghi, 1961):
U t ¼ 1� ht=ho ¼ 1� f½hmin expðchhmintÞ�=½hmin � hoð1� expðchhmintÞÞ�g
(11.88)
where U t is the relative compaction of sediments, ho, ht, and hmin are the thicknesses
of the layer before compaction, at time t, and for the completely compacted rock
(lowest, minimum value), respectively; and ch is the factor of proportionality.
(b) Model of density:
gt ¼ ½gogmax expðcggmaxtÞ�=½gmax � goð1� expðcggmaxtÞÞ� (11.89)
where gt, go, and gmax are rock densities at time t, before compaction, and for the
completely compacted rock, respectively; and cg is the factor of proportionality.
(c) Model of porosity:
ft ¼ ½fo expð�cftÞ�=½1� foð1� expð�cftÞÞ� (11.90)
where fo and ft are porosities before and at a certain time during the process of
compaction of sediments; and cf is the factor of proportionality.
Models based on Eq. 11.87 were widely used in predicting reservoir-rock
properties and physical properties of terrigenous rocks at different geological and
physical environments of the South Caspian Basin, Daghestan Plain, and the Middle
Caspian Basin at depths of 6–9 km. Many examples are given by Buryakovsky et al.
(1982, 1990, 2001).
11.3.3.2. Simulation of rock properties
The main factor of postsedimentary changes of any deposits is the compaction of
overlying strata, resulting in the continuous decrease of the initial porosity of
MODELS OF DYNAMIC GEOLOGIC SYSTEMS 257

sediments with depth (Fig. 11.29). As shown in Fig. 11.29, all curves may be de-
scribed by an exponent, which suggests a single concept for solution of the problem
of mathematical simulation of the process of compaction and lithification of se-
diments and prediction of the properties of rocks (Buryakovsky, 1993).
Fig. 11.29. Relationship between porosity and depth of burial for various types of sediments and rocks
(after Buryakovsky et al., 2001). (a) Sandstones, (b) siltstones in the fields of the NW portion of the South
Caspian Basin: 1 – Dzhanub, 2 – Zyrya, 3 – Surakhany, 4 – Karachukhur, 5 – Zykh, 6 – Gum Deniz,
7 – Gousany, 8 – Bukhta I1’icha, 9 – Patamdar, 10 – Karadag, 11 – Padar, 12 – Kyurovdag,
13 – Karabagly, 14 – Kalmas. (c) Carbonates in the following regions: 1 – Scythian Plate, Upper Cretaceous
limestones; 2 – Western Kuban Trough, Upper Devonian limestones; 4-8 – Southern Florida, Cenozoic and
Mesozoic carbonates: 4 – average, 5 – Eocene, 6 – Paleocene, 7 – limestone, 8 – dolomite, 9-10 – deepwater
carbonate mud, 11-12 – chalk. (d) Argillaceous sediments and rocks by: 1 – Proshlyakov; 2 – Meade;
3 – Athy; 4 – Hosoi; 5 – Hedberg; 6 – Dickinson; 7 – Magara; 8 – Weller; 9 – Ham; 10 – Foster andWhalen.
MATHEMATICAL MODELING IN PETROLEUM GEOLOGY258
This problem is solved by making three assumptions and using their implications:
(1) The process of postsedimentary changes and consolidation of sediments is
affected by many natural factors.
(2) The effect of each factor is unique and differs from those of other factors.
(3) The final result is the sum of individual influences of all natural factors on the
sediments during their transformation into rocks.
Thus:
(A) Assumptions (1) and (2) indicate that the individual influences of any factor on
the overall result of consolidation are small and are inversely proportional to
the number of factors.
(B) Assumption (2) indicates that the influence of each factor is not equal to that of
others.
The above discussion allows one to reach the following conclusions:
(1) Small influences of each ith factor resulting in a relative change in the volume
of consolidating sediments, U, can be represented as dUi/Ui, whereas the cumulative
influences of all the factors can be represented byR
dUi/Ui. This expression is some-
what analogous to Hooke’s law: dUi/Ui ¼ �bs, where b is the modulus of elasticity
and s is the affecting stress. If bs is understood not only as the effect of static load,
but also as the influence of any ith factor, one would obtain:
Z U
Uo
dU i=U i ¼X
n
i¼1
ci (11.91)
where Uo is the rate of initial compaction and ci the influence of ith factor.
Hence, one can derive the following equations:
U t ¼ Uo expX
n
i¼1
ci
!
(11.92)
and
U t ¼ Uo
Y
n
i¼1
xi (11.93)
where U t is the rate of compaction at the present moment of time, xi ¼ expðciÞ, andQn
i¼1xi is a generalized measure of a change in parameter U.
(2) Differences in the physicogeological nature of factors affecting the rock con-
solidation require their presentation in the form of relative dimensionless values that
correspond to a formal type of individual influence dUi/Ui. The influence of the ith
factor (dU i=U i�ci) is evaluated (a) from the results of direct laboratory measurements
on cores (reproduction of Hooke’s law), (b) by using analogies when the direct phys-
ical simulation is impossible, or (c) by actual field observations and measurements.
Based on the above assumptions, a multivariable model was proposed for eval-
uation of the rate of compaction and diagenetic changes of sediments after their
MODELS OF DYNAMIC GEOLOGIC SYSTEMS 259

deposition in the sedimentary basin. The general form of this model is
U t ¼ Uo
Y
n
i¼1
xi (11.94)
where Uo is the rate of initial compaction of sediments and Ut is the rate of com-
paction at a given depth and at a certain geologic time t, and xi is the modeling
coefficient.
In selecting the modeling coefficients, one must consider: (1) conditions of accu-
mulation of terrigenous or carbonate sediments, (2) their postsedimentary changes
(diagenesis and catagenesis or epigenesis), and (3) the structural evolution of the
region. One should recognize the role of different factors, such as external (pressure,
temperature, etc.) and internal (lithology, mineralogic composition, cementation, etc.).
The characteristic feature of coefficients xi is their independence, which is a nec-
essary condition for the model (Eq. 11.94). Numerical values of xi coefficients cor-
responding to the ci factors are given in Table 11.11. Their evaluation is carried out
according to the initial data of experimental and field studies (Buryakovsky et al.,
1982, 1990).
Modeling coefficients take into account the influence of major geological (natural)
factors on compaction and other diagenetic and catagenetic changes of rocks. These
factors are as follows:
(1) geologic age (in million years — My),
(2) number of tectonic (orogenic) cycles (in dimensionless tectonic-stratigraphic
units),
(3) depth of burial (in km),
(4) temperature (in 1C),
(5) rate of sedimentation (in m/My),
(6) content of quartz in sandstones (in wt%),
(7) content of smectites (montmorillonite) in shales (in wt%),
(8) degree of cementation (content of CaCO3 in wt%),
(9) sorting coefficient of Trask, and
(10) degree of homogeneity of carbonate rocks (dimensionless).
Ranges in the absolute values of natural factors are shown in Table 11.11. Scales
of absolute values of natural factors are presented in this table. Model (Eq. 11.94)
requires a normalized form of natural factors. Normalization equations for natural
factors are shown in Table 11.12. These equations, which relate the absolute and the
normalized scales, were obtained from data in Table 11.11.
The number of natural factors used in Eq. 11.94 varies depending on the type of
rocks. The influence of a particular factor is also different for each type of rocks.
There are three types of natural factors with a different influence on rocks: strong,
moderate, and weak.
The ‘‘strong’’ factors affecting the compaction of sandstones are as follows: ge-
ologic age and depth of burial. The factors of ‘‘moderate’’ influence: the number of
tectonic cycles (epochs), quartz content, and cementation (CaCO3 content). The
‘‘weak’’ factors: rate of sedimentation, sorting coefficient of Trask, and formation
temperature. Thus, eight natural factors affect compaction of sandstones.
MATHEMATICAL MODELING IN PETROLEUM GEOLOGY260

TABLE 11.11
Numerical values of factors determining the degree of compaction
Factor Normalized scale (TI)
0 0.1 0.2 0.3 0.4 0.5 0.6 0.7 0.8 0.9 1.0
Scales of absolute values of factors
Absolute geological age, At (My) 0 50 100 150 200 250 300 350 400 450 500
Dynamic deformation, N (tectonic-strat. unit) 0.73 0.85 1.00 1.17 1.37 1.60 1.88 2.20 2.58 3.01 3.53
Depth of burial, D (km) 0 0.6 1.2 1.8 2.4 3.0 3.6 4.2 4.8 5.4 6.0
Formation temperature, T (1C) 0 20 40 60 80 100 120 140 160 180 200
Rate of sedimentation, Rd (m/My) 20 30 50 80 100 200 300 500 800 1,000 2,000
Content of quartz in sandstones, Q (wt%) 100 90 80 70 60 50 40 30 20 10 0
Content of smectites in clays, M (wt%) 0 5 10 15 20 25 30 35 40 45 50
Cementation index, C (wt%) 0 3 6 9 12 15 18 21 24 27 30
Sorting of sandstones, Sss 1 2 3 4 5 6 7 8 9 10 —
Sorting of shales, Ssh — 10 9 8 7 6 5 4 3 2 1
Homogeneity of carbonates, Scr 0 1 2 3 4 5 6 7 8 9 10
MODELSOFDYNAMIC
GEOLOGIC
SYSTEMS
261

Only five natural factors affect the compaction of carbonate rocks. The ‘‘strong’’
factors: geologic age, the number of tectonic cycles, depth of burial, and temper-
ature. The ‘‘moderate’’ factor is the homogeneity level.
For shales, there are eight natural factors. The ‘‘strong’’ factors: geological age,
depth of burial, and rate of sedimentation. The ‘‘moderate’’ factors: the number of
tectonic cycles, content of smectites (montmorillonite), and cementation. The
‘‘weak’’ factors: the sorting coefficient and temperature.
Modeling coefficients are calculated using the following equation:
xi ¼ expð�ajT iÞ (11.95)
where aj is the coefficient of influence of normalized value T i of any natural factor on
the various rock properties xi. Coefficients aj were obtained by examining numerous
experimental data (Buryakovsky et al., 1982; Chilingar et al., 1979) and are pre-
sented in the following table:
Rock type Degree of influence of natural factors, aj coefficient (Eq. 11.95)
Strong Moderate Weak
Reservoir rock 0.968 0.714 0.511
Caprock 2.996 1.833 1.309
Using modeling coefficients, one can calculate the Z factor:
Z ¼ U t=Uo ¼Y
n
i¼1
xi (11.96)
The Z factor characterizes the relative compaction and other diagenetic changes of
sediments, i.e., the relative consolidation of rocks. This factor is used for calculating
TABLE 11.12
Equations of normalization for natural factors (see Table 11.11)
Factor Equation of normalization
Absolute geological age, At (My) TA ¼ 0.002At
Dynamic deformation, N (tectonic-strat. units) TN ¼ 0.2+1.46 logN
Depth of burial, D (km) TD ¼ 0.167D
Formation temperature, T (oC) Tt ¼ 0.005T
Rate of sedimentation, Rd (m/My) TV ¼ 0.5(logRd�1.3)
Content of quartz in sandstones, Q (wt%) TQ ¼ 1�0.01Q
Content of smectites in clays, M (wt%) TM ¼ 0.02M
Cementation index, C (wt%) TC ¼ 0.033C
Sorting coefficient of sandstones, Sss Tss ¼ 0.1(Sss�1)
Sorting coefficient of shales, Ssh Tsh ¼ 0.1(11�Ssh)
Homogeneity of carbonates, Scr Tcr ¼ 0.1Scr
MATHEMATICAL MODELING IN PETROLEUM GEOLOGY262

rock properties using the following equations:
Porosity f ¼ foZ1 (11.97)
Permeability k ¼ koðZ1Þ4 (11.98)
Density g ¼ gmað1� foZ1Þ (11.99)
where fo and ko are, respectively, the initial values of porosity and permeability
before compaction of sediments, gma is the density of matrix of consolidated rocks,
and Z1 is equal to:
Z1 ¼Y
n
i¼1
xi
,
1� fo 1�Y
n
i¼1
xi
!" #
¼ Z=½1� foð1� ZÞ� (11.100)
is the relative change in porosity: f=fo.
The results of the numerical simulation show that the modeling coefficients xirepresent adequately the influence of many geological factors on the petrophysical
properties of rocks (Fig. 11.30).
Fig. 11.30. Results of numerical simulation of Mesozoic reservoir-rock properties. (a) Porosity, (b) per-
meability, (c) density. 1 – Average curve, 2 – confidence limits. (After Buryakovsky, 1993.)
MODELS OF DYNAMIC GEOLOGIC SYSTEMS 263

Thus, the results of numerical simulation show that there is a significant difference
between the reservoir properties of Mesozoic and Neogene rocks (Fig. 11.31).
Geologic time is the main factor determining the rock compaction: porosity of Me-
sozoic sandstone is about two times lower than that of Neogene sandstone (Fig.
11.31a). Permeability of Mesozoic sandstone is 20 times lower than that of Neogene
sandstone (Fig. 11.31c), as indicated by example 1 versus example 4.
Comparison of the results obtained by simulation of the clastic reservoir-rock
properties (sandstones) with those of the carbonate rocks shows that carbonate
rocks become compacted and consolidated faster than sandstones. This is obvious
from examples 1 and 2 (Fig. 11.31).
The results of numerical simulation presented in examples 1 and 3 (Fig. 11.31)
indicate that clays become compacted faster than sands.
Fig. 11.31. Statistical distribution of petrophysical properties of rocks. (a) Porosity, (b) density, (c) per-
meability. Mesozoic rocks: 1 – sandstone, 2 – carbonates, 3 – shale. Cenozoic rocks: 4 – sandstone. o –
frequency. (After Buryakovsky, 1993.)
MATHEMATICAL MODELING IN PETROLEUM GEOLOGY264

11.3.3.3. Prediction of rock properties
To predict the reservoir rock and caprock properties at various depth of burial,
the models of porosity f, permeability k, and formation bulk density g were used as
mathematical descriptions of the rock properties (see Eqs. 11.97–11.100). Initial oil
or gas saturation was evaluated from the following equation:
So=g ¼ 1� ak�b (11.101)
where a and b are the empirical coefficients.
Input data (used by the authors) for the prediction of properties of Neogene rocks
of the South Caspian Basin were:� Geologic age: 10–12My� Dynamic deformation: 1.1–1.2 tectonic-stratigraphic units20
� Depth of occurrence: up to 6.5 km� Formation temperature: up to 1101C� Rate of sedimentation: 500–800m/My� Quartz content: 40–80%� Carbonate cement content: 8–12%� Trask sorting coefficient: 2–4� Initial porosity before compaction: 0.35–0.45� Initial permeability before compaction: 2000–3000mD� Density of rock matrix: 2.6–2.7 g/cm3
� Empirical coefficients in Eq. 11.101: a ¼ 0:80 and b ¼ 0:225.The parameters under study were predicted up to a depth of 9,000m (Figs. 11.32
and 11.33). These figures show that as stratigraphic depth (to the bottom of Middle
Pliocene interval) and hypsometric depth (along the certain bed) increase up to
6,000m, the absolute and effective porosity decrease from 19–20% to 14–15% and
from 14–15% to 9–10%, respectively. The corresponding permeability of sandstones
and siltstones decreases from 130–150 to 40–60mD. At a depth of 9,000m, porosity
varies from 7% to 10%, whereas permeability changes from 2 to 11mD. Table 11.13
shows the predicted values of reservoir-rock properties of the Productive Series of
some offshore fields in the South Caspian Basin.
11.3.3.4. Prediction of hydrocarbon reserves
The model of determining hydrocarbon resources (a model of Eqs. 11.77 type, at
f 1ðx1Þ ¼ V1 and f 2ðx2Þ ¼ V 2, where V 1 and V 2 are hydrocarbon volumes in growing
(V 1) and dwindling (V 2) accumulations) was proposed. At one-stage oil accumu-
lation, the model is as follows:
V 1 ¼ ½BVo expð�1BtÞ�=½B� Voð1� expð�1BtÞ� (11.102)
where B is the volume of trap containing a hydrocarbon accumulation.
20The intensity of subsidence of the sedimentary basin floor during the Middle Pliocene time decreased
with depth, and increased in the direction from the Absheron Peninsula to the Absheron and Baku
archipelagos and from the Cheleken Peninsula to the Turkmenian shelf, i.e., southward.
MODELS OF DYNAMIC GEOLOGIC SYSTEMS 265

Fig. 11.32. Results of simulation of reservoir-rock properties in the South Caspian Basin (after
Buryakovsky et al., 1990). (a) Porosity, (b) permeability, (c) density. 1 – Average curve, 2 – confidence
limits, 3-4 – core data, 5 – statistical distribution of actual (measured) permeability.
Fig. 11.33. Results of simulation of petrophysical properties of rocks (variation with depth) (after
Buryakovsky et al., 1990). (a) Reservoir rocks from Absheron region: 1 – porosity, 2 – permeability, and 3
– density; (b) shales from three regions of the South Caspian Basin: 4, 5, 6 – porosity, and 7, 8, 9 – density.
MATHEMATICAL MODELING IN PETROLEUM GEOLOGY266

This model allows to forecast the extent of hydrocarbon accumulation and to
evaluate the hydrocarbon resources locally or for a region as a whole (Fig. 11.34). As
an example, the reservoirs of the deep-water zone of the South Caspian Basin have
been used.
Using Eq. 11.102, a model of hydrocarbon reserves evaluation in individual traps
was obtained. This model is a derivative of Eq. 11.102 and is formally similar to
Eq. 11.94, where xi are reservoir parameters for hydrocarbon reserves estimation
using the volumetric method.
The formula used in calculating crude oil volume in situ is as follows:
V ¼ AhefffSo (11.103)
where V is the volume of oil accumulation, A is the reservoir area, heff is the thick-
ness of oil-bearing formation (net pay), f is the porosity, and So is the oil saturation.
Eq. 11.103 can be simplified if fSo is replaced by the ‘‘effective saturated po-
rosity’’ feff :�
V ¼ Ahefffeff (11.104)
Some offshore structures of the South Caspian Basin are studied only by a sparse
net of seismic lines, whereas the offshore areas adjacent to the oil and gas fields were
not studied during exploration. In view of this problem, it was decided to use the
mathematical methods. An algorithm and computer program was developed using
the double Fourier series for uneven spacing of the initial data (Buryakovsky et al.,
1990). Examples of structural maps on top of the Lower Productive Series along the
northern slope of South Caspian Basin are presented in Fig. 11.35.
Effective oil and gas saturated thickness of a reservoir (net pay) was determined
using the identification of layers using a cluster-analysis technique, i.e., by means of
pattern recognition without preliminary training. For this purpose, sections studied
using the well logs were utilized. Each section was divided into groups of beds with
TABLE 11.13
Predicted reservoir-rock properties of some offshore formations in Azerbaijan
Suite Depth (m) Porosity (%) Oil/gas saturation (%) Effective porosity (%) Permeability (mD)
Surakhany 200–1500 23 77 18 302
Sabunchi 200–2000 23 77 18 283
Balakhany 200–2500 23 76 18 287
Fasila 200–2500 23 76 18 287
NKG 300–2500 21 71 15 117
NKP 300–2500 23 77 18 280
KS 400–1500 23 73 17 139
PK 500–2000 23 77 18 298
KaS 700–2200 22 74 16 174
�The writers propose that effective porosity is in effect intercommunicating porosity minus the irreducible
fluid saturation.
MODELS OF DYNAMIC GEOLOGIC SYSTEMS 267

Fig. 11.34. Results of simulation of hydrocarbon accumulation in traps. B ¼ volume of the trap,
V ¼ volume of trapped hydrocarbons. (After Buryakovsky et al., 2001, p. 404.)
Fig. 11.35. Simulated structural maps (after Buryakovsky et al., 1990). (a) At the base of Fasila Suite of
the Productive Series of Azerbaijan, (b) at the base of Unit VIII of the Red-Bed Series of Turkmenistan.
MATHEMATICAL MODELING IN PETROLEUM GEOLOGY268
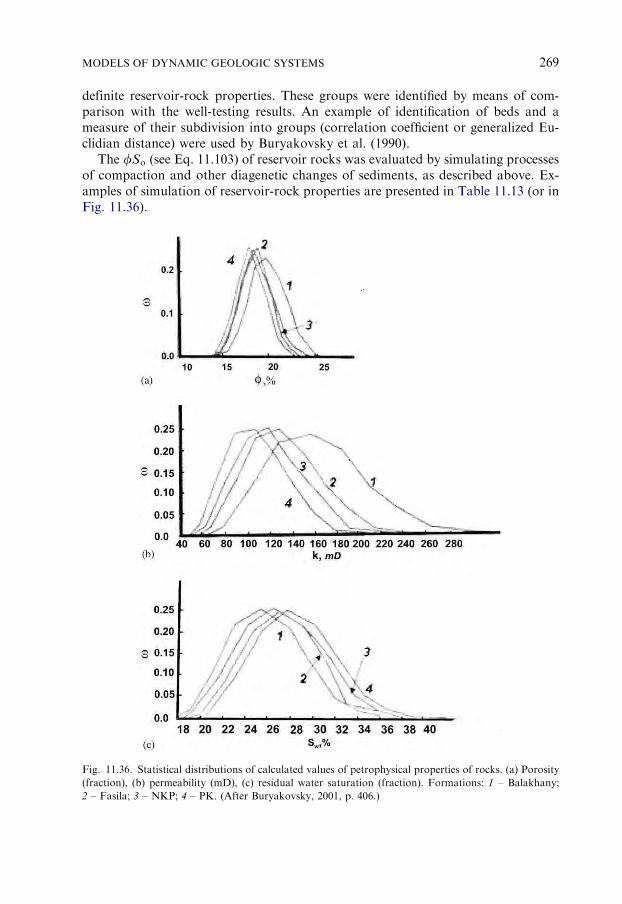
definite reservoir-rock properties. These groups were identified by means of com-
parison with the well-testing results. An example of identification of beds and a
measure of their subdivision into groups (correlation coefficient or generalized Eu-
clidian distance) were used by Buryakovsky et al. (1990).
The fSo (see Eq. 11.103) of reservoir rocks was evaluated by simulating processes
of compaction and other diagenetic changes of sediments, as described above. Ex-
amples of simulation of reservoir-rock properties are presented in Table 11.13 (or in
Fig. 11.36).
Fig. 11.36. Statistical distributions of calculated values of petrophysical properties of rocks. (a) Porosity
(fraction), (b) permeability (mD), (c) residual water saturation (fraction). Formations: 1 – Balakhany;
2 – Fasila; 3 – NKP; 4 – PK. (After Buryakovsky, 2001, p. 406.)
MODELS OF DYNAMIC GEOLOGIC SYSTEMS 269

Hydrocarbon volumes were calculated using the Monte Carlo technique at the
interval-probable setting of reservoir parameters. As discussed by Abasov et al.
(1984), such method of reserve evaluation is more preferable than evaluation using
the average parameters. This allows one to obtain not an average value of reserves
but their variation. Consequently, reliable intervals of real values of reserves (with
the reliability coefficient fixed in advance) can be obtained.
11.3.3.5. Evolution of pore-fluid (formation) pressure
The description of processes of pore-fluid pressure generation and destruction is
obtained from Eqs. 11.77, where f 1ðx1Þ ¼ p1 and f 2ðx2Þ ¼ p2 are pore-fluid pressures
in the process of being increased and decreased, respectively.
Such dynamic model can be described by a system of nonlinear differential first-
order equations as follows:
dp1=dt ¼ �1p1 � g12p1p2
dp2=dt ¼ � �2p2 þ g21p1p2 ð11:105Þ
where p1 ¼ p1ðtÞ is the pore-fluid pressure during the period of being increased,
p2 ¼ p2ðtÞ the pore-fluid pressure during the period of being decreased, �1 and �2 arecoefficients of pore-fluid pressure change during the increasing and decreasing pe-
riods, respectively; and g12 and g21 are coefficients of interaction of natural factors
determining either preservation or change of the pore-fluid pressure.
The system of Eqs. 11.105 describes the processes of generation, stabilization, pres-
ervation, and dissipation of pore-fluid pressures. Due to the difficulty in simultaneous
experimental determination of the coefficients of pressure change and coefficients of
opposite influence of some natural factors, numerical simulation using the models is
possible in a practical case only when the coefficients having opposite influence may be
neglected. For g12 ¼ g21 ¼ 0, Eqs. 11.105 is reduced to two equations, one of which
describes the abnormal pore pressures, and the other, a drop to the normal hydrostatic
pressure. At actual conditions, it is necessary also to take into account the self-retarding
effect of the process, leading to the following equation:
p1 ¼ ½pmax po expð�1pmaxtÞ�=½pmax � poð1� expð�1pmaxtÞÞ� (11.106)
where po is the initial value of the pore pressure (hydrostatic pressure of water at a
depth where sedimentation began), pmax is the maximum possible pore pressure at given
conditions, and t is the time. The coefficient of proportionality, �1 calculated for the
South Caspian Basin averages 0.02 1/(MPa/My).
The change in pressure with depth is assumed to be analogous to the change in
time and may be described by an equation similar to Eq. 11.106. This assumption is
probably true for the South Caspian Basin, taking into account a relatively young
age of rocks, absence of noticeable structuring, one-phase formation of folded
structure, normal bedding of sequential stratigraphic intervals, etc. Other factors can
also influence the development of abnormal pore pressure, but in the South Caspian
Basin they probably play a subordinate role.
MATHEMATICAL MODELING IN PETROLEUM GEOLOGY270

Using Eq. 11.106, it is possible to describe the dynamics of the pore-fluid pressure
(Fig. 11.37a) and to forecast the pore pressure in the reservoir rocks and caprocks at
various depths (Fig. 11.37b) for the various regions of the South Caspian petroleum
province. It has been shown (Fig. 3.15) that hydrostatic pressure gradients in shales
at the depth interval of 1,000–6,000m (over 2,000 determinations by well-logging)
range from 0.012 to 0.024MPa/m with an average value of 0.018MPa/m.
11.3.3.6. Simulation of oil/water mobility
The simulation of dynamic systems on using the methodology described above,
gave rise to the mathematical model of changes in reservoir saturation during oil
displacement by water.
In the course of oil displacement by water, water saturation Sw of the reservoir
increases from the residual water saturation (Sw;1 ¼ Sw;r) to the value of the entire
Fig. 11.37. Results of pore-fluid pressure simulation. (a) Variation in pore-fluid with time; (b) variation in
pore-fluid pressure with depth, for three regions of the South Caspian Basin. ph ¼ hydrostatic pressure,
pmax ¼ total overburden (geostatic) pressure. (After Buryakovsky, 2001, p. 402.)
MODELS OF DYNAMIC GEOLOGIC SYSTEMS 271
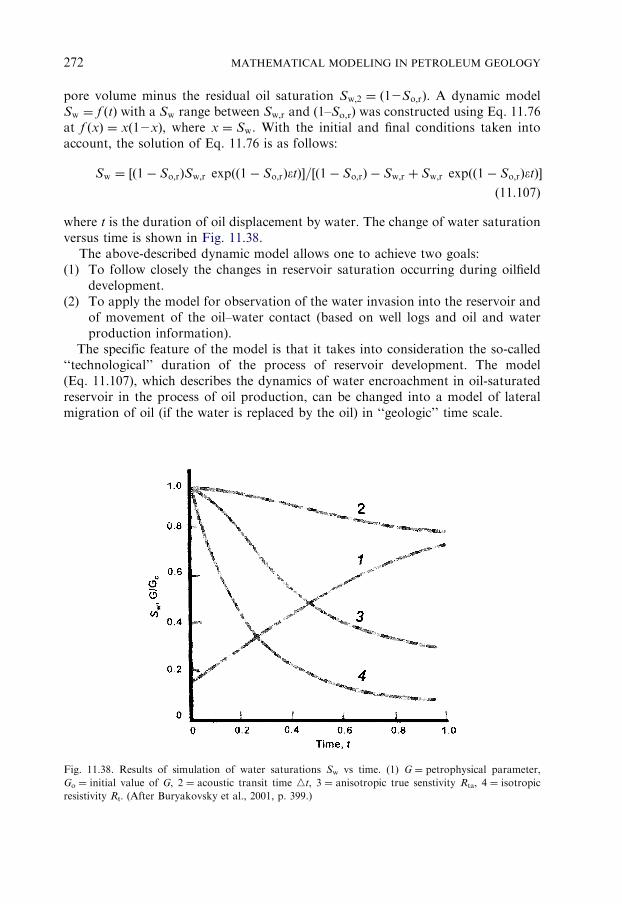
pore volume minus the residual oil saturation Sw;2 ¼ ð12So;rÞ. A dynamic model
Sw ¼ f ðtÞ with a Sw range between Sw;r and (1–So,r) was constructed using Eq. 11.76
at f ðxÞ ¼ xð12xÞ, where x ¼ Sw. With the initial and final conditions taken into
account, the solution of Eq. 11.76 is as follows:
Sw ¼ ½ð1� So;rÞSw;r expðð1� So;rÞ�tÞ�=½ð1� So;rÞ � Sw;r þ Sw;r expðð1� So;rÞ�tÞ�
(11.107)
where t is the duration of oil displacement by water. The change of water saturation
versus time is shown in Fig. 11.38.
The above-described dynamic model allows one to achieve two goals:
(1) To follow closely the changes in reservoir saturation occurring during oilfield
development.
(2) To apply the model for observation of the water invasion into the reservoir and
of movement of the oil–water contact (based on well logs and oil and water
production information).
The specific feature of the model is that it takes into consideration the so-called
‘‘technological’’ duration of the process of reservoir development. The model
(Eq. 11.107), which describes the dynamics of water encroachment in oil-saturated
reservoir in the process of oil production, can be changed into a model of lateral
migration of oil (if the water is replaced by the oil) in ‘‘geologic’’ time scale.
Fig. 11.38. Results of simulation of water saturations Sw vs time. (1) G ¼ petrophysical parameter,
Go ¼ initial value of G, 2 ¼ acoustic transit time nt, 3 ¼ anisotropic true senstivity Rta, 4 ¼ isotropic
resistivity Rt. (After Buryakovsky et al., 2001, p. 399.)
MATHEMATICAL MODELING IN PETROLEUM GEOLOGY272

11.4. ALGORITHM OF ACCELERATED EXPLORATION FOR HYDROCARBON
ACCUMULATIONS
The progress in the oil and gas industry is related closely to the acceleration of
discovery rates, exploration, development, and production of hydrocarbon resources.
This activity must be based on scientific information, which helps to predict subsurface
conditions and properties of the oil- and gas-bearing formations. The use of math-
ematical methods and computers increase the scope of problems that can be solved on
the basis of integrated geological, geophysical, geochemical, engineering, and com-
mercial information. Mathematical methods using computer-aided processing of the
available information accelerate the process of regional and local prediction of oil and
gas potential and increase the reliability of geologic forecast, that, in general, increases
the commercial and geologic efficiency of exploration, development, and production
of oil and gas fields.
Exploration of mineral resources in spite of its commercial content and significant
spending of time and investment may be considered as an actual industrial exper-
iment resulted in changing the a priori probability of mineral deposit discovery.
Exploration being essentially an informational process is profitably employed
the information input, storage, and processing procedures beginning with exper-
iment design (exploration operations including geophysical surveys and drilling the
prospecting and exploratory wells) and ending with computerized geological–
geophysical mapping, forecasting of exploration results, mineral resource assess-
ment, and field-development engineering. Utilization of mathematical methods is the
prolongation of exploration activity and is an effective factor of exploration accel-
eration. In the harsh and severe ambient and subsurface environments and under
complex and rigorous technical, engineering, organizational, and financial conditions,
such an approach increases the commercial efficiency of the mineral resources dis-
covery, assessment, and utilization, as well as subsurface protection and conservation.
Such situations generally occur while prospecting and exploring the sedimentary ba-
sins at great depths or while working in the offshore areas characterized by the scarce
information on the reservoir geometry, composition, and type of fluid saturation.
To resolve this problem, the method of accelerated exploration and commercial
estimation of hydrocarbon resources was proposed by Buryakovsky et al. (1990).
This method resulted in trap identification and mapping, subdivision of stratigraphic
sequences, reservoir delineation and structural description, reservoir rock and for-
mation of fluid properties assessment, and estimation of initial in-place and recov-
erable hydrocarbon reserves.
CONCLUDING REMARKS
The oil and gas generation and accumulation processes are occurring (and oc-
curred) in all sedimentary basins. The formation and preservation of hydrocarbon
accumulations, however, required favorable environments.
The development of concepts of oil and gas generation continuously expanded
with time. Instead of individual organic substances, the source organic matter is now
ALGORITHM OF ACCELERATED EXPLORATION 273

considered to be almost any carbon-containing organic matter. Temperature wise,
instead of a narrow range of high-temperature petroleum is generated in a broad
temperature range starting at ambient temperature. In terms of the energy source, the
concepts shifted from the heat flow to any other energy source in the Earth’s crust,
including the surface energy of finely fragmented rocks and minerals. Instead of
clay–shale deposits alone, the source facies now include a wide range of subaquatic
deposits. In terms of duration, it changed from a narrow ‘‘window’’ or ‘‘phase’’ to a
long and continuous process occurring in the Earth’s crust at a variable speed.
The future is rather optimistic. In the onshore basins with discovered fields, at
least 30–35% of the reserves remain undiscovered due to imperfection of current
exploration and appraisal techniques. These reserves reside in the (1) lithologic traps,
(2) traps with capillary and hydraulic barriers, (3) synclines or over the monoclines,
(4) poor reservoirs, and (5) ‘‘critical state’’ accumulations. The technological ad-
vances will probably increase the estimated reserves further.
Presently, the sedimentary oil and gas basins, shelves, and continental slope areas
are targets of an accelerated exploratory and appraisal efforts. There is not much
hope to discover major hydrocarbon accumulations in the middle of the oceans. The
potential of the continental slopes is also unknown. The potential of the Antarctica
and its shelves are also not studied.
As the extent of our knowledge of a particular region increases, the efficiency
declines, the fraction of large discoveries drops, and the structure of reserves becomes
more complicated. At the same time, the number of (1) small fields, (2) the amount of
their reserves, (3) the number of oilfields with difficult-to-produce oil, and (4) low-
permeability reservoirs increased. The productivity of newly-completed wells became
lower. More remote areas with harsher natural environment are being explored.
Practically all the giant fields in the World are currently under development and
major producing formations are at a stage of declining production. In Russia, for
example, most gas is produced from two giant West Siberia fields (Orenburg and
Vuktyl fields). Plethora of small fields produce very small amount of oil.
Decline in the petroleum production results in the economic, political, and social
complications. The issue of the scientific studies, especially the fundamental ones, is
becoming acute. The fundamental studies, which are the mainstay of energy indus-
try, are unfortunately decreasing. No technical progress can be achieved in the
absence of scientific progress, and the modern society cannot function without the
technical progress.
The current status and avenue of scientific studies is predicated on the extent of
computerization. It covers analytical and measuring equipment, seismic and logging
equipment, and acquisition, storage and processing of information. Broad applica-
tion of Information Technology provides opportunities for integration of diverse
technologies and modeling of the processes and targets. The computers are very
important in the studies of fundamental problems.
N.A. Eremenko and
G.V. Chilingar
MATHEMATICAL MODELING IN PETROLEUM GEOLOGY274
Appendix A
WETTABILITY AND CAPILLARITY
A.1. INTRODUCTION
The pore space of reservoir rock is filled with oil, gas, and/or water. The interfaces
between fluids, and between fluids and solids, are the loci of many physical and
chemical phenomena, including surface free energy, surface tension, adsorption,
cohesion, adhesion, wettability, and capillarity.
The fundamental basis for explaining many interfacial phenomena is the fact that
all molecules exert attractive forces on each other. These attractive forces, generally
known as the van der Waals forces, are weak forces between molecules, which vary
inversely as the sixth power of the intermolecular distance, and are due to
momentary dipoles caused by fluctuations in the electronic configuration of
the molecules. These forces oppose the molecular agitation (kinetic energy of the
molecules that increases with increasing temperature) and cause contraction of
the surface of a liquid due to the surface free energy. The surface area is reduced to a
minimum, and for a given volume the minimum is a sphere. The tension at a liquid
surface in contact with either air or its vapor is called the surface tension. The surface
tension is equal to the surface energy.
In terms of molecular interaction, one should distinguish between the terms of
‘‘cohesion’’ and ‘‘adhesion:’’ the term ‘‘cohesion’’ is applied to the attractive forces
between the like molecules, whereas ‘‘adhesion’’ is applied to forces between unlike
molecules. The liquid that has the higher molecular interaction (higher adhesion)
with the solid is the wetting liquid, whereas the liquid that has the lower molecular
interaction (lower adhesion) with the solid is the non-wetting liquid.
When two immiscible liquids, such as oil and water, fill the pore space of reservoir
rock, they compete for a place on the solid surface. In solving many production and
reservoir engineering problems, it is very important to know which liquid (oil or
water) wets the rock surfaces. The relative ability of water and oil to wet the rock is
theoretically the same as the relative degree of adhesion between the two liquids and
the reservoir rock. Because the pore throats and canals in the reservoir rock are
mainly of capillary size (o0.5mm), capillary phenomena help explain the behavior
of fluids in the oil and gas reservoirs.
A.2. WETTABILITY
The manifestation of molecular interaction at the interface between three phases:
solid, liquid, and gas (or another liquid not miscible with the first) is called the
wettability. In the reservoir rock, the wettability is the appearance of molecular
interaction of a liquid with the pore space surface, the magnitude and nature of
which is related to the nature of the surface and geometry of the pore space.
275

The wettability is calculated on the basis of core sample weights measured at various
testing modes. For example, the forced displacement of oil to Sor and water to Siw may
be conducted using a centrifuge or by mounting the core in fluid-flow equipment and
pumping the displacing fluids into the core (see, e.g., Tiab and Donaldson, 2004, for
details, pp. 371–373).
Wettability may be defined also as the ability of the liquid to ‘‘wet,’’ or spread
over, a solid surface. Fig. A.1A shows a liquid wetting a solid surface, whereas
Fig. A.1B shows the relationship between the liquid and solid when the liquid has
little affinity for the solid. In Fig. A.1C, the liquid drop occupies an intermediate
position. The fluid, which wets the surface more strongly, occupies the smaller pores
and minute interstices in a rock.
The angle, which the liquid interface makes with the solid, is called the contact
angle, y. Usually, it is measured from the solid through the liquid phase (if the other
phase is a gas) and through the water phase if oil and water are both present. In a
capillary tube, shown in Fig. A.2A, the angle between the tube wall and the tangent
to the curved interface (where it intersects the tube wall) is less than 901. For a
capillary depression, shown in Fig. A.2B, the contact angle is greater than 901. In the
case of no rise or depression, the angle is 901 (see Fig. A.2C)
Molecular interaction caused by the molecular property (intermolecular cohesive
forces) of liquids is called the interfacial tension, y. It has the dimensions of force per
unit length (lb/ft or dyn/cm) or energy per unit area (erg/cm2). Interfacial tension
causes the curved surface of the interface between two immiscible fluid phases
(e.g., between the gas and liquid or between two liquids, as well as the interface
between a liquid and a solid) to contract into the smallest possible area per unit of
Fig. A.1. Different degrees of wetting of solid by liquid.
Fig. A.2. Behavior of various fluids in glass capillary tubes. (a)– water, (b)– mercury, and (c)–
tetrahydronaphtalene (when glass is perfectly clean and liquid is pure).
APPENDIX A276

volume. The difference in pressure across the interface between two immiscible fluid
phases jointly occupying the interstices of a rock is known as the capillary pressure.
The value of the capillary pressure (Pc in dyn/cm2) depends on the interfacial tension
and the curvature of the interfacial surface. Mathematical expression of the capillary
pressure is as follow:
Pc ¼ 4sðcos yÞ=d (A.1)
where Pc is the capillary pressure, s is the interfacial tension, y is the angle of contact
of the liquid with the capillary tube wall, and d is the diameter of capillary tube.
A phenomenon associated with surface tension, which occurs in capillary tubes, is
known as the capillarity, which is represented by the elevation (or depression) of
liquid in the capillary tube.
The chief effect of capillary pressure is its control over the static distribution of the
fluids within a non-producing reservoir. The static capillary pressure within the voids
of a reservoir, which may be considered as a bundle of capillary tubes, is a function
of the relative fluid saturation. The capillary pressure of a water–oil system may be
plotted as a function of the water saturation, as shown in Fig. A.3.
If it is assumed that reservoir rocks are originally water-wet, the water is displaced
by oil. Obviously, not all of the water is displaced, for all oil reservoirs contain
varying amounts of interstitial water, even if only oil (or gas) is produced. The
displaced water is called the free water to distinguish it from the thin layer of
adsorbed water held to the mineral grains by capillary pressure. This water is called
the residual water or the irreducible water, Siw (see Fig. A.3).
Fig. A.3. Typical method for plotting capillary pressure vs. saturation for a water-wet system (modified
after Tiab and Donaldson, 2004, Fig. 5.9, p. 325). Pct is the threshold pressure, Siw is the irreducible water
saturation, and Swor is the residual oil saturation. 1 – Water is displaced from the core by oil. 2 – Oil is
displaced from the core by water.
WETTABILITY AND CAPILLARITY 277

A.2.1. Interfacial Tension and Contact Angle
On considering an element of an interface having double curvature (R1 and
R2), the sum of the force components normal to the element is equal to zero
(see Fig. A.4). The pressure difference ( p2 – p1) is balanced by the interfacial tension
forces:
ðp2 � p1Þdydx ¼ 2sdy sin y2 þ 2sdx sin y1 (A.2)
If the contact angles (y1 and y2) are small, then the following simplifications may
be made:
sin y1 ¼ dy=2R1 (A.3)
and
sin y2 ¼ dx=2R2 (A.4)
Therefore, Eq. A.3 becomes
p2 � p1 ¼ s1
R2
þ1
R1
� �
(A.5)
For a capillary tube (see Fig. A.5)
R1 ¼ R2 ¼ R (A.6)
cos y ¼ d=2R (A.7)
and
p2 ¼ p1 þ gh (A.8)
Fig. A.4. Surface tension forces acting on a small element on the surface having double curvature
(p2 ¼ p1 þ gh) (see Binder, 1962; Vennard, 1961). r1 ¼ R1 and r2 ¼ R2 (radii of curvature).
APPENDIX A278

where g is the specific weight of fluid, d is the diameter of capillary tube, and h is the
height of capillary rise. Thus, Eqs. A.5–A.8 may be combined to yield the following
expression for capillary rise, h:
h ¼ 4s cos y=gd (A.9)
Eq. A.9 can also be derived on considering the equilibrium of vertical forces. The
weight of fluid in the capillary tube, W, which is acting downward, is equal to
W ¼ pd2hg=4 (A.10)
The vertical component of interfacial tension force acting upward is equal to
Fsg ¼ pds cos y (A.11)
Equating these two forces and solving for h gives rise to Eq. A.9.
In reference to Fig. A.6, the interfacial tension can be expressed as
sws þ swo cos y ¼ sso (A.12)
where sws, swo, and sso are interfacial tensions at the phase boundaries of
water–solid, water–oil, and solid–oil, respectively, or
cos y ¼ ðsso � swsÞ=swo (A.13)
As shown in Fig. A.7A, when a solid is completely immersed in water phase,
y ¼ 01, cos y ¼ +1 and, consequently,
swo ¼ sso � sws (A.14)
When half of the solid is wet by water, and the other half, by oil (Fig. A.7B),
Fig. A.5. Rise of water in glass capillary tube (see Binder, 1962; Vennard, 1961). r ¼ R (radius of
curvature).
WETTABILITY AND CAPILLARITY 279

y ¼ 901 and cos y ¼ 0, and thus
sso ¼ sws (A.15)
On the other hand, if the solid is completely wetted by oil (Fig. A.7C), y ¼ 1801,
cos y ¼ –1, and
sso ¼ sws � swo (A.16)
If yo901, the surfaces are called hydrophilic and when y4901, they are called
hydrophobic. An interfacial tension depressant lowers swo, whereas a wetting agent
lowers y or increases cos y. A decrease in swo does not necessarily mean an increase
in cos y, or vice versa, because of the changes in sso and sws.
If a rock is completely water-wet (y ¼ 01), water will tend to envelop all of the
grains and force all of the oil out into the middle of the pore channel. Even though
some oil may still be trapped in this case, the recovery would be high. On the other
hand, if all of the solid surfaces were completely oil-wet (y ¼ 1801), oil would tend to
envelop all of the grains and force all of the water out into the center of the pore
channel. In this extreme case, recovery would be very low by water drive. Many oil-
wet reservoirs are known to exist.
In the usual case (01oyo1801), to improve waterflooding operations the contact
angle y should be changed from 4901 to o901, through the use of surfactants. This
would move the oil from the surface of the grains out into the center of the pore
channels, where they would be produced more readily.
Fig. A.6. Shape of water drop resulting from interfacial tension forces.
Fig. A.7. Illustration of 01, 901, and 1801 contact angles.
APPENDIX A280

Contaminants or impurities may exist in either fluid phase or may be adsorbed on
the solid surface. Even if present in minute quantities, they can and do change the
contact angle from the value measured for pure system (see Marsden, 1968).
A.3. EFFECT OF CONTACT ANGLE AND INTERFACIAL TENSION ON MOVEMENT OF OIL
For an ideal system composed of pure liquids, the advancing contact angle should
equal the receding angle. Because of the presence of impurities within the liquids,
however, the advancing contact angle is greater in most systems. The advancing
contact angle is the angle formed at the phase boundary when oil is displaced by
water. It can be measured as follows: the crystal plate is covered by oil and then the
water drop is advanced on it. The contact angle is the limiting angle with time after
equilibrium has been established (see Fig. A.8). The contact angle formed when
water is displaced by oil is called the receding angle (see Fig. A.9). The contact angles
during movement of a water–oil interface in a cylindrical capillary, having a
hydrophilic surface, are shown in Fig. A.10.
In as much as a reservoir is basically a complex system of interconnected capillaries
of various sizes and shapes, an understanding of flow through capillaries is very
important. In Fig. A.11, a simple two-branch capillary system is presented. If a pressure
drop is applied, then the water will flow more readily through the large-diameter
capillary than it will through the small-diameter one. Thus, a certain volume of oil may
be trapped in the small capillary when water reaches the upstream fork. Poiseuille’s law
states that
q ¼ pd4Dpt=128mL (A.17)
Fig. A.8. Contact angle: plate is first immersed in oil followed by the placement of water drop on top.
Fig. A.9. Contact angle: plate is first immersed in oil followed by the placement of water drop
underneath.
WETTABILITY AND CAPILLARITY 281

and
n ¼ q=A ¼ d2Dpt=32mL (A.18)
where q is the volumetric rate of flow (cm3/sec), d is the diameter of capillary (cm), Dptis the total pressure drop (dyn/cm), A is the cross-sectional area (cm2), m is the viscosity
(cP), L is the flow path length (cm), and n is the velocity (cm/s).
The total pressure drop, Dpt, is equal to
Dpt ¼ Dpi þ Pc. (A.19)
where Pc is the capillary pressure (see Eq. A.1) and Dpi is the applied pressure (dyn/
cm2). Solving for n in each capillary, by combining Eqs. A.1, A.18, and A.19 gives
n1 ¼ d21=32m1L1ðDpi þ 4s cos y=d1Þ (A.20)
and
n2 ¼ d22=32m2L2ðDpi þ 4s cos y=d2Þ (A.21)
Setting L1 ¼ L2 and m1 ¼ m2, and dividing Eq. A.20 by Eq. A.21 gives the
following relationship:
n1=n2 ¼ ðd21Dpi þ 4s cos yd1Þ=ðd2
2Dpi þ 4s cos yd2Þ (A.22)
Therefore, when Dpi � Pc,
n1=n2 � d21=d
22 (A.23)
and when Dpi � Pc,
Fig. A.10. Changes in contact angle as a result of movement of water–oil interface. y is the contact angle
at static position, ya is the contact angle when oil is displaced by water (advancing angle), and yb is the
contact angle when water is displaced by oil (receding angle).
Fig. A.11. Flow through a two-branch capillary and trapping of oil in a small-diameter capillary.
APPENDIX A282
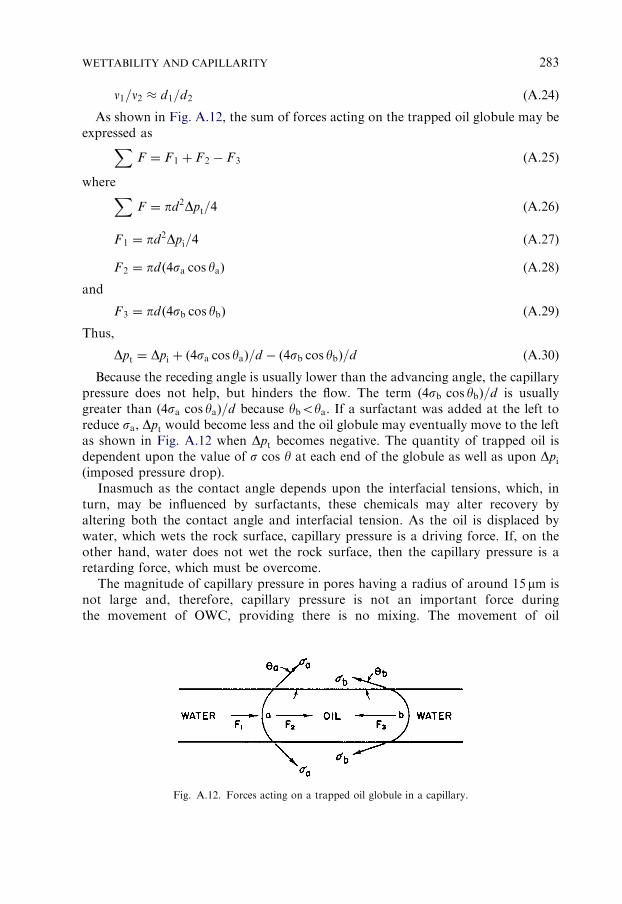
n1=n2 � d1=d2 (A.24)
As shown in Fig. A.12, the sum of forces acting on the trapped oil globule may be
expressed asX
F ¼ F1 þ F 2 � F3 (A.25)
whereX
F ¼ pd2Dpt=4 (A.26)
F 1 ¼ pd2Dpi=4 (A.27)
F 2 ¼ pd ð4sa cos yaÞ (A.28)
and
F 3 ¼ pd ð4sb cos ybÞ (A.29)
Thus,
Dpt ¼ Dpi þ ð4sa cos yaÞ=d � ð4sb cos ybÞ=d (A.30)
Because the receding angle is usually lower than the advancing angle, the capillary
pressure does not help, but hinders the flow. The term ð4sb cos ybÞ=d is usually
greater than ð4sa cos yaÞ=d because yboya. If a surfactant was added at the left to
reduce sa, Dpt would become less and the oil globule may eventually move to the left
as shown in Fig. A.12 when Dpt becomes negative. The quantity of trapped oil is
dependent upon the value of s cos y at each end of the globule as well as upon Dpi(imposed pressure drop).
Inasmuch as the contact angle depends upon the interfacial tensions, which, in
turn, may be influenced by surfactants, these chemicals may alter recovery by
altering both the contact angle and interfacial tension. As the oil is displaced by
water, which wets the rock surface, capillary pressure is a driving force. If, on the
other hand, water does not wet the rock surface, then the capillary pressure is a
retarding force, which must be overcome.
The magnitude of capillary pressure in pores having a radius of around 15 mm is
not large and, therefore, capillary pressure is not an important force during
the movement of OWC, providing there is no mixing. The movement of oil
Fig. A.12. Forces acting on a trapped oil globule in a capillary.
WETTABILITY AND CAPILLARITY 283

and water in a reservoir, however, results in the formation of water–oil and
gas–water–oil mixtures (see Muravyov et al., 1958). The amount of gas coming
out of solution during migration is greater with increasing amount of dissolved
active substances, with increasing surface area of porous medium (i.e., with
decreasing permeability), and with decreasing temperature. As the oil–water–gas
mixture moves through pores, the gas bubbles and water droplets are deformed
on passing through constrictions (see Fig. A.13; see Muravyov et al., 1958). In order
to move, the gas globule as shown in Fig. A.13 must overcome the capillary pressure
equal to
Dp ¼ p1 � p2 ¼ 2s1
R2
�1
R1
� �
(A.31)
Although the Dp may be very small for a single globule, the cumulative resistance
of many bubbles may be large (Jamin effect). Additional resistance to flow is created
by the polymolecular layers of oriented molecules of surface-active components in
the oil, which are adsorbed on the rock surface and may be quite thick
(10�3–10�4 cm). At a constant pressure differential, the rate of oil filtration through
porous media diminishes with time and is more pronounced in the case of higher
content of polar compounds in the oil.
In water-wet carbonate rocks, vugs are ‘‘bad news’’ because during the
waterflooding operations oil is trapped in the vugs. On the other hand, in oil-wet
rocks, vugs are ‘‘good news’’ because water (non-wetting phase) will displace oil
from the vugs. It should be remembered that the non-wetting phase preferably flows
through larger pores.
A.3.1. Water block
The minimum pressure, pcwb, required for oil to displace a globule of water stuck
in a pore throat between the rock grains, providing the oil is the wetting phase, is
Fig. A.13. Movement of gas globule through a constriction (after Muravyov et al., 1958). r1 and r2 ¼
R1 and R2 (radii of curvature).
APPENDIX A284

equal to
pcwb ¼ s1
r1þ 1
r2
� �
cos y (A.32)
where s is the interfacial tension between the oil and water, r1 and r2 are the radii of
capillary in two perpendicular directions, and y is the contact angle.
The above equation can be derived from Eq. A.5:
p1 � p2 ¼ Dp ¼ s1
R1
þ1
R2
� �
(A.33)
(where Dp is the pressure difference across the oil–water interface, and R1 and R2 are
the curvatures of interface in two perpendicular directions), by substituting r1= cos yfor R1 and r2= cos y for R2.
A.4. BUOYANCY
Where the diameter of the gas bubble is less than that of the migration channel,
the gas babble/globule is able to float upward in the channel. In this case, the
capillary pressure plays little or no part in the resistance to gas flow as the gas
globule does not need to displace the water from the pore channel to migrate upward
(a bubble is a small globule).
Fig. A.14 shows an example of gas bubble floating upward due to buoyancy force.
For a Reynolds number, NRp0.4, the drag coefficient, CD ¼ 24/NR for a bubble of
spherical form. Thus, for a laminar or viscous flow, the drag force, D, on the gas
bubble is equal to
D ¼ ACDrðn2Þ=2 ¼ ð24m=rndÞrðn2Þ=2ðpd2=4Þ ¼ 3mnpd (A.34)
where A is the largest projected area (in ft2), r is the mass per unit volume (in slug/
ft3), m is the viscosity of the fluid (in lb-s/ft2) (or slug/ft s), n is the upward velocity of
the bubble in ft/sec, and d is the diameter of the spherical gas bubble (in ft).
Inasmuch as the buoyant force, B, is acting upward, whereas the drag force, D,
and the weight of the gas bubble, Wg, are acting down, D+Wg ¼ B:
ðpd3=6Þgw � ðpd3=6Þgg ¼ 3mnpd (A.35)
Solving for upward velocity of bubble, n,
n ¼ d2ðgw � ggÞ=18mw (A.36)
Assuming a temperature of 251C, a pressure of 20 kg/cm2, a specific weight
of methane gas of about 0.015 g/cm3, a specific weight of water of 1 g/cm3, a
water viscosity at this conditions of approximately 10�2P, and a migrating gas
bubble having the radius of 0.1 cm, the critical velocity is approximately equal to
0.22 cm/s.
WETTABILITY AND CAPILLARITY 285
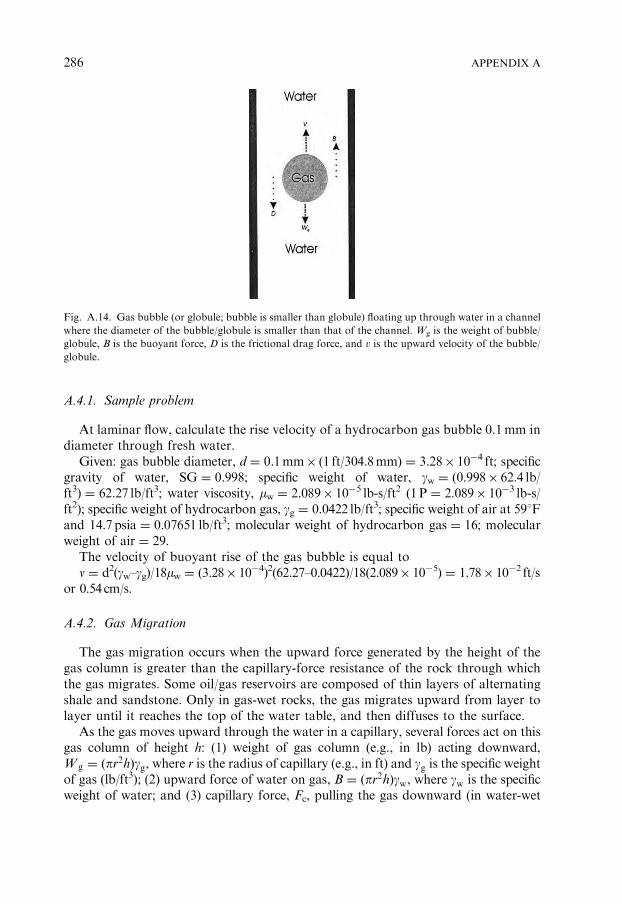
A.4.1. Sample problem
At laminar flow, calculate the rise velocity of a hydrocarbon gas bubble 0.1mm in
diameter through fresh water.
Given: gas bubble diameter, d ¼ 0.1mm� (1 ft/304.8mm) ¼ 3.28� 10�4 ft; specific
gravity of water, SG ¼ 0.998; specific weight of water, gw ¼ (0.998� 62.4 lb/
ft3) ¼ 62.27 lb/ft3; water viscosity, mw ¼ 2.089� 10�5 lb-s/ft2 (1 P ¼ 2.089� 10�3 lb-s/
ft2); specific weight of hydrocarbon gas, gg ¼ 0.0422 lb/ft3; specific weight of air at 591F
and 14.7 psia ¼ 0.07651 lb/ft3; molecular weight of hydrocarbon gas ¼ 16; molecular
weight of air ¼ 29.
The velocity of buoyant rise of the gas bubble is equal to
n ¼ d2(gw–gg)/18mw ¼ (3.28� 10�4)2(62.27–0.0422)/18(2.089� 10�5) ¼ 1.78� 10�2 ft/s
or 0.54 cm/s.
A.4.2. Gas Migration
The gas migration occurs when the upward force generated by the height of the
gas column is greater than the capillary-force resistance of the rock through which
the gas migrates. Some oil/gas reservoirs are composed of thin layers of alternating
shale and sandstone. Only in gas-wet rocks, the gas migrates upward from layer to
layer until it reaches the top of the water table, and then diffuses to the surface.
As the gas moves upward through the water in a capillary, several forces act on this
gas column of height h: (1) weight of gas column (e.g., in lb) acting downward,
W g ¼ ðpr2hÞgg, where r is the radius of capillary (e.g., in ft) and gg is the specific weight
of gas (lb/ft3); (2) upward force of water on gas, B ¼ ðpr2hÞgw, where gw is the specific
weight of water; and (3) capillary force, Fc, pulling the gas downward (in water-wet
Fig. A.14. Gas bubble (or globule; bubble is smaller than globule) floating up through water in a channel
where the diameter of the bubble/globule is smaller than that of the channel. Wg is the weight of bubble/
globule, B is the buoyant force, D is the frictional drag force, and v is the upward velocity of the bubble/
globule.
APPENDIX A286

rocks), F c ¼ 2prðswg cos ywgÞ, where swg is the water–gas interfacial tension and ywg is
the water–gas–rock contact angle. Thus, W g þ F c ¼ B, or ðpr2hÞgg þ 2pr
ðswg cos ywgÞ ¼ ðpr2hÞgw. Solving for h, one obtains
h ¼ ð2swg cos ywgÞ=rðgw � ggÞ ¼ ð2swg cos ywgÞ=rDg (A.37)
and in as much as ð2swg cos ywgÞ=r ¼ PðwgÞc , which is the capillary pressure in the
water–gas system:
h ¼ PðwgÞc =Dg (A.38)
In gas-wet system (possibly some carbonates), the gas starts moving without
reaching this minimum height because the capillary pressure aids the upward
movement. (For analysis of oil-water system, see Chilingar et. al., 1972, pp. 355–356.)
The writers believe that petroleum geologists and engineers must be familiar with
both the SI and FPS systems of weights and measures and be able to easily make
necessary conversions.
WETTABILITY AND CAPILLARITY 287

This page intentionally left blank
288

.Appendix B
PERMEABILITY
Permeability is the measure of the ability of a porous rock to transmit a fluid
under the pressure gradient (differential pressure). The absolute permeability is the
ability of a rock to conduct a fluid (gas, oil, or water) at 100% saturation with that
fluid. Effective/phase permeability is the ability of a rock to conduct one fluid phase
(gas, oil, or water) in the presence of other fluid phases. Relative permeability to a
fluid is the ratio of effective/phase permeability at a given saturation to the
permeability at 100% saturation (the absolute permeability). The terms kro(ko/k),
krg(kg/k), and krw(kw/k) denote the relative permeability to oil, to gas, and to water,
respectively (k is the absolute permeability, often the single-phase liquid
permeability). The relative permeability is expressed in percent or as a fraction. It
ranges from zero at a low saturation to 1 at a saturation of 100%.
Permeability is measured by an arbitrary unit called Darcy, which is named after
Henry d’Arcy, a French engineer, who in 1856 devised a method of measuring the
permeability of porous rocks. The permeability is equal to 1Darcy if 1 cm3 of fluid
per second flows through 1 cm2 of cross-section of rock under a pressure gradient of
1 atm/cm, the fluid viscosity being 1 cP. Because most reservoir rocks have an
average permeability considerably o1Darcy, the usual measurement units are
millidarcies (mD).
In the majority of formations there is a simultaneous existence of more than one
phase: (1) oil and gas, (2) oil and water, or (3) oil, gas, and water. The concept of
effective permeability implies that all but one phase are immobile. Inasmuch as a
part of the effective pore space is occupied by another phase, a correction factor
must be used. The magnitude of effective permeability depends on wettability, i.e.,
on whether (1) the immobile phase does not wet the solid surfaces of the rock and,
therefore, occupies the central parts of the pores, or (2) the immobile phase wets the
solid surfaces and thus tends to concentrate in smaller pores. The nature,
distribution, and amount of immobile phase affects effective permeability.
The results of effective/phase permeability measurement are shown graphically in
the triangular diagram, where the apex represents the 100% saturation point of the
respective phase (oil, gas, or water). Contour lines of equal permeability to oil, gas,
and water are drawn in order to evaluate the test results and characteristics of
simultaneous multiphase fluid flow (Fig. B-1). Composition of three-phase flow
through the porous media (after Leverett, 1941) is shown in Fig. B-2.
The diagram of relative permeability to oil and to water versus the oil and water
saturation is constructed and data points for the relative phase permeability to oil
and water in the presence of gas phase are depicted on the diagram. Examples of
curves of relative permeability to oil and to water vs. water saturation are shown in
Figs. B-3–B-5.
289
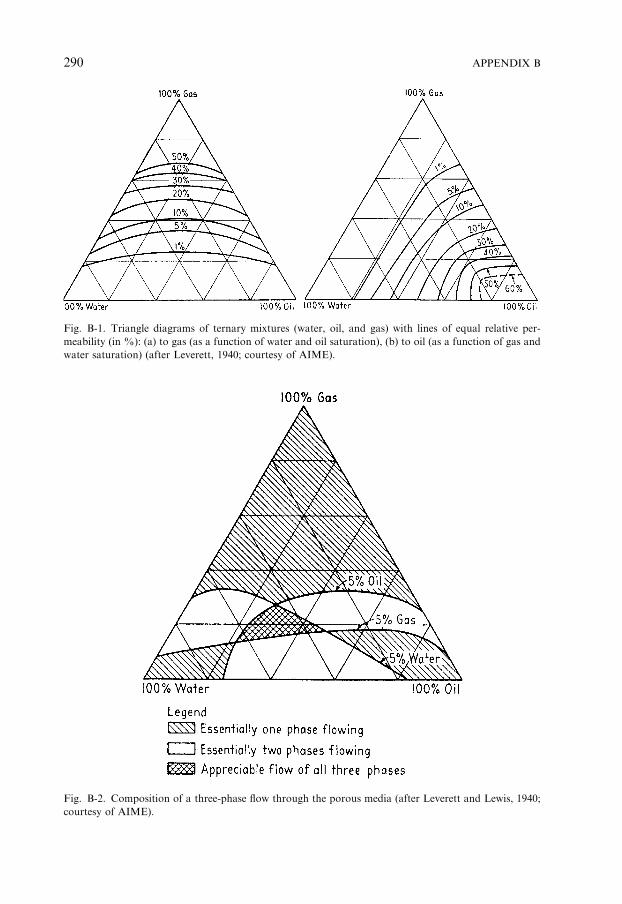
Fig. B-1. Triangle diagrams of ternary mixtures (water, oil, and gas) with lines of equal relative per-
meability (in %): (a) to gas (as a function of water and oil saturation), (b) to oil (as a function of gas and
water saturation) (after Leverett, 1940; courtesy of AIME).
Fig. B-2. Composition of a three-phase flow through the porous media (after Leverett and Lewis, 1940;
courtesy of AIME).
APPENDIX B290

In waterflooding projects or in natural water-drive pools, the relative permeabil-
ities to oil and to water are of great importance. Where water and oil flow together,
the relative permeabilities are affected by many factors, which include:
(1) relative dispersion of one phase in the other,
(2) time of contact with pore walls,
(3) amount of polar substances in the oil,
(4) degree of hardness of water,
Fig. B-3. Relative permeability curves for polar and non-polar oil. Curves P and P0 are for polar oil,
whereas curves N and N0 are for non-polar oil (after Babalyan, 1956, p. 145).
Fig. B-4. Relative permeabilities to oil and to water for polar oil+alkaline water (curves 1 and 10) and for
polar oil+hard water (curves 2 and 20) (after Babalyan, 1956, p. 148).
PERMEABILITY 291

(5) relative amount of carbonate material in porous medium, and
(6) temperature.
Based on the laboratory experiments (Sinnokrot and Chilingar, 1961), the relative
permeability to the continuous phase (dispersion medium) is greater than the relative
permeability to the discontinuous (dispersed, internal) phase. With increasing degree
of dispersion, the relative permeability increases for both continuous and discon-
tinuous phases. The degree of dispersion increases with decreasing interfacial tension
and increasing time of coalescence of dispersed-phase droplets.
Sticking (attachment) of the dispersed phase to solid surface depends on (1) in-
terfacial tension, (2) angle of contact, (3) time necessary for the coalescence of
droplets and lenses of mobile part of a dispersed phase with immobile part, and (4)
thickness of dispersion medium (continuous phase) layer attached to the solid sur-
face. The relative permeability of the dispersed phase decreases if its droplets stick to
the solid surfaces. The thickness of water film on solid surfaces is decreased in the
presence of surface-active substances, which adsorb on the surfaces. In the case of
alkaline water, which contains certain amount of salts of organic acids (soaps),
adsorbed layer (film) is thinner than in the case of hard or distilled water.
At low water saturation, water is present as a dispersed phase. The intensity of its
transition from a dispersed phase into a dispersion medium (continuous medium) is
determined by the intensity of coalescence of water droplets and intensity of their
sticking (attachment) to solid surfaces. The water saturation at which water changes
from a dispersed phase into a continuous phase decreases with decreasing time of
coalescence and sticking of water droplets to solid surfaces.
With increasing concentration of polar substances in the oil, the cumulative water
production decreases. The change in oil production rate upon increasing the con-
centration of polar substances in oil is quite rapid initially; then it slows down and
eventually stabilizes when the polarity of oil reaches a certain limit. As shown in
Fig. B-5. Relative permeability curves for non-polar oil with alkaline water (curves 1 and 10) and for non-
polar oil+hard water (curves 2 and 20) (after Babalyan, 1956, p. 145).
APPENDIX B292

Fig. B-3, the critical saturation for water decreases (point a moves to a0) and that for
oil increases (point b moves to b0) with increasing concentration of polar substances
in the oil. With decreasing concentration of polar substances in oil, the relative
permeability to water sharply increases (point b000 moves to b00), whereas that to oil
decreases (point a000 moves to a00). This is mainly due to the fact that attraction of
non-polar oil to solid surfaces is negligible and that the mobile oil presents less
resistance to flow of water than does the immobile oil.
According to Babalyan (1956), in the case of polar oil the water, and oil pro-
duction is greater when the water is alkaline than when it is hard. This is due to the
change in the critical saturation of both phases (Fig. B-4). As shown in Fig. B-4, the
relative permeability curves of oil+alkaline water lie above those of oil+hard water,
because the following is true in the case of alkaline waters: (1) low interfacial tension
between oil and water, (2) low values of contact angle, (3) slow coalescence of oil
droplets in water, and (4) greater degree of dispersion of oil in water. In the case of
hard water, on the other hand, the oil becomes a dispersed phase at higher water
saturation in a porous medium than in the case of alkaline waters. The intensity of
the transformation of oil into a dispersed phase is greater in the alkaline than in hard
waters.
In the case of non-polar oil, the attachment of oil to solid surfaces is negligible in
the presence of both alkaline and hard waters. When non-polar oil flows with either
alkaline or hard water, there is no change in critical saturations and hence the
recovery of oil and water is the same in each case. The relative permeability curves
with alkaline water, however, lie above those with hard water (Fig. B-5).
Some of the controversial aspects of the above discussion will be resolved by
future research.
For details on the relative permeability of carbonate reservoirs see Honarpour
et al. (1992).
PERMEABILITY 293

This page intentionally left blank
294

Appendix C
GLOSSARY�
A
Abandon To cease efforts to test dry hole or to produce oil or
gas from a well when it becomes unprofitable and to
place the cement plug(s) in the borehole to prevent
migration of fluids between the different formations
penetrated by the borehole. See: Plug and abandon
(P&A)
Abiogenic Products (minerals, sediments, or rocks) resulting
from inorganic processes of formation. Cf: Biogenic.
Abnormal pressure Pressure exceeding or falling below the normal
pressure to be expected at a given depth.
Absolute permeability A measure of the ability of a single-phase fluid (such
as water, gas, or oil) to flow through a rock formation
when the formation is totally filled (saturated) with
this fluid.
Accretion Vertical buildup or lateral extension of deposits as a
consequence of sedimentation or biotic activities.
Accuracy Closeness to the true value or to value accepted as
being true; the degree of perfection attained in a
measurement, computation, or estimate, or degree of
conformity to some recognized standard value (such
as conventional unit of measure, an exact
mathematical value, or a survey observation
determined by refined methods). Accuracy related to
the quality of a result, as distinguished from
precision.
Acidizing The introduction of acid (hydrochloric, formic, and
acetic, for carbonates; and hydrofluoric for
sandstones) into a formation to dissolve rocks, thus
opening new and widening old passageways for fluids
to flow through. See also: Fracture acidizing, Matrix
acidizing.
Acoustic (sonic) log Measurement of porosity, lithology, and cement
bonding by the use of sonic waves.
�Also see Chilingarian et al., 1986, 1996.
295

Aerobic Said of an organism that can live only in the presence
of free oxygen; also said of its activities. Cf:
Anaerobic, Anoxic.
Aggradation Vertical accumulation of deposits as a consequence of
sedimentation or biotic activities. Cf: Degradation.
Air drilling Use of compressed air instead of liquid as the
circulation medium in rotary drilling. See also: Gas
drilling.
Algorithm A set of rules which specify a sequence of actions to
be taken to solve a mathematical problem. It
frequently involves repetition of an action.
Alkali Any strongly basic substance, such as a hydroxide or
carbonate of an alkali metal (e.g., sodium,
potassium). Plural: Alkalis. Adj: Alkaline.
Alkaline (soft) water Water containing not more than 60 ppm (60mg/l) of
hardness-forming constituents (calcium and
magnesium) expressed as CaCO3 equivalent. Cf: Hard
water.
Alkanes (or paraffins) Methane series derived from petroleum, with carbon
atoms arranged in a straight chain. It includes
methane, ethane, propane, butane, pentane, hexane,
and octane (CnH2n+2).
Alkenes See: Olefins.
Alkylation The reaction of alkenes or olefins with branched-
chain alkane to form a branched, paraffinic
hydrocarbon with high anti-knock qualities.
Allochem Carbonate particle of either skeletal or non-skeletal
origin.
Allochthonous Sediments or rocks formed elsewhere than where they
are ultimately deposited; of foreign or introduced
origin. Syn: Allogenous.
Alluvial Pertaining to or composed of alluvium, or deposited
by a stream or running water.
Alluvial fan An outspread, gently slopping mass of alluvium
deposited by a stream, especially in an arid or
semiarid region where a stream issues from a narrow
canyon onto a plain or valley floor.
Alluvium A general term for detrital deposits made by streams
on river beds, flood plains, and alluvial fans;
especially a deposit of silt or silty clay laid down
during the time of flood.
Anaerobic Said of an organism that can live in the absence
of free oxygen; also said of its activities. Cf:
Aerobic.
Analogy Likeness in form of function but not in origin.
APPENDIX C296

Analysis of covariance The partition of the total variation in a set of
observations into components corresponding to
differences between and within sub-classifications of
the data, after adjustment for the effect of other,
possibly related, variables (covariates).
Analysis of variance
(ANOVA)
A statistical technique for simultaneously partitioning
the total variance of a set of the data into components
which can be attributed to different sources of
variation, and which can be used to test for
differences among several samples.
Anisotropic medium A medium whose physical properties vary in different
directions. Cf: Isotropic medium.
Annular space Space between the outside of the casing and the
wellbore.
API Gravity The standard method of expressing the specific weight
of oils: oAPI ¼ 141.5/SG – 131.5, where SG is the
specific gravity of oil at 60oF compared with water at
60oF.
Aquiclude A body of relatively impermeable rock functioning as
an upper or lower boundary of an aquifer and does
not transmit water. Cf: Aquifer.
Aquifer A permeable reservoir or portion of reservoir
containing formation water or groundwater. Cf:
Aquiclude.
Argillaceous Containing clay minerals as impurities in carbonate,
siliciclastic, or evaporitic sediments.
Aromatics Group of cyclic hydrocarbons found in oils. Contain
a benzene ring nucleus in their structure, with a
general formula CnH2n�6.
Artificial lift Any mechanism, other than natural, that lifts fluid
from the wellbore to the surface.
Asphalt Black to dark-brown solid or semisolid bitumens,
which gradually liquify when heated. Composed
principally of carbon and hydrogen, but contain
appreciable quantities of nitrogen, sulfur, and oxygen;
largely soluble in carbon disulfide.
Asphaltenes Any of the solid, amorphous, black to dark-brown
dissolved or dispersed constituents of crude oils and
other bitumens, which are soluble in carbon disulfide.
They consist of carbon, hydrogen, and some nitrogen
and oxygen, hold most of inorganic constituents of
bitumens.
Atoll A ring-shaped reef, circular or elliptical or horseshoe-
shaped, generally encircling an interior lagoon, and
surrounded by deeper water.
GLOSSARY 297

Authigenic Formed or generated in place; specifically said of
minerals that have precipitated in place or which have
replaced other minerals or particles in various
diagenetic environments.
Autochthonous Said of sediments or rocks that have accumulated in
place. Cf: Allochthonous, Allogenous. Syn:
Authigenous.
B
Backstepping Referring to carbonate platforms that are being
eroded or tectonically drowned such that their areal
dimensions are progressively reduced in a landward
direction.
Bafflestone Reef rock that has accumulated as a result of the
trapping or baffling of sediments amidst in-place
organic framework.
Ball sealers Rubber balls dropped into a wellbore to plug
perforations.
Bank Limestone deposits consisting of skeletal matter
formed by in-place organisms or sediments deposited
generally in shallow water; in both cases the deposit
may be surrounded by deeper water.
Barefoot Well completed without casing.
Barite A mineral often used as a component of drilling mud
(or fluid) to add weight: barium sulfate (BaSO4),
SGE4.3. Syn: Heavy spar.
Barrel A unit of petroleum liquid measure equal to 42
gallons, US.
Barrier reef Long, linear reef oriented parallel to shoreline and
separated from it at some distance by a lagoon of
considerable depth and width; generally occur along
the margins of shallow-water platforms, and pass
seaward into deeper-water environments.
Basin (a) A depressed area with no surface outlet.
(b) A low area in the Earth’s crust, of tectonic origin,
in which sediments have been accumulated.
Benzene An aromatic hydrocarbon (C6H6) found in
petroleum. Used as solvent for petroleum products.
Used as synonym for gasoline in many European
countries.
Bindstone Reef rock that has accumulated as a result of
the presence of tabular or lamellar fossils
that encrusted or otherwise bound sediments
during deposition. Partial syn: Boundstone,
Biolithite.
APPENDIX C298

Bioclastic Skeletal-derived sediments. Syn: Biogenic, Skeletal-
organic.
Bioerosion Removal of generally consolidated sediments by the
boring, scraping, chewing, and rasping activities of
organisms.
Biogenic Sediments or rocks, or mineral deposits whose origin
is related to organic activity. Syn: Organic.
Bioherm Mass of rock with varying amounts of topographic
relief above sea floor that has been constructed by
organisms.
Biolithite General term for reef rocks that have accumulated as
a result of the activity of organisms. Partial syn:
Boundstone.
Biostrome Bedded and widely extensive, or broadly lenticular,
blanket-like mass of rock constructed by organisms.
Biota All organisms that are living or have lived in an area,
including animals and plants.
Bioturbation The disruption of sedimentary strata and included
sedimentary/biotic structures by the burrowing
or grazing activities of organisms. Syn: Burrow
mottling.
Bit The rock-cutting tool attached at the working end of
the drilling string. Syn: Drill (or drilling) bit.
Bitumen A generic term for natural, inflammable substances
that are composed of a mixture of hydrocarbons that
are substantially free of oxygenated bodies.
Block diagram An illustration, in which parts of machine or a
process are represented by blocks or similar symbols,
connected by straight lines or arrows. Syn: Flowchart.
Blowout Blowing out of gas and fluids when excessive well
pressure exceeds the pressure of the drilling fluid
head.
Blowout preventer, BOP Device consisting of a series of hydraulically
controlled rams and inflatable bags to prevent the
blowout of a well.
Bottom fraction Heavier components of petroleum, which remain
after the lighter ends have been removed (distilled
out).
Boundstone General term for reef rock that has accumulated
as a result of the activity of organisms; or
non-reef rock that has accumulated as a
result of extensive syndepositional marine
lithification.
Bound water The thin layer of water, which adheres to the surface
of shales and is not producible.
GLOSSARY 299
Brecciation Disruption of strata, and development of fitted clasts
separated by fractures or of chaotic clasts with or
without matrix, formed as a result of tectonism,
carbonate dissolution and collapse, or evaporite
dissolution and collapse.
Bridge plug A mechanical device used to ‘‘seal-off ’’ the wellbore
below the point where it is set.
BS Basic sediment
BS&W Basic sediment and water (often found at the bottom
of tanks).
Buildup General term for reef accumulation.
C
Cable lift A device that uses a cable, often from a tower, instead
of a walking beam to lift the sucker rods.
Calcite/aragonite
compensation depth
Depth in the sea below which the rate of calcite or
aragonite dissolution exceeds their rates of
deposition.
Caliche Authigenic deposit of calcium carbonate, generally
low-magnesium calcite, that forms at the expense of
(i.e., replacing) preexisting sediments, soils, or rocks.
Syn: Soilstone crust, Calcrete.
Calcification Term describing the process of calcite or calcrete
formation.
Caliper log Determination of the inside diameter of a wellbore or
casing
Capillarity The action by which a fluid, such as water, is drawn
up (or depressed) in small interstices or tubes as a
result of surface tension. Syn: Capillary action.
Capillary The minute openings between rock particles through
which fluids are drawn.
Capillary action The upward and outward movement of fluids through
the porous rock as a direct result of surface properties
of rock.
Caprock An impervious body of a rock that forms a vertical
seal against hydrocarbon migration. In a salt dome,
an impervious body of anhydrite and gypsum, with
minor calcite and sulfur, which overlies the top of the
salt body, or plug. It probably results from
accumulation of the less soluble minerals of the salt
body during leaching of its top in the course of its
ascent.
Carbonate rock A rock consisting chiefly of carbonate minerals, such
as limestone, dolomite, or carbonatite; especially a
APPENDIX C300
sedimentary rock composed of more that 50% (by wt)
of carbonate minerals.
Carbonates Group of minerals found mostly in limestones and
dolomites. Calcite (CaCO3) is the most abundant and
most important. Aragonite has the same formula as
calcite but it is less stable; and dolomite contains
magnesium, CaMg(CO3)2. Often used as syn. for
carbonate rocks.
Carbon dioxide injection Compressed CO2 is injected into the formation to
supply energy to push the oil toward the producing
wells and also to improve recovery by mixing with
both the oil and water.
Casing Pipe used to keep the wellbore walls from collapsing
and to seal the borehole to prevent fluids outside the
well from moving from one portion of the well to
another (i.e., crossflow).
Catagenesis Term applied to changes in existing sediments,
or most commonly, rocks during deep burial at
elevated temperatures and pressures short of
metamorphism. Adj: Catagenetic. Syn: Mesogenesis,
Epigenesis.
Catalysis Process in which the chemical reaction rate is affected
by the introduction of another substance (catalyst).
Cation-exchange capacity
(CEC)
The total amount of exchangeable cations that a
particular substance can adsorb at a given pH.
Exchangeable cations are held mainly on the surface
of clay minerals, and are measured in milligram-
equivalents per 100 g of the substance.
Caustic injection Adding caustic to the water being injected to improve
oil recovery by forming oil–water emulsions that help
plug-off the larger pore channels, giving a more even
push to oil in moving it toward the producing wells.
Also reduces interfacial tension and increases the
relative permeability to oil.
Caustobiolith A combustible organic rock, usually of plant origin.
Cellar Area dug out beneath the drilling platform to allow
room for installation of blowout preventer (BOP).
Cement Naturally occurring (biogenic or abiogenic)
precipitate of mineral material, usually calcite,
aragonite, or dolomite in sedimentary rocks, that
binds particles together into a lithified framework.
Cementation Process by which sedimentary rock particles or
fragments are cemented together after deposition.
Partial syn: Consolidation.
GLOSSARY 301

Cementing Pumping of the cement slurry down the casing and
then back up the annular space between the casing
and the borehole.
Cement slurry A mixture of cement and water in a liquid form which
is pumped behind the casing. The slurry is allowed to
set until it hardens.
Centralizer Device fitted around the outside of casing as it is
lowered down in the borehole to keep cement in the
hole, to achieve a good cement job.
Chalk Carbonate rock of low-magnesian calcite composition
consisting dominantly of the remains of coccoliths
and coccospheres.
Chlorite A group of minerals that are related in structure and
composition to the micas. They are hydrated silicates
and have general formula (Mg,Fe)5Al(AlSi3)O10;
green, soft, and platy.
Choke A device that restricts the flow in flowline or through
the orifice, and causes a pressure drop or reduced flow
rate. It provides precise control of wellhead flow rates
in surface production applications involving oil and
gas and in enhanced recovery.
Christmas tree Array of valves, pipes, and fittings placed at the top of
the well, on the surface.
Circulation system Portion of the rotary drilling system, which circulates
the drilling fluid (mud).
Circumgranular Cement which completely lines the pores in a rock.
Clarke The average abundance of a chemical element in the
Earth’s crust. It is named in honor of Frank W.
Clarke (1847–1931), a Chief Chemist of the US
Geological Survey from 1884 to 1925.
Clastic Term used in reference to particles (carbonate,
siliciclastic, or other mineralogies) that commonly are
transported by fluids.
Claystone A compacted, non-fissile, fine-grained, sedimentary
rock composed predominantly of clay-sized particles.
See: Mudstone.
Cluster analysis A statistical method of classifying observations into
homogenous subsets based on their mutual
similarities and hierarchical relationships.
Coated grain Carbonate particle consisting of nuclear fragment
surrounded by a cortex of chemically precipitated
carbonate (e.g., ooids, pisoliths) or cortex composed
of organic encrustation (e.g., oncolites, rhodolites).
Coccolith A button-like plate composed of calcium carbonate,
generally about 3 mm in diameter, a number of which
APPENDIX C302

compose the outer skeletal remains of coccospheres
(skeletons of marine, planktonic protists).
Coefficient of correlation A dimensionless quantity measuring the degree of
linear association between two variables and taking
values in the range from �1 to +1: value of �1
indicates a perfect negative linear relationship; +1, a
perfect positive relationship; 0 denotes the absence of
relationship. Symbol: r.
Coefficient of
determination
A measure of the proportion of each other’s
variability that two variables share; the squared
coefficient of correlation. Symbol: r2.
Coefficient of variation A dimensionless quantity measuring the relative
dispersion of a set of observations, calculated as the
ratio of the standard deviation to the mean of the
data values (sometimes as a percentage). Syn:
Coefficient of variability.
Collapse breccia Sedimentary breccia formed as a result of collapse of
indurated strata due to dissolution of underlying
strata, or commonly, cave-roof collapse.
Combination drive Two or three natural drives moving the reservoir
fluids toward the wellbore.
Compaction Reduction in bulk volume and/or thickness of a
sedimentary deposit resulting from either physical
processes of grain readjustment (closed packing) in
response to an increased weight of overburden
(mechanical compaction), or chemical processes such
as dissolution, grain interpenetration, and
stylolitization (chemical compaction).
Completion Finishing a well. Installation of necessary equipment
to produce a well. Includes placing the casing,
cementing and perforation opposite the productive
zone.
Composite sample Oil sample composed of equal portions of samples
obtained from two or more points in the tank.
Composite grain Aggregate carbonate grain composed of discrete
particles bound together by cement or organic
mucilage.
Condensate Liquid hydrocarbons, generally clear or pale straw-
colored and of high API gravity (above 601), that are
produced with wet gas. Syn: Distillate, Natural
gasoline.
Conduction log Measurement of the formation electric conductivity.
Conductor Casing pipe in a wellbore attached to the BOP.
Confidence level [stat] The probability (prescribed in advance and expressed
as decimals or percentage) that true value of an
GLOSSARY 303
unknown parameter (e.g., mean value of probability
distribution) will be in the confidence interval.
Confidence level supplements the level of significance
to 1 or 100% (often this probability is set at 0.95 or
95%). Syn: Level of confidence.
Confidence limits [stat] Either the upper or the lower value between which an
actual measurement or parameter will fall with a
stated probability (i.e., confidence level). An interval
between confidence limits is referred to as the
confidence interval.
Connate water Water ultimately of marine origin that has been
entrapped in sediment pores after its burial, and
which has been out of contact with the atmosphere
for an appreciable period of geologic time. Cf:
Meteoritic water.
Consolidation Any process (including the deposition of cement) that
changes loose sediment to a coherent rock. Syn:
Lithification.
Contact angle The angle which the oil–water interface makes with
the solid (rock). Usually, it is measured from the solid
through the liquid phase (if the other phase is a gas),
and through the water phase if oil and water are both
present, to the oil–water interface.
Continental slope The part of continental margin that is located
between the continental shelf and continental rise (or
oceanic trench). It is characterized by relatively steep
slope of 3–61.
Contour map A map with continuous lines connecting data points
of equal value, such as elevation, formation thickness,
rock porosity, etc.
Core A cylindrical sample of the rock taken from the well
during drilling operations.
Core sampling Taking a sample of geological strata for examination.
Syn: Coring.
Correlation The intensity of association or interdependence
between two or among several variables, e.g., a
tendency for variation in one variable to be
accompanied by linear variation in another.
Correlation ellipse An ellipse outlying correlated data points within
the given confidence level. Syn: Ellipse of
correlation.
Corrosion Chemical reaction (mainly loss of electrons) that
oxidize metals, e.g., Fe - Fe2+ + 2e�.
Corrosion inhibitor Chemicals added to minimize or prevent corrosion of
metals.
APPENDIX C304

Covariance A measure of the association between two variables x
and y calculated as the arithmetical mean or the
expected mean value of the product of the deviation
of two variables from their respective mean values.
Symbol: cov(x, y).
Critical point A point at which one phase cannot be distinguished
from another and the material cannot be condensed
regardless of the amount of pressure applied. There is
no volume change when a liquid is vaporized at the
critical point (at critical temperature and critical
pressure).
Critical velocity A velocity at the transitional point between laminar
and turbulent types of fluid flow. This point occurs in
the transitional range of Reynolds numbers of
approximately 2,000–3,000.
Cross-stratification Layers or laminae of sedimentary rock deposited at
angles to the horizontal (not exceeding the angle of
repose in air or water) as a normal consequence of
transport by air or water. Syn: Cross-bedding.
Crown block Pulley installed at the top of the drilling rig, which
raises and lowers the drillstring.
Crude oil Petroleum as it is produced from the formation. The
two categories of crude oils are distinguished: (a)
heavy crude — thick (sticky) oil with an 1API gravity
o 171, and (b) light crude — thin (light) oil with an
1API gravity 4251.
Cryptalgal Term used in reference to a presumed algal or
cyanobacterial origin of certain carbonate rock.
Cryptocrystalline Term used in reference to crystal components (e.g.,
cement or architectural elements of shells) of very fine
size, generally not resolvable without the use of at
least a petrographic microscope; also said of a rock
with such texture. Syn: Microcrystalline.
Crystal silt Internal sediments found in cavities in rocks,
composed of silt-size particles of crystals; generally
form as a result of partial dissolution of host rock/
sediment or boring by organisms.
Cumulative distribution
function [stat]
A function giving the probability that a
corresponding continuous random variable takes a
value less than or equal to the argument of the
function.
Cumulative frequency
distribution [stat]
A curve drawn to represent the percentage of
occurrences of a number of observations of a variable
less and greater than any given value for an entire
sample. Syn: Cumulative curve.
GLOSSARY 305

Cuttings Rock chips or fragments produced by drilling and
brought to the surface. Syn: Drill cuttings.
Cyanobacteria Biological/geological term for blue-green algae
(cyanophytes), the association of blue-green algae and
bacteria, or the bacterial affinity of blue-green algae.
Cyclic sedimentation Sedimentation involving a vertical repetition of rock
types representative of distinct depositional
environments. Syn: Rhythmic sedimentation.
Cycloparaffins Group of saturated homocyclic hydrocarbons having
the formula CnH2n. Syn: Naphthene.
D
Dedolomite Dolomite that has been replaced by calcite wherein
the crystal form of the predecessor has been
preserved.
Dedolomitization Process of replacement of dolomite by calcite with
preservation of dolomite crystal form.
Deflation Removal of the loose, dry sediment by wind action.
Deflection A change in the angle of a wellbore. In directional
drilling, it is measured in degrees from the vertical.
Degrees of freedom The capability of variation in a system. The number
of degrees of freedom is determined as the number of
independent variables defining the state of a system.
Dehydration The removal of water or water vapor from gas or oil.
Delta The nearly flat alluvial tract of land at the mouth of a
river, commonly forming a triangular or fan-shaped
plain resembling the Greek letter ‘‘delta’’, D, in plan
view. It is crossed by many distributaries, and resulted
from the accumulation of sediment supplied by the
river. Most deltas are partly subaerial and partly
below water.
Deltaic Pertaining to or characterized by a delta, e.g., deltaic
sedimentation or deltaic coast.
Dendrogram A tree-like diagram depicting the mutual relationships
of a group of items sharing a common set of
variables, the variables representing either samples on
which multiple measurements have been made or
measured attributes for a group of samples.
Dendrograph A tree-like two-dimensional correlation diagram
depicting the mutual relationships between and within
groups of items sharing a common set of variables.
Density The mass or weight of a substance per unit volume (in
ppg, lb/ft3, or kg/m3). Also see Specific gravity, and
API gravity.
APPENDIX C306

Density log Measurement of formation porosity. Involves
bombarding the formation with gamma rays, with
detectors measuring the number of gamma rays that
are reflected from the formation.
Depositional karst Term used in reference to various small-scale karst
features (e.g., small dissolution caves and related
speleothems and cave cements, dissolution-etched
erosion surfaces) formed as a result of short periods
of subareal exposure during deposition.
Desiccation Loss of interstitial water from sediments as a result of
drying.
Design of experiments Methods of obtaining mathematical description or
mathematical model of a process under study as a
regression equation based on the limited number of
reproducible experimental data. Syn: Experimental
design.
Detrital Term generally restricted to sediments derived from
the erosion of preexisting rocks. Syn: Terrigenous,
Siliciclastic.
Deviation [stat] The difference between an observation and a fixed
value.
Deviation [drill] Directional change of wellbore from vertical.
Diagenesis All chemical, physical, and biologic changes in
sediments or rocks that have altered their original
textures and mineralogies, operative from the time of
their formation and deposition, up through
lithification.
Diagenetic facies An assemblage of rocks with similar diagenetic
attributes or which have been affected by similar
diagenetic histories.
Differential pressure The difference between two fluid pressures; e.g., the
difference between the pressure in a reservoir and in a
wellbore drilled through the reservoir.
Diffusion (a) The spontaneous movement and scattering of
particles of liquids, gases, or solids.
(b) The migration of dissolved substances from an
area of high concentration to an area of low
concentration.
Directional drilling Intentional deviation of a wellbore from the vertical.
Directional survey A logging method that records drift angle, or
deflection from the vertical, and direction (azimuth)
of the drift.
Discriminant analysis A statistical procedure for classifying subsequent
samples into categories previously defined and
GLOSSARY 307

differentiated on the basis of samples from known
population.
Dispersion [stat] The extent, to which observations are dissimilar in
value, often measured by standard deviation, range,
etc.
Dispersion [petr] A suspension of extremely fine particles in a liquid
(e.g., colloids in a colloidal solution).
Dissolution Process of dissolving substances. Syn: Leaching.
Dissolution-enlargement/
enhancement
In porosity studies, the process of enlarging or
otherwise enhancing the size of preexisting pores by
dissolution.
Dissolution-
reprecipitation
Common process of carbonate dissolution and void
formation at the microscale or macroscale, followed
by the precipitation of another mineral phase.
Distally-fining A sequence of rocks wherein sediment size decreases
either away from shore, toward deeper water
(marine), or from the point of sediment input (marine
or terrestial).
Distillation Boiling off various fractions of oil at different
temperatures.
Distribution [stat] (a) The partition of observations into intervals by
value.
(b) The set of frequencies of observations in a set of
intervals (frequency distribution).
(c) A generic term for mathematical formulae giving
probabilities related to values of random variables.
The following statistical distributions are
distinguished: binomial, chi-square, exponential, F-
distribution, geometric, hypergeometric, lognormal,
normal, Poisson, standard normal, t-distribution, etc.
Dolomite A type of sedimentary rock similar to limestone but
containing more than 50% dolomite (CaMg(CO3)2).
Dolomitization Replacement of preexisting carbonate sediment or
rock by dolomite.
Dolostone Synonym for dolomite rock.
Doubles Two joints of pipe (casing, tubing) fitted together.
Drawworks The hoisting equipment of a drilling rig.
Drill bit The cutting or boring element used for drilling. Syn:
Bit.
Drill collar A heavy, thick-walled tube, usually steel, used
between the drill pipe and the bit in the drillstem to
provide the pendulum effect to the drillstem and
weight to the bit.
Driller’s log Continuous recording of types of cuttings, gas, and
oil occurrences while drilling the well.
APPENDIX C308

Drilling mud Fluid composed of water or oil, clays, chemicals,
and weighting materials used to lubricate the bit
and to move cuttings out of the hole. Syn:
Drilling fluid.
Drilling program Plan for assembling all the personnel, equipment, and
supplies for drilling and completing a well.
Drill pipe Heavy seamless tubing used to rotate the bit and
circulate the drilling mud.
Drill ship Vessel especially designed for offshore drilling
operations.
Drillstem test (DST) Drillstem test employs equipment, which allows a well
to flow for a short period of time, gathering.
information on reservoir fluids and pressure and the
ability of the reservoir to produce fluids.
Drillstring A long continuous string of tubular goods of
tubing, drill collars, bit, and subsurface tool. Syn:
Drillstem.
Drive mechanism The natural force present in a reservoir which causes
the fluid to move toward the wellbore; the action of
one fluid pushing another. Drive mechanism includes
water drive, gas cap expansion, solution gas drive,
gravity drainage, and combination drive.
Dry gas Natural gas consisting principally of methane and
devoid of readily condensable constituents such as
gasoline. Cf: Wet gas.
Dry hole A well that fails to produce oil or gas.
Duricrust General term for a hard crust (carbonate, silica,
ferruginous, or aluminous) on the surface of land or
as a replacive layer in the upper horizons of soils.
E
Economic geology The study and analysis of geologic bodies and
materials (systems) that can be utilized profitably by
man, including fuels, metals, nonmetallic minerals,
and water; the application of geologic knowledge and
theory to the search for and the understanding of
mineral deposits.
Edgewater Water around the edge of a reservoir — water presses
inward.
Effective permeability A measure of the ability of the porous medium to
transmit a particular fluid at the existing saturation,
which is normally less than 100%.
Effective porosity The percentage of interconnected pores in the rock
bulk volume that allow the passage of fluids through
the rock. See: Porosity.
GLOSSARY 309

Effective pressure Grain-to-grain stress, which is equal to the total
overburden pressure minus the pore (fluid) pressure.
Elasticity A property a material may have of recovering its
original shape and size ‘‘immediately’’ after a
deforming force has been removed. Elasticity arises
from the forces between atoms or molecules and
shows that the forces are repulsive when the atoms are
closer than some natural spacing, and attractive when
they are farther away.
Electric log Measures the electric characteristics of a formation;
the tool transmits signals to the surface. Downhole
tools include either normal or lateral device. In both
devices (sondes) a constant electric current is passed
between electrodes A and B; the resultant potential
difference is measured between electrodes M and N.
In the normal device, electrodes A and M are on the
sonde, and electrodes B and N are, theoretically,
located an infinite distance away. In the lateral device,
electrodes A, M, and N are on the sonde, and
electrode B is located an infinite distance away.
Electric submersible lift Downhole electric motor and pump, which are used
for high volumes of fluid production.
Elevators Clamps for lifting rods, tubing, and casing.
Enhanced recovery Techniques that supplement the natural primary
recovery mechanism to increase the flow of the
reservoir fluids to the wellbore.
Entropy, information
theory
A special index in the theory of information which is
employed as a criterion of a priori (before the
communications were received) indefiniteness of the
system. The entropy of a set of events,
H ¼ �P
n
i¼1
pi log pi
where pi is a probability of each event. The entropy
properties: (1) it becomes zero, if one of the states of
the system is fully known and the others are
impossible; (2) at a given number of states, it becomes
maximum, if all the states are equally probable, but
increases with the increasing number of states; (3) it is
additive, i.e., it is possible to add up entropy of
different systems.
Entropy, thermodynamics
or statistical mechanics
A macroscopic, thermodynamic quantity, ultimately
reflecting the degree of microscopic randomness or
disorder of a system. The entropy in a closed system
increases to a maximum at equilibrium as the
APPENDIX C310

consequence of the trend from a less probable to a
more probable state.
Eogenetic All diagenetic processes operative from the time of
sediment formation, including marine and meteoric
processes, until the sediments or rocks ultimately are
buried and away from the influence of surface and
near-surface processes.
Eolian Referring to processes and products of sediment
transport, erosion, or deposition by wind.
Epeiric sea A shallow sea on a broad continental shelf or an
inland sea covering large portions of continent; in the
latter case, commonly considered to be tideless.
Partial syn: Epicontinental sea.
Epibionts In reference to encrusting organisms or that
population of organisms that has encrusted various
substrate.
Epigenesis Late diagenetic processes that have occurred, and
resulting products that have formed, in the deep
burial environments. Cf: Eogenetic.
Erosion The physical and/or chemical processes whereby the
earthy and rocky materials of the Earth’s crust are
loosened, dissolved, or worn away, and
simultaneously removed from one place to another by
running water (including rainfall), waves and
currents, moving ice, or wind.
Error The difference between an observed, calculated, or
measured value of a quantity, and the ideal or true
value of that quantity. The following types of errors
are distinguished: accidental, constant, instrumental,
mean-square, personal, probable, random, residual,
sampling, standard, statistical, systematic, and also
Type I and Type II errors in a hypothesis-testing
procedure.
Ethane A colorless, odorless, gaseous paraffin hydrocarbon,
formula C2H6, which occurs in natural gas.
Eustatic Rise or fall in sea level due to global changes in
the volume of the ocean. Cf: Relative sea level
change.
Euxinic An environment of restricted circulation, with
stagnant or anaerobic conditions.
Evaporite One of the sediments which are deposited from
aqueous solution as a result of extensive or total
evaporation. Examples include anhydrite, rock salt,
and various nitrates and borates.
GLOSSARY 311
Expectation [stat] The average value resulting from an infinite series
of repetition of an experiment or observations of a
random variable. Symbol: E.
Extraclasts Particles derived from outside the basin of carbonate
deposition. Cf: Intraclasts.
F
Fabric The orientation, or lack of orientation, of the
elements (particles, crystals, cement) in a sedimentary
rock.
Facies Sum of all lithologic, biologic, and diagenetic
attributes in a rock from which the origin and
environment of deposition can be inferred. The term
can be restricted to lithologic facies (lithofacies),
depositional facies, biotic facies (biofacies), or
diagenetic facies.
Fan See: Alluvial fan.
Fault A break in subsurface strata.
Fault trap The sealing of a porous and permeable reservoir
formation by the abutment of an impermeable bed
juxtaposed by fault action.
Fenestrae General term for penecontemporaneously formed
shrinkage pores or gas-bubble pores in rocks, both
larger than interparticle pore spaces; includes ‘‘bird
eyes’’ and larger pores such as sheetcracks. Also in
reference to pore types in carbonate rocks. Adj:
Fenestral.
Field An area consisting of a single reservoir or multiple
reservoirs all grouped on or related to, the same
individual structural feature and/or stratigraphic
condition.
Filter cake The layer of concentrated solids from the drilling mud
or cement slurry that forms on the walls of the
borehole opposite the porous and permeable
formation. See also: Mud cake.
Filtrate The liquid portion of drilling mud that is forced into
porous and permeable formations next to the
borehole.
Flare Burning off excess natural gas at a well or other
production site.
Floating offshore drilling
rig
A type of mobile offshore drilling unit that floats and
is not secured to the seafloor (except for anchors).
Floating units include inland barge rigs, drill ships
APPENDIX C312

and ship-shaped barges, and semisubmersibles. See
also: Mobile offshore drilling rig.
Floatstone Reef rock composed of matrix-supported organic
particles, the particles being of allochthonous
(transported) rather than in-place origin.
Flocculation The coagulation of solids in the drilling mud,
produced by special additives or by contaminants.
Flow Movement of fluids through the reservoir.
Flowchart Diagrammatic representation of the operations
involved in an algorithm or a technological
process. Flow lines indicate the sequence of
operations or the flow of data/information. Syn:
Block diargam.
Flow test Preliminary test to confirm flow rate through a testing
tool prior to going downhole. Syn: Formation testing.
Fluidity The measure of rate with which a fluid is continuously
deformed by a shearing stress; ease of flowing. Cf:
Viscosity.
Fluid level Distance between well head and point to which fluid
rises in the well.
Fluid loss The unwanted migration of the liquid part of the
drilling mud or cement slurry into a formation, often
minimized or prevented by the blending of additives
with the mud or cement.
Fluid loss agent Materials added to the drilling mud to reduce water
loss into the formation.
Fluorescent Instantaneous re-emission of light of a greater
wavelength than the light originally absorbed.
Flushed zone The area near the wellbore, which has had all the
original formation water and/or movable
hydrocarbons replaced by the invading mud filtrate.
Cf: Uninvaded zone.
Fluvial Of or pertaining to rivers; growing or living in a
stream or river; produced by the action of a stream or
river.
Formation [strat] A bed or deposit composed throughout of
substantially the same kind of rock. The fundamental
unit in lithostratigraphy. Specific features distinguish
one rock formation from another.
Formation [drill] A general term applied by drillers without
stratigraphic connotation to a sedimentary rock that
can be described by certain drilling or reservoir
characteristics: e.g., hard formation, porous
formation, productive formation, etc.
GLOSSARY 313

Formation resistivity
factor
F ¼ R0=Rw, where R0 is the electrical resistivity of a
formation 100% saturated with formation water and
Rw is the formation water resistivity. F ¼ a� f�m,
where f is the porosity, a is the empirical constant,
and m is the cementation factor (varies from 1.3 for
unconsolidated sands and oolitic limestones to 2.2 for
dense sandstones and dolomites). F embodies the
effects of grain size, shape, distribution, sorting, and
packing.
Formation resistivity
index
F 0 ¼ Rt=R0, where Rt is the true resistivity of a
formation saturated with formation fluids (oil,
gas, water) in different proportions and R0 is the
resistivity of a formation 100% saturated with
formation water. F 0 ¼ aðSwÞ�n, where Sw is the
water saturation, a is the empirical constant, and n
is the saturation exponent (varies from 1.6 for clayey
sands to 2 for clean, non-clayey sands and
limestones).
Formation testing The gathering of pressure data and fluid samples
from a formation to determine its production
potential before choosing a completion method. Syn:
Flow test.
Formation Volume Factor
(FVF or B)
The volume of oil (and the solution gas dissolved in it)
at reservoir pressure, p, and temperature, T, per unit
volume of stock-tank oil (at surface, T ¼ 601F and
p ¼ 1 atm).
Fossil Any remains, trace, or imprints of a plant or animal
that has been preserved, by natural processes, in the
Earth’s crust since some past geologic time; any
evidence of past life.
Fraction Percentage or fraction of a separate component of the
crude oil having a certain boiling point range.
Fracture acidizing Acid solution is injected into the formation at a high
enough pressure to fracture the formation. The acid
etches the new fracture.
Fracturing Artificial opening up (fracturing) of a formation, by
pumping fluids under high pressure, to increase
permeability and flow of oil to the well. See also:
Hydraulic fracturing, Fracture acidizing.
Framebuilder Organisms capable of creating massive, generally
wave-resistant buildups.
Framestone Reef rock that has formed as a result of the
accumulation of large, in-place fossils that formed the
actual framework of the deposits.
APPENDIX C314
Frasch process Process to remove sulfur from a sulfur-bearing crude
oil, by using cupric acid developed by Herman
Frasch.
Free gas Gas present in a vapor state.Frequency distribution A systematic arrangement of statistical data (such as
graphic or tabular display of the number of
observations of a variable) that exhibits the division
of the values of the variable into mutually exclusive
(but closely related), usually ranked, and exhaustive
discrete categories or classes. It indicates the
frequencies or relative frequencies that correspond to
each of the categories or classes.
Funnel viscosity Viscosity as measured by the Marsh funnel, based on
the number of seconds it takes for 1,000 cm3 of
drilling fluid to flow through the funnel.
Fuzzy set theory A form of informal set theory in which belonging
is replaced by an index of membership between
0 and 1.
G
Gamma-ray log Measurement of the natural formation radioactivity
to determine lithology.
Gas cap Free natural gas above the crude oil sometimes
present in the reservoir.
Gas cap expansion Expansion of the gas cap upon reduction of reservoir
pressure; it forces reservoir fluids toward the wellbore.
Gas drive The use of the energy that arises from the expansion
of compressed gas in a reservoir to move crude oil to a
wellbore.
Gas drilling Use of compressed natural gas instead of liquid as the
circulation medium in rotary drilling. See also: Air
drilling.
Gas lift Injection of gas into the well to lift fluids out of the
wellbore.
Gas-oil ratio (GOR) A measure of the volume of gas produced with oil,
expressed in ft3/barrel or m3/ton.
Gel strength A measure of the ability of colloidal dispersion to
develop and retain a gel form, based on it resistance
to shear.
Geochemistry (a) The study of the distribution and amounts of the
chemical elements in minerals, ores, rocks, soils,
water, and the atmosphere. (b) The study of the
circulation of the elements in nature, on the basis of
the properties of their atoms and ions. (c) The study
GLOSSARY 315

of the distribution and abundance of isotopes,
including problems of nuclear frequency and stability
in the universe.
Geologic system ‘‘A well-organized natural assembly of interconnected
and interacting elements of lithosphere having
common development history and comprising a single
natural unit with properties that are not inherent in
its individual elements.’’ (Buryakovsky, 1992,
pp. 273–295).
Geomathematics Mathematics as applied to geology; ‘‘the closely
interrelated system involving mathematical and
applied statistics, experimental design, and associated
computer techniques as applied to geological
sciences’’ (Osborne, 1969, in: Vistelius, 1980). See
also: Mathematical geology.
Geophone Microphone placed near the Earth’s surface to detect
seismic waves.
Gilsonite A black, shiny asphaltite with conchoidal fracture
and black streak, which is soluble in turpentine. Syn:
Uintahite.
Grainstone Grain-supported carbonate rock textural type,
generally mud-free. Syn: Sparite.
Gravity drainage Gravity force results in movement of oil downward as
the gas migrates upward. This force is strong in
steeply dipping reservoirs.
Gum Naturally occurring or synthetic hydrophylic colloids
used to control various properties of drilling fluids.
Gypsum A naturally occurring crystalline form of calcium
sulfate (CaSO4 � 2H2O).
H
Hardground General term for a surficial or near-surficial layer of
sediment that is cemented syndepositionally, close to
or at the sediment–water interface.
Hard water Water containing more than 60mg/l (60 ppm) of
hardness-forming constituents (calcium and
magnesium) expressed as CaCO3 equivalent. Cf:
Alkaline (soft) water.
Heater-treater A vessel that heats an emulsion and removes water
and gas from the oil to raise it to a quality acceptable
for a pipeline or other means of transport. Syn: Oil
treater.
Hemipelagic Deep-sea sediments composed of the remains of
pelagic organisms and small amount of terrigenous
material.
APPENDIX C316

Histogram A graphical representation of class frequencies (or
relative frequencies) as rectangles against class
interval, the value of frequency being proportional to
the area of the corresponding rectangle.
Hydraulic fracturing Fracturing the formation by pumping in a specifically
blended liquid under pressure high enough to cause
the formation to crack open.
Hydraulic lift Use of hydraulic pressure to activate the downhole
pump.
Hydrocarbon Any organic compound, gaseous, liquid, or solid,
consisting solely of carbon and hydrogen. They are
divided into four specific groups: paraffin, cyclo-
paraffin or naphthene, olefin, and aromatic. Crude oil
is essentially a complex mixture of hydrocarbons.
Hydrocracking Method of cracking or breaking up of long-chain
hydrocarbons.
Hydrogen sulfide A toxic, corrosive gas, H2S, with a characteristic odor
of rotten eggs. It is emitted in natural decomposition
of organic matter and is present in many crude oils
and natural gases.
Hydrophilic Having strong affinity for water; said of colloids that
swell in water and are not easily coagulated.
Hydrophobic Lacking strong affinity for water; said of colloids
whose particles are not highly hydrated and coagulate
easily.
Hydrophone Waterproof microphone used to detect seismic echoes
at sea.
Hydrostatic head Pressure (p) exerted at the bottom of a column of
liquid, p ¼ gD, where g ¼ specific weight of liquid
(e.g., in lb/ft3 or kg/m3), and D ¼ depth (e.g., in ft or
m). Syn: Pressure head; Hydrostatic pressure.
Hydrothermal Alteration of rocks or minerals by the action of
heated waters.
Hypersaline Seawater salinity elevated beyond values of normal
salinity (e.g., greater than 34–38%); also used in
reference to environments of extensively high salinity.
Hypothesis testing The theory and methods used in statistics to test one
hypothesis (null hypothesis, H0) about the probability
distributions of a sample population against another
(alternative or research hypothesis, Ha).
I
Igneous rock A rock mass formed by the solidification of material
poured (when molten) into the Earth’s crust or onto
its surface.
GLOSSARY 317

Illite Very common and widely occurring group of clay
minerals; crystals form tiny flakes; formed by the
weathering decomposition or hydrothermal alteration
of muscovite or feldspar. Syn: Hydrous mica,
Hydromica.
Induction log Measurement of the formation resistivity response to
the induced current.
Inflow performance
relationship (IPR)
Plot of the flowing bottom-hole pressure versus the
flow rate, greatly influenced by the reservoir drive
mechanism.
Injection Placing fluids into the reservoir under pressure. See:
Carbon dioxide injection, Caustic injection.
In-situ combustion Enhanced recovery technique by starting a fire at the
injector to generate heat and gas to drive oil toward
the producing wells.
Interfacial tension The surface tension occurring at the interface between
two liquids that do not mix, such as oil and water.
Internal sediment Fine-grained sediment, including insoluble residue
that has collected in pores in sediments or rocks; such
sediment is generated syn-depositionally as a result of
organic boring and micritization, or partial
dissolution of soluble rocks.
Internal yield Minimum internal pressure to burst casing (pipe).
Interstitial Interparticle (either pore space, cement, or fluids).
Intrabasinal Said of sediments or rocks formed within or derived
from the basin of deposition. Cf: Terrigenous.
Intracratonic Geologic features found on cratons, e.g.,
intracratonic basins, intracratonic seas.
Intrastratal Formed or occurring within a given layer or layers.
Syn: Intra-formational.
Irreducible fluid saturation Equilibrium saturation of the wetting phase, which
cannot be lowered by flowing indefinitely a non-
wetting phase through a porous medium, providing
evaporation does not take place.
Isopachous Cement which completely lines the pores in a rock.
Syn: Circum-granular.
Isotropic medium A medium whose physical properties are the same in
all directions. Cf: Anisotropic medium.
J
Jackup drilling rig A mobile bottom-supported offshore drilling
structure with columnar or open-truss legs that
support the deck and hull.
Joint Single section of a pipe.
APPENDIX C318

K
Kaolinite A common, white to grayish, or yellowish
clay mineral of a kaolin group; occurs as a
secondary mineral produced by alteration of
aluminosilicates.
Karst Topography (surficial and subsurface) formed as a
result of the dissolution of soluble rocks, such as
limestones, dolomites, and evaporites, and
characterized by closed depressions, caves, and
underground drainage.
Karst towers Residual hills in karsted terranes. Syn: Buried hills.
Kelly A hollow 40-ft-long pipe, having four or more sides
and threaded connections at each end to permit it to
be attached to the swivel and to the drillpipe. It
transmits torque from the rotary drilling table to the
drillstring.
Kelly bushing A special device that, when fitted into the master
bushing, transmits torque to the kelly and
simultaneously permits vertical movement of the kelly
to make hole.
Kerogen The solid, insoluble organic matter (fossilized), which
can be converted by distillation into petroleum
products.
Kick An entry of water, gas, oil, or other formation fluid
into the wellbore during drilling. If prompt action is
not taken to control the kick or kill the well, a
blowout may occur.
Kill a well To overcome pressure in a well by use of mud
or water so that surface connections may be
removed.
L
LACT Lease Automated Custody Transfer: fully automated
tank battery that records and ships oil and gas into
gathering pipeline.
Lacustrine Pertaining to lakes or deposits of lakes.
Latent heat of
vaporization
BTUs required to vaporize 1 lb of a liquid at its
atmospheric boiling point.
Leaching Pertaining to dissolution of soluble minerals or rocks.
Partial syn: Dissolution.
Least square method
(LSM)
A statistical method for fitting a line, curve, or higher-
degree surface to a set of data such that the sum of the
squares of the distances of data points to the fitted
line, etc. is minimized.
GLOSSARY 319

Level of significance The probability of committing an error while rejecting
the null hypothesis when it is really true or a threshold
value of probability at or below which the results of
statistical investigation (e.g., hypothesis testing) are
held to contradict a particular hypothesis. This
probability is expressed as decimal or percentage;
level of significance supplements the level of
confidence to 1 or 100% (often this probability is set
at 0.05 or 5%).
Lift mechanisms Various methods of lifting oil from the wellbore to the
surface. It includes: artificial lift, cable lift, electric
submersible lift, gas lift, hydraulic lift, rod lift, and
surface lift.
Lighter ends Volatile components (or fractions) of petroleum.
Lignin The substance that gives tensile strength to plant
structures such as tree trunks. It is a polymer of
propylbenzene nuclei joint by oxygen and carbon
linkages plus –OH and –OCH3 side chains.
Lignite A brownish-black coal that is intermediate in
coalification between peat and sub-bituminous coal.
Cf: Brown coal.
Lime mud A general term for carbonate sediment composed of
particles up to 62 microns in size.
Lipids A broad term that includes all oil- and water-soluble
substances such as fats, waxes, fatty acids, steroids,
pigments, and terpenoids.
Lithification Process of converting unconsolidated sediments to
rocks by the addition of mineral cement. Syn:
Consolidation. Partial syn: Cementation.
Lithoclast Mechanically or biogenically formed and deposited
fragment (larger than 2 mm) of a weakly lithified
sediment or rock, formed within the basin of
deposition. Cf: Extraclast.
Lithofacies See: Facies.
Lithographic texture Compact, dense, homogenous and exceedingly
fine-grained rock with conchoidal or
subconchoidal fracture. Partial syn: Micrite,
Carbonate mudstone.
Lithology Descriptive, physical characteristics of rocks such
as color, structure, mineralogic composition, grain
size, etc.
Live oil Oil that contains gas.
Log Continuous record of certain data obtained from a
logging tool lowered into the wellbore.
APPENDIX C320

Logging Recording of data (various physical, chemical, and
mechanical properties of reservoir) obtained by
lowering of various types of measuring tools into a
wellbore. Well-logging includes: acoustic (sonic) log,
caliper log, conduction log, density log, driller’s log,
electric log, gamma-ray log, induction log, nuclear
log, neutron log, pressure log, production log,
resistivity log, spontaneous potential log, temperature
log, and some others.
Lost circulation additives Materials (fiber, flake, or granular) added to the
drilling mud in varying amounts to control or prevent
lost circulation.
M
Mathematical expectation The average value resulting from an infinite series of
repetition of an experiment or observations of a
random variable. Syn: Expectation. Symbol: E.
Mathematical geology Mathematics as applied to geology; ‘‘the name given
to the discipline devoted to the investigation of
probability distributions of values of random
variables with the object of obtaining information
concerning geological processes’’ (Vistelius, 1980).
These investigations are based on the methods of
mathematical probability, statistical theory, and
special computational mathematics developed in
work on the solutions of various particular problems.
Syn: Geomathematics.
Mathematical modeling The representation by mathematical expressions of a
physical system to understand its structure (static
mathematical models) and/or behavior (dynamic
mathematical models).
Matrix The continuous material (sediment, cement)
composing rocks; the continuous material enclosing
interstices in rocks.
Matrix acidizing Enlargement of preexisting pores without
fracturing. Acid can also enlarge (etch) the preexisting
fractures.
Maturation [petrol] Term pertaining to the thermocatalytic state of
hydrocarbons, i.e., the evolution of hydrocarbons
through the increasing pressure and temperature
associated with burial, or to the hydrocarbon source
material.
Maturation [sed] Term pertaining to the mineralogic composition of
siliciclastic or carbonate rocks as they approach a
GLOSSARY 321

pure quartz or calcite end-member composition,
respectively.
Maturity In reference to maturation above.
Mean square error (MSE) The expression of the square of the difference between
an estimate of a parameter and its true value, taken
with respect to the sampling distribution of the
estimate.
Meniscus [lith] The hour-glass shape of interparticle cements
precipitated from fluids held by attraction at grain-to-
grain contacts; usually indicative of cement
precipitation in the vadose environment.
Meniscus [petr] The curved upper surface of a liquid column, concave
when the containing walls are wet by the liquid
(negative meniscus) and convex when they are not
(positive meniscus).
Mesh A measure of fineness of a screen or sieve; e.g., a 200-
mesh sieve has 200 openings per linear inch through
which a particle of 74 mm can pass.
Mesogenetic Diagenetic changes in rocks occurring in the deep
burial environment. Syn: Catagenetic, Epigenetic.
Metamorphic rock A rock derived from preexisting rocks by
mineralogical, chemical, and structural alterations
caused by processes within the Earth’s crust.
Metastable Said of minerals that are unstable at certain
temperatures and pressures, or in fluids of certain
composition. Partial syn: Unstable.
Meteoric Water derived ultimately from rain; water of recent
atmospheric origin.
Methane A colorless odorless inflammable gas; the simplest
paraffin hydrocarbon, formula CH4. It is the
principal constituent of natural gas and is also found
associated with crude oil.
Mica A silicate mineral characterized by sheet cleavage, i.e.,
it separates in thin sheets. There are two major types
of micas: biotite, a ferromagnesian black mica, and
muscovite, a potassic white mica.
Micrite Particulate, fine-grained matrix of carbonate rocks,
by various definitions, the particles being less than
20 mm or 4mm in size; a carbonate rock textural type
composed dominantly of mud. Syn: Carbonate
mudstone.
Micritization Organic or inorganic process of converting
preexisting carbonate cements or grains to micrite.
Microbial Pertaining to the presence, activities, or products of
microbes such as algae, bacteria, fungi, and yeasts.
APPENDIX C322

Microcrystalline See cryptocrystalline; said of a rock with such a
texture.
Microfacies Term for the features, composition, and appearance
of rocks, or of specific diagenetic features, as
identified in thin-sections.
Microspar Fabric of carbonate crystals resulting from
recrystallization of micrite-size crystals or grains that
range in size from 5 to �30 mm.
Migration The movement of liquid and gaseous hydrocarbons
from their source or generating beds, through
permeable formations into reservoir rocks.
Miscible drive Fluid displacement in which the displacing fluid and
the displaced fluid become miscible in all proportions.
Miscible mixture Complete mixture of fluids: single phase.
Mobile offshore drilling
unit (MODU)
A drilling rig that is used to drill offshore exploration
and development wells and that float upon the
surface of the water when being moved from one
drill site to another. Two basic types of MODUs
are used: bottom-supported drilling rig and floating
drilling rig.
Mobility The ability of a fluid to move through a reservoir.
Model An accurate simulation, by means of description,
statistical data, mathematical equation, or analogy, of
an item or process that cannot be observed directly or
that is difficult to observe directly.
Mole The fundamental unit of mass of a substance
expressed as the number of grams or pounds
indicated by its molecular weight.
Molecular weight The sum of the atomic weights in a molecule. For
example, the molecular weight of water (H2O) is 18
because the atomic weight of hydrogen is 1 and that
of oxygen is 16.
Monomineralic Composed of one mineral species.
Monte Carlo method A procedure in statistics employed to obtain
numerical solution to mathematical or physical
problems by means of random sampling.
Montmorillonite An expanding-lattice clay mineral, white to gray with
tints of blue, pink, and green; usually occurs in
massive, microcrystalline aggregates of very fine,
scale-like crystals. It is characterized by a three-layer
crystal lattice (one sheet of aluminum and hydroxyl
between two sheets of silicon and oxygen); subject to
swelling on wetting (and shrinking on drying) due to
introduction of considerable interlayer water. Syn:
Smectite.
GLOSSARY 323

Mound Organic or inorganic sediment buildup with low
depositional relief; or organic buildup composed of
non-framework building (but commonly gregarious),
in-place organisms or allochthonous organisms.
Mud [sed] Fine-grained particles, by various definitions less than
20 microns or 4 microns in size. Syn: Particulate
micrite.
Mud [drill] See: Drilling mud.
Mudbank Accumulation of mud [sed].
Mud cake A clay layer formed where the drilling mud lost water
by filtration into a porous and permeable formation
during rotary drilling and adhered to the walls of the
borehole. See also: Filter cake.
Mud logging A continuous analysis of the drilling mud and
cuttings to determine the presence or absence of oil,
gas, or water in the formations penetrated by
borehole, and to ascertain the depths of any oil- and
gas-bearing formations using geochemical analysis,
chromatograph interpretation, and sample
description.
Mud program Plan of supplying and using drilling fluids and their
additives during the drilling operations.
Mudstone (a) Argillaceous or clay-bearing sedimentary rock
which is non-plastic and has a massive or non-foliated
structure. See: Claystone.
(b) Carbonate rock textural type composed
dominantly of mud (micrite) with less than 10%
grains. See: Lime mud.
Multiple completion Several producing zones completed for production
through one well.
N
Nannofossil General term for small fossils, the resolution of which
is near the limits of the light microscope.
Naphtha Petroleum distillate used as a cleaning fluid, for
example.
Naphthene See: Cycloparaffin.
Natural gas A naturally occurring mixture of hydrocarbon and
non-hydrocarbon gases found in porous media at
depth. It is often associated with crude oil. Composed
mainly (E70 to 90%) of methane gas.
Neomorphism General petrologic term that encompasses both
recrystallization (increase in crystal size in case where
APPENDIX C324

mineralogy is constant) and inversion (crystal fabric
changes attending mineralogic conversions).
Neutron log Measurement of porosity; also valuable information
concerning rock composition and fluid content.
The logging tool bombards the formation with
neutrons.
Newtonian fluid A fluid in which the viscosity remains constant for all
rates of shear if constant conditions of temperature
and pressure are maintained. Most drilling fluids
behave as non-Newtonian fluids. Syn: Newtonian
flow.
Nuclear log Measurement of porosity, type of fluids and/or gas,
lithology, etc., by recording the nuclear properties of
the formation.
O
Occlusion In reference to porosity reduction as a typical
consequences of cementation or compaction.
Offlap Progressive offshore migration of the updip
terminations of sedimentary beds within a
comformable sequence of rocks. Cf: Onlap.
Oil See: Petroleum.
Oil and gas separator An item of production equipment used to separate
liquid components of the well stream from gaseous
elements. Separation is accomplished principally by
gravity, the heavier liquids falling to the bottom and
the gas rising to the top.
Oil-base mud A drilling or workover fluid in which oil is the
continuous phase and which contains about 2–5% of
water.
Oilfield The surface area overlaying an oil reservoir(s). The
term usually includes not only the surface area, but
also the reservoir, the wells, and the production
equipment.
Oil sample Small volume of oil drawn from a tank for testing;
includes bottom sample, composite sample, running
sample, spot sample, water, and sediment sample.
Oil sand Any porous stratum bearing oil.
Oil treater Equipment used to separate natural gas, BS&W, and
water from the oil by the use of heat. Syn: Heater-
treater.
Olefins Group of unsaturated hydrocarbons (one double
bond), such as ethylene (C2nH4n).
GLOSSARY 325
Oncolite An accretionary carbonate particle composed of
a particulate nucleus surrounded by a cortex of
algae and entrapped sediment and/or precipitated
cement.
Onlap Progressive onshore migration of the updip
terminations of sedimentary beds within a
comformable sequence of rocks. Cf: Offlap.
Ooid An accretionary, sand-size carbonate particle
composed of a particulate nucleus surrounded by a
laminated cortex of microcrystalline calcium
carbonate; oolite is the term commonly used for rocks
composed of ooids. Partial syn: Oolite, Oolith.
Ooze Soft, soupy mud generally composed of at least
30% skeletal remains of pelagic organisms
(calcareous or siliceous), the remainder being clay
minerals.
Overbalance The extent to which the hydrostatic pressure of the
mud column exceeds formation pressure.
Overburden Section of rocks overlying a given stratum or strata.
Overburden pressure Total pressure, pt, exerted on a reservoir by the weight
of the overlying rocks and fluids. It is balanced by the
pore pressure, pp, plus the grain-to-grain stress, pg (or
effective pressure, pe), pt ¼ pp+pe.
Overpressuring/
overpressured reservoirs
Porous rocks characterized by greater than normal
hydrostatic pressure resulting, for example, from
undercompaction due to rapid sedimentation.
Oxidation Process in which a given substance loses electrons or a
share of its electrons.
P
Packer Mechanical device set in the casing (attached to the
tubing) to prevent communication between the tubing
and annulus.
Packing Three-dimensional arrangement of particles in a rock.
Packstone Muddy, but grain-supported carbonate rock textural
type.
Paleoenvironment Ancient depositional (or diagenetic) environment.
Paleogeomorphic Term used in reference generally to a buried
landscape; in reference to hydrocarbon reservoir traps
in or along certain buried landscape features.
Paleokarst Buried or relict karst.
Paleosol Fossilized soil.
Paraffin Denotes a solid, waxy material.
Paraffins Group of saturated aliphatic hydrocarbons with
general formula CnH2n+2.
APPENDIX C326

Pay zone The zone of production where commercially
recoverable oil and/or gas are present, i.e., productive
or producing formation. Syn: Pay sand.
Pelagic Pertaining to open ocean water as an environment;
deep-sea sediments without terrigenous material
(either inorganic red clays or organic oozes).
Pellet A particle composed of fecal material. Partial syn:
Pelletoid, Peloid.
Peloid A cryptocrystalline carbonate particle of
unrecognizable origin, most likely a completely
micritized grain, less likely a fecal pellet. Partial syn:
Pellet.
Penecontemporaneous Contemporaneous with deposition. Syn:
Syndepositional.
Perforating Making holes in the casing (or liner), cement and
formation so that formation fluids can enter the
wellbore. There are three basic types of perforation:
mechanical, gun, and jet.
Periplatform Said of sediments or environments in deeper water
immediately seaward of carbonate platforms, atolls,
or banks.
Peritidal Inclusive term for supratidal and intertidal
environments, or in some definitions, supratidal,
intertidal, and upper subtidal environments.
Permeability The ability of a porous medium to transmit fluids.
Permeability is equal to one Darcy if 1 cm3 of fluid
flows through 1 cm2 of cross-section of rock per
second under a pressure gradient of 1 atm/cm, the
fluid viscosity being 1 cP. See also: Absolute
permeability, Effective permeability, and Relative
permeability.
Petroleum A naturally occurring complex of liquid
hydrocarbons that may contain varying amounts of
impurities (sulfur, nitrogen), which after distillation
yields a range of combustible fuels, petrochemicals,
and lubricants. Syn: Crude oil.
Petrophysics The physical properties of reservoir rocks and the
methods of their study.
pH The negative logarithm of the hydrogen ion
concentration in a solution, pH ¼ � log101/[H+].
The pH is measured on a scale of 0 to 14; a neutral
mediums (such as pure water) has pH of 7; pH47
indicate relative alkalinity; pHo7 indicates relative
acidity. Most pH values in natural systems lie in the
range of 4–9.
GLOSSARY 327

Phreatic Zone below the water table in an unconfined
groundwater lens, or in an aquifer, where all the pores
are filled with water.
Pinch-out trap A petroleum trap formed by the thinning out of a
porous and permeable rock (e.g., sandstone) between
two layers of impermeable rock (e.g., shale). Syn:
Wedge-out trap.
Pinnacle reef An isolated, long (thick), spire or column-shaped reef.
Pisolite An accretionary carbonate particle, usually larger
than sand-size, composed of a particulate nucleus
surrounded by a cortex, generally laminated, of
precipitated calcium carbonate; term commonly used
for rocks containing pisoids or pisoliths. Syn: Pisolith,
Pisoid.
Planktonic In reference to pelagic organisms that float.
Plastic fluid A complex, non-Newtonian fluid in which the shear
force is not proportional to the shear rate. Most
drilling muds are plastic fluids. Syn: Plastic flow.
Plasticity The ability of a substance to be deformed without
rupturing.
Platform [drill] Working surface or deck of a drilling rig, e.g., an
immobile offshore structure from which development
wells are drilled and produced.
Platform [sed] A linear region of variable width of shallow-water
calcium carbonate deposition.
Play The extent of a petroleum-bearing formation, e.g., a
productive structure.
Playa A desiccated, vegetation-free, flat-floored area
commonly found in deserts, which represents a
former shallow desert-lake basin. Syn: Playa lake.
Plug and abandon (P&A) To place cement plugs into a borehole and abandon
it.
Point counter analysis A statistical method involving the estimation of the
frequency of occurrence of an object in a sample
(thin-section), determined by counting the number of
times that object occurs at specified intervals
throughout the sample. The analysis is commonly
made with an automatic point counter attached to an
optical microscope.
Polycyclic Pertaining to more than one cycle of formation.
Polygenetic Pertaining to an origin involving more than one
process of formation, or superimposed processes of
formation.
Polymer Compound having many repeated linked units. In
oilfield operations, various types of polymers are used
APPENDIX C328

to thicken drilling mud, fracturing fluids, acid, water,
and other liquids.
Polymineralic Composed of more than one mineral.
Polymorph A mineral species with more than one crystal form,
e.g., CaCO3, calcite (hexagonal) and aragonite
(orthorhombic).
Population [stat] Any theoretical group of items or samples all of which
are capable of being measured statistically in one or
more respects; all possible values of a variable, either
finite or infinite, or continuous or discrete.
Pore A hole, opening, or passageway in a rock. Syn:
Interstice.
Porosity Absolute or total porosity is the total of all
void spaces present within a rock, but not all these
spaces will be interconnected and thus able to
contain and transmit fluids. The effective porosity
is thus defined as the proportion of the rock,
which consists of interconnected pores. Porosity is
expressed as a percentage of the bulk volume of
the rock.
Porosity terms (a) Fabric-selective porosity: pores that occur in
regard to specific elements in the rock. Cf: Non-
fabric-selective.
(b) Framework porosity: porosity in the matrix of
rocks, exclusive of fractures. Syn: Matrix porosity.
(c) Porosity-specific: porosity occurrence within a
given rock type or paleodepositional facies.
(d) Pore system: the total petrophysical attributes of a
porous unit.
(e) Primary porosity: porosity inherited from the
depositional environment. Cf: Secondary porosity.
(f) Secondary porosity: developed after deposition as
a result of dissolution, for example. Cf: Primary
porosity.
Postdepositional Physical or chemical changes in sediments or rocks
after final deposition and burial.
Pour point The temperature at which a liquid hydrocarbon
ceases to flow, or at which it congeals.
Precision (a) The degree of agreement or uniformity of repeated
measurements of a quantity. Precision relates to the
quality of the operation by which a result is obtained,
as distinguished from accuracy. (b) The deviation of a
set of estimates or observations from their mean.
Pressure gradient The difference in pressure at two given points, divided
by the distance between these two points.
GLOSSARY 329

Pressure head The height (h) of a column of liquid supported by
pressure at a point in a liquid: h ¼ p/g, where h is the
head of liquid (e.g., in ft), p is the pressure (e.g., in lb/
ft2), and g is the specific weight of liquid (e.g., in lb/
ft3). Syn: Hydrostatic head.
Pressure log Measurement of the formation pressure at various
depths.
Pressure solution Process in which carbonate dissolution occurs at
burial as a result of increased pressure due to
overburden stress; usually results in the formation of
stylolites and interpenetrative grain contacts. Syn:
Pressure dissolution.
Primary cementing The cementing operation that takes place immediately
after the casing has been run into the hole.
Primary recovery The production obtained using the initial reservoir
energy.
Probability [stat] A statistical measure of the likelihood of occurrence
of an event.
Production log Measurement of production status of a completed
well. Yields information on the nature and movement
of fluids within the well.
Production test A test of the well’s producing potential usually done
during the initial completion phase.
Productivity index It is equal to PI ¼ q/( pr�pwf), where q is the flow rate
(e.g., bbl/d); pr is the average reservoir pressure (e.g.,
psia); and pwf is the flowing bottom-hole pressure at
the wellbore (psia).
Progradation The seaward accretion and migration of sedimentary
bodies and corresponding depositional environments.
Cf: Regression [sed].
Protodolomite Term used in reference to dolomite that is poorly
ordered and compositionally impure (i.e., calcic).
Provenance The source or place of origin of detrital sediments.
Pseudospar Fabric of carbonate crystals, resulting from
recrystallization of micrite-size crystals or grains, that
are larger than 30 mm in size.
Pumping Lifting fluids from the production well to the surface
by an artificial lift method.
Pumping off Pumping the reservoir fluids out of the well faster
than they can enter the wellbore.
PVT analysis An examination of reservoir fluid in a laboratory
under various pressures, volumes, and temperatures
to determine the characteristics and behavior of the
fluid.
APPENDIX C330

Q
Quantile [stat] The argument of the cumulative distribution function
corresponding to a specified probability; (of a
sample) the value below which occur a specified
proportion of the observations in the ordered set
of observations.
Quartile [stat] The argument of the cumulative distribution function
corresponding to a probability of either 14(first or
lower quartile), 12(second or middle quartile or
median) or 34(third or upper quartile). In a sample, the
value below which a quarter, one-half or three-
quarters of the observations occurs in the ordered set
of observations.
R
Radial flow Two-dimensional flow from all points around a 3601
circle within a formation to a centered well.
Radioactivity logging The recording of the natural or induced radioactive
characteristics of subsurface formations. A
radioactivity log normally consists of two recorded
curves: a gamma-ray curve and a neutron curve.
Ramp A carbonate depositional surface that dips very gently
(o11) in a seaward direction, passing imperceptibly
from shallow to deep water.
Rate of Penetration (ROP) Speed with which the drilling bit cuts through the
formation.
Rate of shear Rate (in rpm) at which an action resulting from
applied forces causes or tends to cause two adjacent
parts of a body to slide relative to each other in a
direction parallel to their plane of contact.
Recovery The petroleum produced from the reservoir in % (or
fraction) of the total oil in-place reserves; it is
subdivided into primary, secondary, and tertiary
recovery.
Recrystallization Term that refers to an increase in the size of existing
crystals without a change in mineralogy.
Redox potential (Eh) A scale of values, measured as electric potential in
volts, indicating the ability of a substance or solution
to cause reduction or oxidation reactions under non-
standard conditions. The higher the value of Eh, the
more oxidizing the conditions.
Reduced pressure The absolute pressure at which the gas exists divided
by the absolute critical pressure: pr ¼ p/pcr.
GLOSSARY 331

Reduced temperature The absolute temperature divided by the absolute
critical temperature: Tr ¼ T/Tcr.
Reduction Process in which a given substance gains electrons.
Reef An organic buildup made of the remains of sedentary
calcareous organisms, especially corals.
Regression [sed] Retreat of the sea from land areas; also, any change
that converts offshore, deep-water condition to the
near-shore, shallow-water conditions. The landward
migration of sedimentary bodies and corresponding
depositional environments. Cf: Transgression.
Regression [stat] A model of the relationship between the expected
value of a random variable and the values of one or
more possibly related variables.
Relative frequency In a particular class interval, a fraction (as decimal or
percentage) of the total number of occurrences or
events in the sample.
Relative permeability Ratio of the effective permeability at a given
saturation of that fluid to the absolute (single-phase
fluid) permeability at 100% saturation.
Repeatability A precision with which a measured value can be
repeated in an experiment.
Replacement When one mineral replaces the another mineral, e.g.,
dolomitization, silicification.
Representative sample A sample that, well enough, represents the
proportions of the whole population.
Resendimentation Refers to sediments, originally formed and deposited
in one environment and subsequently transported to a
completely different environment.
Reservoir A subsurface accumulation of crude oil or natural gas
under adequate trap conditions.
Reservoir pressure The average pressure within the reservoir at any given
time.
Reservoir rock A porous and permeable rock holding an
accumulation of crude oil and/or natural gas.
Sandstones and carbonates (limestones and
dolomites) are the usually encountered reservoir
rocks.
Resin (a) Any of various hard, brittle, transparent or
translucent substances formed esp. in plant secretion
and obtained as exudates of recent or fossil origin by
the condensation of fluids or the loss of volatile oil.
Resins are yellowish to brown in color, with a
characteristic luster; they are fusible and flammable,
are soluble in ether and other organic solvents but not
in water.
APPENDIX C332

(b) Semisolid or solid complex, amorphous mixture of
organic compounds having no definite melting point
or tendency to crystallize.
Resistivity log Defines the reservoir contents. Electric current flows
in the formation between two electrodes on a logging
tool and measures resistivity between those two
points.
Reynolds number The dimensionless number defined as Re ¼ rvd/Z
where r is the density of a fluid with viscosity Z
traveling at velocity v in a pipe of diameter d.
Above Re ¼ 2,000, flow is turbulent. Below, it is
laminar.
Rheology The study of fluid flow, esp. of fluid elasticity,
viscosity, and plasticity, which is of special
importance to mud engineers and reservoir engineers.
Rhizoconcretion, rhizolith An accumulation of calcium carbonate around plant
roots.
Rhodolite An accretionary carbonate particle, larger than sand-
size, with or without a nucleus surrounded by a
laminated to massive cortex constructed by red
(rhodophyte) algae. Syn: Rhodolith, Rhodoid.
Rimmed shelf/platform A shallow water platform of deposition, the seaward
edge of which is defined by a submarine topographic
high constructed by carbonate sands or reef buildups.
Rod Sucker rod is attached to the downhole pump, usually
having a length of 16–1/2 ft.
Rod lift Use of solid metal rods to activate the downhole
pump.
Root mean square (RMS) Square root of sum of squares of individual
observations divided by total number of observations.
Rotary drilling A drilling method that imparts a turning or rotary
motion to the drill string to drill the hole.
Rotary table The principal component of rotary machine used to
turn the drill string and support the drilling assembly.
Rudstone Reef rock composed of grain-supported texture of
allochtonous (transported) rather than in-place
organic particles.
Running sample Oil sample taken by lowering an unstoppered beaker
from the top outlet level to the bottom outlet and
returning it at a uniform rate of speed so that it is
about three quarters full when returned.
S
Salt dome A dome that is caused by an intrusion or piercing of
rock salt into overlying deposits, which are usually
GLOSSARY 333

arched so that they dip in all directions away from the
center of the dome.
Sample [geol] A representative unit of a rock, cuttings, fluid, ore,
fossil population, or other entity for analysis or
display.
Sample [stat] A set of items selected from the population; if
properly selected may be used to estimate parameters
of population.
Sampling [stat] The process of selecting items from the population.
Sapropel Material composed of plant remains, most commonly
algae, that is or has macerated and putrefied in an
anaerobic environment: source material for
petroleum and natural gas.
Saturation Percentage of a particular fluid in a porous medium,
expressed as the percent of the pore volume.
Scale inhibitor Chemicals introduced into the producing well to
prevent the buildup of scale, paraffin, etc. These
can block off the flow of fluids and gas into the
wellbore.
Schizohaline Said of a water body or environment of fluctuating
salinity.
Screen liner Perforated pipe or wire mesh screen placed at the
bottom of the well to prevent larger formation
particles from entering the wellbore.
Seal An impermeable bed that acts as a barrier to the
vertical or lateral migration of hydrocarbons.
Sea-marginal Environments close to the sea, such as lagoons, tidal
flats, beaches, or deposits in these environments. Syn:
Marine-transitional.
Secondary cementing Any cementing operation after the primary cementing
operation including a plug-back job.
Secondary recovery The production obtained by introducing a second
source of energy, i.e., waterflooding.
Sediment [geol] Solid fragmental material, or a mass of such material,
either inorganic or organic, that originates from
weathering of rocks and is suspended in, transported
by, and deposited by air, water, or ice. Sediment can
also form as a result of coagulation of clays, chemical
precipitation from solution, or secretion by
organisms. It forms in layers on the Earth’s surface at
ordinary temperatures in a loose, unconsolidated
form; e.g., sand, gravel, silt, mud, loess, alluvium.
Sediment [prod] Particulate material (clay, silt, etc.) that is carried
along with the produced fluids and settles to the
bottom of the tank.
APPENDIX C334
Sedimentary rock A layered rock originated from the compaction and/
or consolidation of sediments, including a clastic rock
such as sandstone or siltstone, a chemical rock such as
rock salt or gypsum.
Semisubmersible
drilling rig
Marine drilling rig that can either be anchored to the
bottom of sea or maintained at a given position.
Sensitivity analysis Statistical analysis of sensitivity (variability) of
different parameters of a process or system as the
response to some action or influence on the process or
system.
Separator Equipment for separating the crude oil from the
natural gas and water. The primary function of the
separator is to produce gas-free liquid and liquid-free
gas.
Sequence A succession of geologic events, processes, or rocks,
arranged in chronological order.
Set theory The branch of mathematics, which is concerned with
the study of sets, i.e., any collection of items
(elements) defined by specifying the elements. See also
Fuzzy set theory.
Shale-out trap A petroleum trap formed by the lateral variation or
facies change of a porous sandstone in which the clay
constituents increase and the hard mineral grains are
reduced until porosity and permeability disappear
and the bed grades to claystone or shale. Cf: Pinch-
out trap.
Shale shaker Mechanical device (vibrating screen) for separation of
drilling cuttings from the drilling fluid as it arrives at
the surface.
Shear Action or stress that results from applied forces
and that causes or tends to cause two adjoining
portions of a substance or body to slide relative to
each other in a direction parallel to their plane of
contact.
Shelf A gently sloping or near-horizontal, shallow, marine
platform. A stable cratonic area that was periodically
flooded by shallow marine waters and received a thin,
well-winnowed cover of sediments.
Shoal Area of shallow water.
Sidetracking Drilling a new section of wellbore parallel to a
previously drilled hole but blocked with junk.
Sidewall core Core generally one inch in diameter taken from the
side of the wellbore, often by wireline.
Silcrete A soil-replacive or sand and gravel-replacive deposit
composed of silica.
GLOSSARY 335
Siliciclastic In reference to terrigenous detrital sediment
composed of silicate mineral grains.
Simulation The representation of a real system by a device (such
as a computer, model, or piece of equipment) that
imitates the structure and behavior of the system.
Skewness A statistical measure of the state of asymmetry
shown by a frequency distribution curve that is
bunched on one side of the mean and tails out on
the other side.
Smectite A highly swelling family of clay minerals that includes
montmorillonite and bentonite.
Solution gas Gas dissolved so thoroughly in the crude oil that the
solution behaves as one phase. Gas bubbles dissolved
in the oil push the latter toward the wellbore.
Sonic log A type of acoustic log that records the travel time of
sounds through objects, cement, or formation rocks.
Sorting A measure of the spread or range of particle size
distribution about the mean in a sediment population.
Source rock [petrol] Sedimentary rock deposited together with the organic
material, which under pressure, heat, and time was
transformed to liquid or gaseous hydrocarbons.
Source rock is usually shale and limestone.
Source rock [sed] The rock from which fragments and other detached
pieces have been derived to form later a sedimentary
rock. Syn: Parent rock, Mother rock.
Sour gas (or crude oil) An acid gas (or crude oil) containing a significant
amount of hydrogen sulfide (H2S) and carbon dioxide
(CO2). Cf: Sweet gas (or crude oil).
Sour gas (or oil) Gas or oil which contains hydrogen sulfide.
Spar Term for coarse crystalline calcite; commonly used in
reference to precipitated cement and may be used for
coarse crystalline, recrystallized micrite. Syn: Sparry.
Sparite Grain-supported, mud-free carbonate rock textural
type. Syn: Grainstone.
Specific heat Quantity of heat required to raise the temperature of
a unit weight of material by one degree.
Specific surface Surface of pores and pore channels per unit of pore
volume (commonly), per unit of bulk volume, or per
unit of grain volume.
Spontaneous potential
(SP)
Measurement of the difference in potential between
the formation and the Earth’s surface —
identification of rock types.
Spot sample Oil sample obtained from a particular level of the
tank.
APPENDIX C336

Squeeze cementing Placing cement by squeezing it under pressure.
Standard deviation A statistical measure of dispersion equal to the
square root of the ratio of the sum of the squared
deviations from the mean of a set of observations to
either the sample size (the population standard
deviation) or the sample size minus one (the sample
standard deviation); i.e., the square root of the
variance. Syn: Root Mean Square (RMS) deviation.
Symbol: s.
Statistics A branch of mathematics concerned with the
collection, classification, tabulation, and study of
numerical facts or the mathematical study of methods
of summarizing or describing data (descriptive
statistics) and then drawing inferences from the
summary measures (inferential statistics).
Strain The dimensional change in the shape or volume of a
body as a result of an applied stress.
Strand, strandline The zone of contact between the sea and land
commonly represented by beach deposits.
Stratigraphic trap The sealing of a reservoir bed as the result of litho-
logic changes rather than through structural trapping
conditions. See also: Pinch-out trap, Shale-out trap.
Stress A measure of the intensity of a force (F) acting upon
an area A of a body. Stress ¼ F/A can be expressed in
units of N/m2. Stress can be resolved into two
components: (1) compressive (tensile) stress acts
normal to the surface and changes the volume of the
body, and (2) shear stress acts parallel to the surface
and changes the shape of the body.
Stromatolite A laminated organo-sedimentary deposit, either
planar or dome-shaped, constructed by the sediment
trapping and binding activities, together with some
amount of syndepositional lithification, of blue-green
algae (cyanobacteria).
Structural trap The containment of oil or gas within a reservoir bed
as the result of bed bend or flexure. Syn: Anticlinal
trap.
Stylolite A pressure-solution feature, generally formed in
moderately to deeply buried rocks, characterized by a
thin seam or suture of irregular, interlocking, saw-
toothed appearance.
Subaerial Referring to exposure on land, to meteoric fluids.
Subsidence Local or regional downwarping of a depositional
surface due to tectonism or sediment loading.
Subsidence of land surface can occur as a result of
GLOSSARY 337
fluid (oil and/or water) withdrawal from the oil/gas-
and water-producing formations.
Subunconformity Position of strata beneath an unconformity.
Sucrosic General, non-genetic term for coarse crystalline
texture, used mostly in reference to dolomites; a
porosity term referring to intercrystalline pores within
coarse crystalline dolomites.
Sulfuric acid karst Dissolution, generally of carbonate strata, by sulfuric
acid generated from the oxidation of upward
migrating, H2S-bearing fluids from depth.
Supraunconformity Position of strata directly above an unconformity.
Surface lift Any lifting equipment at the surface such as a
pumping unit.
Surface tension The tendency of liquids to maintain as small a surface
as possible. It is caused by the cohesive attraction
between the molecules of liquid.
Surfactant A soluble compound that concentrates on the surface
boundary between two substances such as oil and
water and reduces the surface tension between them.
The use of surfactant permits the thorough surface
contact or mixing of substances that ordinarily
remain separate. Surfactants are used in the
petroleum industry as additives to drilling mud and to
water during chemical flooding or well stimulation.
Swabbing Raising and lowering rubber cups in the tubing to
recover liquids.
Sweet gas (or crude oil) Gas or crude oil devoid of hydrogen sulfide and
carbon dioxide.
Syndepositional Physical, biologic, or diagenetic processes occurring
during sediment deposition. Syn: Synsedimentary.
Synergistic effect The added effect produced by two processes working
in combination. It is greater than the sum of the
individual parts.
System Generally, anything formed of parts placed together
or adjusted into a regular or connected whole.
Systems analysis Complete analysis of all phases of behavior of a
system, and development of a detailed procedure for
all collection, manipulation and evaluation of data
associated with the activity of all parts of the system.
Systems approach A sophisticated philosophy and a scientific method
for investigation through mathematical modeling
(simulation) of very complicated dynamic systems,
which cannot be modeled through material or
physical procedures, and which assumes that the
given feature is an integrated assembly consisting of
APPENDIX C338

interconnected and interacting elements with new,
systems properties.
T
Tar A thick black or dark brown viscous liquid obtained
by the destructive distillation of coal, wood or peat.
Telogenesis Diagenetic alteration in the subaerial meteoric
environment of rocks that once were deeply buried.
Temperature log Measurement of the formation temperature at
various depths. It is also used to determine the height
of cement behind the casing and to locate the source
of water influx into the wellbore. Syn: Temperature
survey.
Ternary diagram A triangular diagram that graphically depicts com-
position of a three-component mixture or ternary sys-
tem. The perpendicular distances of a point from each
of the three sides (in an equilateral triangle) will then
represent the relative amount of each of the materials
represented by the apexes opposite those sides.
Terrigenous Sediments, typically siliciclastic, derived from the
erosion on land of preexisting rocks. Syn: Detrital.
Tertiary recovery The production obtained by introducing a third
source of energy, i.e., enhanced oil recovery, such as
thermal, CO2 flooding, surfactants, polymers,
alkaline flooding, in-situ combustion, and DC
electrical current.
Texture General physical appearance or characteristics of a
rock, including parameters such as size, shape,
sorting, and packing of constituent particles.
Theory of information The mathematical study of information, its storage by
codes, and its transmission through channels of
limited capacity. A fundamental idea is the entropy of
a set of events. See: Entropy, theory of information.
Thixotropy The property exhibited by a fluid that is in a liquid
state when flowing and in a semisolid, gelled state
when at rest. Most drilling fluids must be thixotropic
so that cuttings will remain in suspension when the
pipe is not in use.
Tidal flat Environment and deposits therein, formed in the
intertidal zone (including neighboring supratidal and
upper subtidal environments and deposits). Syn:
Peritidal flat.
Tight formation A petroleum- or water-bearing formation of relatively
low porosity and permeability. Syn: Hard rock.
Torque Turning or twisting force on a drilling string.
GLOSSARY 339

Tortuosity Square of the ratio of the effective length, Le, to the
length parallel to the overall direction of flow of the
pore channels, t ¼ (Le/L)2.
Total depth (TD) The maximum depth reached in a well.
Tract A region or area of land that may be precisely or
indefinitely defined.
Transgression The spread of the sea over land areas; also, any
change that brings offshore, deep-water environments
to areas previously occupied by near-shore, shallow-
water environments. The term transgressive is used in
reference to sediments deposited during a
transgression. Cf: Regression. Syn: Sea invasion.
Trap [petrol] The accumulation of petroleum in a reservoir rock
under such conditions that its migration and escape is
prevented. Sealing can be effected by the abutment of
impermeable formations against the reservoir (e.g.,
stratigraphic trap, unconformity trap), by lateral
variation within the bed to reduce permeability
(e.g., pinch-out trap, shale-out trap), by the presence
of water preventing downward migration (e.g.,
structural trap), or by the presence of impermeable
fault preventing lateral migration (e.g., fault trap).
Trap [prod] A device for separating sediment from flowing oil or
water. Syn: Sand trap.
Traveling block Arrangement of pulleys on the drilling rig with an
attached hook, which moves up and down on cables
running through the crown block.
Trip Process of pulling drillstring (or tubing) out of the
wellbore and then running it back in.
Trip gas Gas that enters the wellbore when the mud pump is
shut down and pipe is being puled from the wellbore.
The gas may enter because of reduction in
bottomhole pressure when the mud pump is shut
down, because of swabbing, or because of both.
Tubing Relatively small-diameter pipe that is run into the well
to serve as a conduit for the passage of oil and gas to
the surface.
Turbidite A sediment deposited from a turbidity current. It is
characterized by graded bedding, moderate sorting,
and well-developed primary structures, especially
lamination.
Turbodrills A rotary drilling method in which fluid pumped down
the tubing turns the drill bit. The downhole motor
consists of multistage vane-type rotor and stator sec-
tion, bearing section, drive shaft, and bit-rotating sub.
APPENDIX C340

Turbulent flow The erratic, nonlinear flow of a fluid caused by high
velocity. Cf: Laminar flow.
U
Ultraviolet light Light waves shorter than the visible blue violet waves
of the spectrum. Crude oil, colored distillates,
residuum, a few drilling fluid additives, and certain
minerals and chemicals fluoresce in the presence of
ultraviolet light.
Unconformity A substantial break or gap in the geologic record
where a rock unit is overlain by another that is not
next in the stratigraphic succession.
Unconformity trap A stratigraphic trap associated with an unconformity.
Underbalanced Of or relating to a condition in which pressure
in the wellbore is less than the pressure in the
formation.
Uninvaded zone The area far enough away from the borehole so as not
to have been invaded by the filtrate of drilling mud.
Cf: Flushed zone.
Upward-shoaling A vertical section of deposits that records continually
decreasing paleowater depths.
V
Vadose That zone in an unconfined groundwater lens wherein
the pores in the sediments are filled mostly with air.
Cf: Phreatic.
Viscosity Measure of the internal resistance of a fluid to flow.
Viscosity is equal to the ratio of shearing stress to the
rate of shearing strain. There are two kinds of
viscosity: (1) absolute or dynamic viscosity and (2)
kinematic viscosity. Cf: Fluidity.
Vitrinite A coal maceral group that is the dominant organic
constituent of humic coals. Vitrinite forms the
familiar brilliant black bands of coal. Vitrinite
particles are found in about 80% of the clays and
sands.
Vitrinite reflectance One of the petrographic components of coals used for
the determination of paleotemperatures based on the
thermogenic changes in optical properties of the
organic matter. The reflectance of vitrinite is
determined by microscopic examination of polished
sections, measuring and comparing the electric
currents generated in a photomultiplier under the
influence of light reflected from the polished surface
of the rock sample and from the standard with a
GLOSSARY 341

known reflection. The reflectance of vitrinite is
determined in immersion oil (Ro) and also in air (Ra).
Vug A small cavern in a rock, larger than a pore.
W
Wackestone A mud-supported carbonate rock with greater than
10% particles.
Water and sediment
sample
Sample of oil taken for obtaining the water and
sediment content, usually by centrifuging.
Water-base mud A drilling mud in which the continuous phase is
water.
Water block A reduction in the permeability of a formation caused
by the invasion of water into the pores.
Water cut Percentage (by volume) of water associated with the
produced oil.
Water drive The reservoir-drive mechanism in which oil is
produced by the expansion of the underlying or edge
water (as a part of aquifer), which forces the oil into
the wellbore.
Waterflooding A method of improved recovery in which water is
injected into the reservoir through the special
injection wells to remove additional quantities of oil
that have been left behind after primary recovery.
Weathering The destructive physical and/or chemical processes
constituting that part of erosion whereby earthy and
rocky material on exposure to atmospheric agents at
or near the Earth’s surface are changed in character
(color, texture, composition, firmness, or form), with
little or no transport of the loosened or altered
material.
Weight indicator Device that constantly measures the weight of the
drillstring on a drilling rig.
Well completion The activities and methods of preparing a well for the
production of oil and gas or for other purposes, such
as injection; the method by which one or more flow
paths for hydrocarbons are established between the
reservoir and the surface.
Wet gas A natural gas containing liquid hydrocarbons. Cf:
Dry gas.
Wettability The ability of a liquid to form a coherent film on a
solid rock surface, due to the dominance of molecular
attraction between the liquid and the solid surface
over the cohesive force of the liquid itself.
Wildcat A well drilled in an area where no oil or gas
production exists.
APPENDIX C342

Wireline A rope made from steel wire.
Wireline formation tester A formation fluid sampling device, actually run on
conductor line rather than wireline, that also logs flow
and shut-in pressure in formation near the wellbore.
Workover Remedial work on a well, i.e., cleaning, repairing,
servicing, stimulating, etc., after commencement of
production.
Y
Yield point The resistance to initial flow, or the stress required to
start fluid movement. The values of the yield point
and thixotropy are the measurements of the same
fluid properties under dynamic and static conditions,
respectively. Syn: Yield value.
Z
Zone of lost circulation Openings in the formation (fractures, etc.) into which
the drilling mud is lost without returning to the
surface during the drilling operations.
GLOSSARY 343

This page intentionally left blank
344

REFERENCES AND BIBLIOGRAPHY
Abasov, M. T., Buryakovsky, L. A. and Dzhafarov, I. S., 1984. Simulation of predicted hydrocarbon
resources. Proc. XXVII International Geological Congress, Section 20, III, pp. 317–318.
Abasov, M. T., Dzhafarov, I. S. and Dzhafarova, N. M., 1987. Foundations of Computerized Geological
Interpretation and Analysis. Elm Press, Baku.
Afanasyev, V. G., 1973. On the systems approach in social conscience. Philosophic Issues, 6: 8–12.
Afanasyev, V. G., 1980. Systems Approach and the Society. Politizdat, Moscow, 368 pp.
Akramkhodzhayev, A. M., 1973. Organic Matter as a Major Source of Oil and Gas. Fan Press, Tashkent,
204 pp.
Akramkhodzhayev, A. M. and Amirkhanov, Sh. Kh., 1977. On actual amount of sorbed methane and
higher hydrocarbons in insoluble organic matter, host rocks and coal. Uzbek Geologic Magazine, 4:
3–40.
Akramkhodzhayev, A. M., Kirshin, A. V. and Kushnir, M. I., 1978. On the oil generating potential of
dispersed organic matter and its quantitative estimation. Uzbek Geologic Magazine, 4: 89–91.
Aksenov, A. A., Vorobyev, V. T., Mamadzhanov, Z. A. et al., 1990. Oil and gas forecast for
intermountain depressions of the Central Asia and Kazakhstan based on integrated interpretation of
geological-geophysical and space information. Proc. VNIIOENG, Series of Geology, Geophysics and
Development of Oil Fields, Moscow, 59 pp.
Aleksandrov, B. L., 1987. Abnormally High Formation Pressures in Petroleum Basins. Nedra Press,
Moscow, 216 pp.
Allen, P. A. and Allen, J. R., 1990. Basin Analysis: Principles and Applications. Blackwell, Oxford, 427 pp.
Reprinted, 1993.
Ammosov, I. I., Gorshkov, V. I., Grechishnikov, N. P. et al., 1987. Organic Matter Petrology in the
Geology of Fossil Fuels. Nauka Press, Moscow, 333 pp.
Amott, E., 1959. Observations relating to the wettability of porous rock. Trans. AIME, 216: 156–162.
Andreyev, P. F., Bogomolov, A. I., Dobryanskiy, A. F. et al., 1958. Oil Transformations in the Nature.
Gostoptekhizdat, Leningrad, 273 pp.
Anikiev, K. A., 1964. Abnormally High Reservoir Pressures in Oil and Gas Fields. Nauka Press, Leningrad,
167 pp.
Antonellini, M. and Aydin, A., 1994. Effect of faulting on fluids in porous sandstones and petrophysical
properties. Bull. Am. Assoc. Petrol. Geol., 78(3): 355–377.
Aoyagi, K., Kazama, T., Sekiguchi, K. and Chilingarian, G. V., 1985. Experimental compaction of Na-
montmorillonite clay mixed with crude oil and seawater. Chem. Geol., 49: 385–392.
Arkhangelskiy, A. D., 1954. Oil generation conditions in the North Caucasus. Selected Works, 2. The
USSR Academy of Sciences Publishing, pp. 321–436.
Arnold, V. I., 1983. Theory of Catastrophes. Moscow State University Publishing, 80 pp.
Babalyan, G. A., 1956. Problems of Oil Recovery Mechanism. Aznefteizdat, Baku, 254 pp.
Bagir-zadeh, F. M., Buryakovsky, L. A. and Babayev, F. R., 1974a. Geochemistry of Oil and Gas in the
Absheron-Prebalkhan Anticlinal Trend. Nedra Press, Moscow, 288 pp.
Bagir-zadeh, F. M. and Buryakovsky, L. A., 1974b. Principles of Marine Petroleum Geology. Elm Press,
Baku, 125 pp.
Bagrintseva, K. I., 1977. Carbonate Rocks as Oil and Gas Reservoirs. Nauka Press, Moscow, 247 pp.
Baird, R. A., 1986. Maturation and source rock evaluation of Kimmeridgian clay, Norwegian North Sea.
Bull. Am. Assoc. Petrol. Geol., 70(1): 1–11.
345

Baker, J., and Patrice, 1992. Postdepositional history of the Permian sequence in the Denison Trough,
Eastern Australia. Bull. Am. Assoc. Petrol. Geol., 76(8): 1224–1249.
Baker, R. A., Gehman, H. M., James, W. R. and White, D. A., 1986. Geologic field number and size
assessment of oil and gas plays. Oil and Gas Assessment, Methods and Applications. AAPG Studies Geol.,
21: 133–142.
Bakirov, A. A., 1976. Geologic principles in zonation of oil and gas-bearing territories. Principles of
Geologic Zonation. Nedra Press, Moscow, pp. 16–52.
Bakirov, A. A., Bakirov, E. A. and Mstislavskaya, L. P., 1984. Systems analysis in forecasting oil and gas
occurrences in the subsurface. Systems Approach to Forecasting, Exploration and Appraisal of Oil and
Gas Accumulations. Proc. MINKhiGP, 175: 4–21.
Bakirov, A. A., Bordovskaya, M. V., Yermolkin, V. I. et al., 1991. Oil and Gas Geology and Geochemistry
(Textbook for Higher Education). Nedra Press, Moscow. 288 pp.
Barker, C. and Takach, N. E., 1992. Prediction of natural gas composition in ultra-deep sandstone
reservoirs. Bull. Am. Assoc. Petrol. Geol., 76(12): 1859–1873.
Bars, E. A., 1984. Natural water-head systems. Reference Book of Oil and Gas Geology. Nedra Press,
Moscow, pp. 310–312.
Beletskaya, S. N., 1990. Primary Migration of Oil. Nedra Press, Moscow, 288 pp.
Belousov, V. V., 1939. Greater Caucasus. Proc. TsNIGRI, 108 pp.
Belousov, V. V., 1975. Principles of Geotectonics. Nedra Press, Moscow, 334 pp.
Bertalanffy, L. von, 1969. General theory of systems. Review of problems and results. Systems Studies.
1969 Yearbook, Nauka Press, Moscow, pp. 30–54.
Binder, R. C., 1962. Fluid Mechanics, 4th ed. Prentice-Hall, Englewood Cliffs, NJ, 453 pp.
Blauberg, I. V., Sadovskiy, V. N. and Yudin, E. G., 1969. Systems studies and general theory of systems.
Systems Studies. 1969 Yearbook, Nauka Press, Moscow, pp. 7–29.
Blauberg, I. V. and Yudin, E. G., 1973. Establishing and Substance of the Systems Approach. Nauka Press,
Moscow.
Bogdanov, A. A., 1925, 1927, 1929. Universal Organizational Science (Tectology), Parts I, II, III. Moscow,
Leningrad.
Bolshakov, Yu. Ya., 1986. Oil accumulation formation conditions in clayey sequences. Geol. Geophy., 11:
18–26.
Bolshakov, Yu. Ya. and Cherenkov, S. B., 1989. Systems analysis of interaction between geologic and
capillary processes, and new properties of hydrocarbon distribution in Siberian oil- and gas-bearing
rocks. The III All-Union Conference ‘‘Systems Approach in Geology’’, Moscow, pp. 21–22.
Bordovskiy, O. K., 1974. Organic Matter in Marine and Oceanic Deposits During Diagenesis. Nauka Press,
Moscow, 296 pp.
Brod, I. O., 1947. On hydrocarbon fluid migration in the Earth’s crust. Proc. USSR Acad. Sci., Geol. Ser.,
4: 75–79.
Brod, I. O. and Eremenko, N. A., 1950. Basics of Oil and Gas (Brief Course). Moscow State University
Publishing, 245 pp.
Brod, I. O., 1957. Oil and Gas Accumulations (Formation and Classification). Gostoptechizdat, Moscow,
305 pp.
Burlin, Yu. K., 1986. Systems approach to studies of oil and gas-generation. In: Methodological Problems
of Oil and Gas, and their Practical Applications. Novosibirsk, pp. 153–158.
Burst, T. F., 1969. Diagenesis of Gulf Coast clay sediments and its possible relation to petroleum
migration. Bull. Am. Assoc. Petrol. Geol., 1: 73–94.
Buryakovsky, L. A., 1968. Entropy as criterion of heterogeneity of rocks. Int. Geol. Rev., 10(7): 761–764.
Buryakovsky, L. A., 1974. Distribution pattern of oil and gas deposits within the Absheron Archipelago.
Int. Geol. Rev., 16(7): 749–758.
Buryakovsky, L. A., Listengarten, B. M. and Bairamalibeili, N. I., 1974. Correlation of conjugated
petrophysical and geochemical parameters of oil and gas reservoirs (Azeri and English summary). Proc.
Azerbaijan Acad. Sci., Earth’s Sci. Ser., (5): 80–88.
Buryakovsky, L. A. and Kukhmazov, M. S., 1975. Classification of sandy-silty-clayey rocks based on
petrography and reservoir indexes. Petrol. Geol., 13(3): 125–129.
REFERENCES AND BIBLIOGRAPHY346

Buryakovsky, L. A. and Dzhafarov, I. S., 1980. Permeability anisotropy in stratified oil- and gas-bearing
rocks. Int. Geol. Rev., 22(9): 1067–1069.
Buryakovsky, L. A., Dzhafarov, I. S., Dzhevanshir, R. D. and Kuzmina-Gerasimova, V. L., 1981.
Simulation of physical properties of reservoir and sealing rocks in deposits of oil and gas. Proc.
International Symposium COGEODATA on the Computerizing of Geological Data, pp. 26–27.
Buryakovsky, L. A., Dzhafarov, I. S. and Dzhevanshir, R. D., 1982. Prediction of Petrophysical Properties
of Oil and Gas Reservoirs and Seals. Nedra Press, Moscow, 200 pp.
Buryakovsky, L. A. and Dzhafarov, I. S., 1984. Informational simulation of the process of geologic system
cognition (Azeri and English summary). Proc. Azerbaijan Acad. Sci., Earth’s Sci. Ser., 1: 34–40.
Buryakovsky, L. A., 1985a. Dynamic stochastic models of geologic systems (Azeri and English summary).
Proc. Azerbaijan Acad. Sci., Earth’s Sci. Ser., 5: 44–51.
Buryakovsky, L. A., 1985b. Petrophysics of Oil and Gas Reservoir Rocks of the Productive Series of
Azerbaijan. Elm Press, Baku, 196 pp.
Buryakovsky, L. A. and Dzhevanshir, R. D., 1985. Structure of pore space in Cenozoic argillaceous rocks
of Azerbaijan in connection with development in them of abnormal pore pressure. Lithol. Mineral
Resour., 20(1): 83–91.
Buryakovsky, L. A., 1986. Dynamic stochastic models as the basis of the systems forecast in geosciences.
The III All-Union Conference on Systems Approach to Geological Studies, Moscow Institute of Oil and
Gas Industry.
Buryakovsky, L. A., Arkharova, I. M. and Agamaliev, R. A., 1986. Surface-active properties of rocks in
the Productive Strata of Azerbaijan. Proc. of the II Symp. on Mining Chemistry, Visegrad, Hungary, pp.
139–149.
Buryakovsky, L. A., Dzhevanshir, R. D. and Aliyarov, R. Yu., 1986. Well-logging Techniques in Studying
Formation Pressures. Elm Press, Baku, 148 pp.
Buryakovsky, L. A., Dzhevanshir, R. D., Kheirov, M. B. and Aliyarov, R. Yu., 1988. Post-sedimentary
transformation of Middle Pliocene clay minerals of the South Caspian depression. Lithol. Mineral
Resour., 23(1): 68–77.
Buryakovsky, L. A. and Agamaliyev, R. A., 1990. Textbook on Application of Mathematical Methods in
Geochemistry and Hydrochemistry. Azerbaijan Institute of Oil and Chemistry Publishing, 140 pp.
Buryakovsky, L. A., Dzhafarov, I. S. and Dzhevanshir, R. D., 1990. Mathematical Modeling of Petroleum
Geology Systems. Nedra Press, Moscow, 295 pp.
Buryakovsky, L. A., Dzhafarov, I. S. and Kerimov, V. Yu., 1991. Exploration for Marine Oil and Gas
Fields. Nedra Press, Moscow, 260 pp.
Buryakovsky, L. A. and Chilingarian, G. V., 1991. Time factor in mathematical models of geologic and
technical processes. J. Petrol. Sci. Engr., 6: 341–347.
Buryakovsky, L. A., 1992. Scientific bases, methods and results of mathematical simulation and prediction
of structure and behavior of petroleum geology systems. Energy Sources, 14: 273–295.
Buryakovsky, L. A. and Dzhevanshir, R. D., 1992. Mathematical models of interconnections between
composition and properties of oil in the Apsheron oil- and gas-bearing region of Azerbaijan. Energy
Sources, 14: 51–71.
Buryakovsky, L. A., 1993a. Method and software for numerical simulation of reservoir properties of oil-
and gas-bearing rocks. Comput. Geosci., 19(6): 803–815.
Buryakovsky, L. A., 1993b. Outline of general and petroleum geology in Azerbaijan and the South
Caspian Basin. Bull. Houston Geol. Soc., 35(6): 16–23, 43–47.
Buryakovsky, L. A., Dzhevanshir, R. D. and Chilingar, G. V., 1995. Abnormally high formation pressures
in Azerbaijan and the South Caspian Basin (as related to smectite 3 illite transformations during
diagenesis and catagenesis). J. Petrol. Sci. Engr., (13): 203–218.
Buryakovsky, L. A., Chilingar, G. V. and Aminzadeh, F., 2001. Petroleum Geology of the South Caspian
Basin. Gulf Professional Publishing/Butterworth-Heinemann/Reed Elsevier Group, Woburn, MA,
442 pp.
Buryakovsky, L. A., Dzhevanshir, R. D., Chilingar, G. V., et al., 2002. Smectite-illite transformation
during diagenesis and catagenesis as related to overpressures. In: Origin and Prediction of Abnormal
Formation Pressures, Developments in Petroleum Science, 50, Elsevier, Amsterdam, pp. 97–122.
REFERENCES AND BIBLIOGRAPHY 347

Buryakovsky, L. A., Chilingar, G. V. and Robertson, J. O. Jr., 2004. Axiomatic approach to the geological
and geophysical sciences, Energy Sources, 26(6): 575–593.
Capiano, R. M., 1993. Evidence of fluid flow in microfractures in geopressured shales. Bull. Am. Assoc.
Petrol. Geol., 77(8): 1303–1314.
Cartmill, J. C., 1979. Obscure nature of petroleum migration and entrapment. Bull. Am. Assoc. Petrol.
Geol., 60(9): 98–103.
Chakhmakhchev, V. A., 1982. Geochemistry of Migration Process in Hydrocarbon Systems. Nedra Press,
Moscow, 231 pp.
Chapman, R. E., 1981. Geology and Water. An Introduction to Fluid Mechanics for Geologists. Nijhoff/
Junk, The Hague, 228 pp.
Chapman, R. E., 1983. Petroleum Geology. Elsevier, Amsterdam, 415 pp.
Chave, K. E., 1960. Evidence on history of seawater from chemistry of deeper subsurface waters of ancient
basins. Bull. Am. Assoc. Petrol. Geol., 44: 357–370.
Chebotarev, I. I., 1955. Metamorphism of natural waters in the crust of weathering, 1–3. Geochim.
Cosmochim. Acta, 8: 22–48, 137–170, 198–212.
Chekalyuk, E. B. and Filos, Yu. I., 1977. Oil–Water Solutions. Naukova Dumka Press, Kiev, 147 pp.
Chekalyuk, E. B., 1986. To an issue of oil synthesis at great depths. ZhVKhO Publishing, 31: 556–561.
Chen, J. C. and Fang, J. H., 1993. A new method for prospect appraisal. Bull. Am. Assoc. Petrol. Geol.,
77(1): 9–18.
Chepak, G. N., 1984. Oil accumulations as intermediate form of its primary migration. Oil Gas Geol.,
Geophys. Drilling, 7: 3–6.
Chilingar, G. V., 1956. Durov’s classification of natural waters and chemical composition of atmospheric
precipitation in USSR. Trans. Am. Geophys. Union, 37(2): 193–196.
Chilingar, G. V., 1957. Soviet methods of reporting and displaying results of chemical analyses of natural
waters and methods of recognizing oil-field waters. Trans. Am. Geophys. Union, 38(2): 219–221.
Chilingar, G. V., 1958. Chemical composition of oil-field waters from Apsheron Peninsula, Azerbaijan
S.S.R.: A summary. Geochim. Cosmochim. Acta, 14: 168–172.
Chilingar, G. V. and Degens, E. T., 1964. Notes on chemistry of oil-field waters. Bol. Asoc. Mexicana Geol.
Petrol., 15(7–8): 177–193.
Chilingar, G. V., Main, R. and Sinnokrot, A., 1963. Relationship between porosity, permeability, and
surface area of sediments. J. Sediment. Petrol., 33(3): 759–765.
Chilingar, G. V., Mannon, R. W. and Rieke, H. H., 1972. Oil and Gas Production from Carbonate Rocks.
Elsevier, New York, 408 pp.
Chilingarian, G. V. and Wolf, K. H., 1975. Compaction of Coarse Grained Sediments, Part I: Developments
in Sedimentology, 18A. Elsevier, Amsterdam, 552 pp.
Chilingarian, G. V. and Wolf, K. H., 1976. Compaction of Coarse Grained Sediments, Part II:
Developments in Sedimentology, 18B. Elsevier, Amsterdam, 808 pp.
Chilingarian, G. V. and Rieke, H. H. III, 1976. Compaction of argillaceous sediments. In: W. H. Fertl (Ed.),
Abnormal Formation Pressures. Development in Petroleum Science, 2. Elsevier, Amsterdam, pp. 49–100.
Chilingar, G. V., Bissell, H. J. and Wolf, K. H. 1979. Diagenesis of Carbonate Sediments and Epigenesis (or
Catagenesis) of Limestones In: Diagenesis in Sediments and Sedimentary Rocks. Developments in
Sedimentology, 25A, Elsevier, Amsterdam, pp. 247–422.
Chilingar, G. V. and Degens, E. T., 1964. Notes on chemistry of oilfield waters. Bol. Asoc. Mexicana Geol.
Petrol., 15 (7–8): 177–193.
Chilingar, G. V., Serebryakov, V. A. and Robertson, J. O. Jr., 2002. Origin and Prediction of Abnormal
Formation Pressures. Developments in Petroleum Science, 50, Elsevier, Amsterdam, 373 pp.
Chilingarian, G. V., Robertson, J. O. and Kumar, S., 1988. Surface Operations in Petroleum Production,
Part I: Developments in Petroleum Science, 19A. Elsevier, Amsterdam, 821 pp.
Chilingarian, G. V., Robertson, J. O. and Kumar, S., 1989. Surface Operations in Petroleum Production,
Part II: Developments in Petroleum Science, 19B. Elsevier, Amsterdam, 562 pp.
Chilingarian, G. V., Jincai Chang and Bagrintseva, K. I., 1990. Empirical expression of permeability in
terms of porosity, specific surface area, and residual water saturation of carbonate rocks. J. Petrol. Sci.
Engr., 4: 317–322.
REFERENCES AND BIBLIOGRAPHY348

Chilingarian, G. V., Mazzullo, S. J. and Rieke, H. H., 1992. Carbonate Reservoir Characterization: A Geologic
— Engineering Analysis, Part I: Developments in Petroleum Science, 30. Elsevier, Amsterdam, 639 pp.
Chilingarian, G. V., Rieke, H. H., and Kazi, A., 1994. Chemistry of pure water. In: Studies in Abnormal
Pressures, W. H. Fertl, R. E. Chapman, and R. F. Hotz (Editors), Elsevier, Amsterdam, pp. 107–153.
Chilingarian, G. V., Mazzullo, S. J. and Rieke, H. H., 1996. Carbonate Reservoir Characterization: A
Geologic-Engineering Analysis, Part II: Developments in Petroleum Science, 44. Elsevier, Amsterdam,
994 pp.
Chung, H. M., Claypool, G. E., Roony, M. A. and Squires, R. M., 1994. Source characteristics of marine
oils as indicated by carbon isotope ratios of volatile hydrocarbons. Bull. Am. Assoc. Petrol. Geol., 78(3):
396–408.
Conteharu, H. M. and Boudjema, A., 1993. Maturity and geochemical classification of Algerian
oils. Poster sessions from the XVI International Meeting on Organic Geochemistry, Stavanger,
pp. 261–264.
Crovelli, R. A., 1987. Probability theory versus simulation of petroleum potential in play analysis.
Statistical and Computational Problems in Probability Modeling, Part 1. pp. 363–381.
Degens, E. T., Pierce, W. D. and Chilingar, G. V., 1962. Origin of petroleum-bearing freshwater
concretions of Miocene age. Bull. Am. Assoc. Petrol. Geol., 62(8): 1522–1527.
Degens, E. T., Chilingar, G. V. and Pierce, W. D., 1963. On the origin of petroleum inside freshwater
carbonate concretions of Miocene age. Advances in Organic Geochemistry, Proc. Internat. Meet., Milan,
pp. 1–16.
Degens, E. T. and Chilingar, G. V., 1967. Diagenesis of subsurface waters. In: G. Larsen, and G. V.
Chilingar (Eds.), Diagenesis in Sediments: Developments in Sedimentology, 8, Elsevier, Amsterdam.
De Sitter, L. U., 1947. Diagenesis of oil-field brines. Bull. Am. Assoc. Petrol. Geol., 31: 2030–2040.
Dickey, P. A., 1975. Possible primary migration of oil from source rock as oil phase. Bull. Am. Assoc.
Petrol. Geol., 59(2): 336–345.
Dickinson, G., 1953. Geological aspects of abnormal reservoir pressures in Gulf Coast, Louisiana. Bull.
Am. Assoc. Petrol. Geol., 37: 410–432.
Dmitriyevskiy, A. N., 1982. Lithogenetic Systems Analysis of Oil and Gas Basins. Nedra Press, Moscow,
177 pp.
Dmitriyevskiy, A. N., 1984. System-structural analysis of oil and gas basins. In: Systems Studies in Geology
of Caustobioliths. Nauka Press, Moscow, pp. 33–38.
Dmitriyevskiy, A. N., 1986. Major Principles of Natural/Goal Oriented Approach in Geology and
Methodological Grounds of Systems-geologic Studies in Geology and Geophysics. Nauka Press,
Novosibirsk.
Dmitriyevskiy, A. N., Bazhenova, T. K., Ilyukhin, L. H. et al., 1992. Siberian Platform Sedimentary Basin
Evolution in Vendian-Paleozoic and Forecast of their Hydrocarbon Potential. Federal Gas Concern,
Moscow, 57 pp.
Dmitriyevskiy, A. N., 1993. Systems approach in oil and gas geology, general concepts in studies of
systems approach in geology. Geol. Oil Gas, 10: 2–4.
Dmitriyevskiy, A. N., Samsonov, Yu. V., Ilyukhin, L. H. et al., 1993. Oil and Gas Accumulation Zones in
Carbonate Sediments of Siberian Platform. Nedra Press, Moscow, 119 pp.
Dmitriyevskiy, A. N., 1994. Systems approach to the development of theory and techniques in forecasting
oil and gas occurrences in the subsurface. Geol. Oil Gas, 2: 2–4.
Dobrynin, V. M., 1970. Deformation and Alteration of Physical Properties of Oil and Gas Bearing Reservoir
Rocks. Nedra Press, Moscow.
Dobrynin, V. M. and Serebryakov, V. A., 1989. Geologic and Geophysical Methods for Prediction of
Abnormal Formation Pressures. Nedra Press, Moscow, 287 pp.
Dobrynin, V. M. and Kuznetsov, O. L., 1993. Thermoelastic Processes in Rock of Sedimentary Basins.
Proc. VNIIGeosystem, Moscow, 176 pp.
Dolton, G. L., Bird, K. S. and Crovelli, R. A., 1987. Assessment of in-place oil and gas resources:
Petroleum Geology of the Northern Part of the ANWR, NE Alaska, USGS Bull., 1178: 277–298.
Domine, F., 1991. High-pressure pyrolysis of n-hexane, 2,4-dimethylpentane and 1-phenylbutane: Is
pressure an important geochemical parameter? Org. Geochem., 17(5): 619–634.
REFERENCES AND BIBLIOGRAPHY 349
Donofrio, R. R., 1981. Impact craters: Implications for basement hydrocarbon production. J. Petrol.
Geol., 3(3).
Dow, W. G., 1977. Kerogen studies and geological interpretations. Geochem. Explor., 7: 79–99.
Drew, L. J. and Schuenemeyer, J. H., 1993. The evolution and use of discovery process models at the U.S.
Geological Survey. Bull. Am. Assoc. Petrol. Geol., 77(3): 467–478.
Durmishyan, A. G., 1973. On the consolidation of argillaceous rocks. Proc. USSR Acad. Sci., Geology
Ser., 8: 85–89.
Durov, S. A., 1948. Classification of natural waters and graphical presentation of their composition.
Trans. USSR Acad. Sci., 59(1): 87–90.
Dutton, S. P. and Diggs, T. N., 1992. Evolution of porosity and permeability in the Lower Cretaceous
Travis Peon Formation, East Texas. Bull. Am. Assoc. Petrol. Geol., 76(2): 252–269.
Efros, A. L., 1982. Physics and Geometry of Chaos. Nauka Press, Moscow.
Einstein, A., 1965. Physics and Reality. Nauka Press, Moscow.
Eremenko, N. A., Maksimov, S. P. and Tkhostov, B. A., 1949. On bitumen-formation cycles in the NE
Caucasus. Oil Econ., 12: 9–12.
Eremenko, N. A. (Ed.), 1960. Geology of Petroleum, I — Principles of Geology and Petroleum.
Gostoptekhizdat, Moscow, 592 pp.
Eremenko, N. A. and Ul’yanov, A. V., 1960. Oil and gas-bearing sequences of the world, their features and
distribution. Regional and Structural Problems of Petroleum Geology. Proc. XXI International Geologic
Congress, Moscow, pp. 19–21.
Eremenko, N. A., 1968. Geology of Oil and Gas. Nedra Press, Moscow, 389 pp.
Eremenko, N. A. and Neruchev, S. G., 1968. Primary migration during burial and lithogenesis of
sediments. Geol. Oil Gas, 9: 28–32.
Eremenko, N. A., Ammosov, I. I., Petrov, A. A. et al., 1976. Interrelation of mineral and organic
components at different stages in the formation of oil and gas-bearing sequences. Proc. XXV
International Geologic Congress, Moscow, pp. 117–152.
Eremenko, N. A., Mikhaylov, I. M. and Yakovlev, B. M., 1978. Role of hydraulic forces in the
preservation of non-anticlinal oil and gas accumulations. Proc. IGiRGI, 17: 21–33.
Eremenko, N. A. and Tverdov, R. A., 1980. Sorbed hydrocarbons in dispersed organic matter. Geol. Oil
Gas, 12: 26–31.
Eremenko, N. A., 1984. Oil and gas fields and their classification. Reference Book on Geology of Oil and
Gas. Nedra Press, Moscow, pp. 227–234.
Eremenko, N. A., 1985. Primary accumulation in oil source-rocks. Geol. Oil Gas, 2: 14–18.
Eremenko, N. A., 1986. Methodological bases of the development of theory of oil and gas origin. In:
Methodological Problems of Oil and Gas Geology and their Practical Applications. Nauka Press,
Novosibirsk, pp. 71–83.
Eremenko, N. A., Maksimov, S. P. and Minskiy, N. A., 1986. Lithologic factors in oil-gas-generation
and oil-gas-accumulation at great depths (Abstract). Moscow State University Press, Moscow,
pp. 17–19.
Eremenko, N. A. and Chilingarian, G. V. (Eds.), 1991. Petroleum Geology Handbook. OSI Publications,
Los Angeles, CA, 600 pp.
Eremenko, N. A. and Chilingar, G. V., 1996. Geology of Oil and Gas. Nauka Press, Moscow, 176 pp.
Espitalie, J., Laporte, J. L., Madec, M. et al., 1977. Methode rapide characterisation de roches meres, de
leur potentiel petrolier et de leur degre d’evolution. Rev. Inst. Fr. Petrol., 32: 23–42.
Fertl, W. H., 1976. Abnormal Formation Pressure. Developments in Petroleum Science, 2. Elsevier,
Amsterdam, 382 pp.
Fertl, W. H., Chapman, R. E. and Hotz, R. F. (Eds.), 1994. Studies in Abnormal Pressures, Developments
in Petroleum Science, 38. Elsevier, Amsterdam, 454 pp.
Fotiadi, E. E. and Voronin, Yu. A. (Eds.), 1967. Geology and Mathematics. Nauka Press, Novosibirsk, 253
pp.
Freund, H. and Kelemen, S. R., 1989. Low-temperature pyrolysis of Green River kerogen. Bull. Am.
Assoc. Petrol. Geol., 73(8): 1011–1017.
Fyodorov, S. F., 1962. Gradual migration of oil and gas. Sov. Geol., 7: 8–26.
REFERENCES AND BIBLIOGRAPHY350
Gadzhi-Kasumov, A. S., 1985. Some theoretical problems of oil and gas generation. Problems in the
Theory and Methodology in Forecasting Oil and Gas Occurrences in the Subsurface. Oil and Gas,
Moscow, pp. 82 –100.
Galimov, E. M., 1973. On new model of oil-gas-generation process. Nature of Organic Matter in Modern
and Fossil Sediments, Nauka Press, Moscow.
Gattenberger, Yu. P., 1984. Techniques of hydrodynamic studies in oil-gas-bearing basins. Reference Book
on Geology of Oil and Gas. Nedra Press, Moscow, pp. 312–328.
Gavrilov, V. P., 1993. New geodynamic approaches to the evolution of lithosphere and problems of oil
and gas-generation. In: Problems in the Theory and Methodology in Forecasting Oil and Gas Occurrences
in the Subsurface. Oil and Gas, Moscow, pp. 100–114.
Genik, G. J., 1993. Petroleum geology of Cretaceous-Tertiary rift basins in Niger, Chad and Central
African Republic. Bull. Am. Assoc. Petrol. Geol., 77(8): 605–624.
Geodekyan, A. A., Yegorov, A. E. and Yentov, V. M., 1984. On HC migration via isothermal distillation.
Trans. USSR Acad. Sci., 7(1): 170–173.
Glesstone, S., Leidler, K. and Airing, T., 1948. Theory of Absolute Velocity of Reactions. Publishing House
for Foreign Literature, Moscow.
Golovachev, E. M., 1984. Systems approach to petroleum geology, object’s rank, scale of its study, and
forecast level. Systems Studies in Geology of Caustobioliths. Nauka Press, Moscow, pp. 38–42.
Goncharov, I. V., 1987. Oil Geochemistry in West Siberia. Nauka Press, Moscow, 125 pp.
Gorrell, H. A., 1958. Classification of formation waters based on sodium chloride content. Bull. Am.
Assoc. Petrol. Geol., 42: 2513.
Gorskaya, A. I., 1950. Studies of organic matter in modern deposits. Cognition of Modern Analogues of
Oil-Gas-Bearing Facies. Gostoptekhizdat, Moscow, 96 pp.
Gottikh, R. P. and Pisotskiy, B. I., 1986. On one form of hydrocarbon migration. The II All-Union
Meeting on Carbon Geochemistry, Moscow, pp. 343–345.
Gretener, P. E., 1969. Fluid pressure in porous media — its importance in geology. A review. Bull. Can.
Petrol. Geol., 17(3): 245–255.
Gubkin, I. M., 1915. Geologic studies in the Kuban oil region. Proc. Geologic Committee, New Series,
Issue 115.
Gubkin, I. M., 1932. Science of Oil. OHTII, Moscow.
Gussow, W. C., 1954. Differential entrapment of oil and gas: a fundamental principle. Bull. Am. Assoc.
Petrol. Geol., 38(5): 816–853.
Gussow, W. C., 1968. Migration of reservoir fluids. J. Petrol. Technol., 20(4): 353–363.
Halbouty, M. T., 1970. Geology of giant petroleum fields. Mem. Am. Assoc. Petrol. Geol., 14: 575.
Hall, A. D. and Feigin, R. E., 1969. Definition of the concept of system. Studies in General Theory of
Systems. Progress Press, Moscow, pp. 252–282.
Harbaugh, J. W. and Bonham-Carter, G., 1974. Computer Simulation in Geology. Mir Press, Moscow.
Hedberg, H. D., 1926. The effect of gravitational compaction on the structure of sedimentary rocks. Bull.
Am. Assoc. Petrol. Geol., 10(10): 1035–1072.
Hnatiuk, J. and Martinelli, J. W., 1967. The relationship of the Westerose D-3 Pool to other pools on the
common aquifer. J. Can. Petrol. Technol., April–May: 43–49.
Hoering, T. and Moore, H., 1958. The isotopic composition of the nitrogen in natural gases and associated
crude oils. Geochim. Cosmochim. Acta, 13(4): 225–232.
Honarpour, M. M., Chilingarian, G. V. and Mazzullo, S. J., 1992. Permeability and relative permeability
of carbonate reservoirs (pp. 399–416). In: G. V. Chilingarian, S. J. Mazzullo and H. H. Rieke (Eds.),
Carbonate Reservoir Characterization: A Geologic Engineering Analysis, Part I. Elsevier, Amsterdam,
639 pp.
Horsefield, R., 1962. Performance of the Leduc D-3 reservoir. SPE Petrol. Trans. Reprint Ser., (4):
65–72.
Houghton, J. C., 1988. The use of the truncated shifted Pareto distribution in assessing the size
distribution of oil and gas fields. Math. Geol., 20(8): 907–938.
Houghton, J. C., Dolton, G. L., Mast, R. F. et al., 1993. U.S. Geological Survey estimation procedure for
accumulation size distribution by play. Bull. Am. Assoc. Petrol. Geol., 77(3): 454–466.
REFERENCES AND BIBLIOGRAPHY 351

Hubbert, M. K. and Rubey, W. W., 1959. Role of fluid pressure in mechanics of overthrust faulting. Geol.
Soc. Am. Bull., 70(2): 167–206.
Hunt, J. M., 1979. Petroleum, Geochemistry and Geology. Freeman, San Francisco, 675 pp.
Hunt, J. M., 1981. Distribution of hydrocarbons in sedimentary rocks. Geochim. Cosmochim. Acta, 22:
37–49.
Ignatchenko, N. A., 1968. Earthquake effect on rock formation conditions. Lithol. Mineral Resour., 2:
7–11.
Ilich, H. A., 1983. Pristane, phitane and lower molecular weight isoprenoid distributions in oils. Bull. Am.
Assoc. Petrol. Geol., 67(3): 385–393.
Il’inskaya, V. V., 1985. Genetic Relation between the Hydrocarbons of Organic Matter of Rocks and Oil.
Nedra Press, Moscow, 175 pp.
Il’inskaya, V. V. and Tukh, M. P., 1985. Inherited structures in heavy and sulfur-rich oils. In: Distribution
and Generation Conditions of Heavy and Sulfur-Rich Oils. Nauka Press, Moscow, pp. 33–37.
Il’inskaya, V. V., 1986. Principles of Identifying Qualitative and Quantitative Genetic Relation between Oils
and Organic Matter of Sedimentary Rocks. Nauka Press, Moscow, 229 pp.
Izosimova, A. N. and Chalaya, O. N., 1989. Relic Hydrocarbons in Organic Matter of the West Yakutia
Subsurface. Nauka Press, Novosibirsk.
Karogodin, Yu. N. and Prokopenko, A. I., 1984. Study Techniques of Oil and Gas Basin Structure. Nedra
Press, Moscow, 97 pp.
Karimov, I. A. and Kalapov, M. U., 1983. X-ray/neutron study of insoluble OM in sedimentary rocks.
Trans. Uzbek Acad. Sci., 3: 15–20.
Kartsev, A. A., 1984. Geochemistry of oil and gas accumulations. Reference Book of Oil and Gas Geology.
Nedra Press, Moscow, pp. 376–388.
Kartsev, A. A. and Ilyukhin, L. N., 1990. Interbed fluid cross-flow as indication of oil-gas occurrence.
Summary Reviews of VNIIEgazprom, Moscow, pp. 7–8.
Kedrov, B. M., 1980. On modern classification of sciences. Philosophic Issues, 10: 85–103.
Kerans, C., Lucia, F. J. and Senger, R. K., 1994. Integrated characterization of carbonate ramp reservoirs
using Permian San Adreas formation outcrop analogs. Bull. Am. Assoc. Petrol. Geol., 78(2): 181–216.
Khain, V. Ye., 1973. Geotectonic Bases for Oil Field Exploration. Aznefteizdat Publ. House, Baku.
Khaken, G., 1985. Synergetics. Hierarchies of Instability in Self-Organizing Systems and Devices. Mir
Press, Moscow, 423 pp.
Khakimov, E. M., 1986. Modeling of Hierarchic Systems. Kazan University Publishing, 160 pp.
Khanin, A. A., 1976. Petrophysics of Oil and Gas Reservoir Rocks. Nedra Publ. House, Moscow, 304 pp.
Khilyuk, L.F., Chilingar, G.V., Robertson, J.O., Jr., and Endres, B., 2000. Gas Migration, Events
Preceding Earthquakes. Gulf Publ. Co., Houston, TX, 389 pp.
Klubova, T. T., 1973. Clay Minerals and their Role in the Genesis, Migration and Accumulation of Oil.
Nedra Press, Moscow, 209 pp.
Klubova, T. T., 1975. On structural features of clay rocks determining their role in the formation of oil
and gas accumulations. Problems Petrol. Geol., Moscow, 5: 106–111.
Klubova, T. T., 1984. Oil and gas sequences. Reference Book of Oil and Gas Geology. Nedra Press,
Moscow, pp. 142–205.
Kovalev V. P., 1986. Methodological requirements for adequate representation of complex natural
systems by the geologic science. In: Methodological Studies in Geology and Geophysics. Nauka Press,
Novosibirsk, pp. 6–32.
Kozlov, A. L., 1940. Problems of Natural Gas Geochemistry and Genesis of Accumulations. ONTI,
Moscow, 69 pp.
Komarov, V. E., 1984. Time issue in geology. In: Systems Studies in Geology of Caustobioliths. Nauka
Press, Moscow, pp. 162–181.
Kontorovich, A. E., Bogorodskaya, L. I. and Melnikova, V. M., 1974. Anaerobic transformations of
organic matter in ancient marine deposits. Proc. USSR Acad. Sci., Geol. Ser., (3): 112–123.
Kontorovich, A. E., Nesterov, I. I., Salmanov, F. K. et al., 1975. Geology of Oil and Gas in West Siberia.
Nedra Press, Moscow, 521 pp.
REFERENCES AND BIBLIOGRAPHY352
Kontorovich, A. E., 1976. Some problems of oil genesis and geochemical history in the West Siberian
Plain. In: Patterns in Distribution and Conditions of Formation of Oil and Gas Fields in the West Siberian
Plain. Nedra Press, Moscow, pp. 91–108.
Kontorovich, A. E., 1991. General theory of naphtidogenesis. In: Theoretical and Regional Problems of
Petroleum Geology. Nauka Press, Novosibirsk, pp. 29–44.
Korchagina, Yu. I., Ivanov, M. K., Chilingar, G. V. and Yen, T. F., 1988. Major stages of transformation
of dispersed organic matter. Energy Sources, 10(1): 21–42.
Koshmann, J. J., 1985. Geologic time as a parameter in organic metamorphism and vitrinite reflectance as
an absolute paleogeothermometer: Discussion. J. Petrol. Geol., 8(2): 228–232.
Kosygin, Yu. A. and Solovyev, V. A., 1969. Static, dynamic and retrospective systems in geologic studies.
Proc. USSR Acad. Sci., Geol. Ser., 6: 9–17.
Kosygin, Yu. A., 1978. Hierarchy of Geologic Bodies. Khabarovsk.
Kram, I. Kh., 1974. Prospective Oil and Gas Provinces of the USA. Nedra Press, Moscow, 632 pp.
Krasny, L. I., 1989. Tectonic Systematic (Contemporary Problems). Abstracts of the III All-Union
Conference ‘‘Systems Approach to Geology’’, Moscow.
Krouse, H. R., Vian, Ch. A., Eliak, L. S., 1988. Chemical and isotopic coincidence of thermochemical
sulfate reduction by light hydrocarbon gases in deep carbonate reservoirs. Nature, 33: 415–419.
Krejci-Graf, F., Hecht, F. and Palser, W., 1957. Uber Olfeldwasser des Wiener Beckens. Geol. Jahrb. 74:
161–209.
Kruglikov, N. I., 1976. On the film-type migration of oil. In: Problems of Geofluidal Dynamics. VNIGRI,
Leningrad, pp. 103–107.
Krumbein, W. C. and Graybill, K. A., 1969. An Introduction to Statistical Models in Geology (translated
from English). Mir Press, Moscow.
Krumbein, W. C., Kauffman, M. E. and McCammon, R. B., 1973. Models of Geological Processes. An
Introduction to Mathematical Geology (translated from English). Mir Press, Moscow.
Krut’, I. V., 1973. Studies in Foundations of Theoretical Geology. Institute for History of Natural Sciences
and Technology, Nauka Press, Moscow, 206 pp.
Kurazhkovskaya, E. A., 1970. Dialectic Concept of Evolution in Geology (Philosophical Aspect). Moscow
State University Publishing, Moscow, 240 pp.
Kuznetsov, V. G., 1992. Oil and Gas Reservoirs in Carbonates. Nedra Press, Moscow, 191 pp.
Langnes, G. L., Robertson, J. O. and Chilingar, G. V., 1972. Secondary Recovery and Carbonate
Reservoirs. Elsevier, New York, 304 pp.
Lapinskaya, T. A. and Postnikov, A. V., 1993. On the problems of geodynamic evolution of an ancient
platform. In: Problems of Theory and Methodology in Forecasting Oil and Gas Occurrences in the
Subsurface. Oil and Gas, Moscow, pp. 114–130.
Larsen, G. and Chilingar, G. V., 1967. Diagenesis in Sediments. In: Developments in Sedimentology, 8,
Elsevier, Amsterdam, 551 pp.
Larskaya, E. S., 1983. Diagnostics and Study Techniques of Source Rocks. Nedra Press, Moscow,
211 pp.
Law, B. E. and Dickinson, W. W., 1985. Conceptual model for origin of abnormally pressured gas
accumulations in low-permeability reservoirs. Bull. Am. Assoc. Petrol. Geol., 69(8): 1217–1235.
Law, B. E., Ulmishek, G. F. and Slavin, V. I. (Eds.), 1998. Abnormal Pressures in Hydrocarbon
Environments. AAPG Memoir 70, Tulsa, OK, 264 pp.
Lerche, I. and Yarzal, R. F., 1984. Determination of paleoheat flux from vitrinite reflectance data. Bull.
Am. Assoc. Petrol. Geol., 68(11): 976–1112.
Leverett, M. C. and Lewis, W. B., 1940. Steady flow of gas–oil–water mixtures through unconsolidated
sands. AIME Tech. Pub., 1206 pp.
Leverett, M. C., 1940. Capillary Behavior in Porous Solids. AIME Tech. Pub., p. 1223.
Levorsen, A. I., 1967. Geology of Petroleum, 2nd ed.: Freeman, San Francisco, 724 pp.
Lopatin, N. V., 1971. Temperature and geologic time as coalification factors. Proc. USSR Acad. Sci., Geol.
Ser., 2: 43–64.
Lopatin, N. V., 1983. Formation of Fossil Fuels. Nedra Press, Moscow, 131 pp.
REFERENCES AND BIBLIOGRAPHY 353

Mackenzie, A. S., Patience, R. L., Maxwell, I. R. et al., 1980. Molecular parameters of maturation in the
Toarcian shales, Paris Basin, France: Part 1. Changes in the configurations of acyclic isoprenoid
alkanes, steranes and triterpanes. Geochim. Cosmochim. Acta, 44(11): 1709–1721.
Magara, K., 1978. Compaction and Fluid Migration: Practical Petroleum Geology. Elsevier, Amsterdam,
319 pp.
Magara, K., 1981. Possible primary migration of oil globules. J. Petrol. Geol., 33: 325–331.
Magara, K., 1982. Rock Compaction and Fluid Migration (translated from English). Nedra Press, Moscow,
227 pp.
Maksimov, S. P., 1954. On the oil accumulation in the Carboniferous and Devonian deposits of the
Samarskaya Luka area. Oil Econ., 10: 40–47.
Maksimov, S. P., Eremenko, N. A., Zhukhovitskiy, A. A. et al., 1959. Patterns in the changes of associated
gas composition down the stratigraphic section. Geol. Oil Gas, 1: 4–17.
Maksimov, S. P., 1962. Some regularities of the oil accumulation in the major oil and gas fields in the
southern part of the Volga-Urals region. Geol. of Oil Gas, 1: 8–18.
Maksimov, S. P., Botneva, T. A., Eremenko, N. A. et al., 1972a. On the cyclic nature of oil and gas
generation processes. Proc. XXIV International Geologic Congress, Nauka Press, Moscow, pp. 117–127.
Maksimov, S. P. and Minskiy, N. A., 1972b. On some geochemical causes affecting the distribution depths
of major oil reserves. Trans. USSR Acad. Sci., 204(6): 1225–1228.
Maksimov, S. P., Kunin, N. Ya. and Sardonnikov, N. M., 1977. Cyclicity of Geologic Processes and
Problem of Oil/Gas Formation. Nedra, Moscow.
Maksimov, S. P., Botneva, T. A., Eremenko, N. A. et al., 1979. Organic matter and cyclic nature of the oil
and gas generation processes. Sov. Geol., 9.
Marsden, S. S., 1968. Wettability: The elusive key to waterflooding. Petrol. Engr., (Apr): 82–87.
Massoud, M. S. and Kinghorn, R. F., 1985. A new classification of the organic components of kerogen. J.
Petrol. Geol., 8(1): 85–100.
Masters, C. D., 1993. U.S. Geological Survey petroleum resource assessment procedures. Bull. Am. Assoc.
Petrol. Geol., 77(3): 452–453.
Masters, I. A., 1979. Deep basin gas trap, Western Canada. Bull. Am. Assoc. Petrol. Geol., 69(2): 267–293.
Mekhtiev, Sh. F., 1956. On the Origin of Oil and Formation of Petroleum Deposits in Azerbaijan. Izd. Akad.
Nauk of Azerbaijan S.S.R., Baku, 320 pp.
Mileshina, A. G., Kalinko, M. K. and Safonova, G. I., 1983. Alterations in Oils While Filtering Through
Rocks. Nedra Press, Moscow, pp. 75–81.
Minskiy, N. A., 1975. Formation of Oil-Bearing Rocks and Oil Migration. Nedra Press, Moscow, 213 pp.
Mirchink, M. F., Eremenko, N. A. and Klubov, V. A., 1976. Criteria of oil and gas zonation and oil and
gas potential forecast. In: Principles of Oil and Gas Zonation. Nedra Press, Moscow, p. 171.
Mikhaylov, I. M., 1984. Time, duration and formation rate of oil and gas accumulations. Reference Book
of Oil and Gas Geology. Nedra Press, Moscow, pp. 414–423.
Mikhaylovskiy, G., 1906. Some consideration on the origin of Caucasus oil. Proc. Geol. Committee, 25:
97–105.
Miller, B. M., Thomsen, H. D., Dolton, G. et al., 1975. Geological estimates of undiscovered recoverable
oil and gas resources in the United States. USGS Circular, 725: 78.
Miller, B. M., 1981. Methods of assessing the petroleum reserves of Alaska. Geology and Exploration of the
National Petroleum Reserve in Alaska. USGS Prof. Paper 1399: 117–128.
Miller, R. L. and Kahn, J. S., 1965. Statistical Analysis in the Geological Sciences (translated from
English). Mir Press, Moscow.
Molchanov, V. I. and Gontsov, A. A., 1992. Modeling of Oil and Gas Generation. Nauka Press,
Novosibirsk, 219 pp.
Moskvin, V. I., 1981. Catagenesis of organic matter. Geol. Oil Gas, 3: 47–51.
Movshovich, E. B., 1984. Systems approach to identification of oil and gas exploration targets. In: Systems
Studies in Geology of Caustobioliths. Nauka Press, Moscow, pp. 107–136.
Muravyov, I., Andriasov, R., Gimatudinov, Sh. and Polozkov, V., 1958. Development and Exploration of
Oil and Gas Fields. Mir Publishers, Moscow, 503 pp. (in English).
REFERENCES AND BIBLIOGRAPHY354

Mushin, I. A., Brodov, L. Yu., Kozlov, E. A. et al., 1990. Structural Formational Interpretation of Seismic
Data. Nedra Press, Moscow, 151 pp.
Nazarevich, B. P., Nazarevich, I. A. and Volkova, T. A., 1985. On a degree of matching in catagenesis
of dispersed OM and thinly dispersed material in Aptian-Albian source-rocks of the Central and
Eastern Fore-Caucasus. In: Organic Matter in Modern and Fossil Deposits. Nauka Press, Moscow,
pp. 121–143.
Nazarkin, L. A., 1979. Effect of Deposition Rate and Erosion in Oil and Gas Basins. Saratov University
Publishing, Saratov (Russia), 157 pp.
Nazarkin, L. A., 1994. On Paleoclimatic and Dynamic Sedimentary Process of Oil and Gas Generation.
Saratov University Publishing, Saratov (Russia), 119 pp.
Nametkin, S. S., 1955. Chemistry of Oil. The USSR Academy of Sciences Publishers, Moscow, 617 pp.
Nelson, W.L., 1949. Petroleum Refinery Engineering. McGraw-Hill, New York, N.Y., 3rd ed., 830 pp.
Neruchev, S. G., Rogozina, E. A. and Kapchenko, L. N., 1973. The main phase of gas formation — one of
the stages in catagenetic evolution of sapropelic dispersed organic matter. Geol. Geophys., 10: 14–16.
Neruchev, S. G., 1979. Organic matter and accumulation of fossil fuels during Phanerozoic. Trans. USSR
Acad. Sci., 247(3): 117–118.
Neruchev, S. G. and Rogozina, E. A., 1982. Quantitative assessment of oil and gas source-rock potential
in sediments. Nauka Press, Moscow, pp. 26–34.
Neruchev, S. G., Rogozina, E. A. et al., 1986. Oil and Gas Generation in Domanik-Type Sediments. Nedra
Press, Leningrad, 133 pp.
Neruchev, S. G. and Rogozina, E. A., 1992. General model of oil and gas generation in sedimentary rocks.
In: Oil and Gas Generation Models. Nauka Press, Moscow, pp. 9–14.
Neruchev, S. G., Chepak, G. N., Chistyakov, K. B. et al., 1992. Oil and Gas Generation Models from OM
in Oligocene Clays of the Eastern Stavropol Region in Conditions of Restricted and Free Fluid Outflow.
Nauka Press, Moscow, 91 pp.
Nesterov, I. I. and Shpilman, V. I., 1984. Oil and Gas Accumulation Theory. Nauka Press, Moscow, 336 pp.
Nesterov, I. I. and Ryl’kov, A. V., 1986. Evaluation of scale of generation and emigration of liquid and
gaseous hydrocarbons. In: Geochemistry of Processes of Generation and Accumulation of Hydrocarbons
in Mesozoic Deposits of the Western Siberia. Tyumen, pp. 3–19.
Nesterov, I. I., Grigor’eva, G. F., Fishbein, Yu. V. et al., 1992. Thermodynamic aspects of hydrocarbon
generation. In: Oil and Gas Generation Models. Nauka Press, Moscow, pp. 98–103.
Novik, I. B., 1975. Problems of Thinking Style in Sciences of Nature. Politizdat, Moscow, 144 pp.
Olenin, B. V., 1984. Classification of oil and gas basins, provinces and regions. In: Reference Book of Oil
and Gas Geology. Nedra Press, Moscow, pp. 249–260.
Otis, R. M. and Schneidermann, N., 1997. A process for evaluating exploration prospects. Bull. Am.
Assoc. Petrol. Geol., 81(7): 1087–1109.
Perrodon, A., 1984. Le gas non-organique, mythe ou realite? Gas Aujourd’hui, 108 (2).
Petrov, A. A., 1974. Chemistry of Alcanes. Nauka Press, Moscow, 379 pp.
Petrov, A. A., 1984. Hydrocarbons of Oil. Nauka Press, Moscow, 419 pp.
Petrov, A. A., 1985. Composition of biomarkers and biochemical indications of oil and gas generation
processes. Geol. of Oil Gas, 10: 29–33.
Philip, R. P., 1983. Correlation of crude oils from the San Jorges Basin, Argentina. Geochim. Cosmochim.
Acta, 47: 267–275.
Plotnikov, A. A., 1976. Conditions for Formation of Hydrodynamic Traps. Nedra Press, Moscow,
117 pp.
Polishchuk, Yu. M. and Yashchenko, I. G., 2003. Cyclic character of changes in chemical properties of oils
depending on age of rocks. Geol. of Oil Gas, 6: 53–57.
Poston, S. W., Ysrael, S., Hossain, A. K. M. S., Montgomery, E. F. III. and Ramey, H. J. Jr., 1970. The
effect of temperature on irreducible water saturation and relative permeability of unconsolidated sands.
Soc. Pet. Eng. J., 2: 171–180.
Potonie, H., 1920. Die Entstehung der Steinkohle und der Kaustobiolithe Uberhaupt, 6. Aufl. B.
Borntraeger, 139 pp.
REFERENCES AND BIBLIOGRAPHY 355

Powers, M. C., 1957. Fluid-release mechanisms in compacting marine mudrocks and their importance in
oil exploration. Bull. Am. Assoc. Petrol. Geol., 51: 1240–1254.
Prasolov, E. M., 1990. Isotope Geochemistry and the Origins of Natural Gases. Nedra Press, Leningrad,
127 pp.
Pratt, W. E., 1943. Oil in the Earth. Univ. Kansas Press, Lawrence, 231 pp.
Price, L. C., 1973. The Solubility of Hydrocarbons and Petroleum in Water as Applied to the Primary
Migration of Petroleum. Ph.D. Thesis, Geol. Univ. Calif., 15 pp.
Price, L. C., 1982. Organic geochemistry of core samples from an ultradeep hot well (3001C, 7 km). Chem.
Geol., 37: 29–35.
Price, L. C., 1983. Geologic time as a parameter of organic metamorphism and vitrinite reflectance as an
absolute paleogeothermometer. J. Petrol. Geol., 6: 5–38.
Price, L. C., 1985. Geologic time as a parameter of organic metamorphism and vitrinite reflectance as an
absolute paleogeothermometer (Reply). J. Petrol. Geol., 8(2): 233–240.
Price, L. C. and Barker, C. E., 1985. Suppression of vitrinite reflectance in amorphous rich kerogen — a
major unrecognized problem. J. Petrol. Geol., 8(1): 59–84.
Price, L. C., Daws, T. and Pawlewiz, M., 1986. Organic metamorphism in the Lower Mississippian —
Upper Devonian Bakken shales. J. Petrol. Geol., 9(2): 125–162.
Proshlyakov, B. K., 1974. Secondary Changes in Oil and Gas Reservoir Rocks. Nedra Press, Moscow.
Radlinski, A. P. and Cadman, S. J., 1993. Tilt and drainage ratio in sedimentary basins. Bull. Am. Assoc.
Petrol. Geol., 77(1): 19–31.
Rainwater, F. H. and White, W. F., 1958. The solusphere — its inference and study. Geochim. Cosmochim.
Acta, 14: 244–249.
Rakitov, A. I., 1971. Lecture Course in Logic of Sciences. Higher Education Publishers, Moscow,
176 pp.
Rakitov, A. I., 1977. Philosophic Problems of Science (Systems Approach). Mysl’ Press, Moscow, 270 pp.
Rapoport, A., 1969. Different approaches to general theory of systems. Systems Studies. 1969 Yearbook.
Nauka Press, Moscow, pp. 55–79.
Ray, M. R., Brashear, J. P. and Biglarbigi, K., 1991. Classification system targets unrecovered U.S. oil
reserves. Oil Gas J., 89(39): 89–93.
Rieke, H. H. III and Chilingarian, G. V., 1974. Compaction of Argillaceous Sediments. Developments in
Sedimentology, 16. Elsevier, Amsterdam, 531 pp.
Rodionov, D. A. et al., 1987. Handbook on Mathematical Methods in Geology. Nedra Press, Moscow.
Rohrback, B. G., Peters, K. E. and Kaplan, J. R., 1984. Geochemistry of artificially heated humic and
sapropelic sediments. 2. Oil and gas generation. Bull. Am. Assoc. Petrol. Geol., 68(8): 1313–1349.
Root, D. H. and Attanasi, E. D., 1993. Small fields in the national oil and gas assessment. Bull. Am. Assoc.
Petrol. Geol., 77(3): 485–490.
Root, D. H. and Mast, R. T., 1993. Future growth of known oil and gas fields. Bull. Am. Assoc. Petrol.
Geol., 77(3): 479–484.
Sadovskiy, V. N., 1972. Paradoxes of Systems Thoughts. Systems Studies. 1972 Yearbook. Nauka Press,
Moscow, pp. 133–146.
Sadovskiy, V. N., 1974. Foundations of General Theory of Systems. Nauka Press, Moscow, 279 pp.
Samedov, F. I. and Buryakovsky, L. A., 1956. Chemical composition and origin of formation waters of
the Neftyanyye Kamni field. Trans. Azerbaijan Acad. Sci., 12(11): 841–848.
Samedov, F. I. and Buryakovsky, L. A., 1962. Gas potential of the Productive Series of the southeastern
part of Absheron Archipelago. Petrol. Geol., 5(4): 186–189.
Samedov, F. I. and Buryakovsky, L. A., 1966. Oilfield Hydrogeology of the Absheron Archipelago.
Azerneshr Press, Baku, 228 pp.
Savchenko, V. P., 1952. On the oil and gas accumulation. Oil Econ., 5: 37–44.
Savchenko, V. P., 1977. Formation, Appraisal and Development of Oil and Gas Fields. Nedra Press,
Moscow, 219 pp.
Sazonova, G. I., 1980. Relic Structures in Oil’s Hydrocarbons of Various Stratigraphic Subdivisions. Nedra
Press, Moscow, pp. 5–31.
REFERENCES AND BIBLIOGRAPHY356

Sakhibgareyev, R. S., 1985. Alteration specifics of carbonate reservoirs in the process of formation and
destruction of oil and gas accumulations. In: Distribution Patterns of Complex Reservoirs and the
Forecast of Oil and Gas Potential. Nauka Press, Leningrad, pp. 85–93.
Saxby, J. D., 1982. A reassessment of the range of kerogen maturities in which hydrocarbons are
generated. J. Petrol. Geol., 5(2): 217–247.
Scott, A. K., Kaiser, W. R. and Ayess, W. R., 1994. Thermodynamic and secondary biogenic cases, San
Juan Basin, Colorado and New Mexico — Implication for producibility of coal beds. Bull. Am. Assoc.
Petrol. Geol., 78(8): 1176–1206.
Seifert, W. K., 1978. Steranes and terpanes in kerogen pyrolysis for correlations of oils and source rocks.
Geochim. Cosmochim. Acta, 42: 473–484.
Seifert, W. K. and Moldowan, I. M., 1980. The effect of thermal stress on source rock quality as measured
by hopane stereochemistry. Phys. Chem. Earth, 12: 229–237.
Seifert, W. K. and Moldowan, I. M., 1986. Use of biological markers in petroleum exploration. Biol.
Markers Sediment Rec., 1: 267–290.
Sergiyenko, S. I., 1984. Heat field of oil and gas provinces of the USSR. In: Reference Book of Oil and Gas
Geology. Nedra Press, Moscow, pp. 267–294.
Sergiyenko, S. I., 1995. Heat flow and HC generation processes. Trans. Russ. Acad. Sci., 217: 949–950.
Serebrovskaya, K. B., 1986. Possible role of abiogenic oil in the origins of life on the Earth. ZhVKhO
Publishing, 5: 513–517.
Serruya, C., Picard, L. and Chilingarian, G. V., 1967. Possible role of electrical currents and potentials
during diagenesis (‘‘electrodiagenesis’’). J. Sediment. Petrol., June: 695–698.
Setrov, M. I., 1972. Foundations of Functional Theory of Organization (Philosophical Essay). Nauka Press,
Leningrad, 164 pp.
Shen, R. et al., 1988. Characteristics of isotope composition of gasiform hydrocarbons and identification
of coal-type gas: Sci. Sen. Sem. B., 31(6): 737–747.
Sheriff, R. E., 1984. Encyclopedic Dictionary of Exploration Geophysics, 2nd ed.: Society of Exploration
Geophysicists, Tulsa, OK.
Shipov, G. I., 1989. Systematization of relativity principles in physics. Abstracts of the III All-Union
Conference ‘‘Systems approach in geology’’, Moscow, pp. 137–139.
Shvetsov, P. F., 1974. Geothermal Conditions in Mesozoic-Cenozoic Oil and Gas Basins. Moscow, Nauka
Press, 117 pp.
Simonenko, V. F., 1988. Emigration of HC in Water Soluble State and their Initial Accumulation. Proc.
VIEMS, Moscow, 79 pp.
Sinnokrot, A. A. and Chilingar, G. V., 1961. Effect of polarity of oil and presence on carbonate particles
on relative permeability of rocks. The Compass of Sigma Gamma Epsilon, 38: 115–120.
Sinnokrot, A. A., Ramey, H. J. Jr. and Marsden, S. S., 1969. Effect of Temperature Level upon Capillary
Pressure Curves. SPE paper 2517 presented at 44th SPE of AIME Annual Fall Meeting, Denver,
Colorado.
Smirnov, L. B., 1980. Heat Field of the USSR Territory. GUGK, Moscow, 219 pp.
Smith, O. U., 1954. Studies on origin of petroleum, occurrence of hydrocarbons in recent sediments. Bull.
Am. Assoc. Petrol. Geol., 3(8): 377–404.
Smirnov, Yu. P., 1989. Systems approach to geology. The III All-Union Conference, Moscow,
pp. 47–53.
Sokolov, V. A., Bestuzhev, M. A. and Tikhomolova, T. B., 1971. Chemical Composition of Oil and Natural
Gases in Connection with their Origin. Nedra Press, Moscow, 171 pp.
Solovyev, N. N., 1986. Tectonic mechanism of degassing the subsurface hydrosphere in gas accumulation
formation. Trans. USSR Acad. Sci., 286 (4): 947–950.
Spencer, C. W., 1987. Hydrocarbon generation as a mechanism for overpressuring in Rocky Mountain
region. Bull. Am. Assoc. Petrol. Geol., 71(4): 368–388.
Stadnikov, G. L., 1931a. Origin of Coal and Oil. GONTI, Leningrad, 217 pp.
Stadnikov, G. L., 1931b. Origin of Oil and Gas. The USSR Academy of Sciences Publishing, Moscow,
597 pp.
REFERENCES AND BIBLIOGRAPHY 357

Starobinets, I. S., Kondratov, L. S. and Fedorova, G. S., 1986. Role of physical fields in formation of
hydrocarbon and geochemical concentration fields in sedimentary rocks. In: Modeling of Geochemical
Field of Oil and Gas Deposits. Nedra Press, Moscow, pp. 47–54.
Stefanova, E. I. and Shimorina, E. F., 1981. Study of coal in fault zones. Geol.Explorat., 1: 27–34.
Strakhov, N. M., 1960. Foundations of Lithogenetic Theory. Nauka Press, Moscow, 631 pp.
Stetyukha, Ye. I., 1964. Equations of Correlations between Physical Properties of Rocks and Depth of
Burial. Nedra Press, Moscow.
Sulin, V. A., 1948. Oilfield Hydrogeology. Gostoptekhizdat, Leningrad, 245 pp.
Terzaghi, K., 1961. Theory of Mechanics of Soils (translated from German). Gosstroyizdat, Moscow.
Tkhostov, B. A., 1966. Initial Reservoir Pressure and Geofluidal Systems. Nedra Press, Moscow, 268 pp.
Tissot, B.P. and Welte, D.H., 1978. Petroleum Formation and Occurrence. A New Approach to Oil and Gas
Exploration. Springer, Berlin-Heidelberg-New York, 538 pp.
Tissot, B. and Welte, D., 1981. Oil Generation and Distribution. Mir Press, Moscow, 273 pp.
Tissot, B. P., Pelet, R. and Ungeser, P. H., 1987. Thermal history of sedimentary basins, maturation
indices and kinetics of oil and gas generation. Bull. Am. Assoc. Petrol. Geol., 71(12): 1445–1466.
Tolstikhin, N. I., 1932. Toward question of graphical representation of analysis of waters. In:
V. Golubyatnikov (Editor), Sampling of Mineral Deposits. Gosgeolizdat, Moscow-Leningrad, pp. 1–8.
Tolstikhin, N. I. et al., 1954. Hydrogeology. In: N. B. Vassoyevich (Ed.), Companion of Field Petroleum
Geologist, Part II. Gostoptekhizdat, Leningrad, pp. 101–145.
Trash, P.J. and Brown, K.E., 1965. Field Operation Handbook for Gas Lift. Otis Engineering, Dallas, TX,
88 pp.
Trofimuk, A. A., Karogodin, Yu. N. and Movshovich, E. B., 1980. Problems of improvement in oil and
gas geology conceptual and terminology base. Geol. Geophys., 2: 3–10.
Trofimuk, A. A., Cherskiy, N. V., Tsarev, V. P. and Soroka, G. I., 1981. New data on experimental studies
of transformation of organic matter using mechanical forces. Trans. USSR Acad. Sci., 257 (1): 207–211.
Trofimuk, A. A. et al., 1982. Problems of improvement in oil and gas geology conceptual base. Geol.
Geophys., 5: 18–24.
Tsarev, V. P., 1978. New data on liquid hydrocarbon primary migration mechanism from thinly dispersed
media. Geol. Geophys., 7: 15–25.
Tverdova, R. A. and Eremenko, N. A., 1988. Transformation of kerogen in sedimentary rocks. Reports on
Geochemistry and Chemical and Physical Problems of Exploration and Production of Oil and Gas, vol. 1
— Geochemistry, Sol’nok. pp. 202–210.
Tverdova, R. A. and Eremenko, N. A., 1992. Products of transformation of concentrates of insoluble OM
of sedimentary rocks. In: Modeling of Oil and Gas Generation. Nauka Press, Moscow, pp. 14–18.
Uyemov, A. I., 1969. Logical analysis of systems approach to objects and its place among the other study
techniques. Systems Studies. 1969 Yearbook. Nauka Press, Moscow, pp. 80–96.
Uyemov, A. I., 1978. Systems Approach and General Theory of Systems. Mysl’ Press, Moscow, 272 pp.
Urov, K. E., 1992. Saturatedness of oils in light of mechanical destruction of kerogen-containing rocks. In:
Modeling of Oil-Gas Generation. Nauka Press, Moscow, pp. 125–128.
Urmantsev, Yu. A., 1974. Symmetry of the Nature and Nature of the Symmetry (Philosophic and Scientific
Aspects). Mysl’ Press, Moscow, 229 pp.
Urmantsev, Yu. A., 1978. Fundamentals of the general theory of systems. In: Systems Analysis and
Scientific Knowledge. Nauka Press, Moscow, pp. 7–41.
Uspenskiy, V. A., 1970. Introduction to Geochemistry. Nedra Press, Leningrad, 164 pp.
Van Krevelen, D. W., 1961. Coal. Typology — Chemistry — Physics — Constitution. Elsevier, Amsterdam,
514 pp.
Vassoyevich, N. B. (Ed.), 1954. Companion of Field Petroleum Geologist, Part II. Gostoptekhizdat,
Leningrad, 564 pp.
Vassoyevich, N. B. and Bronovitskiy, A. V., 1962. Density and porosity of sedimentary rocks. Proc.
VNIGRI, Issue 190, Leningrad, pp. 478–484.
Vassoyevich, N. B., Korchagina, Yu. I., Lopatin, N. V. et al., 1969. Oil/gas window. Herald of Moscow
State University, Series 4, Geology, 6: 67–78.
REFERENCES AND BIBLIOGRAPHY358

Vassoyevich, N. B., 1975. Cycles of deposition, lithogenesis and oil and gas generation: In: Sedimentary
Basins and Their Oil and Gas Content. Moscow University Publishing, Moscow, 176 pp.
Vassoyevich, N. B., 1976. Concept of age of oil as related to the stages of its generation. Sov. Geol., 2:
72–78.
Vassoyevich, N. B. and Neruchev S. G., 1979. Main Stage of Evolution of Oil Source Rocks and Their
Diagnostics. Proc. VNIGRI, Moscow, 184 pp.
Vassoyevich, N. B., 1984. Dispersed bitumoids in sedimentary rocks. Reference Book on Geologic Science
and Geography. Nedra Press, Moscow, pp. 68–98.
Vassoyevich, N. B., 1986. Geochemistry of Organic Matter and Origin of Petroleum. Nauka Press, Moscow,
196 pp.
Veber, V. V., 1966. Sedimentary Facies Favorable for Oil Generation. Nedra Press, Moscow, 121 pp.
Vennard, J. K., 1961. Elementary Fluid Mechanics, 4th ed. Wiley, New York, NY, 570 pp.
Vernadskiy, V. I., 1975. Reflections of a Naturalist: Space and Time in Live and Inanimate Nature. Nauka
Press, Moscow, 173 pp.
Vernadskiy, V. I., 1995. Live Matter and the Biosphere. Nauka Press, Moscow.
Vistelius, A.B., 1980. Fundamentals of Mathematical Geology. Nauka, Leningrad.
Voytov, G. I., 1986. Chemistry and scale of present-day flow of natural gases in different geo-structural
zones of the Earth. ZhVKhO Publishing, 31(5): 533–540.
Volkova, I. B., 1990. Organic Petrology. Nedra Press, Leningrad, 217 pp.
Volterra, V., 1976. Mathematical Theory of Struggle for Survival (translated from Italian). Nauka Press,
Moscow.
Vorobyev, V. M., 1989. Typology of ideal concepts of geologic objects as systems. Abstracts of the III All-
Union Conference ‘‘Systems approach to geology’’, Moscow, pp. 17–18.
Voropayev, V. N., 1989. Methodological aspects of systems approach to geology. Abstracts of the III All-
Union Conference ‘‘Systems approach to geology’’, Moscow, pp. 27–28.
Von Engelhardt, 1960. Der Porenraum der Sedimente. Springer, Berlin, 207 pp.
Waples, D. W., 1980. Time and temperature in petroleum formation: Application of Lopatin’s method to
petroleum exploration. Bull. Am. Assoc. Petrol. Geol., 46(6): 916–926.
Waples, D. W., 1992. The art of maturity modeling, Parts 1, 2. Bull. Am. Assoc. Petrol. Geol., 76: 31–60.
Weber, K. J., 1986. How heterogeneity affects oil recovery. Reservoir Characterization. Acad. Press,
Orlando, pp. 17–21.
Weller, F. A., 1959. Compaction of sediments: Bull. Am. Assoc. Petrol. Geol., 43(2): 273–310.
Welte, D. H., Hagemann, H. W., Hollerbach, A. and Leythauser, D., 1975. Correlation between
petroleum and source rocks. Proc. IX World Petrol. Congr. Panel Discussion, Tokyo, 3, pp. 179–191.
Wescott, W. A. and Hood, W. C., 1994. Hydrocarbon generation and migration routes in the East Texas
Basin. Bull. Am. Assoc. Petrol. Geol., 78(2): 287–307.
White, D., 1915. Some relation in origin between coal and petroleum. Proc. Wash. Acad. Sci., 6: 2–21.
White, D. A., Garrett, R. W., March, G. R. et al., 1975. Assessing regional oil and gas potential.
methods of estimating the volume of undiscovered oil and gas resources. AAPG Studies in Geology, 1:
143–159.
White, D. A., 1987. Conventional oil and gas resources. Resources and World Development. Wiley, New
York, pp.113–128.
White, L. P., 1981. A play approach to hydrocarbon resource assessment and evaluation. The Economics
of Exploration for Energy Resources. JAI Press, pp. 51–68.
Wilhelms, A., Larter, S. R. and Leythaenser, D., 1991. Influence of bitumen 2 on Rock-Eval pyrolysis.
Org. Geochem., 17(3): 315–354.
Yakushin, B. V., 1975. Classification: Great Soviet Encyclopedia, 6. Moscow.
Yermakova, V. I., Sukhoveyeva, G. S. and Baryshnikova, L. P., 1988. Thermobaric destruction of
geostructures in bituminous matter — source of HC neoformation. Primary Migration and Oil and Gas
Potential of Sedimentary Basins. Proc. VNIGNI, Moscow, pp. 27–35.
Yerzhanov, Zh. S., Yegorov, A. K., et al., 1975. Theory of Crustal Folding. Nauka Press, Moscow.
Zabrodin, V. Yu., 1981. Systems Analysis of Faults. Nauka Press, Moscow, 200 pp.
REFERENCES AND BIBLIOGRAPHY 359

Zhabrev, I. P., 1993. Geologic concepts and the system of modeling. In: Problems of Theory and
Methodology in Forecasting Oil and Gas Occurrences. Oil and Gas, Moscow, pp. 39–45.
Zhdanov, M. A. and Kartsev, A. A., 1958. Oilfield Geology and Hydrogeology. Gostoptekhizdat, Moscow,
312 pp.
Zheltov, Yu. P. and Khristianovich, S. A., 1955. On hydraulic fracturing of oil reservoirs. Proc. USSR
Acad. Sci. Sect. Tech. Sci., 5: 79–87.
Zhuze, T. P. and Sushilin, A. V., 1984. Physical and thermodynamic properties of liquid and gaseous HS’s
at reservoir conditions. Reference Book of Oil and Gas Geology. Nedra Press, Moscow, pp. 98–142.
Zhuze, T. P., 1986. Hydrocarbon Migration in Sedimentary Rocks. Nedra Press, Moscow, 117 pp.
REFERENCES AND BIBLIOGRAPHY360

Author Index
Abasov, M.T., 270
Afanasyev, V.G., 2, 9
Agamaliev, R.A., 51, 205, 221
Akramkhodzhayev, A.M., 124–125,
129, 131
Aleksandrov, B.L., 51
Alekseyev, 128
Aliyarov, R.Yu., 57
Allen, J.R., 34–35, 118, 120
Allen, P.A., 118, 120, 161
Aminzadeh, F., 51, 53, 64, 171, 177,
213, 217, 219–221, 226–227,
257–258
Amirkhanov, Sh.Kh., 124
Ammosov, I.I., 50, 117–119, 121–124
Andreyev, P.F., 120
Antonellini, M., 27–28
Arkhangelskiy, A.D, 135–136
Arkharova, I.M., 51, 221
Arps, J.J., 74, 165
Athy, L.F., 253
Aydin, A., 27–28
Babalyan, G.A., 73, 234, 291–293
Babson, E.C., 191
Bacon, F.O., 7
Bagir-zadeh, F.M., 164
Bagrintseva, K.I., 22, 25, 34, 220
Baird, R.A., 124
Bakirov, A.A., 20
Barker, C.E., 121, 124
Bars, E.A., 82
Beletskaya, S.N., 72, 80, 82, 152, 155–157,
160, 168
Belousov, V.V., 45, 101, 169
Bezhayev, 238
Binder, R.C., 278–279
Bissell, H.J., 262
Bereto, Ya.A., 42
Bogomolov, A.I., 120
Bolshakov, Yu.Ya., 197
Bonham-Carter, G., 205
Bordovskiy, O.K., 136
Botnieva, T.A., 92, 94–95, 97, 138
Brilling, 137
Brod, I.O., 35–36, 136–137, 149, 173, 195
Bronovitsky, 253–254
Brown, K.E., 92
Bruce, W.A., 193
Burlin, Yu.K., 35
Burst, T.F., 126
Buryakovsky, L.A., 2, 8, 14–15, 23, 25, 32,
44, 51, 53–57, 59–60, 62–64, 75, 152,
164–166, 171, 177, 205–206, 213–214,
217, 218–221, 226–227, 234–236, 238,
244, 248–250, 252, 254, 256–258, 260,
262–264, 266, 267, 269, 272–273
Carman, P.C., 220
Cartmill, J.C., 159
Chakhmakhchev, V.A., 96, 179
Chave, K.E., 75
Chebotarev, I.I., 75
Chekalyuk, E.B., 155–156
Chepak, G.N., 142, 167
Cherskiy, N.V., 120
Chilingar, G.V., 22–25, 27, 48, 51–55, 59–60,
63–68, 73–75, 81–82, 87, 92, 110,
111–112, 144–145, 151, 153, 156–159,
164, 170–171, 177, 180, 183, 202–203,
213, 217, 219–221, 226–227, 257–258,
262, 287, 292, 295
Chistyakov, K.B., 140, 142
Christianovich, 140
Clarke, F.W., 302
Darwin, Charles, 1
Daws, T., 121, 143
De Sitter, L.U., 75, 78
Degens, E.T., 75
Descartes, Rene, 7
Dickey, P.A., 159
361

Dickinson, G., 51, 253
Diggs, T.N., 23, 47
Dmitriyevskiy, A.N., 1, 2, 21
Dobryanskiy, A.F., 120
Dobrynin, V.M., 29, 30, 32, 45, 51–52,
252–253
Doherty, W.T., 90
Donaldson, E.C., 276–277
Donofrio, R.R., 199
Dow, W.G., 50
Dunan, 53
Durmishyan, A.G., 253, 255
Durov, S.A., 75
Dutton, S.P., 23, 47
Dzhafarov, I.S., 8, 14–15, 56, 205, 250, 252,
254, 256–257, 260, 262
Dzhevanshir, R.D., 5, 8, 14–15, 53–57,
59–60, 64, 205, 234, 236, 244, 248–250,
252, 254, 256–257, 260, 262
Efros, A.L., 158
Elliot, G.R., 189
Engelhardt, Von W., 78
Eremenko, N.A., 24, 25, 30, 36, 46,
75, 81–82, 87, 92, 110, 124, 128,
129, 136, 138, 144–145, 151, 153,
156–159, 164, 167, 170–171, 173,
180, 198, 202
Fedorova, G.S., 115, 156, 179
Fertl, W.H., 51, 62
Fishbein, Yu.V., 141–142
Filos, Yu.I., 155
Foster, J.B., 51, 253
Fyodorov, S.F., 164
Galimov, E.M., 145
Gattenberger, Yu.P., 85, 196
Geodekian, A.A., 158
Glesston, 120
Gontsov, A.A., 145
Gorrell, H.A., 75
Gorshkov, V.I., 50, 117–118, 121–124
Gorskaya, A.I., 125
Graybill, K.A., 205
Grechishnikov, N.P., 50, 117–118,
121–124
Gretener, P.E., 201
Grigor’eva, G.F., 141–142
Gubkin, I.M., 85, 135, 152
Gussow, W.C., 162–163, 171
Ham, H.H., 253
Harbaugh, J.W., 205
Hedberg, H.D., 253–254
Hnatiuk, J., 163
Hoering, T., 104
Honarpour, M.M., 293
Hood, W.C., 50–51
Horsefield, R., 163
Hosoi, H., 253
Hubbert, M.K., 201
Hunt, J.M., 1, 125
Ignatchenko, N.A., 124, 144
Illing, L.V., 151
Jodry, R.L., 74
Jones, P.H., 26
Kahn, J.S., 205
Kalapov, M.U., 124
Kalinko, M.K., 98–99
Kaplan, J.R., 120, 132–133, 145
Karimov, I.A., 124
Karogodin, Yu.N., 35, 136
Kartsev, A.A., 128
Kauffman, M.E., 205
Kedrov, B.M., 3
Kerans, C., 25–26
Kerimov, V.Yu., 13, 56
Khain, V.Yu., 19, 32
Khanin, A.A., 23, 32
Khatskevich, N.E., 238
Kheirov, M.B., 56–57
Khilyuk, L.F., 52, 71, 103–104, 171
Khitarov, N.I., 58
King, J.G., 199
Kirshin, A.V., 124, 131
Klubov, V.A., 151
Klubova, T.T., 24, 29, 33–34, 43, 48–49,
137, 159
Koichi, A., 152
Komarov, V.E., 7
Kondratov, L.S., 115, 156, 179
AUTHOR INDEX362
Kontorovich, A.E., 32, 35, 128, 136, 140,
161, 174, 176–177, 199
Kosygin, Yu.A., 3, 4, 14
Kotyakhov, F.I., 25
Krouse, H.R., 104
Krejchi-Graf, K., 75
Kruglikov, N.I., 157
Krumbein, W.C., 205
Kulbitskiy, 128
Kurazhkovskaya, E.A., 8
Kushnir, M.I., 124, 131
Kuznetsov, V.G., 32, 35, 45
Langnes, G.L., 73, 183
Larskaya, E.S., 131
Lebedev, L., 110
Lee, S., 53
Leverett, M.C., 290
Lewis, W.B., 290
Levorsen, A.I., 25, 35, 161, 170, 173,
182
Lipetskiv, V.F., 44
Lopatin, N.V., 2, 118, 120–121, 140
Lucia, F.J., 25–26
Magara, K., 51, 58, 159, 253
Maksimov, S.P., 46, 129, 138, 145, 162, 164,
168
Mannon, R.W., 74, 183
Marsden, S.S., 281
Martinelli, J.W., 163
Masters, I.A., 197
Mazzullo, S.J., 22–23, 25, 27, 48, 152,
183
McCammon, R.B., 205
Meade, R.H., 253
Mekhtiev, Sh.F., 77
Mikhailovskiy, G., 135
Mikhaylov, I.M., 30, 138, 169, 196
Mileshina, A.G., 98–99
Milleau, 57
Miller, R.L., 1, 205
Minskiy, N.A., 46–48
Mirchink, M.F., 151, 217
Molchanov, V.I., 145
Moore, H., 104
Moskvin, V.I., 120
Movshovich, E.B., 35, 136
Muravyov, I., 284
Muskat, M., 186
Namiol, 111
Nametkin, S.S., 125–126
Nazarevich, B.P., 137
Nazarevich, I.A., 137
Nazarkin, L.A., 136, 153–154, 160
Nelson, W.L., 93
Neruchev, S.G., 128, 129, 131, 140,
142, 157
Nesterov, I.I., 32, 136, 141–142, 145, 161,
174, 176–177
Olenin, B.V., 151
Osborne, W.E., 316
Otis, R.M., 147
Parker, 156
Pavlova, 42
Pawlewiz, M., 121, 143
Pelet, R., 118
Perrodon, A., 197
Peters, K.E., 120, 132–133, 145
Petrov, A.A., 87–88, 93, 95, 96, 181
Picard, L., 143
Plotnikov, A.A., 196
Polishchuk, Yu.M., 87
Potonie, H., 132, 135
Powers, M.C., 41, 152
Prasolov, E.M., 103, 104–105, 106
Price, L.C., 50, 118, 120–121, 124,
143, 145
Proshlyakov, B.K., 253
Pugin, V.A., 58
Rainwater, F.H., 75
Reznikov, A.N., 170
Rieke, H.H., 22–23, 25, 27, 40, 48,
53, 63, 74, 136, 152, 183, 201,
252–253
Robertson, J.O., 52, 64, 73, 203
Rodionov, D.A., 205
Rogozina, E.A., 128, 131, 140
Rohrback, B.G., 120, 132–133,
145
Rubey, W.W., 201
Rylkov, A.V., 32
AUTHOR INDEX 363

Safonova, G.I., 98–99
Sakhibgareyev, R.S., 169
Salmanov, F.K., 32, 136, 161, 174,
176–177
Samedov, F.I., 63, 75, 164, 238
Sariapo, 156
Savchenko, V.P., 24, 42, 81, 158, 164, 182,
196
Saxby, J.D., 50, 122–124
Schneidermann, N., 147
Serebryakov, V.A., 30, 51–52, 59, 64, 203
Sergiyenko, S.I., 45, 154
Serruya, C., 143
Shen, R., 104
Shibaoka, 123
Shimorina, E.F., 124
Shpilman, V.I., 145
Shvetsov, P.F., 120
Sidorenko, 117
Simonenko, V.F., 80, 156–157
Skripka, 111
Smirnov, L.B., 154
Sinnokrot, A., 292
Sokolov, V.A., 44, 128
Solovyev, N.N., 14, 167
Soroka, G.I., 120
Stadnikov, G.L., 145
Starobinets, I.S., 115, 156, 179
Stefanova, E.I., 124
Stetyukha, Ye.I., 254
Strakhov, N.M., 124, 135–136
Sudarikov, 168
Sulin, V.A., 75, 78, 238
Sultanov, Ch.A., 111
Sushilin, A.V., 112–113, 115
Terry, R.D., 48
Terzaghi, K., 257
Tiab, D., 276–277
Tissot, B., 92, 94, 118, 124–125, 130, 132
Tkhostov, B.A., 138
Tolstikhin, N.I., 75–76
Thrash, P.J., 92
Trofimuk, A.A., 35, 120, 128, 130, 136
Tsarev, V.P., 80, 120, 157
Tverdova, R.A., 124, 128
Ul’yanov, A.V., 19
Ungeser, P.H., 118
Urov, K.E., 143
Uspenskiy, V.A., 131–132, 137, 140
Van Krevelen, D.W., 118, 120
Vasilyev, 178
Vassoyevich, N.B., 75–76, 78, 82,
117, 121, 126–128, 137–139, 143,
148, 253, 254
Vennard, J.K., 278–279
Vistelius, 316, 321
Volkova, T.A., 137
Volterra, V., 251
Von Engelhardt, W., 217
Weber, K.J., 1, 35
Weber, 1, 128
Weller, F.A., 253–254
Welte, D., 92, 94, 118, 124–125, 130, 132
Wescott, W.A., 50–51
Whalen, H.E., 51, 253
White, D., 136
White, W.F., 75
Witherspoon, P.A., 26
Wolf, K.H., 40, 152, 262
Yakovlev, B.M., 30, 138
Yakushin, B.V., 3
Yakutsina, V.P., 170
Yashchenko, I.G., 87
Yermakova, V.I., 128
Zaba, J., 90
Zhabrev, D.V., 238
Zhabrev, I.P., 143
Zheltov, Yu.P., 140
Zhukhovitskiy, A.A., 145
Zhuze, T.P., 113–115, 137, 157
AUTHOR INDEX364

Subject Index
adhesion, 275
abnormality factor, 54
Abnormally-high formation pressure
(AHFP), 43, 52–55, 57, 59, 61, 63, 66,
201, 203
abnormally-low formation pressures (ALFP),
68
Absheron Archipelago, Azerbaijan,
213, 227
Absheron Peninsula and Archipelago,
58, 245
Absheron Archipelago rocks, 56
Acheson-Homeglen-Rimbey-Leduc reef
trend, 163, 187
adsorption water, 80
AHFP, 44, 60, 62, 64, 65, 107
Alberta, Canada, 37, 191
algal-lagoonal (sapropelic) oozes, 132
alginite, 119
alkalinity, 239, 240
alkaline waters, 73, 238, 292, 293
alkane hydrocarbons, 87
ALFP, 69
algo-humite, 119
ammonium, 79
anaerobic bacteria, 177
anisotropy, 215, 216, 218
anisotropy coefficient, 216–217
anticlinal reservoir, 201
Anastasyev-Troitsk Field (North Caucasus),
168
API gravity, 89
Arbuckle Limestone, 188
argon, 103
Arkansas, 188, 193
aromatic hydrocarbons, 88
arenes (aromatic hydrocarbons), 87
Arrhenius equation, 140
asphaltenes plus resins, 225–226
Azerbaijan, 225
Balakhany Formation, 217
Bazhenov Formation, Russia, 29, 144
Baku Archipelago, 58, 59, 63, 223, 229, 231,
245
barium, 79
basin, 147
basins underneath the World Ocean, 149
bentonite, 43
benzine fraction, 225
bitumens, 125, 126, 128, 129, 131
Boltzmann’s constant, 210
boron, 79
bottom water, 85
Braden South Field (U.S.), 101
breakthrough pressure, 182
bromine, 79
buoyancy, 107, 160, 200, 161–162, 167, 285
Buzachi Peninsula (North Caspian,
Kazakhstan), 96
calcium chloride type water, 78
caprock breakthrough potential, 31
capillary pressure, 30, 32, 74, 160, 277, 278,
283, 284
caprocks, 29–33, 150
capillarity, 275
capillary water, 80
carbon dioxide, 236
carbon isotope composition, 103
carbonate rocks, 260
carbonates, 40
carbonates caprocks, 34
catagenetically altered crude oils, 97
catagenetic maturity, 123
catagenetic stages, 127, 138
catagenesis, 121, 153
Caucasus Black Mountains, 81
chemical composition of oilfield waters, 76,
77, 93
clarke, 117
365

classification of systems, 10, 174, 207
classification of crude oils, 89, 91, 93, 95,
97, 99
classification of hydrocarbon accumulations
based on phase relationships, 180
classification of reservoirs, 36
classification of terrigenous rocks, 245
classifications of oil and gas accumulations,
173, 175
classifications of water, 76
clay content, 49, 220, 230, 233
closed combination-drive reservoirs, 193
coefficient of irreversible compaction, 253
coal maceral evolution, 120
coal thermolysis, 140
coalification factors, 121
coals, 120, 124
cohesion, 275
colloidal–emulsion solution, 72
combination-drive reservoirs, 191, 194
combustion heating value, 107
compaction, 39–41, 152, 154, 253, 255–257,
259, 260, 262
composition of crude oils, 94
composition of natural gases, 102
compressibility of natural gases, 107
condensates, 112–115, 176
conversion table, 90–91
concentration barrier, 159
contact angles, 276, 280, 281, 282, 284
cosmic origin, 199
Coulomb’s law, 53
critical-state accumulations, 184, 198
critical temperature, 113
critical-state fluid system, 178
crude oil, 87, 93–94, 97, 98, 230, 232, 241
crude oil parameters, 230, 231
cyclic paraffins (naphthenes), 87
Dashlary Formation, 239
deductive approach, 4
demulsification, 156
density, 22, 24, 94, 166, 228, 232, 234–236,
242, 243, 244, 257
depth of burial, 252, 254, 258
Desulfovibrio desulfuricans, 79
differential entrapment, 162, 164
diffusion, 157
dispersed, internal phase, 292
dispersion medium, 292
dissolution in compressed gases, 157
Dominikites, Bazhenovites, 127
Dogger sandstones, 217
Donyets Basin of Ukraine, 139
drive mechanism, 183, 185, 187, 189, 191, 193
dynamic geologic models, 250
dynamic geologic systems, 13, 249, 251, 253,
255, 257, 259, 261, 263, 265, 267, 269,
271
dynamic model, 268
dynamic viscosity, 244, 247
Eastern Pre-Caucasus (Russia), 168, 240
edge water, 182
effective/phase permeability, 289
elastic forces, 167
electrodiagenesis, 143
elision basins, 82
Emba Area (Russia), 126
emulsions, 156
energy in the oil generation, 141, 143, 145
energy of organic matter, 143
entropy, 210–215
endothermal reactions, 141
Entrada Sandstone, UT, USA, 28
epigenesis, 29
eruptions, 171
evaporite seals, 34
Excelsior Field, Alberta, Canada, 190
exinite, 123
exothermal reactions, 141
expulsion of oil, 152
factors determining the degree of
compaction, 261
faults, 182
field, 198, 199
film-type migration, 157
formal logic, 3, 5
formation, 19
formation water, 86, 237–238
formation volume factor (FVF), 71
fractures, 25–26, 30
gas accumulations, 175
gas column, 108
SUBJECT INDEX366
gas density, 106
gas migration, 286
gas solubility in oil, 177
gas viscosity, 109
gas-cap drive, 187, 188
gas-condensate accumulations, 176
gas-hydrate, 110
genetic potential, 131
genetic types of crude oils, 95, 96
geologic system, 15, 205
geochemical classification of crude oils,
97
geosystem identification, 12
geothermal gradient, 59
Gipsland and Cooper basins of Australia,
124
Goldsmith San Andres Dolomite Pool in
West Texas, 187, 188
grain-to-grain stress, 65
gravity-drainage, 191, 192
gravity segregation of oil and gas, 187
gravitational force, 161
gravity water, 80
H2S content, 103
hard water, 73, 239, 292
helium, 103
He/Ar ratio, 105
heat conductivity, 45, 71
heavy-mineral content, 243
Helium–Argon Technique, 170
Henry’s law, 178
heterogeneity, 154, 212–213, 215
heterogeneity entropy, 214
hierarchical classification, 6
huminite, 119
hydrate formation, 109
hydraulically trapped oil and gas
accumulations, 196
hydraulic forces, 196
hydraulic fracturing, 44, 182
hydrocarbon gases, 110
hydrocarbon reserves, 266
hydrofracturing, 140
hydrogen, 103
hydrogen sulfide geochemical facies, 136
hydrodynamic systems, 167
hydrogen isotopes, 75
hypergenetically altered crude oils, 97
hypergenetic alteration, 98
inductive approach, 4
Inert gases, 105
infrared spectroscopy, 98
intensity of subsidence, 265
inertinite, 119
interohuminite, 119
intuitive systems approach, 1
infiltration drive, 81–82
interfacial tension, 45, 280
intermediate water, 86
irreducible water, 277
Ishimbay group of fields, 37
isotope composition of natural gases, 103,
105
isotope composition of water, 75
Izbaskent Field, 114
Jamin effect, 160, 284
Kala Formation, 214, 255
Karachukhur–Zykh–Gousany–Gum
Deniz–Turkyany anticlinal trend, 214
kerogen, 118, 125, 126, 130–131, 141
kinematic viscosity, 244, 247–249
Kozeny–Carman equation, 220
lateral migration, 161
Leduc D-3 Pool, 193
lipid compounds, 125
liptinite, 119, 124
lithite, 241
lithofacies, 19
lithofluidal system, 208
lithogenesis, 121
Lopatin’s technique, 118
lower edge water, 85
Lower Kura Depression, 58–59, 63, 222, 223,
229, 231
lower water, 86
magnesium chloride type water, 78
main phase of oil and gas generation, 129
massive reservoirs, 37, 38
mathematical simulation, 209
SUBJECT INDEX 367

Maykop Formation (Krasnodar Region,
Russia), 85
mesocatagenetic zone, 139
methane, 236
methane–water system, 111
microcomponents of coals, 119
microoil, 137
migration-altered crude oils, 99
Milk River Field (Canada), 197
mixed base crude oil, 89
model of organism growth, 256
model of proportional effect, 251
modeling coefficients, 260
modeling in geology, 14
molecular solubility, 156
monoclines, 196–197
montmorillonite, 24, 58–59, 63–64, 222,
225
montmorillonite-to-illite transformation, 46,
57
Mount Holly Pool, 193
multidimensional models, 240
naphthenes, 88
naphthenic or asphaltic base crude oils, 89
natural gases, 101, 236
Neft Dashlary Formation, 225, 239
Neft Dashlary Oilfield, 225, 226, 238
nitrogen, 104
nitrogen content in gases, 101
nomogram, 246, 254
non-polar oil, 291
normalization equations, 260
normalization for natural factors, 262
normalized pressure, 84
oceanic environment, 150
offshore formations in Azerbaijan, 267,
272
oil and gas province, 151
oil window, 140
oil/water mobility, 271
oilfield waters, 77
oligomictic, 221
open combination-drive reservoirs, 191, 193
Ordovician, 199
organic matter (OM), 117, 119, 121–123, 125,
127
organic theory of oil generation, 135
organo-fluidoliths, 117
orthogonal and conjugated regression, 235
orthogonal regression, 234
osmosis, 65, 67–69
overburden pressure, 153
overpressure, 51
OWC, 73, 83–84
oxidation, 48
oxidation/reduction potential, 47
oxygen isotopes, 75
parameter, Ada, 223
paleotemperature, 49–50
Palmer’s characteristics, 241
Palvantash and Izbaskent fields of the
Fergana Basin (Uzbekistan), 112
paraffin base crude oil, 89
paraffin/naphthene ratio, 92
permafrost, 67
permeability, 22–23, 27, 39, 49, 215, 216, 218,
220, 230, 263, 269, 289
petroleum geology systems, 209
pH, 71
pH stability limits, 48
phase transformation, 112–113, 115
piezometric surface, 83
pinch-out pressure, 182
plate tectonics, 148
play, 147, 148
Poisson’s ratio, 39
polar oil, 291, 292, 293
polar substances, 73
porosity, 21, 27, 39, 220, 254, 258, 269
porosity of shales, 251, 253
potential energy, 31
pore-fluid pressures, 60, 268, 270, 271
pore pressure, 54, 153–154, 270
pore-pressure gradient, 55, 59
prediction of rock properties, 264
Priazov Series (Ukrainian Shield), 117
primary gas-condensate, 116
primary migration, 151, 152, 157, 160
probabilistic-statistical models, 221
Productive Series of Azerbaijan, 57, 61, 217,
221–222, 230, 233
productivity, 74
prospect, 148
SUBJECT INDEX368

radioactivity of water, 72
Rainbow Oilfield, 37
ratio [odd n-alkanes/even n-alkanes], 130
reserves evaluation, 266
residual water saturation, 269
Red Wing Creek Field, 199
Redwater Field, Alberta, Canada, 191, 193
Red-Bed Series of Turkmenistan, 268
relative permeability, 74, 289, 291–292
relative permeability curves, 73
reservoir rocks, 20–21, 23, 25, 27
reservoirs, 35, 37
resins plus asphaltenes, 226, 246
retrograde evaporation, 113
Reynolds number, 23
rock dilatancy, 65, 69
Romashkino Field, Russia, 165
Sakhalin Island, 126
salinity, 64, 75
salt deformation, 42
San Juan Field in Alberta, Canada, 85
sapropelic matter, 135
saturation pressure technique, 171
scanning electron microscope (SEM), 57
Schuler Jones Sand Pool, 189
secondary migration, 151, 158, 161
sedimentogenesis, 139
seismic data, 52
set, 5
Siberian Platform, 117
Slaughter San Andres Limestone Pool, 185
Smackover Limestone, 188, 189
Smackover Oolite Limestone, 193
solution gas drive, 184–185, 186
sodium bicarbonate type of waters, 78
sodium sulfate type of waters, 78
solubility isotherms of normal paraffin
hydrocarbons in methane, 115
solubility of gases in water, 110
solubility of hydrocarbon gases in crude oils,
111
source rocks, 137, 158
South Absheron Offshore Zone, 229, 231
South Caspian Basin, 53, 55, 58, 62, 64, 200,
217, 238, 267, 270
South Semivodskoe gas-condensate field
(West Siberia), 101
specific gravity of gas, 237
specific pore surface area, 21, 25, 219–220
stages of oil and gas generation, 139
stagewise transformation of organic matter,
138
static geologic systems, 208, 211, 213,
215, 217, 219, 221, 223, 225, 227,
229, 231, 233, 235, 237, 239, 241,
243, 245, 247
static system, 13
stereochemical studies, 88
stress vs. strain, 42
structural element, 200
structural maps, 268
sulfur, 94, 104
superdeep wells, 179
surface activity parameters, 224, 229–230,
233
surface tension forces, 278
surfactants, 72
sylvite (KCl), 63
synclines, 197
system, 2, 10, 11, 207
Systems Approach, 8–9, 11, 13,
15, 17, 206
taphrogene, 149
tectonic characteristics, 199
temperature, 42–43, 154
Tengiz Field, Kazakhstan, 37
ternary mixtures (water, oil, and gas), 290
theory of information, 210
thermodynamic alterations, 142
thermal diffusion, 158
three-phase flow, 290
tilted water–oil contacts, 165, 174
time factor, 14
time of formation of hydrocarbon
accumulation, 169
total energy, 7
total organic carbon (TOC), 117
tortuosity, 220
total overburden load, 65
transformation index, 130
trap, 36, 173, 174
trap classifications, 173, 174, 194
trapped oil globule, 283
Travis Peak Formation, Texas, 47
SUBJECT INDEX 369

trend, 147
two-branch capillary, 282
types of solutions, 11
upper water, 85, 86
vertical zonation, 198, 201–202
viscosity, 110
vitrinite, 124
vitrinite reflectance, 50, 121–122
volatile coalification products, 132
Volga-Ural Province, 82
volumetric technique, 170
vugs, 22, 285
water, 71, 72, 238
water drive, 188, 189–190
water block, 285
water chemistry, 62–63, 75
water density, 75
water – oil mixture, 92
water-drive pool, 190
water drive systems, 80, 83
water origin, 75
West Texas, 185, 188
wettability, 275–276
width of fracture, 26
World Ocean, 83
Young’s modulus, 44
zero energy surface, 83
zonation of oil and gas generation, 128
SUBJECT INDEX370