Embed Size (px)
Citation preview

GEOLOGIC ASSESSMENT OF DRILLING, COMPLETION, AND
STIMULATION METHODS IN SELECTED GAS SHALE PLAYS
WORLDWIDE
An Undergraduate Research Scholars Thesis
by
HARSH JAY PATEL
Submitted to Honors and Undergraduate Research
Texas A&M University
in partial fulfillment of the requirements for the designation as an
UNDERGRADUATE RESEARCH SCHOLAR
Approved by
Research Advisor: Dr. Zenon Medina-Cetina
May 2014
Major: Civil Engineering

TABLE OF CONTENTS
Page
ABSTRACT............................................................................................................... I
DEDICATION........................................................................................................... III
ACKNOWLEDGEMENT.......................................................................................... IV
NOMENCLATURE................................................................................................... V
CHAPTER
I. INTRODUCTION....................................................................................
1.1 Introduction to Unconventional Gas Reservoirs................................
1.2 Unconventional Gas Reservoir and “Energy Resource Triangle”.....
1.3 Contemporary view of the Gas Shale Play........................................
1.4 Research Objectives...........................................................................
II. GAS SHALE PROPERTIES...................................................................
2.1 Overview of Gas Shale System..........................................................
2.2 Review of Gas Shale Geologic Parameters........................................
2.2.1 Antrim Shale....................................................................
2.2.2 Barnett Shale....................................................................
2.2.3 Bakken Shale...................................................................
2.2.4 Canning Shale..................................................................
2.2.5 Cambay Shale..................................................................
III. COMPLETION AND STIMULATION METHODS.............................
3.1 Overview of Completion, and Stimulation Techniques.....................
3.1.1 Antrim Shale....................................................................
3.1.2 Barnett Shale....................................................................
3.1.3 Bakken Shale...................................................................
3.1.4 Canning Shale..................................................................
3.1.5 Cambay Shale..................................................................
IV. CONCLUSION........................................................................................
4.1 Summary of Gas Shale properties for each Shale..............................
2
2
2
3
4
6
6
7
9
16
23
29
34
39
39
39
41
42
43
44
45
47
REFERENCE............................................................................................................. 48

LIST OF FIGURES FIGURE Page
1.1 Energy Resource Triangle.............................................................................
1.2 World Shale Resource and the locations of the shale basins chose………
2.1 Geologic Parameters......................................................................................
2.2 Devonian Shale extents in Michigan Basin...................................................
2.3 Location of the Michigan Basin....................................................................
2.4 Cumulative Michigan Antrim Shale Production Trends 1989-2007.............
2.5 (A) Gamma Ray Log test for the Antrim Shale…………………………....
(B) Core Sample from the Antrim Shale…………………………………...
2.6 Antrim Shale sub-layers and relative depths.................................................
2.7 Mineralogy breakdowns for the Antrim Shale..............................................
2.8 Barnett Shale location in the Fort Worth Basin.............................................
2.9 Cross-section of the Barnett Shale and the Llano Uplift (outcrop)...............
2.10 Structure, top of the Barnett Shale.................................................................
2.11 Type log of the Barnett Shale........................................................................
2.12 (A) Stratigraphic column of the Fort Worth Basin........................................
(B) Core Sample from the Barnett Shale………………………………….
2.13 Mineralogy breakdowns for the Barnett Shale..............................................
2.14 Geographic extent of the Bakken Formation within the Williston Basin......
2.15 Generalized stratigraphic chart of the Williston Basin, Montana and ND....
2.16 Schematic stratigraphic cross-section of the Bakken Formation...................
2.17 (A) Type log of the Bakken Shale.................................................................
(B) Core Sample form the Bakken Shale…………………………………..
2.18 Principle structural elements of the Canning Shale………………………...
2.19 Stratigraphic sub-division of the Canning Basin…………………………...
2.20 Australia’s Prospective Gas Shale Basin…………………………………...
2.21 Location of the Cambay Shale……………………………………………...
2.22 General Stratigraphic of the Cambay Shale………………………………..
2
5
7
9
10
11
13
13
14
15
18
18
19
19
20
21
22
25
26
27
27
28
31
32
32
36
37

ABSTRACT
Geologic Assessment of Drilling, Completion, and Stimulation Methods in Selected Gas
Shale Plays Worldwide. (May 2014)
Harsh Jay Patel
Zachry Department of Civil Engineering
Texas A&M University
Research Advisor: Dr. Zenon Medina-Cetina
Zachry Department of Civil Engineering
The United States regularly imports the majority of the transportation oil, and several
TCF of natural gas annually (Agrawal, 2010). Nevertheless, it host a is very large
resource of natural gas in unconventional reservoirs, with over 2,200 TCF of natural gas
in just the gas shale formations that have been identified in the world energy consortium
(Holditch, 2006). The natural gas in shales and other unconventional reservoirs can be
easily used to generate electricity, or it can be turned into liquids and used by the
transportation industry. However, despite of its substantial economic advantage over
conventional gas plays, the petroleum industry is still having difficulty determining the
best drilling, completion, and stimulation methods to properly develop gas shale plays
worldwide (Agrawal, 2010). The underlying reason for this problem is hypothesized to be
due to the limitations to technological resources and data processing inference methods to
appropriately assess the geologic characteristics of the shale formations. Current methods
for selecting the best drilling, completion, and stimulation employs trial and error, to
verify what works best for each shale basin. Industry needs to develop a systemic
geologic and technical drilling methods to determine the best way to recover gas from a
shale play.
I

The objective of this research is to (1) identify key geologic parameters that affect
drilling, completion, and stimulation decisions for each gas shale play, and (2) present
these findings by the use of a summary table based decision making model, where a
logic-based decision model will reflect the carousal dependencies between the play’s
geologic characteristics and the efficiency of the technologies used.
Based on the literature review presented in this work for chosen gas shale basins, it has
been identified six key geologic constraints that influence drilling, completion, and
stimulation practices. These are (1) depositional environment, (2) total organic content
(TOC), (3) average gas content, (4) shale mineralogy, (5) shale thickness, and (6)
reservoir pressure (Agrawal, 2010). Next, I identified different drilling, completion, and
stimulation trends in the industry for the different shale plays.
II

DEDICATION
I dedicate this research to my parents. Without their support this research opportunity
would not have been possible.
III
ACKNOWLEDGEMENT
I would like to thank Dr. Zenon Medina-Cetina for his tremendous support. His teaching
has been paramount to the production of this thesis and my improvement as a student and
person.
IV

1
NOMENCLATURE
SGL Stochastic Geomechanics Laboratory
TCF Trillion Cubic Feet
TOC Total Organic Content
CBM Coalbed Methane
Mya Millions of Years Ago
VR Vitrinite Reflectance
SCF Standard Cubic Feet
EUR Estimated Ultimate Recovery
Wt. % Percent by Weight
OGIP Original gas-in-place
OHMS Open-hole Multistage Frac Systems
V
2
CHAPTER I
INTRODUCTION
1.1 Introduction to Unconventional Gas Reservoirs
Unconventional gas reservoirs are among the few gas reservoirs that are more difficult or
less economical to extract (Holditch, 2006). Usually, the technology inexistence is either
not developed fully or is too expensive to implement. Unconventional gas reservoirs are
commonly classified as tight gas sands, coalbed methane (CBM), or gas shale.
According to Agrawal (2010), the biggest effort to commercially produce unconventional
reservoirs wasn’t until the 1970’s when prices for natural gas began to increase. Increased
gas prices and diminished supply provided a valid economic reason to look at such
reservoirs. Beginning in 1970’s, the natural gas industry began serious development of
tight sand reservoirs in a number of basins across North America. After successful
development of tight gas sands, industry began producing gas from coal seams. Natural
gas from coal reservoirs required overcoming special challenges such as reservoir
characterization, project economics, and water handling. After a decade of work on CBM
reservoirs, the natural gas industry turned to produce gas from shale gas reservoirs.
However, the main difficulties of developing gas shale fields include drilling horizontal
and multilateral wells, generating massive hydraulic fractures, and gaining an in-depth
understanding in reservoir characterization (Agrawal, 2010).
1.2 Unconventional Gas Reservoirs and the “Energy Resource Triangle”
According to Holditch (2006), the desirability of the gas industry for unconventional
resource is best explained by the resource triangle. The effort to increase gas reserve in an
environment with high gas prices forces natural gas operators to look for fields of lesser
quantity. He also uses the resource triangle to demonstrate the value and importance of

3
unconventional reservoirs as compared to conventional reservoirs. As illustrated in
Figure 1.1, at the top of the “Energy Resource Triangle” are the high quality gas
reservoirs. These reservoirs are very few in quantity, but they appeal energy producers
given that their development is rather straightforward and economically feasible. Below
the high quality gas reservoirs are the medium quality reservoirs. The wider base of the
triangle displays the low quality reservoirs. This portion of the energy resource triangle
represents the unconventional gas reservoirs, those being the tight sands, gas shales, and
CBM. Unconventional gas reservoirs are characterized as low permeability, low quality
reservoirs. Low quality reservoirs contain extremely large volumes of gas in place as
compared to the high quality reservoirs at the top of the energy resource triangle.
Figure 1.1 “Energy Resource Triangle” depicting High quality, Medium Quality, and
Low Quality Gas Reservoirs (Holditch, 2006)
1.3 Contemporary view of Gas Shale Plays
According to Holditch (2006), the current method to optimize the gas recovery is through
trial and error. In order to determine the best recovery method that works best for each
shale basin, reservoir characteristics for the play must be known in advance. Reservoir
characteristics depend on several geologic parameters that include depositional

4
environment, total organic content (TOC), average gas content, shale mineralogy,
reservoir thickness, and reservoir pressure (Goodman & Maness, 2008) (Agrawal, 2010).
Knowing these geologic parameters is paramount to properly gauge each gas shale basin.
They also provide insight on how to optimally drill, complete, and stimulate a given well.
Most shale gas operators do not make use of the necessary resources to perform a
thorough study of the best drilling, completion, and stimulation methods for a given site.
This is why the common practice shows the use of limited technology and data inference
methods to properly assess recovery rates. However, if the necessary evidence becomes
easily accessible, gas shale development could increase without any potential obstruction.
Thus, appraising efficiency rate of different completion techniques could constructively
impact cost savings, such as implementing new technology for exploration, production,
processing, transportation, and storage operations of gas shale
1.4 Research Objectives
The objective of this research is to (1) identify key geologic parameters that affect
drilling, completion, and stimulation decisions for the Antrim Shale, the Barnett Shale,
the Bakken Shale, the Canning Shale, and the Cambay Shale (Figure 1.2); (2) present
these findings by the use of a summary table based decision making model, where a
logic-based decision model will reflect the carousal dependencies between the play’s
geologic characteristics and the efficiency of the technologies used.

5
Figure 1.2 World Shale Resource and the locations of the shale basins chosen for this
thesis (Kuuskraa, Stevens, Van Leeuwen, & Moodhe, 2011)

6
CHAPTER II
GAS SHALE PROPERTIES
2.1 Overview of Gas Shale Systems
Gas shale systems are very different other conventional and unconventional plays due to
the nature and practice of producing from the source rock. This makes it difficult to
choose the ideal drilling, completion, and stimulation methods for a gas shale reservoir.
Since the source rock in a gas shale reservoir is also the reservoir rock, the environmental
condition during the deposition of a shale rock must be anoxic to allow the organic
material to generate hydrocarbons with minimum oxygen contact. The shale undergoes
either biogenic or thermogenic, or both process to generate natural gas. Natural gas
generated through biogenic process is formed through the action of anaerobic
microorganisms. Natural gas generated through thermogenic process is formed through
the thermal breakdown of kerogen. The origin of natural gas in gas shales can be
determined using the Vitrinite Reflectance (VR) and core analysis test (Goodman &
Maness, 2008).
Gas shale rocks that are rich in organic matter are usually dark in appearance with high
TOC and gamma ray signatures. The porosity and permeability of any given shale rock
are function of compaction during the rock’s burial history. Typically, gas shale produces
natural gas that is stored as free gas in pores and fractures of the rock, or it produces
natural gas that is attached to the surface of the organic matter and is only released when
the reservoir pressure around the wellbore drops.

7
2.2 Review of Gas Shale Geologic Parameters
As illustrated in Figure 2.1, the main geologic parameters paramount in determining the
quality of a gas shale reservoir are depositional environment, TOC, average gas content,
shale mineralogy, reservoir thickness, and reservoir pressure.
Figure 2.1 Geologic parameters affecting the quality of gas shale reservoir
The depositional environment is a key geologic parameter in determining the
feasibility of producing from any shale gas reservoir. The shale depositional
environment affects how the hydrocarbons within the rock are formed, establish if
hydrocarbons are even present, and determines the type and quality of the
hydrocarbon that might exist in the shale.

8
TOC indicates the total quantity of organic material available for the formation of
hydrocarbons. It is directly proportional to the yield of gas, and allows evaluation
of organic matter transformation.
The average gas content indicates the amount of natural gas in place and is often
used to forecast what is recoverable. Shales with high average gas content also
have high gas permeability. On average, shales that are more porous and
permeable also contain more gas, and will allow gas production at much higher
rates than normal.
The presence of high clay content in a shale rock increases the difficulty of
fracturing and keeping a fracture propped open over the production time frame.
Whereas, the presence of high quartz content in a shale rock makes it more brittle
and easier to hydraulically fracture treat over the production time frame.
Shale thickness is another geologic parameter that greatly influences the
commercial production of the gas shale. It is difficult and uneconomic to produce
from shales that are less than 50 feet in thickness due to the overall area of contact
and minimal average gas content. Likewise, if shale thickness exceeds optimal
length, it becomes more difficult to determine the best layers to produce from.
Also, the efficiency of the horizontal drilling is further reduced in thicker shales,
unless the fracture treatments are pumped or multiple horizontal wells are drilled,
with both choices proving uneconomical.
Reservoir pressure of gas shale play indicates gas in place and possible net gas
recovery due to compaction. On average, the porosity and permeability of high-
pressure gradient gas shale is much higher than low-pressure gradient gas shale.

9
2.2.1 Antrim Shale
I. Summary of geologic parameter for the Antrim Shale formation
The Devonian Antrim Shale of the Michigan Basin resulted from vast Devonian-
Mississippian (360-410 Mya) “Black-Shale Sea” which deposited organic rich sediments
from the Transcontinental Arch in the west to the present day Appalachians in the east
(Oliver, Kuuskraa, Brnadenburg, Coates, & Kelafant, 1989) (Figure 2.2). The intra-
cratonic structure of the Antrim Shale extends below the Southern Peninsula of
Michigan, part of the Northern Peninsula of Michigan, and portions of Wisconsin,
Illinois, Indiana, Ohio, and Ontario in Canada (Oliver, Kuuskraa, Brnadenburg, Coates,
& Kelafant, 1989). The Michigan Basin is bounded by the Canadian Shield in the north,
by the Algonquin and Findley Arches in the east and southeast respectively, and by the
Wisconsin Highlands in the west and northwest (Oliver, Kuuskraa, Brnadenburg, Coates,
& Kelafant, 1989) (Figure 2.3). The center of the Michigan basin lies near the Saginaw
Bay (Oliver, Kuuskraa, Brnadenburg, Coates, & Kelafant, 1989) (Figure 2.3).
Figure 2.2 Devonian Shale extents in Michigan Basin with location of Antrim and
Otsego Counties in State of Michigan (Oliver, Kuuskraa, Brnadenburg, Coates, &
Kelafant, 1989)

10
Figure 2.3 Location of the Michigan Basin with respect to Findlay Arch and Appalachian
Basin (Oliver, Kuuskraa, Brnadenburg, Coates, & Kelafant, 1989)
As illustrated in Figure 2.4, according to a study conducted in 2008, it was concluded
that approximately 10,000 wells from Antrim Shale have produced over 2.6 TCF of gas
(Goodman & Maness, 2008). According to The estimated gas-in-place for the entire
Antrim Shale is estimated to range between 35 TCF to 76 TCF (Goodman & Maness,
2008). The Antrim Shale formation thickness ranges between 500 feet to 2000 feet
(Goodman & Maness, 2008). Wells in the Antrim Shale tap at 1,200-1,806 feet, but they
can range from 600-2,200 feet depending on the position of the well in the basin (Oil &
Gas Journal, 1994). The Michigan Basin extends approximately 122,000 sq. miles,
whereas the Antrim Shale formation extends approximately 30,000 sq. miles aerially
(Oliver, Kuuskraa, Brnadenburg, Coates, & Kelafant, 1989). Using VR test, and core
analysis test, it is concluded that the Antrim Shale is primarily biogenic gas shale as
opposed to thermogenic gas shale (Goodman & Maness, 2008). A biogenic natural gas is
formed from organic matter by the action of bacteria at a very shallow depth, whereas the
thermogenic natural gas is formed from organic matter in the rock under the influence of
heat deep inside under the earth.

11
Figure 2.4 Cumulative Michigan Antrim Shale Production Trends 1989-2007 (Goodman
& Maness, 2008)
Based on a study done in 1992 by Kuuskraa, the protrusions from Antrim Shale reveal
that the Antrim Shale rock is primarily black in color, and organically rich (due to the
biogenic origin). Also, the Antrim Shale is very brittle (due to high percentage of quartz),
radioactive, and also contains traces of bitumen (Kuuskraa, Wicks, & Thurber, 1992).
The radioactivity of the Antrim Shale protrusion is spotted through the gamma ray log
test.
II. In-depth enquiry of each geologic parameter for the Antrim Shale formation
a. Depositional Environment – The Antrim Shale lies between Transcontinental
arch in the west and Appalachian in the east (Oliver, Kuuskraa, Brnadenburg,
Coates, & Kelafant, 1989). The shale formation was deposited in the late
Devonian and early Mississippian geologic time period (Goodman & Maness,
2008). The Antrim Shale formation generated as a part of a large Devonian-
Mississippian “Black-Shale Sea” which deposited this highly organic formation
(Goodman & Maness, 2008). It is observed that the shale rises when moving from

12
the center of the basin to the shale margins. However, it shortens under a sheet of
glacial drift on land or under the lake sediment deposits of the Great Lakes
(Goodman & Maness, 2008). The absence of shale across the margins of the
Michigan Basin results from extensive erosion of continental interior during the
late Devonian geologic time period (Goodman & Maness, 2008). As illustrated in
Figure 2.6, The Antrim Shale formation is divided into four well-defined sub-
layers, those being the Upper Antrim, Lachine, Paxton, and Norwood (Agrawal,
2010). The Upper Antrim layer is at the top of the first black shale (i.e. Lachine)
beneath the Bedford formation (Agrawal, 2010). The Lachine layer is identified
through gamma ray log (Figure 2.5 (a)). Sudden ingress into the Lachine layer
indicates an increase in radioactivity. It lies below the Upper Antrim. The Paxton
layer is identified by a sharp decrease in the gamma ray log. It lies below the
Lachine layer. The Norwood layer is identified by a sharp increase in the gamma
ray log (Figure 2.5). Both, Lachine and Norwood, are organic rich black shale
(Figure 2.5 (b)) (Reeves, 1993). They are 80 and 20 feet in thickness,
respectively (Reeves, 1993).

13
Figure 2.5 (a) Gamma Ray Log test and Gutshick Classification for the Antrim Shale
(Oliver, Kuuskraa, Brnadenburg, Coates, & Kelafant, 1989)
Figure 2.5 (b) Core sample from Antrim Shale (Oliver, Kuuskraa, Brnadenburg, Coates,
& Kelafant, 1989)

14
Figure 2.6 Antrim Shale sub-layers and relative depths (Goodman & Maness, 2008)
b. Total Organic Content – Based on the study done in 1993, the organic content
of the Antrim Shale can be up to 20% (Matthews, 1993). The organic material in
the Antrim Shale is of algal source; the hydrocarbons in the shale formation come
from plant material rather than animals (Matthews, 1993).
c. Gas Content – The Antrim Shale is peculiar given that it has very low matrix
permeability and shows characteristics of a dual porosity reservoir (Kuuskraa,
Wicks, & Thurber, 1992). The average porosity throughout the Antrim Shale is
roughly around 9% (Agrawal, 2010). However, it can range from 3% to 10%
depending on the position in the basin (Agrawal, 2010). It doesn’t take into
consideration the absorbed gas in the reservoir. It is vital to know the amount of
absorbed gas that will be liberated when the reservoir pressure decreases as a
result of gas production. Approximately 60-70% of the Antrim gas shale system is
absorbed (Agrawal, 2010). Knowing the gas content is essential in determining
how much cubic feet of gas is in place per ton of rock. Based on the survey done
in 2008, it was concluded that the gas content for the Antrim Shale ranges
between 40 SCF/ton to 100 SCF/ton (standard cubic feet per ton) (Phasis
Consulting, 2008). The Estimated Ultimate Recovery (EUR) for the Antrim Shale

15
is between 20% and 60% (Phasis Consulting, 2008). If the recovery factor gets up
to 60%, it indicates that the absorbed gas within the shale is released (Phasis
Consulting, 2008).
d. Shale Mineralogy – The mineralogy of the Antrim Shale is relatively uniform
and contains both quartz and clay (Matthews, 1993). High quartz content in the
Antrim Shale makes the shale rock more brittle. This makes Antrim an ideal shale
formation for fracturing compared to the other shales. Antrim Shale contains 50%
to 60% quartz by composition (Matthews, 1993). Other constituents include illite,
kaolinite, chlorite, pyrite, calcite, and dolomite (Matthews, 1993). The Antrim
Shale also consists 0.2% to 0.8% of bitumen by composition (Matthews, 1993).
Figure 2.7 Mineralogy breakdowns for the Antrim Shale
e. Reservoir Thickness – The Antrim Shale is found at depths anywhere from 500
feet to 2000 feet. Deeper reservoir depths as located at the center of the Michigan
Basin and it gets shallower towards the margins of the basin (Phasis Consulting,
2008).

16
f. Reservoir Pressure – Based on a study done in 2005, the average reservoir
pressure for the Antrim Shale is approximately 400 psi at 1150 feet (Phasis
Consulting, 2008). Also, the pressure gradient in the Antrim Shale is expected to
range from 0.35 psi/ft. to 0.38 psi/ft. (Phasis Consulting, 2008).
2.2.2 Barnett Shale
I. Summary of geologic parameter for the Barnett Shale formation
The Barnett Shale, located in the Fort Worth Basin, is the most active gas shale in
the US. The Fort Worth Basin covers approximately 15,000 square miles of North
Texas (Figure 2.8). The Barnett shale stretches roughly 5,000 square miles and
has depth ranging from 6,500 feet to 8,500 feet deep (Givens & Zhao, 2008). The
first Barnett well was drilled in 1981, but the commercial drilling in the Barnet
Shale took off in 1990s (Brackett, 2006). The commercial drilling started
primarily due to higher gas prices in late 1980s for natural gas as well as
improvements in drilling technology. According to Airhart (2009), as of July
2008, wells in the Barnett Shale have produced about 7.5 TCF of gas. Estimated
gas in-place is between 25 TCF and 30 TCF. Fragments of the Barnett Shale are
also present in the Permian Basin. Due to the shale’s enormity, it is important to
look at all the shale properties before determining any analogy to other existing
plays. The majority of the wells in Fort Worth Basin are drilled in or around the
Newark East Field. The Newark East Field is bounded by the Muenster Arch in
the north and east, and Ouachita Structural Front in the east and south (Figure
2.10). The shale outcrops at the Llano uplift, which is located in the Central
Texas. Based on the number of wells drilling, and the production activity, Newark
East Field is the largest shale-gas field in the world (Givens & Zhao, 2008).

17
Through the use of VR and core analysis, it is concluded that the Barnett Shale is
capable of producing either gas or oil (Jarvie, Hill, Ruble, & Pollastro). The shale
rock produces thermogenic gas, and is black, organic rich, siliceous, and very
hard (Figure 2.12 (b)). Understanding potential gas recovery from the Barnett
Shale is difficult because of three primary factors.
1. It has layers with varying lithology. This makes it difficult to correlate
and characterize reservoir parameters regionally.
2. Shale rock has very intricate and multifaceted fracture system. This
makes it difficult to determine fracture length and how well the
wellbore is connected to the reservoir.
3. Regional faulting and underlying Ellenberger Karsting.
II. In-depth enquiry of each geologic parameter for the Barnett Shale formation
a. Depositional Environment – The depositional environment of the Barnett Shale
primarily consists of sedimentary rocks that were deposited during the
Mississippian (360 Mya) time period (Givens & Zhao, 2008). According to
Givens (2008), the deposition occurred likely due to the marine transgression that
originated by the closing of the Iapetus Ocean Basin. As illustrated in Figure 2.9,
the Barnett Shale is deposited on the Oklahoma Aulacogen, which subsided due
to the late Mississippian collision of the North and South American plates. The
foreland basin along the front of the thrust resulted as the Ouachita thrust belt
began to infringe upon the Barnett Shale sediments. The Barnett shale thickness
increases as we move to the Northeast direction of the basin. It is thickest just
south of Muenster Arch (Figure 2.10). The increased thickness in the formation
results from the interstratifications of the shale, limy shale, and limestone beds

18
that are unevenly deposited over the basin. Also, the Ordovician Viola
Limestone/Ellenberger Limestone lies below the Barnett Shale (Figure 2.11 and
2.12 (a)) (Givens & Zhao, 2008).
Figure 2.8 Barnett Shale location in the Fort Worth Basin (Givens & Zhao, 2008)
Figure 2.9 Cross-section of the Barnett Shale and the Llano Uplift (the black line in
Figure 2.8 represent the location of the cross-section depicted on a regional map)
(Agrawal, 2010)

19
Figure 2.10 Structure, top of the Barnett Shale (Tian & Ayers, 2010)
Figure 2.11 Type log of the Barnett Shale (Givens & Zhao, 2008)

20
Figure 2.12 (a) Stratigraphic column of the Fort Worth Basin (Givens & Zhao, 2008)

21
Figure 2.12 (b) Core Sample from the Barnett Shale (Givens & Zhao, 2008)
b. Total Organic Content – According to Loucks and Ruppel (2007), the organic
content present in the Barnett Shale can be as high as 12%, but on average it is
about 4.5%. Also, the variation in the TOC results primary due to varying
deposition of plants and animal deposition throughout the Shale basin.
c. Gas Content – According to Hayden and Pursell (2005), the total average
porosity of the Barnett Shale ranges from 3% to 8%, but on average it is about
5%. Nearly 70% to 85% of the gas in the Barnett Shale is found in the free-state,
meaning it can be extracted without any major artificial lift treatments.
Approximately 15% to 30% of all gas in the Barnett Shale is absorbed gas. Since
there is less gas that is absorbed, the gas content for the Barnett is higher than
most other shale plays. The EUR for Barnett Shale is approximately 10-20%
(Hayden & Pursell, 2005).
d. Shale Mineralogy – Although the Barnett Shale is called homogenous black
Shale, it contains an assortment of organic-rich lithofacies (Hickey & Henk,

22
2007). Most common lithofacies are either calcareous, siliceous, or phosphate in
composition (Figure 2.13). Hickey and Hank (2007), also state that the quartz
content in the Barnett Shale ranges from 40% to 45% of the original formation.
Whereas clay comprises of 20% to 40% of the formation, and the pyrite content
can be as high as 5%. Feldspar, calcite, dolomite, siderite, and ankerite, make up
the remaining minerals.
Figure 2.13 Mineralogy breakdowns for the Barnett Shale
e. Reservoir Thickness– According to Loucks and Ruppel (2007), the Barnett
Shale gas production occurs at depths of 6,500 feet to 8,500 feet. Shale formation,
thickness varies from 200 feet to 1000 feet. The net thickness varies from 100 feet
to 600 feet. The Upper Barnett is uniform in thickness, approximately 60 feet to
70 feet, and the Lower Barnett varies in thickness approximately more than 600
feet to less than 50 feet.
f. Reservoir Pressure – The original reservoir pressure of the Barnett Shale is
3,000 psi to 4,000 psi yielding a pressure gradient of approximately 0.42 psi/ft. to
23
0.46 psi/ft. (Hayden & Pursell, 2005). In general, shallower depths have lower
reservoir pressure. It is imperative to ensure there are no surface pressure issues to
prevent long-term production delay (Hayden & Pursell, 2005).
2.2.3 Bakken Shale
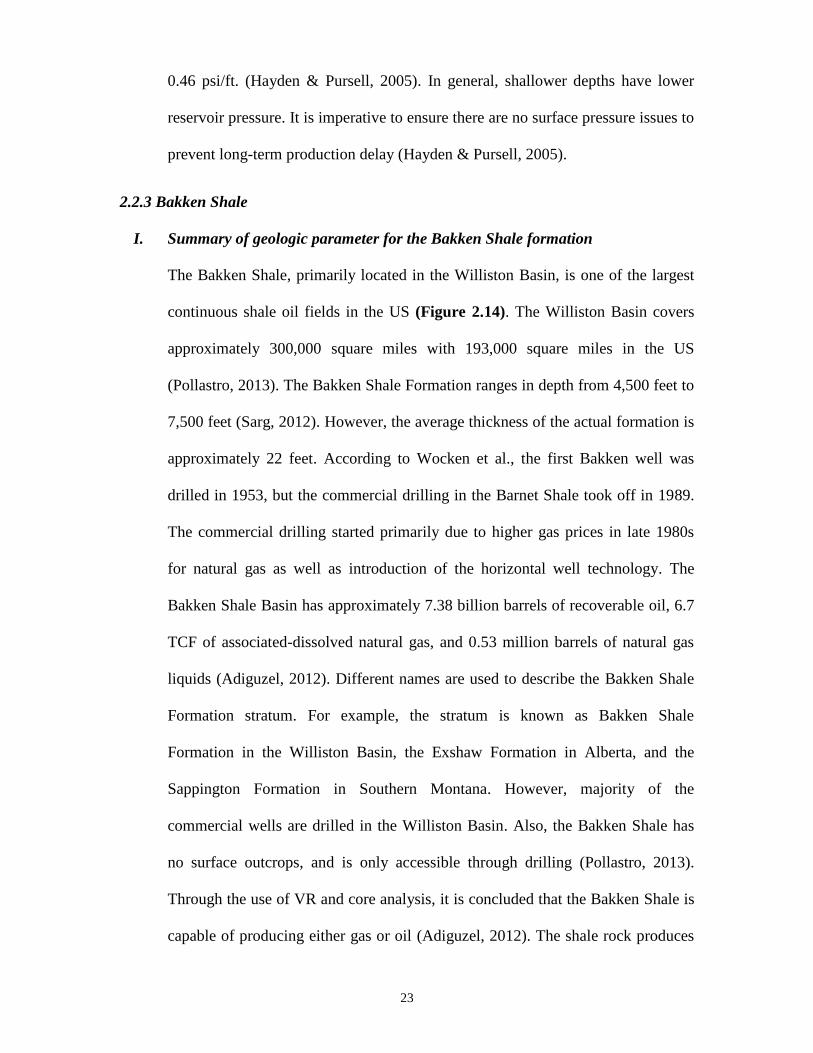
I. Summary of geologic parameter for the Bakken Shale formation
The Bakken Shale, primarily located in the Williston Basin, is one of the largest
continuous shale oil fields in the US (Figure 2.14). The Williston Basin covers
approximately 300,000 square miles with 193,000 square miles in the US
(Pollastro, 2013). The Bakken Shale Formation ranges in depth from 4,500 feet to
7,500 feet (Sarg, 2012). However, the average thickness of the actual formation is
approximately 22 feet. According to Wocken et al., the first Bakken well was
drilled in 1953, but the commercial drilling in the Barnet Shale took off in 1989.
The commercial drilling started primarily due to higher gas prices in late 1980s
for natural gas as well as introduction of the horizontal well technology. The
Bakken Shale Basin has approximately 7.38 billion barrels of recoverable oil, 6.7
TCF of associated-dissolved natural gas, and 0.53 million barrels of natural gas
liquids (Adiguzel, 2012). Different names are used to describe the Bakken Shale
Formation stratum. For example, the stratum is known as Bakken Shale
Formation in the Williston Basin, the Exshaw Formation in Alberta, and the
Sappington Formation in Southern Montana. However, majority of the
commercial wells are drilled in the Williston Basin. Also, the Bakken Shale has
no surface outcrops, and is only accessible through drilling (Pollastro, 2013).
Through the use of VR and core analysis, it is concluded that the Bakken Shale is
capable of producing either gas or oil (Adiguzel, 2012). The shale rock produces

24
thermogenic and biogenic gas, and is dark gray to brownish black, organically
rich, siliceous, and hard (Figure 2.17 (b)).
II. In-depth enquiry of each geologic parameter for the Bakken Shale formation
a. Depositional Environment – The Upper Devonian-Lower Mississippian (360-
410 Mya) Bakken Shale Formation in the Williston Basin extends from North
Dakota and Montana in the United States to Saskatchewan and Manitoba province
in Canada (Adiguzel, 2012). It is highly organic-rich, siliciclastic rock sequence
that is present only in the subsurface with in the central and deeper portions of the
Basin (Adiguzel, 2012). The Bakken Shale Formation is composed of three
informal members: the lower, dark gray to brownish black to black shale member,
the middle, calcareous–dolomitic sandstone and siltstone member; and the upper,
dark gray to brownish black to black shale member (Figure 2.17 (a) and 2.17 (b))
(Adiguzel, 2012). The shale members are source rocks for both conventional and
unconventional hydrocarbon resources (Adiguzel, 2012). Deposition of the
Bakken Shale Formation began during the Upper Devonian transgression in the
Williston Basin and across Rocky Mountain Shelf. Late Devonian stratum occurs
across much of Montana and Southern Canada (Adiguzel, 2012). However,
different names are used to describe the stratum in these areas. For example, the
stratum is known as Bakken Shale Formation in the Williston Basin, the Exshaw
Formation in Alberta, and the Sappington Formation in Southern Montana
(Adiguzel, 2012). The Williston Basin is an intracratonic Basin that extends
primarily from Northern United States (North Dakota, South Dakota and
Montana) to Southern Canada (Saskatchewan and Manitoba). It encompasses
approximately 300,000 square miles with 193,000 square miles in the US, totaling

25
to 200,000 cubic miles of sedimentary rock volume (Pollastro, 2013). The Bakken
Shale Formation was deposited during the Kaskaskia super sequence (Figure
2.15) (Adiguzel, 2012). Jurassic and Cretaceous marine strata of the Williston
Basin were deposited uncomformably over an eroded Paleozoic Surface.
Paleozoic strata are characterized by carbonate rock in the Williston Basin,
whereas siliciclastic rocks characterize Mesozoic and Cenozoic strata in the
Basin. The Bakken Shale Formation overlies the Upper Devonian Three forks
Formation on the basin flanks of the Williston Basin (Figure 2.15 and 2.16). The
Three Forks Formation is composed of sandstone, siltstone, shale, anhydrite, and
dolomite (Adiguzel, 2012).
Figure 2.14 Geographic extent of the Bakken Formation within the Williston Basin
(Wocken, Stevens, Almlie, & Schlasner)

26
Figure 2.15 Generalized stratigraphic chart of the Williston Basin, Montana and North
Dakota (Pollastro, 2013)

27
Figure 2.16 Schematic stratigraphic cross section from north to south across the
depositional margin of the Devonian-Mississippian Bakken Formation (the black line in
Figure 2.14 represent the location of the cross-section depicted on a regional map)
(Pollastro, 2013)
Figure 2.17 (a) Type log of the Bakken Shale (Pollastro, 2013)

28
Figure 2.17 (b) Core Sample from the Bakken Shale (Sar, 2012)
b. Total Organic Content – The Bakken Shale Formation is thought to be one of
the largest continuous oil fields in the US with 7.38 billion barrels of recoverable
oil, 6.7 TCF of associated-dissolved natural gas, and 0.53 million barrels of
natural gas liquids (EUR of 1.4%) (Adiguzel, 2012). Based on the TOC and
pyrolysis results of Bakken samples, lower and upper Bakken shales exhibit a
wide range in TOC. According to Jin and Sonnenberg (2012), TOC usually ranges
from 1 wt. % (percent by weight) at shallower basin margins up to 15 wt. % to 35
wt. % in the deeper basin, with an average of 20 wt. %. The high variation in
TOC results from mixed effects of the original depositional environment and
progressive post-depositional diagenesis and catagenesis (maturation). Based on
the Van–Krevelen analysis, Bakken Shale consist primarily Type I/II kerogen in
the center of the Basin, with type III kerogen input along the shallow east flank of
the Basin.
c. Shale Mineralogy – According to Sarg (2012), the mineralogy across all the
Bakken lithofacies is very similar and is dominated by dolomite, calcite, and

29
quartz. In general, majority of the Bakken Shale rocks show a diverse mineralogy
and are quartz rich. This along with the carbonate content play a significant role
in making the Bakken Shale brittle, and thus able to open and maintain natural
micro-fractures as well as induced hydraulic fractures from well completion.
d. Reservoir Thickness and Pressure – The Bakken Shale Formation ranges in
depth from 4,500 to 7,500 feet (Sarg, 2012). However, the average thickness of
the actual formation is approximately 22 feet (Sarg, 2012). The maximum
thickness of the Bakken Shale Formation occurs at the center of the Williston
Basin (140 feet) to a zero pinch out at the edges of the Basin.
e. Reservoir Pressure – According to Meissner, the original reservoir pressure of
the Bakken Shale is 5,600 psi yielding a pressure gradient of approximately 0.50
psi/ft. to 0.73 psi/ft. In general, shallower depths have lower reservoir pressure. It
is imperative to ensure that there are no surface pressure issues to prevent long-
term production delay.
2.2.4 Canning Shale
I. Summary of geologic parameter for the Canning Shale formation
The Canning Shale Basin, a partly marine gas shale basin, is located in the
northwestern Australia. According to Cadman et al., it covers approximately
230,000 square miles of northwest Australia. The prospective basin that is of
interest to shale developers stretches roughly 48,000 square miles in size and is
found at depths ranging from 3,300 feet to 16,500 feet, with an average of 12,000
feet. Exploration in the Canning Shale Basin began in 1922. However, the
commercial drilling did not commence until 1981. According to Tirhce and Bahar
(2013), as of December 2013, 307 wells have been drilled in the Canning Shale

30
Basin. Two major sub-formations of the Canning Shale Basin are the Goldwyer
and the Laurel formations. The Canning Shale Basin has approximately 764 TCF
of risked original gas-in-place (OGIP), with an additional 384 TCF of wet gas,
and 83.5 TCF of associated gas.
II. In-depth enquiry of each geologic parameter for the Canning Shale formation
a. Depositional Environment – The deposition of the Canning Shale began in the
early Ordovician (500 Mya) and ended in Cainozoic (66 Mya) geologic time
period. As illustrated in Figure 2.18 and 2.19, the shale basin underlies an area of
more than 230,000 square miles of northwest Australia and is internally
subdivided into a series of sub-basins, platforms, shelves, and terraces (Haines,
2004) (Cadman, Vuckovic, Pain, & le Poidevin, 1993). In the deepest part of the
basin, the sediments are estimated to be 11 miles in thickness (Bell Potter, 2011).
The Precambrian Kimberley Block bound the onshore portion of the basin to the
north, whereas the Pilbara and Musgrave Blocks, and the Amadeus Basin
(characterized by the upper Proterozoic sediments) respectively bound the
southern and eastern limits of the basin (Figure 2.19). Approximately one third of
the Canning Basin lies offshore in water depths of up to 1000m (Cadman,
Vuckovic, Pain, & le Poidevin, 1993). Transgressions from the northwest
deposited a uniform thickness of Ordovician sediments over most of the basin on
a Precambrian erosion surface (Figure 2.18). According to Cadman et al., paralic
sandstones and intertidal and subtidal shale, siltstone and carbonate were
deposited during this time period. The deposition slowed by the mid-Ordovician
time period, and fine grained clastics and carbonates were deposited in shallow

31
marine to subtidal areas. The sedimentation stage was followed by prolonged
regression and non-depositional time period over the whole Canning Basin.
Figure 2.18 Principle structural elements of the Canning Shale and its location (Haines,
2004)

32
Figure 2.19 Stratigraphic sub-division of the Canning Basin (Haines, 2004)
Figure 2.20 Australia’s Prospective Gas Shale Basin, Gas Pipeline, and LNG
Infrastructure (Kuuskraa, Stevens, Van Leeuwen, & Moodhe, 2011)

33
b. Total Organic Content – According to Cadman et al., the average organic
content present in the Canning Shale is low compared to other major shale basins.
The TOC ranges from 1.4% in the Upper Nambeet Formation to 0.46 – 6.40%
(mean 1.85%) in the Goldwyer Formation of the basin, with an average of 3%
throughout the basin. Approximately 90% of the organic matter in the Canning
Shale Basin originates from the cyanobacteria. Also, the high variation in the
TOC results primarily due to varying deposition of plants and animal matter
throughout the shale basin.
c. Gas Content – According to Tirche and Bahar (2013), the total average porosity
of the Canning Shale ranges from 0.6% to 30%, but on average it is about 2%.
Nearly 98% to 99% of the gas in the Canning Shale is found in the absorbed state.
This implies that the Canning Shale Basin is still immature for high profile
commercial activity.
d. Shale Mineralogy – The Canning Shale Basin primarily consists source rock
resulting from extensive marine deposition. Most common lithofacies are either
calcareous, siliceous, or carbonate in composition (Cadman, Vuckovic, Pain, & le
Poidevin, 1993). Due to high variation among the source rock, it is difficult to
generalize the mineralogy distribution for the basin. However, limestone,
dolostone, mudstone, and sandstone make up majority of the basin (Cadman,
Vuckovic, Pain, & le Poidevin, 1993).
e. Reservoir Thickness– According to Kuuskraa (2011), the Canning Shale Basin
gas production occurs at depths of 3,300 feet to 16,500 feet, with an average of
12,000 feet. The shale formation, thickness varies from 300 feet to 2,414 feet.

34
However, the net average thickness of the formation is approximately 250 feet. It
is most organically rich at 1,300 feet.
f. Reservoir Pressure – Based on several test done in the Canning Shale Basin,
operators have reported that the Canning Shale Basin is normally pressured shale
basin (Kuuskraa, Stevens, Van Leeuwen, & Moodhe, 2011).
2.2.5 Cambay Shale
I. Summary of geologic parameter for the Cambay Shale formation
The Cambay Shale Basin is a Late Cretaceous (66-138 Mya) to Tertiary-age (1.6-
66 Mya) gas shale basin in the State of Gujarat in northwestern India. It covers
approximately 20,656 square miles square miles, and stretches roughly 1,940
square miles in size (Sharma, Kulkami, Kumar, & Pankaj, 2010). It is found at
depths ranging from 6,000 feet to more than 13,000 feet, with an average of
10,000 feet. According to Kuuskraa et al., exploration in the Cambay Shale Basin
began in 1989. However, commercial drilling has not commenced as of today.
The Cambay Shale Basin has approximately 20 TCF of technically recoverable
natural gas. Based on the VR test, natural gas from the Cambay Shale Basin
classifies as biogenic (Dayal, Mani, Mishra, & Patil, 2013).
II. In-depth enquiry of each geologic parameter for the Canning Shale formation
a. Depositional Environment – The Cambay Shale Basin is an intracratonic (within
Indo-Australian craton), N-S rift basin situated in the western part of Indian
subcontinent. It is bounded by the Saurashtra uplift in the west and the Aravalli
ranges in the east (Figure 2.21) (Dayal, Mani, Mishra, & Patil, 2013). It formed
during Late Mesozoic (66-240 Mya) era with the development of major tensional
faults following widespread extrusion of the Deccan Trap basalt. The Cambay

35
Shale Basin spreads over an area of about 20,656 square miles and extends into
Rajasthan in north, and into the shelf of Arabian Sea through the Gulf of Cambay
in south (Dayal, Mani, Mishra, & Patil, 2013). The Cambay sequence comprises
of greywacke, dark grey to black grey shales, coal cyclothems, silts, fine to
medium grained sands and grey reddish-brown clays. The entire basin is
longitudinally divided into five major tectonic blocks by transverse basement
faults within the Deccan traps, and is divided into eleven stratigraphic formations
(Figure 2.21 and 2.22) (Dayal, Mani, Mishra, & Patil, 2013).

36
Figure 2.21 Location of the Cambay Shale (Sharma, Kulkami, Kumar, & Pankaj, 2010)

37
Figure 2.22 General Stratigraphic of the Cambay Shale (Sharma, Kulkami, Kumar, &
Pankaj, 2010)
b. Total Organic Content – According to Kuuskraa (2011), the average organic
content present in the Cambay Shale averages to 3%, which is considered mature
for shale basins similar to that of Cambay. However, it ranges from 1% to 4%
(Padhy & Das, 2013). Also, the organic matter is characterized by Type II and III
kerogen, which is suitable for generation of gas (Dayal, Mani, Mishra, & Patil,
2013).
c. Shale Mineralogy – The Cambay Shale Basin primarily consists of black shale.
Most common lithofacies are either calcareous or siliceous (Kuuskraa, Stevens,
Van Leeuwen, & Moodhe, 2011). Due to high composition of quartz, source
rocks in the Cambay Shale Basin are easier to fracture.
d. Reservoir Thickness– According to Kuuskraa (2011), the Cambay Shale Basin
gas production occurs at depths of 6,000 feet to more than 13,500 feet, with an

38
average of 10,000 feet. The shale formation, thickness varies from 300 feet to
3,000 feet. However, the net average thickness of the formation is approximately
500 feet.
e. Reservoir Pressure – Based on several test done in the Cambay Shale Basin,
operators have reported that Cambay Shale Basin is moderately over-pressured
shale basin (Kuuskraa, Stevens, Van Leeuwen, & Moodhe, 2011).

39
CHAPTER III
GAS SHALE PROPERTIES
3.1 Overview of Drilling, Completion, and Stimulation Techniques
For gas shale plays, as with most convention plays, there is a learning curve that gas shale
operators must undergo before drilling, completion, and stimulation operations can be
optimized. Due to technical limitations, there have been many failures and uneconomic
wells drilled and completed in every gas shale play. But as technology improves and
more experience is gained, the success and economic of the well completions continues
to improve. Failures often include anything from losing a wellbore to ending up with a
sub-economical well (Agrawal, 2010). The second objective of my research is to review
the literature to determine the best practices for drilling, completing and stimulating wells
in all of the selected gas shale plays. Then using the geologic and reservoir characteristics
established in Chapter II, I have a summary table, to help operators obtain a first
qualitative assessment to relate drilling technology with current geologic shale
characteristics, complete and stimulate the next well in a gas shale play.
3.1.1 Antrim Shale
According to Goodman and Maness (2008), the Antrim Shale is one of the first shale gas
productions in the United States, coming in-place in 1926. One of the main differences
between the Antrim Shale and the other shales is the amount of water it produces. On
average, 110 barrels of water is produced each day from the Antrim Shale (Goodman &
Maness, 2008).
The first wells in the Antrim Shale were drilled in its Lachine layer, and utilized an open-
hole completion method (Goodman & Maness, 2008). Wells were not drilled deeper into
the Traverse zone (geologic zone capable of producing gas) in the fear that the water

40
production was coming from the Traverse zone. As water production increases it lower
bottomhole pressure, which further reduces gas production. However, it was later
discovered that the water was actually in the shale fractures, and that drilling the traverse
zone was safe and acceptable. Given that, due to these recent discoveries, wells are now
drilled vertically, and cased and selectively perforated using the spot acid. The geology of
the Antrim Shale virtually requires all of the wells in the Antrim Shale to be fracture
stimulated with a multistage treatment that has an average number of fractures anywhere
from two stages to five stages treatment (Goodman & Maness, 2008). Most common
stimulation design in the Antrim Shale is N2 foam that carries about 25,000 to 50,000 lbs.
of 20/40 sand in the fracture (Goodman & Maness, 2008). Today, the cost for drilling and
completion in the Antrim Shale ranges from $200,000 to $700,000 per well (Phasis
Consulting, 2008). The enhanced ultimate recovery (EUR) per 80 acres in the Antrim
Shale, using vertical wells, is 500 MMCF. Due to its relatively simple geology and
structural setting, the use of horizontal wells is limited in the Antrim Shale. Following
factors contribute to this decision:
a. The cost of drilling in the Antrim Shale is very minimal. The Antrim Shale vertical
wells cost about $350,000 to drill and complete given that the formation is shallow.
b. The reservoir pressure in the Antrim Shale is low (400 psi), so there could be issues
with wellbore stability.
c. Horizontal wells are difficult to operate long-term due to high water production. They
would water out very early in the life of the well, meaning that water higher water
production will inhibit gas production.

41
3.1.2 Barnett Shale
The Barnett Shale had only 100 vertical wells completed during the 1980s. According to
Martineau (2009), during this time frame, the vertical wells were fracture treated with
around 200,000 gallons of cross-linked gel fluid and approximately 300,000 lbs. of sand,
which was usually 20/40 mesh. With such fracture treatment design, the initial production
for most of these wells were anywhere from 600 MCF/D to 700 MCF/D on average. The
size of the average fracture treatment increased to 1,000,000 gallon of cross-linked gel
fluid and 1,000,000 lbs. of sand, which resulted in initial production of about twice those,
achieved with the smaller fracture treatments. By 1990s, there were more than 2,000
wells drilled in the Barnett Shale. This was primarily due to the fact that changes were
made in the fracture stimulation designs.
As drilling activity picked up in the Barnett, operators in the Fort Worth Basin started
fracturing with N2
and eventually moved to fracturing with 123,000 gals of CO2
foam and
188,000 lbs. of Ottawa sand. According to Agrawal (2009), the most successful
stimulation treatment and widely used since the early 2000s is 31,000 gals of slick water
and about 95,000 lbs. of 20/40 Ottawa sand.
In 2002, many operators shifted their focus to drilling horizontal wells and steered away
from drilling vertical wells. In the early stages of horizontal drilling in the Barnett Shale,
operators looked at both cemented and uncemented laterals. Uncemented laterals soon
phased out due to the fact that shorter laterals were required thus leading to less number
of fracture stages and fracture stimulations in the uncemented lateral were difficult to
design and understand. As such, most wells today are completed with cemented laterals
to maintain better control on where the hydraulic fractures are created. As drilling
horizontals became increasingly common, many operators moved up the learning curve

42
on fracture stimulation rather quickly due to information shares, conferences, and
relationships with service companies.
According to Agrawal (2010), the general design for a Barnett horizontal has been to
drill a 3000 ft. to 4000 ft. lateral and then place a fracture treatment every 500 ft. or
so down the lateral. As a result, it is common to pump 6 to 10 fracture treatment
stages in any one wellbore. For the total well, it would not be uncommon to pump
1,000,000 gallons of slick water carrying 300,000 lbs. of sand in each stage. The
sand is normally 20/40, 40/70 or 100 mesh. Generally, a 4-1/2” or 5-1/2” casing is
run-in-hole in lateral potion of the well so that average pump rate is anywhere from
40 to 120 BPM.
3.1.3 Bakken Shale
Since its discovery, the Bakken has gone through a number of drilling and completion
phases. According to Zander et al., the first phase involved drilling vertical wells in
1960s in the Antelope Field, North Dakota. The practice continued until 1980s. The first
horizontal well in the Bakken was completed in 1987 in Billings County with a pre-
perforated, or slotted liner.
Today, the Bakken is completed primarily with two types of open-hole, multistage
fracturing methods. The first method, or the offset method, uses external packers run on
the casing to provide annular isolation between stages, and composite bridge plugs for
isolation (Zander, Czehura, Snyder, & Seale, 2010). The bridge plugs are run in hole and
set via pump-down wireline or coiled tubing, followed by perforating and then fracturing
the well to provide access to the reservoir. After all stages have been completed, CT
issued to drill on the composite plugs to reestablish access to the horizontal wellbore.

43
The second method involves running open-hole multistage fracturing systems (OHMS)
(Zander, Czehura, Snyder, & Seale, 2010). OHMS uses external packers to isolate
sections of the wellbore. The wells analyzed for this research specifically used
hydraulically activated, mechanical-set open-hole packers. The major advantage of
OHMS is that all the fracture treatments can be performed in a single, continuous
pumping operation without the need for drilling or wireline/CT services, saving time and
costs.
Previous study also demonstrates that the use of OHMS completion systems in wells
targeting the Bakken Formation provides higher production and lower water cut than
other completion methods. OHMS completed wells increased cumulative production and
reduced water cut compared to offset wells.
Stage number evaluations also suggest that increasing OHMS stage completion also
increases the production. Evaluation of the effect of stage length on production indicates
that the shorter stage spacing outperforms the longer interval. This concludes to the
generality, that more fracture stages and shorter stage spacing in the Bakken Formation
leads to higher production.
3.1.4 Canning Shale
Unlike other gas shale plays, no real production data exists for the Canning Shale.
Exploration activities in this gas shale play commenced fairly recently, so only
simulation data exists. A sensitivity analysis performed to investigate the effect of key
parameters on the NPV, recovery factor and cumulative gas production in the Canning
Shale suggests that despite the high costs associated with drilling and fracturing and the
relatively low gas content shale gas development in the Canning Shale can be profitable
in the long run. According to Godeke and Hossain (2012), simulation also suggests that

44
horizontal well lengths of 2,000 m to 3,000 m are optimum to maximize gas production.
Longer completions extend plateau production and can affect the optimum stimulation
stages.
For a 2,500 m long horizontal well, with fracture half-length of 500-ft and a
dimensionless fracture conductivity of 100, the optimum number of hydraulic fracture is
10. No data on the best fracture fluid selection exists as of today.
3.1.5 Cambay Shale
Two wells, D-A and D-B, in the Dholka field were identified for hydraulic fracturing as
first ever attempt in India to produce the huge untouched unconventional resource of
shale gas present in the Cambay Basin.
According to Sharma et al., due to economic setback and completion limitations in India,
both wells were fractured with cross-linked guar gel, 20/40 sand, and YF130 treating
fluid. Based on the swelling properties of the shale, a 4% KCL is used as the baseline
fluid for the treatment.
Before hydraulic fracturing, the well D-A had shown no production of any oil from the
shale section. However, after hydraulic fracturing, the shale play in well D-A is
producing at a stabilized production of around 300 m3/day of shale gas and 2 m
3/day of
shale oil. In the well D-B, the shale play was newly completed and hydro-fractured and it
produced a stabilized rate of 600 m3/day of shale gas and 2 m
3/day of shale oil (Sharma,
Kulkami, Kumar, & Pankaj, 2010). Drilling of horizontal wells and multistage hydraulic
fracturing will increase recovery and economic viability to produced shale gas for longer
periods of time.

45
CHAPTER IV
CONCLUSION
After analyzing the geologic parameters and the available drilling, completion, and
stimulation technologies available for each gas shale play, the following conclusions are
generated:
A comprehensive, systematic evaluation of completion techniques in gas shale is
crucial to the energy industry given that gas shale plays will be an important global
resource for the 21st century. This need has sparked interest in what makes up a
commercially viable gas shale play.
By doing geologic characterization of the Antrim Shale, Barnett Shale, Bakken Shale,
Canning Shale, and Cambay shale, this research analyzes the similarities as well as
the difference in the key parameters for gas shale worldwide. From the literature
review, the key geologic parameters include depositional environment, depth, TOC,
gas content, clay content, quartz content, shale mineralogy, reservoir pressure
gradient, and reservoir thickness.
Table 4.1, shown in section 4.1, and Chapter II summarizes the geological parameters
and available technologies that are found for the five shales evaluated, respectively.
As seen, the stark difference between some of this shale allows comparing how gas
shale, its exploration, and its extraction in United States compare with ongoing gas
shale activities worldwide (i.e. in Asia and Australia).
The shale formations chosen for this research are representative of how the shale gas
industry and related technologies evolved over time (from 1950s (Antrim) to 2012
(Cambay)). For example, Antrim Shale was the first gas shale formation that was
fully exploited for commercial production. Whereas, compared to the Antrim Shale,

46
Cambay Shale in India is a fairly new gas shale formation with little to no
commercial production. The application of stimulation and completion technologies
in these two shale formations are very different i.e. more sophisticated technologies
are used in the Cambay Shale to do preliminary evaluation.
Also, the gas shale formations chosen for this research were randomly picked from a
larger pool with some restrictions. Three different constraints were considered when
choosing the gas shale formation. One of the main constraints was the evolution of
stimulation and completion technologies. Since the first gas shale well was developed
in the Antrim Shale, it was fundamental to include it as a control standard to compare
other gas shales with. The second constraint that was considered was the depth and
thickness of the shale and shale basin. Each gas shale chosen for this research
represent varying depths to give a broader perspective regarding the development in
deeper versus shallower shale basins. The third constraint was the location of the gas
shale basin. The capital available for gas shale development on each continent varies
drastically. To avoid bias, three gas shale basins from North America and one from
Australia and one from India were randomly selected to monitor how gas
development correlates with amount of capital available for investment in developing
the shale basin. For example, compared to the United States, India and Australia don’t
have strong capital or funding to develop commercial gas shale for production.
Also, the gas shale technologies evaluated in this research were not all the same. With
the learning curve that the industry has climbed over the years and data limitations,
there are some things that were not tested because of the economic viability and time
constraint. With development in newer technology, these plays will become more
competitive with other conventional plays in differing economic environments but

47
this should not stop operators from testing different shale plays not only in the U.S.
but throughout the globe since this could one day become one of the primary
resources for gas production.
4.1 Summary of Gas Shale properties for each Shale
Table 1 Summary of Key Properties from Five Shale Gas Basins
Property Antrim Shale Barnett Shale Bakken Shale Canning Shale Cambay Shale
Basin Michigan Fort Worth Williston Perth Cambay
Primarily Gas or Oil
Shale Gas Both Both Gas Gas
Primary Depositional
Environment Continental Continental Continental Oceanic Continental
Geologic Time
Period Devonian Mississippian
Devonian-
Mississippian Ordovician Cretaceous
Basin Area, sq. miles 122000 15000 300000 230000 20656
Formation Area, sq.
miles 30000 5000 53000 48000 1940
Depth, ft. 600-2200 6500-8500 4500-7500 3300-16500 6000-13000
Gas Type
(Thermogenic or
Biogenic gas) Biogenic Thermogenic Both Biogenic Thermogenic
Thickness, ft. 500-2000 200-1000 Variable 3300 300-3000
TOC, % 20 12 1-15 1.14 3
Gas-in-Place, TCF 40-100 120-150 6.7 764 20
Reservoir Pressure,
psi 400 3000-4000 5600 Normal
Moderately
over-pressured
Reservoir Pressure
Gradient, psi/ft. 0.35-0.38 0.42 0.50-0.73 Normal
Moderately
over-pressured
EUR, % 20-60 10-20 1.4 Not estimated Not estimated
Oil-In-Place, billion
barrels N/A Not estimated 7.38 N/A N/A

48
REFERENCE
Adiguzel, Z. (2012). Correlation and Stratigraphic Analysis of the Bakken and Sappington Formations in
Montana. Texas A&M Univeristy, Department of Geology and Geophysics. College Station:
Texas A&M Univeristy.
Agrawal, A. (2010). A Technical and Economic Study of Completion Techniques in Five Emerging US
Gas Shales. College Station, Texas, United States of America: Texas A&M University.
Airhart, M. (2009, February). Barnett Boom Ignites Hunt for Unconventional Gas Resources. JSG.
Bell Potter. (2011, December 9). Australian Shale Overview. Australia.
Brackett, W. (2006, October). Developing the Marcellus Shale: What We've Experienced in the Barnett
Shale. Powell Barnett Shale Newsletter.
Cadman, S. K., Vuckovic, V., Pain, L., & le Poidevin, S. R. (1993). Australian Petroleum Accumulation
Report 9 - Canning Basin, W.A. Petroleum Resource Branch, Department of Primary Industries
and Energy.
Dayal, A. M., Mani, D., Mishra, S., & Patil, D. J. (2013, January 31). Shale Gas prospects of the Cambay
asin, Western India. GeoHorizons.
Givens, N., & Zhao, H. (2008, October 15). The Barnett Shale: Not So Simple After All.
Godeke, S., & Hossain, M. M. (2012, January 23-25). Simulation of a Shale Gas Field Development: An
Example from Western Australia. SPE International.
Goodman, W. R., & Maness, T. R. (2008, April 23). Michigan’s Antrim Gas Shale Play—A Two-Decade
Template for Successful Devonian Gas Shale Development. San Antonio, Texas, United States of
America: AAPG Annual Convention. Retrieved June 24, 2013, from
http://www.searchanddiscovery.com/documents/2008/08126goodman/ndx_goodman.pdf
Goodman, W. R., & Maness, T. R. (2008, April 23). Michigan's Antrim Gas Shale Play - A Two-Decade
Template for Successful Devonian Gas Shale Development. AAPG.
Haines, P. W. (2004). Depositional Facies and Regional Correlations of the Ordovician Goldwyer and
Nita Formations Canning Basin, Western Autralia with Implications for Petroleum Exploration.
Geological Survey of Western Australia, Department of Industry and Resources, Perth.
Hayden, J., & Pursell, D. (2005, October). The Barnett Shale Report: Visitor Guide to the Hottest Gas Play
in the US. Retrieved from www.tudorpickering.com/pdfs/TheBarnettShaleReport.pdf
Hickey, J. J., & Henk, B. (2007, April). Lithofacies summary of the Mississipian Barnett Shale, Mitchell 2
T.P. Sims well, Wise County, Texas. AAPG, 91(4), 437-443.
Holditch, S. A. (2006, June). Tight Gas Sands. Journal of Petroleum Technology Supplement, 86.
Jarvie, D., Hill, R. J., Ruble, T. E., & Pollastro, R. M. (n.d.). Unconventional shale-gas systems: The
Mississippian Barnett Shale of north-central Texas as one model for thermogenic shale-gas
assessment. 91(4), 475-499.
Jin, H., & Sonnenberg, S. (2012, July 2). Source Rock Potential of the Bakken Shales in the Williston
Basin, North Dakota and Montana. Search and Discovery.
49
Kuuskraa, V. A., Wicks, D. E., & Thurber, J. L. (1992, October 4-7). Geologic and Reservoir Mechanisms
Controlling Gas Recovery From the Antrim Shale. Society of Petroleum Engineers(24883).
Kuuskraa, V., Stevens, S., Van Leeuwen, T., & Moodhe, K. (2011). World Shale Gas Resources: An Initial
Assessment of 14 Regions Outside the United States. U.S. Energy Information Administration,
Office of Energy Analysis. Washington, D.C.: U.S. Department of Energy.
Loucks, R. G., & Ruppel, S. C. (2007, April). MIssissippian Barnett Shale: Lithofacies and depositional
setting of a deep-water shale-gas succession in the Fort Worth Basin, Texas. AAPG, 91(4), 579-
601.
Martineau, D. (2009, March 18). The expansion of the Barnett Shale Play in the Fort Worth Basin. AAPG.
Matthews, R. D. (1993). Petroleum Geology of the Devonian and Mississippian Black Shale of Eastern
North America. United States of America: Geological Survey.
Meissner, F. (n.d.). Petroleum Geology of the Bakken Formation Williston Basin, North Dakota and
Montana. Filon Exploration Corporation. Denver: Filon Exploration Corporation.
Oil & Gas Journal. (1994, May 30). Antrim Gas Play, Production Expanding in Michigan. Unconventional
Oil & Gas. Oil & Gas Journal.
Oliver, S. P., Kuuskraa, V. A., Brnadenburg, C. F., Coates, J.-M. P., & Kelafant, J. R. (1989, June 7-9). The
Antrim Shale of the Michigan Basin: An Active Devonian Shale Gas Play. Society of Petroleum
Engineers(19104).
Padhy, P. K., & Das, S. K. (2013, January 25). Shale Oil and Gas Plays: Indian Sedimentary Basins.
GeoHorizons.
Phasis Consulting. (2008, September). US Shale Gas Brief. Unites States of America: Phasis Consulting.
Phasis Consulting, :. (2008, September). US Shale Gas Brief. United States of America: Phasis Consulting.
Retrieved June 24, 2013, from www.phasis.ca
Pollastro, R. M. (2013). Geologic Assessment of Technically Recoverable Oil in the Devonian and
Mississippian Bakken Formation. In R. M. Pollastro, Assessment of Undicsovered Oil and Gas
Resources of the Williston Basin Province of North Dakota, Montana and South Dakota. Reston,
Virginia, United States of America: USGS.
Reeves, S. R. (1993, March 21-23). Production Optimization in the Antrim Shale. Society of Petroleum
Engineers(25461).
Sarg, J. F. (2012). Bakken-An Unconvetional Petorleum and Reservoir System. United States Department
of Energy, National Energy Technology Laboratory. Golden: Colorado School of Mines.
Sharma, S. S., Kulkami, P. K., Kumar, A., & Pankaj, P. (2010, November 1-3). Successful Hydrofracturing
Leads to Opening of New Frontiers in Shale Gas Production in the Cambay Basin in Gujarat,
India. SPE International.
Tirche, N. E., & Bahar, M. (2013, November 11-13). Shale Gas Volumetrics of Unconventional Reosurces
Plays in the Canning Basin, Western Australia. SPE International.
Wocken, C. A., Stevens, B. A., Almlie, J. C., & Schlasner, S. M. (n.d.). End-Use Technology Study-An
Assessment of Alternative Uses for Associated Gas. National Energy Technology Laboratory.
North Dakota Industrial Commission.
Zander, D., Czehura, M., Snyder, D., & Seale, R. (2010, November 1-3). Well Completion Optimization in
a North Dakota Bakken Oilfield. SPE International.


![03 Drilling& Completion Dj.ppt [Compatibility Mode]](https://img.pdfslide.us/doc/110x75/55cf9a9c550346d033a28ef9/03-drilling-completion-djppt-compatibility-mode.jpg)