Embed Size (px)
Citation preview
Geography (and more) @
Bristol
October, 2015
Prof. Jemma Wadham
School of Geographical Sciences, University of Bristol

Outline
• A bit about Bristol
• Studying Geography (and more) at
University in the UK
• A “taste” of Geography

LondonBristol
Easy access via London
(1:45 by train)
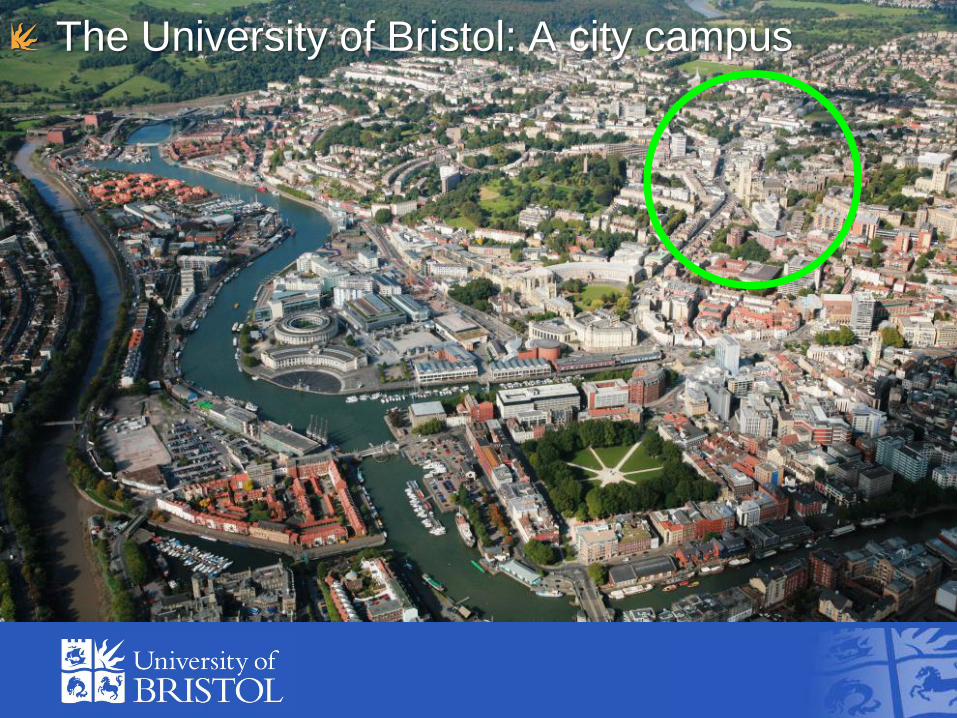
The University of Bristol: A city campus

An international, comprehensive university
Six Faculties:
• Arts & Modern Languages
• Engineering
• Medicine & Dentistry
• Medical & Veterinary Sciences
• Social Sciences & Law
• Science
• Students from >120 countries
• 400 Chinese Undergraduates, 900 Postgraduates
Geography
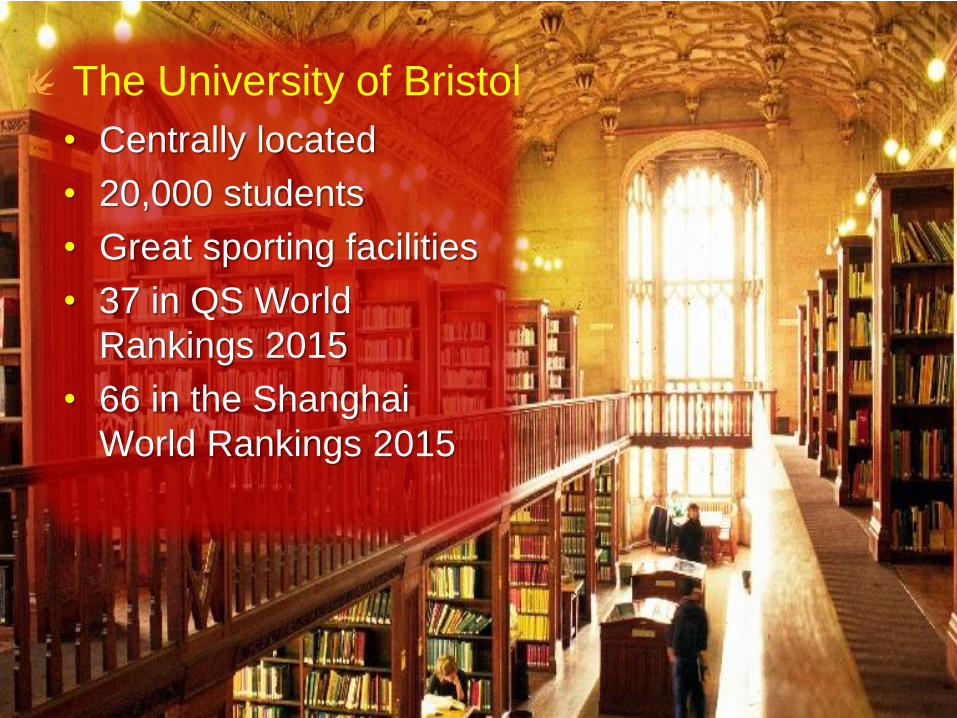
• Centrally located
• 20,000 students
• Great sporting facilities
• 37 in QS World
Rankings 2015
• 66 in the Shanghai
World Rankings 2015
The University of Bristol

Bristol – Best University voted for “City Life” by
the WhatUni awards 2015
• Port city founded 1,000 years ago
• Rich history of trade & industry
• Population of 500,000
• Capital of the southwest of England
• Multicultural city
• Direct trains to London

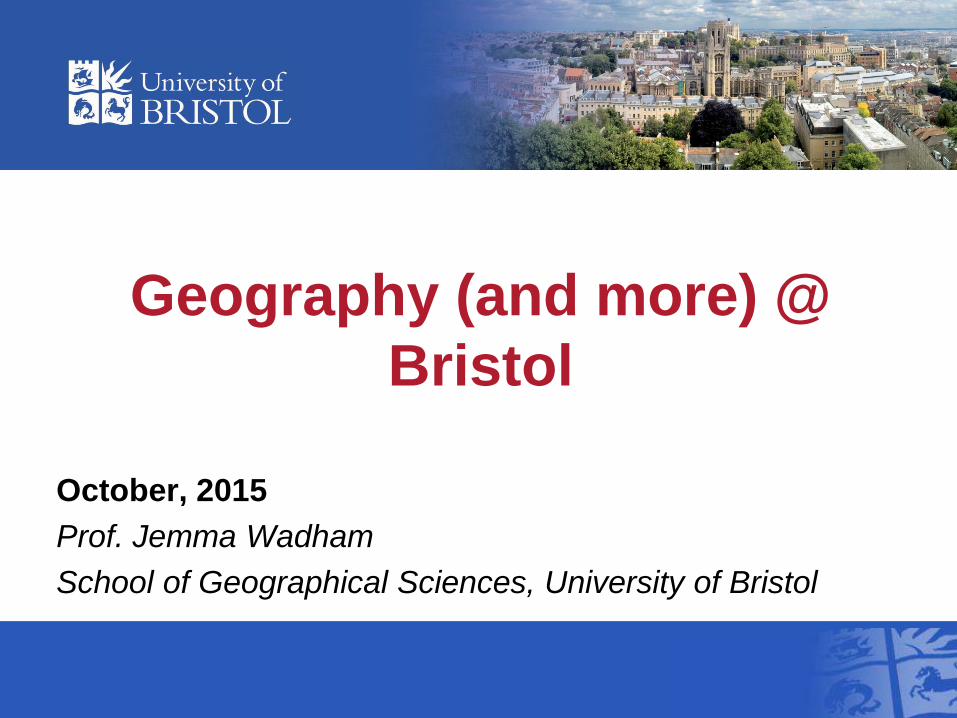
Bristol is green!

Bristol is vibrant

Bristol eats well!
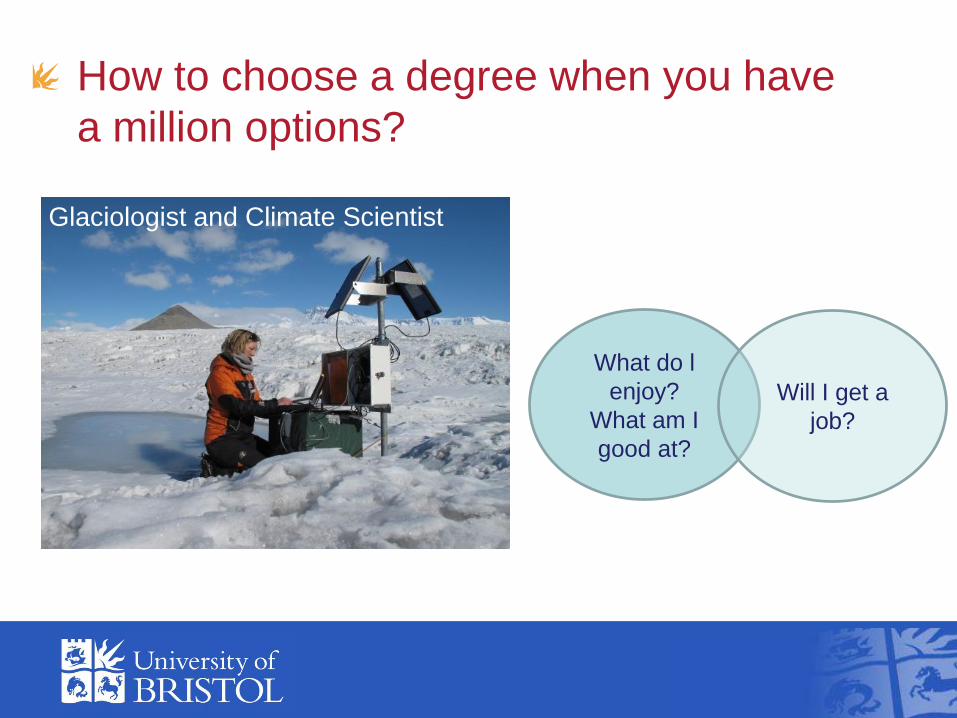
Glaciologist and Climate Scientist
How to choose a degree when you have
a million options?
What do l
enjoy?
What am I
good at?
Will I get a
job?
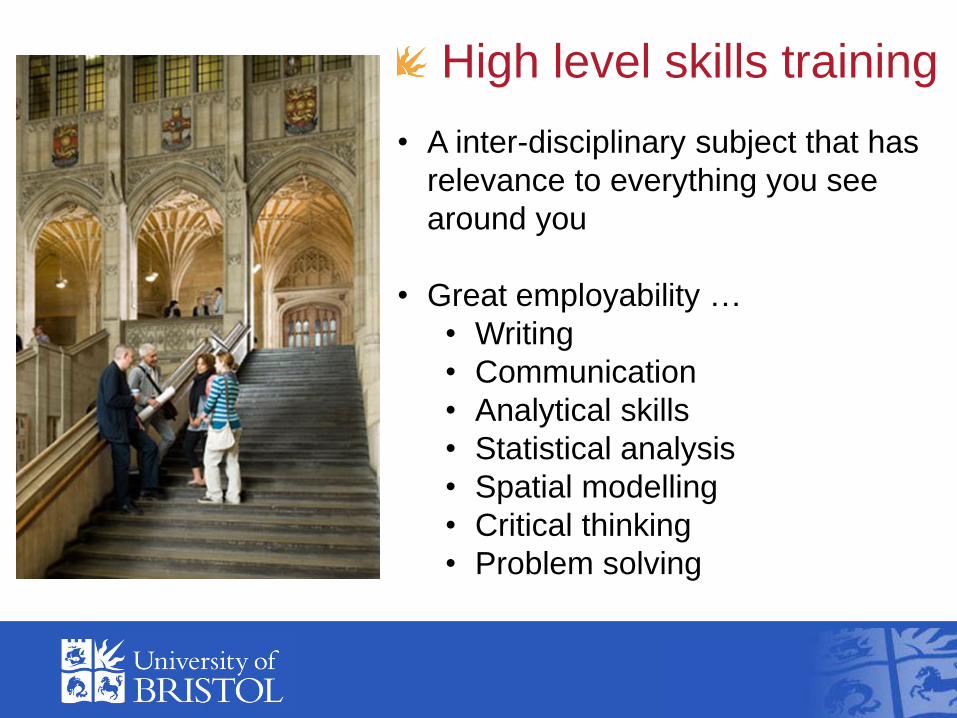
High level skills training
• A inter-disciplinary subject that has
relevance to everything you see
around you
• Great employability …
• Writing
• Communication
• Analytical skills
• Statistical analysis
• Spatial modelling
• Critical thinking
• Problem solving
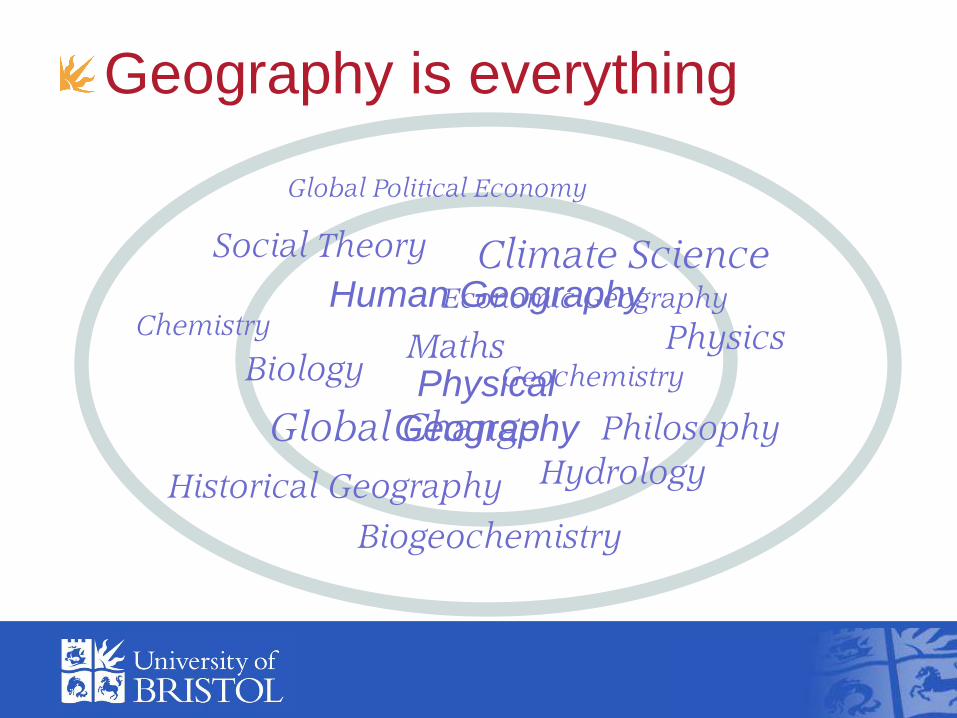
Geography is everything
Human Geography
Physical
Geography Philosophy
Social Theory
Economic GeographyChemistry
GeochemistryBiology
Global Change
Climate Science
Historical Geography
PhysicsMaths
Biogeochemistry
Hydrology
Global Political Economy

How are you taught?
Lectures – large classes (100s students), largely
presented material, little two way discussion
Tutorials – small group discussion,
pastoral issues
Practical classes, variable numbers of students,
desk, lab, computer exercises via an activity
(continuous assessment, normally at least 1/3)
Field courses
(50-100 students)
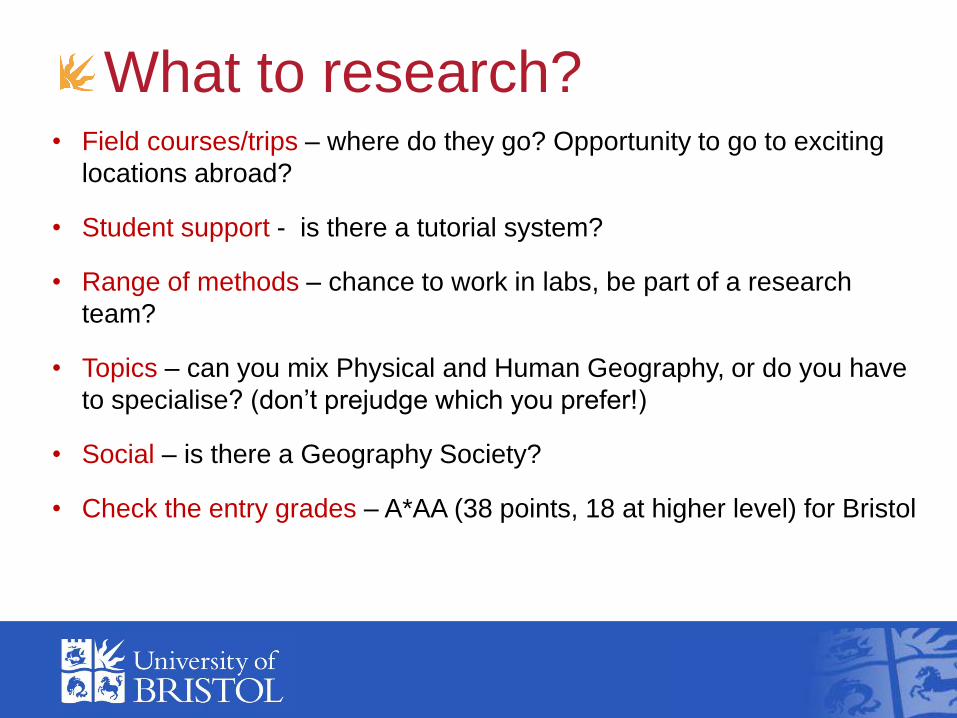
What to research?• Field courses/trips – where do they go? Opportunity to go to exciting
locations abroad?
• Student support - is there a tutorial system?
• Range of methods – chance to work in labs, be part of a research
team?
• Topics – can you mix Physical and Human Geography, or do you have
to specialise? (don’t prejudge which you prefer!)
• Social – is there a Geography Society?
• Check the entry grades – A*AA (38 points, 18 at higher level) for Bristol

Do you want to do more than just
your major subject?
• Learn a language Geography with Study in Continental Europe (BSc, 4
years, France, Germany, Spain etc.)
• Study abroad in English Geography with Study Abroad (BSc, 4 years
– US, New Zealand, Australia, Singapore)
• Convert to a masters Geography Msci Degree (4 years)
• Develop new skills/joint degrees
Geography with Innovation (MSci, 4 years)
Geography with Quantitative Research Methods (BSc/MSci, 3 or 4
years), £19.5m UK-wide initiative to provide quantitative skills sought after by
employers, focus on applied data analysis for social science, not about maths
but how to deal with data)

Bristol Geography: research led teaching
The only
Geography
department ranked
in the top category
in every UK national
research
assessment
exercise

Main themes in Human Geography
Historical,
Cultural &
Philosophy
Spatial
ModellingPolitical
Economy

Main themes in Physical Geography
Glaciology Global ChangeHydrology
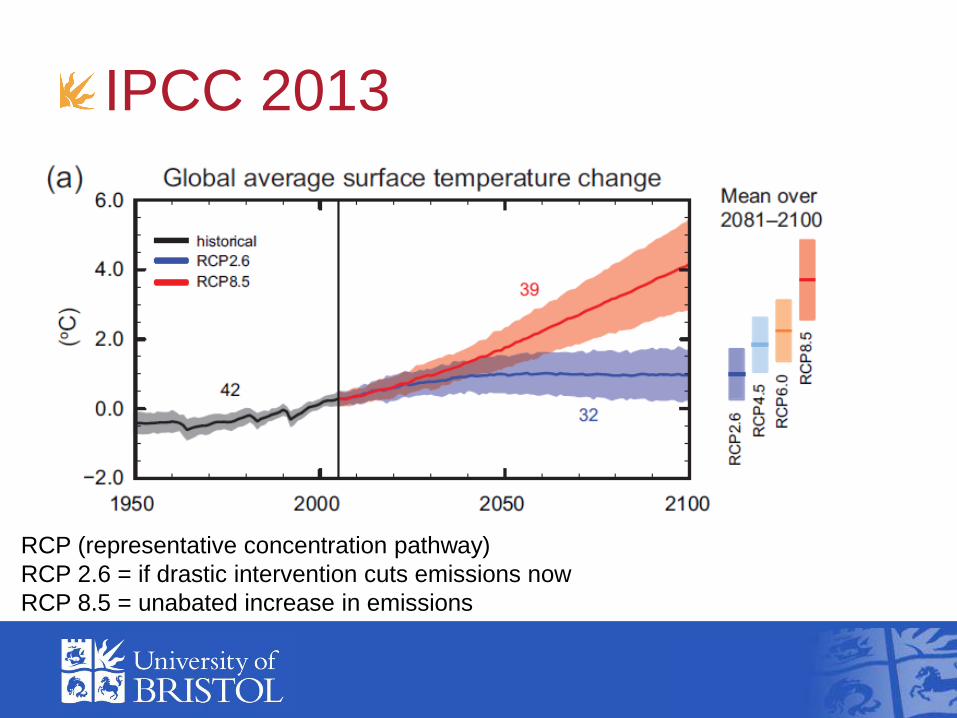
IPCC 2013
RCP (representative concentration pathway)
RCP 2.6 = if drastic intervention cuts emissions now
RCP 8.5 = unabated increase in emissions

Will we see more extreme events, such as
coastal and riverine flooding?
As climate warms, there are more extreme heat
events, more water evaporates from the oceans
– these create “extreme weather”

To be a catastrophe, they need to affect human beings
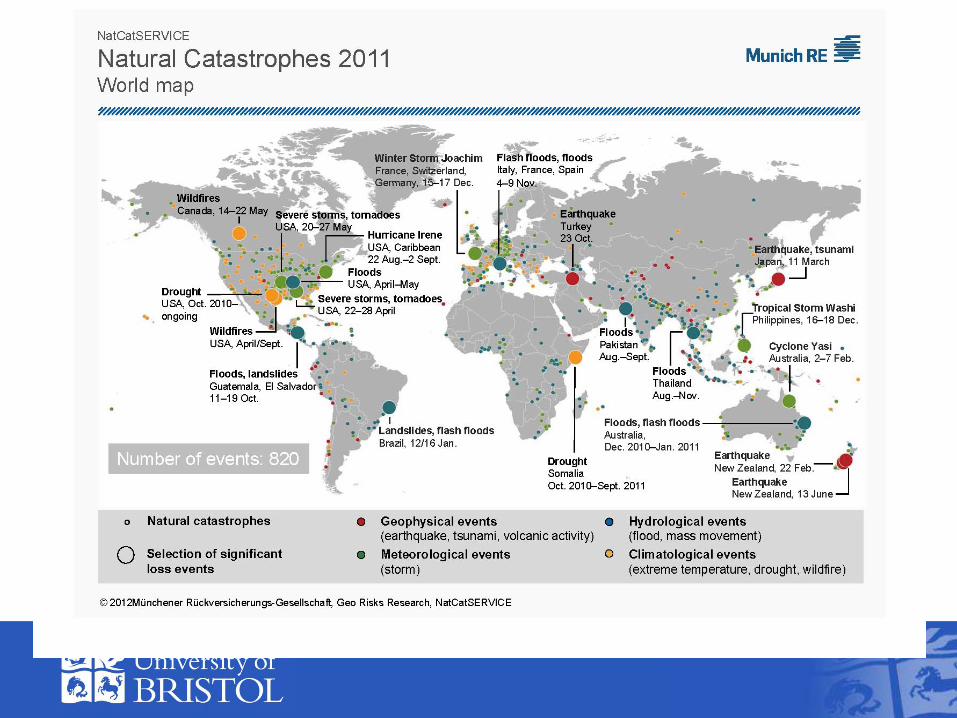
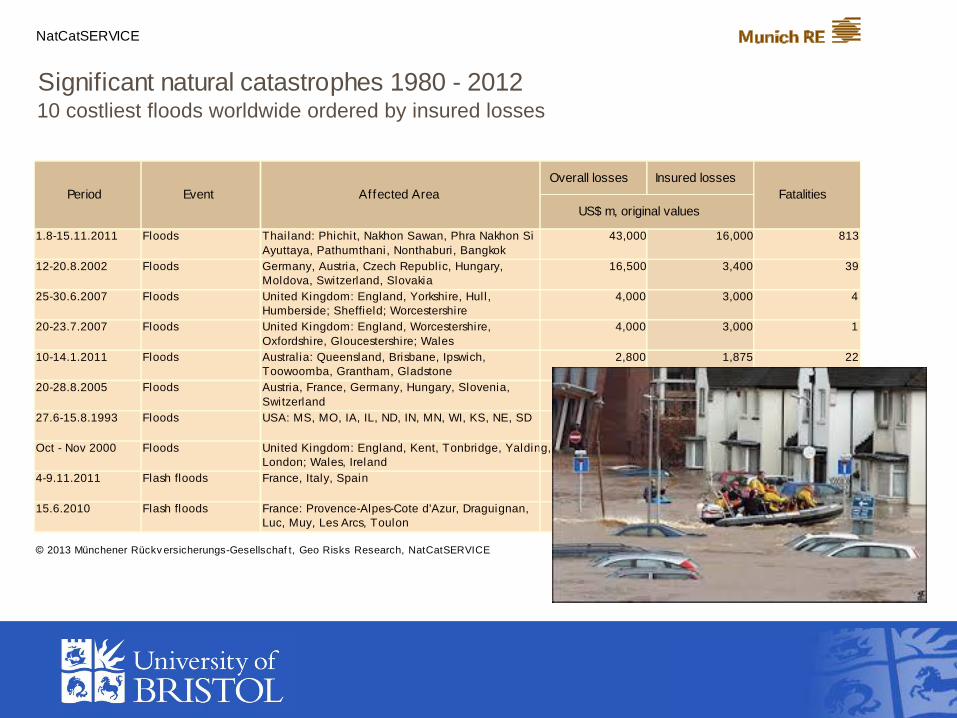
NatCatSERVICE
Significant natural catastrophes 1980 - 201210 costliest floods worldwide ordered by insured losses
Overall losses Insured losses
1.8-15.11.2011 Floods Thailand: Phichit, Nakhon Sawan, Phra Nakhon Si
Ayuttaya, Pathumthani, Nonthaburi, Bangkok
43,000 16,000 813
12-20.8.2002 Floods Germany, Austria, Czech Republic, Hungary,
Moldova, Switzerland, Slovakia
16,500 3,400 39
25-30.6.2007 Floods United Kingdom: England, Yorkshire, Hull,
Humberside; Sheffield; Worcestershire
4,000 3,000 4
20-23.7.2007 Floods United Kingdom: England, Worcestershire,
Oxfordshire, Gloucestershire; Wales
4,000 3,000 1
10-14.1.2011 Floods Austral ia: Queensland, Brisbane, Ipswich,
Toowoomba, Grantham, Gladstone
2,800 1,875 22
20-28.8.2005 Floods Austria, France, Germany, Hungary, Slovenia,
Switzerland
3,300 1,760 11
27.6-15.8.1993 Floods USA: MS, MO, IA, IL, ND, IN, MN, WI, KS, NE, SD 21,000 1,270 48
Oct - Nov 2000 Floods United Kingdom: England, Kent, Tonbridge, Yalding,
London; Wales, Ireland
1,700 1,100 10
4-9.11.2011 Flash floods France, Italy, Spain 2,100 1,100 14
15.6.2010 Flash floods France: Provence-Alpes-Cote d'Azur, Draguignan,
Luc, Muy, Les Arcs, Toulon
1,500 1,070 27
© 2013 Münchener Rückv ersicherungs-Gesellschaf t, Geo Risks Research, NatCatSERVICE As at: March 2013
Period Event Affected Area Fatalities
US$ m, original values
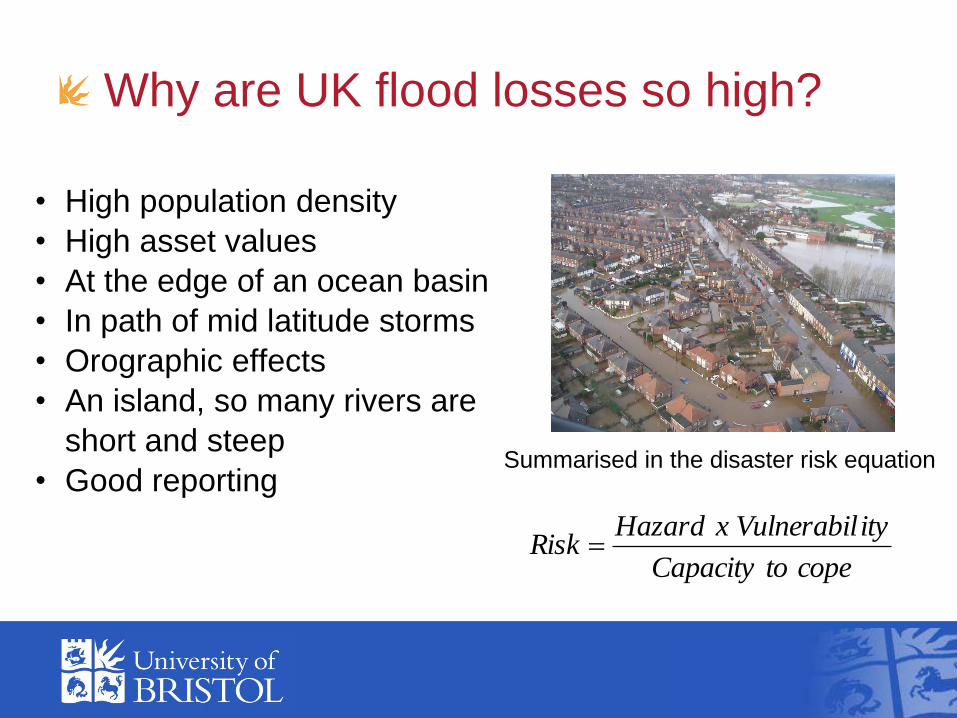
Why are UK flood losses so high?
• High population density
• High asset values
• At the edge of an ocean basin
• In path of mid latitude storms
• Orographic effects
• An island, so many rivers are
short and steep
• Good reporting
copetoCapacity
ityVulnerabilxHazardRisk
Summarised in the disaster risk equation

Flood hazard in Bristol
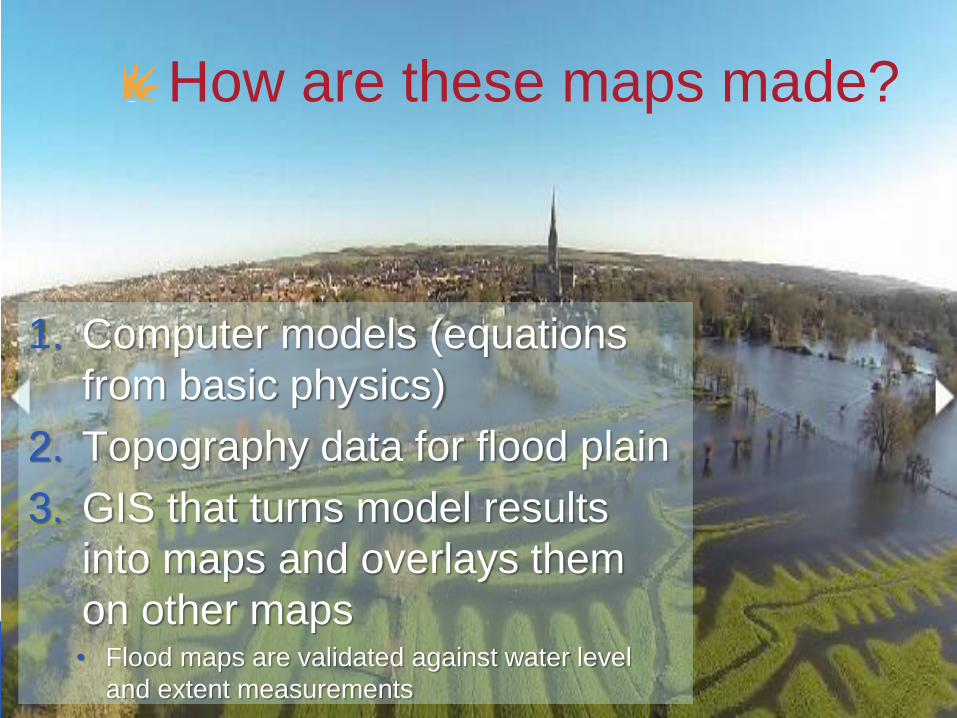
How are these maps made?
1. Computer models (equations
from basic physics)
2. Topography data for flood plain
3. GIS that turns model results
into maps and overlays them
on other maps• Flood maps are validated against water level
and extent measurements
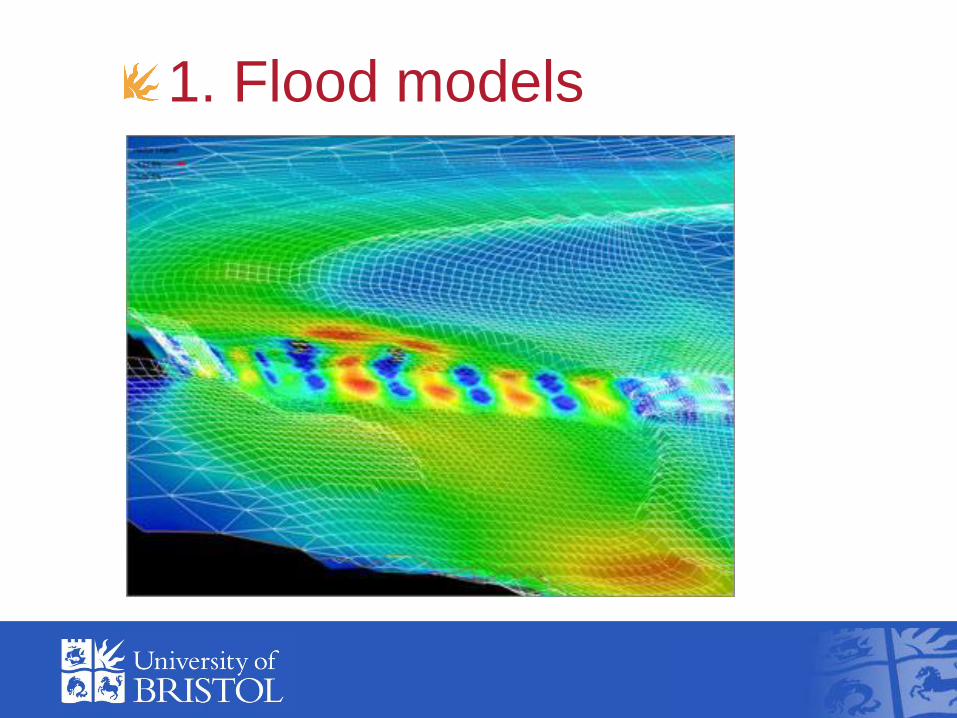
1. Flood models
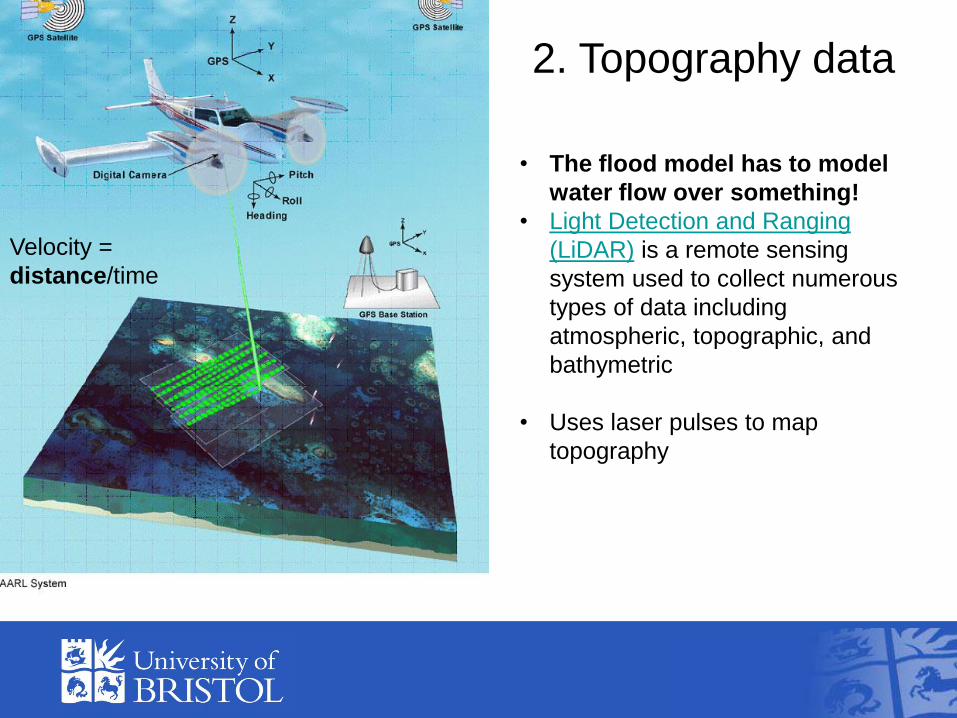
• The flood model has to model
water flow over something!
• Light Detection and Ranging
(LiDAR) is a remote sensing
system used to collect numerous
types of data including
atmospheric, topographic, and
bathymetric
• Uses laser pulses to map
topography
2. Topography data
Velocity =
distance/time
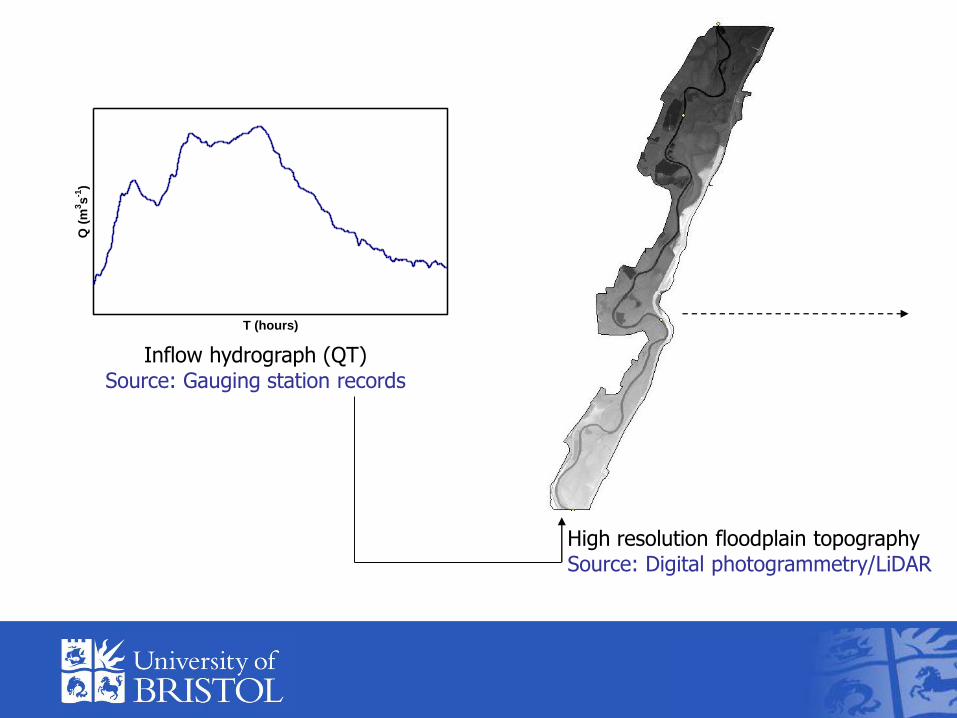
T (hours)
Q (
m3s
-1)
Inflow hydrograph (QT)Source: Gauging station records
High resolution floodplain topographySource: Digital photogrammetry/LiDAR
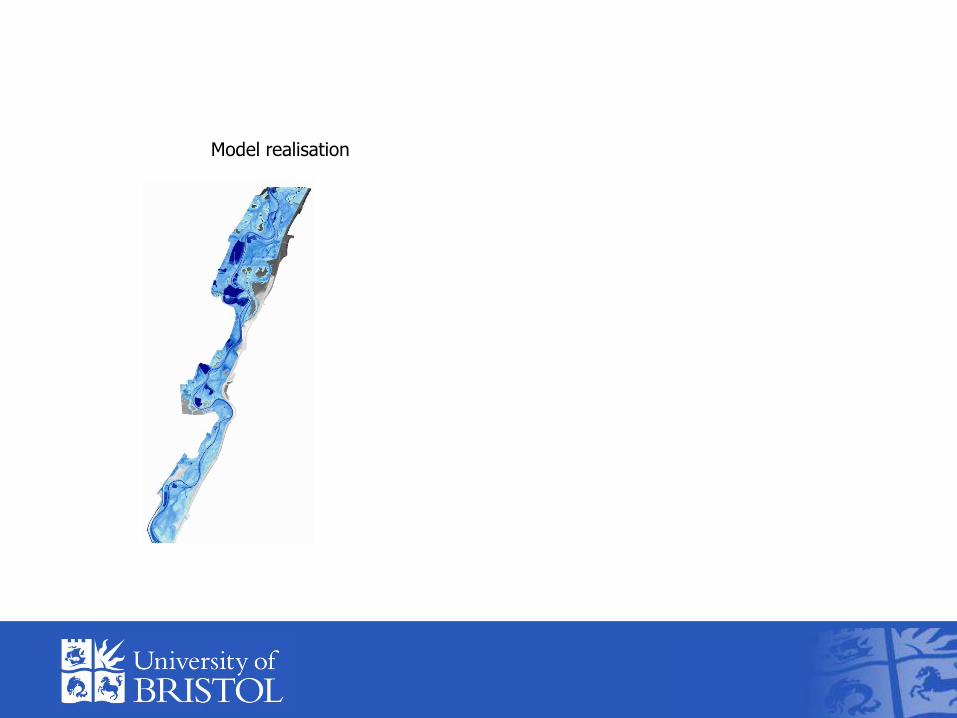
Model realisation

T (hours)
Q (
m3s
-1)
SAR Overpass
Inundation extent derived from satellite imaging radarSource: SAR imagery processed using a statistical active contour model (Horritt, 1999)
Outflow hydrograph

European flood hazard at 100m
resolution
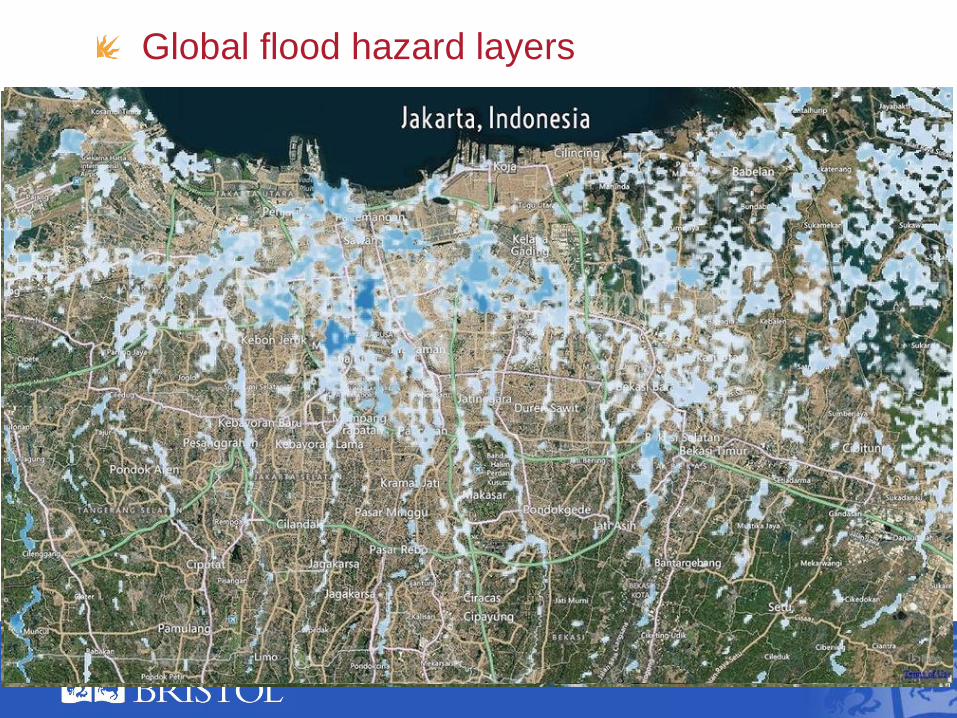
Global flood hazard layers

So why is this Geography?
• Focusses upon a Physical process with
Human impact
• Explores the spatial (extent of flooding)
and temporal (hydrograph) aspects of the
flood process
• With the goal of solving an environmental
problem
Summary
• Geography at University is much more diverse
than you might think
• It provides an ideal degree to give a broad, but
high level skills training, generating highly
employable graduates
• It is current, exciting, tackles real world problems
• It is the only degree that blends social science with
science
Bristol student/alumni networks in China
新浪微博用户名:英国布里斯托大学(account: University of Bristol)微博地址:http://weibo.com/bristol