Embed Size (px)
Citation preview

Geographical repartition of migrants personal networks in
Catalonia
José Luis Molina, Carlos Lozares Colina & Miranda J Lubbers (UAB)
Research project funded by the MICINN (CSO2008-01470/SOCI), Estudio comparado de casos sobre la influencia mútua entre el
capital e integración sociales y la inserción, estabilidad, promoción y cualificación en el empleo.
Workshop Personal Networks and Spatial Mobility, 28th May 2010, Barcelona.

Research questions…
• What are the differences between “nationals” and “migrants” in terms of the geographical repartition of their social networks?
• What are the role of neighborhoods in Catalonia?

Project CASCIVI
• Funded by the MICINN (2009-2011). IP: Carlos Lozares Colina, QUIT, Departament de Sociologia, UAB.
• Quota sample stratified by place of residence, target group (and age).– Barcelona (capital), Sant Feliu (Metropolitan Area) and Balaguer
(Small city).
• 416 interviews with people living in Catalonia, born in Catalonia, Spain, Morocco and Ecuador (the two main migrants groups in Catalonia).
• Fieldwork: sept. 2009-may 2010.• Structured interview with EgoNet. Flexible name
generator asking for 30 alters (active contacts), their characteristics and the pattern of relationships among them.

Ego
Target groups N %Cumulativ
e %
Age >55, born in Catalonia with parents born in Catalonia
92 22,1 22,1
Age 25-55, born in Catalonia with parents born in Catalonia
56 13,5 35,6
Age 25-55, born in Catalonia, with parents born in the rest of Spain
76 18,3 53,8
Age>50, born in the rest of Spain 63 15,1 69,0
Born in Ecuador 56 13,5 82,5
Born in Morocco 73 17,5 100,0
Total 416 100,0

Alters

Strong and weak ties …
• A roster of 30 active contacts overepresent strong ties although weak ties are also captured.

Geographic repartition of active contacts
• Social relations of people born in Catalonia are essentially local: in general over 70% of the contacts living in the same city or area of influence ("glocalization", Hampton and Wellman, 2002).
• In the case of the two immigrant groups studied, the situation is different with a 50.9% (Ecuador), and a 57.7% (Morocco) contacts living in another town, not necessarily the country of origin.

Age >55, with parents born in Catalonia. Non-local active contacts (25,2%)
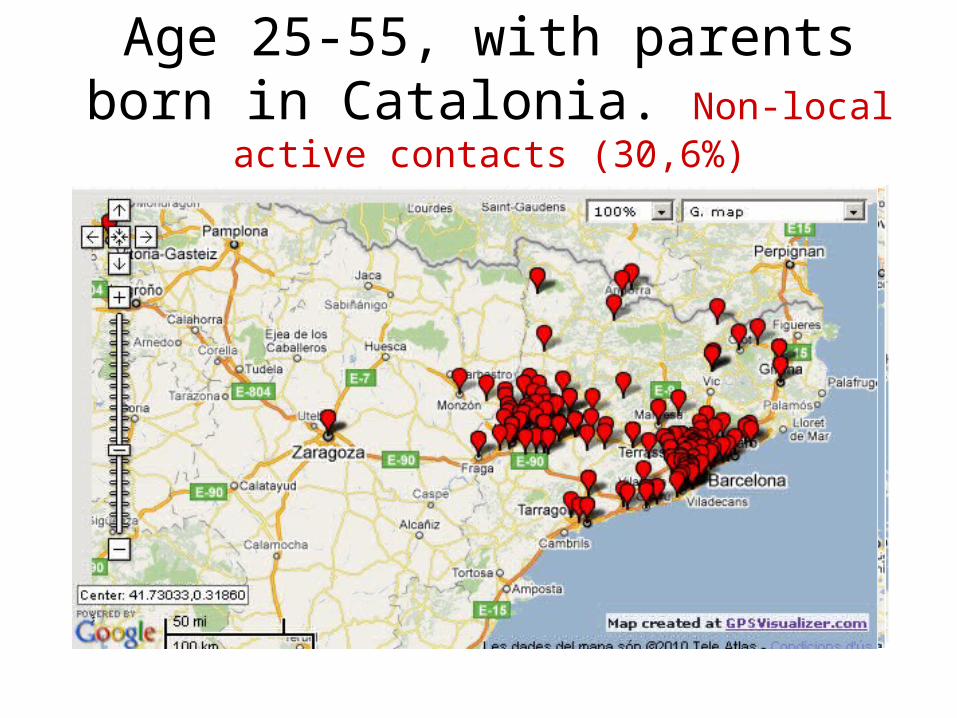
Age 25-55, with parents born in Catalonia. Non-local active contacts (30,6%)

Age 25-55, parents born in the rest of Spain. Non-local active contacts (34,6%)

Born in Ecuador. Non-local active contacts (50,9%)

Born in Morocco. Non-local active contacts (57,7%)

Neighborhoods …
• Now we can undertand better why migrants have less active contacts in the neighborhoods (there is not gender differences).

A dual society …

A dual society …

Alters that provided information about Jobs


Alters that provided information about housing …

… health services …

… educational centres …

… public services …

Where do they live in the case of migrants?
Ego= migrant + alter (provide support), N= 2.288.

Who are they?

In the case of Catalan/Spanish …

Significative diferences ….Place of residence alters providing support - origen Ego
origen_ego Catalonia Spain Other
Total
N 1782 1796 1190 4768 Same city % 70,7% 67,5% 46,6% 61,6% N 737 866 1364 2967
Place of residence
Other city % 29,3% 32,5% 53,4% 38,4% N 2519 2662 2554 7735 Total % Origin 100,0% 100,0% 100,0% 100,0%
Test chi-square
Valor gl Sig. asintótica (bilateral)
Chi- square de Pearson 371,051a 2 ,000 Razón de verosimilitudes
367,404 2 ,000
Asociación lineal por lineal
313,830 1 ,000
N de casos válidos 7735 a. 0 casillas (,0%) tienen una frecuencia esperada inferior a 5. La frecuencia mínima esperada es 966,24.

Ergo …
• Immigrants have smaller local networks and their suppliers of support do not live in the same town .... and hence they do not live in the same neighborhood.

Thanks!