Embed Size (px)
Citation preview
GEOG 101 – World Regional Geography
Professor: Dr. Jean-Paul Rodrigue
A Divided World
1 - The Three Worlds2 - The World Bank Classification of Development3 - The United Nations Classification of Development4 - The Human Development Index5 - Inequalities
The Three Worlds
■ Origins• New American foreign aid policy (1948):
• President Truman.• Providing financial, technical and military means for recent and fragile
states (facing the communist movement).• The geopolitical structure of the world was consequently settled for the
next 40 years with three worlds; the First, the Second and the Third.• Third World:
• Term brought forward in 1952 by the French author Alfred Sauvy.• Duality between capitalist systems leaning market-based economies and
control-based communist nations.• What remained were nations that were “ignored, exploited, despised and
wishing to be recognized”.
The Three Worlds
• Ignored:• Cold War putting the international attention towards the United States and
the Soviet Union.• Exploitation:
• Almost all of them have been part of the colonial control of a European country.
• Despised:• Populated by non-European populations.
• Recognition:• Early stage of their independence or on the way to be.
The Three Worlds
■ First World countries• Market economies having a high Gross National Product (GDP)
per capita.• Generally capitalist democracies having the United States,
Western Europe and Japan as leaders.• The United States as the pole:
• Military bases around the world and practicing foreign aid policies (neo-colonialism) for nations within its area of influence.
■ Second World countries• Centrally planned economies; from socialism to communism. • Average GDP per capita and a well-developed industrial
structure.• The USSR as the pole:
• Satellite nations in Eastern Europe and allies in Asia, Africa and Latin America

The Three Worlds
■ Third World countries• “Other” nations having diversified political conditions.• Low GPD per capita and a weak, and sometimes non-existent,
industrial structure.• Africa, South America and Asia were the stage of several
ideological confrontations between the First and the Second worlds.
• Several situations of dependency were created between First World and Third World countries.
• Movements trying to organize Third World countries such as the League of Nonaligned Nations in the 1960s.
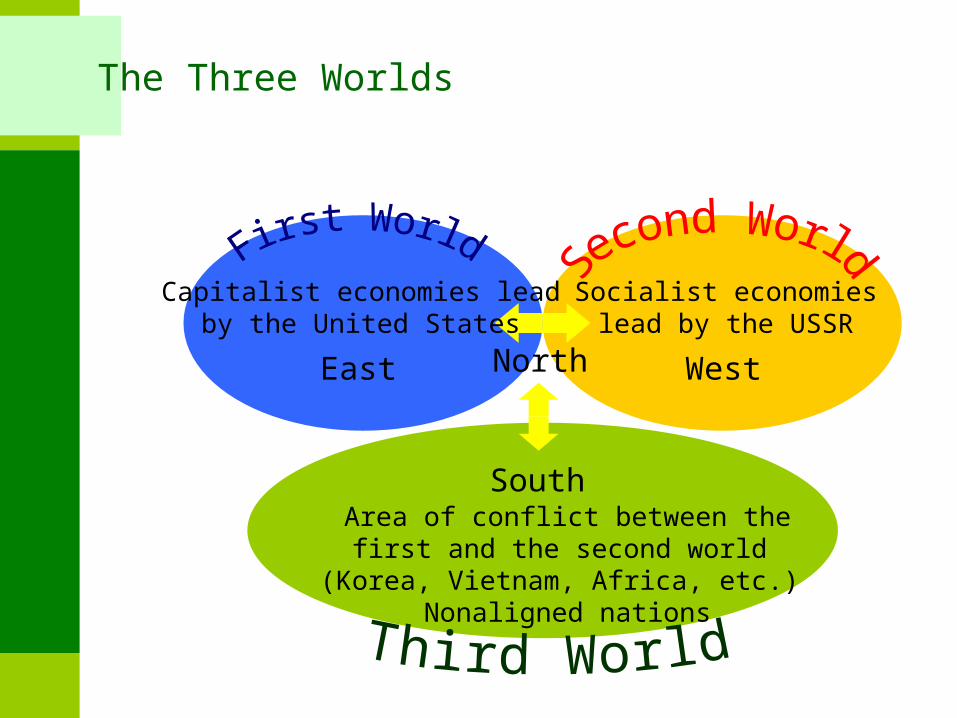
The Three Worlds
East West
Capitalist economies leadby the United States
Socialist economieslead by the USSR
North
South Area of conflict between the first and the
second world (Korea, Vietnam, Africa, etc.) Nonaligned nations
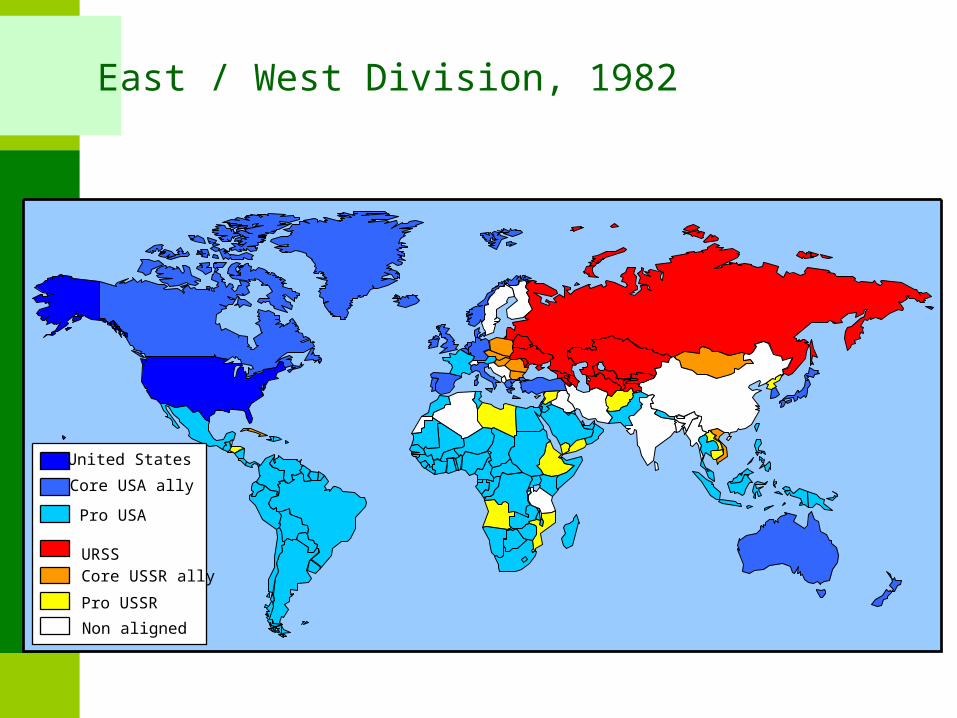
East / West Division, 1982
Pro USSR
Core USSR allyURSS
United States
Core USA ally
Pro USA
Non aligned
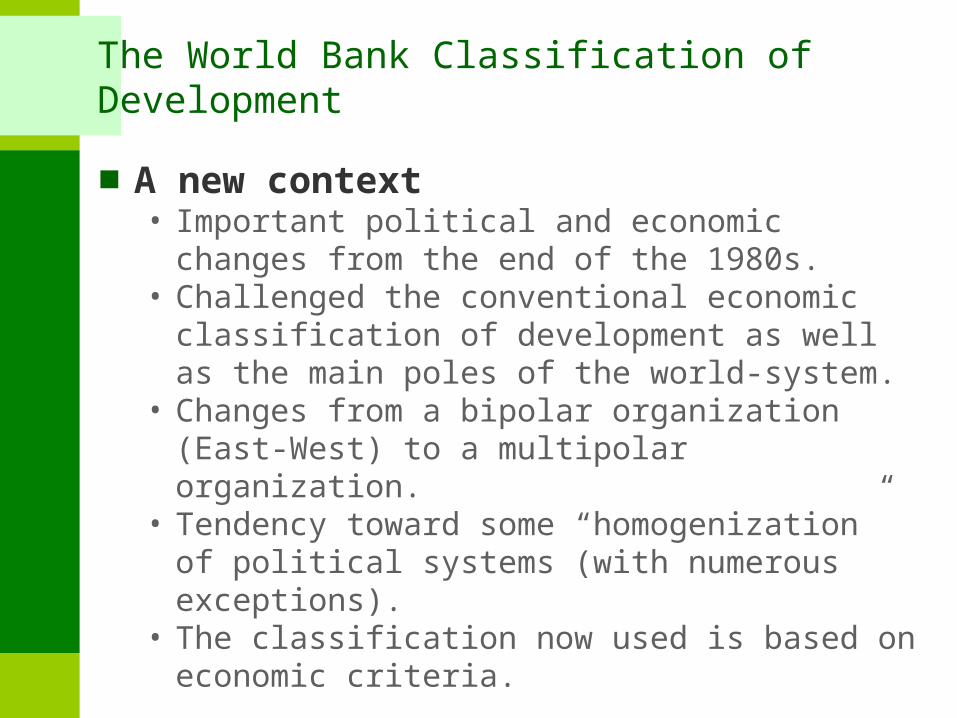
The World Bank Classification of Development
■ A new context• Important political and economic changes from the end of the
1980s.• Challenged the conventional economic classification of
development as well as the main poles of the world-system.• Changes from a bipolar organization (East-West) to a multipolar
organization.• Tendency toward some “homogenization” of political systems
(with numerous exceptions).• The classification now used is based on economic criteria.
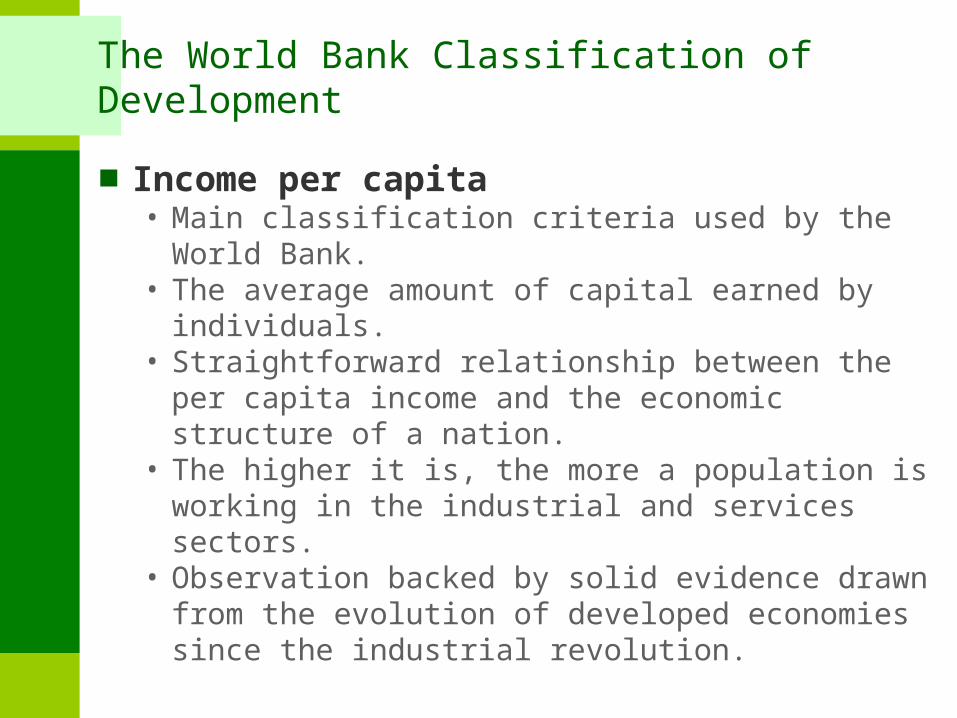
The World Bank Classification of Development
■ Income per capita• Main classification criteria used by the World Bank.• The average amount of capital earned by individuals.• Straightforward relationship between the per capita income and
the economic structure of a nation.• The higher it is, the more a population is working in the industrial
and services sectors.• Observation backed by solid evidence drawn from the evolution
of developed economies since the industrial revolution.
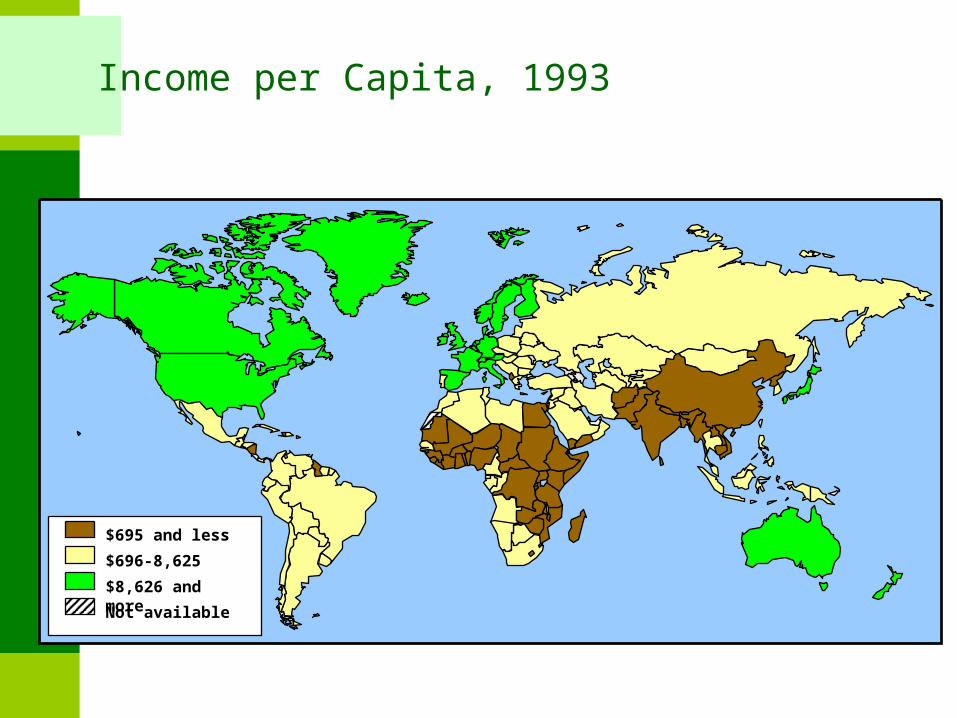
Income per Capita, 1993
Not available
$8,626 and more
$696-8,625
$695 and less
The World Bank Classification of Development
■ Patterns• The GDP per capita underlines the important disparities between
countries of the “North” and of the “South.”• Does not well illustrate the development potential of the market:
• China has a per capita income slightly over $300 per year, whereas development opportunities are very high.
• Mali has a similar income per capita, but conditions of the economy are completely different.
• Income by capita doesn't necessarily represent the purchasing power:
• The quantity of goods and services a currency can buy.• The higher the purchasing power is, the more an economy is
developed.
The World Bank Classification of Development
• Purchasing power parity:• Considers the comparative cost of living (food, lodging, energy, etc.)
between nations.• A low income country with a low cost of living may have a GDP with PPP
similar to an average income country with a higher cost of living.
United Nations Classification of Economic Development
■ Structure• Using several criteria related to income as well as the structure of
the economy and exports.• Advanced economies:
• High income levels.• The classifications proposed by the World Bank and by the United
Nations are similar.• Newly industrialized economies:
• Manufacturing goods represent more than 25% of the GDP and 50% of the exportations.
• Around 20 countries have experienced a fast and recent industrial growth.
United Nations Classification of Economic Development
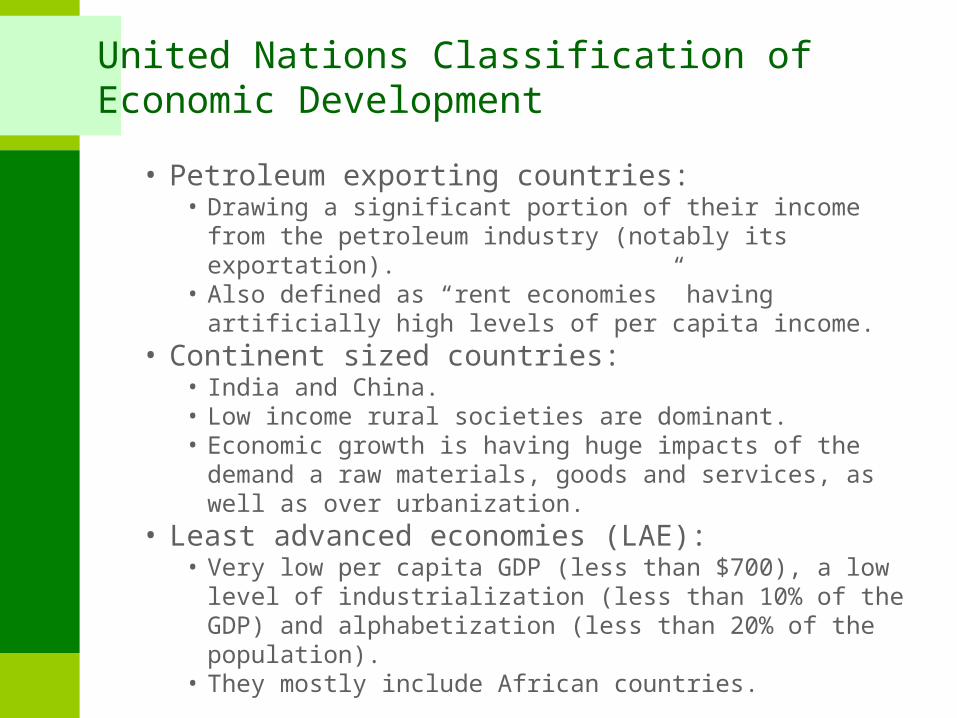
• Petroleum exporting countries:• Drawing a significant portion of their income from the petroleum industry
(notably its exportation).• Also defined as “rent economies” having artificially high levels of per
capita income.• Continent sized countries:
• India and China.• Low income rural societies are dominant.• Economic growth is having huge impacts of the demand a raw materials,
goods and services, as well as over urbanization.• Least advanced economies (LAE):
• Very low per capita GDP (less than $700), a low level of industrialization (less than 10% of the GDP) and alphabetization (less than 20% of the population).
• They mostly include African countries.
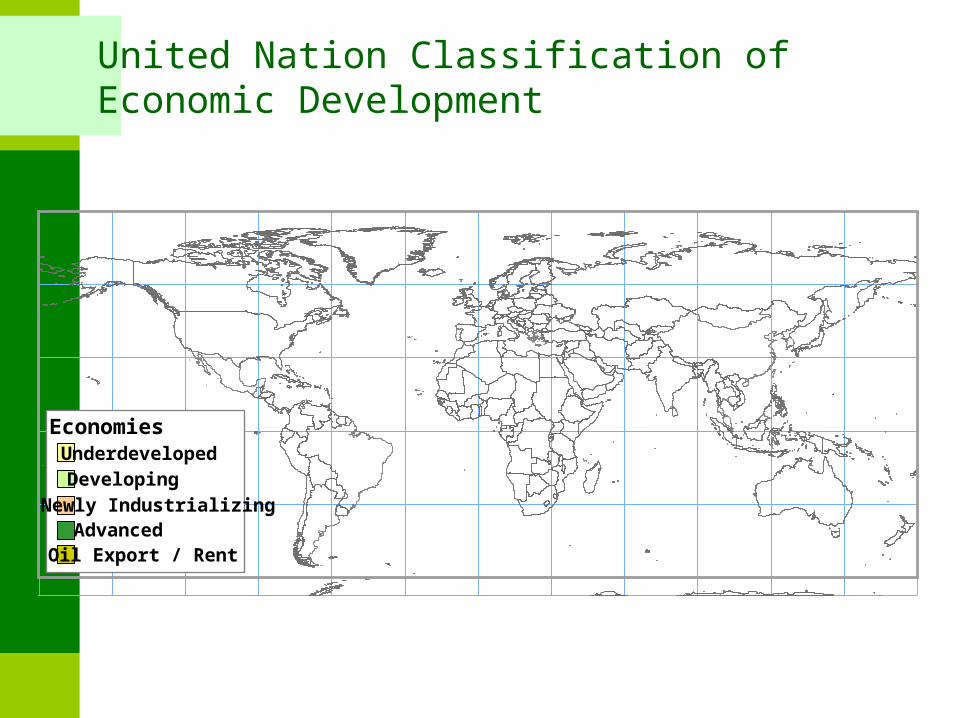
United Nation Classification of Economic Development
Newly IndustrializingDevelopingUnderdeveloped
AdvancedOil Export / Rent
Economies
Human Development Index
■ Nature• The Human Development Index (HDI) is a composite indicator
developed in 1990 by the United Nations Program for Development (UNPD).
• More complex and representative measure.■ Definition
• Level of health:• The variable used is the life expectancy at birth.• A good health system is likely to improve the life expectancy significantly
in a nation.• Level of education:
• The alphabetization level and the average years of attending school are the two variables used.
Human Development Index
• Income:• It is represented by two transformations on the GDP per capita.• The first adjust de GDP per capita to take account of the purchasing
power parity.• The purchasing power parity basically considers the cost of living in each
country and adjusts the GDP accordingly.• The second transformation considers that welfare increase in a non-linear
fashion with income.• Going from a GDP per capita of $1,000 to $2,000 is more important for
the human welfare of that country than going from a GDP per capita of $15,000 to $16,000, even if the increase is the same.
• The HDI ranges from 0 to 1 and is a comparative measure.• The country having the highest score for a variable has a value
of 1 and other countries are graded from how far they are from this best score.
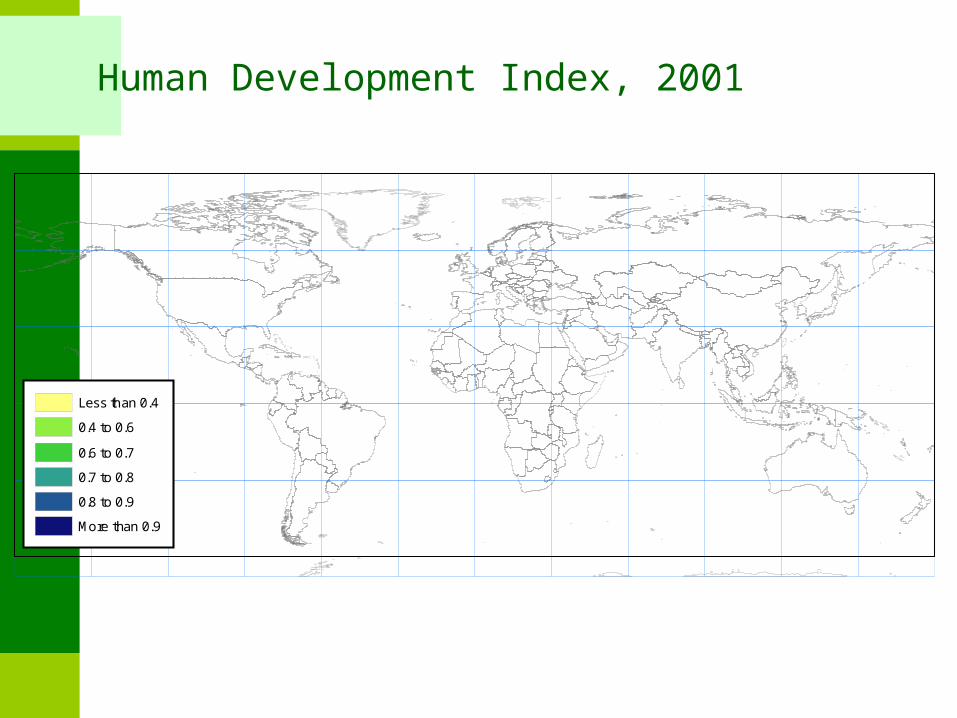
Human Development Index, 2001
Less than 0.4
0.4 to 0.6
0.6 to 0.7
0.7 to 0.8
0.8 to 0.9
More than 0.9
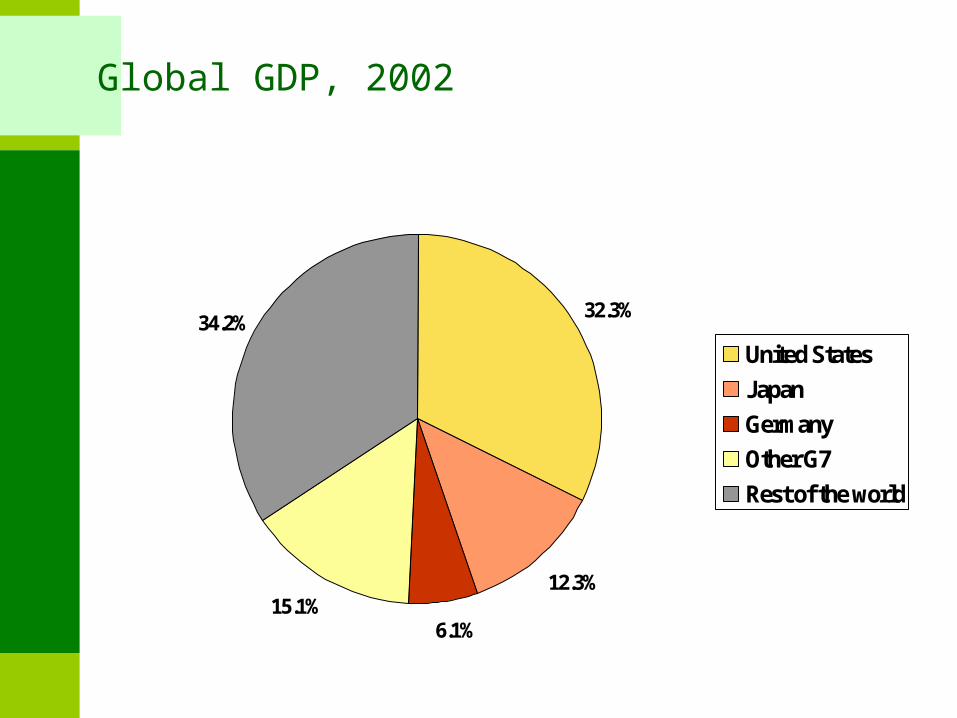
Global GDP, 2002
32.3%
12.3%
6.1%15.1%
34.2%
United States
Japan
Germany
Other G7
Rest of the world
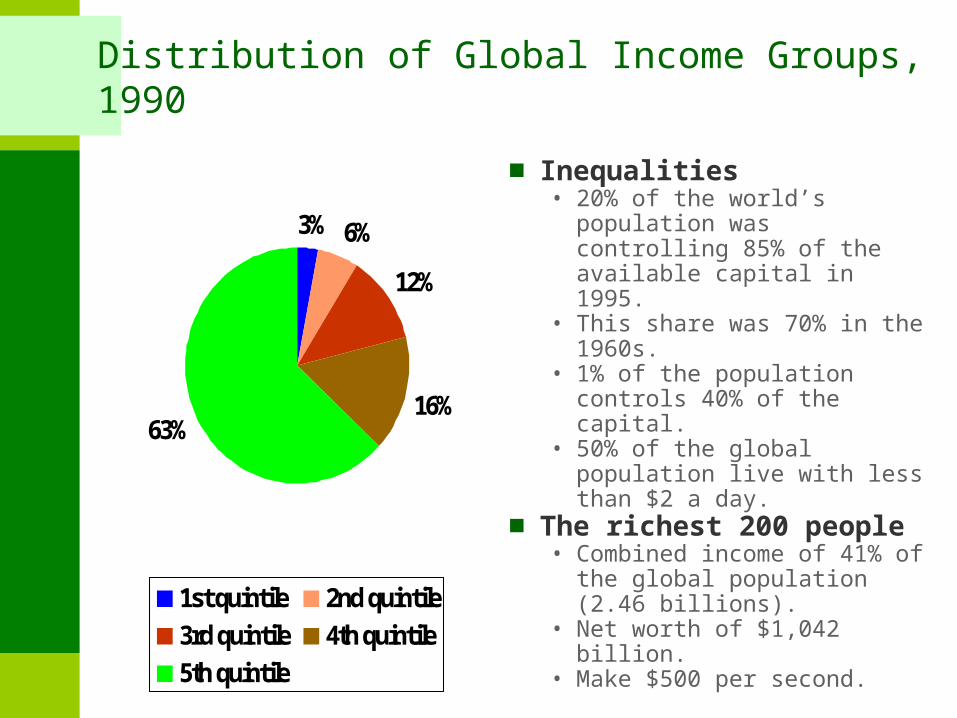
Distribution of Global Income Groups, 1990
■ Inequalities• 20% of the world’s population was
controlling 85% of the available capital in 1995.
• This share was 70% in the 1960s.• 1% of the population controls 40%
of the capital.• 50% of the global population live
with less than $2 a day.■ The richest 200 people
• Combined income of 41% of the global population (2.46 billions).
• Net worth of $1,042 billion.• Make $500 per second.
3% 6%
12%
16%63%
1st quintile 2nd quintile
3rd quintile 4th quintile
5th quintile