Embed Size (px)
Citation preview
GEOG 60 – Introduction to Geographic Information Systems
Professor: Dr. Jean-Paul Rodrigue
Topic 6 – Cartographic Composition
A – CartographyB – Elements of Map CompositionC – Cartographic ElementsD – Symbolization
The Purpose of this Course
■ Understand how elements composing a map should be arranged.
■ Know what elements should be placed on a map.■ Use the appropriate symbolism to represent features
correctly.
Cartography
■ 1. Maps and their Uses■ 2. Efficiency and Mapping■ 3. Cartography and GIS
AA
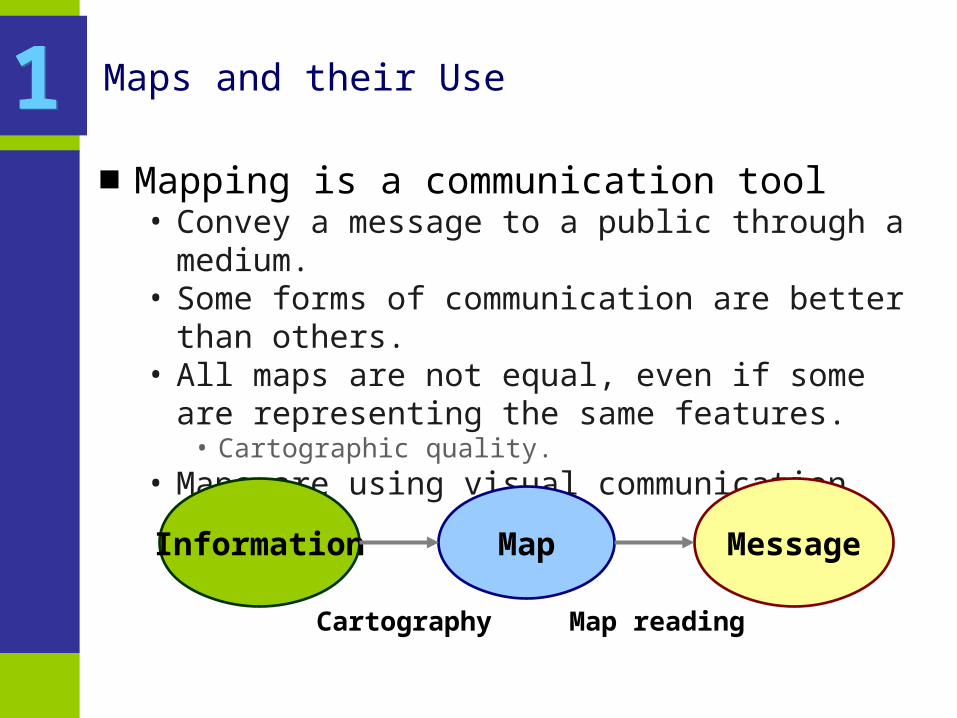
Maps and their Use
■ Mapping is a communication tool• Convey a message to a public through a medium.• Some forms of communication are better than others.• All maps are not equal, even if some are representing the same
features.• Cartographic quality.
• Maps are using visual communication tools.
11
MapInformation Message
Cartography Map reading
Maps and their Use
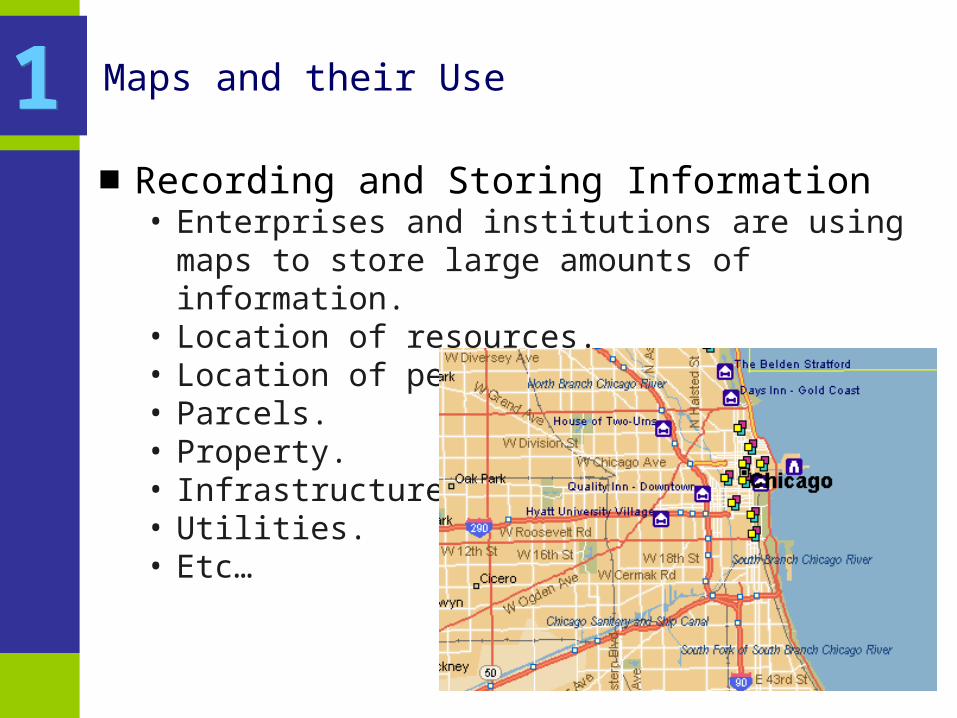
■ Recording and Storing Information• Enterprises and institutions are using maps to store large
amounts of information.• Location of resources.• Location of people.• Parcels.• Property.• Infrastructure.• Utilities.• Etc…
11
Maps and their Use
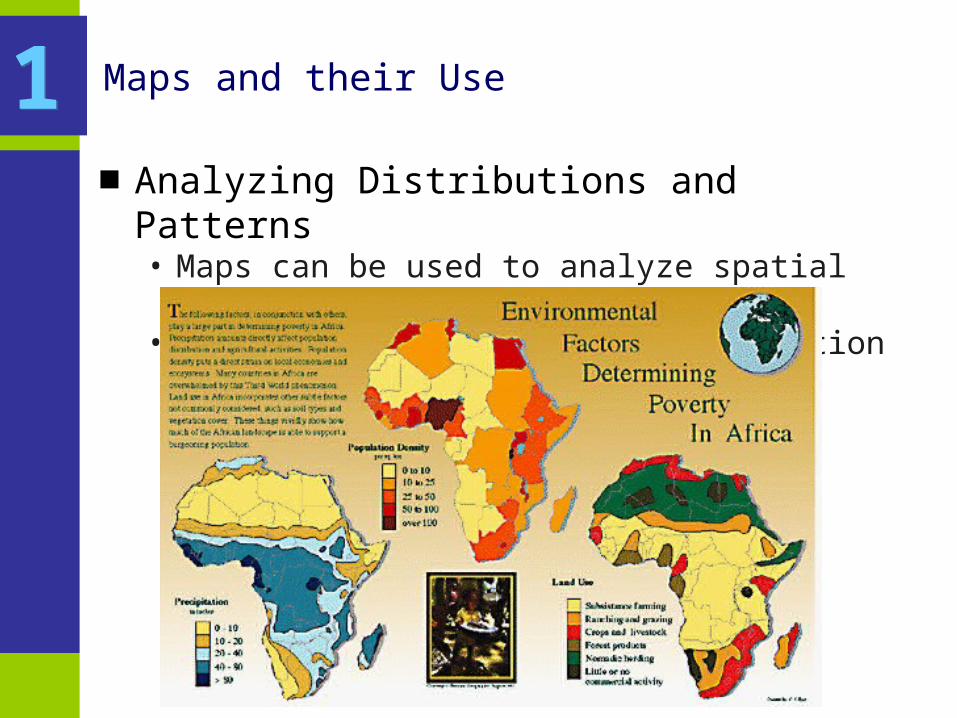
■ Analyzing Distributions and Patterns • Maps can be used to analyze spatial distributions.• Visualization helps conceptualization of patterns and processes.
11
Maps and their Use
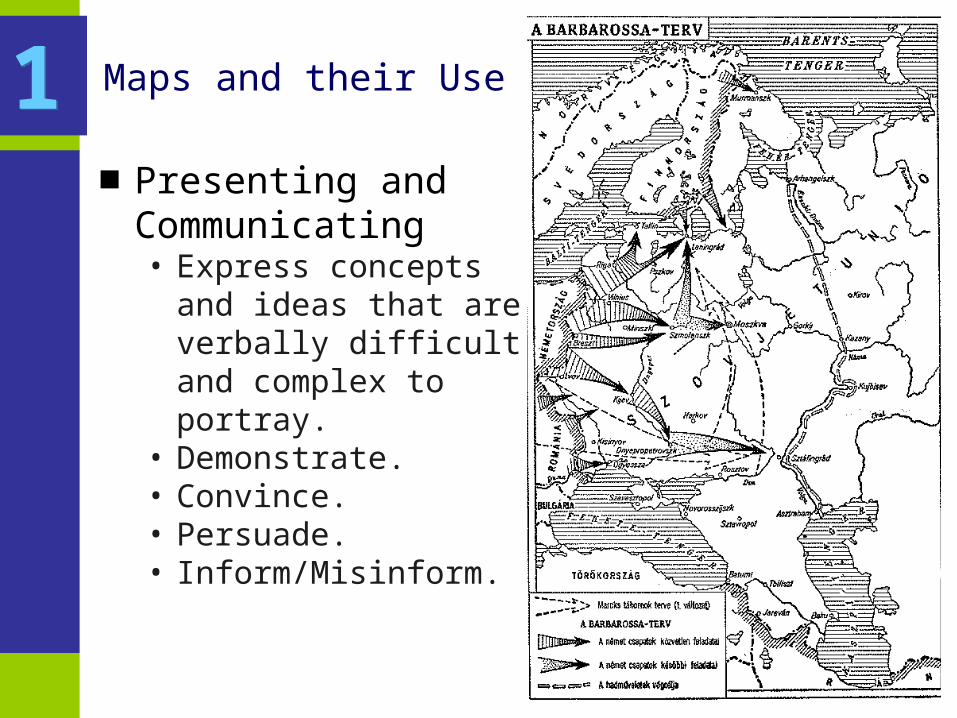
■ Presenting andCommunicating • Express concepts and ideas
that are verbally difficult and complex to portray.
• Demonstrate.• Convince.• Persuade.• Inform/Misinform.
11
Efficiency and Mapping
■ Cartography• Science / art / technique of map production.• Uses a set of defined graphical elements to communicate a
message.■ Graphical elements specific to cartography
• Coordinate systems.• Map projections.• Scale.• Symbolism.
■ Legend• Explaining the meaning of graphical symbols.• With the large diffusion of maps, some symbols do not require
explanation anymore.
22
Efficiency and Mapping
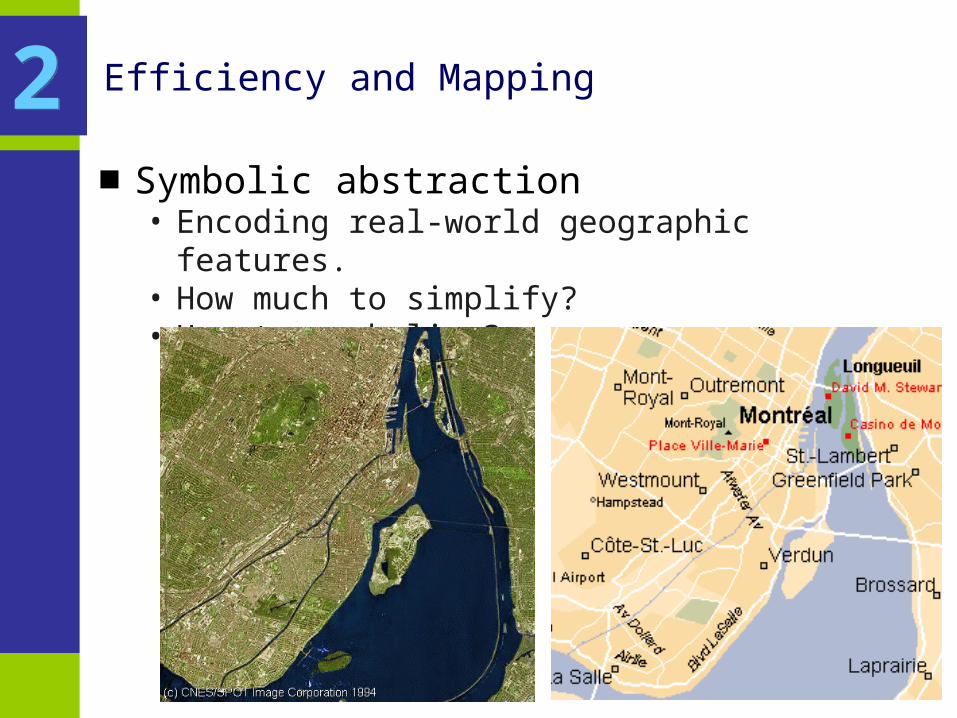
■ Symbolic abstraction• Encoding real-world geographic features.• How much to simplify?• How to symbolize?
22
Efficiency and Mapping
■ Designing a Good Map• A good map conveys well its intended message.
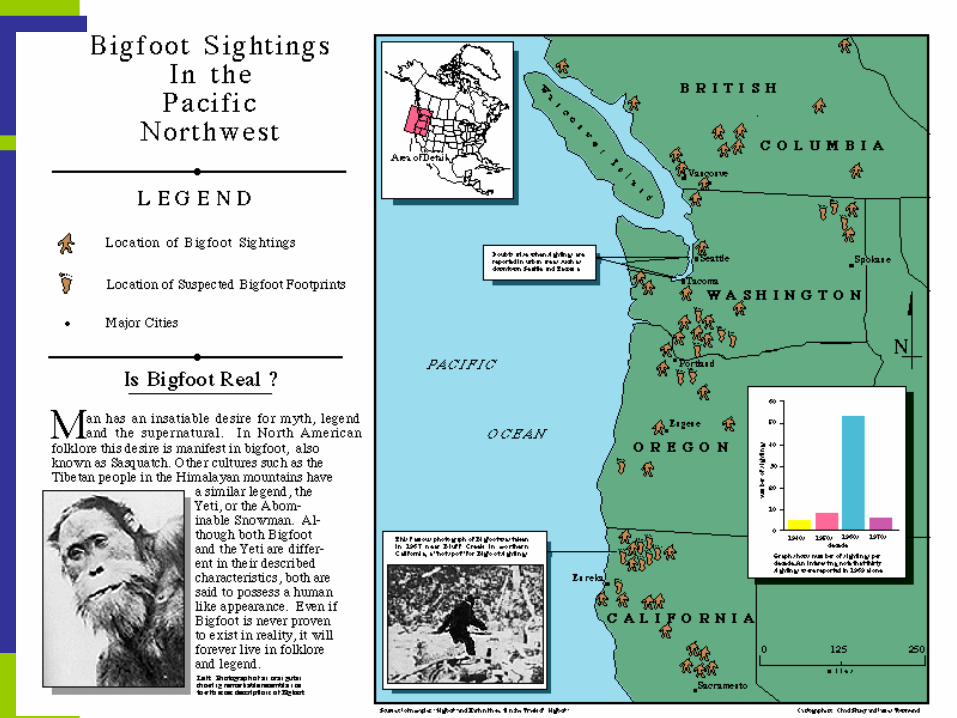
■ What is the goal of the map?• What the reader should gain from the map or how the reader
should respond.• Motives vary greatly.
• Convey accurate information about spatial relationships.• Sway public debate.
• The motive will have a great bearing on the content of the map (the information included) and its form (the cartographic strategies employed).
22
Efficiency and Mapping
■ Who is the reader?• Map design is not the same according to the intended public.• Identify the type of reader being addressed.• Important to have an idea about what the audience is likely to
know about the subject matter of the map.• Map literacy:
• How much background the readers have in using maps.• A map intended for specialists who have a background in cartography
might be organized far differently than one intended for use in a public debate.
22
Efficiency and Mapping
■ Where it will be used?• Usage depend on the type of medium the map will be published
in (book, magazine, news, web site, etc.).• Some maps are used only once and then discarded.• Others are intended to used for reference for decades or
centuries.■ What data is available?
• Some maps use reliable sources while others have sketchy information.
• Decisions about map design are tempered greatly by source materials themselves.
■ What resources and equipment are available?• Underline the time and the costs for map production.
22
Cartography and GIS
■ Explosion in the generation of maps over the last decades• More information is available from several sources.• Information is more accurate and in numerical format.• GIS enable to produce maps at a very low cost.• The population have more map-reading skills.• The Internet:
• Massive distribution of graphical images such as maps.• Access to a wide array of public databases.
33
Cartography and GIS
■ Automated Cartography• Computing mapping is a revolution that could be compared to the
word-processor for writing.• GIS automate several aspects of the cartographic process.• Assist cartographers for tasks that previously took a lot of
training, time and manual expertise.• Map revision is enhanced as errors do not involve starting over
again.• Can adjust the layout, the composition and symbolization.• One map can be duplicated “ad infiniti” to form new maps with
the same base map.• “GIS don’t make good or bad maps, cartographers do”.
33
Cartography and GIS
■ Future of cartography• Virtual maps:
• A truly “digitized world”.• Official base maps and datasets available for everyone to use.
• 3-D maps.• Animated maps.
33
Elements of Map Composition
■ 1. Format of Final Production■ 2. Generalization, Simplification and Abstraction■ 3. Common Elements■ 4. Balancing Elements■ 5. Map Layouts
BB
Format and Final Production
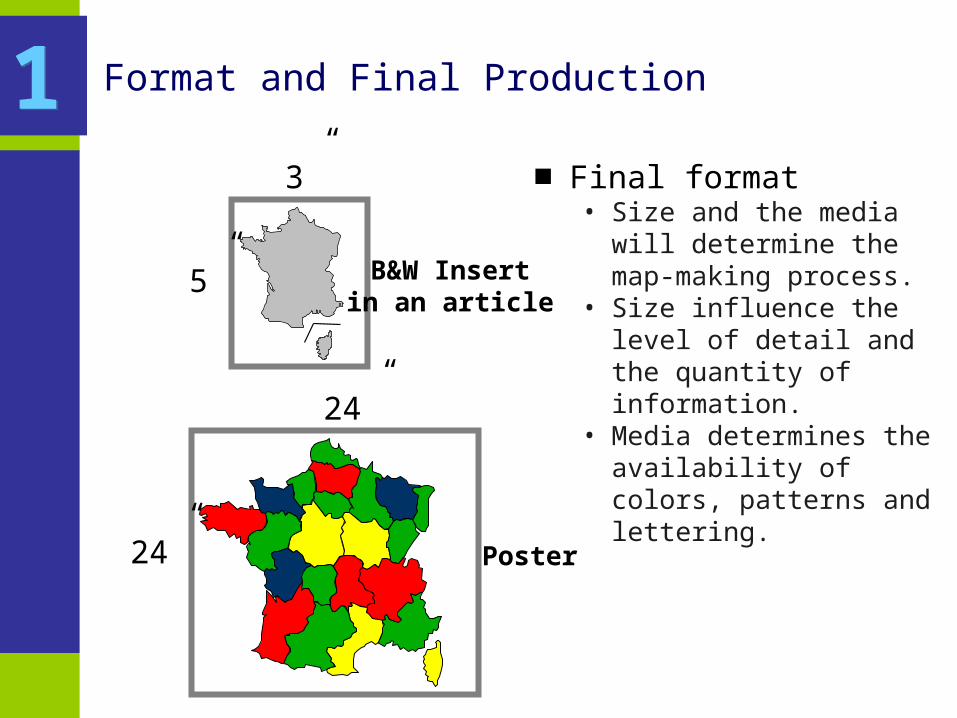
■ Final format• Size and the media will
determine the map-making process.
• Size influence the level of detail and the quantity of information.
• Media determines the availability of colors, patterns and lettering.
11
B&W Insertin an article
3”
5”
Poster
24”
24”
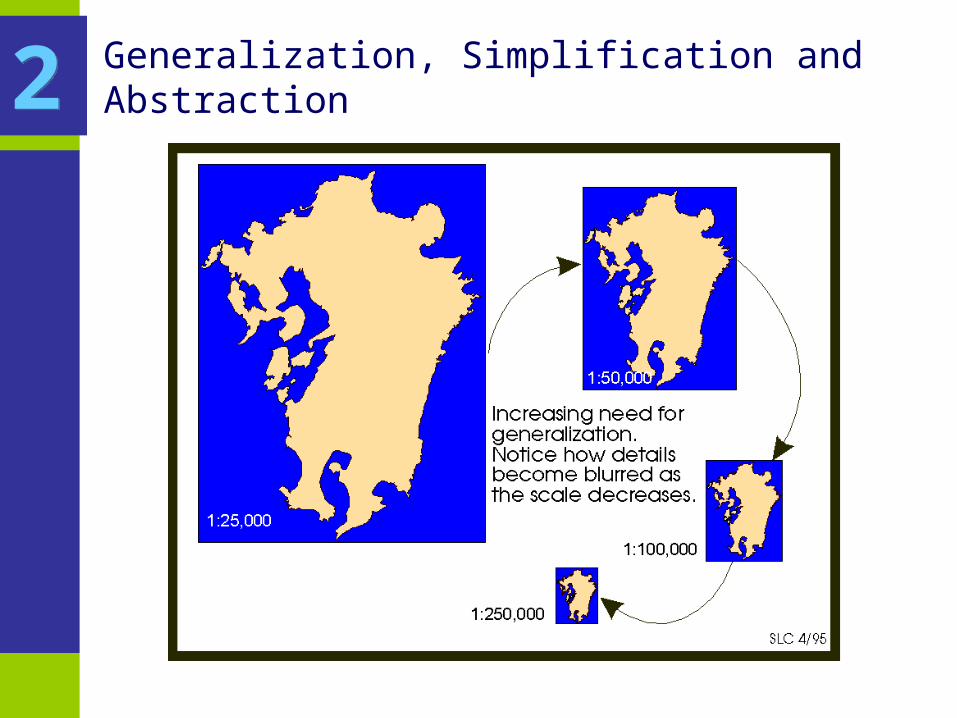
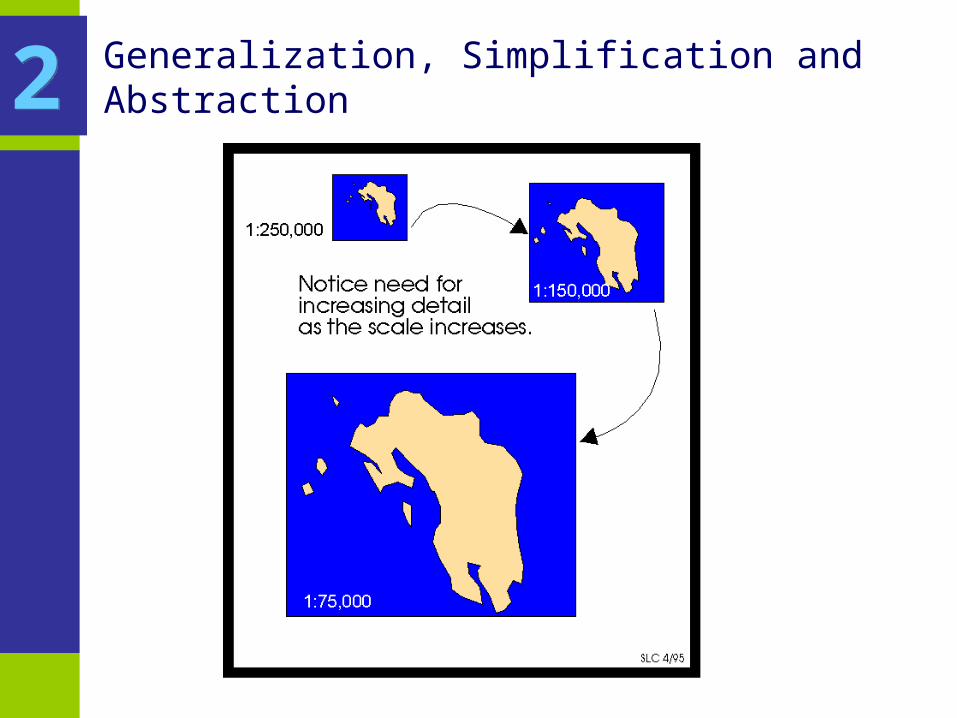
Generalization, Simplification and Abstraction
■ Cartography is a process of abstraction• Features are generalized and simplified.• Not all elements are relevant to the message a map convey.• The reader must have his/her attention of the message portrayed
by the map.■ Detail
• Too much details undermine the message of the map.• The amount of detail is related to the scale of the map.• A small scale map must be generalized.• A large scale map can contain more details at the expense of
generalization.
22
Generalization, Simplification and Abstraction22
Generalization, Simplification and Abstraction22
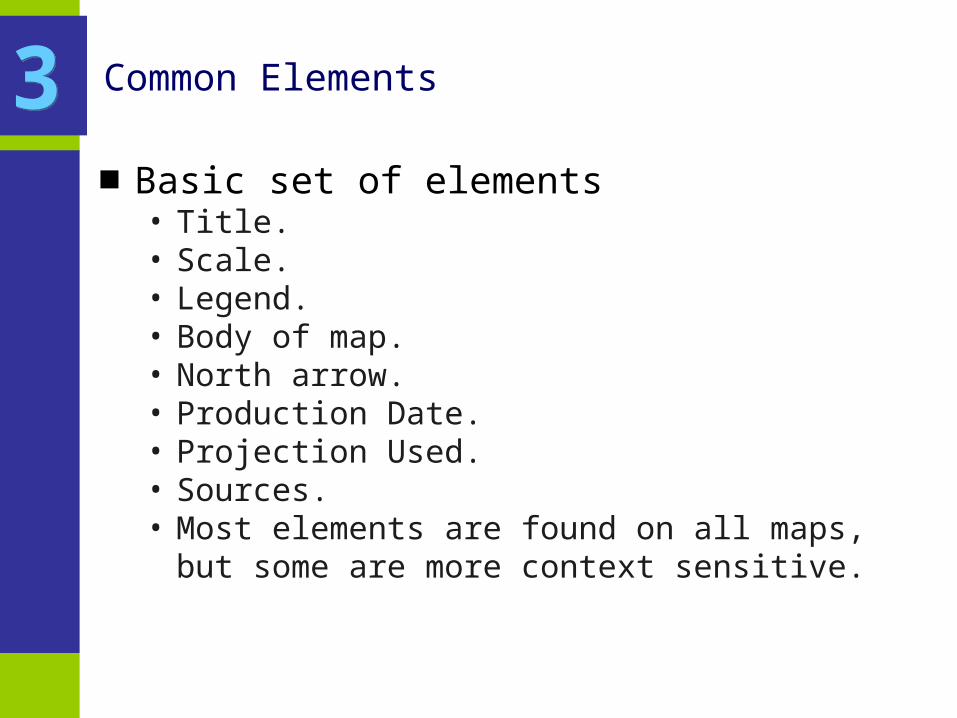
Common Elements
■ Basic set of elements• Title.• Scale.• Legend.• Body of map.• North arrow.• Production Date.• Projection Used.• Sources.• Most elements are found on all maps, but some are more context
sensitive.
33
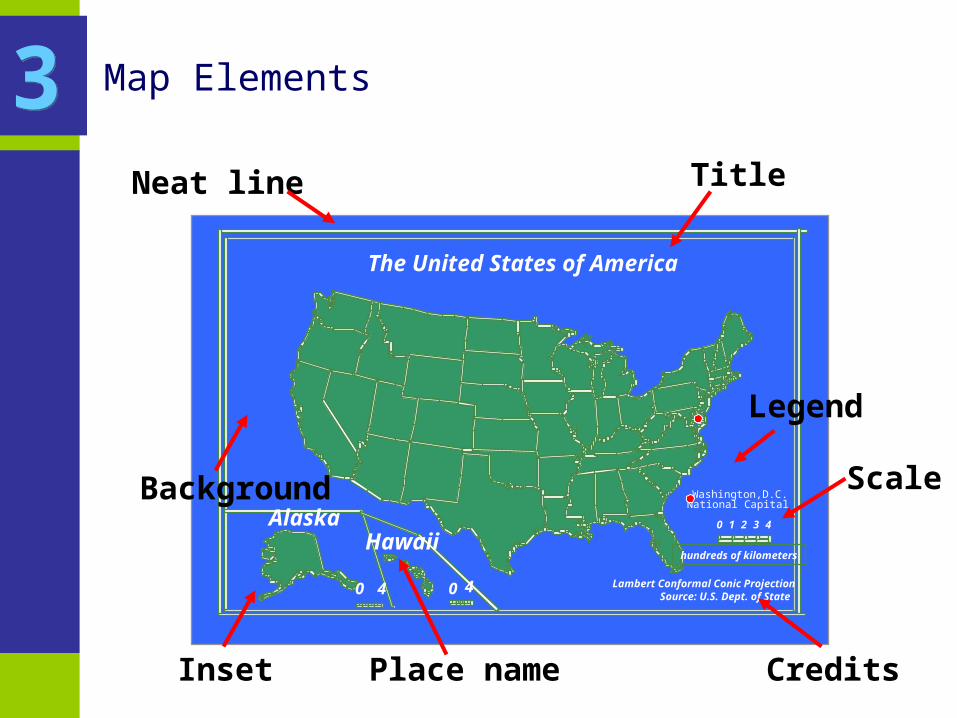
Map Elements
The United States of America
Alaska
Lambert Conformal Conic ProjectionSource: U.S. Dept. of State
0 41 2 3
hundreds of kilometers
0 4 0 4
Washington,D.C.National Capital
Legend
Scale
CreditsPlace nameInset
Background
Neat line Title
Hawaii
33
Balancing Elements
■ Concept• Each map element has its own importance.• The cartographer must organize them according to priority.• Important elements should be in prominent positions within the
map.• Important elements should have an according size; a larger area.
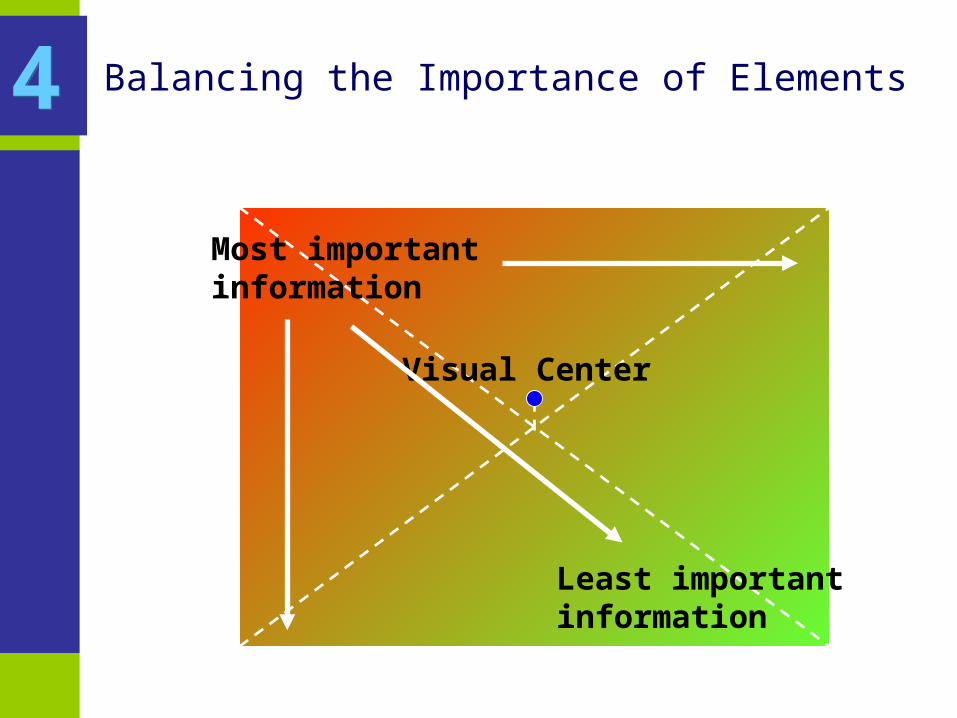
■ A general rule:• The most important elements should be on the top left.• The least important elements should be on the bottom right.
44
Balancing the Importance of Elements44
Most importantinformation
Least importantinformation
Visual Center
Balancing Elements
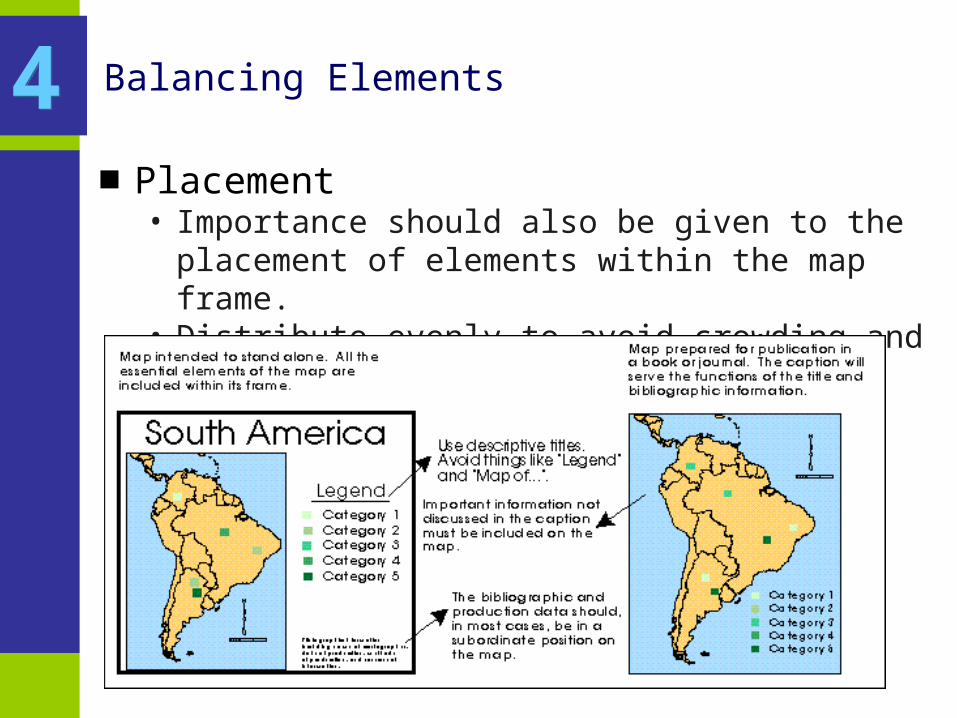
■ Placement• Importance should also be given to the placement of elements
within the map frame.• Distribute evenly to avoid crowding and blank areas.
44
Map Layout
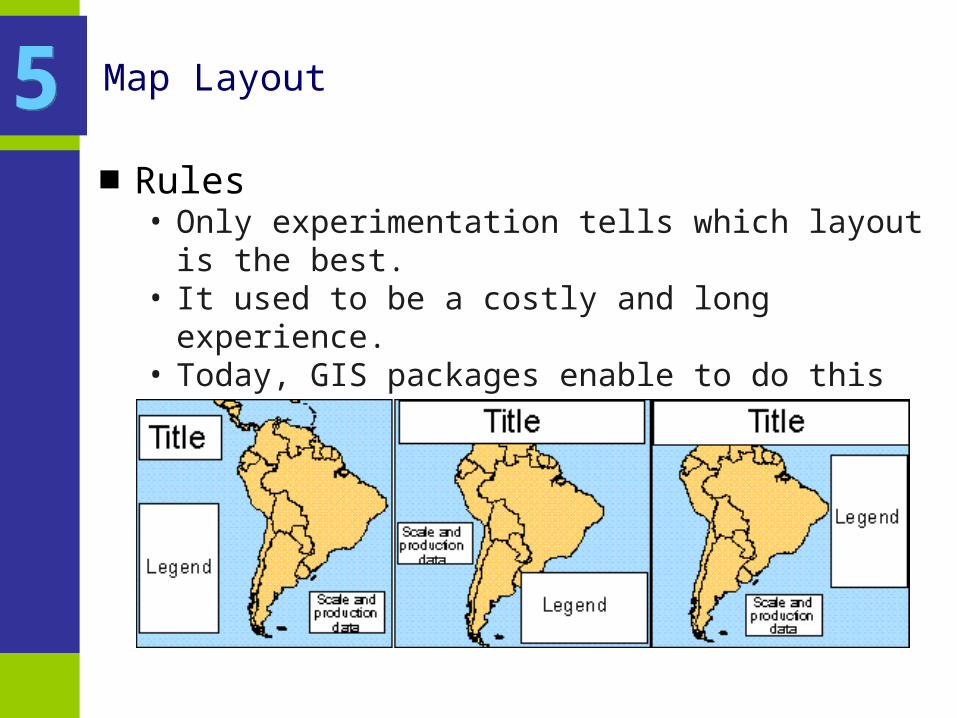
■ Rules• Only experimentation tells which layout is the best.• It used to be a costly and long experience.• Today, GIS packages enable to do this easily.
55
Map Layout
■ Relevance of the elements on the map• Each one should be justified.• Those of less importance should be simplified.• Those of importance should be explained.• Simple design are more readable.• Too much detail and complexity will confuse the reader.• The rules are generally vague, so it is to the cartographer to
develop his/her “style”.
55
Cartographic Elements
■ 1. Distance and Scale■ 2. Direction■ 3. Legend■ 4. Sources■ 5. Context Sensitive Elements■ 6. Effective Communication Elements
CC
Distance and Scale
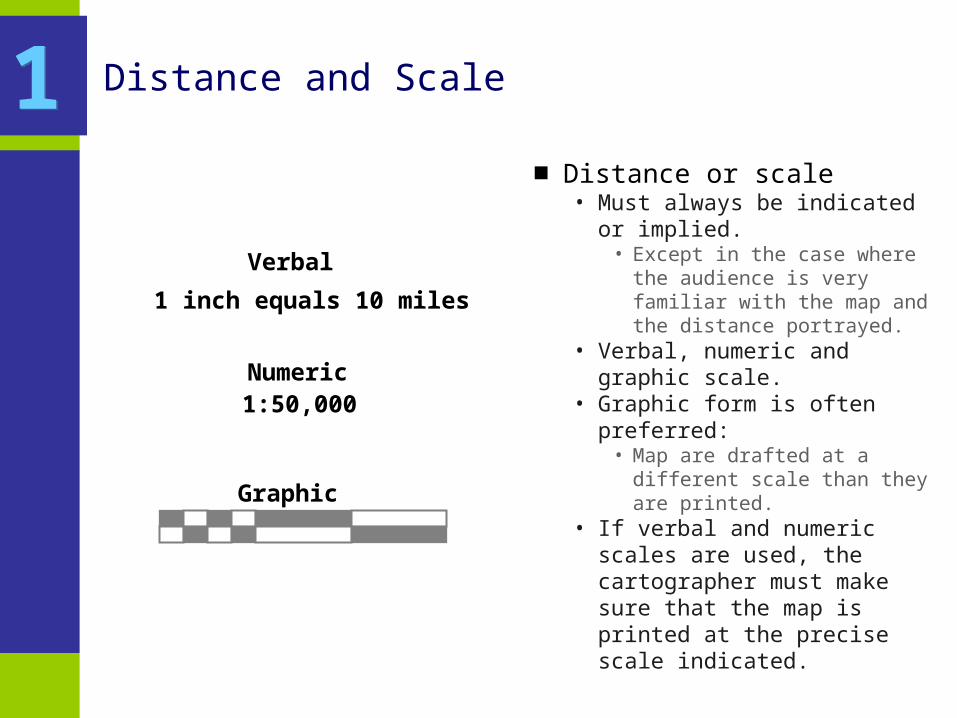
■ Distance or scale• Must always be indicated or
implied.• Except in the case where the
audience is very familiar with the map and the distance portrayed.
• Verbal, numeric and graphic scale.
• Graphic form is often preferred:• Map are drafted at a different
scale than they are printed.• If verbal and numeric scales are
used, the cartographer must make sure that the map is printed at the precise scale indicated.
11
1 inch equals 10 miles
1:50,000
Verbal
Numeric
Graphic
Direction
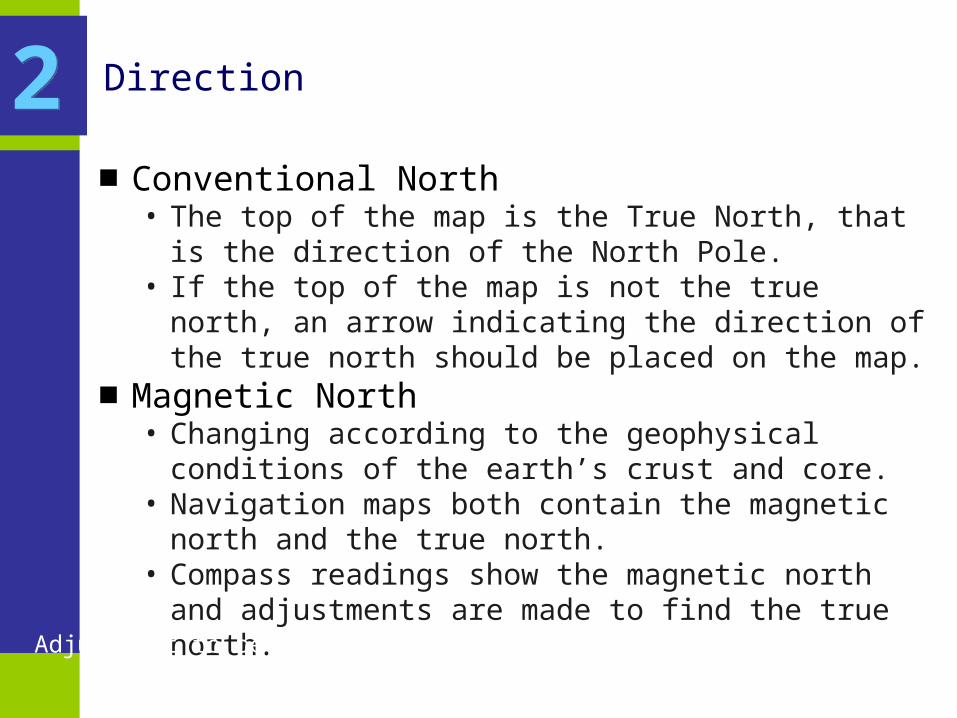
■ Conventional North• The top of the map is the True North, that is the direction of the
North Pole.• If the top of the map is not the true north, an arrow indicating the
direction of the true north should be placed on the map.■ Magnetic North
• Changing according to the geophysical conditions of the earth’s crust and core.
• Navigation maps both contain the magnetic north and the true north.
• Compass readings show the magnetic north and adjustments are made to find the true north.
22
Adjustment to be made (declination)
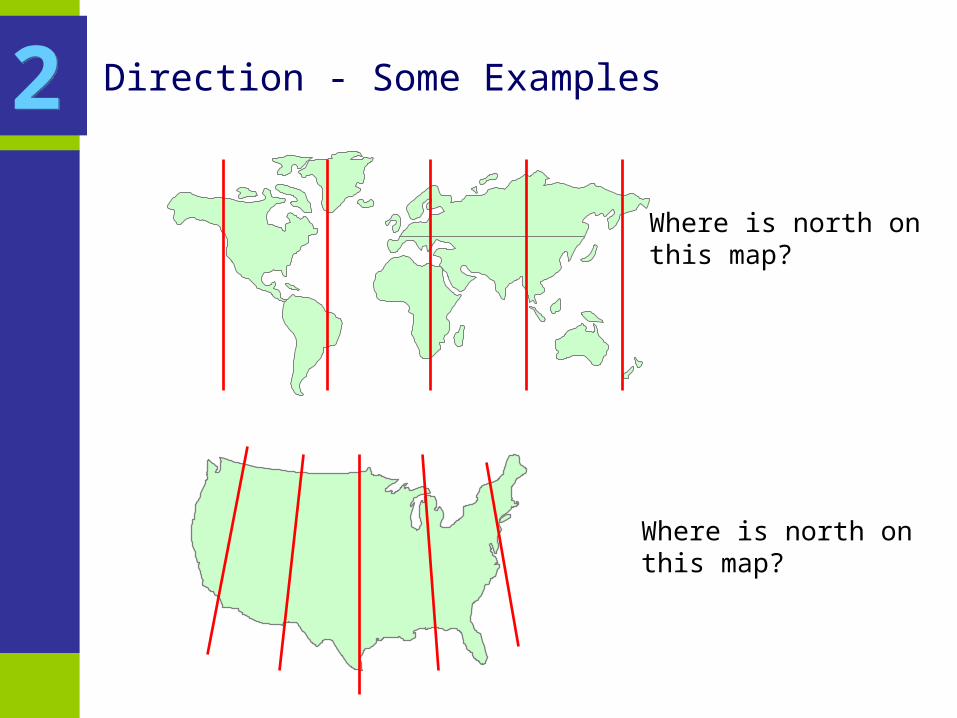
Direction - Some Examples
Where is north onthis map?
Where is north onthis map?
22
Legend
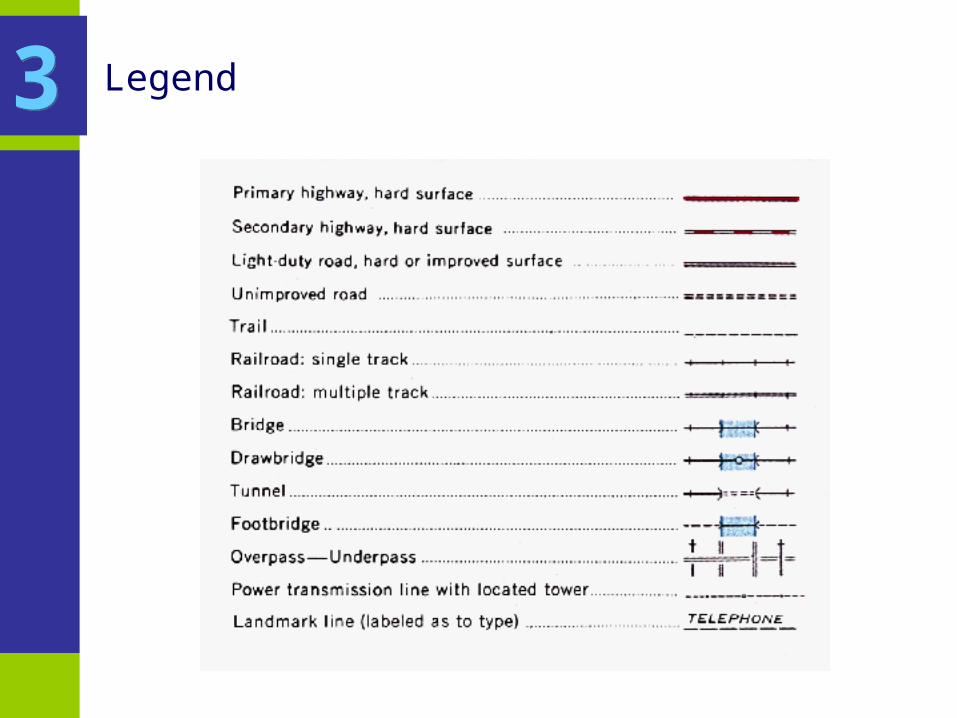
■ Nature and placement• List of symbols used on the map and their significance.• Symbols on the map should look exactly the same on the legend.• The choice of symbols is open, but they should portray a good
abstraction.• Some conventions are difficult to escape from.• Often, legends are not necessary if textual annotations are put
directly on the map.• Legend should be placed on an empty part of a map to create
some balance.
33
Legend33
Sources
■ Sources• Since a map is an information medium, it must be referenced.• Source for the base map.• Source for the information portrayed on the map (mostly for
thematic maps).• Possibility to verify information and the way it was interpreted.• Age, accuracy and reliability of data is important.• Also relevant to indicate how the data was processed, grouped,
generalized and categorized.• Only consider cities of more than 20,000.• Classes are equidistant.
44
Context Sensitive Elements
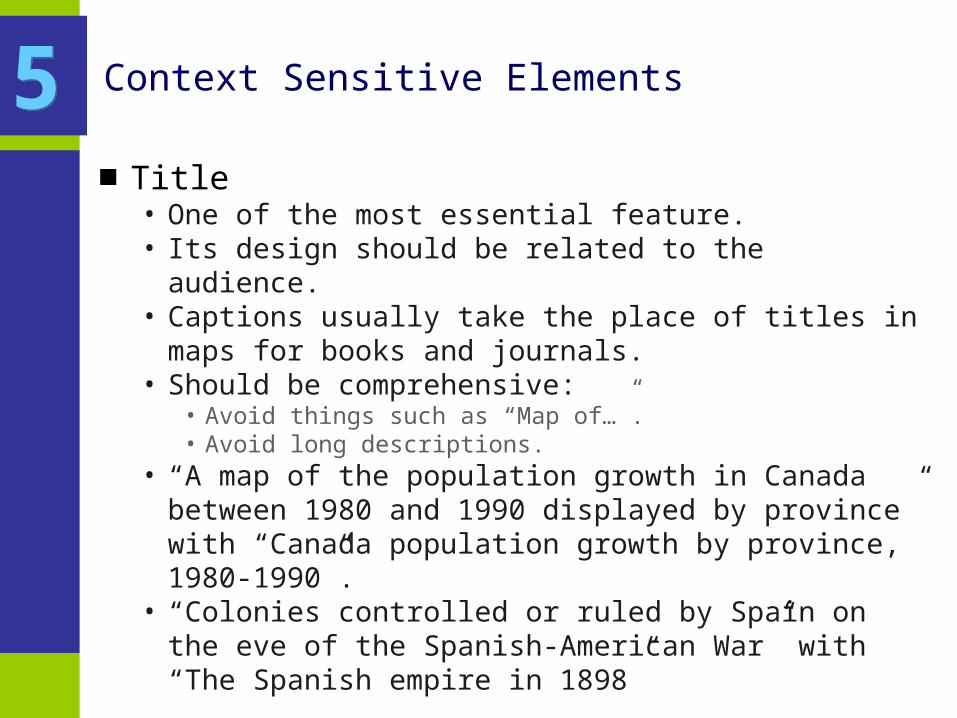
■ Title• One of the most essential feature.• Its design should be related to the audience.• Captions usually take the place of titles in maps for books and
journals.• Should be comprehensive:
• Avoid things such as “Map of…”.• Avoid long descriptions.
• “A map of the population growth in Canada between 1980 and 1990 displayed by province” with “Canada population growth by province, 1980-1990”.
• “Colonies controlled or ruled by Spain on the eve of the Spanish-American War” with “The Spanish empire in 1898”
55
Context Sensitive Elements
■ Projection• Influences the representation of area, distance and direction.• An experienced cartographer can identify the projection simply
by looking at the map.• Choose the appropriate projection for the mapping context.• Some projections are incompatible with some representations.• The projection used should be indicated on the map if precision
is important.• For several thematic maps, projection is factual.• Projection is mandatory for maps to be used in the digitizing
process.• Projection is indicated on all topographic maps.
55
Context Sensitive Elements
■ Cartographer• Name (initials) of the person(s) responsible for the map
production.• Could also be a corporate identity.• Seal of approval since the cartographer is linked to his(her)
output.■ Production date
• Several map are time sensitive.• The reader must thus know when the map was produced to
understand its context.• Illustrates how old is the information, and thus its accuracy.• For some maps, the year is all what is needed.• For maps, such as weather maps, the time precision can go up
to the minute.
55
Effective Communication Elements
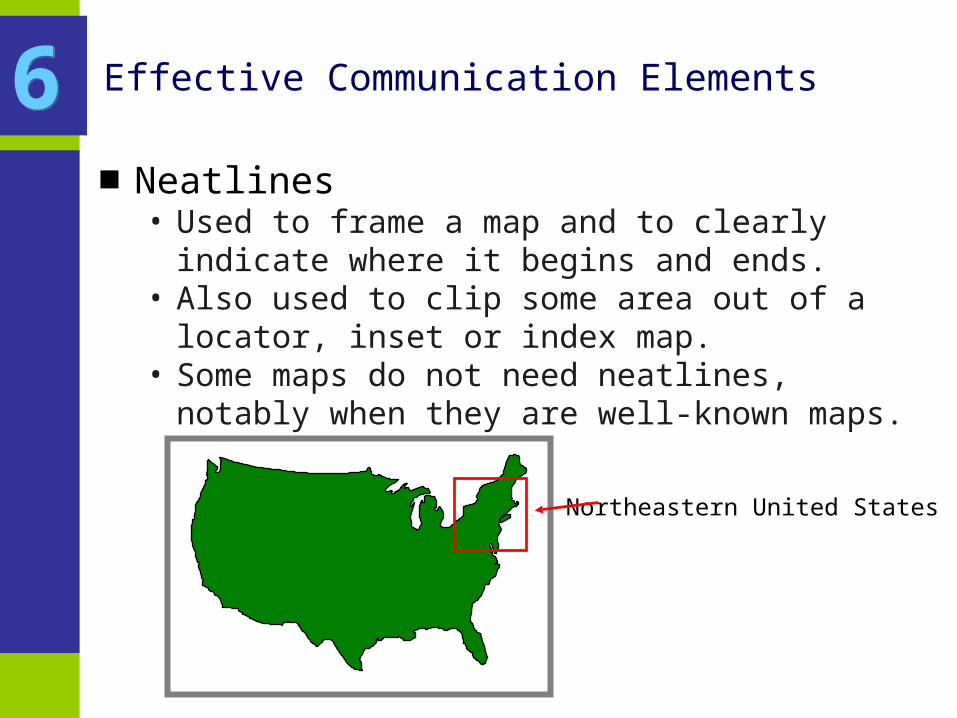
■ Neatlines• Used to frame a map and to clearly indicate where it begins and
ends.• Also used to clip some area out of a locator, inset or index map.• Some maps do not need neatlines, notably when they are well-
known maps.
66
Northeastern United States
Effective Communication Elements
■ Locator• Some maps show a location unfamiliar to the reader.• It is useful to put a locator map portraying where is location in
relation to a wider area.■ Inset
• Information on a specific part of a map may be too dense.• Useful in this context to put an inset map to zoom in.
■ Index map• Limit to the amount of information that can be put on a map.• Useful to place labels and other information on an index map.
66
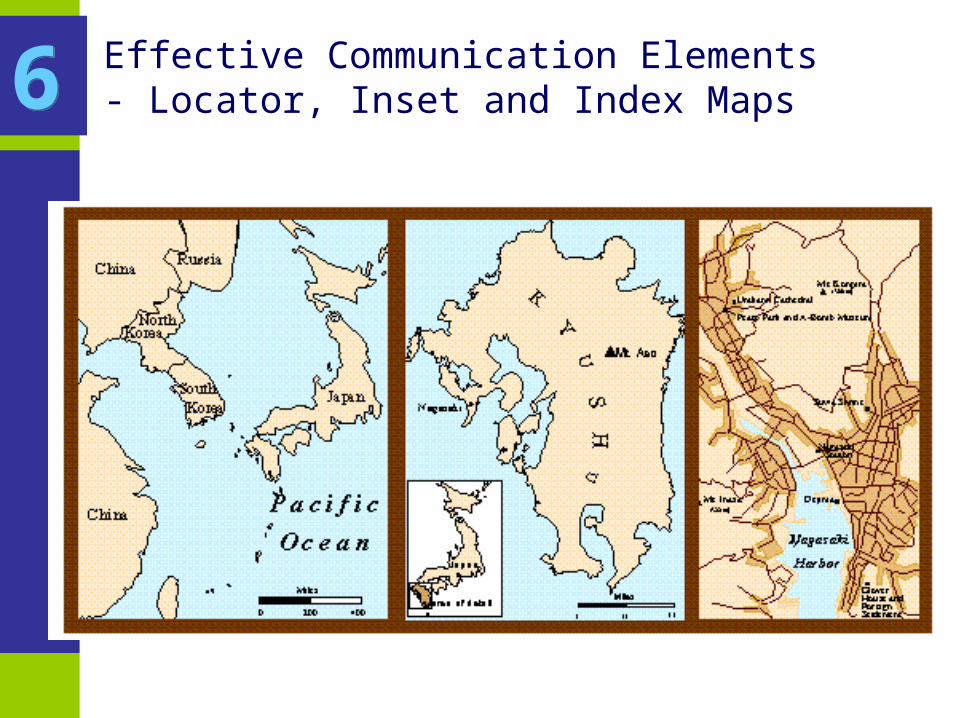
Effective Communication Elements- Locator, Inset and Index Maps66
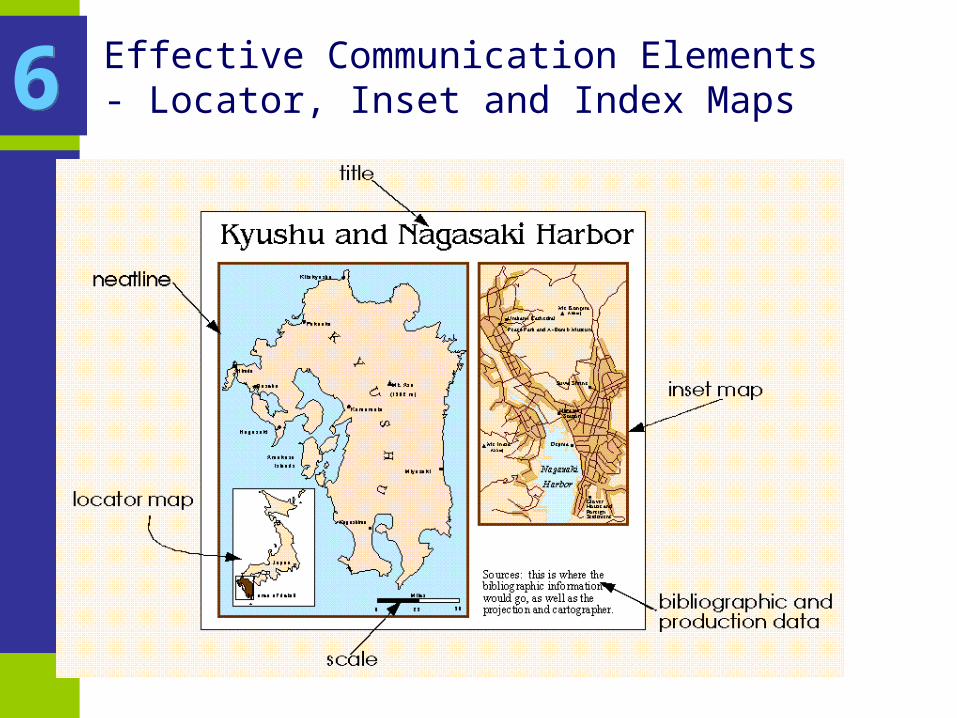
Effective Communication Elements- Locator, Inset and Index Maps66
Symbolization
■ 1. Visual Resources■ 2. Symbolization Strategies■ 3. Typography■ 4. Foreground and Background■ 5. Category Ranges
DD
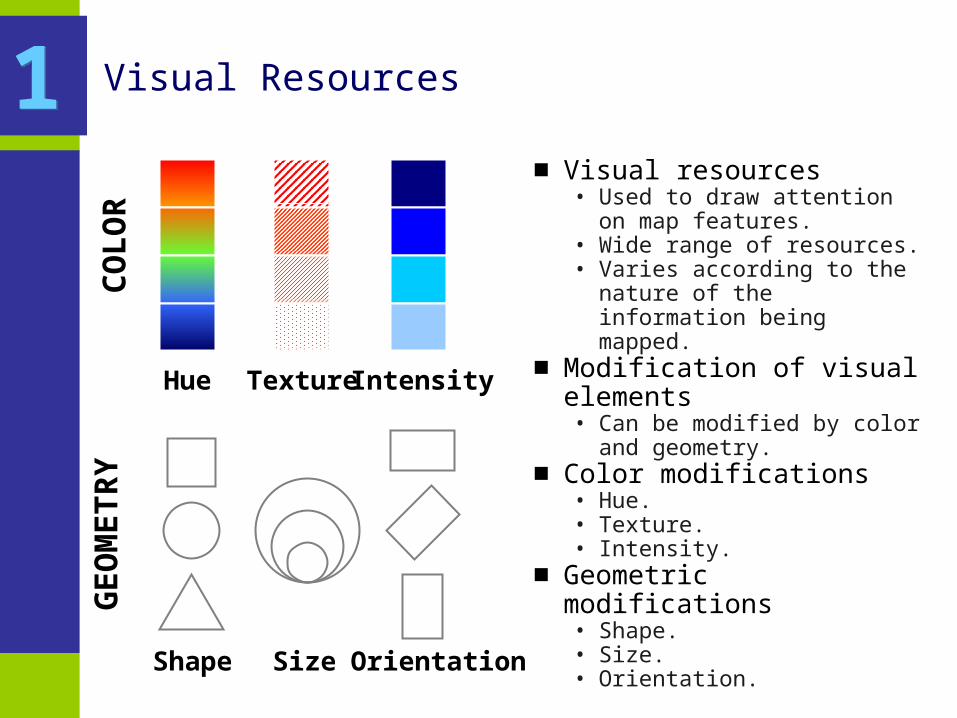
Visual Resources
■ Visual resources• Used to draw attention on map
features.• Wide range of resources.• Varies according to the nature of
the information being mapped.■ Modification of visual elements
• Can be modified by color and geometry.
■ Color modifications• Hue.• Texture.• Intensity.
■ Geometric modifications• Shape.• Size.• Orientation.
11
Hue TextureIntensity
Shape Size Orientation
CO
LO
RG
EO
METR
Y
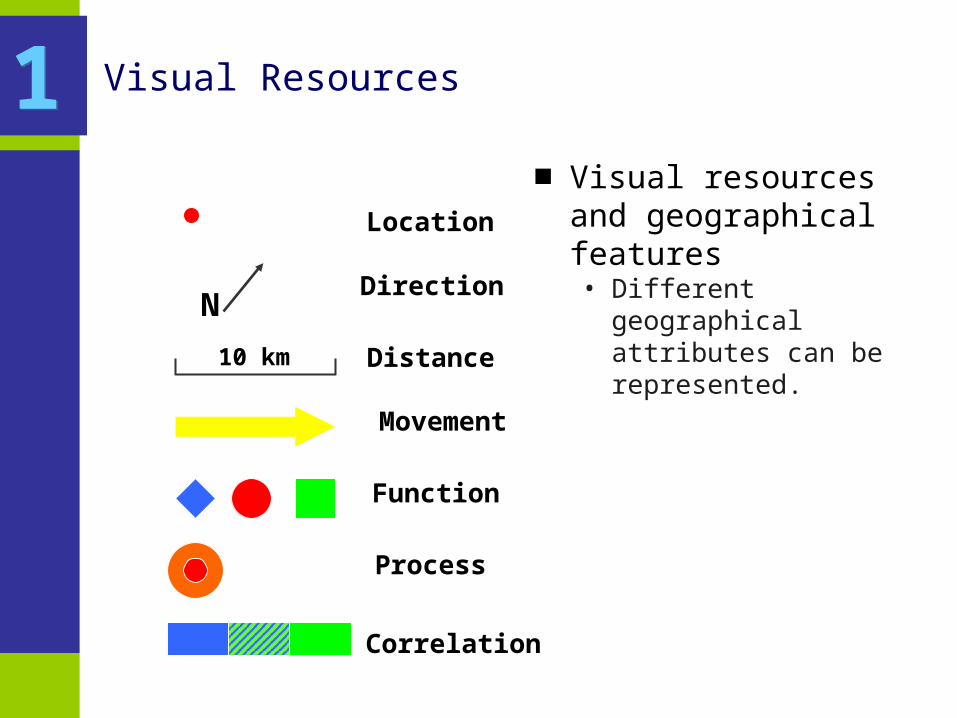
Visual Resources
■ Visual resources and geographical features• Different geographical attributes
can be represented.N
10 km
Location
Direction
Distance
Movement
Function
Process
Correlation
11
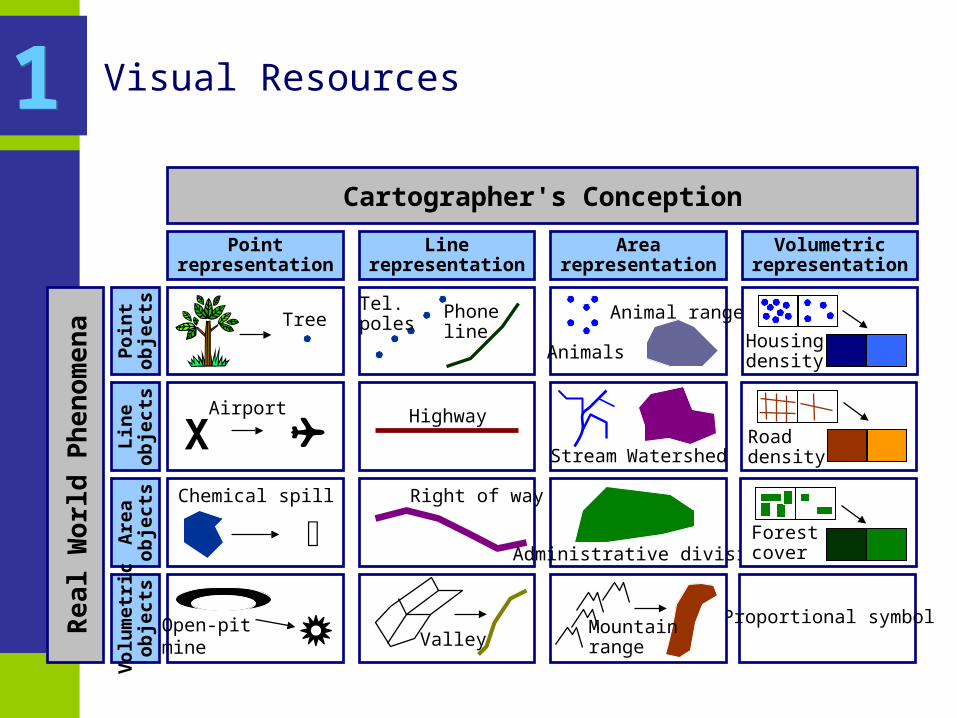
Visual Resources
Cartographer's Conception
Pointrepresentation
Linerepresentation
Arearepresentation
Volumetricrepresentation
Real W
orl
d P
hen
om
en
a
Poin
tob
jects
Lin
eob
jects
Are
aob
jects
Volu
metr
icob
jects
Tree
XAirport
Chemical spill
Open-pitmine
Highway
Tel.poles
Phone line
Right of way
Animals
Animal range
Stream Watershed
Administrative division
Housingdensity
Roaddensity
Forestcover
Proportional symbolMountainrangeValley
11
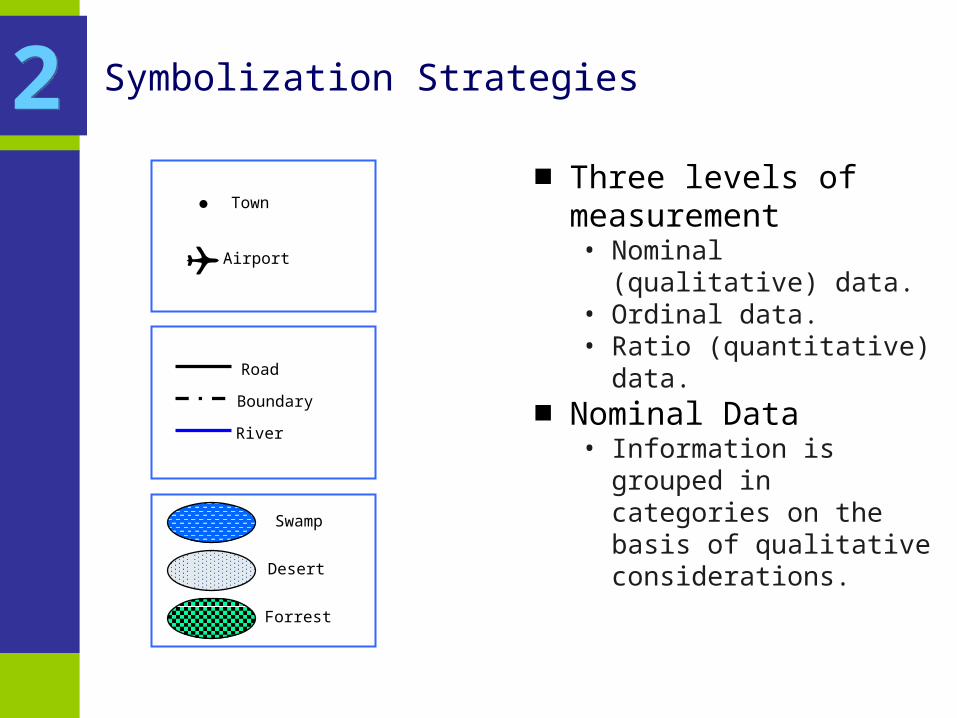
Symbolization Strategies
■ Three levels of measurement• Nominal (qualitative) data.• Ordinal data.• Ratio (quantitative) data.
■ Nominal Data• Information is grouped in
categories on the basis of qualitative considerations.
22
Town
Airport
Road
Boundary
River
Swamp
Desert
Forrest
Points
Lines
Polygons
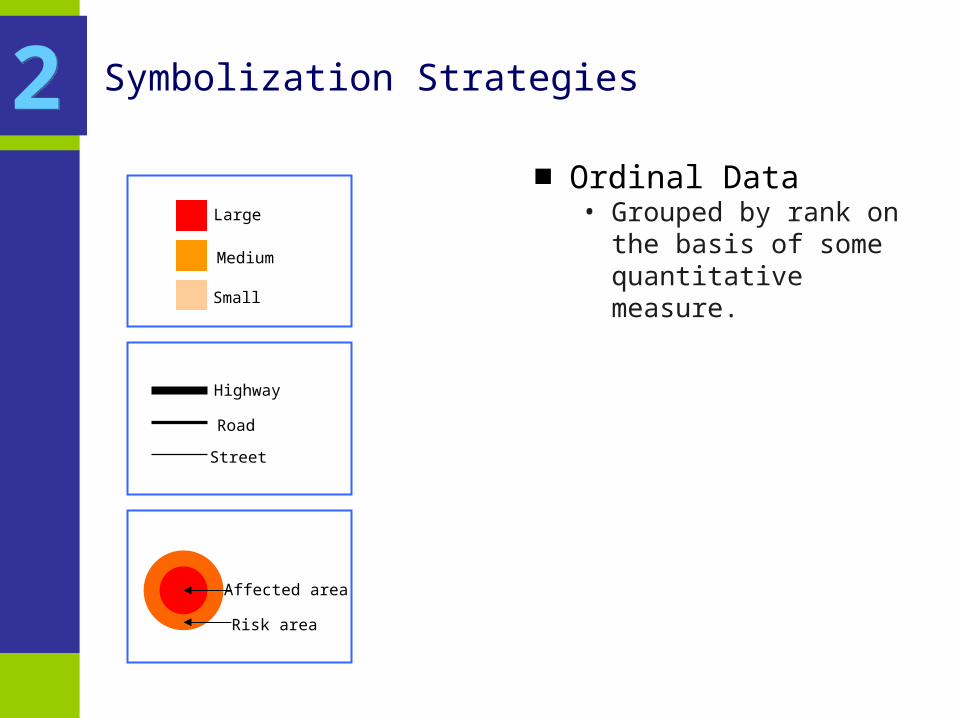
Symbolization Strategies
■ Ordinal Data• Grouped by rank on the basis of
some quantitative measure.Large
Medium
Small
Highway
Road
Street
Affected area
Risk area
Points
Lines
Polygons
22
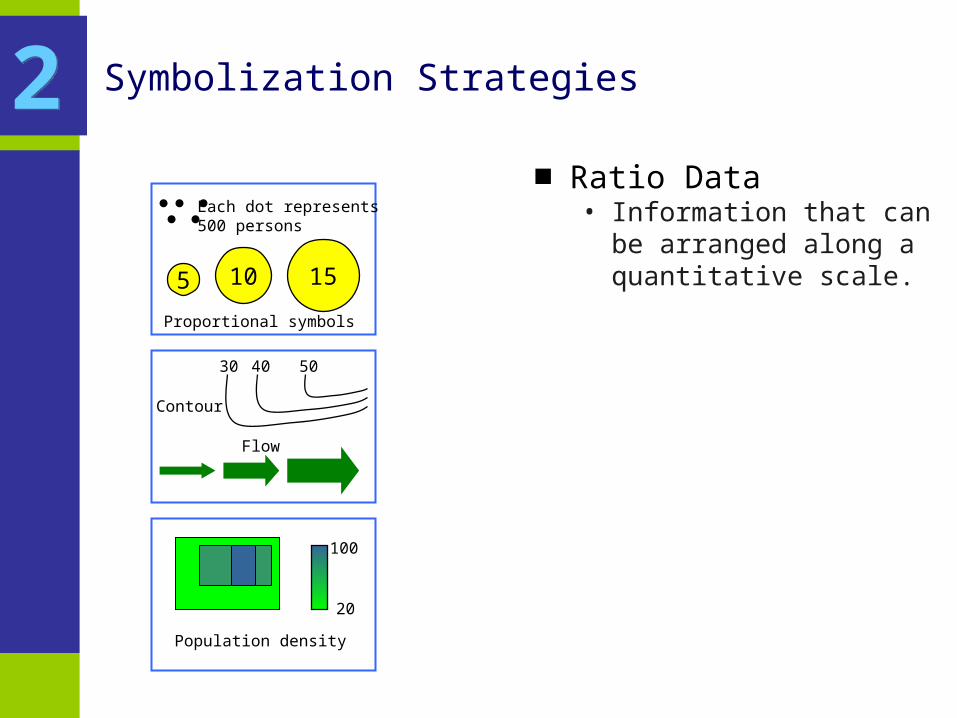
Symbolization Strategies
■ Ratio Data• Information that can be arranged
along a quantitative scale.5 10 15
Each dot represents500 persons
Proportional symbols
Flow
Contour
30 40 50
100
20
Population density
Points
Lines
Polygons
22
Typography
■ Definition• Placement and appearance of textual information.• Very difficult task.• The cartographer must be concerned about the content and the
form.• The content is the relevance and clarity of text.
• Avoid confusion and misinterpretations.• Avoid redundancies.• Avoid abbreviations.
• The form is the appearance of the text on the map.
33
Typography
■ Font• Refers to the shape and pattern of letters.• Hundred of fonts are available today, but stick to the basics.• Two major categories:
• Serif and Sans Serif.• Sans Serif fonts are easier to read, but readers put more attention on Serif fonts
(in theory). • Other variances are Bold and Italic.
• Both used to make text stand out.
•Font size used to play with prominence of the text.
• As well as UPPER CASE, lower case and Mixed Case.• The same information usually has the same font and font size.
33
Typography
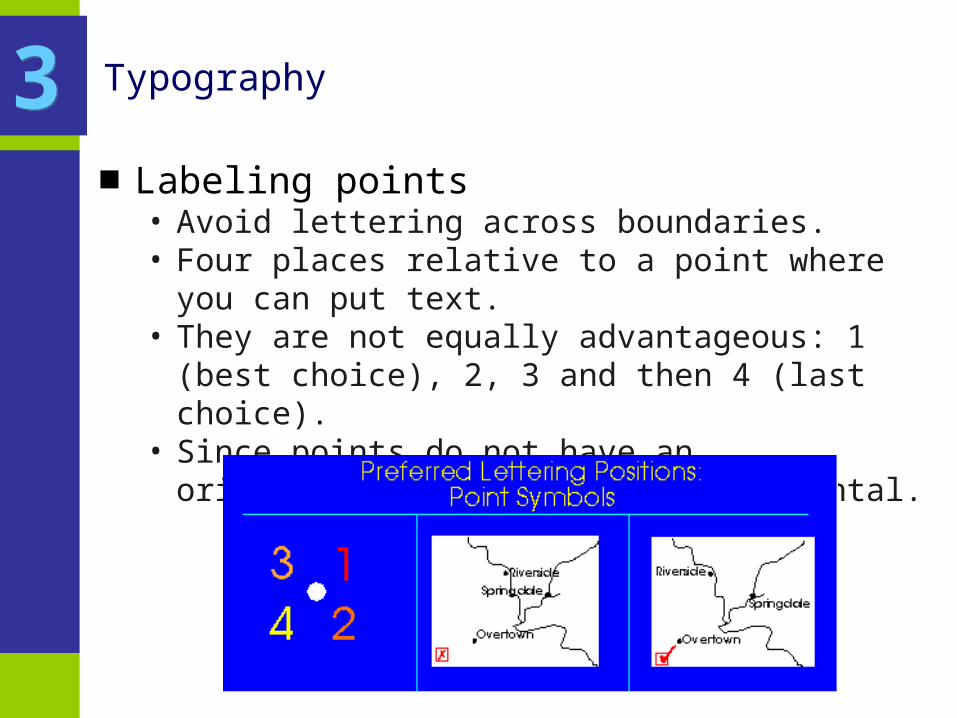
■ Labeling points• Avoid lettering across boundaries.• Four places relative to a point where you can put text.• They are not equally advantageous: 1 (best choice), 2, 3 and
then 4 (last choice).• Since points do not have an orientation, text should be
horizontal.
33
Typography
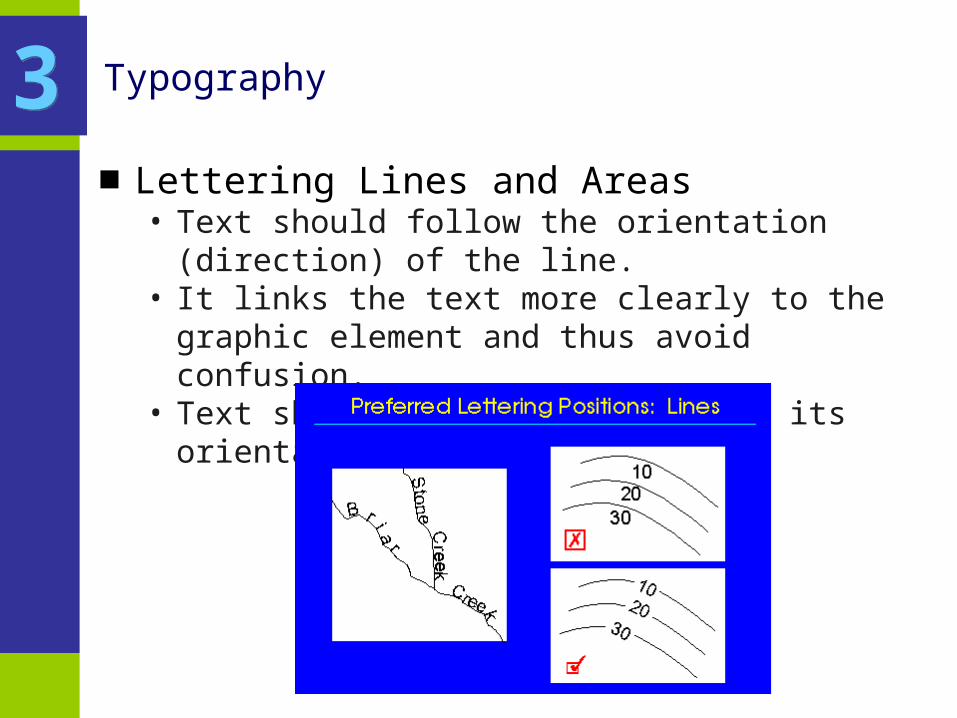
■ Lettering Lines and Areas• Text should follow the orientation (direction) of the line.• It links the text more clearly to the graphic element and thus
avoid confusion.• Text should occupy the area and its orientation.
33
Foreground and Background
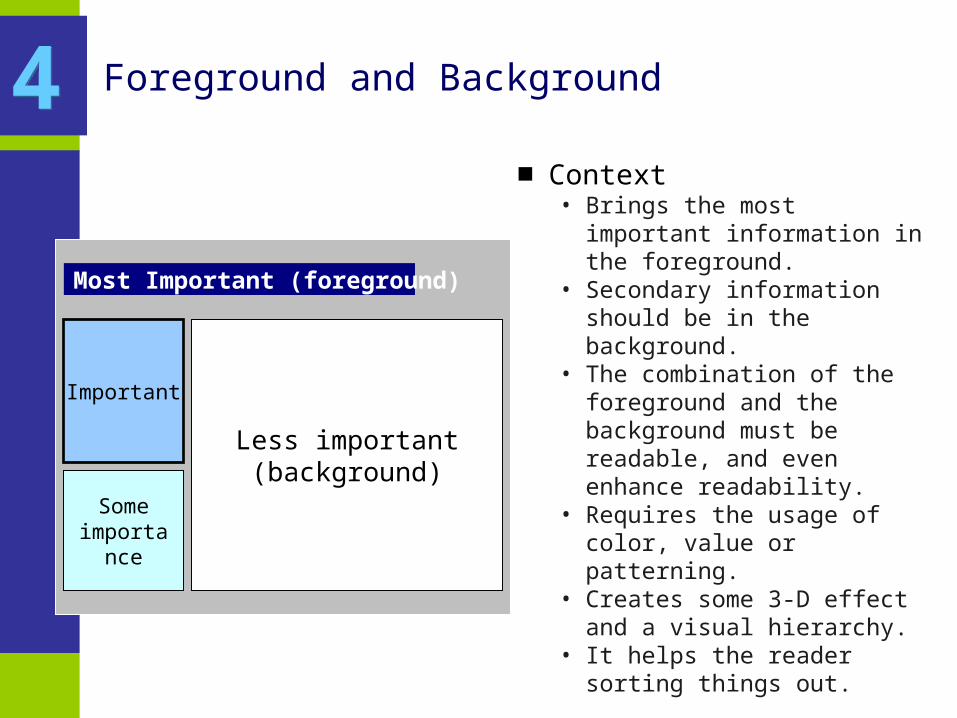
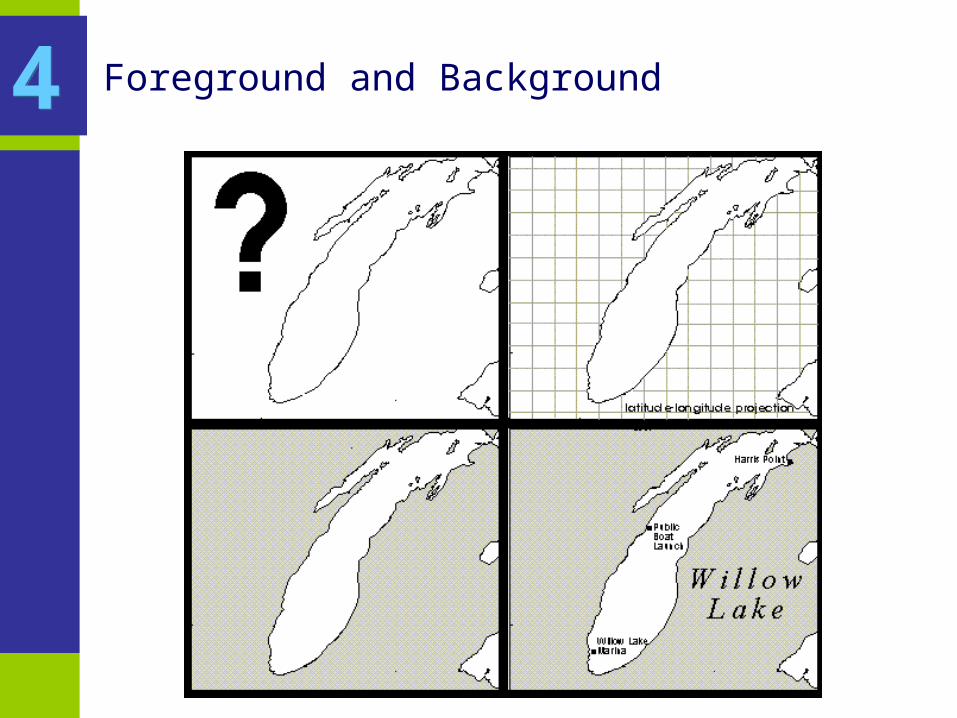
■ Context• Brings the most important
information in the foreground.• Secondary information should be
in the background.• The combination of the foreground
and the background must be readable, and even enhance readability.
• Requires the usage of color, value or patterning.
• Creates some 3-D effect and a visual hierarchy.
• It helps the reader sorting things out.
44
Less important (background)
Some importance
Important
Most Important (foreground)
Foreground and Background44
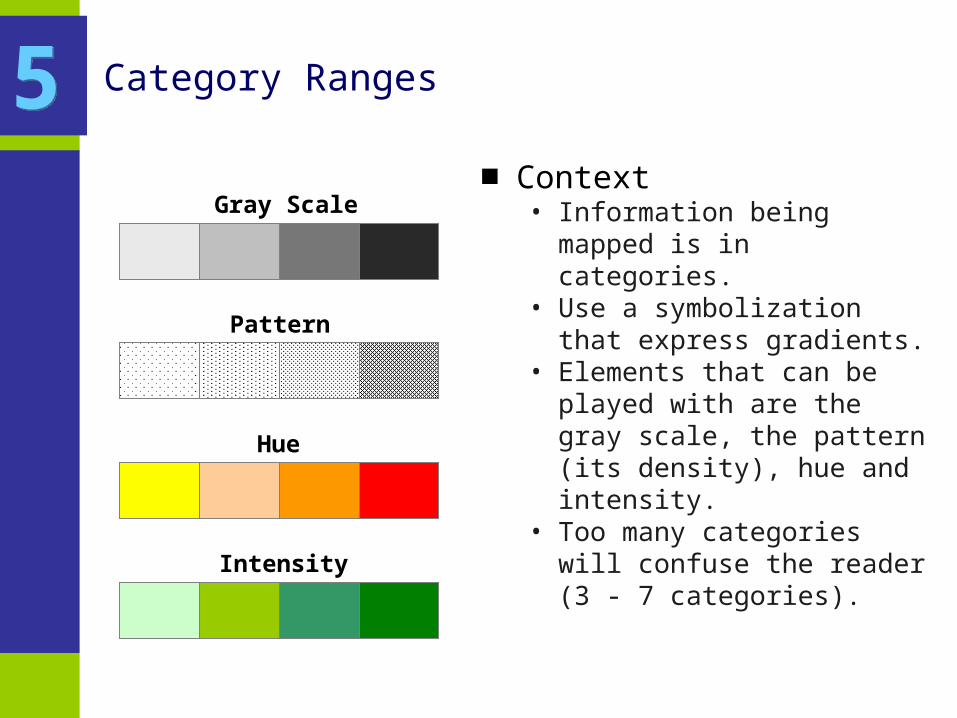
Category Ranges
■ Context• Information being mapped is in
categories.• Use a symbolization that express
gradients.• Elements that can be played with are
the gray scale, the pattern (its density), hue and intensity.
• Too many categories will confuse the reader (3 - 7 categories).
55Gray Scale
Pattern
Hue
Intensity