Embed Size (px)
Citation preview
GEOCHEMISTRY OF SMALL MOUNTAINOUS RIVERS OF PAPUA NEW GUINEA; LOCAL OBSERVATIONS AND GLOBAL IMPLICATIONS
A Thesis
Presented to
The Faculty of the School of Marine Science
The College of William and Mary in Virginia
In Partial Fulfillment
of the Requirements for the Degree of
Master of Science
by
Megan B. Raymond
1999
(
APPROVAL SHEET
This thesis is submitted in partial fulfillment of the requirements for the degree of
Master of Science
egan B. aymond
Approved, July 1999.
TABLE OF CONTENTS
Page
ACKNOWLEDGEMENTS ................................................... .iv
LIST OFTABLES ............................................................... v
LIST OF FIGURES ............................................................. vi
ABSTRACT ..................................................................... vii
INTRODUCTION .............................................................. 2
BACKGROUND ............................................................... 3
STUDY AREA .................................................................. 7
MATERIALS AND METHODS ............................................. 8
RESULTS ........................................................................ l4
DISCUSSION ................................... · ............................... 25
CONCLUSIONS ................................................................ 47
REFERENCES .......................... ··.············ ......................... 48
APPENDIX ............................... · ....... · .............................. 52
VITA .............................................................................. 56
iii
ACKNOWLEDGEMENTS
The support and guidance provided by my advisor, Dr. John D. Milliman, as well as my entire thesis committee of Dr. Jim Bauer, Dr. Catherine Chisholm-Brause, and Dr. Hugh Ducklow, throughout my research project are gratefully acknowledged. The analysis of my samples would not have been possible without the help of Catherine Chisolm-Brause, Mark Schrope, Pete Raymond, Libby MacDonald, Barry Grant and John Edmond. I would also like to thank my friends and family for their continual support of me in all capacities.
iv
LIST OF TABLES
Table Page
1. River names, catchment areas and headwater elevations ............................. 10
2. Concentrations of major inorganic solutes .............................................. 16
3. Dissolved loads and yields ............................................................... 20
4. Concentrations of DOC and POC ........................................................ 23
5. Results from carbon isotope analysis of POC ......................................... 24
6. Rainfall data 1990-1997 in Madang, PNG ............................................. 27
7. Supplementary data ........................................................................ 30
8. Inorganic solute data from large PNG rivers ........................................... 36
9. Examples or rivers and regions included in morphoclimatic budget. ............. .42
10. Morphoclimatic division of rivers ...................................................... .43
v
LIST OF FIGURES
Figure Page
I. TSS and TDS yield as a function of basin area ........................................ .4
2. Study Area ................................................................................... 9
3. TDS load versus basin area for sampled PNG rivers ................................. 21
4. PNG TDS yield as a function of basin area ............................................. 22
5. Monthly rainfall in Madang, PNG 1990-1997 ......................................... 26
6. Estimated monthly river discharge of sampled PNG rivers .......................... 29
7. Comparision of TDS concentration of sampled rivers to world average ............ 32
8. Chehalis R. and Santa Clara R. annual discharge, TDS load and concentration ... 38
9. Morphoclimatic division of annual riverine TDS export to ocean ................. .44
vi
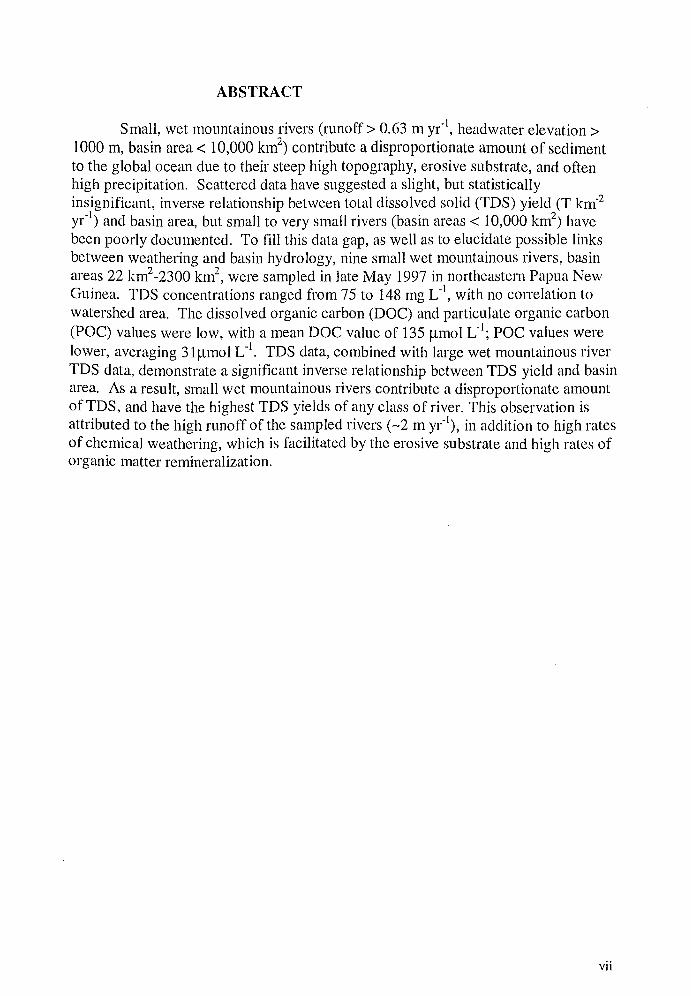
ABSTRACT
Small, wet mountainous rivers (runoff> 0.63 m yr"1, headwater elevation>
1000 m, basin area < 10,000 km2) contribute a disproportionate amount of sediment
to the global ocean due to their steep high topography, erosive substrate, and often high precipitation. Scattered data have suggested a slight, but statistically insignificant, inverse relationship between total dissolved solid (TDS) yield (T km-2
yr-1) and basin area, but small to very small rivers (basin areas< 10,000 km2
) have been poorly documented. To fill this data gap, as well as to elucidate possible links between weathering and basin hydrology, nine small wet mountainous rivers, basin areas 22 km2-2300 km2
, were sampled in late May 1997 in northeastern Papua New Guinea. TDS concentrations ranged from 75 to 148 mg L-1
, with no correlation to watershed area. The dissolved organic carbon (DOC) and particulate organic carbon (POC) values were low, with a mean DOC value of 135 f.Lmol L-1
; POC values were lower, averaging 3lf.Lmol L-1
• TDS data, combined with large wet mountainous river TDS data, demonstrate a significant inverse relationship between TDS yield and basin area. As a result, small wet mountainous rivers contribute a disproportionate amount of TDS, and have the highest TDS yields of any class of river. This observation is attributed to the high runoff of the sampled rivers (-2m yr-1
), in addition to high rates of chemical weathering, which is facilitated by the erosive substrate and high rates of organic matter remineralization.
vii
GEOCHEMISTRY OF SMALL MOUNTAINOUS RIVERS OF NORTHEASTERN PAPUA NEW GUINEA; Local Implications and Global Observations
INTRODUCTION
Rivers are the primary link between the continents and the oceans, and the
transport of solutes from rivers plays' a major role in oceanic chemistry. Mechanical and
chemical weathering within the watershed exert the primary control on river chemistry.
Although mechanical weathering is a physical process and chemical weathering is driven
by thermodynamic and kinetic processes, the two are coupled through the hydrodynamics
of a river system (Stallard and Edmond 1983). As such, chemical weathering is largely
dependent on the lithology of the source rocks, the elevation of the headwaters and relief
of the watershed, climate (i.e. rainfall, watershed vegetation and temperature), and
organic matter remineralization both within watershed soils and the river itself (Berner et
al, 1983; Meybeck, 1987; Berner, 1992; Drever and Zobrist, 1992; Meybeck, 1994). The
lithology of the source rocks in a river basin dictates the ions that will be weathered.
Organic matter remineralization increases the rate of chemical weathering through the
production of H+ ions (i.e. from carbonic acid), which dissolves rocks to release ions
from the bedrock. The relief of watershed topography enhances the rate of mechanical
breakdown of rocks, thereby increasing the surface area of exposed material and thus the
rate of chemical weathering (Lasaga et al. 1994 ). In areas of very high relief, soil
formation is limited, which increases the exposure of fresh rock and mineral surfaces and
hence chemical weathering (Stallard and Edmond 1983).
Small, wet mountainous rivers located in southeastern Asia and Oceania (runoff
> 0.63 m y(1, basin area< 10,000 km
2, headwater elevation> 1000 m above sea level)
represent a unique category of rivers because of their highly erosive substrate, steep high
topography, and exposure to seasonally heavy monsoonal rainfall (Milliman and
2
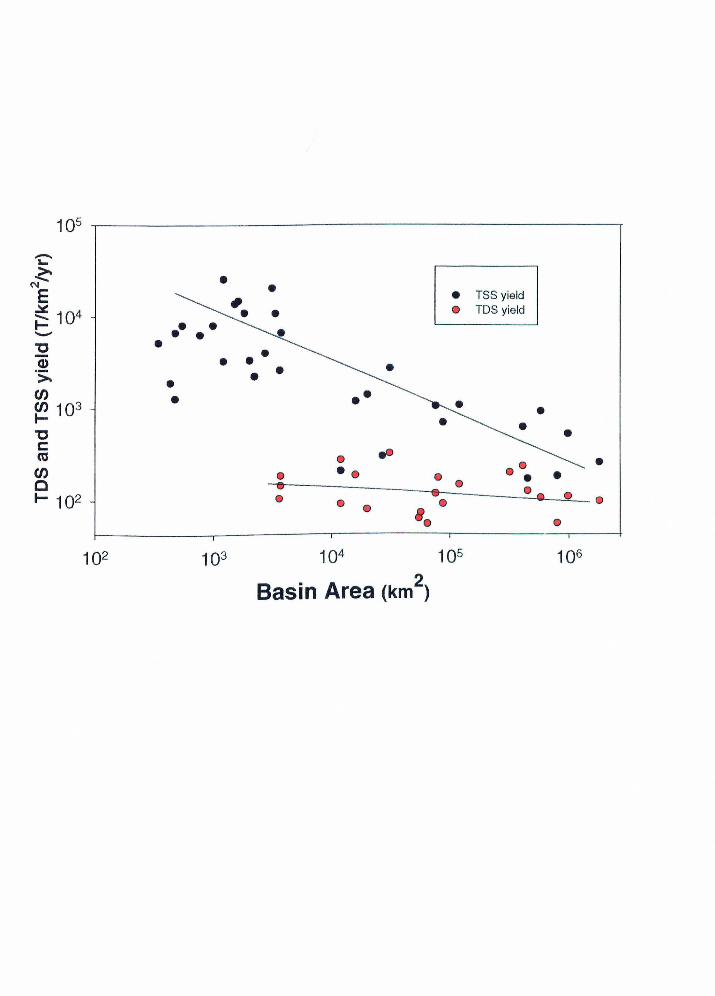
Syvitski, 1992). Due to the aforementioned characteristics, these rivers have high total
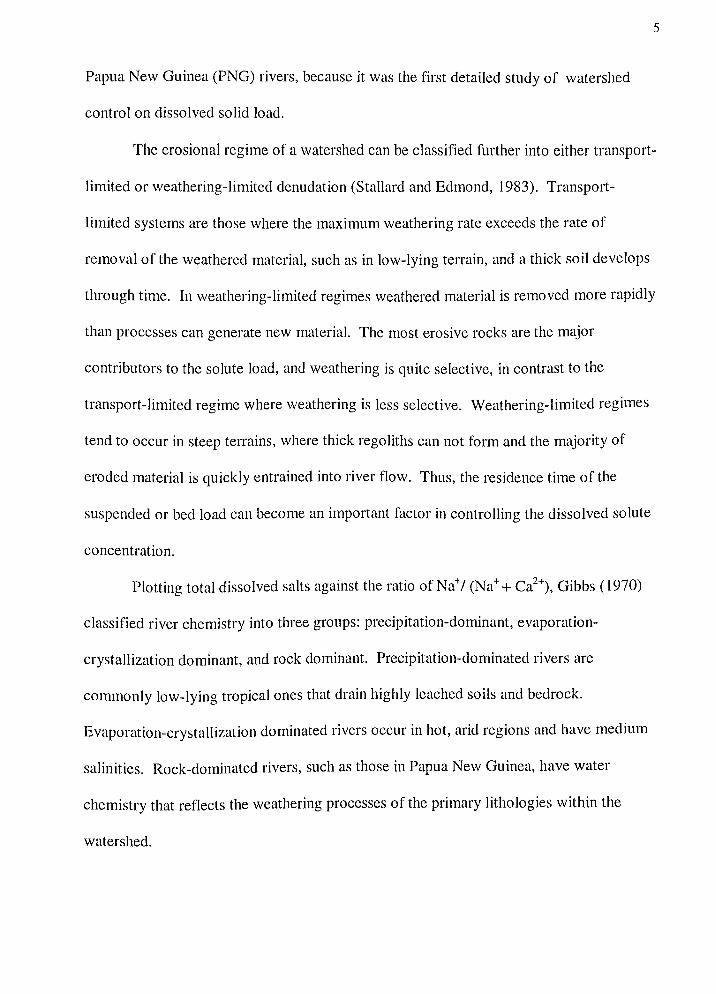
suspended sediment (TSS) yields (Figure 1 ), and thus contribute a disproportionately
large amount of sediment to the global ocean (Milliman and Syvitski, 1992). Visual
inspection of the few available total dissolved solids (TDS) data from wet mountainous
rivers suggests that chemical yield (i.e. TDS load/basin area) increases slightly with
decreasing basin area (Milliman, 1997) (Figure 1); however, the relationship is weak and
does not include data from rivers with basin areas smaller than 1000 km2.
The purpose of the present study was to quantify the yield of dissolved inorganic
components from small mountainous rivers of Papua New Guinea in order to identify the
possible links between physical and chemical weathering and basin hydrology in small to
very small river basins. Sampling such small rivers might help elucidate the factors
controlling weathering in these basins and also document the importance of these rivers
with respect to the export of TDS to the oceans. Because the rivers of New Guinea
discharge large quantities of sediment (estimated at 1.7 * 10 9 T y{1, about 10% of the
global total; Milliman, 1995) and water annually, the discharge of dissolved material
from small New Guinea rivers may have global relevance. Dissolved and particulate
organic carbon (DOC and POC, respectively) were also measured to document further
the hydrologic and biologic dynamics in these small basins.
BACKGROUND
PROCESSES CONTROLLING RIVER CHEMISTRY
Substrate lithology and erosional regime exert the dominant controls on the
dissolved load in the Amazon River basin, a large, wet mountainous river (Stallard and
Edmond, 1981; 1983; 1987). This river is interesting for comparison to the sampled
3
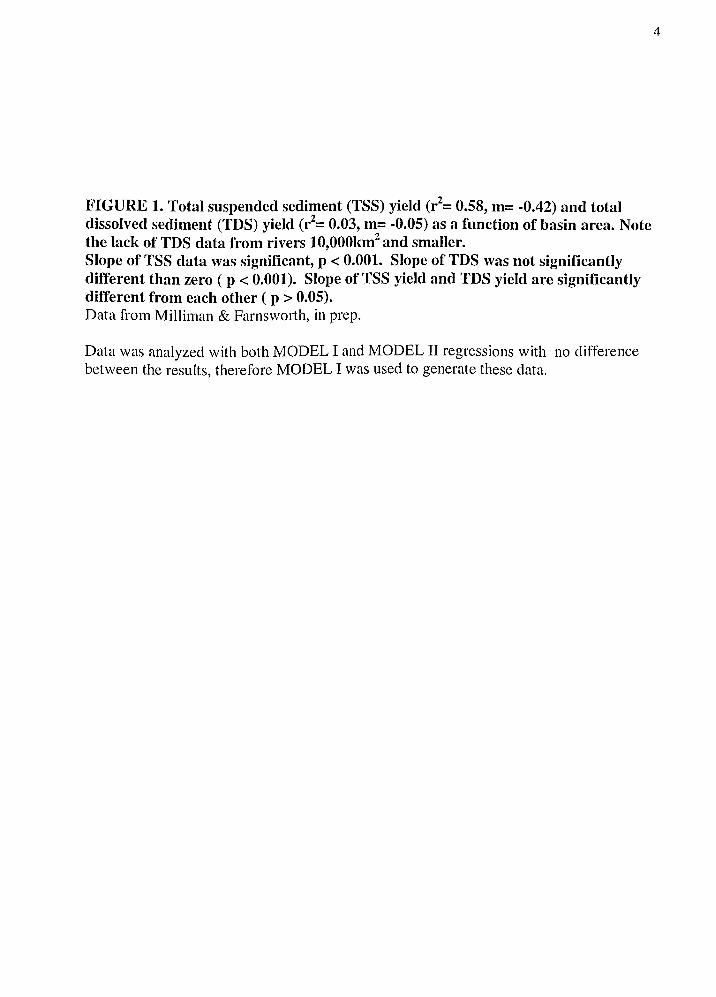
FIGURE 1. Total suspended sediment (TSS) yield (r2= 0.58, m= -0.42) and total dissolved sediment (TDS) yield (r2= 0.03, m= -0.05) as a function of basin area. Note the lack of TDS data from rivers 10,000km2 and smaller. Slope of TSS data was significant, p < 0.001. Slope of TDS was not significantly different than zero ( p < 0.001). Slope of TSS yield and TDS yield are significantly different from each other ( p > 0.05). Data from Milliman & Farnsworth, in prep.
Data was analyzed with both MODEL I and MODEL II regressions with no difference between the results, therefore MODEL I was used to generate these data.
4
105
-... ~ • N
E • TSS yield • ~ 104 • • TDS yield
- •• "C • - •• Q) • > • • • (/) • •• (/) 103 t- • "C • c: co • .. • (/) • • • • 0 • t- 102 •
'· 102 103 104 105 106
Basin Area (km2)
Papua New Guinea (PNG) rivers, because it was the first detailed study of watershed
control on dissolved solid load.
5
The erosional regime of a watershed can be classified further into either transport
limited or weathering-limited denudation (Stallard and Edmond, 1983). Transport
limited systems are those where the maximum weathering rate exceeds the rate of
removal of the weathered material, such as in low-lying terrain, and a thick soil develops
through time. In weathering-limited regimes weathered material is removed more rapidly
than processes can generate new material. The most erosive rocks are the major
contributors to the solute load, and weathering is quite selective, in contrast to the
transport-limited regime where weathering is less selective. Weathering-limited regimes
tend to occur in steep terrains, where thick regoliths can not form and the majority of
eroded material is quickly entrained into river flow. Thus, the residence time of the
suspended or bed load can become an important factor in controlling the dissolved solute
concentration.
Plotting total dissolved salts against the ratio of Na+/ (Na + + Ca2+), Gibbs ( 1970)
classified river chemistry into three groups: precipitation-dominant, evaporation
crystallization dominant, and rock dominant. Precipitation-dominated rivers are
commonly low-lying tropical ones that drain highly leached soils and bedrock.
Evaporation-crystallization dominated rivers occur in hot, arid regions and have medium
salinities. Rock-dominated rivers, such as those in Papua New Guinea, have water
chemistry that reflects the weathering processes of the primary lithologies within the
watershed.
In a study of the weathering regime along the Amazon River, Stallard and
Edmond (1987) found that the most easily eroded minerals are precipitates, followed by
the mafic minerals, and then sialic phases. In terms of rock susceptibility to chemical
weathering, Meybeck ( 1987) found a similar order (in order of decreasing rates of
weathering): rock salt> gypsum>> carbonate rocks>> serpentine, marble, amphibolite
>shales> volcanic rocks (basalts)> gabbro, sandstone> granite, gneiss, micaschist.
Waters draining rocks that have been subaerially exposed for a longer period of time do
not have as high a concentration of dissolved ions as waters draining more recently
exposed rocks of the same lithology as ions are continually leached from their parent
material through time (Berner and Berner, 1996).
Subsurface flow of groundwater also may affect the concentrations of ions and
organic matter found in rivers. If the permeability of the rocks and soils is high, a large
proportion of rainfall may infiltrate the surface and become part of the groundwater
comprising base flow. Because of the increased contact time in the subsurface and the
presence of organic acids that facilitate chemical weathering, groundwater discharged to
the river can be solute-rich (Drever, 1997). In addition, if basetlow is a significant
contributor to the fluvial discharge of rivers, the dissolved organic carbon (DOC) might
be low, due to loss by microbial decomposition, adsorption and precipitation (Stevenson,
1985).
The major controls on dissolved solids concentrations of small tropical
mountainous rivers therefore are thought to be interbasinal processes, namely chemical
weathering facilitated by organic matter respiration. Subsurface flow may be a major
6
contributor to the discharge of rivers and therefore of dissolved ion concentration, but it
is difficult, if not impossible, to quantify groundwater importance in the PNG system.
TSS vs. TDS SAMPLING
TDS concentrations in rivers, in contrast to TSS concentrations, remain relatively
stable in many rivers, generally being highest during low flow and lowest during high
flow (Walling, 1984 ). This temporal stability of TDS concentrations increases the
probability of procuring a representative TDS sample, because chemical erosion is a
continuous and relatively constant function of time (Garrels and MacKenzie, 1971 ). TSS
concentrations, in contrast, are more episodic by nature of their export dynamics, and a
more rigorous sampling procedure is necessary to obtain a representative sample
(Walling, 1984).
STUDY AREA
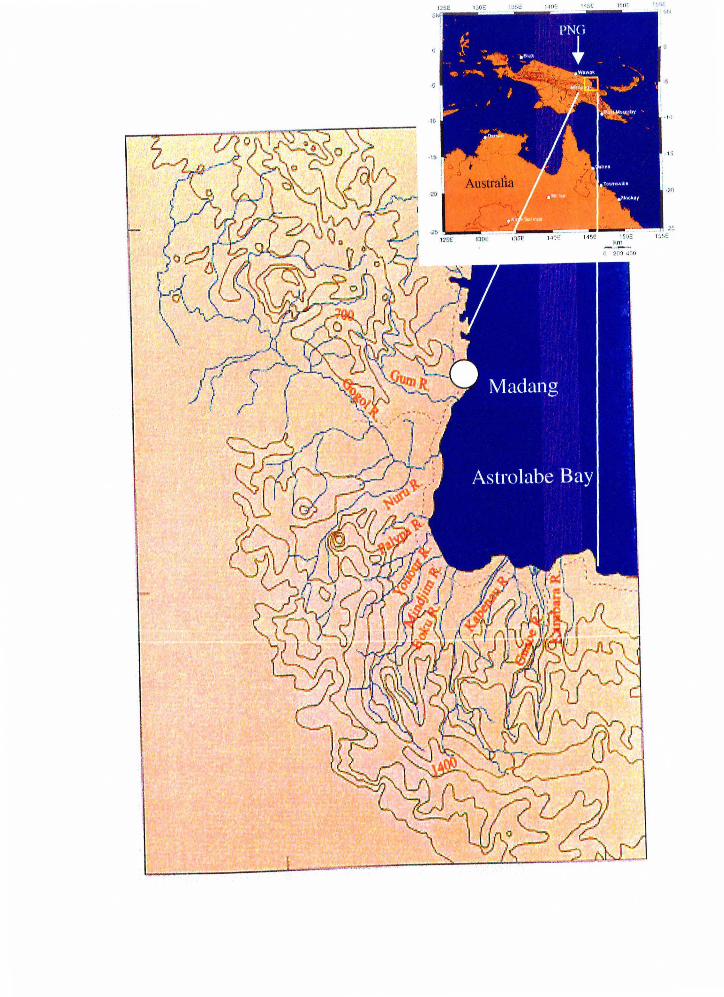
Papua New Guinea (PNG) encompasses the eastern half of the island of New
Guinea, north of Australia, in the western subequatorial Pacific Ocean (Figure 2). New
Guinea occupies approximately 800,000 km2 in area, representing less than I% of the
total global land area that drains into the ocean; however, rivers on this island discharge
-1.7 * 109 T of sediment per year, or about 10% of the global total (Milliman, 1995).
The island transports sediment from the actively uplifting mountains to the ocean via a
number of small rivers. New Guinea does have a few larger river systems, including the
Mamberamo, (85,000 km2), the Sepik (72,000 km2
) and the Fly, (76,000 km2
) (Milliman,
1995), but a substantial portion of the annual sediment load is discharged by the
numerous rivers whose basin areas are less than 5,000 km2• A few of the larger river
7
systems' TDS export have been documented (Petr, I 983), but no TDS data exist for
rivers smaller than 13,200 km2•
8
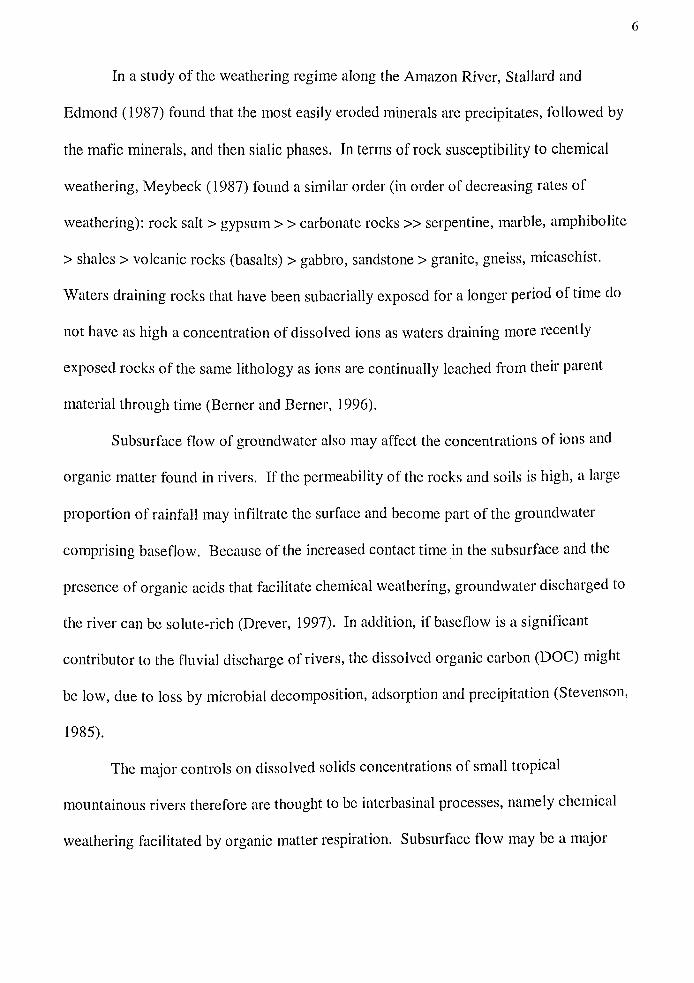
The study area is located southeast of the coastal town of Madang (- 5°20' S and
145°50'E) (Figure 2). The climate is monsoonal, with northwestern winds prevailing
from December through March, and with southeast trade winds dominating the remainder
of the year. The temperature is warm in the lowland areas, with an average high and low
of 30°C and 23°, respectively. Temperatures decrease with altitude, on the average of 8 °
for the first 1000 min elevation and 5° for each additional 1000 m (Robinson et al.,
I 976). Rainfall is moderate to heavy for most of the year, averaging about - 4 m yr" 1 in
the lowlands, but the higher elevations may receive more (Robinson et al, 1976).
Heaviest rains t~tll during the NW monsoon season. The area is vegetated by primary
rainforest, and shows little anthropogenic disturbance.
Nine rivers were sampled in this study (Table 1). All drain the knife-edged
Finesterre Range (average elevations 2000 m), and with the exception of the Tapa R.,
which is a tributary to the Gogo! R., all empty into Astrolabe Bay. The lithology of the
drainage basins is dominated by Cenozoic marine carbonates and sandstones. Basalt,
welded tuff, and other pyroclastics comprise minor components of the bedrock (Robinson
et al., 1976). The sampled rivers can be divided into two distinctly different geomorphic
classes: one lowland river (the Gum R., headwaters approximately 750 m in elevation)
and eight mountainous rivers (all of whose headwaters are 1000 m and greater).
MATERIALS AND METHODS
The 9 rivers were sampled May 20-24, 1997, at the end of the monsoon season,
during the falling hydrograph. Water samples were collected by wading into the middle

Figure 2. Study area in PNG. See inset for location on island. Contour interval = 200 m for lower map, I 000 m for inset.
9
of the river, free from riverbank influences, and at a location upstream from any tidal
influence. Water samples were taken with an acid-washed plastic bucket
11
that had been rinsed several times with ambient river water. Estimated water velocities in
all rivers were 50 - 100 cm3 s·1• Samples were analyzed for major inorganic solutes, and
DOC and POC.
INORGANIC SOLUTES
Samples for major dissolved inorganic solutes were filtered through pre-weighed
0.45-Jlm Gelman polycarbonate filters using a hand-operated vacuum pump. Volumes
filtered ranged from 0.2 L to I L, and the filtered samples were placed in pre-acidified
(10% 2N HN03-), sterile 50-ml plastic centrifuge tubes. Duplicate samples were
collected at each site.
The dissolved inorganic samples were analyzed for total silicon and sulfur with an
inductively-coupled plasma atomic emission spectrophotometer equipped with an axial
torch (ThermoJarrell Ash). Standard solutions were made by dilution of certified
standards to span concentrations in the samples (0-50 ppm), and were used to establish
calibration curves. The optimal wavelengths for each element were chosen using the
standard. The probe was acid-washed between each sample, and analyses were run in
quadruplicate.
Samples were analyzed for Na+, K+, Ca2+, and Mg2+ in Dr. John Edmond's
laboratory at MIT by flame atomic absorption (Perkin Elmer 403). Standards spanned
the anticipated concentrations in the samples (0-11 0 JlM), and a Lanthanum spike was
added to each standard and sample for matrix stability. Linearity
was achieved with all four calibration curves (r2 = 0.99). Samples were diluted 50:1 for
the Mg2+ analysis because of the high concentration of this ion.
BICARBONATE
12
The bicarbonate samples were stored in 50-ml glass serum vials, previously baked
at 550°C for four hours, and the samples were preserved with 2 111 of a saturated solution
of HgCh. The vials were purged with N2 gas to remove any C02 in the vial. In the field,
the samples were injected into the serum vials using 22-gauge needles, in order to
minimize exchange with the atmosphere, and duplicates were collected.
The pH was measured in the lab (a consequence of losing the field pH meter en
route to PNG). The validity of this method of pH measurement was confirmed by a field
test at VIMS. To do this, five water samples from the Mattaponi R. (a tributary to the
York R.) were collected using the PNG method, and then stored for 4 weeks in similar 50
ml glass serum vials as were used in PNG. The pH was measured at the time of sampling,
and again after 4 weeks of refrigerated storage. There was no difference between the two
values (pH= 7.1 ± 0.0), indicating that measuring the pH in the lab, following addition of
HgCh to field samples, provided accurate pH values.
Bicarbonate was measured on a Shimadzu 5000A Total Organic Carbon analyzer
used in total inorganic carbon mode. The acidified sample was injected into a reservoir,
with the resultant C02 measured by non-dispersive IR (NDIR) spectroscopy, and
compared with standard solutions ranging from 0 to 3500 !lM in concentration. This
provided an estimate of the total amount of inorganic carbon (TC02) in the sample. The
pH was also measured and the speciation of the carbonate system components calculated
using the dissociation constants at standard temperature and pressure (Drever, 1997).
Alkalinity also was measured by titration for all samples to re-check the TC02 and pH
methods. Bicarbonate was also estimated using a mass-balance approach to balance the
cations and anions on a milliequivalent basis.
DISSOLVED ORGANIC CARBON
Water for DOC analysis was filtered through 0.7 ~m GF/F Whatman disposable
syringe filters (pre-soaked for 2 hours in Ultrapure H20), and the filtrate was collected in
acid-washed 45-ml polycarbonate vials. Samples were preserved with 100 ~L of 2M
HCl, and duplicate samples were collected at each site.
DOC was quantified using a Shimadzu 5000A Total Organic Carbon analyzer.
The sample was acidified (from field preparation) to convert inorganic carbon to COz,
which was stripped from the sample by bubbling with ultra-high purified air for 4
minutes. The sample was then injected onto aPt-alumina catalyst at 680° to oxidize the
organic carbon, and the resulting C02 was measured by NDIR spectroscopy and
compared to standard solutions spanning 0-100 ~M in concentration.
PARTICULATE ORGANIC CARBON
The POC was collected by filtration of water samples through 0. 7 J..lm GF/F
13
What man filters ( 45-mm diameter). All filters were been previously baked at 550° for 4
hours. Water was filtered until the filter became visibly colored, with the total amount of
sample filtered varying between 0.5 L to 1.5 L. After sampling, the filters were placed in
a dessicator and dried. Drying time was rapid ( 15-45 min). The dried filters were then
placed on a piece of baked aluminum foil with baked forceps, and wrapped and stored in
an air-tight Ziploc bag. Duplicate samples were not collected.
14
Two 13-mm sub-cores were taken from the GF/F filter for analysis on a Fisons
CHN elemental analyzer. A sulfanilamide standard was used (weights ranging from
0.065 mg to 1.6 mg) to establish a linear calibration curve (r2 = .98) to calculate POC
concentration. The remainders of the filters were sent to the Center for Accelerator Mass
Spectrometry at Lawrence Livermore National Laboratory (LLNL) for natural 14C
analyses. Splits of the samples ( -10% of the total) were taken for 13
C analyses, which
were analyzed by isotope ratio mass spectrometry (IRMS) by LLNL (Williams and
Gordon, 1970).
MAP WORK
Topographic and geologic maps were used to calculate drainage basin area and
identify the dominant lithologies of the basin area. Watershed boundaries were drawn on
area topographic maps using topographic highs, and digitized using a Numonics
Corporation Electronic Graphics Calculator to calculate basin area. Topographic maps
(1: 100,000 scale) were made by aerial photography in 1973, and estimated errors were±
30 m in the horizontal direction, and± 10 m in the vertical, indicating a range of error of
the watershed areas to be from 0.06% in the Gogol R. to 6% in the Boku R. Elevations of
headwaters were estimated by visual inspection of the same topographic maps. The
dominant lithologies in the watersheds were identified using the Madang quadrangle
geologic map and map notes (Robinson et al, 1976).
RESULTS
MAJOR INORGANIC SOLUTES
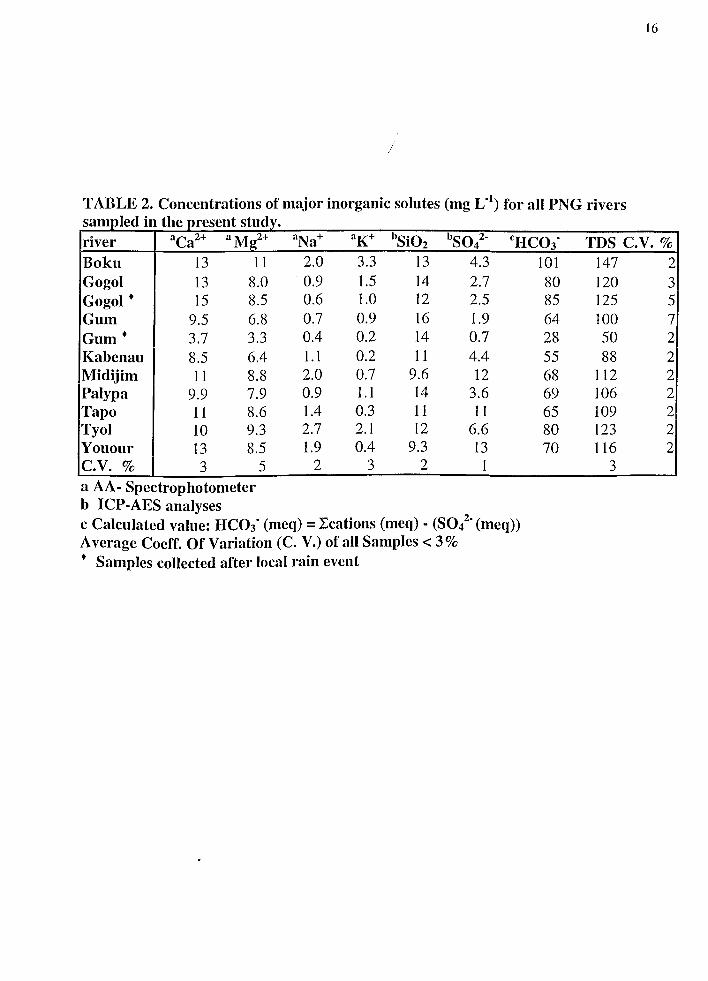
The TDS concentrations of all samples ranged from 50 to 148 mg L"1, averaging
111 mg L"1 (Table 2). Ca2+ (8- 15 mg L"1) and Mg
2+ (7- 11 mg L"1
) comprised an
average of 90% of the total cations, and were present in almost equal proportions; Na+
and K+ were present in far smaller concentrations (0.3 - 3 mg L" 1). The average
coefficient of variation for all duplicates was less than 3%. The dominant anion was
HC03-, determined by both direct analysis and the subtraction of S042
- (the only other
significant anion ti"om the total cations. Because the cations and anions must balance,
this is an acceptable, though not ideal, method (J. Edmond, pers. comm.). This
calculation was necessary because the anions (i.e. HC03-) were approximately two times
higher than the cations on a milliequivalent basis (average cations= 1218 meq. ± 306,
average anions= 2556 meq. ± 735). This imbalance may have been caused by poor
sampling procedure. For example, since the DIC samples were not filtered, any
particulate CaC03 would contaminate the sample resulting in high HC03-. DIC samples
must be filtered when working in a carbonate environment to avoid this. The dissolved
solids in all nine rivers were dominated by Mg2+:Ca2+/ HC03-, which accounted for 80%
of the total dissolved inorganic solutes. There was no significant correlation (p > 0.05)
between TDS concentration and basin area (Table 1 and 2).
15
16
TABLE 2. Concentrations of major inorganic solutes (mg L"1) for all PNG rivers
I d- th t t l samp.e Ill e presen s uuy. river aca2+ aM~2+ aNa+ al{+ hSiOz bsol· cHC03-
Boku 13 II Gogo I 13 8.0 Gogol • 15 8.5 Gum 9.5 6.8 Gum • 3.7 3.3 Kabenau 8.5 6.4 Midijim II 8.8 Palypa 9.9 7.9 Tapo II 8.6 Tyol 10 9.3 Youour I3 8.5 c.v.% 3 5 a AA- Spectrophotometer b ICP-AES analyses
2.0 0.9 0.6 0.7 0.4 I. I 2.0 0.9 1.4 2.7 1.9
2
3.3 13 4.3 1.5 14 2.7 1.0 I2 2.5 0.9 I6 1.9 0.2 I4 0.7 0.2 II 4.4 0.7 9.6 I2 I. I 14 3.6 0.3 II II 2.1 I2 6.6 0.4 9.3 I3
3 2 I
c Calculated value: HC03- (meq) = L:cations (meq)- (S042-(meq)) Average Coeff. Of Variation (C. V.) of all Samples< 3% • Samples collected after local rain event
101 80 85 64 28 55 68 69 65 80 70
TDS C.V.% 147 2 120 3 125 5 IOO 7 50 2 88 2
II2 2 106 2 I09 2 123 2 II6 2
3
17
Both the Gum and Gogol rivers were sampled before and after an intense evening
rainstorm; TDS on the Gum R. decreased by half (100 vs. 50 mg L-1) as a result of
increased discharge following the storm, whereas Gogol R. TDS remained essentially the
same (120 vs. 125 mg L"1). The decrease in TDS concentration on the Gum R. is likely
due to dilution, which is a characteristic response for rivers when discharge increases,
although not every ion will exhibit an inverse relationship to increased discharge
(Walling, 1984). The greater influence of this rain event on the Gum was also indicated
by the fact that river was considerably higher after the rainstorm compared to the Gogol,
whose much larger basin area may have mitigated some of the effects of the heavy rains.
The annual dissolved loads of the rivers were calculated by the product of
inorganic solute concentration and estimated annual water discharge, according to the
equation:
Load (T yr-1) =Concentration (T km-3
) *Discharge (km3 yr" 1) (1)
Water discharge was calculated from the following equation:
Discharge (km3 yr"1) =Runoff (km yr" 1
) *Basin Area (km2) (2)
where runoff was calculated from precipitation minus evaporation. The rivers were
estimated to receive 4 m of rainfall, of which 2 mare evaporated (Baumgartner and
Reichel, 1976, Robinson, 1976). This value of 50% total evaporation to total
precipitation agrees with independent studies of tropical rain forest hydrology
(Schlesinger, 1991 ).
18
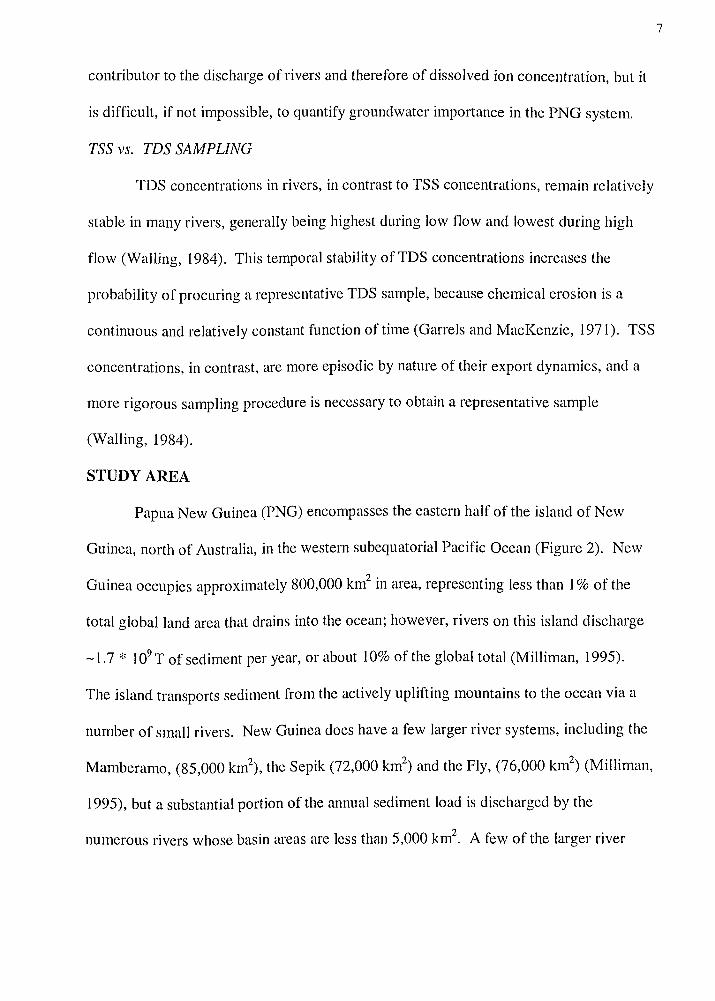
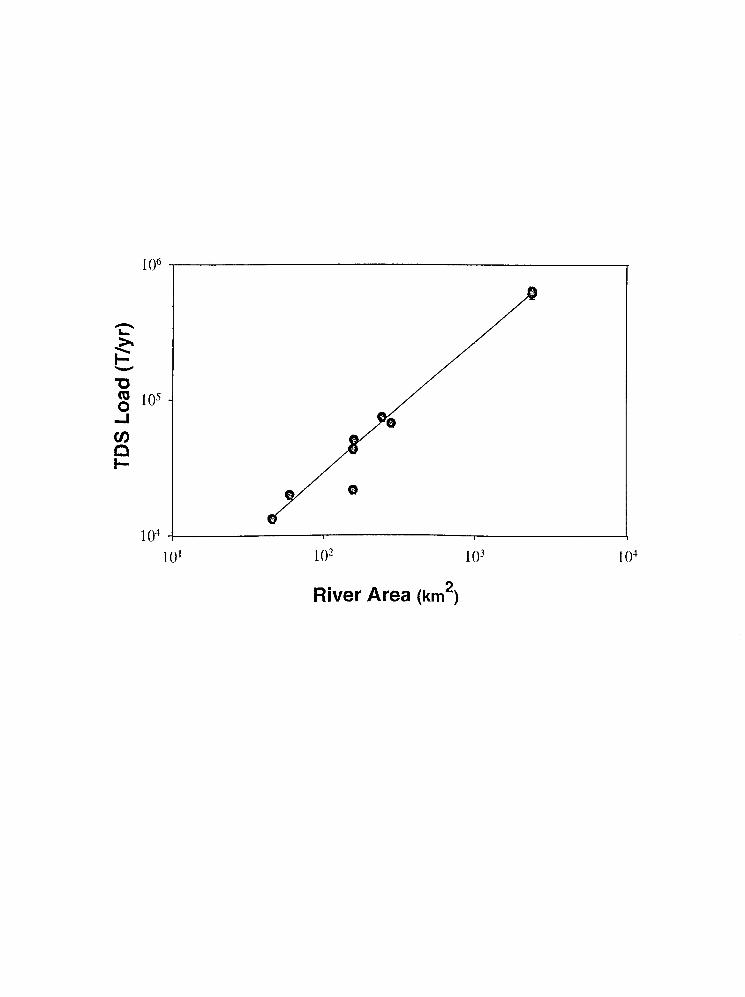
Calculated annual loads ofTDS ranged from 8,000 T y(1 to 635,000 T y(1 (Table
3, Figure 3). This large range was primarily a function of the two-order-of-magnitude
range of basin areas of the sampled rivers, which produces a large range in discharge
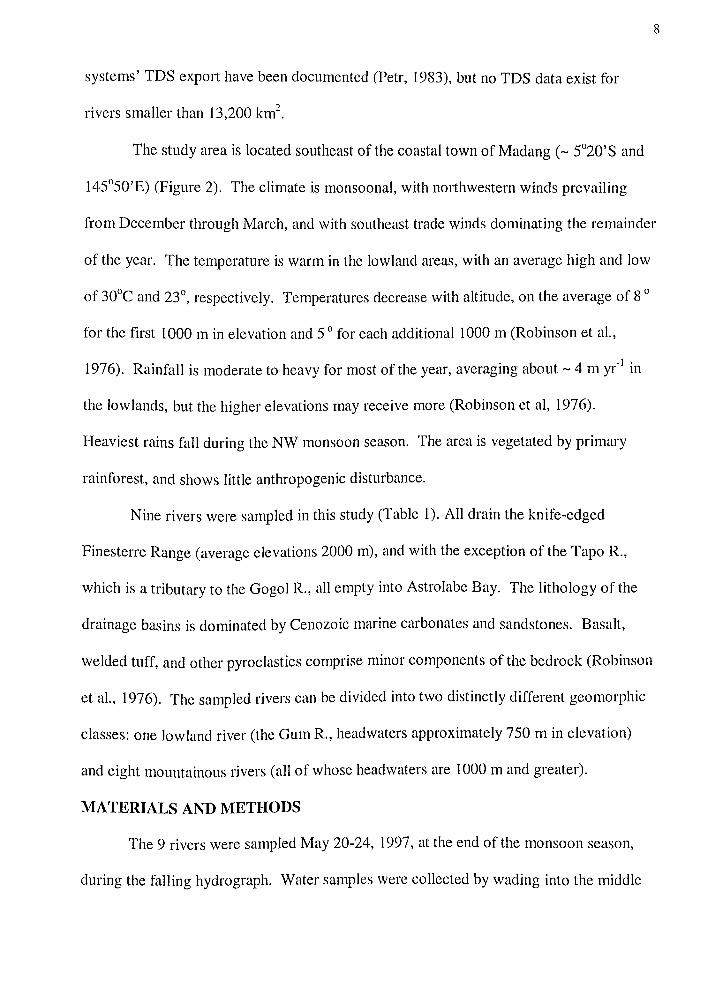
(Equation 2). The dissolved yields of the sampled rivers, load normalized to basin area,
ranged from 130 to 400 T km-2 y(1 (average= 280 ± 66 T km-2 yf1) (Table 3), and when
combined with data from larger wet mountainous rivers, displayed a slight, but
statistically significant (p < 0.001 ), inverse relationship to basin area (Figure 4 ).
ORGANIC CARBON
Dissolved Organic Carbon
The concentrations of dissolved organic carbon in the nine rivers ranged from
0.58 to 4.6 mgC L-1 (average= 1.63 mgC L-1 ± 1.38) (Table 4). The lowest
concentrations (0.58 mgC L-1) were found in the mountainous rivers and higher
concentrations (2- 4 mgC L-1) were found in the Gogol and the lowland river, the Gum.
The concentration of DOC after the rain event decreased by half. The coefficient of
variation of duplicate samples was < 5.5%.
Particulate Organic Carbon
The concentrations of particulate organic carbon were all lower than the
corresponding DOC values and ranged from 0.07 mgC L-1 to 0.91 mgC L-1, averaging
0.37 mgC L-1 ± 0.28 (Table 4). As with the DOC samples, the higher POC values were
found in the Gum R. and the Gogol R., generally with lower values occurring in the
mountainous rivers. The POC concentration increased in the Gum River after a heavy
rain event; a similar but smaller increase was observed in the Gogo! River. The
coefficient of variation between cores of the same filter was less than 10%.
The o13C analyses of five of the POC filters ranged from -32%o to -22%o (Table
5). The radiocarbon ages of the same filters ranged from 350 to 2690 years before
present (B.P.). The youngest POC age (350 yr. B.P.) was from the Gum River (basin
area = 158 km\ a low land river, after a heavy rain; before the rain the age of the
sampled POC was 790 yr. B.P .. The oldest age was from the Youour River (2690 yr.
B.P.), a mountainous river with a basin area of 160 km2• POC from other mountainous
rivers all had ages greater than 1300 yr. B.P.
19
20
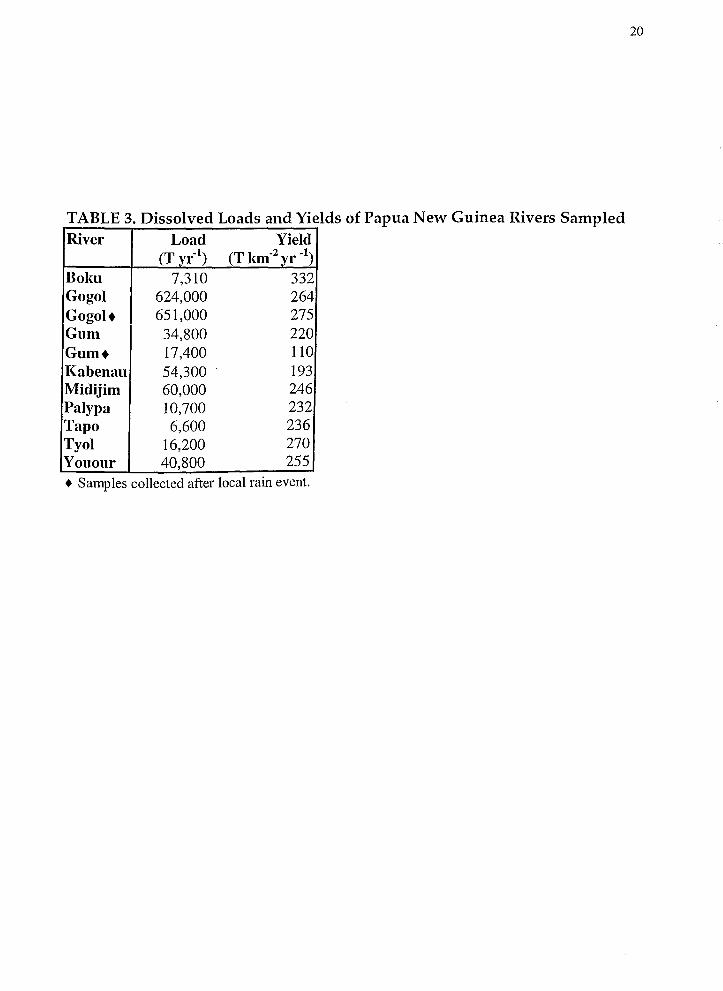
TABLE 3. Dissolved Loads and Yields of Papua New Guinea Rivers Sampled River Load Yield
(T yr"1) (T km"2 yr "1)
Boku 7,310 332 Gogo I 624,000 264 Gogol+ 651,000 275 Gum 34,800 220 Gum+ 17,400 110 Kabenau 54,300 193 Midijim 60,000 246 Palypa 10,700 232 Tapo 6,600 236 Tyol 16,200 270 Youour 40,800 255 + Samples collected after local rain event.

Figure 3. TDS load versus basin area for sampled PNG rivers. Note the strong linear correlation (r2 = 0.97, m = 0.95, p < 0.001). The point deviating from strong linear correlation is the Gum R. when it was sampled after a rain event.
21
"C «S 105 0 -.1 en c t-
101
River Area (km2)

FIGURE 4. PNG small mountainous rivers and SE Asian wet mountainous rivers TDS yield, y = -0.086 + 2.53. Slope is significantly different than zero (p < 0.001). Note the difference in slope and significance from Figure 1. Data was analyzed with both MODEL I and MODEL II regressions with no difference between the results, therefore MODEL I was used to generate this data.
Data from rivers > 10,000 km2 (black circles) is from Milliman & Farnsworth, in prep.
22
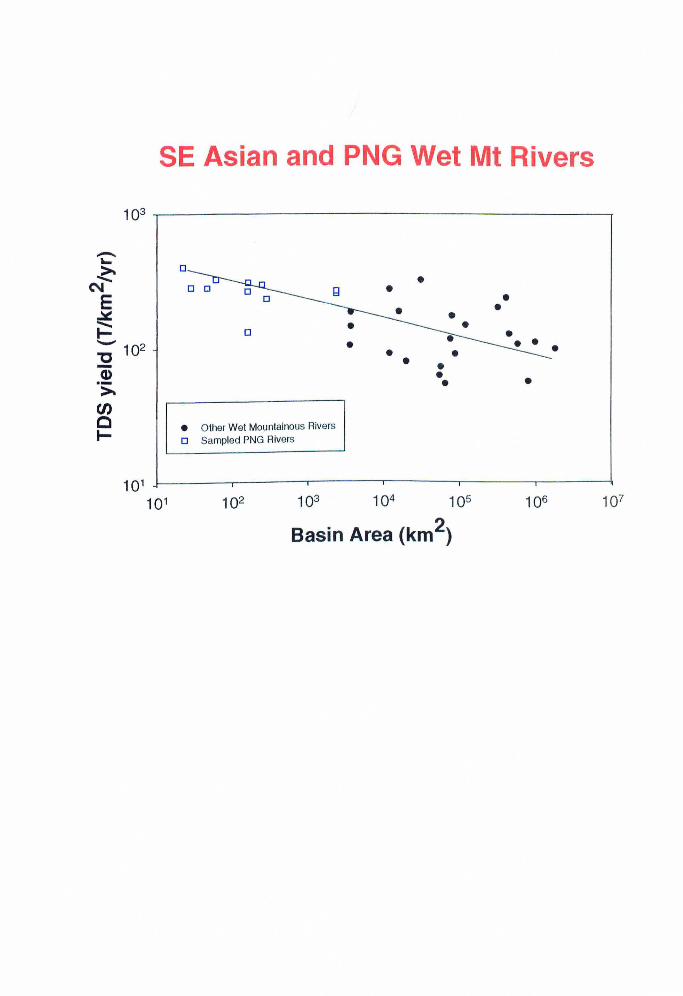
SE Asian and PNG Wet Mt Rivers
103 ~-----------------------------------------------.
-'-~
C\1 E ~
t::: -102 'tJ -Q)
·~ C/) c 1-
101
101
D
• • •
• Other Wet Mountainous Rivers o Sampled PNG Rivers
102 103 104 105
Basin Area (km2)
•
106 107
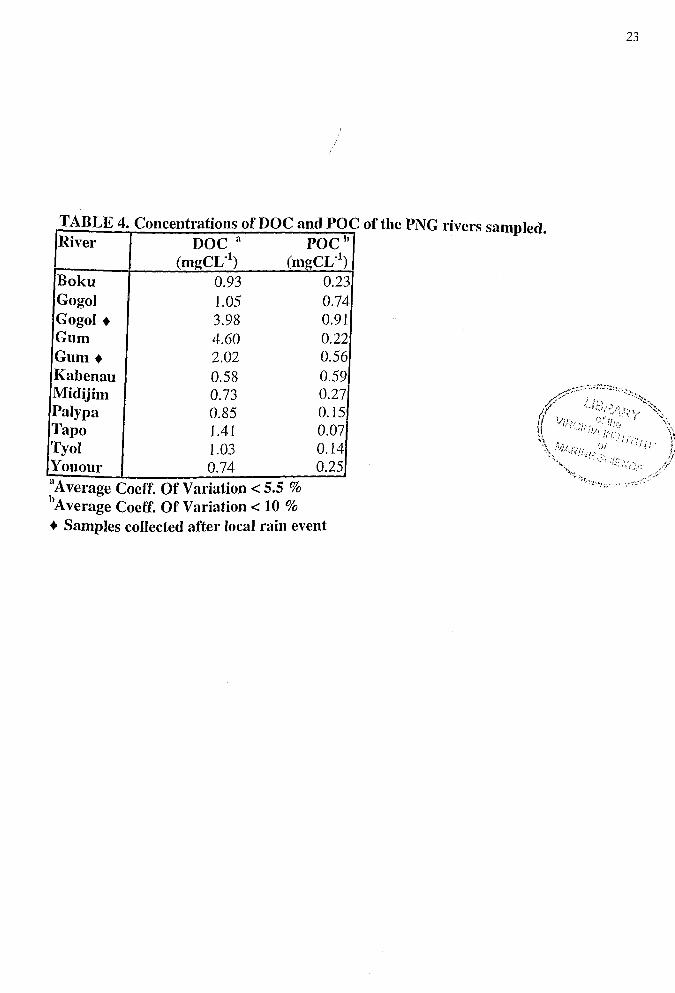
TABLE 4. Concentrations of DOC and POC ofthe PNG rivers sampled. I River I DOC a POC hI (mgCL"1
) (mgCL"1)
Boku 0.93 Gogo I 1.05 Gogol + 3.98 Gum 4.60 Gum+ 2.02 Kabenau 0.58 Midijim 0.73 Palypa 0.85 Tapo 1.41 Tyol 1.03 Youour 0.74 aA verage Coeff. Of Variation < 5.5 % !>Average Coeff. Of Variation< 10%
0.23 0.74 0.91 0.22 0.56 0.59 0.27 0.15 0.07 0.14 0.25
+ Samples collected after local rain event
23
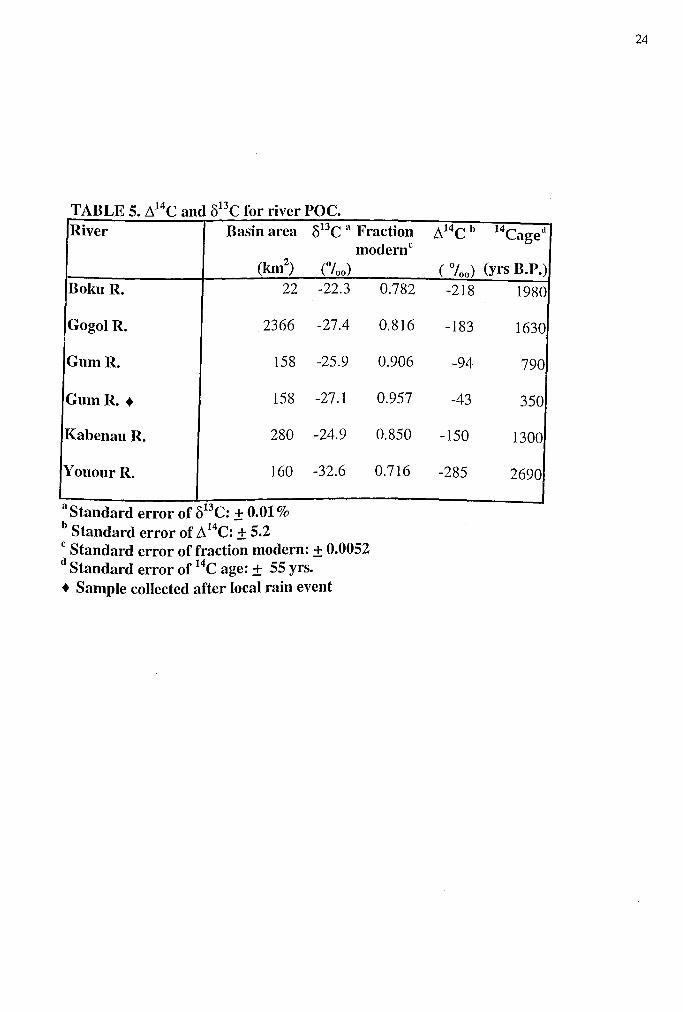
TABLE 5. ~14C and 813C for river POC. River Basin area 813C a Fraction
modernc (km2
)
Boku R. 22
Gogol R. 2366
GumR. 158
Gum R. + 158
Kabenau R. 280
Youour R. 160
a Standard error of 813C: + 0.01% b Standard error of~ 14C: ± 5.2
(0/oo)
-22.3
-27.4
-25.9
-27. I
-24.9
-32.6
c Standard error of fraction modern: ± 0.0052 d Standard error of 14C age: ± 55 yrs. + Sample collected after local rain event
0.782
0.816
0.906
0.957
0.850
0.716
24
~14c b t4c d age
( %J (yrs B.P.) -218 1980
-183 1630
-94 790
-43 350
-150 1300
-285 2690
DISCUSSION
REPRESENTATIVE DATA
25
Basing a discussion of TDS export on the results from a single sampling period is
dubious at best, particularly for rivers in a monsoon-dominated climate. To some degree,
however, this problem can be minimized by comparing the sampling period with monthly
rainfall recorded at the Christiansen Research Institute, a biological research station
located on the coast 5 km northwest of Madang. Rainfall, and therefore river runoff in
New Guinea rivers, varies according to the Southern Oscillation Index, with runoff
decreasing markedly during El Nino years. While total annual rainfall at the Christiansen
Research Institute between 1990 and 1996 varied by about 50 percent (2.4 to 4.0 m y(1),
the range of rainfall during May and June between 1990 and 1997 was considerably
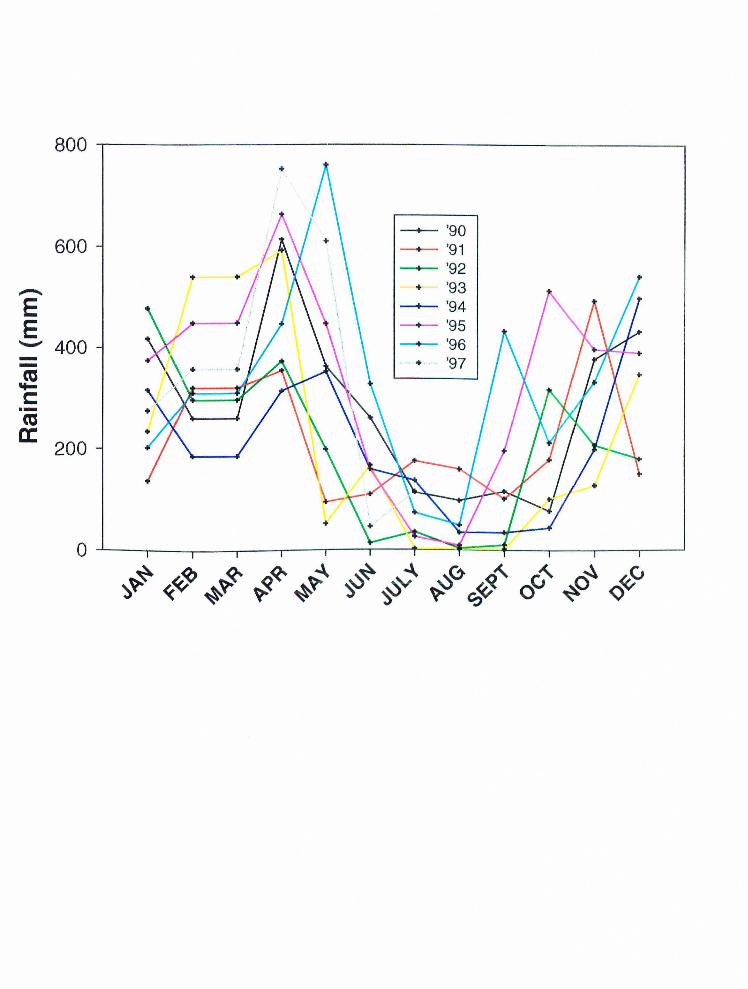
greater, 52 to 760 mm in May and 14 to 327 mm in June (Table 6). May 1997 saw
greater than normal rainfall at Madang (the fourth highest monthly total in the 1990's),
but much of this probably occurred during the early parts of the month, as rainfall during
June was substantially below normal (45.7 mm) (Figure 5). River conditions during the
third week of May therefore were probably about average for the falling hydro graph or
perhaps slightly below the eight-year mean depicted in Figure 6. However, for the sake of
this discussion, the assumption is that the May 1997 samples were collected at mean
flow, and therefore the measured concentrations may represent median TDS values for
the nine rivers.
In humid and wet rivers, dissolved solid concentrations remain relatively constant
throughout the annual cycle, increasing during low-flow periods and decreasing during
maximum discharge (Walling, 1984). Suspended solid concentrations, in contrast, are
26
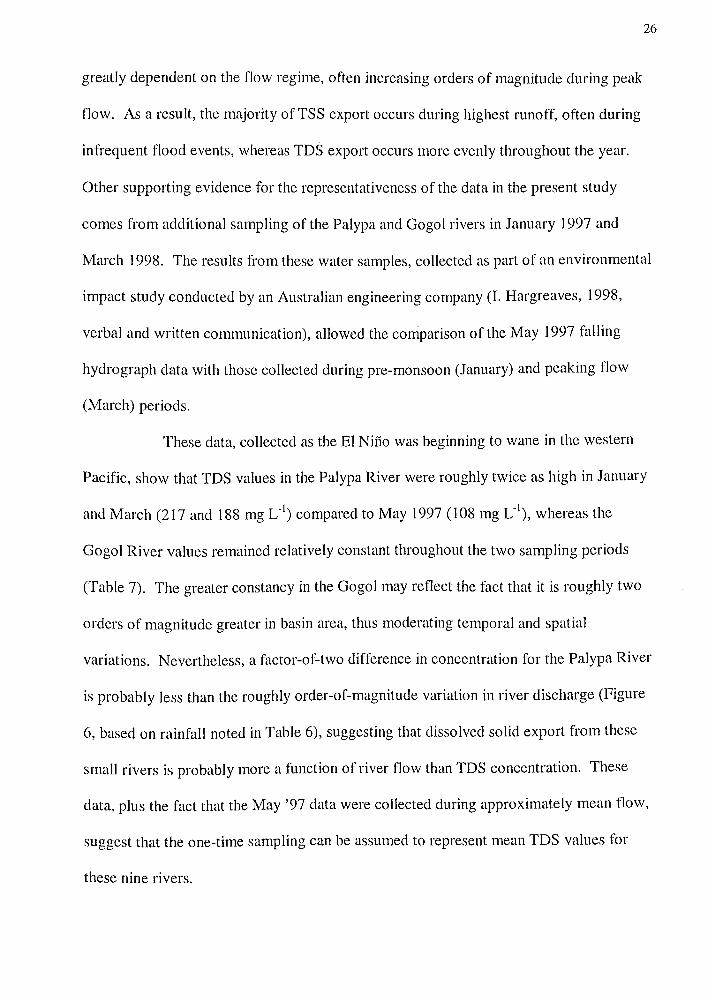
greatly dependent on the flow regime, often increasing orders of magnitude during peak
flow. As a result, the majority of TSS export occurs during highest runoff, often during
infrequent flood events, whereas TDS export occurs more evenly throughout the year.
Other supporting evidence for the representativeness of the data in the present study
comes from additional sampling of the Palypa and Gogo I rivers in January 1997 and
March 1998. The results from these water samples, collected as part of an environmental
impact study conducted by an Australian engineering company (I. Hargreaves, 1998,
verbal and written communication), allowed the coniparison of the May 1997 falling
hydrograph data with those collected during pre-monsoon (January) and peaking flow
(March) periods.
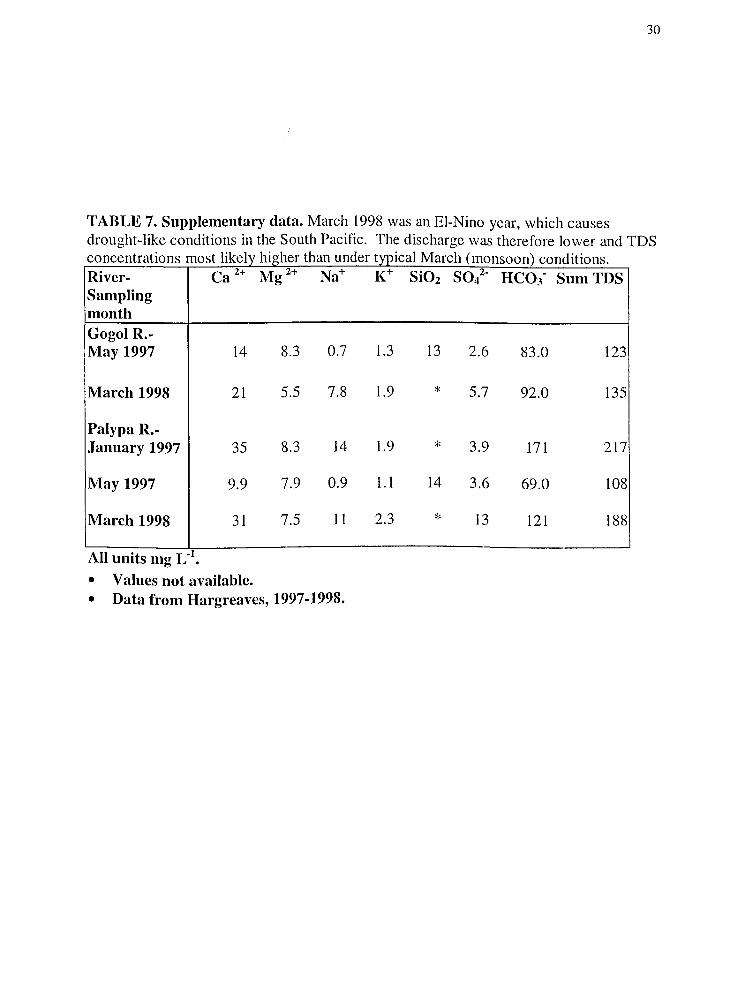
These data, collected as the El Nifio was beginning to wane in the western
Pacific, show that TDS values in the Palypa River were roughly twice as high in January
and March (217 and 188 mg L-1) compared to May 1997 (108 mg L"1
), whereas the
Gogol River values remained relatively constant throughout the two sampling periods
(Table 7). The greater constancy in the Gogol may reflect the fact that it is roughly two
orders of magnitude greater in basin area, thus moderating temporal and spatial
variations. Nevertheless, a factor-of-two difference in concentration for the Palypa River
is probably Jess than the roughly order-of-magnitude variation in river discharge (Figure
6, based on rainfall noted in Table 6), suggesting that dissolved solid export from these
small rivers is probably more a function of river flow than TDS concentration. These
data, plus the fact that the May '97 data were collected during approximately mean flow,
suggest that the one-time sampling can be assumed to represent mean TDS values for
these nine rivers.
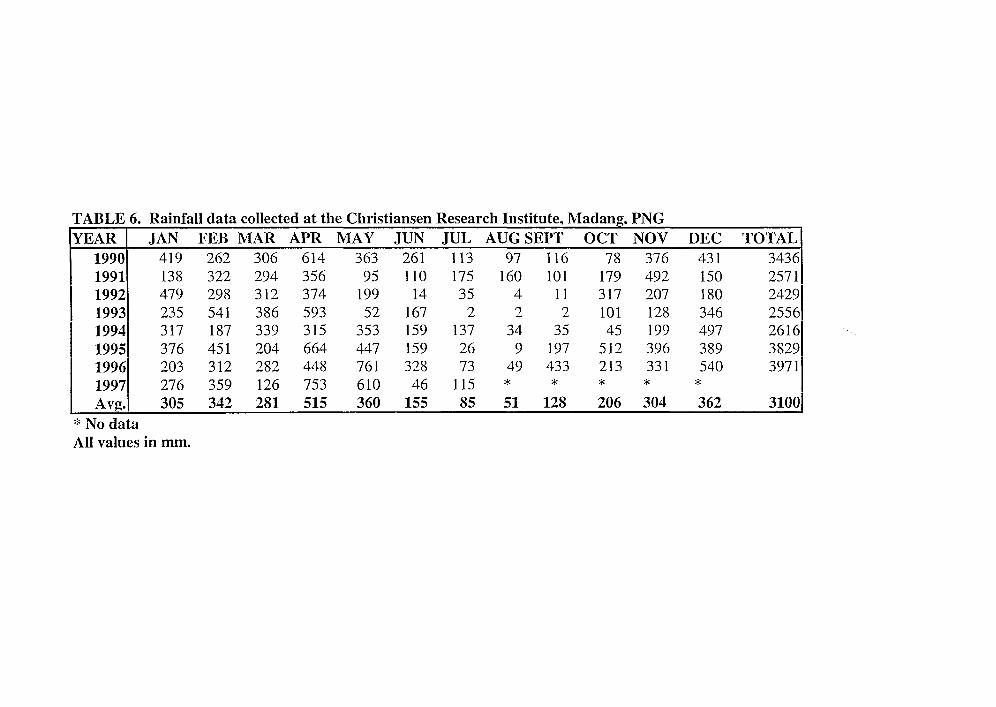
TABLE 6. Rainfall data collected at the Chrisf ---- ---- - ------ ~ R h Institute. Mad
' PNG ~
YEAR JAN FEB MAR APR lYlA Y JUN JUL AUGSEPT OCT NOV DEC TOTAL 1990 419 262 306 614 363 261 113 97 116 78 376 431 3436 1991 138 322 294 356 95 110 175 160 101 179 492 150 2571 19921 479 298 312 374 199 14 35 4 11 317 207 180 2429 1993 235 541 386 593 52 167 2 2 2 101 128 346 2556 19941 317 187 339 315 353 159 137 34 35 45 199 497 2616 1995 376 451 204 664 447 159 26 9 197 512 396 389 3829 19961 203 312 282 448 761 328 73 49 433 213 331 540 3971 1997 276 359 126 753 610 46 115 * * * * *
I A vg.[ 305 342 281 515 360 155 85 51 128 206 304 362 31001 *No data All values in mm.

Figure 5. Monthly rainfall in Madang, PNG collected at Christiansen Research Institute, 1990-1997.
28
800~--------------·------------------------~
..-.. E E
600
._.. 400 -co .... s:::::: ·-co a: 200
+
+- +
l
--'90 '91
-- '92 + '93
-- '94 '95 '96
+ '97
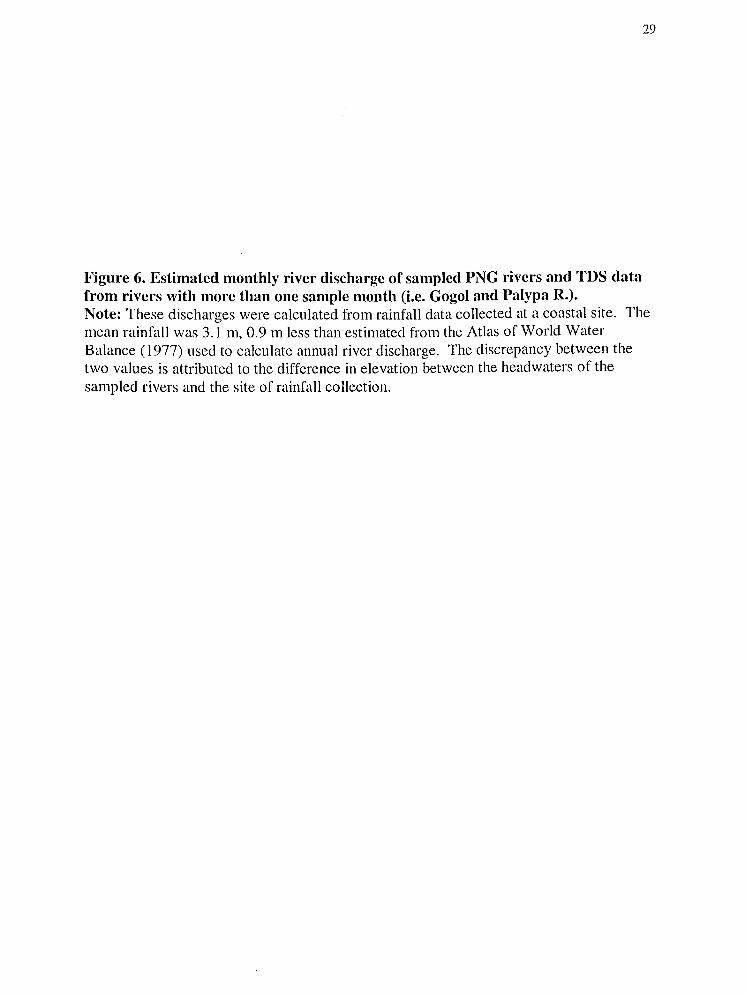
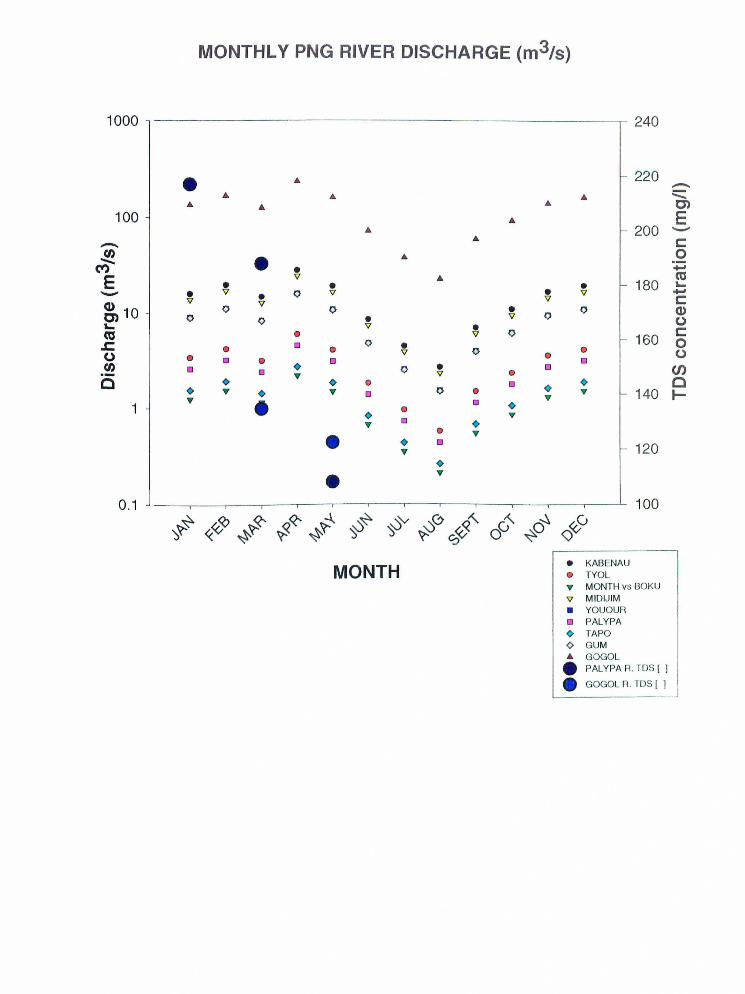
Figure 6. Estimated monthly river discharge of sampled PNG rivers and TDS data from rivers with more than one sample month (i.e. Gogol and Palypa R.).
29
Note: These discharges were calculated from rainfall data collected at a coastal site. The mean rainfall was 3.1 m, 0.9 m less than estimated ti·om the Atlas of World Water Balance ( 1977) used to calculate annual river discharge. The discrepancy between the two values is attributed to the difference in elevation between the headwaters of the sampled rivers and the site of rainfall collection.
MONTHLY PNG RIVER DISCHARGE (m3/s)
1000 ------------------------------------------------, 240
• ... 220 -... ... ... ::::::: ... ... ... 0')
100 ... E ... 200 -... c:: -~ • ... 0 ('I) • ... E v ...
180 m • • • ... - • v 0 v • v ...
v • v c:: &10 0
v 0 • 0 Q)
0 0 • v 0 0 '- v • c:: m • v 0 160 .c CJ 0 • 0 • • v 0 0 0 • CJ • D CJ en CJ • 0 • CJ (/) ·- ... v • c • • • c • ... • ... 0 0 • ... 140 1-... 1
... • Cl ... ... • • ... ... 120
• • ...
0.1 100
-F ~<Q -l' 'S « ~
9.«:- .; ~ ~
:0~ "S :0"" "S
-00 9.-<,_ ~ <::>«;
0-<,_ a 0~
~ ~(;
<)
MONTH • KABENAU e TYOL ... MONTH vs BOKU
v MIDIJ IM
• YOUOUR PALYPA
<> TAPO 0 GUM ... GOGOL
• PALYPA R. TDS [ ]
• GOGOL R. TDS [ ]
30
TABLE 7. Supplementary data. March 1998 was an El-Nino year, which causes drought-like conditions in the South Pacific. The discharge was therefore lower and TDS
. l"k 1 h. h th d t . I M l ( ) d" . concentrations most 1 ely 1g1 er an un er ryp1ca arc 1 monsoon con 1t1ons. River- Ca 2+ Mg2+ Na+ K+ SiOz soi· HC03" Sum TDS Sampling month Gogol R.-May 1997 14 8.3 0.7 1.3 13 2.6 83.0 123
March 1998 21 5.5 7.8 1.9 * 5.7 92.0 135
Palypa R.-January 1997 35 8.3 14 1.9 * 3.9 171 217
May 1997 9.9 7.9 0.9 1.1 14 3.6 69.0 108
March 1998 31 7.5 II 2.3 * 13 121 188
All units mg L"1•
• Values not available. • Data from Hargreaves, 1997-1998.
31
MAJOR INORGANIC SOLUTES
Dissolved Solid Concentrations
TDS and Ca/Mg
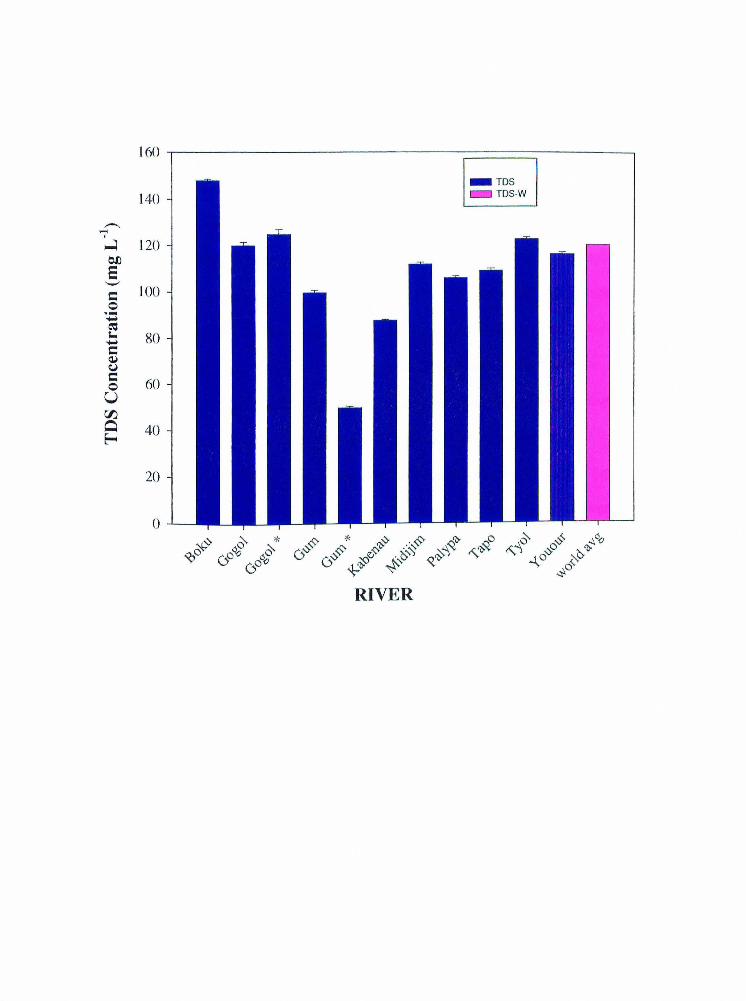
Concentrations of major ions and organic carbon in these small rivers can provide
insights regarding the geology of the river basin, and terrestrial primary production
within the watershed. The concentrations of major ions in all of the samples (Ill mg L-1,
avg.) are similar to the world average of 120 mg L-1 (Figure 7), with significantly lower
concentrations (50 mg L- 1) found in the Gum R. after a rain event.
Dissolved cations in most rivers are dominated by calcium, often 3 to 10-fold
greater than magnesium (Livingstone, 1963; Schlesinger, 1991). The average Ca2+/Mg2+
ratio of sampled PNG rivers is 1.33 ± 0.22 (mass ratio); in contrast, the Ca2+/Mg2+ ratio
for larger basin area PNG rivers is 10 (Petr, 1983). The low Ca2+/Mg2+ ratios in these
small rivers may reflect the abundance of volcanic rocks, magnesian carbonates and
dolomites in the river basins. Other rivers in the area that drain the Finesterre Range
display similar low ci+/Mg2+ ratios, and rivers proximal to the study site also display
Mg2+ as the dominant cation, with ci+/Mg2+ ratios as low as 0.07 (Hargreaves, 1998).
The low ratio of Ca2+/Mg2+ in area rivers further attests to the local lithological influence
on the chemical concentrations in the sampled rivers.
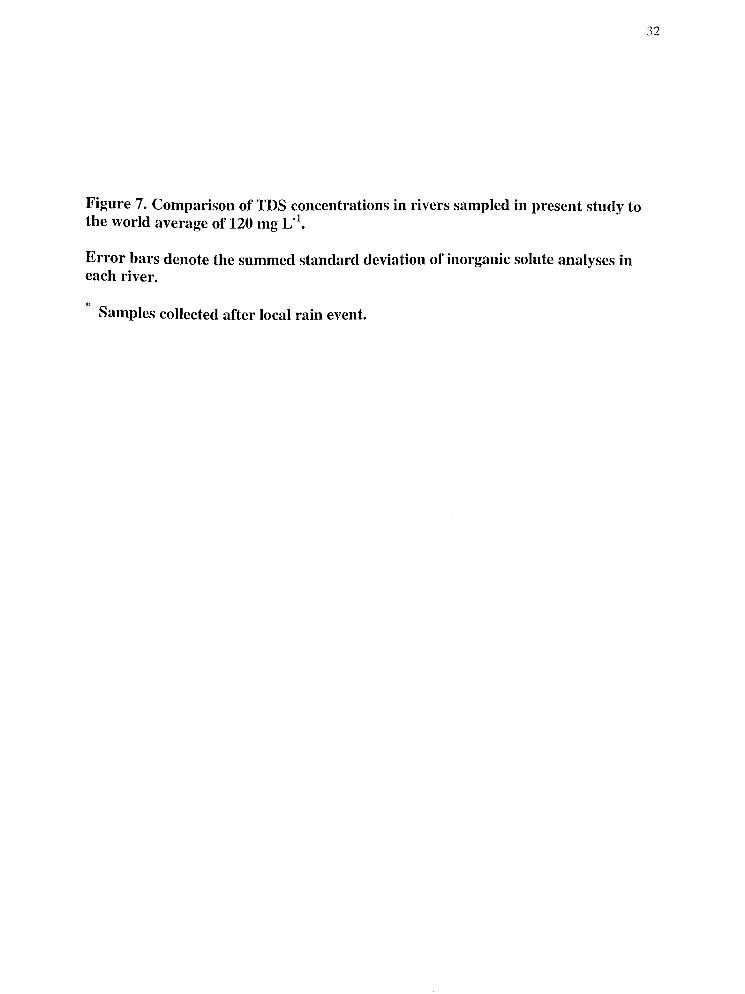
Figure 7. Comparison of TDS concentrations in rivers sampled in present study to the world average of 120 mg L -I.
Error bars denote the summed standard deviation of inorganic solute analyses in each river.
"' Samples collected after local rain event.
32
160
- TDS
140 c::::J TDS-W
--' ~ 120 ell e "-" c 100 0 ·-..... C':S ~ 80 ..... c Q,i ~ c 60 0 u 00. Q 40 ~
20
0
Importance ofLithology in determining TDS Values
A long-standing controversy with river geochemists revolves around whether climate
(Berner and Berner, 1997), lithology (Edmond et al, 1996) or a combination of the two
plays the dominant role in determining river chemistry. The data from small PNG rivers
indicate that lithology, rather than climate, is the most important variable in controlling
the solute concentration for small rivers. Because of the short length and moderately
high t1ow rates, the residence times of surface water in these small PNG rivers may be
only a matter of hours or a few days, and only readily soluble minerals will dissolve to
release ions to the rivers. The warm temperatures and vegetation help accelerate
chemical weathering reactions, but the rate acceleration is still limited by the kinetics of
the reaction between the water and the rock. The dissolution of carbonates and
evaporites involves simple congruent reactions, and has the potential to yield a high
amount of ions to surface waters even with short contact time between rainfall and
bedrock.
33
A similar study in SW India also examined the dissolved material of small
mountainous rivers. These small rivers had an average TDS concentration of 39 mg L- 1
(Bajpayee et a!., 1999), which the authors attribute to insufficient contact time between
rainfall and catchment rocks due to the rivers' steep gradients and short lengths.
However, given the high TDS in the studied PNG rivers, with similarly high relief and
short length, the low concentrations in SW India may reflect more the primary lithology
drained by these rivers, that is Precambrian igneous and metamorphic sialic rocks, in
addition to their hydrological dynamics.
34
An unknown but perhaps significant factor affecting the TDS load in the PNG
rivers may be the contribution of groundwater baseflow to total surface flow.
Groundwater input, particularly in a karst topography (as PNG most likely has), could
reflect in a longer residence time of water and thus explain the higher TDS
concentrations. This possibility is suggested because the TDS concentrations in the
rivers are high, in spite of the short residence time of surface water in these small basins.
Concentrations in the Boku R. and Tapo R. (148 and 109 mg L-1), for example, are
similar to the Gogo I R., even though they are two orders of magnitude smaller in basin
area (22 and 28 km2 vs. 2366 km2). The unknown groundwater contribution adds a
degree of uncertainty to the interpretation of the data, because the concentration of
dissolved solids exclusively from surface water runoff is not determined. Nonetheless,
the main conclusion that the lithology signal dominates the river chemistry in the
sampled rivers does not change. The chemical susceptibility to weathering of watershed
bedrock is the dominant factor controlling the dissolved load in this weathering-limited
system.
35
DOC and Chemical Weathering
The low concentrations of DOC provide evidence of low net ecosystem
production (NEP) in these watersheds. NEP is defined as gross autotrophic production
minus total respiration (Odum, 1969). The primary production in tropical rainforest
ecosystems is known to be amongst the highest in nature (Nkounkou and Probst, 1987),
and the lack of organic matter accumulation in tropical soils reflects rapid
remineralization by soil microbes (Berner and Berner, 1996). Thus the high rates of
primary production presumably are balanced by high rates of respiration on land, which
minimizes the accumulation of organic matter content in the soils. The DOC exported by
rivers therefore can be thought of as an estimate of NEP since, other than respiration,
export to the river is the primary sink for DOC. In addition, high rates of respiration
within watershed soils provide the hydrogen ions that facilitate chemical weathering
reactions, e.g.:
C02 (from respiration) + HzO -7 HzC03 -7 H+ + HC03- (3)
This observation supports the hypothesis that chemical weathering of the dominant
lithologies controls the high TDS export from wet small mountainous rivers in PNG.
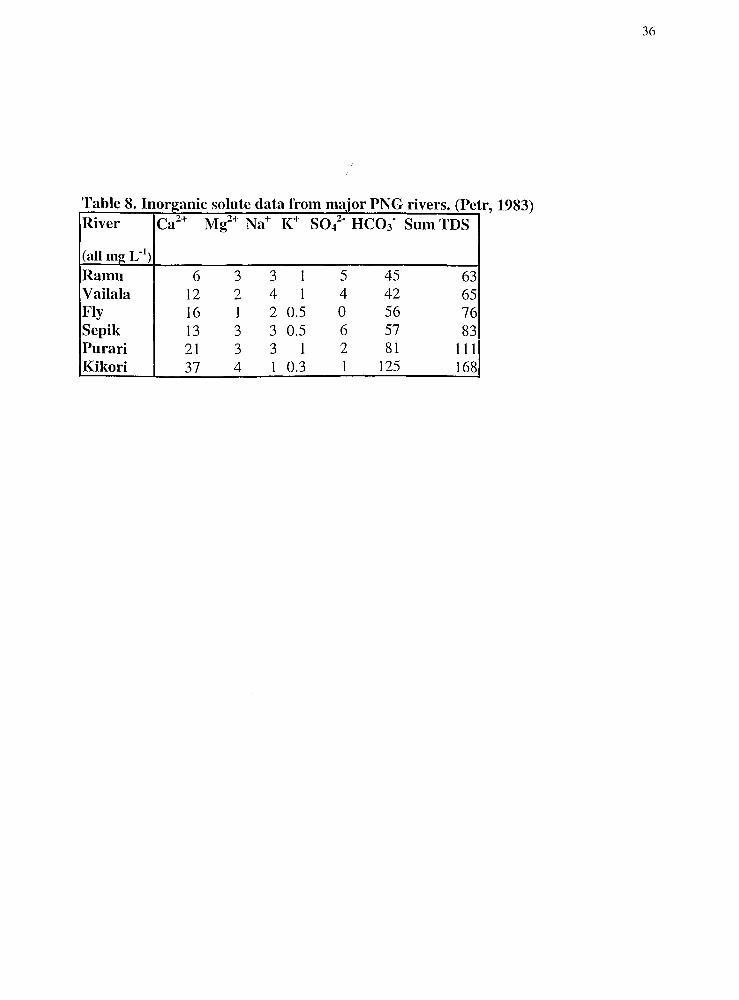
Petr ( 1983) also found high rates of chemical weathering in five large rivers of Papua
New Guinea (Table 8).
36
T bl 8 I I t l t f a c . norgamc so u c c a a rom maJOr PNG. nvcrs. ct (P r, 1983) River Ca2+ Mg2+ Na+ K+ sol· HC03. Sum TDS
(all mg L"1)
Ramu 6 3 3 I 5 45 63 Vailala 12 2 4 I 4 42 65 Fly 16 I 2 0.5 0 56 76 Scpik I3 3 3 0.5 6 57 83 Purari 2I 3 3 1 2 81 Ill Kikori 37 4 1 0.3 I 125 168
Dissolved Load
Dissolved load is the product of TDS concentration (T km-3) and discharge (km3
yr-'). Because the sampled rivers are assumed to have similar runoff (2m y(1), and
because TDS concentrations vary by a factor of two (75- 147 mg L-1, mean= 111 mg
L-1), the calculated TDS load of the sampled PNG rivers is largely controlled by basin
area (Figure 3).
37
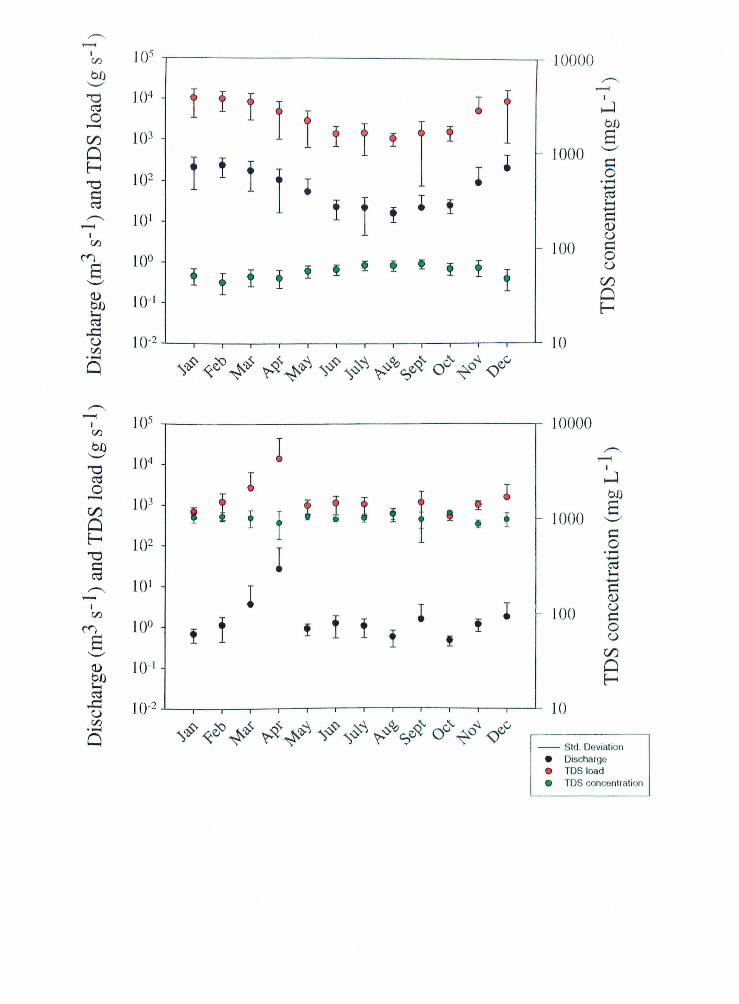
Comparison of two small US west coast mountainous rivers, the Chehalis River
(basin area= 3300 km2, runoff= 1 m y{1) and the Santa Clara River (basin area= 4100
km2
, runoff= 0.01 m yr-1), with the Gogol River (basin area =2366 km2
, runoff= 2m yr-1)
highlights the factors that control a river's TDS load and export. The Chehalis River, a
wet river draining the Cascade Mountains in southern Washington, has an annual load of
0.05* 106 T y(1, whereas the Santa Clara, an arid river in southern California, has a
similar annual dissolved load of0.06*106 T yr-1; in comparison, the Gogol's annual load
is an order of magnitude greater (0.6* 106 T y(1 ). The similarity between the TDS load of
the Chehalis and the Santa Clara belies the fact that the former has much lower TDS
concentration (11 vs. 895 mg L-1), but a much higher discharge (3 vs. 0.12 km3 y(1)
(Figure 8). The Gogol River, in contrast, has both high TDS concentration ( 123 mg L-1),
and high discharge because of high rainfall.
Because the flows of the Chehalis and the Gogol are continuous, both rivers have
weathering-limited erosional regimes (Stallard and Edmond, 1983). The contrast in
dissolved export, therefore, reflects primarily the difference between metamorphic and
igneous sialic rocks eroded by the Chehalis compared to the soluble carbonates and
extrusive mafic and intermediate igneous rocks in the Gogol watershed. In contrast, the
38
FIGURE 8. Top Chehalis R., bottom Santa Clara R. Note the similarity between the TDS loads of the rivers, but the difference in discharge and TDS concentration. The Chehalis discharge pattern is much more regular than the Santa Clara, and is the result of relatively constant rainfall. The Santa Clara River is event driven.
Data from Alexander et al. ( 1996)
,-.... ,....., I 1Q5 C/1 10000 bJ)
'--''
'"d J04 ~ 0 -C/J 103
Q ~
1Q2 '"d ~ ~
,-.... LQ 1 ,....., I
f f f I I I ! ~ f !
1 !
~ 1-
! ! ! f l I ! I ! • !
,-.... -I
~ bJ)
s 1000 ""-"
~ 0 ·-~ ..... ...... ~ <!.) u
C/1
('f") 10° s ""-"
<!.) 10-1 bJ)
a
1-
~ ! ! ! ! ! t ! ' ! ~ ! lOO ~
0 u
C/J Q ~
..c:: J0-2 u C/1
10 ·-Q ")"b-"> ~~ ~~ ~<t ~"b-~ ")v"> "'-:,~~ ~v¢o S~¢ ov'-~o~ <:)~v
,-.... ,....., J05 I 10000
C/1
bJ) ""-" J04 '"d ~ 0 - 1()3
C/J Q ~ 102 '"d ~ ~
101 ,-.... -I C/1
('f") LQO s
""-"
r ,-.... ,....., I
I ~
I • bJ)
I t : ! : ! ' ! s f f • f ' 1- 1000 ""-"
~ 0
I ·-...... ~ ..... ......
I ~ <!.)
l I u
! ! ! ! 1- 100 ~
! ! ! 0
' u
C/J <!) J0-1 ~
Q ~
~ ..c:: I 0-2 u 10
C/1 ·-Q . . s~~ &;:\. ""~ (;
"'-:,<§:" ~~ ~o/ ~~ ~"b- "'-:,.;;;; "'-:,~ ~.::> S~~ Ov ~0 <:)V - Std. Deviation
• Discharge
• TDS load e TDS concentrati on
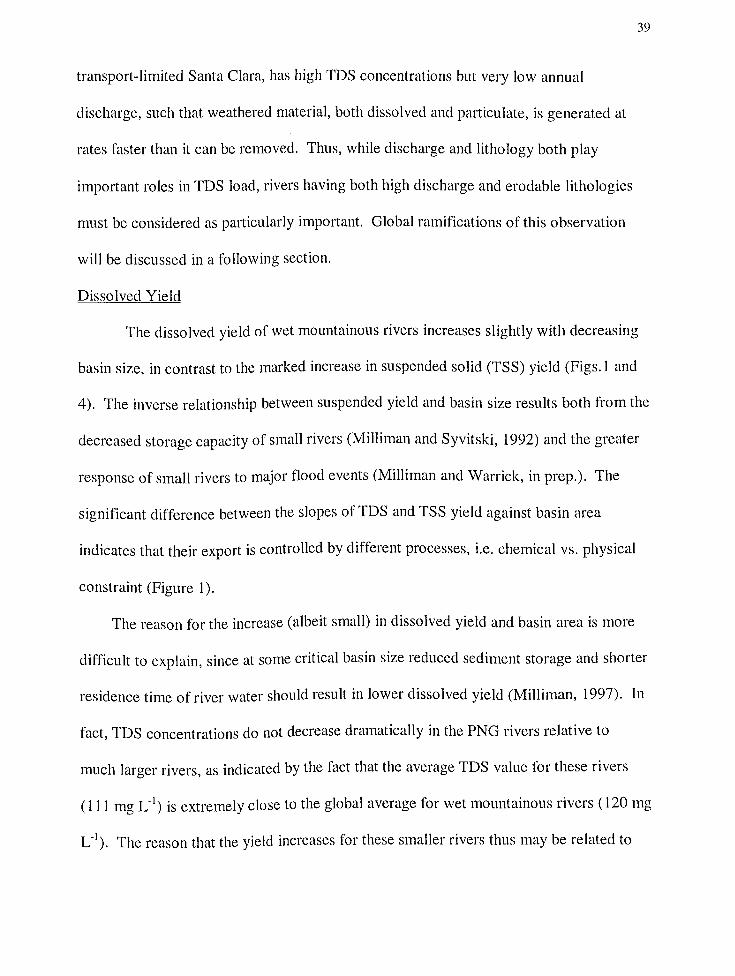
transport-limited Santa Clara, has high TDS concentrations but very low annual
discharge, such that weathered material, both dissolved and particulate, is generated at
rates faster than it can be removed. Thus, while discharge and lithology both play
important roles in TDS load, rivers having both high discharge and erodable lithologies
must be considered as particularly important. Global ramifications of this observation
will be discussed in a following section.
Dissolved Yield
39
The dissolved yield of wet mountainous rivers increases slightly with decreasing
basin size, in contrast to the marked increase in suspended solid (TSS) yield (Figs.1 and
4). The inverse relationship between suspended yield and basin size results both from the
decreased storage capacity of small rivers (Milliman and Syvitski, 1992) and the greater
response of small rivers to major flood events (Milliman and Warrick, in prep.). The
significant difference between the slopes of TDS and TSS yield against basin area
indicates that their export is controlled by different processes, i.e. chemical vs. physical
constraint (Figure 1 ).
The reason for the increase (albeit small) in dissolved yield and basin area is more
difficult to explain, since at some critical basin size reduced sediment storage and shorter
residence time of river water should result in lower dissolved yield (Milliman, 1997). In
fact, TDS concentrations do not decrease dramatically in the PNG rivers relative to
much larger rivers, as indicated by the fact that the average TDS value for these rivers
(111 mg L- 1) is extremely close to the global average for wet mountainous rivers ( 120 mg
L-1). The reason that the yield increases for these smaller rivers thus may be related to
40
the very high runoff of these rivers. For example, runoff of the PNG rivers (at 2m y{1)
is about twice that for the Amazon River.
One might then ask why the TDS concentrations are so high in these small PNG
rivers - and why the TDS concentrations are about as high in very small Boku and Tapo
rivers as the much larger Gogo! River. To some degree this maybe related to the
dissolution kinetics of the environment, the wet tropical mountainous climate providing
optimal conditions for chemical weathering and also limiting the build-up and
accumulation of thick regoliths (Berner and Berner, 1997). This suggestion is supported
by the fact that lowland rivers generally have lower TDS concentrations because the low
hydraulic gradient results in extensive soil horizons that limit chemical weathering
products from directly entering surface flow; in addition, soil absorption capacity is
greater in thick regoliths (Berner and Berner, 1997).
Kinetics alone, however, may not explain the high TDS concentrations observed in
rivers such as the Boku and Tapo, since their very short length (less than l 0 km) means
that surface flow presumably can last no longer than a few hours once the water reaches
the rivers or their tributaries. A more complete explanation for such high concentrations
may require another factor, most likely groundwater flow, which would permit
subsurface flow to remain within the catchment for longer period, and thereby
accumulating greater concentrations of dissolved solids. Because groundwater generally
serves as the base flow for rivers, the groundwater input would be greatest during lower
hydrologic stages, surface runoff becoming more important during higher discharge
events (Walling, 1984). The relative role and importance of groundwater flow to these
small rivers, however, remain undetermined.
41
Annual TDS Export to the Ocean
To estimate the contribution of small, wet mountainous rivers to the annual TDS
export to the global ocean, an existing classification was augmented with data from
various world rivers and data the present study. Rivers were tabulated according to
annual runoff, air temperature, and relief, in accordance with Meybeck's (1988)
morphoclimatic division of world rivers. There are 12 divisions using this method (Table
9), and rivers used for the analysis were chosen based on the criteria provided for each
division (Table 10). The dissolved solid concentrations of the rivers were averaged in
each of the twelve categories and multiplied by the percentage of the world runoff of
32,350 km3 yr-1 (Meybeck, 1988)that the category contributed to the ocean. Using the
sum of the dissolved load values from the twelve categories, the total export of dissolved
ions was estimated at 39.4 * 1014 g y(1, similar to estimates of Garrels and MacKenzie
(1971) (36 * 1014 g y(1) and Meybeck (1976, 1977) (37.6 * 1014 g y{1
).
The sampled rivers in Papua New Guinea are included in the wet tropics highland
group (Figure 9). The other rivers in this category are larger ones, so the contribution of
small rivers exclusively is not determined with this exercise. However, the wet tropics
highland group contributes 28% of the annual dissolved solid load to the oceans, and
24% of the annual water discharge, yet occupy 8% of the total land area that discharges
to the ocean. Water discharge alone, however, does not drive the high export of dissolved
ions from this class of river. For instance, the Amazon R., the largest river in the world,
discharges 18% of the annual freshwater export to the oceans, but only 8% of the annual
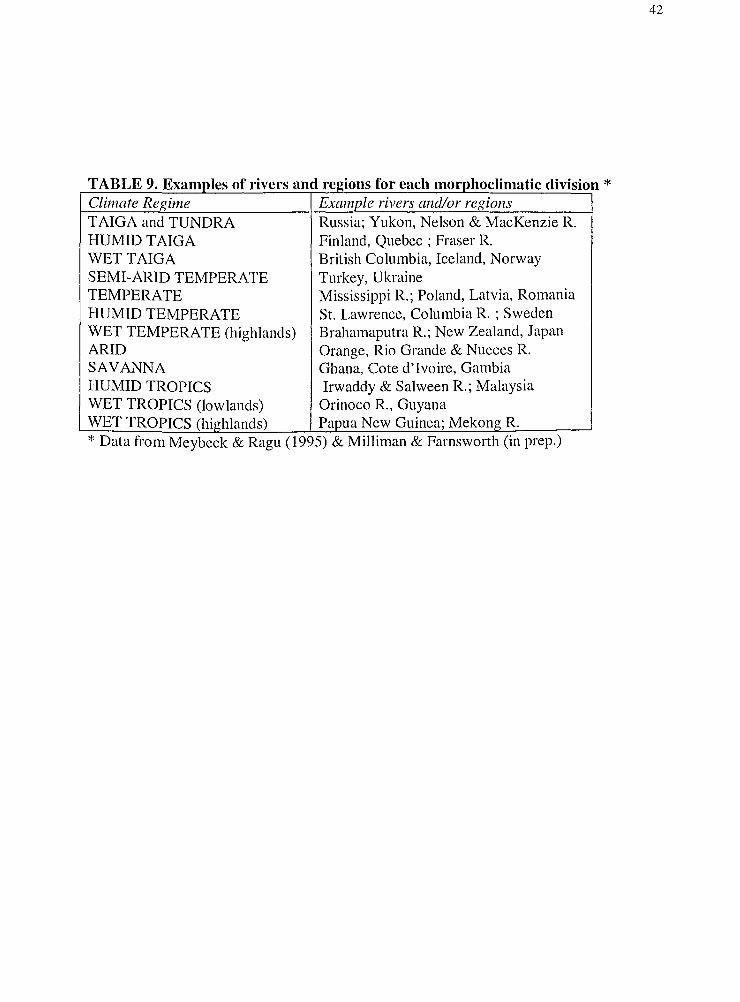
42
TABLE 9. Examp1 es of rivers and regwns for each morp toclimatic division * Clirnate ReRime Example rivers and/or ref?ions T AlGA and TUNDRA Russia; Yukon, Nelson & MacKenzie R. HUMID T AlGA Finland, Quebec ; Fraser R. WET T AlGA British Columbia, Iceland, Norway SEMI-ARID TEMPERATE Turkey, Ukraine TEMPERATE Mississippi R.; Poland, Latvia, Romania HUMID TEMPERATE St. Lawrence, Columbia R.; Sweden WET TEMPERATE (highlands) Brahamaputra R.; New Zealand, Japan ARID Orange, Rio Grande & Nueces R. SAVANNA Ghana, Cote d'Ivoire, Gambia HUMID TROPICS Irwaddy & Salween R.; Malaysia WET TROPICS (lowlands) Orinoco R., Guyana WET TROPICS (highlands) Papua New Guinea; Mekong R. ~- Data from Meybeck & Ragu ( 1995) & Milliman & Farnsworth (m prep.)
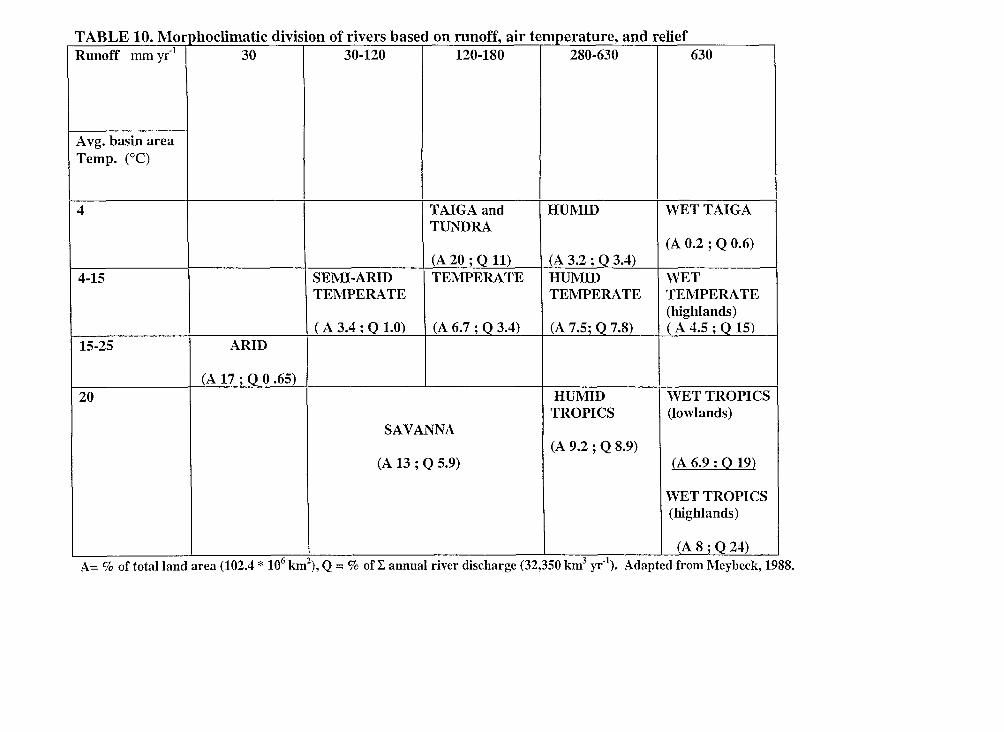
TABLE 10. "Nlorphoclimatic division of rivers based on runoff, air temperature, and relief Runoff mm y(1 I 30 I 30-120 I 120-180 I 280-630 I 630
A vg. basin area Temp. COC)
4
4-15
15-25
20
ARID
(A 17 ; Q 0 .65)
SEMI-ARID TEl\1PERA TE
( A 3.4 ; Q 1.0)
TAIGA and TUNDRA
(A20; Q 11)
TEMPERATE
(A 6.7; Q 3.4)
SAVANNA
(A 13; Q 5.9)
HUMID WET TAIGA
(A 0.2 ; Q 0.6) (A 3.2 ; Q 3.4) HUMID I WET TEl\1PERA TE TEl\1PERA TE
(A 7.5; Q 7.8)
HUMID TROPICS
(A 9.2 ; Q 8.9)
(highlands) (A 4.5; Q 15)
WET TROPICS (lowlands)
(A 6.9; 0 19)
WET TROPICS (highlands)
(A 8; Q 24) A= % of total land area (102.4 * 106 km2
). Q = % of L annual river discharge (32,350 km3 yr"1). Adapted from Meybeck, 1988.

Figure 9. Morphoclimatic division of annual dissolved load to the ocean. See Table 9 for examples of regions and rivers for each climate category and Table 10 for physical descriptions of the divisions.
44
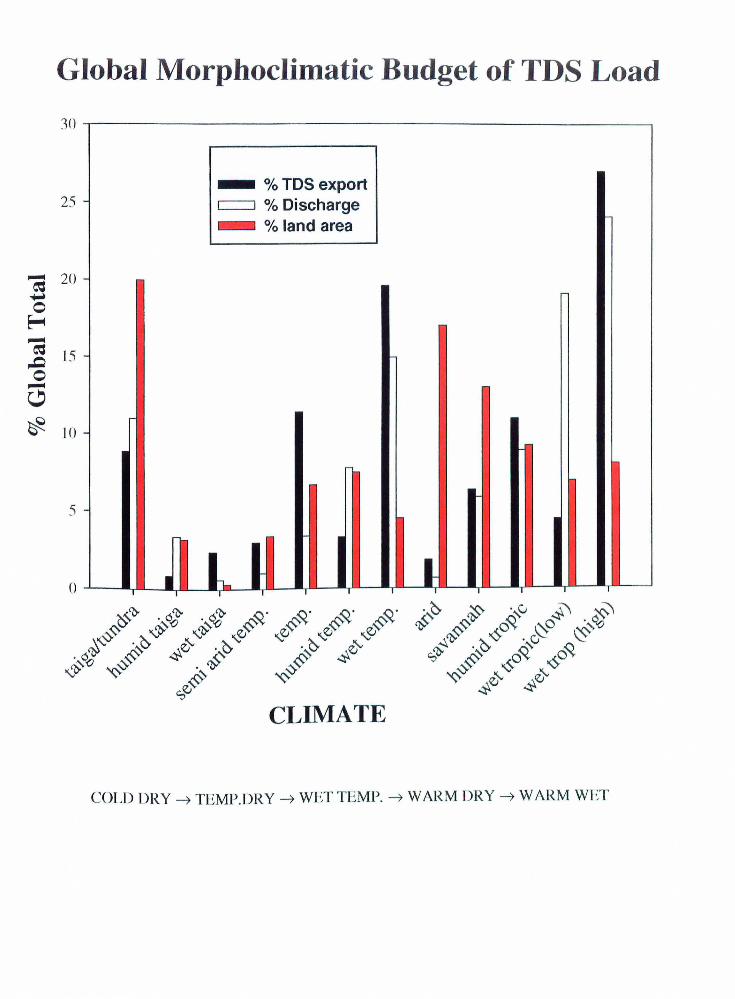
Global Morphoclimatic Budget of TDS Load
30 ..,.--------- ---------------------,
25 - % TDS export c:==::J % Discharge - %1andarea
CLIMATE
COLD DRY --7 TEMP.DRY --7 WET TEMP. --7 WARM DRY --7 WARM WET
45
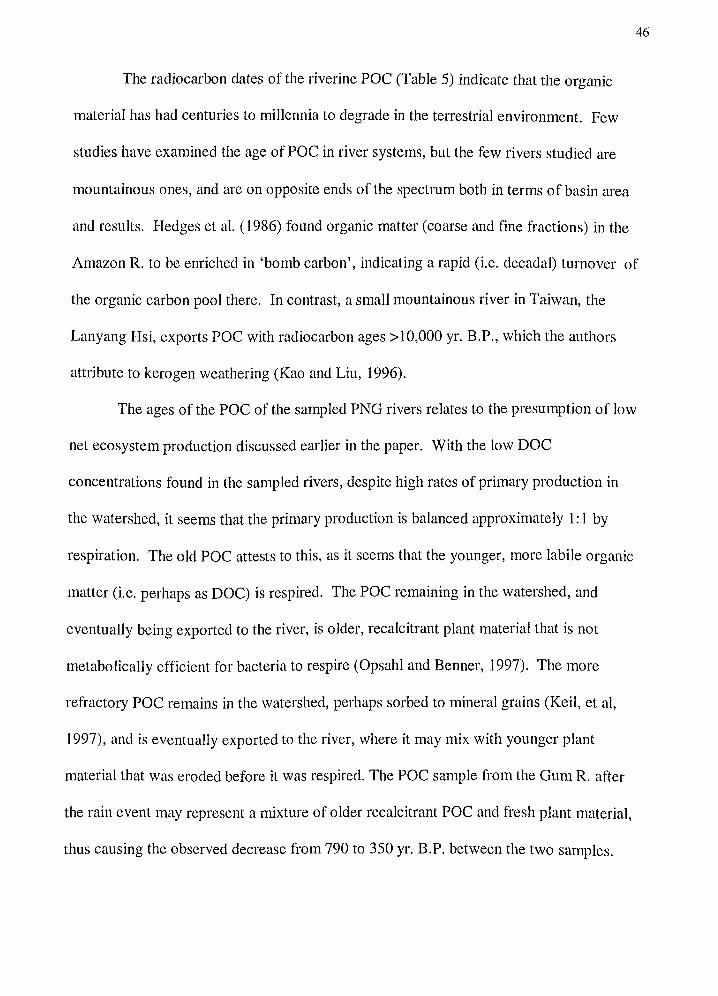
dissolved solid load. The wet tropics highland rivers are unique in that they receive large
amounts of annual rainfall (runoff> 0.63 m yr-1) and are located in a geologically active
area, resulting in geologically young (and thus erodable) substrate. In addition to the age
of watershed bedrock, the primary lithologies in the wet tropic highland watershed are
typically marine carbonates, interspersed with extrusive igneous rocks, rocks that are
readily susceptible to chemical weathering. The lithology and hydrology of the wet
tropical basins combined with their inability to develop thick soil horizons creates a high
TDS export, seemingly independent of basin area.
ORGANIC CARBON
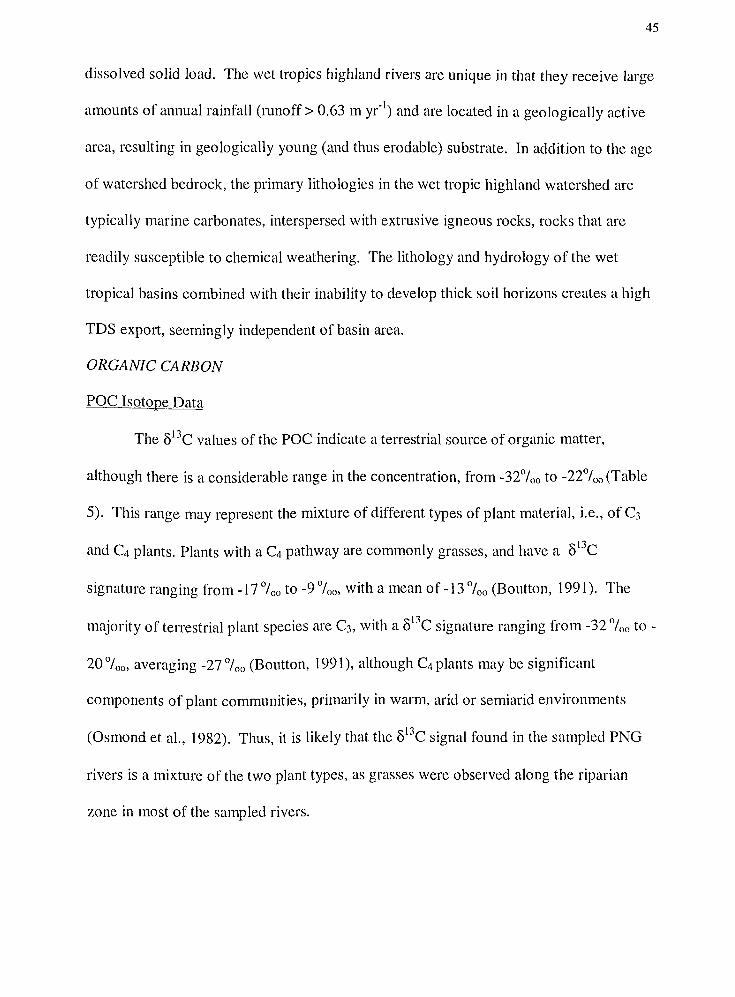
POC Isotope Data
The <Pc values of the POC indicate a terrestrial source of organic matter,
although there is a considerable range in the concentration, from -32°/00 to -22%o (Table
5). This range may represent the mixture of different types of plant material, i.e., of C3
and C4 plants. Plants with a C4 pathway are commonly grasses, and have a o13C
signature ranging from -17°/00 to -9°/oo. with a mean of -13 %o (Boutton, 1991). The
majority of terrestrial plant species are C3, with a o13C signature ranging from -32 %o to -
20 °/00 , averaging -27 °/00 (Boutton, 1991 ), although C4 plants may be significant
components of plant communities, primarily in warm, arid or semiarid environments
(Osmond et al., 1982). Thus, it is likely that the o13C signal found in the sampled PNG
rivers is a mixture of the two plant types, as grasses were observed along the riparian
zone in most of the sampled rivers.
46
The radiocarbon dates of the riverine POC (Table 5) indicate that the organic
material has had centuries to millennia to degrade in the terrestrial environment. Few
studies have examined the age of POC in river systems, but the few rivers studied are
mountainous ones, and are on opposite ends of the spectrum both in terms of basin area
and results. Hedges et al. ( 1986) found organic matter (coarse and fine fractions) in the
Amazon R. to be enriched in 'bomb carbon', indicating a rapid (i.e. decadal) turnover of
the organic carbon pool there. In contrast, a small mountainous river in Taiwan, the
Lanyang Hsi, exports POC with radiocarbon ages> 10,000 yr. B.P., which the authors
attribute to kerogen weathering (Kao and Liu, 1996).
The ages of the POC of the sampled PNG rivers relates to the presumption of low
net ecosystem production discussed earlier in the paper. With the low DOC
concentrations found in the sampled rivers, despite high rates of primary production in
the watershed, it seems that the primary production is balanced approximately 1: 1 by
respiration. The old POC attests to this, as it seems that the younger, more labile organic
matter (i.e. perhaps as DOC) is respired. The POC remaining in the watershed, and
eventually being exported to the river, is older, recalcitrant plant material that is not
metabolically efficient for bacteria to respire (Opsahl and Benner, 1997). The more
refractory POC remains in the watershed, perhaps sorbed to mineral grains (Keil, ct a!,
1997), and is eventually exported to the river, where it may mix with younger plant
material that was eroded before it was respired. The POC sample from the Gum R. after
the rain event may represent a mixture of older recalcitrant POC and fresh plant material,
thus causing the observed decrease from 790 to 350 yr. B.P. between the two samples.
47
CONCLUSIONS
The conclusions from the data obtained in this study are that basin area, a proxy
for sediment residence time, does not affect total dissolved solid concentration or load in
the sampled wet small mountainous rivers. However, it is impossible to ascertain how
much of the surface flow of the sampled rivers is affected by groundwater base flow, and
therefore the possibility if a basin area control on TDS concentration for other small
rivers is left undetermined. Lithology of the watershed is considered to be the most
important variable controlling the dissolved load of small rivers. The data from this
project fill the noticeable gap in dissolved data from the world rivers. Small rivers, basin
areas less than 10,000 km2, have been neglected in the global data set, and this project
provides evidence that they are important contributors of dissolved constituents to the
global ocean. Their class of river exports 28% of the annual global export of 39 * 10 14 g
yr-1
of dissolved ions. And based on the TDS yield data, small mountainous rivers
contribute a disproportionately high amount of inorganic solutes to the global ocean.
More data are needed from small rivers in other climates and morphologies to explore
their dynamics further.
48
REFERENCES
Alexander, R.B., A.S. Ludtke, K.K. Fitzgerald, and T.L. Schertz. 1996. Data from selected USGS national stream water quality network, USGS Digital Data Series, DDS- 37, on CD-ROM.
Bajpayee, S.K., D. Wittkuhn, V. Subramanian, and I. Ittekot. 1999. Water and sediment quality of small rivers in the south western part of India, Hydrogeology Journal, submitted.
Baumgartner, A. and Reichel, E. 1976. The World Water Balance, Elsevier, 179pp.
Berner, R.A., A.C. Lasaga, and R.M. Garrels. 1983. The carbonate-silicate geochemical cycle and its effect on atmospheric carbon dioxide over the past I 00 million years, Am. J. Sci. 283: 641-683.
Berner, R.A. 1992. Weathering, plants, and the long-term carbon cycle, Geochim. Cosmochim. Acta, 56:3225-3231.
Berner, E.K. and R.A. Berner. 1996. Global Environment; Water, Air and Geochemical Cycles, Prentice Hall, 376 pp.
Berner, R.A. and E.K. Berner. 1997. Silicate weathering and climate, In Global Tectonic and Climate Chan~, Plenum Press, pp. 354-364.
Boutton, T. W. 1991. Stable carbon isotope ratios of natural materials: II. atmospheric, terrestrial, marine and freshwater environments, In Carbon Isotope Technigues, Academic Press, pp. 173-185.
Drever, J.I. and J. Zobrist. 1992. Chemical weathering function of elevation in the southern Swiss Alps, Geochim. Cosmochim. Acta, 56: 3209-3216.
Drever, J.I. 1997. The Geochemistry of Natural Water, 3rd eel., Prentice Hall, 436pp.
Edmond, J.M., M.R. Palmer, C.I. Measures, E.T. Brown and Y. Huh. 1996. Fluvial Geochemistry of the eastern slope of the northeastern Andes and its foredeep in the drainage of the Orinoco in Columbia and Venezuela, Geochim. Cosmochim. Acta, 60:2949-2976.
Garrels, R.M. and F.T. MacKenzie. 1971. Evolution of Sedimentary Rocks, W.W. Norton, 397 pp.
Gibbs, R.J. 1970. Mechanisms controlling world water chemistry, Science, 170: 1088-
1090.
Hargreaves, I. 1998. Papua New Guinea Report, NSR Environmental Consulting Pty. Ltd., Victoria, Australia, 70 pp.
Hedges, J.I., J.R. Ertel, P.D. Quay, P.M. Grootes, J.C. Richey, A.H. Devol, G.W. Farwell, F.W. Schmidt, and E. Salati. 1986. Carbon-14 in the Amazon River system, Science, 231: 1129-1131.
Kao, S., and K. Liu. 1996. Particulate organic carbon export from a subtropical mountainous river (Lanyang Hsi) in Taiwan, Limnol. Oceano gr., 41: 1749-1757.
Keil, R.G., L.M. Mayer, P.D. Quay, J.E. Richey, and J.I. Hedges. 1997. Loss of organic matter from riverine particles in deltas, Geochim. Cosmochim. Acta, 61: 1507-1511.
Lasaga, A.C., J.M. Soler, J. Ganor, T.E. Burch, K.L. Nagy. 1994. Chemical weathering rate laws and global geochemical cycles, Geochim. Cosmochim. Acta, 58: 2361-2386.
Livingstone, D.A. 1963. Chemical composition of rivers and lakes, U.S. Geological Survey, Professional Paper 440G, 64 pp.
49
Meybeck, M. 1976. Total mineral transport by world major rivers, Hydrol. Sci. Bull., 21: 265-284.
Meybeck, M. 1977. Dissolved and suspended matter carried by rivers: composition, time and space variations and world balance, In Interactions between sediments and fresh waters, Junk and Pudoc, pp. 25-32.
Meybeck, M. 1987. Global chemical weathering of surficial rocks estimated by river dissolved loads, Am. J. Sci., 287: 401-428.
Meybeck, M. 1988. How to establish and use world budgets of river material. In Physical and Chemical Weathering in Geochemical Cycles, Kluwer, pp. 247-272.
Meybeck, M. 1994. Origin and variable composition of present day riverborne material, In Material Fluxes on the Surface of the Earth, NRC Studies in Geophysics, pp. 61-73.
Meybeck, M. and A. Ragu.1995. River discharges to the ocean: An assessment of suspended solids, major ions and nutrients, GEMS/ EAP Report NR, 245 pp.
Milliman, J.D. and P.M. Syvitski. 1992. Geomorphic/tectonic control of
sediment discharge to the ocean: The importance of small mountainous rivers, J. Geol., 100: 751-762.
Milliman, J.D. 1995. Sediment discharge to the ocean from small mountainous rivers: The New Guinea example, Geo-Marine Letters, 15: 127-133.
Milliman, J.D. 1997. Flu vial sediment discharge to the sea and the importance
50
of regional tectonics, In Global Tectonics and Climate Chan~, Plenum Press, pp. 240-256.
Milliman, J.D. and K.L. Farnsworth. Global Rivers Atlas, Oxford Univ., In Prep.
Nkounkou, R.R., and J.L. Probst. 1987. Hydrology and geochemistry of the Congo River system, In Transport of carbon and minerals in major world rivers, Mitt. Geol. Palaont. Inst. Univ. Hamburg, SCOPE/UNEP, 64: 483-508.
Odum, E.P. 1969. The strategy of ecosystem development, Science, 164: 262-270.
Opsahl, S. and R. Benner. 1997. Distribution and cycling of terrigenous dissolved organic matter in the ocean, Nature, 398: 480-482.
Osmond, C.B., K. Winter, and H. Ziegler. 1982. Functional significance of different pathways of C02 fixation in photosynthesis, In Physiological Plant Ecology II.
Relations and Carbon Assimilation, Springer-Verlag, pp. 479-547.
Petr, T. 1983. Dissolved chemical transport in major rivers of Papua New Guinea, In Transport of Carbon and Minerals in Major World Rivers, Mitt. Geol. Palaont. Inst. Univ. Hamburg, SCOPE/UNEP, 55:447-481.
Robinson, G.P., A.L. Jaques, and C.M. Brown. 1976. Explanatory notes of the Geologic map, Madang quadrangle, Sheet SB/55-6. Canberra: Australian Government Publishing Service.
Schlesinger, W.H. 1991. Biogeochemistry: an analysis of global chan~, Academic Press, Inc.,
443pp.
Stallard, R.F., and J.M. Edmond. 1981. Geochemistry of the Amazon l: Precipitation chemistry and the marine contribution to the dissolved load, J. Geophys. Res., 86: 9844-9858.
Stallard, R.F. and J.M. Edmond. 1983. Geochemistry of the Amazon 2: The influence of the geology and weathering environment on the dissolved load, J. Geophys. Res., 88: 9671-9688.
Stallard, R.F. and J.M. Edmond. 1987. Geochemistry of the Amazon 3: Weathering chemistry and limits to dissolved inputs, J. Geophys. Res., 92: 8293-8302.
Stevenson, F.J. 1985. Geochemistry of soil humic substances, In Humic Substances in Soil, Sediment and Water; Geochemistry Isolation and Characterization, John Wiley, pp. 13-52.
Walling, D.E. 1984. Dissolved loads and their measurement. In: Erosion and sediment Yield: Some methods of measurement and modeling, Geo Books, pp. 111-177.
Williams, P.M. and L.l. Gordon. 1970. 13C: 12C ratios of dissolved and particulate organic matter in the sea, Deep Sea Research, 17:19-27.
51

52
APPENDIX
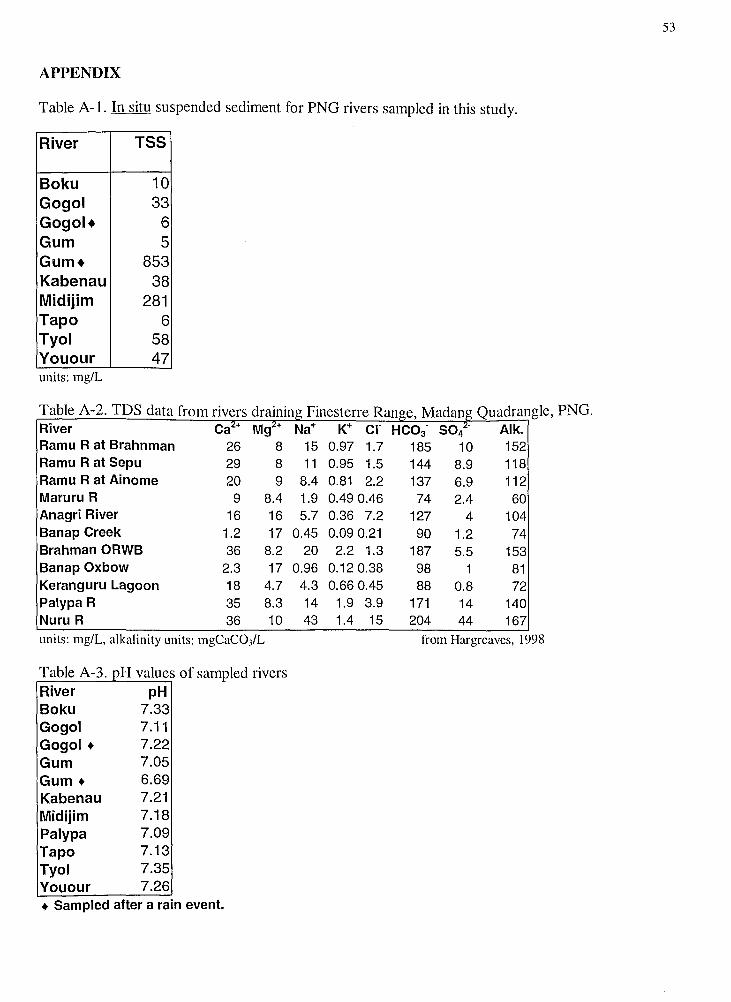
The following appendix contains five tables that were not of direct relevance to the preceding paper. Included among these are data fi·om proximal PNG rivers (documenting the high concentration of Mg2+), the in-situ suspended matter of the rivers at the time of sampling, the measured pH and alkalinity of the samples, and the raw dissolved inorganic carbon data.
53
APPENDIX
Table A-l. In situ suspended sediment for PNG rivers sampled in this study.
River TSS
Boku 10 Gogol 33 Gogol+ 6 Gum 5 Gum+ 853 Kabenau 38 Midijim 281 Tapo 6 Tyol 58 Youour 47 units: mg/L
T bl A 2 TDS d t f a e - a a rom nvers d .. F rammg mesterre R af!ge, Mel a ang Q d gle, PNG. ua ran River Ca2+ MgZ+ Na+ K+ cr Hco3· so4 ~- Alk. Ramu R at Brahnman 26 8 15 0.97 1.7 185 10 152 Ramu R at Sepu 29 8 11 0.95 1.5 144 8.9 118 Ramu R at Ainome 20 9 8.4 0.81 2.2 137 6.9 112 Maruru R 9 8.4 1.9 0.490.46 74 2.4 60 Anagri River 16 16 5.7 0.36 7.2 127 4 104 Banap Creek 1.2 17 0.45 0.09 0.21 90 1.2 74 Brahman ORWB 36 8.2 20 2.2 1.3 187 5.5 153 Banap Oxbow 2.3 17 0.96 0.120.38 98 1 81 Keranguru Lagoon 18 4.7 4.3 0.66 0.45 88 0.8 72 Palypa R 35 8.3 14 1.9 3.9 171 14 140 Nuru R 36 10 43 1.4 15 204 44 167 umts: mg/L, alkalinity units: mgCaC03/L from Hargreaves, 1998
T bl A 3 H a e - . P- va ues of sampled rivers River pH Boku 7.33 Gogo I 7.11 Gogol + 7.22 Gum 7.05 Gum+ 6.69 Kabenau 7.21 Midijim 7.18 Palypa 7.09 Tapo 7.13 Tyol 7.35 Youour 7.26 + Sampled after a ram event.
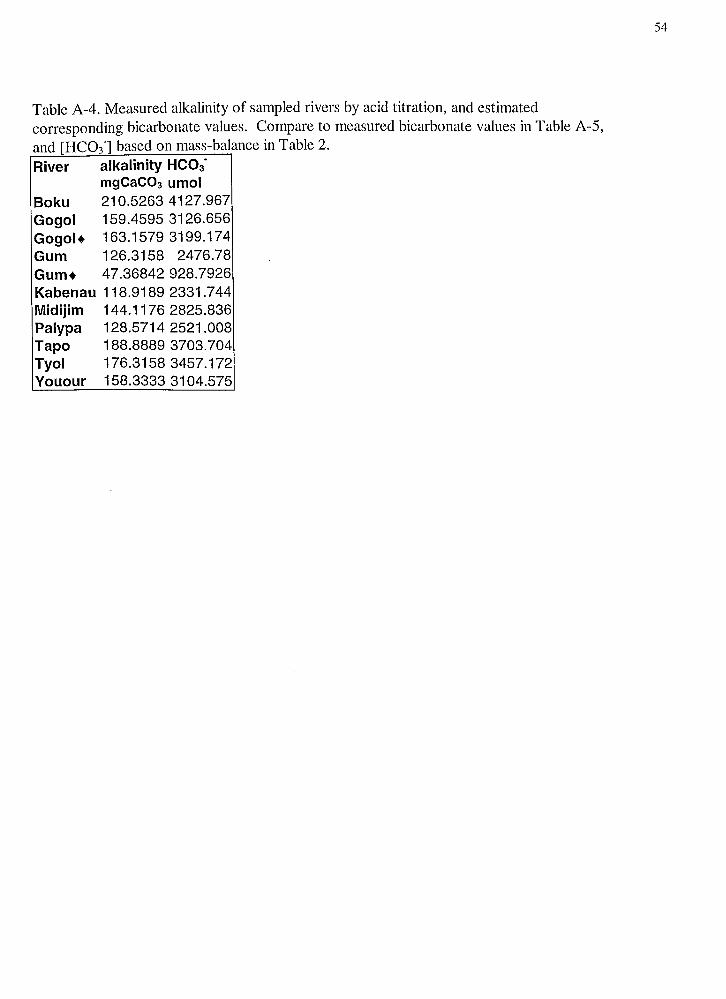
Table A-4. Measured alkalinity of sampled rivers by acid titration, and estimated corresponding bicarbonate values. Compare to measured bicarbonate values in Table A-5, and [HC03"] based on mass-balance in Table 2. River alkalinity HC03.
mgCaC03 umol Boku 21 0.5263 4127.967 Gogol 159.4595 3126.656 Gogol+ 163.1579 3199.174 Gum 126.3158 2476.78 Gum+ 47.36842 928.7926 Kabenau 118.9189 2331.744 Midijim 144.1176 2825.836 Palypa 128.5714 2521.008 Tapo 188.8889 3703.704 Tyol 176.3158 3457.172 Youour 158.3333 3104.575
54
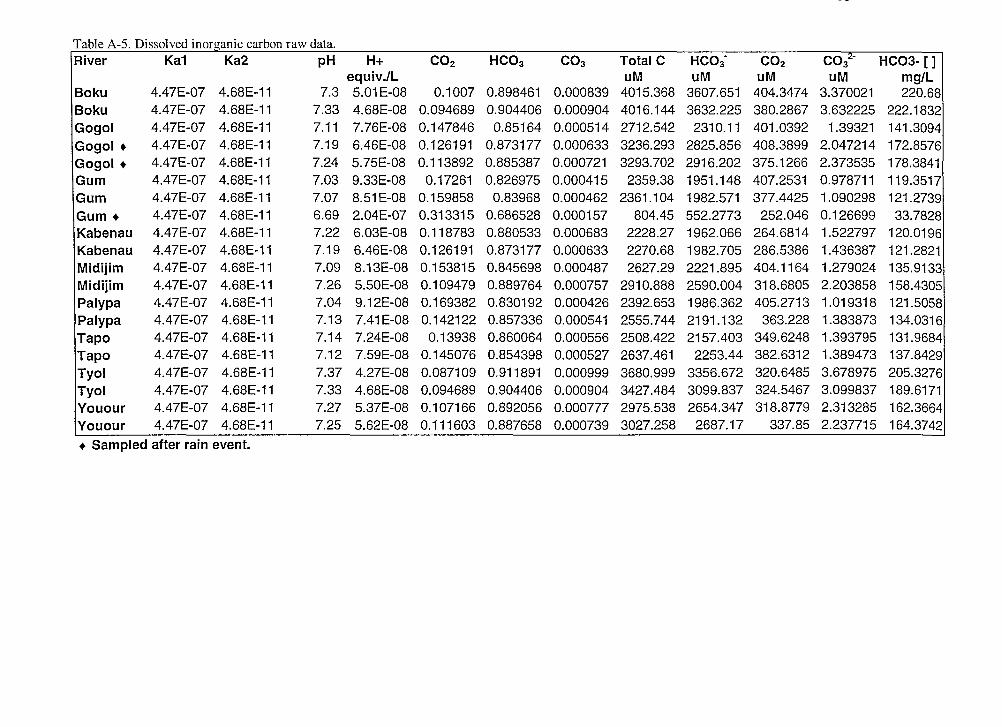
Table A-5. Dissolved inorganic carbon raw data. ·River Ka1 Ka2 pH H+ C02 HC03 co3 Total C HC03. C02 co32• HC03- []
equiv./L uM uM uM uM mg/L Baku 4.47E-07 4.68E-11 7.3 5.01 E-08 0.1007 0.898461 0.000839 4015.368 3607.651 404.3474 3.370021 220.68 Baku 4.47E-07 4.68E-11 7.33 4.68E-08 0.094689 0.904406 0.000904 4016.144 3632.225 380.2867 3.632225 222.1832 Gogel 4.47E-07 4.68E-11 7.11 7.76E-08 0.147846 0.85164 0.000514 2712.542 2310.11 401.0392 1.39321 141.3094 Gogel + 4.47E-07 4.68E-11 7.19 6.46E-08 0.126191 0.873177 0.000633 3236.293 2825.856 408.3899 2.047214 172.8576 Gogel+ 4.47E-07 4.68E-11 7.24 5. 75E-08 0.113892 0.885387 0.000721 3293.702 2916.202 375.1266 2.373535 178.3841 Gum 4.47E-07 4.68E-11 7.03 9.33E-08 0.17261 0.826975 0.000415 2359.38 1951.148 407.2531 0.978711 119.3517 Gum 4.47E-07 4.68E-11 7.07 8.51 E-08 0.159858 0.83968 0.000462 2361.104 1982.571 377.4425 1.090298 121.2739 Gum+ 4.47E-07 4.68E-11 6.69 2.04E-07 0.313315 0.686528 0.000157 804.45 552.2773 252.046 0.126699 33.7828 Kabenau 4.47E-07 4.68E-11 7.22 6.03E-08 0.118783 0.880533 0.000683 2228.27 1962.066 264.6814 1.522797 120.0196 Kabenau 4.47E-07 4.68E-11 7.19 6.46E-08 0.126191 0.873177 0.000633 2270.68 1982.705 286.5386 1.436387 121.2821 Midijim 4.47E-07 4.68E-11 7.09 8.13E-08 0.153815 0.845698 0.000487 2627.29 2221.895 404.1164 1.279024 135.9133 Midijim 4.47E-07 4.68E-11 7.26 5.50E-08 0.109479 0.889764 0.000757 2910.888 2590.004 318.6805 2.203858 158.4305 Palypa 4.47E-07 4.68E-11 7.04 9.12E-08 0.169382 0.830192 0.000426 2392.653 1986.362 405.2713 1.019318 121.5058 Palypa 4.47E-07 4.68E-11 7.13 7.41E-08 0.142122 0.857336 0.000541 2555.744 2191.132 363.228 1.383873 134.0316 Tapa 4.47E-07 4.68E-11 7.14 7.24E-08 0.13938 0.860064 0.000556 2508.422 2157.403 349.6248 1.393795 131.9684 Tapa 4.47E-07 4.68E-11 7.12 7.59E-08 0.145076 0.854398 0.000527 2637.461 2253.44 382.6312 1.389473 137.8429 Tyol 4.47E-07 4.68E-11 7.37 4.27E-08 0.087109 0.911891 0.000999 3680.999 3356.672 320.6485 3.678975 205.3276 Tyol 4.47E-07 4.68E-11 7.33 4.68E-08 0.094689 0.904406 0.000904 3427.484 3099.837 324.5467 3.099837 189.6171 Youour 4.47E-07 4.68E-11 7.27 5.37E-08 0.107166 0.892056 0.000777 2975.538 2654.347 318.8779 2.313285 162.3664 Youour 4.47E-07 4.68E-11 7.25 5.62E-08 0.111603 0.887658 0.000739 3027.258 2687.17 337.85 2.237715 164.3742
+ Sampled after rain event.
VITA
Megan Bohlen Raymond
Born in Westerly, Rhode Island, 24 August 1972. Graduated from The Williams
School, New London, Connecticut, in 1990. Earned a B.S. in Geological Sciences and
Environmental Studies from Tufts University, in Medford, Massachussets, in 1995.
Entered the Master's program at the College of William and Mary, School of Marine
Science in 1996.
56