Embed Size (px)
Citation preview

Journal of Science and Technology © KNUST April 2015
GEO-ELECTRICAL INVESTIGATION FOR SUBSURFACE ELECTRICAL SYSTEM EARTHING AT THE SCHOOL OF
MANAGEMENT TECHNOLOGY OF THE FEDERAL UNIVERSITY OF TECHNOLOGY, AKURE, NIGERIA
G. M. Olayanju and F. O. Onaolapo Department of Applied Geophysics, Federal University of Technology, Akure, Nigeria.
E-mails: [email protected]; [email protected] Corresponding author: [email protected]
ABSTRACT Electrical tomographic imaging and depth sounding techniques were employed in the investiga-tion of the subsoil around the School of Management Technology of the Federal University of Technology, Akure, Nigeria for the purpose of Electrical Earthing. Wenner Dipole-dipole elec-trical resistivity imaging was conducted along seven traverses in the area with electrode inter spacing ‘a’ of 2m, with the probing level ‘n’ varied from 1 to 5. Twelve Vertical Electrical Soundings were conducted at selected locations based on the results of electrical imaging. The geoelectric sections obtained from inverted sounding data revealed three subsurface geologic layers, which comprise the topsoil, weathered bedrock and the fresh basement rock. The topsoil is composed mainly of clay or sandy clay/ clayey sand or laterite with resistivity values that range from 41 to 739 Ohm-m and thickness ranging from 0.5 to 5.3m. The weathered bedrock resistiv-ity values ranges from 12 to 363 Ohm-m with thickness between 1.0m and 17.9m. The underly-ing fractured/fresh basement rock resistivity varies from 213 to 865 ohm-m. However, the under-lying migmatite-gneiss basement rock is relatively shallow. The inverted resistivity sections from the Dipole–dipole and computed ground resistance distribution revealed typical 3- layer earth models revealing majorly five suitable localities with relatively low resistance (< 15 ohm ) with probable depth for the insertion of Earthing materials lying between 1.5m and 4m. In addition, areas characterized by resistance values, between 15 ohm and 25 ohm, can be improved upon by adding industrial salts.
Keywords: Earthing, Ground resistance, Tomographic Imaging, Wenner Dipole-dipole, Vertical Electrical Sounding
INTRODUCTION Earthing of infrastructures usually requires the connection of a conductor of a particular frame of a device (i.e., a metallic lightning device)
extending to the general mass of earth with the aim of protecting the infrastructure from dam-ages that might be as a result of excessive cur-rent discharge, especially from thunder storms.
© 2015 Kwame Nkrumah University of Science and Technology (KNUST)
Journal of Science and Technology, Vol. 35, No. 1 (2015), pp10-23 10
http://dx.doi.org/10.4314/just.v35i1.2
RESEARCH PAPER

Journal of Science and Technology © KNUST April 2015
Earthing materials play an important role in generation, transmission and distribution for safe and proper operation of any electric instal-lation. These devices form a low-resistance path for the lightning discharge and prevent it from travelling through the infrastructures. There are a number of good reasons for earthing, but primary among them is to ensure personnel safety. Geophysical applications are essential in many areas of human developmen-tal programmes, especially development of infrastructures, hydrogeology, engineering and foundational studies, environmental studies and planning, among many (Barker, 1990; Herman, 2001; Pfieffer, 2001; Akintorinwa and Adesoji, 2009; Ofomola et al., 2009). Essentially, the geophysical application of elec-trical resistivity methods will significantly be suitable in detecting conductive medium through which the earthing installations can be done. The resistance between the earth elec-trode and “true Earth” is known as the Earth Resistance of an electrode and it will depend on the soil resistivity, the type and size of the elec-trode and the depth to which it is buried. The resistance of an earth electrode is greatly influ-enced by the resistivity of the soil in which it is driven and as such, soil resistivity measure-ments are an important parameter when design-ing earthing installations. Earthing devices form a low-resistance path for the lightning discharge and prevent it from travelling through the infrastructures; therefore a safe conductive medium is essential for the emplacement of these devices in order to meet electrical safety standards. Various geophysical methods, for example seis-mic refraction, ground penetrating radar can help in identifying shallow geologic environ-ment suitable for this purpose. If the soil resistivity is known or can be meas-ured using the 4-point electrode method, the earthing resistance Rg of an earth electrode may be calculated from the earth resistivity r
and the electrode geometry used (Markiewicz and Klajn, 2003). Several authors have demonstrated application of geophysics in ground resistance testing for proper down conductors grounding systems in some journals and handbooks (Beackmann and Schweak, 1976; LEM, 2005; Megger, 2005; Akintorinwa and Adesoji, 2009; AEMC, 2012). Their approaches involve direct measurement of soil resistivity across the area of interest. In this paper in order to identify suitable area for earthing of an academic Building under con-struction, Vertical Electrical Sounding (VES) and combined Vertical Electrical Sounding and Horizontal Profiling Electrical Techniques were employed. MATERIALS AND METHODS Site description and geology The study location is the School of Manage-ment Technology site of the Federal University of Technology, Akure campus in Nigeria, which lies within latitudes 7° 17′ N to 7° 19′ N and longitudes 5° 07′ E to 5° 09′ E (Fig. 1). The study area is accessible by a network of roads and foot paths within the Campus. The topogra-phy of the area shows a relatively undulating terrain, with surface elevation lying between 375 m and 377.5 m. The Institution is predomi-nantly underlain by the Migmatite-gneiss-quartzite complex as shown in Fig. 1, which forms a part of West African Basement Com-plex. The migmatite-gneiss-quartzite complex is gen-erally considered as a major group of the West African Basement complex, which has a het-erogeneous assemblage comprising migmatites, orthogneisses, paragneisses, and a series of basic and ultrabasic metamorphosed rocks (Rahaman, 1976, 1988). Major rocks outcrops in the area include the Quartzite, Charnockite, Migmatite-gneiss and Granites. The granitic rocks occur mainly as low-lying outcrops and generally have texture varying from fine grained to medium grained with col-
Olayanju and Onaolapo 11

Journal of Science and Technology © KNUST April 2015
Investigation of subsoil for the purpose of electrical earthing... 12
which measures and displays the current and potential difference, averaged over a number of cycles. The measured apparent earth resistivity is computed from the output displayed values of the current and voltage averaged over five cycles in order to ensure good quality data. Seven traverses were established, labelled Line 1 to Line 7 in Fig. 2. Four of these traverses ran south to north, while the other three ran west to east. The geographi-cal coordinates of the data points were estab-lished using GERMAN hand held Global Posi-tioning System (GPS). The coordinates were recorded in Universal Transverse Mercator (UTM) coordinate system with the predefined Zone 32 N World Geodetic System 1984 (WGS 84) reference datum. Electrical imaging of the subsurface along the
4 6 8 10 12 14
4 6 8 10 12 14
5
7
9
11
13
5
7
9
11
13
Ondo S
tate
FCT
Lagos
Calabar
Ikom
Warri
Yola
Kano
Katsina
Lokoja
Maiduguri
Makurdi
Minna
Nguru
Ibadan
Onitsha
Osogho
Owerri
P.Harcourt
Yelwa
Gusau
Katsina
Zaria
Bauchi
Bida Abuja
Jos
Ikeja
Abeokuta
Benin
Akure
Enugu
Uyo
sokoto
Ilorin
Kaduna
Potiskum
IfonIrhua
0 100 200 300 400km
Edo State
Towns/Cities
State boundaries
Inter National boundary
Study area
o
o
o
o
o o
o
o
o
o
oooooo
o o o o o o
River
RE
PU
BL
IC
OF
BE
NIN
NIGER
CAMEROON
BIGHT OF
BENIN
R. NIGER
R. BENUE
Fig. 1: Geological Map of Federal University of Technology Akure; inset Map of Nigeria (After Olayanju and Ojo, 2015).
our varying from pale brown to greyish. The Charnockites in the area are dark greenish to greenish grey rocks with bluish quartz and greenish feldspar. The greenish colouration is due principally to the presence of hornblende. The Charnockites bear a variable contact rela-tionship with the surrounding rocks, with the transition in contact between the Charnockites and the surrounding granite rocks marked by loss of dark colouration, which is characteristic of the feldspar of the Charnockite. Quartzite occurs mostly as ridges and thin bands (not more than 20 – 30 cm in thickness, within the migmatite gneiss) around the area. They occur in the NW-SW direction and are brownish in colour with a medium to coarse grain texture. Electrical resistivity surveys The electrical equipment employed for this paper is the PASI (E2 Digit) Resistivity Meter,
Journal of Science and Technology © KNUST April 2015
13 Olayanju and Onaolapo
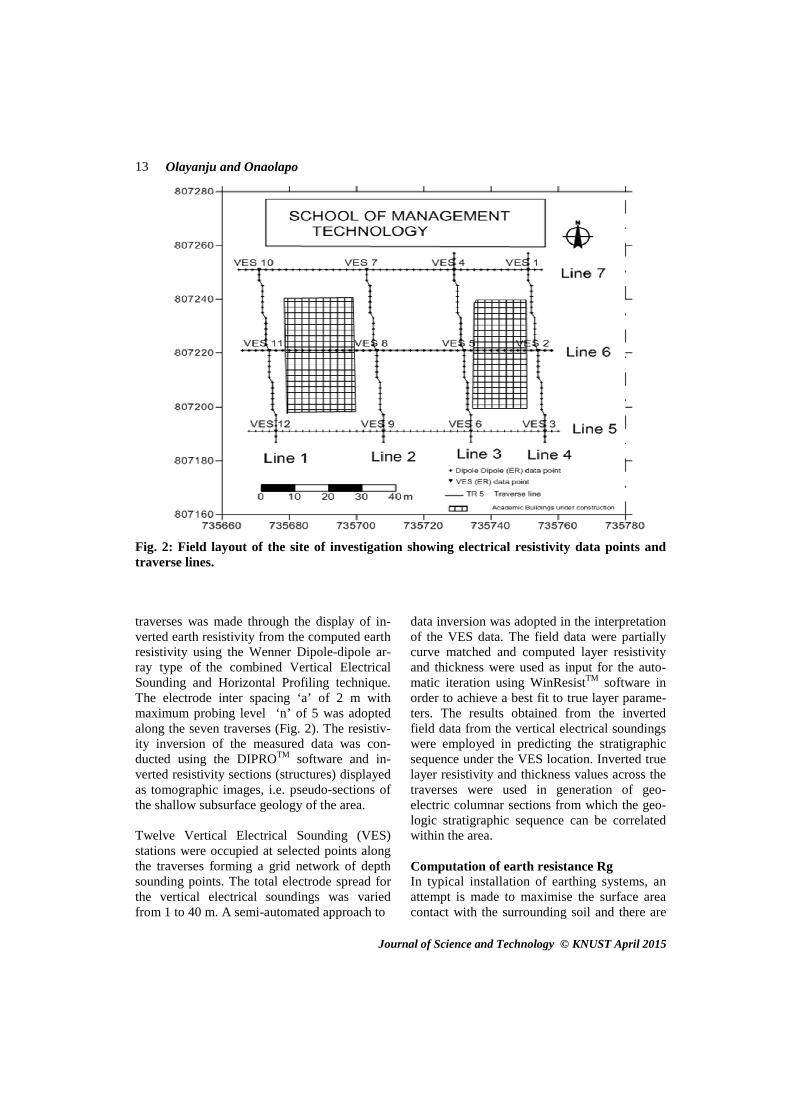
data inversion was adopted in the interpretation of the VES data. The field data were partially curve matched and computed layer resistivity and thickness were used as input for the auto-matic iteration using WinResistTM software in order to achieve a best fit to true layer parame-ters. The results obtained from the inverted field data from the vertical electrical soundings were employed in predicting the stratigraphic sequence under the VES location. Inverted true layer resistivity and thickness values across the traverses were used in generation of geo-electric columnar sections from which the geo-logic stratigraphic sequence can be correlated within the area. Computation of earth resistance Rg In typical installation of earthing systems, an attempt is made to maximise the surface area contact with the surrounding soil and there are
Fig. 2: Field layout of the site of investigation showing electrical resistivity data points and traverse lines.
traverses was made through the display of in-verted earth resistivity from the computed earth resistivity using the Wenner Dipole-dipole ar-ray type of the combined Vertical Electrical Sounding and Horizontal Profiling technique. The electrode inter spacing ‘a’ of 2 m with maximum probing level ‘n’ of 5 was adopted along the seven traverses (Fig. 2). The resistiv-ity inversion of the measured data was con-ducted using the DIPROTM software and in-verted resistivity sections (structures) displayed as tomographic images, i.e. pseudo-sections of the shallow subsurface geology of the area. Twelve Vertical Electrical Sounding (VES) stations were occupied at selected points along the traverses forming a grid network of depth sounding points. The total electrode spread for the vertical electrical soundings was varied from 1 to 40 m. A semi-automated approach to

Journal of Science and Technology © KNUST April 2015
14 Investigation of subsoil for the purpose of electrical earthing ...
series of common methods of earthing. Details of these methods have been documented in Markiewicz and Klajn (2003). However, for this paper the single electrode earthing arrange-ment was used to model the effective Earth Resistance (Rg) in the study area. There are some formulae for calculating earth resistance for various types and configurations of elec-trodes as stipulated by the Australian Standard on Lightning protection (AS 1768-1991), which are well documented in details in some publica-tions (ARTC, 2005; Lightning and Surge Tech-nologies, 2014). For a single spike, of diameter (d) and length (L) driven vertically into the soil of resistivity (ρ), the effective Earth resistance (Rg) was computed using the following expres-sion:
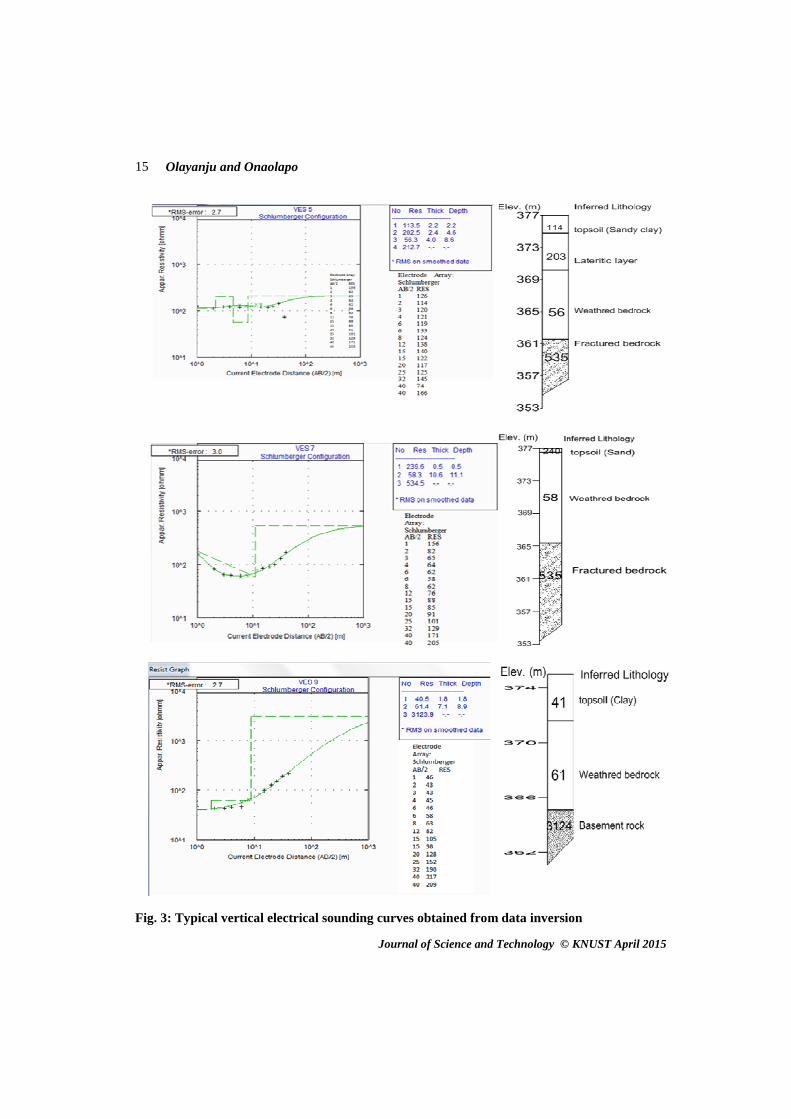
On the basis of effective soil resistivity values obtained from the inverted Dipole-Dipole resis-tivity data, information about the distribution of Earth resistance (Rg) within the area was de-rived using the above expression and the results presented in the form of pseudo sections similar to that of the dipole-dipole electrical imaging. RESULTS AND DISCUSSION Vertical electrical sounding The estimated geo-electric parameters from the sounding curves from the study area are shown in Table 1, while the typical sounding curves from the area are displayed in Fig. 3. Qualita-tive analysis of the Vertical Electrical Sounding data was based on the observed frequency plot (Fig. 4). Three curve types were delineated, with the H – type dominant in the area having maximum rate of occurrence (50%), followed by the A – type (42% rate of occurrence) and the KH – type having 8% rate of occurrence. The H-type is typical of pronounced weathering effect charac-
where: ρ = soil resistivity in ohm-m L = Buried length of the electrode in m d = diameter of the electrode in m
Table 1: Table showing the VES interpretation results from the measured field data
S/N VES
Station
Curve
Types
Geoelectric Parameters Thickness of the
Geoelectric Layer:
h1/h2/h3/…/hn-1
(m)
Depth to the
Geoelectric Interface:
d1/d2/d3/…/dn-1
(m)
Layer
Resistivity: ρ1/ρ2/ρ3/……/ρn
(ohm-m) 1 3 A 1.4/1.0 1.4/2.4 41/160/3280 2 4 A 2.1/3.1 2.1/5.2 104/171/467 3 6 A 5.3/3.3 5.3/8.6 76/333/3036 4 8 A 0.9/17.9 0.9/18.8 54/75/490 5 9 A 1.8/7.1 1.8/8.9 41/61/3124 6 1 H 0.5/2.2 0.5 /2.7 133/53/2376 7 2 H 3.5/6.8 3.5/10.3 739/72/865 8 7 H 0.5/10.6 0.5/11.1 240/58/535 9 10 H 3.3/6.9 3.3/10.2 128/62/2549 10 11 H 1.3/4.2 1.3/5.5 141/37/4840 11 12 A 3.4/6.5 3.4/9.9 42/120/363 12 5 KH 2.2/2.4/4.0 2.2/4.6/8.6 114/203/56/213
Journal of Science and Technology © KNUST April 2015
15 Olayanju and Onaolapo
Fig. 3: Typical vertical electrical sounding curves obtained from data inversion
Journal of Science and Technology © KNUST April 2015
16 Investigation of subsoil for the purpose of electrical earthing...
terized by low to intermediately high resistive clayey to lateritic topsoil (41 to 739 ohm-m); saturated weathered layer (37 to 61 ohm-m); and fractured/fresh basement (535 to 4840 ohm-m). The A – type curves are diagnostic of shal-low bedrock in the area, with progressive in-crease in resistivity from a low resistive (41 to 104 ohm-m) clayey topsoil to saturated and highly weathered layer (12 to 333 ohm-m) overlying the fractured/fresh basement rock with resistivity value ranging from 326 to 3280 ohm-m. The KH curve type indicates the pres-ence of clayey topsoil with resistivity values of 114 ohm, which is underlain by clayey sand layer with resistivity value of 203 ohm-m. Be-neath this intermediate layer lies a saturated and highly weathered layer having resistivity value of 56 ohm-m underlying by highly frac-tured bedrock (213 ohm-m). In most cases the topsoil is relatively thin (2.1± 1.4) m, while average overburden is 8.5 ± 4.4 m. The relatively low bedrock resistivity val-ues observed at VES 2, 4, 5, 7, 8 and 12 loca-tions are diagnostic of development of secon-dary porosity, which might arise from fracture-
Fig. 4: The frequency distribution chart of the curve types in the study area
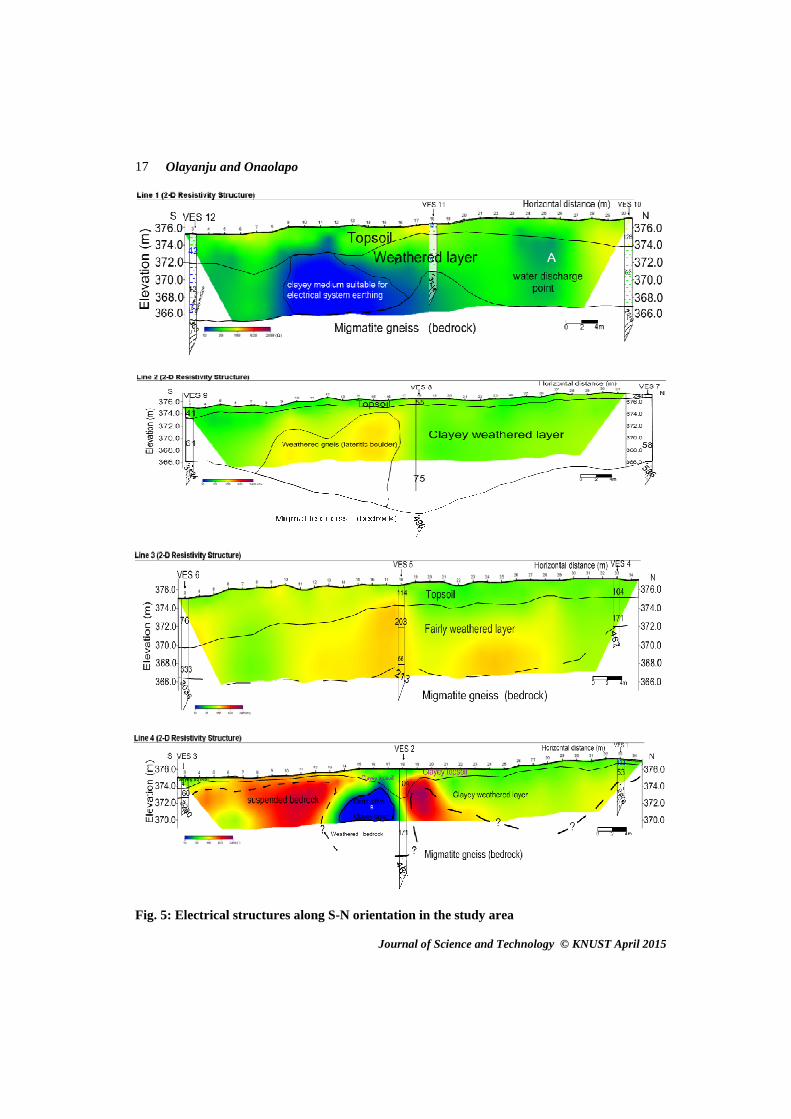
ing of the bedrock and are more significant in groundwater development. However, some shallow zones of low resistivity value along the stratigraphic sections character-ized by these curves could be relevant in earthing scheme, especially at VES 3, 9 and 12 locations with probable depth less than 5m. Dipole-Dipole electrical imaging Characteristic earth images (pseudo-sections) of the immediate shallow parts of the subsur-face in the area are shown in Figs. 5 and 6. The geoelectric stratigraphic columns are superim-posed on the inverted pseudo sections (resistivity structures) from the dipole-dipole electrical imaging. This allows the correlation of the geoelectric sections with the 2D resistiv-ity structures in order to identify zones of con-ductive medium for earthing in the area. Since it is required that earth electrodes must ideally penetrate into the moisture level below the ground level, emphasis is laid on the immediate shallow layers for the purpose of the electrical earthing systems.
Journal of Science and Technology © KNUST April 2015
Fig. 5: Electrical structures along S-N orientation in the study area
Olayanju and Onaolapo 17

Journal of Science and Technology © KNUST April 2015
Fig. 6: Electrical structures along W-E orientation in the study area
The inversion of the Dipole-Dipole electrical data obtained along traverses labelled Line 1 – 4 in the S-N, and Line 5 – 7 in the W-E direc-tion are presented as images of the Earth mod-els of the inferred resistivity structures in the area with the aid of DIPROTM tomographic software. The areas identified to be suitable for the electrical earthing systems are marked out on the tomographic displays of the resistivity structures in the area. Toning effect of the tomographic displays of the inverted resistivity structures depict charac-teristic resistivity (consequently conductivity) of the intermediate medium encountered in the study area. In conjunction with the VES results obtained in the area, the south-western edge of the study area was recognized to be character-ized by resistivity value less than 25 Ohm-m.
The suitable conductive zones for electrical earthing systems are located beneath VES 12 (around stations 3 – 5) and low resistivity zone (i.e. conductive zone) extending from 16 to 30 m (station 9 – 17) along traverse 1 (Line 1) along S-N direction. Along traverse 5 (Line 5), the observed conduc-tive zone lies between the start of the traverse and 22 m (station 1 – 12) away from the begin-ning of the traverse in the W-E direction. Also, along traverse 1 (Line – 1), the conductive zone labelled A along corresponds to a water dis-charge point (bleeding point), while the con-ductive zone labelled B along traverse 4 (Line – 4) is also characterized by resistivity value less than 25 ohm-m, which signify the possible zones of interest for the earthing purpose. However, the earthing system is likely to fail at these locations due to relatively high resistivity
Investigation of subsoil for the purpose of electrical earthing... 18

Journal of Science and Technology © KNUST April 2015
values of surrounding soil in the area. Distribution of earth resistance Rg A typical result of the computed Rg obtained along Line 1, with effective depth of investiga-tion of 2 m is shown in Table 2, which shows that the earth resistance reduces with reduction in the length or diameter of the earthing rod.
From the results of electrical tomography, the distributions of the computed effective ground resistance in the area are displayed as pseudo-section (resistance structures) in Figs 7 and 8. The displays show variation in Earth resistance computed from the inverted earth resistivity along the profiles based on a 3 m length earthing rod with a diameter of 2.5 mm.
Table 2: Extract of computed ground resistance from effective resistivity values along Line-1
Ground distance (m)
Elevation (m)
Effective Resistivity (Ohm-m)
Eg (L = 2m, D = 2.5 mm)
Eg (L= 3m, D= 2.5 mm)
Eg (L = 4m, D = 2.5 mm)
0 374.95 37.40 23.10 16.21 12.58 0.5 374.949 38.05 23.51 16.49 12.80 1 374.949 38.58 23.84 16.72 12.98 1.5 374.949 38.18 23.59 16.55 12.85 2 374.95 37.56 23.21 16.28 12.64 2.5 374.95 37.00 22.86 16.03 12.45 3 374.95 36.95 22.83 16.01 12.43 3.5 374.95 38.85 24.01 16.84 13.07 4 374.95 41.18 25.45 17.85 13.86 4.5 374.949 43.31 26.76 18.77 14.57 5 374.948 45.56 28.15 19.75 15.33 5.5 374.948 49.66 30.68 21.52 16.71 6 374.95 55.49 34.28 24.05 18.67 6.5 374.953 63.95 39.51 27.72 21.52 7 374.955 73.82 45.61 31.99 24.84 7.5 374.955 75.89 46.89 32.89 25.54 8 374.95 80.04 49.45 34.69 26.93 8.5 374.938 90.40 55.85 39.18 30.42 9 374.929 103.34 63.85 44.79 34.77 9.5 374.929 104.50 64.57 45.29 35.16 10 374.95 106.68 65.91 46.24 35.90 10.5 374.995 115.61 71.43 50.11 38.90 11 375.053 125.55 77.57 54.41 42.25 11.5 375.11 117.19 72.40 50.79 39.43 12 375.15 108.08 66.78 46.84 36.37 12.5 375.164 103.93 64.21 45.04 34.97 13 375.169 101.20 62.53 43.86 34.05 13.5 375.19 89.47 55.28 38.78 30.11 14 375.25 84.66 52.31 36.69 28.49 14.5 375.362 79.67 49.22 34.53 26.81 15 375.505 75.69 46.76 32.80 25.47 15.5 375.645 69.65 43.03 30.19 23.44 16 375.75 65.45 40.44 28.37 22.02 16.5 375.796 60.83 37.58 26.36 20.47 17 375.797 56.81 35.10 24.62 19.12 17.5 375.774 54.17 33.47 23.48 18.23 18 375.75 51.58 31.87 22.35 17.36 18.5 375.741 48.73 30.10 21.12 16.40 19 375.743 46.04 28.44 19.95 15.49
Olayanju and Onaolapo 19
Journal of Science and Technology © KNUST April 2015
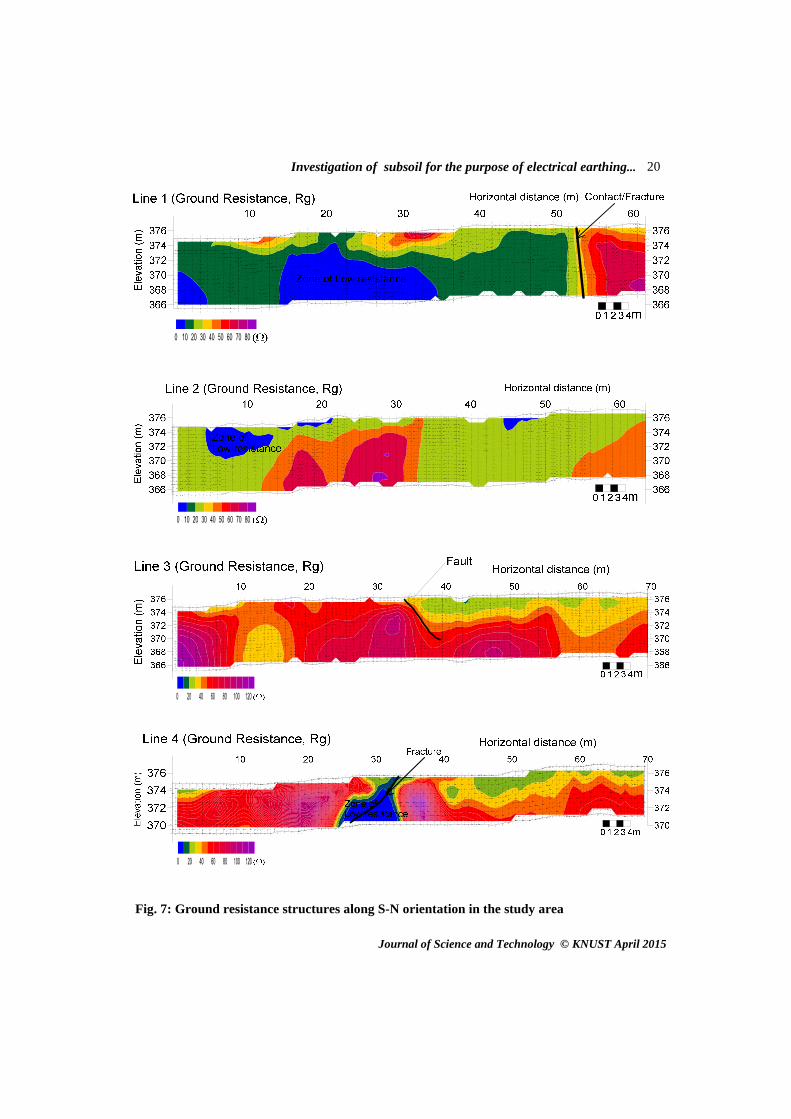
Fig. 7: Ground resistance structures along S-N orientation in the study area
Investigation of subsoil for the purpose of electrical earthing... 20
Journal of Science and Technology © KNUST April 2015
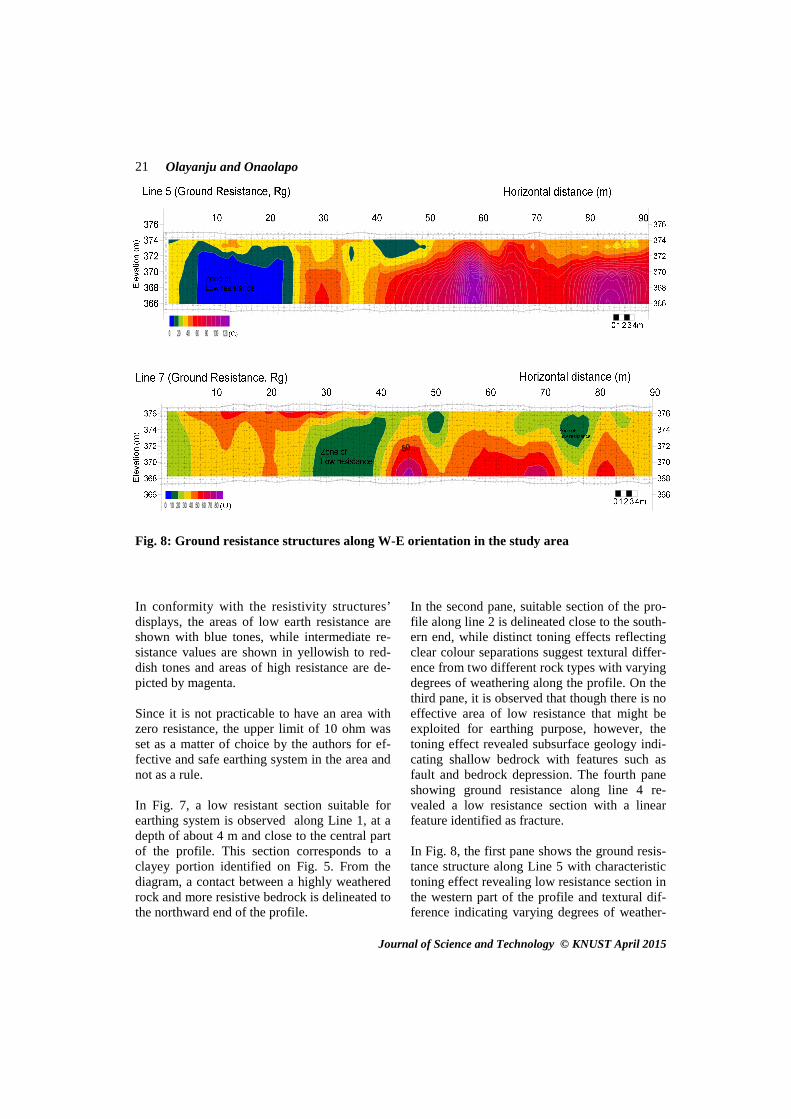
Fig. 8: Ground resistance structures along W-E orientation in the study area
In conformity with the resistivity structures’ displays, the areas of low earth resistance are shown with blue tones, while intermediate re-sistance values are shown in yellowish to red-dish tones and areas of high resistance are de-picted by magenta. Since it is not practicable to have an area with zero resistance, the upper limit of 10 ohm was set as a matter of choice by the authors for ef-fective and safe earthing system in the area and not as a rule. In Fig. 7, a low resistant section suitable for earthing system is observed along Line 1, at a depth of about 4 m and close to the central part of the profile. This section corresponds to a clayey portion identified on Fig. 5. From the diagram, a contact between a highly weathered rock and more resistive bedrock is delineated to the northward end of the profile.
In the second pane, suitable section of the pro-file along line 2 is delineated close to the south-ern end, while distinct toning effects reflecting clear colour separations suggest textural differ-ence from two different rock types with varying degrees of weathering along the profile. On the third pane, it is observed that though there is no effective area of low resistance that might be exploited for earthing purpose, however, the toning effect revealed subsurface geology indi-cating shallow bedrock with features such as fault and bedrock depression. The fourth pane showing ground resistance along line 4 re-vealed a low resistance section with a linear feature identified as fracture. In Fig. 8, the first pane shows the ground resis-tance structure along Line 5 with characteristic toning effect revealing low resistance section in the western part of the profile and textural dif-ference indicating varying degrees of weather-
Olayanju and Onaolapo 21
Journal of Science and Technology © KNUST April 2015
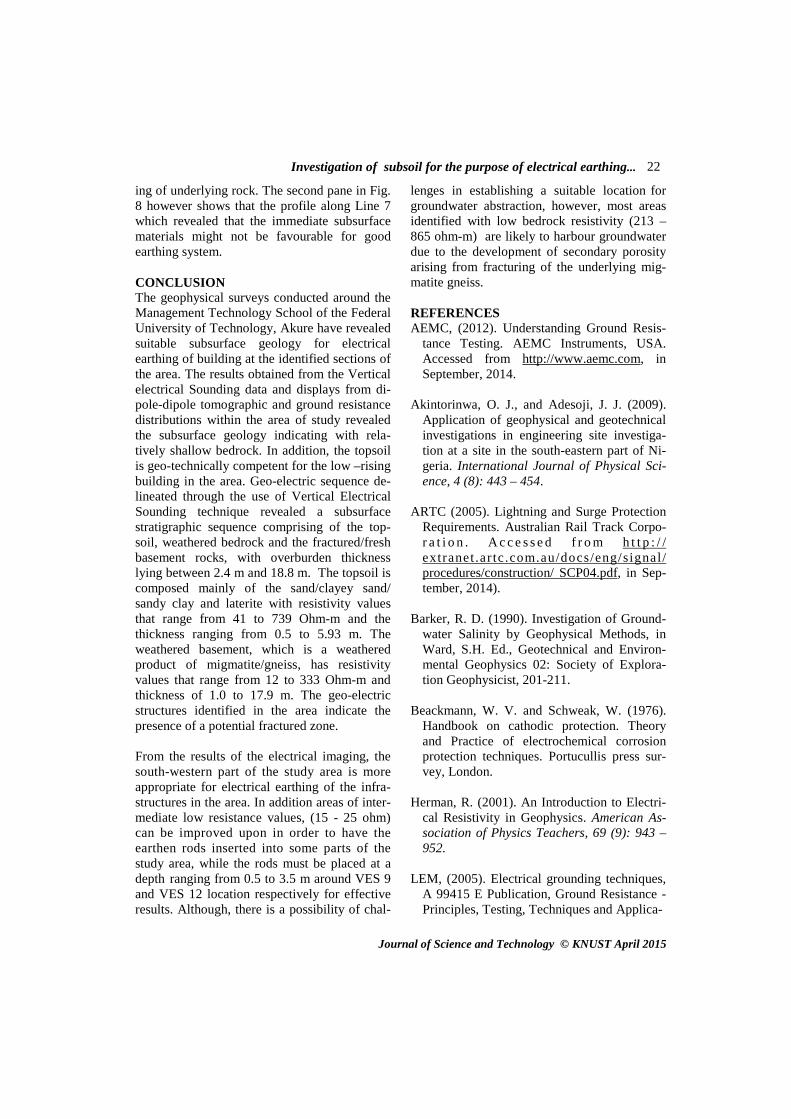
ing of underlying rock. The second pane in Fig. 8 however shows that the profile along Line 7 which revealed that the immediate subsurface materials might not be favourable for good earthing system. CONCLUSION The geophysical surveys conducted around the Management Technology School of the Federal University of Technology, Akure have revealed suitable subsurface geology for electrical earthing of building at the identified sections of the area. The results obtained from the Vertical electrical Sounding data and displays from di-pole-dipole tomographic and ground resistance distributions within the area of study revealed the subsurface geology indicating with rela-tively shallow bedrock. In addition, the topsoil is geo-technically competent for the low –rising building in the area. Geo-electric sequence de-lineated through the use of Vertical Electrical Sounding technique revealed a subsurface stratigraphic sequence comprising of the top-soil, weathered bedrock and the fractured/fresh basement rocks, with overburden thickness lying between 2.4 m and 18.8 m. The topsoil is composed mainly of the sand/clayey sand/sandy clay and laterite with resistivity values that range from 41 to 739 Ohm-m and the thickness ranging from 0.5 to 5.93 m. The weathered basement, which is a weathered product of migmatite/gneiss, has resistivity values that range from 12 to 333 Ohm-m and thickness of 1.0 to 17.9 m. The geo-electric structures identified in the area indicate the presence of a potential fractured zone. From the results of the electrical imaging, the south-western part of the study area is more appropriate for electrical earthing of the infra-structures in the area. In addition areas of inter-mediate low resistance values, (15 - 25 ohm) can be improved upon in order to have the earthen rods inserted into some parts of the study area, while the rods must be placed at a depth ranging from 0.5 to 3.5 m around VES 9 and VES 12 location respectively for effective results. Although, there is a possibility of chal-
lenges in establishing a suitable location for groundwater abstraction, however, most areas identified with low bedrock resistivity (213 – 865 ohm-m) are likely to harbour groundwater due to the development of secondary porosity arising from fracturing of the underlying mig-matite gneiss. REFERENCES AEMC, (2012). Understanding Ground Resis-
tance Testing. AEMC Instruments, USA. Accessed from http://www.aemc.com, in September, 2014.
Akintorinwa, O. J., and Adesoji, J. J. (2009).
Application of geophysical and geotechnical investigations in engineering site investiga-tion at a site in the south-eastern part of Ni-geria. International Journal of Physical Sci-ence, 4 (8): 443 – 454.
ARTC (2005). Lightning and Surge Protection
Requirements. Australian Rail Track Corpo-r a t i o n . Ac c e s s e d f r o m h t t p : / /extranet.ar tc.com.au/docs/eng/signal/procedures/construction/ SCP04.pdf, in Sep-tember, 2014).
Barker, R. D. (1990). Investigation of Ground-
water Salinity by Geophysical Methods, in Ward, S.H. Ed., Geotechnical and Environ-mental Geophysics 02: Society of Explora-tion Geophysicist, 201-211.
Beackmann, W. V. and Schweak, W. (1976).
Handbook on cathodic protection. Theory and Practice of electrochemical corrosion protection techniques. Portucullis press sur-vey, London.
Herman, R. (2001). An Introduction to Electri-
cal Resistivity in Geophysics. American As-sociation of Physics Teachers, 69 (9): 943 – 952.
LEM, (2005). Electrical grounding techniques,
A 99415 E Publication, Ground Resistance -Principles, Testing, Techniques and Applica-
Investigation of subsoil for the purpose of electrical earthing... 22

Journal of Science and Technology © KNUST April 2015
tions. Accessed from http://www.lem.com, in September, 2014.
Lightning and Surge Technologies (2014). Earthing Fundamentals. Accessed from h t t p : / / w w w . l i g h t n i n g m a n . c o m . a u / Earthing.pdf, in September, 2014.
Markiewicz, H. and Klajn, A. (2003). Earthing
Systems - Fundamentals of Calculation and Design. ‘Earthing and EMC Power Quality Application Guide’, Wroclaw University of Technology.
Megger, (2005). Getting down to Earth, A prac-
tical guide to earth resistance testing. Ac-cessed from http://www.megger.com in Sep-tember, 2014.
Ofomola, M. O., Adiat, K. A. N., Olayanju, G.
M. and Ako, B. D. (2009). Integrated Geo-physical Methods for Post Foundation Stud-
ies, Obanla Staff Quarters of the Federal Uni-versity of Technology, Akure, Nigeria. The Pacific Journal of Science and Technology, 10 (2): 333 – 359.
Olayanju, G. M. and Ojo, A. O. (2015). Mag-
netic Characterisation of Rocks Underlying FUTA Campus, South-Western Nigeria. In Press.
Pfieffer, J. C. (2001). Principles of electrical
grounding. Pfieffer Engineering Co. Inc., Louisville.
Rahaman, M. A. (1976). Review of the Base-
ment geology of South Western Nigeria. (In) Geology of Nigeria, C.A. Kogbe (ed): 41-56.
Rahaman, M. A. (1988). Recent Advances in
the study of the Basement Complex of Nige-ria. (In) Precambrian Geeology of Nigeria, second edition: 11-45.
Olayanju and Onaolapo 23