Embed Size (px)
Citation preview

Geo Data Institute, University of Southampton
Prevention and Treatment of Trachoma
D. J. Gove. From University of Southampton. Now at
Sun Microsystems Inc, California, USA
J. D. Hawkins From University of Southampton. Now a Consultant
A. K. Shahani, University of Southampton [email protected] [email protected] M. E. Ward, University of Southampton
Geo Data Institute, University of Southampton
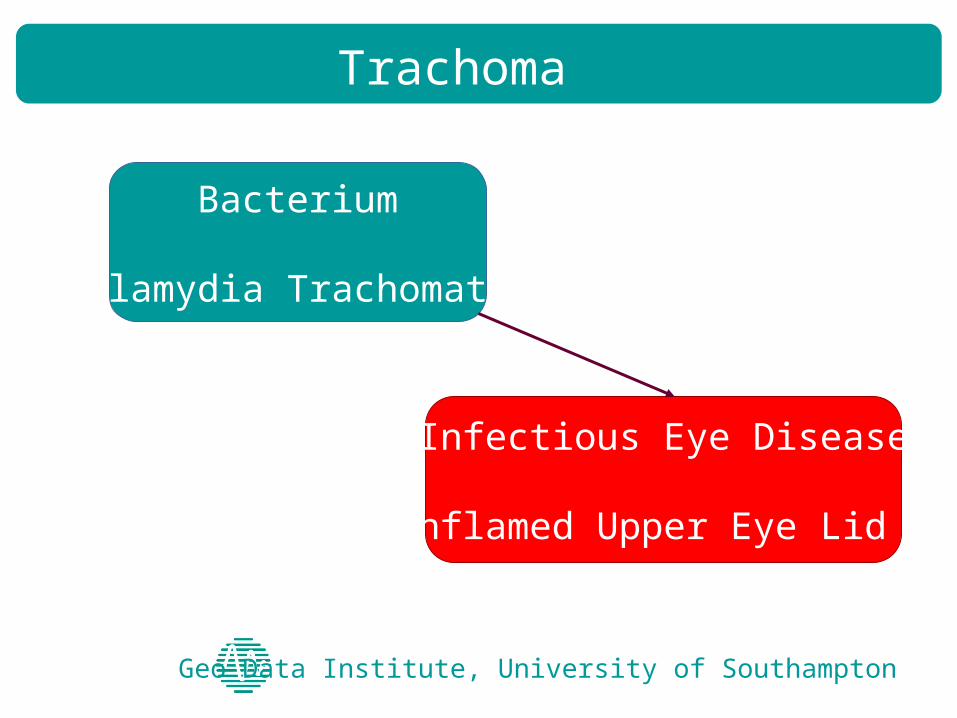
Trachoma
Bacterium
Chlamydia Trachomatis
Infectious Eye Disease
Inflamed Upper Eye Lid
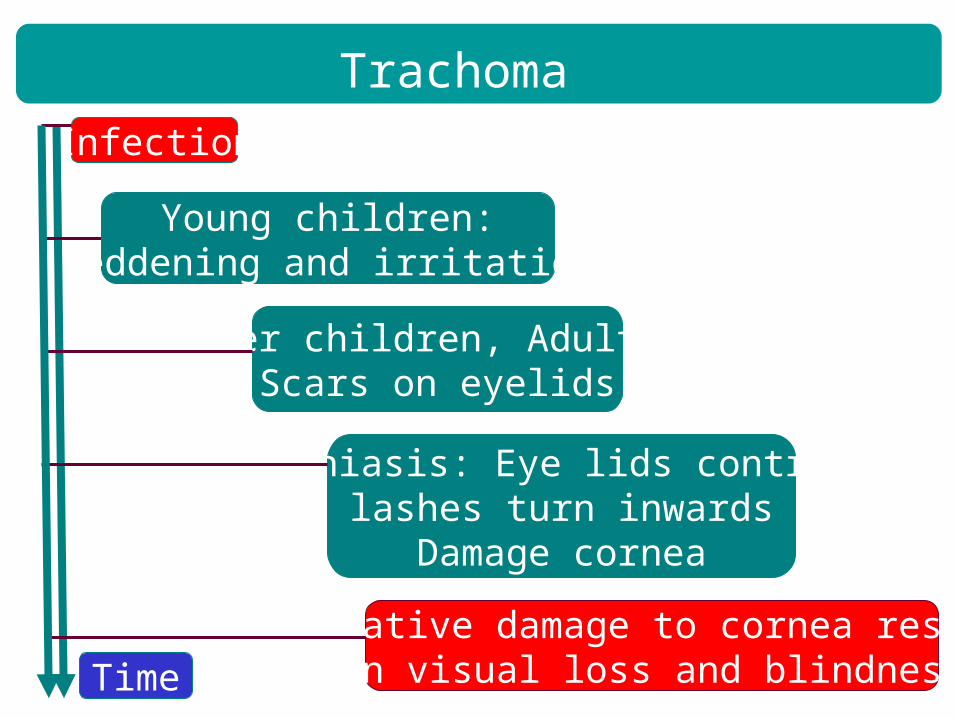
Trachoma
Infection
Young children:Reddening and irritation
Older children, Adults: Scars on eyelids
Trichiasis: Eye lids contract.Eye lashes turn inwards and
Damage cornea
Cumulative damage to cornea results in visual loss and blindnessTime
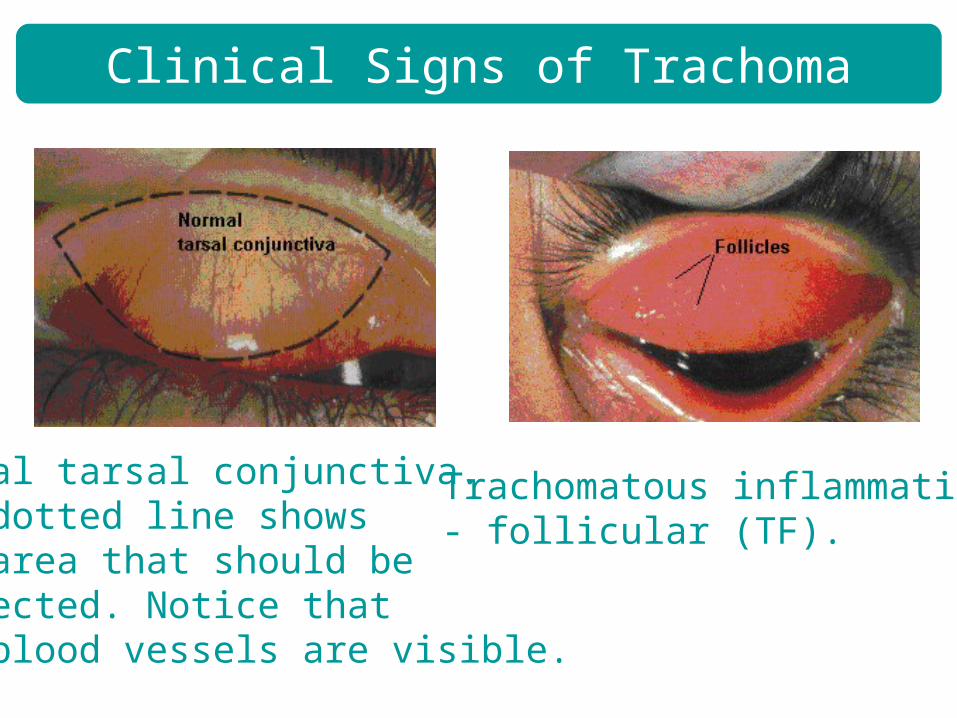
Clinical Signs of Trachoma
Normal tarsal conjunctiva. The dotted line shows the area that should be inspected. Notice thatthe blood vessels are visible.
Trachomatous inflammation - follicular (TF).
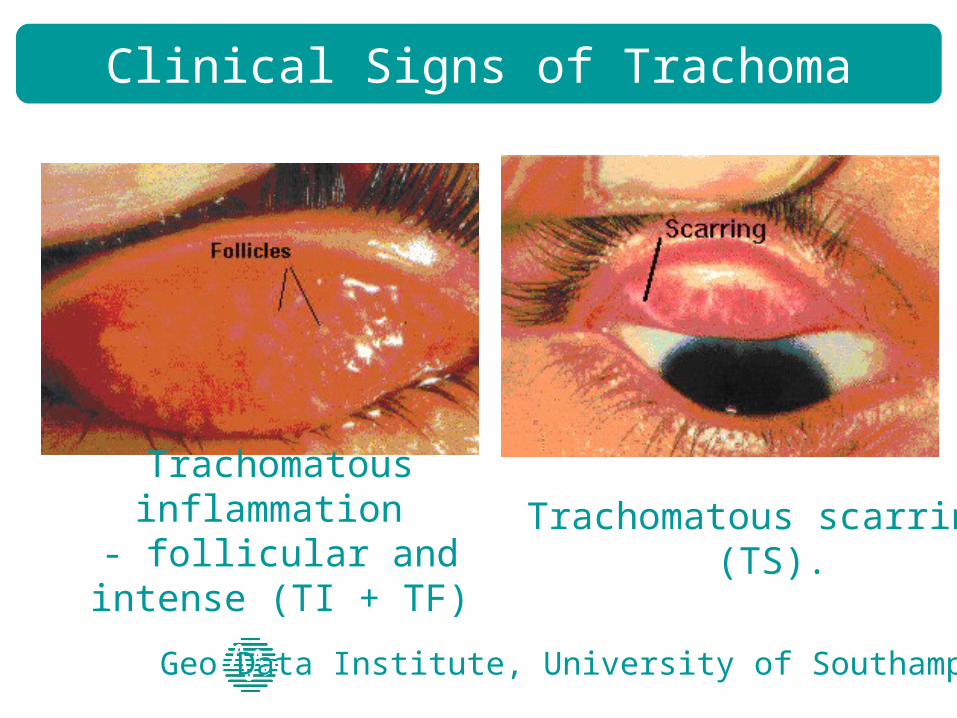
Clinical Signs of Trachoma
Trachomatous inflammation - follicular and intense (TI + TF)
Trachomatous scarring (TS).
Geo Data Institute, University of Southampton
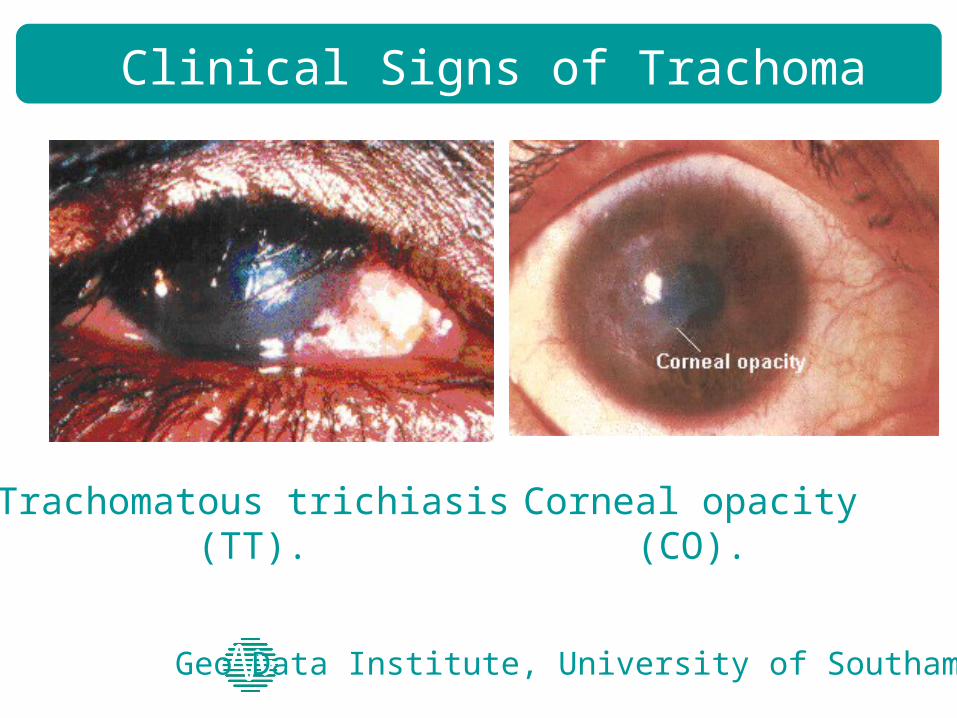
Clinical Signs of Trachoma
Trachomatous trichiasis (TT).
Corneal opacity (CO).
Geo Data Institute, University of Southampton
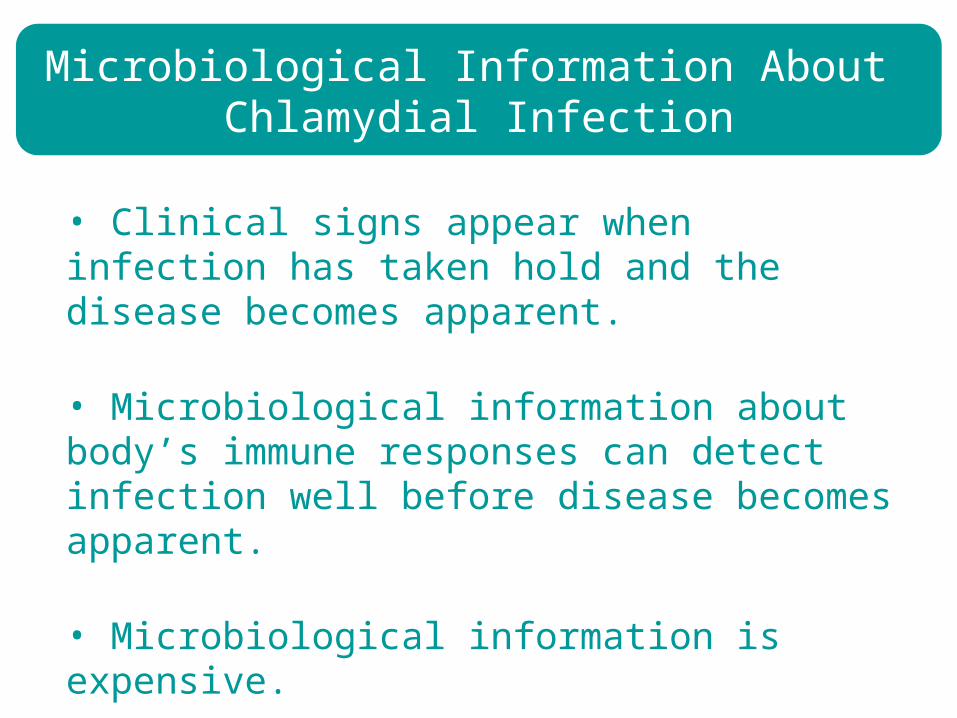
Microbiological Information About Chlamydial Infection
• Clinical signs appear when infection has taken hold and the disease becomes apparent.
• Microbiological information about body’s immune responses can detect infection well before disease becomes apparent.
• Microbiological information is expensive.
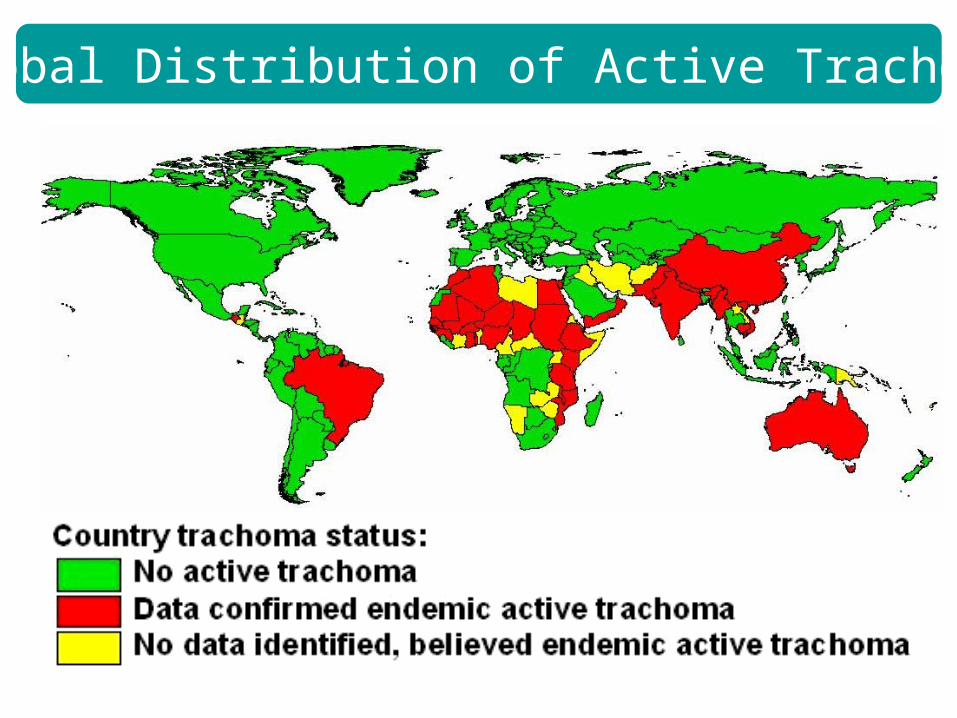
Global Distribution of Active Trachoma
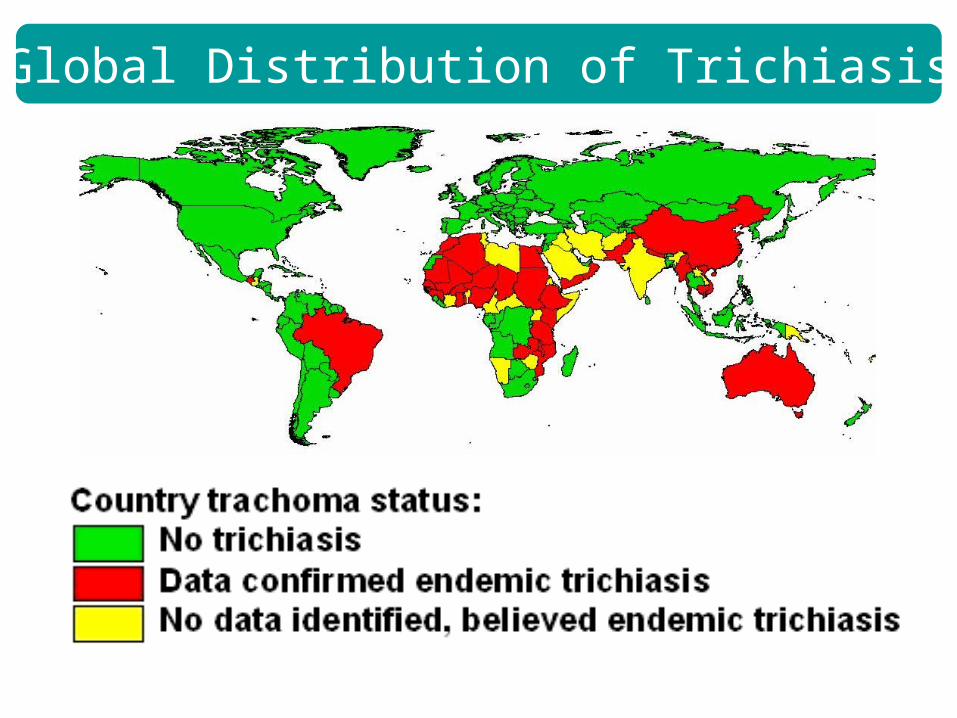
Global Distribution of Trichiasis
Geo Data Institute, University of Southampton
Trachoma
• Trachoma is the world’s major cause of preventable blindness.
• Trachoma has been eradicated from most developed countries. Trachoma is very common in poor countries.
• About 10% of the world’s population is at risk of blindness from Trachoma.
• About 84 million people have active disease.
• About 8 million people are visually impaired or blind d ue to Trachoma.
Geo Data Institute, University of Southampton
Prevention and Treatment of Trachoma
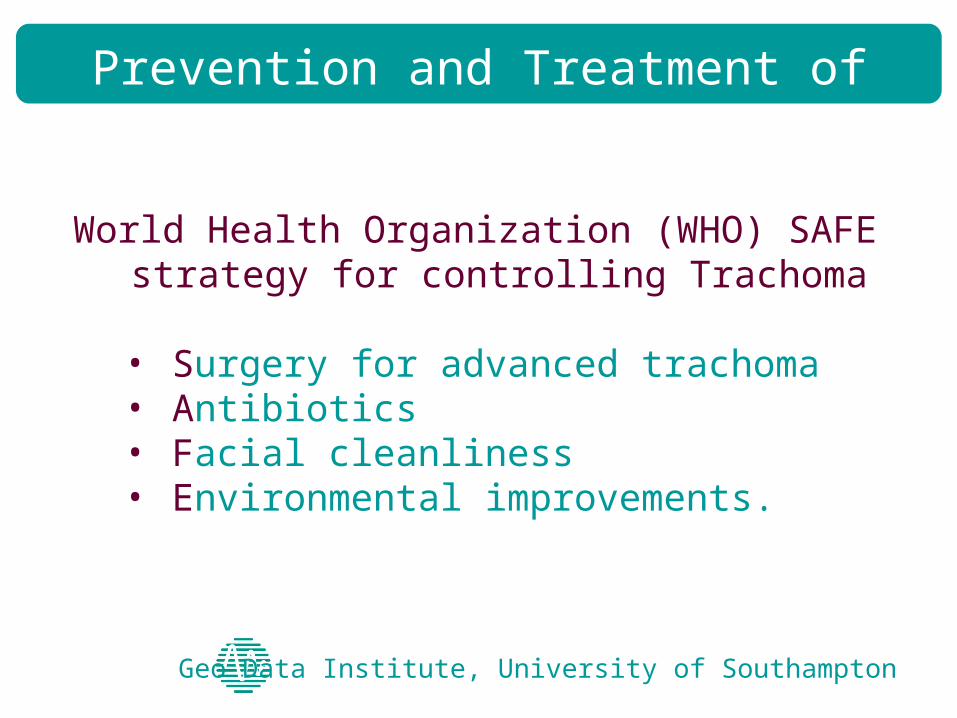
World Health Organization (WHO) SAFE strategy for controlling Trachoma
• Surgery for advanced trachoma• Antibiotics • Facial cleanliness• Environmental improvements.
Geo Data Institute, University of Southampton
Prevention and Treatment of Trachoma
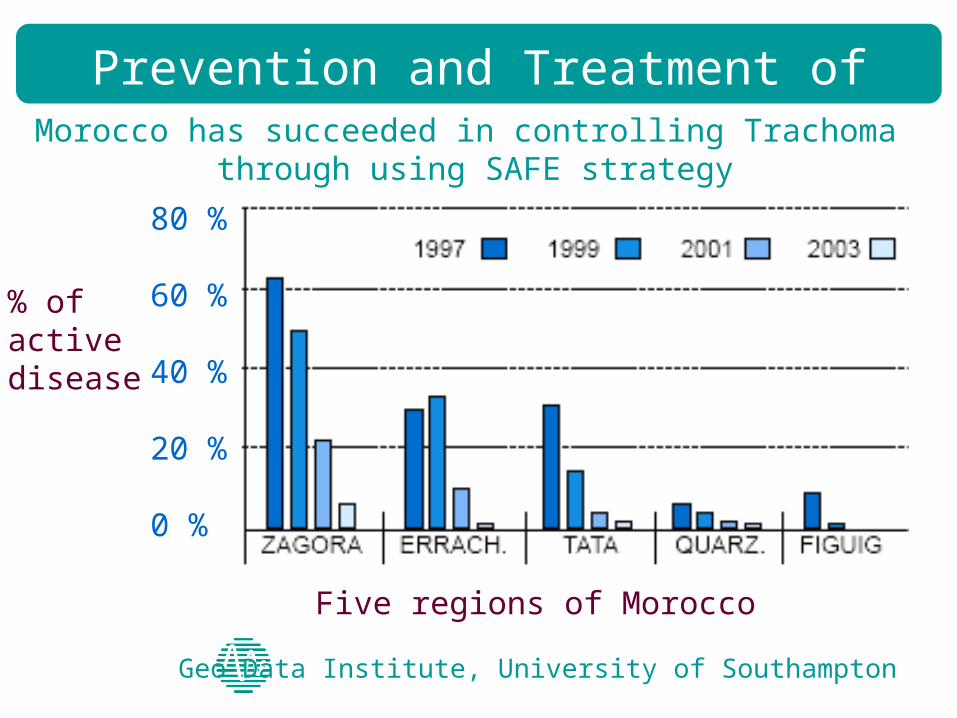
Morocco has succeeded in controlling Trachoma through using SAFE strategy
Five regions of Morocco
% ofactivedisease
80 %
60 %
40 %
20 %
0 %
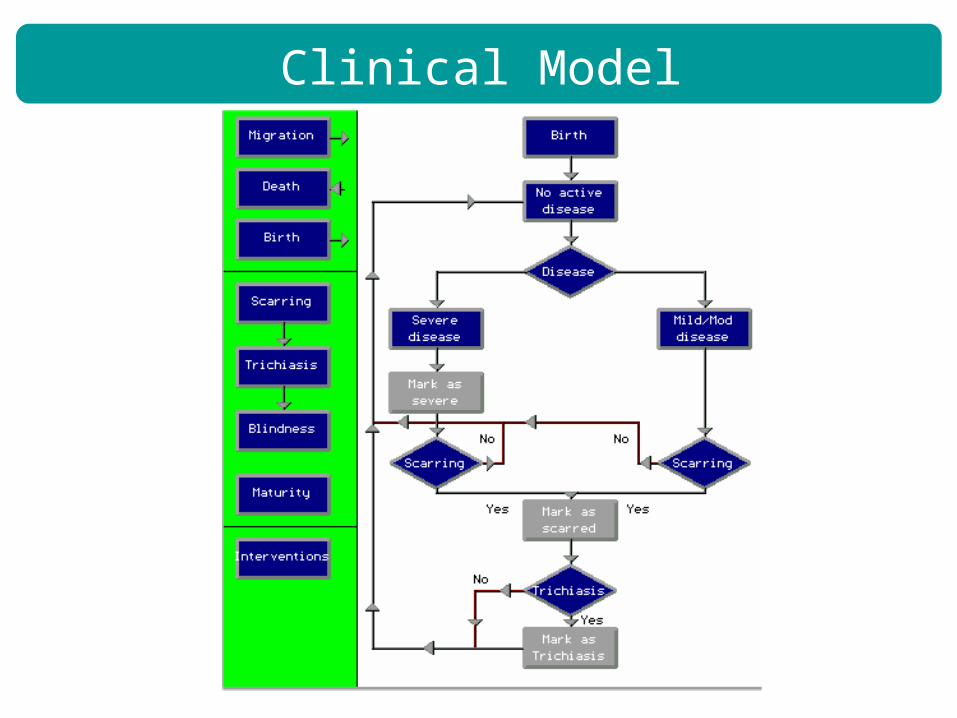
Clinical Model
Microbiological Model
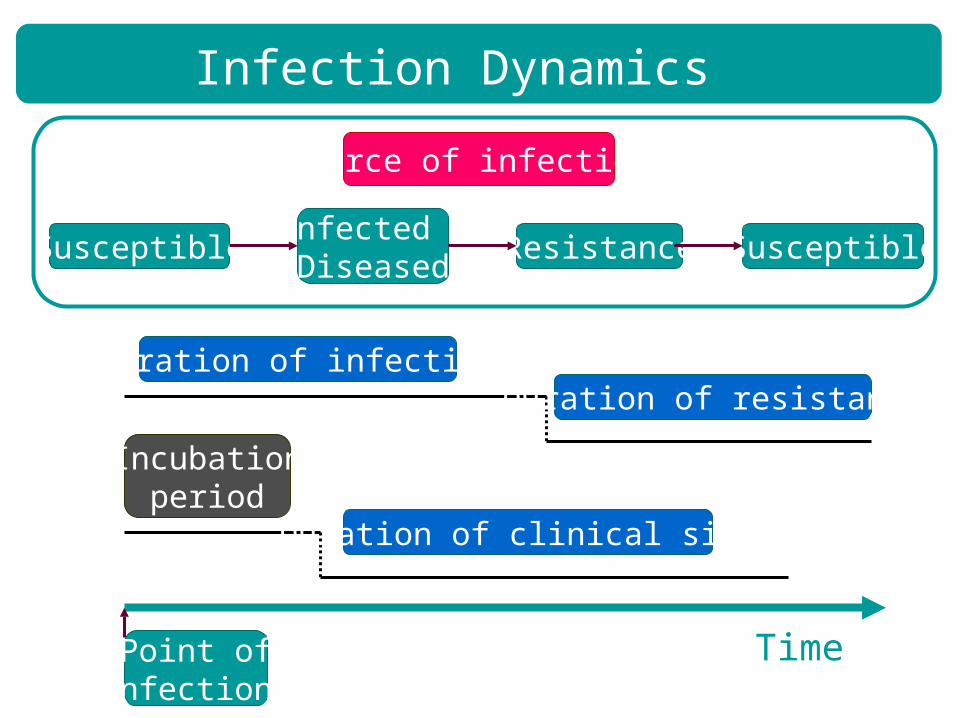
Infection Dynamics
Susceptible
Force of infection
Infected /Diseased
Resistance Susceptible
TimePoint ofinfection
Duration of infectionDuration of resistance
Incubationperiod
Duration of clinical signs
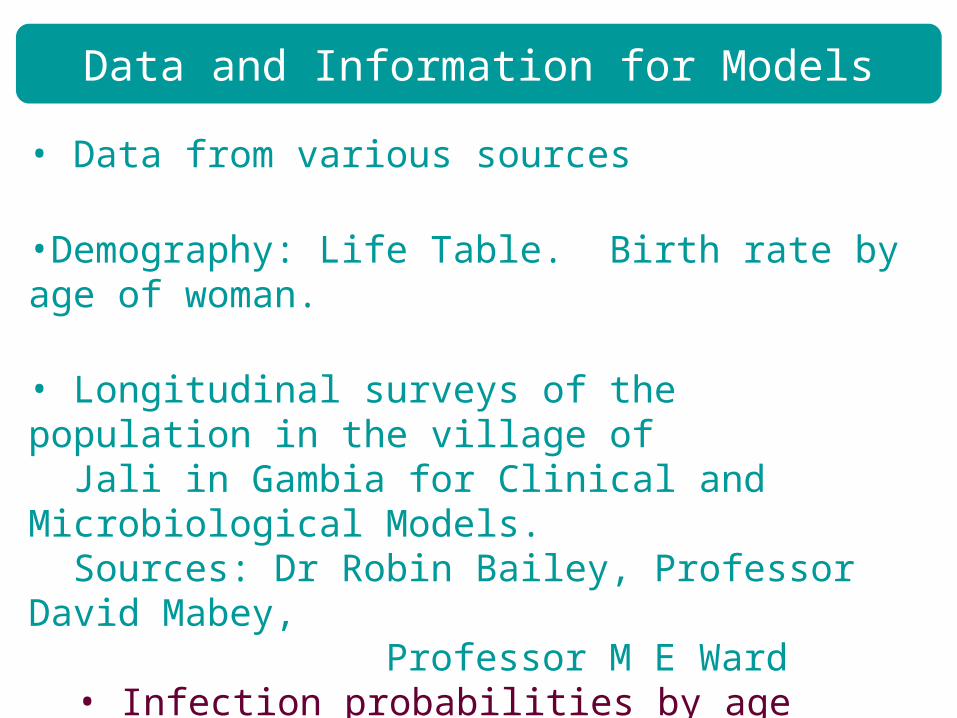
Data and Information for Models
• Data from various sources
•Demography: Life Table. Birth rate by age of woman.
• Longitudinal surveys of the population in the village of Jali in Gambia for Clinical and Microbiological Models. Sources: Dr Robin Bailey, Professor David Mabey, Professor M E Ward
• Infection probabilities by age• Duration of infection by age• Probabilities of consequences of infection• etc.
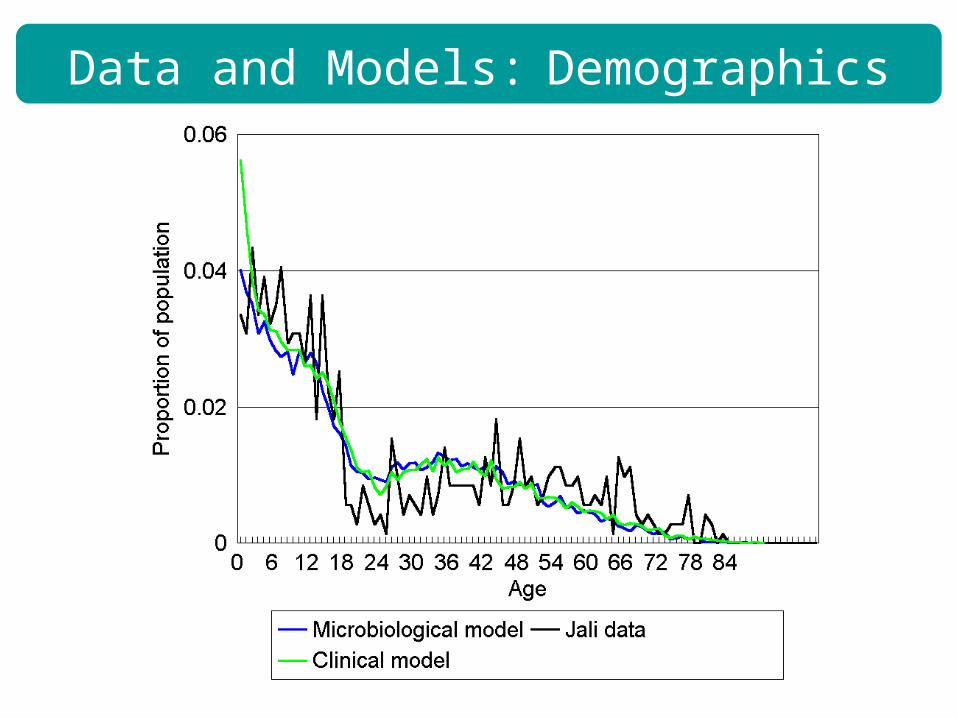
Data and Models: Demographics
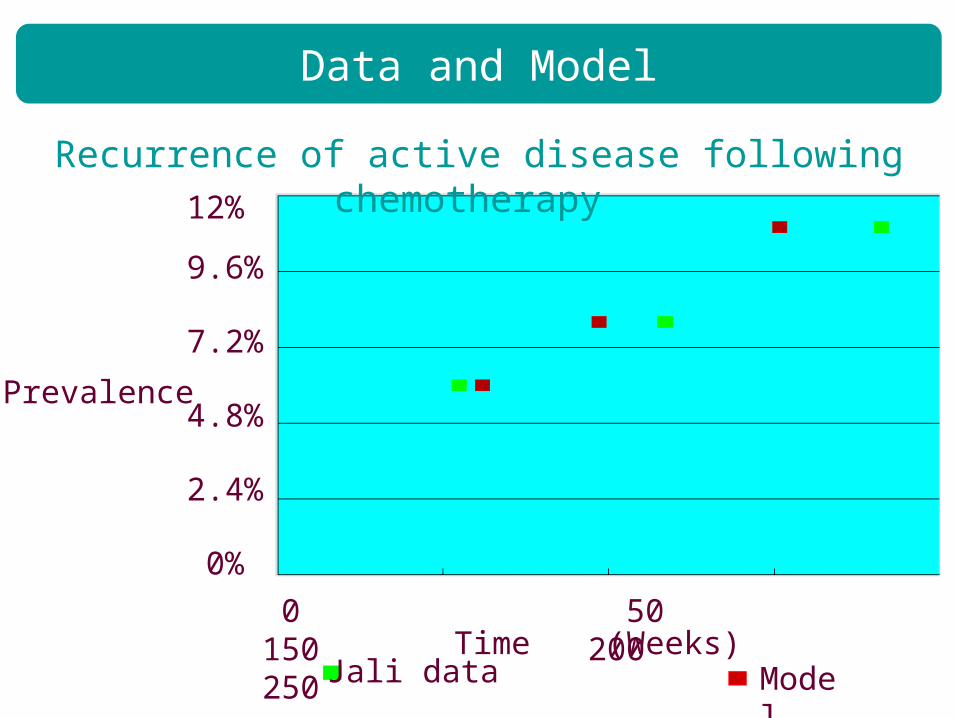
Data and Model
Recurrence of active disease following chemotherapy
ModelJali data
Prevalence
12%
9.6%
7.2%
4.8%
2.4%
0%
0 50 150 200 250Time (Weeks)
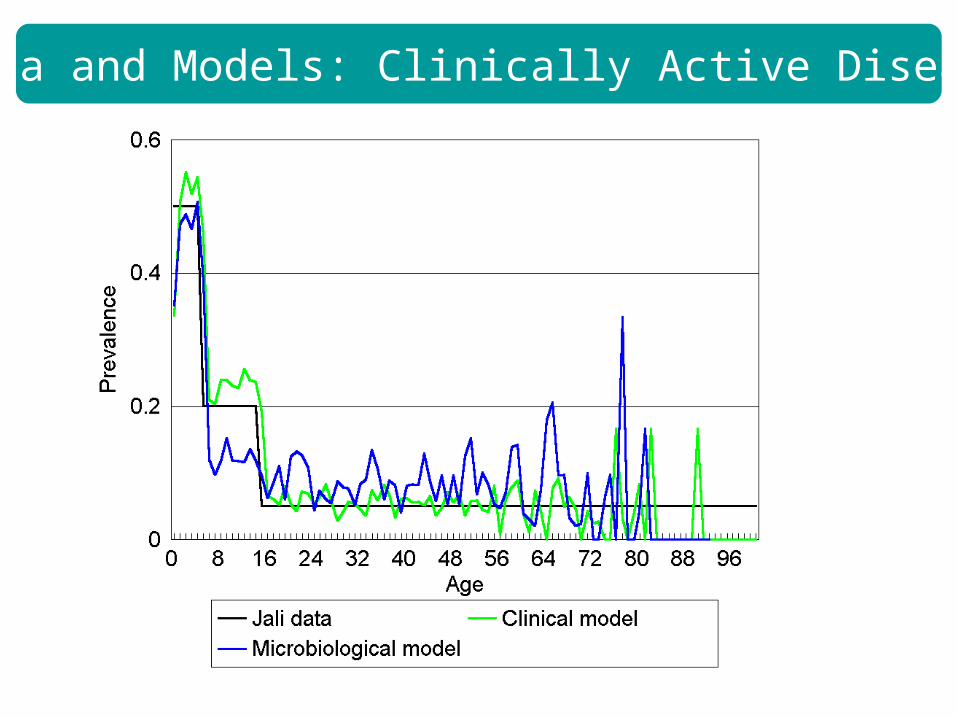
Data and Models: Clinically Active Disease
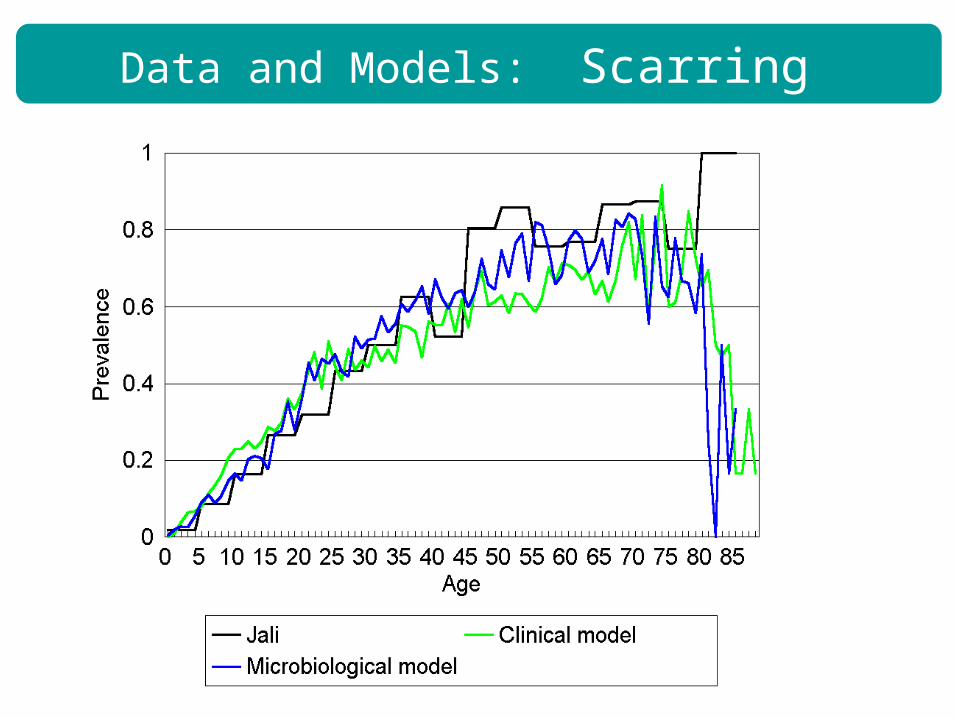
Data and Models: Scarring
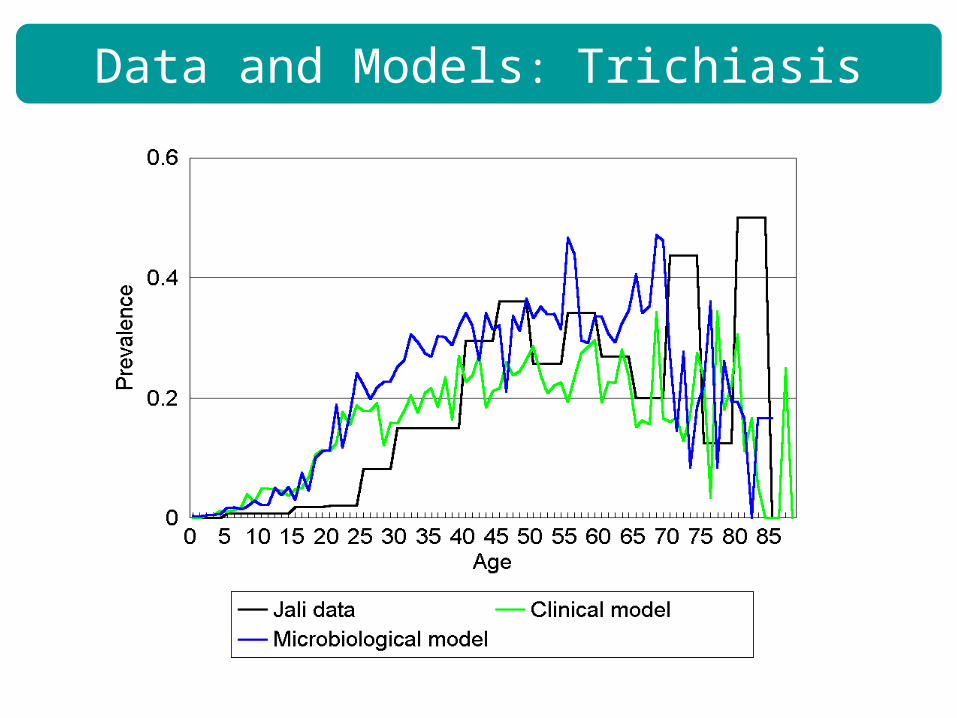
Data and Models: Trichiasis
Geo Data Institute, University of Southampton
Chemotherapy
Chemotherapy was modelled as an immediate reduction in the force of infection
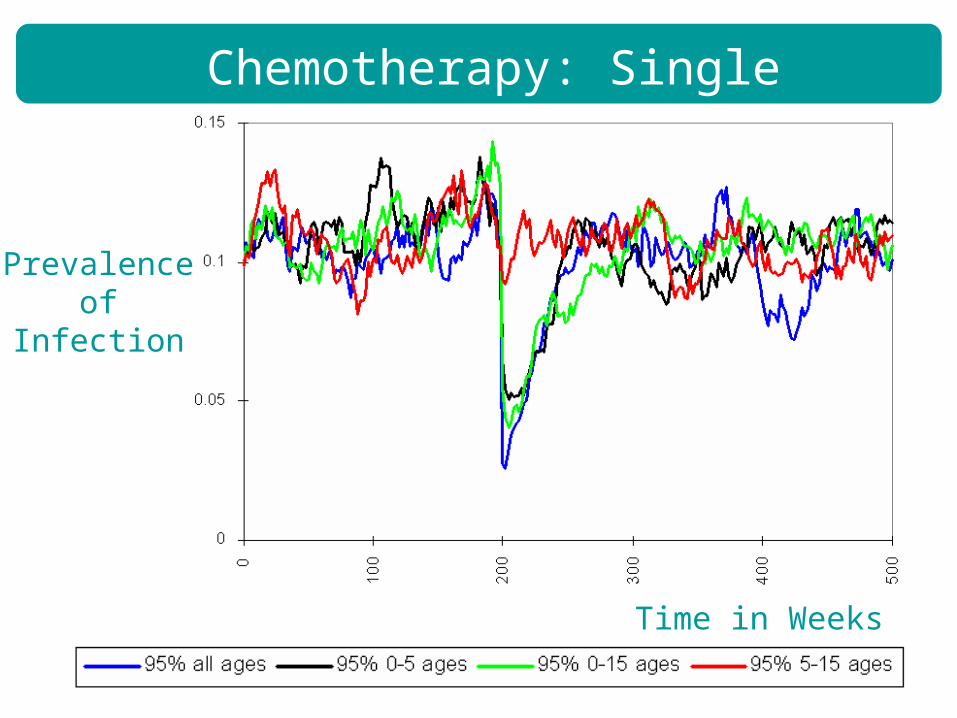
Chemotherapy: Single Treatment
Time in Weeks
Prevalenceof
Infection
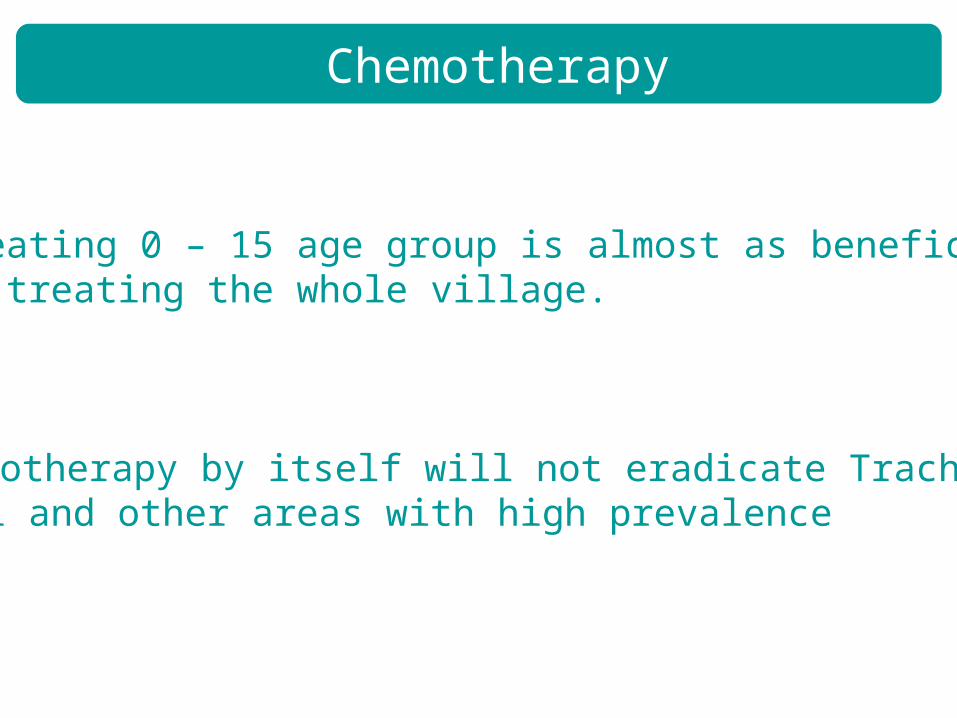
Chemotherapy
• Treating 0 – 15 age group is almost as beneficial as treating the whole village.
• Chemotherapy by itself will not eradicate Trachoma in Jali and other areas with high prevalence
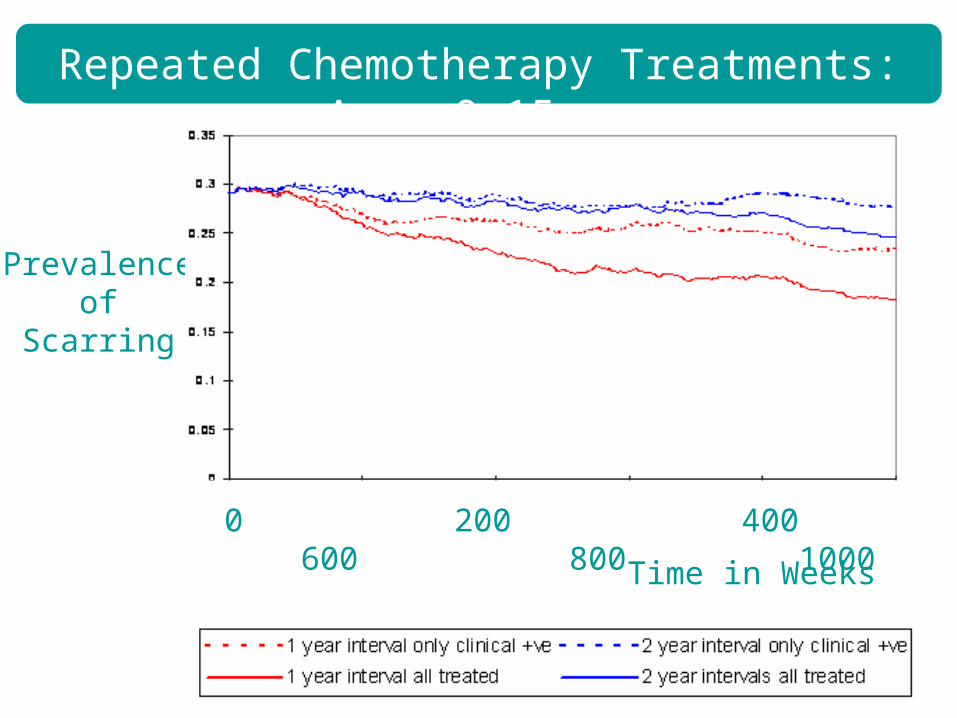
Repeated Chemotherapy Treatments: Age 0-15
Prevalenceof
Scarring
Time in Weeks
0 200 400 600 800 1000
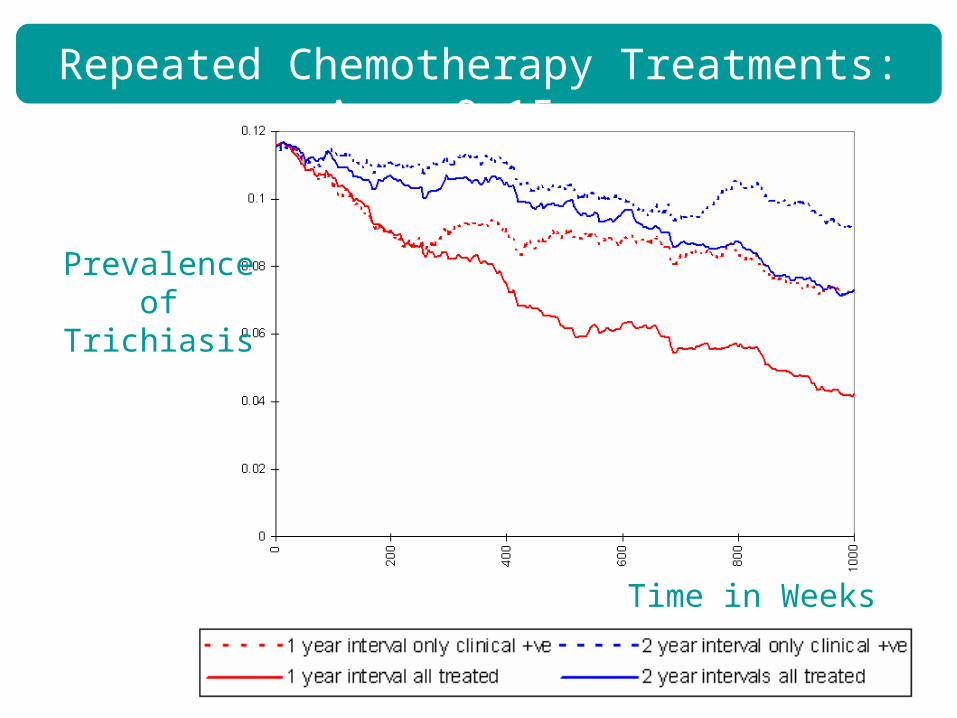
Repeated Chemotherapy Treatments: Age 0-15
Prevalenceof
Trichiasis
Time in Weeks
Vaccination
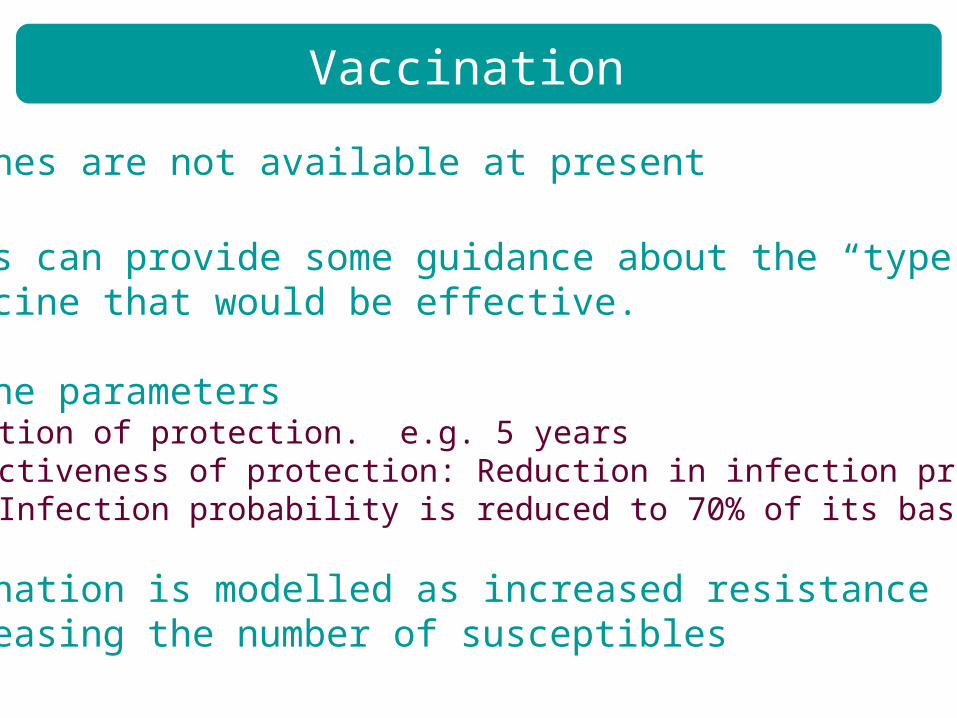
• Vaccines are not available at present
• Models can provide some guidance about the “type” of vaccine that would be effective.
• Vaccine parameters• Duration of protection. e.g. 5 years • Effectiveness of protection: Reduction in infection probability e.g. Infection probability is reduced to 70% of its base value
• Vaccination is modelled as increased resistance decreasing the number of susceptibles
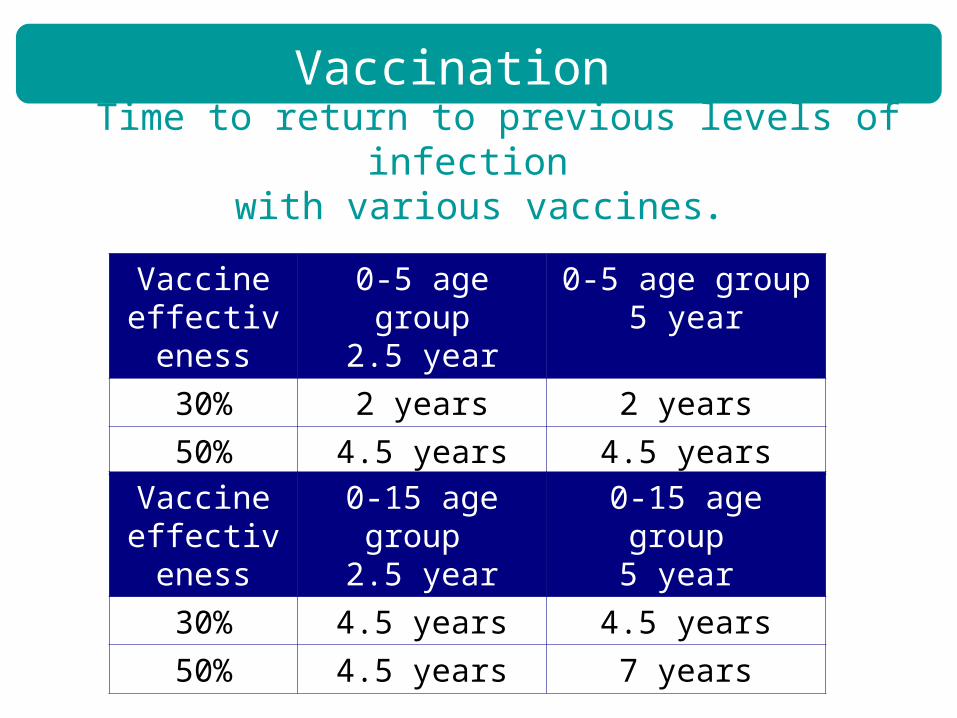
Vaccination
Time to return to previous levels of infection with various vaccines.
Vaccine effectiveness
0-5 age group 2.5 year
0-5 age group 5 year
30% 2 years 2 years
50% 4.5 years 4.5 years
Vaccine effectiveness
0-15 age group 2.5 year
0-15 age group 5 year
30% 4.5 years 4.5 years
50% 4.5 years 7 years
Geo Data Institute, University of Southampton
Socio-Economic Actions
• Effect of socio-economic actions is modelled as a reduction in the force of infection
• Examples of socio-economic actions• Actions that decrease / eliminate poverty • Easy access to sufficient clean water• Improved hygiene
• There is no high quality data for estimating the effects of particular socio-economic actions
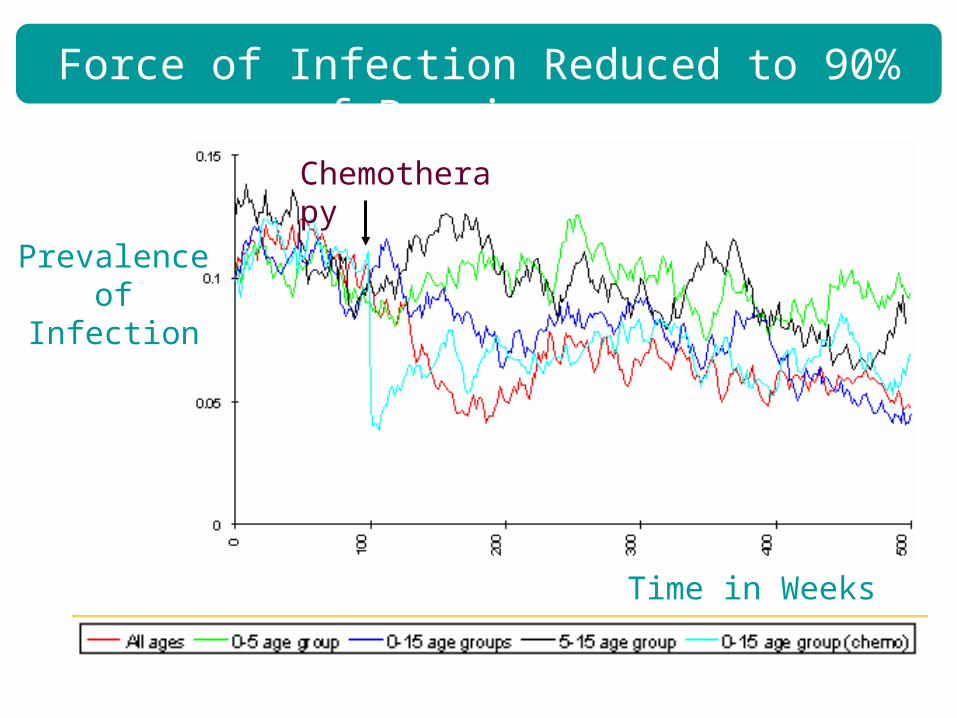
Force of Infection Reduced to 90% of Previous
Prevalenceof
Infection
Chemotherapy
Time in Weeks
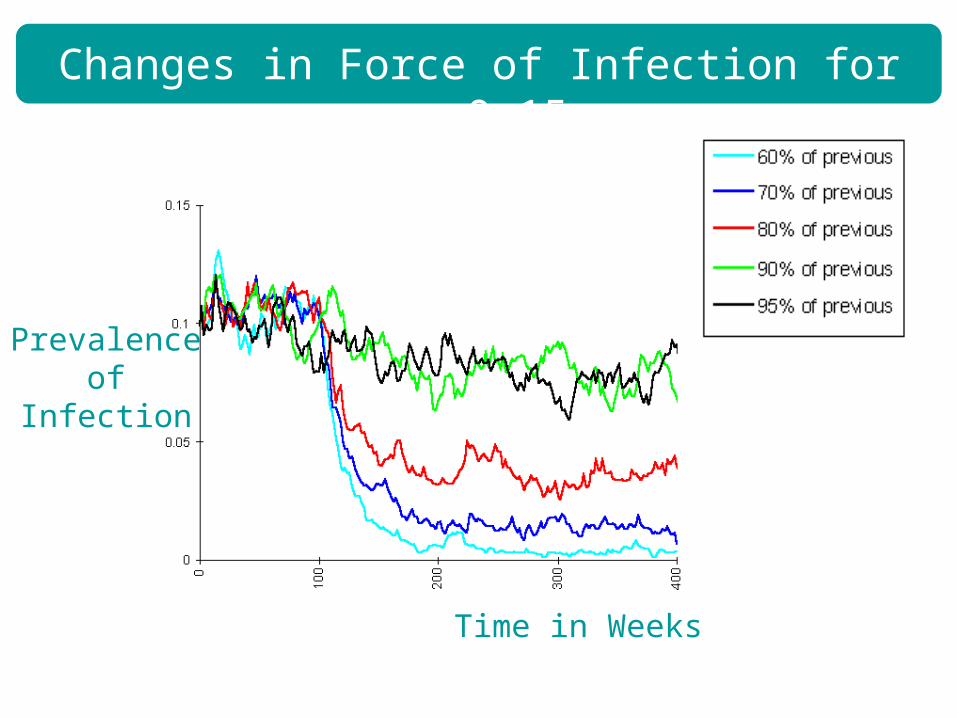
Changes in Force of Infection for age 0-15
Prevalenceof
Infection
Time in Weeks
Geo Data Institute, University of Southampton
Concluding Remark
•Appropriate data + Detailed models for evaluating treatment strategies can evolve good strategies for eradicating Trachoma