Embed Size (px)
Citation preview

1
Gentle and Cheap Introduction to XBRL-
based Digital Financial Reporting1
By Charles Hoffman, CPA (December 8, 2020)
This document helps professional accountants and auditors get an approachable, gentle, cheap, hands
on introduction to XBRL-based digital financial reporting that serves as a foundation for expanding their
knowledge about XBRL-based accounting, reporting, auditing, and analysis.
This introduction will evolve over time.
In this tutorial we will use two extremely simple and fundamental financial reporting artifacts to provide
you with a solid big picture and the critically important details of XBRL-based financial reporting: the
accounting equation and SFAC 6’s Elements of Financial Statements. Believe it or not, but you can
easily get a rock-solid grounding using these two foundational artifacts of financial reporting. We will
start with the accounting equation.
But first, let us quickly introduce a handful of important jargon we need in order to communicate some
information effectively.
Logical Theory
A logical theory is made up of a set of models, structures, terms, associations, rules, and
facts. In very, very simple terms,
▪ Logical theory: A logical theory is a set of models that are consistent with and
permissible per that logical theory.
▪ Model: A model2 is a set of structures that are consistent with and permissible
interpretations of that model.
▪ Structure: A structure is a set of statements which describe the structure.
▪ Statement: A statement is a proposition, claim, assertion, belief, idea, or fact about
or related to the universe of discourse to which the logical theory relates. There are
four broad categories of statements:
▪ Terms: Terms are statements that define ideas used by the logical theory such
as “assets”, “liabilities”, “equity”, and “balance sheet”.
▪ Associations: Associations are statements that describe permissible
interrelationships between the terms such as “assets is part-of the balance
1 Gentle and Cheap Introduction to XBRL-based Financial Reporting, http://xbrlsite.azurewebsites.net/2020/introduction/index.html 2 Wikipedia, Model Theory, https://en.wikipedia.org/wiki/Model_theory

2
sheet” or “operating expenses is a type-of expense” or “an asset is a ‘debit’ and
is ‘as of’ a specific point in time and is always a monetary numeric value”.
▪ Rules: Rules are statements that describe what is permissible per the logical
system and other constraints. For example, “Assets = Liabilities + Equity” is
an example of a consistency type rule.
▪ Facts: Facts are statements about the numbers and words that are provided
by an economic entity within a business report. For example, the financial
report, a type of business report, might state “assets for the consolidated legal
entity Microsoft as of June 20, 2017 was $241,086,000,000 expressed in US
dollars and rounded to the nearest millions of dollars.
Fundamentally, a logical theory is a set of statements. Those statements can be represented
in machine-readable form. Once in machine-readable form, those statements can be
interrogated using software applications. To the extent that this can be done effectively;
software tools can assist professional accountants and others working with those statements.
An XBRL-based financial report is a machine-readable version of what has historically been
represented on paper. Humans can interpret that paper, computers cannot. A logical theory
can be used to break up the pieces of a financial report into ideas that can be explained to
humans (to see if they agree with the theory) and to computers (to see if they understand
the financial report).
Don’t worry about any more of an explanation about logical theories for now; we will get to
that in latter documentation (i.e. not here). For now, focus on the mechanical aspects of
the tasks you are performing. We will enhance the conceptual understanding later. The more
a theory passes the test of use; the more seriously the theory can be taken over time. Or,
the theory can be improved to make the theory better.
Accounting Equation The double-entry accounting model and the accounting equation provide the very foundation of
financial reporting. There are many different sources for the accounting equation, but I will use
Wikipedia’s version3, of the accounting equation:
Assets = Liabilities + Equity
As Wikipedia points out, that fundamental accounting equation, also called the balance sheet equation,
represents the relationship between the line items assets, liabilities, and equity of an economic entity. It
is the foundation for the double-entry bookkeeping system. For each transaction, the total debits equal
the total credits.
So, breaking the accounting equation down, what do we see? Well, we see the following:
• We have three terms: Assets, Liabilities, Equity.
• Those terms work together to create a structure, the Balance Sheet.
• We have a rule which explains the mathematical association between the three terms: “Assets =
Liabilities + Equity”.
• Economic entities use the terms (Assets, Liabilities, Equity), the structure (Balance Sheet), and
rule (Assets = Liabilities + Equity) to report facts about their particular economic entity.
3 Wikipedia, Accounting Equation, https://en.wikipedia.org/wiki/Accounting_equation

3
• The terms, structure, rule, and facts work together to provide a financial model of the economic
entity.
• That model is effectively used to represent a set of logical statements about the assets,
liabilities, and equity of an economic entity at some point in time.
In the past, these logical statements about the financial information of some economic entity were
represented on clay tablets, papyrus, paper. Now, in the information age, we can represent that same
information in a computer readable form with the help of the XBRL structured format. The really good
thing is that you need to understand exactly NOTHING about that XBRL technical format. Why?
Because properly created software applications hide the technical details from you so that you can focus
on the logic of representing financial information.
To understand how all this works, we will use a free, very basic software application to create a
complete XBRL-based report for the accounting equation. We will be walking you through this using the
software application called Luca4. You can use whatever software you might desire to use.
Download and install Luca or whatever software application you choose to make use of. We will walk
you through the process using Luca, showing each step you will perform.
Representing the Accounting Equation Using XBRL Before starting this tutorial, be sure to clear out any other information in the application by selecting
“File”, then “New”, and then “Model” from the menu ribbon. Confirm that you want to delete the
model information which will also delete all report information in the Luca application.
We are trying to keep this tutorial as simple as possible. We encourage you to follow each step exactly
in order to get the most out of this tutorial. We will build on this foundation in further tutorials that
increase in complexity.
As an alternative to using the Luca application, a Microsoft Access database application is provided for
each example which can be used to generate the XBRL model and report. In this first example we will
walk you through the example using Luca. In the second we will walk you through using the Microsoft
Access database.
Here we go!
Step 1: Starting the application.
Open Luca. You should see the following.
4 Luca, http://xbrl.squarespace.com/journal/2020/9/15/luca.html

4
From the menu ribbon select “File”, then “New”, and then “Model”.
A dialog box will appear and ask you to confirm that you want to delete any existing model which would
also delete any reports that you have created. Select “Yes” to clear out what is stored in the application.

5
Step 1: Enter base information.
Select “Edit” and then “Base Information”. The Base Information form will appear. Enter the base
information that will be used by the XBRL taxonomy and XBRL report:
Your information should look exactly as what appears above.
Step 2: Enter term information.
Select “Edit” and then “Terms”. The Terms form will appear. Enter term information. When you begin,
your form will look like this:
After you have finished entering your terms for the accounting equation XBRL taxonomy, your term
information for the accounting equation XBRL taxonomy should look like this:
Close the terms form by pressing the “x” in the upper right-hand corner.

6
Step 2: Enter label information.
Select “Edit” and then “Labels” from the menu ribbon. The Labels form will appear. We already entered
the labels we need when we entered the terms above, note the “Standard Label” which is always
required. So, we will skip entering any additional labels and move on.
Close the labels form.
Step 3: Enter structure information.
Select “Edit” and then “Structures” from the menu ribbon. The Structures form will appear. When you
begin, your form will look like this:
After you have finished entering your structures for the accounting equation XBRL taxonomy, your
structure information for your accounting equation XBRL taxonomy should look like this:
Close the structures form.
Step 4: Enter associations information.
Select “Edit” and then “Associations” from the menu ribbon. The Associations form will appear. When
you begin, your form will look like this:

7
After you have finished entering your associations for the accounting equation XBRL taxonomy, your
associations information for your accounting equation XBRL taxonomy should look like this:
Close the associations form.
Step 4: Enter rules information.
Select “Edit” and then “Rules” and then “Consistency” from the menu ribbon. The Rules form will
appear. When you begin, your form will look like this:
After you have finished entering your rules for the accounting equation XBRL taxonomy, your rules
information for your accounting equation XBRL taxonomy should look like this:
IMPORTANT NOTE!!! If you copy/paste the rule into the Luca application from the Excel spreadsheet,
you will need to enter the three variables.

8
Close the rules form.
Step 5: Entering facts
Select “Edit” and then “Facts” from the menu ribbon. The Facts form will appear. When you begin, your
form will look like this:
After you have finished entering your facts for the accounting equation report, your facts information in
your accounting equation REPORT should look like this:
IMPORTANT NOTE!!! Notice the “Save” button above the facts that where entered. Be sure to press
that “Save” button or the facts will not be saved by the application.
Step 5: Generate your XBRL taxonomy schema, XBRL linkbases, and XBRL instance.
Select “File” and then “Save as XBRL” then a standard Windows form will appear that will allow you to
save your XBRL taxonomy files. Enter “ae.xsd” into the File name field:

9
Several XBRL files will be generated that contain the information that you entered into the Luca
application. If you go to the subdirectory where you stored those files you should see the following:
Step 5: Verify your XBRL files.
Finally, we will want to verify that the XBRL taxonomy that we created was consistent with the XBRL
technical specification. Luca does not perform XBRL validation. You can use any off-the-shelf XBRL
processor to verify that your XBRL is correct. Arelle5 is a free, open source, but rather technical XBRL
processor. Below you can see what your XBRL taxonomy looks like in a technical oriented tool. Note
that if you load the XBRL instance (i.e. the file ae.xbrl) the XBRL taxonomy files will be automatically
loaded also.
5 Arelle.org, https://arelle.org/arelle/

10
Step 6: Examining the End Result.
XBRL Cloud provides a handy mechanism for humans who need to work with XBRL-based financial
reports on their terms. The XBRL Cloud Evidence Package is a set of HTML pages that you can use to
investigate an XBRL-based report. Here is what the human readable version looks like6:
Try clicking on terms and numbers and notice how the XBRL Cloud Evidence Package works.
Another tool for working with XBRL-based reports is Pesseract7. Below you see the technical perspective
of the XBRL taxonomy that you created for the accounting equation:
This is what your XBRL instance looks like:
6 Accounting Equation representation, http://xbrlsite.azurewebsites.net/2020/introduction/ae-basic/evidence-package/contents/index.html#Rendering-BalanceSheet-Implied.html 7 Pesseract, http://pesseract.azurewebsites.net/

11
Notice how you can effectively use many different software tools to work with XBRL-based financial
reports. This is because the XBRL technical syntax is a global standard supported by many different
software vendors.
Terms and Rules So, the notions of Terms and Rules should be pretty clear to you. As we pointed out; Assets, Liabilities,
and Equity are three Terms we used in the accounting equation example. The rule “Assets = Liabilities +
Equity” explains the mathematical association between the three terms.
As we will see next, Structures offer a mechanism for having flexibility.

12
Understanding Structures by Representing Net Assets We want to introduce you to the notion of structures in more detail using another version of the
accounting equation. As you know, not all economic entities us the rule: Assets = Liabilities + Equity.
Using the rules of mathematics, that rule can be change to: Equity = Assets - Liabilities. More
commonly, the term “Net Assets” is used instead of “Equity” in this situation, and so we have another
approach to representing the accounting equation:
Net Assets = Assets - Liabilities
To keep the two different sets of terms and rules apart which have different associations, we need some
sort of mechanism. That mechanism is the Structure. A Structure is comprised of a set of logical
statements which describe the Structure. Those statements are in the form of terms, associations
between the terms, and rules.
While the terms Assets, Liabilities, and Equity are part of the balance sheet structure; the terms Assets,
Liabilities, and Net Assets are part of the statement of net assets structure. We already pointed out the
two different rules that represent the mathematical associations between the two different structures.
An economic entity might use a balance sheet structure or perhaps a statement of net assets structure.
Reporting economic entities tend to report either a balance sheet or a statement of net assets.
Building on our accounting equation example, we can add a second structure and get the following8:
We are not going to work through constructing this example; you can work through that on your own if
you like. This is very similar to the accounting equation except that you have two structures rather than
one, the terms used are different, and the rules for each structure are different.
Important Subtle Difference Between Net Assets and Equity There is a very subtle but important difference between the term Net Assets and the term Equity. While
Equity is a CREDIT balance; Net Assets has the balance type of DEBIT. See the graphic above. This
mimics how these two terms are used in the real world. Just be aware of this subtle difference.
8 Accounting Equation, Net Assets Approach, http://xbrlsite.azurewebsites.net/2020/introduction/ae-na/index.html

13
SFAC 6 Elements of Financial Statements We are going to add a bit more complexity by moving to the FASB’s SFAC 69 Elements of Financial
Statements example. On page 12 you see the 10 elements that serve as the building blocks of financial
statements: (i.e. Terms)
• Assets,
• Liabilities,
• Equity (or Net Assets),
• Revenues,
• Expenses,
• Gains,
• Losses,
• Investments by Owners,
• Distributions to Owners, and
• Comprehensive Income.
In addition, three Rules are explicitly or implicitly defined:
• Assets = Liabilities + Equity
• Comprehensive Income = Revenues - Expenses + Gains - Losses
• Ending Equity = Beginning Equity + Comprehensive Income + Investments by Owners -
Distributions to Owners
Finally, three Structures are explicitly or implicitly defined:
• Balance sheet
• Income statement
• Statement of Changes in Equity
The final result you are working toward in the creation of this SFAC 6 representation in XBRL10 provides a
Microsoft Access database application that has all the terms, rules, and structures represented. You can
examine that representation and/or work through the creation of the above information using Luca
again. We will now walk you through completing this in Luca:
Step 1: Enter base information.
Select “Edit” and then “Base Information”. The Base Information form will appear. Enter the base
information that will be used by the XBRL taxonomy:
9 FASB, Statement of Financial Accounting Concepts No. 6, page 12, https://www.fasb.org/pdf/con6.pdf 10 SFAC 6 representation, http://xbrlsite.azurewebsites.net/2020/introduction/sfac6-basic/index.html

14
Step 2: Enter term information.
Select “Edit” and then “Terms”. The Terms form will appear. Enter term information. When you begin,
your form will look like this:
After you have finished entering your terms for the SFAC 6 XBRL taxonomy, your term information for
the XBRL taxonomy should look like this:
Alternatively, you can copy information from Excel and then paste it into the TERMS form.
Step 3: Enter label information.

15
Select “Edit” and then “Labels” from the menu ribbon. Before you enter any information, the labels
form will look as follows:
After you have finished entering your label information for the SFAC 6 XBRL taxonomy, your labels
information for SFAC 6 should look like this:
Again, alternatively this information can be copied and then pasted from Excel.
Step 3: Enter structure information.
Select “Edit” and then “Structures” from the menu ribbon. Before you enter any information, the
structures form will look as follows:
After you have finished entering your structures for the SFAC 6 XBRL taxonomy, your structure
information for the XBRL taxonomy should look like this:
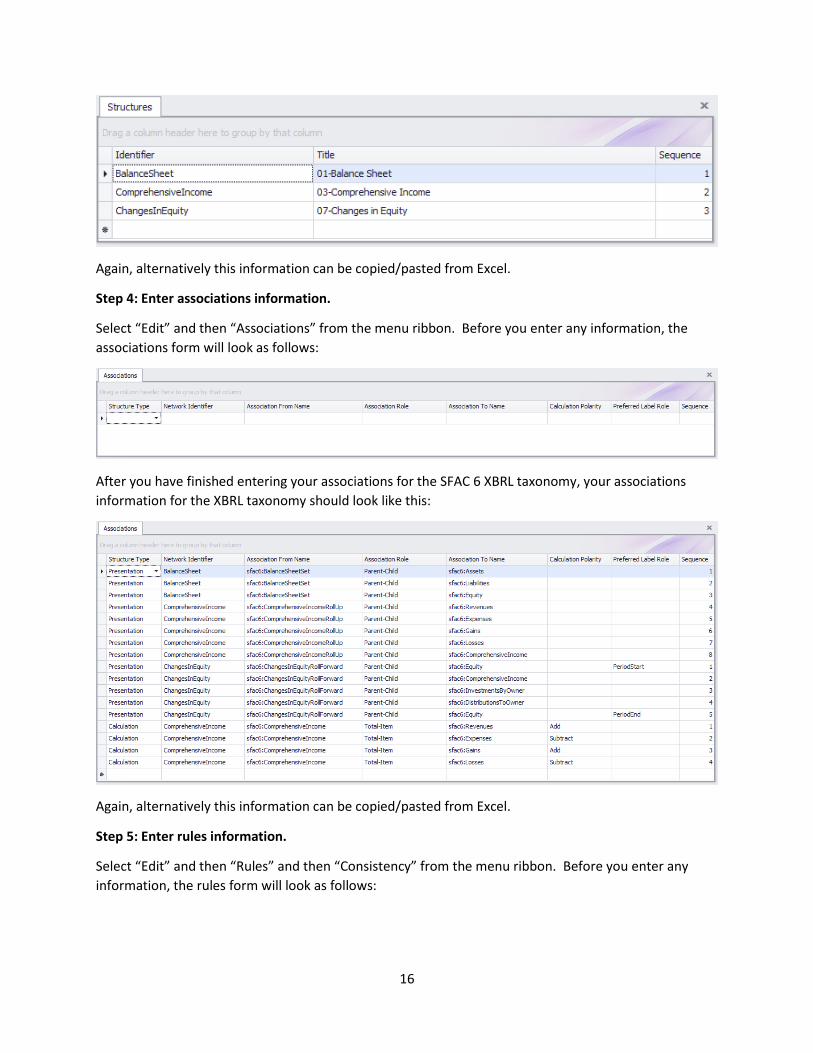
16
Again, alternatively this information can be copied/pasted from Excel.
Step 4: Enter associations information.
Select “Edit” and then “Associations” from the menu ribbon. Before you enter any information, the
associations form will look as follows:
After you have finished entering your associations for the SFAC 6 XBRL taxonomy, your associations
information for the XBRL taxonomy should look like this:
Again, alternatively this information can be copied/pasted from Excel.
Step 5: Enter rules information.
Select “Edit” and then “Rules” and then “Consistency” from the menu ribbon. Before you enter any
information, the rules form will look as follows:

17
After you have finished entering your rules for the SFAC 6 XBRL taxonomy, your rules information for the
XBRL taxonomy should look like this:
IMPORTANT NOTE!!! If you copy/paste the rule into the Luca application from the Excel spreadsheet,
you will need to enter the three variables.
Close the rules form.
Step 6: Enter facts information.
Select “Edit” and then “Facts” from the menu ribbon. Before you enter any information, the facts form
will look as follows:
After you have finished entering your facts the SFAC 6 report, your form should look like this:

18
IMPORTANT NOTE!!! Notice the “Save” button above the facts that where entered. Be sure to press
that “Save” button or the facts will not be saved by the application.

19
Step 7: Generate your XBRL taxonomy schema, linkbases, and XBRL instance.
After you have successfully entered all your term, label, structure, association, and rule information;
then you can generate your XBRL taxonomy. This will include the XBRL taxonomy schema and the XBRL
linkbases that will support your report.
To generate the XBRL taxonomy information, from the menu ribbon select “File” and then “Save as
XBRL”. The following standard Windows dialog box will appear which will let you save your file.
In the “File name:” text box of the form, enter “sfac6.xsd” which will be the name of your XBRL
taxonomy schema file.
Step 7: Verify that your XBRL is correct.
Luca does not provide XBRL syntax verification. And so, to validate the XBRL taxonomy and XBRL
instance that you created, you will have to use an XBRL processor that provides XBRL, XBRL dimensions,
and XBRL Formula validation. As part of the representation we provide you as an end result is the
validation result from XBRL Cloud’s Evidence Package11:
If you validate the XBRL files using your favorite XBRL processor, you should see that you have no errors:
11 XBRL Cloud Evidence Package validation result for SFAC 6, http://xbrlsite.azurewebsites.net/2020/introduction/sfac6-basic/evidence-package/contents/index.html#ReportProperties.html

20
This is what the XBRL taxonomy looks like in Pesseract12:
Here is what the XBRL instance looks like in Pesseract:
12 Pesseract, http://pesseract.azurewebsites.net/

21
You can have a look at the completed SFAC 6 representation from the files we provide generated by
XBRL Cloud13:
Introducing the Hypercube We want to now introduce you to the notion of the Hypercube. A Hypercube is a mechanism for
defining a structure in the XBRL technical syntax. Before now, we were using another mechanism for
defining structures in XBRL, the Network. To round out the three different approaches to defining a
structure there is also the approach of using a combination of a Network and a Hypercube to define a
structure.
The first question you might have is, “Why three approaches?” That is a very good question but
providing a good answer is harder. For now, don’t worry about the answer to the question because
creating XBRL-based reports using IFRS or US GAAP allows either approach. The “best approach” can be
a matter of opinion.
Both a Hypercube and a Network are ways of connecting associations together to define a structure.
Networks must always exist in XBRL-based reports. Hypercubes are optional until you need what only
they can provide to structure information effectively.
Essentially, Networks and Hypercubes connect sets of associations and facts together. What we try and
do is make the notion of a Network and Hypercube invisible to you and expose only the notion of the
Structure itself. This is done by automatically generating the Network, Hypercube, or combination of
Network + Hypercube by cleverly designing software.
But, lets forget about all that for now and look at a Hypercube. We do this by looking at the following
structure of the SFAC 6 representation:
13 XBRL Cloud Evidence Package, http://xbrlsite.azurewebsites.net/2020/introduction/sfac6-basic/evidence-package/

22
Notice the “Comprehensive Income Statement [Hypercube]” in the representation above. In this case
whether the Hypercube does or does not exist changes nothing about the meaning of the information
conveyed by the XBRL-based information provided.
We are going to cover Hypercubes more in a bit. But first, we need to Segway by looking at a
pathological structure in order to better understand structures.
Pathological Structure What you see below is four logical structures that have been represented as one physical structure
within an XBRL-based report14:
14 Pathological structure, http://xbrlsite.azurewebsites.net/2020/introduction/pathological/evidence-package/
23
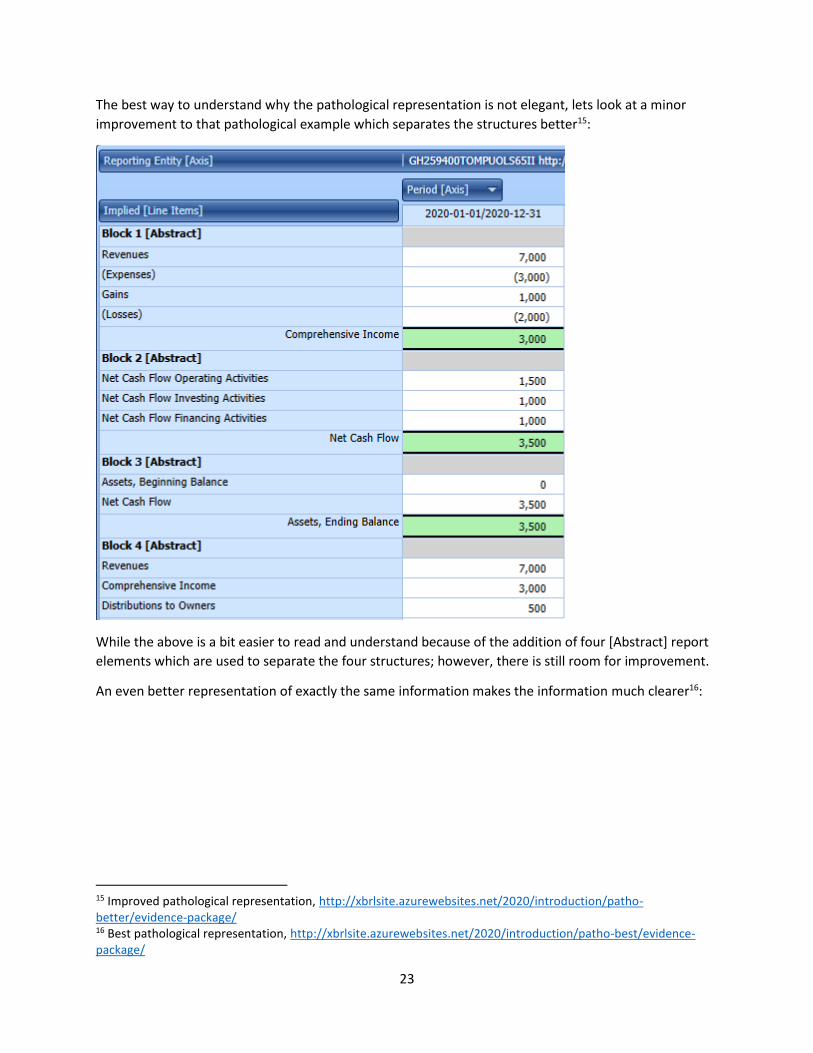
The best way to understand why the pathological representation is not elegant, lets look at a minor
improvement to that pathological example which separates the structures better15:
While the above is a bit easier to read and understand because of the addition of four [Abstract] report
elements which are used to separate the four structures; however, there is still room for improvement.
An even better representation of exactly the same information makes the information much clearer16:
15 Improved pathological representation, http://xbrlsite.azurewebsites.net/2020/introduction/patho-better/evidence-package/ 16 Best pathological representation, http://xbrlsite.azurewebsites.net/2020/introduction/patho-best/evidence-package/

24
Notice how the four structures (i.e. income statement which is a roll up, net cash flow roll up and assets
roll forward which makes up the cash flow statement, and the unrelated set of facts which make up the
financial highlights set) are significantly more understandable.
While it is true that all three versions of this same example convey exactly the same meaning and all
drive the same Inline XBRL representation (see next page); it is likewise true that all things considered

25
the third representation that you see above is more explicit and tends to be easier to understand. Here
is the same information represented using Inline XBRL17:
17 Inline XBRL of pathological representation, http://xbrlsite.azurewebsites.net/2020/introduction/pathological/instance-RENDERED.html

26
Notice how the third representation is the most consistent with the Inline XBRL representation and note
how a better model tends to yield a better automated rendering of information without the need for
taking the time to create the Inline XBRL.
Proof Plus Representation Rounds Out Financial Report Model While the SFAC 6 representation makes the point that there are different information patterns such as
the “roll up” which is different than the “roll forward”; the SFAC 6 does not have a complete inventory
of all information patterns you might run across.
The Proof Plus representation18 does have that complete inventory. Here are three additional
information patterns that XBRL-based financial reports must support:
Adjustment which reconciles an originally stated balance to a restated balance19:
Variance which reconciles a budget or forecast to an actual balance20:
18 Proof Plus Representation, http://xbrlsite.azurewebsites.net/2020/introduction/proof-plus/index.html 19 Adjustment, http://xbrlsite.azurewebsites.net/2020/introduction/proof-plus/evidence-package/contents/index.html#Rendering-PriorPeriodErrors-proof_PriorPeriodErrorsHypercube.html 20 Variance, http://xbrlsite.azurewebsites.net/2020/introduction/proof-plus/evidence-package/contents/index.html#Rendering-VarianceAnalysis-proof_VarianceAnalysisHypercube.html

27
Member aggregation which is similar to a roll up however is represented across a set of members of a
dimension21:
Text block or prose22:
There are a few additional information models that financial report fragments fit into. For a complete
list, please refer to the Logical Theory Describing Financial Report23 which is introduced in the
intermediate discussion.
Back to Hypercubes, Networks, and Structures We round out this introduction with some final pointers about structures and the networks and
hypercubes used to represent them.
First, there are two reasons you create a new structure: (1) because you have to and (2) because you
want to.
You have to create a new structure when a conflict occurs when you do not. For example, in the SFAC 6
representation there are two different roll up alternatives provided for Comprehensive income which
we provide here:
Alternative 124:
21 Member aggregation, http://xbrlsite.azurewebsites.net/2020/introduction/proof-plus/evidence-package/contents/index.html#Rendering-SegmentRevenues-proof_SegmentRevenuesHypercube.html 22 Text block, http://xbrlsite.azurewebsites.net/2020/introduction/proof-plus/evidence-package/contents/index.html#Rendering-Policies-proof_PoliciesHypercube.html 23 Logical Theory Describing Financial Report, http://www.xbrlsite.com/2020/Theory/Home.html 24 Comprehensive Income Roll Up 1, http://xbrlsite.azurewebsites.net/2020/introduction/sfac6-basic/evidence-package/contents/index.html#Rendering-ComprehensiveIncome-Implied.html

28
Alternative 225:
It is literally impossible to represent both alternatives using the same physical structure, so two different
structures are required.
But if you want to create another structure you can do that also. For example, you could represent the
balance sheet and income statement within the same structure because each of those disclosures use
completely separate terms, associations, and rules so you would not get a conflict if you did. Or, you
could make the choice to use two separate structures. In this case, either approach works fine.
And so, when you create a new structure, we pointed out that there are three alternatives for doing so.
Here we show each of those three approaches. We will contrast the income statement of the three
approaches to help you differentiate the approaches.
Approach 126: SFAC 6 Very Basic representation
In this first approach, note that neither the balance sheet, either income statement, nor changes in
equity have hypercubes. In each case the Table (a.k.a. Hypercube) field says “(Implied)” which means
that no explicit hypercube has been defined and therefore an imaginary hypercube that does not really
exist is implied. Each network has a unique identifier and can be used to distinguish one structure from
another.
25 Comprehensive Income Roll Up 2, http://xbrlsite.azurewebsites.net/2020/introduction/sfac6-basic/evidence-package/contents/index.html#Rendering-ComprehensiveIncome2-Implied.html 26 SFAC 6 Very Basic, http://xbrlsite.azurewebsites.net/2020/introduction/sfac6-basic/evidence-package/contents/index.html#Rendering-ComprehensiveIncome-Implied.html

29
However, consider the following. What if you combined the Comprehensive Income [Roll Up] and the
Balance Sheet [Set] into the same network. Could you use the Network to differentiate one structure
from the other when they share the same network? The answer is no; you would need to provide
additional information.
Approach 227: SFAC 6 Introducing Hypercubes representation
In this second approach, notice that every structure provides a hypercube; the balance sheet, each
income statement, and the changes in equity. But notice one important detail. Both of the income
statements use the same hypercube name, “Comprehensive Income Statement [Hypercube]”.
So, while each structure does contain a hypercube, because the hypercubes are not uniquely named,
the hypercube cannot be used to distinguish or identify structures. While you can distinguish the
balance sheet and statement of changes in equity; you cannot do the same with the two income
statements that use the same hypercube.
Or, saying this another way; if each of the hypercubes did have a unique name, then the hypercube
alone could be used to differentiate each structure.
27 SFAC 6 Introducing Hypercubes, http://xbrlsite.azurewebsites.net/2020/introduction/sfac6-dim/evidence-package/contents/index.html#Rendering-ComprehensiveIncome-sfac6_ComprehensiveIncomeStatementHypercube.html

30
Approach 328: SFAC 6 Alternative Hypercube Approach representation
In this alternative representation using hypercubes, the approach where one hypercube named
“Hypercube [Hypercube]” is used to represent the balance sheet, each of the two income statements,
and the changes in equity. See the first income statement here and look at the line below to see each of
the others. Further note that the Line Items term, “Hypercube [Line Items]”, is used in the
representation of each hypercube.
28 SFAC 6 Alternative Hypercube Approach, http://xbrlsite.azurewebsites.net/2020/introduction/sfac6-dim2/evidence-package/contents/index.html#Rendering-BalanceSheet-sfac6_HypercubeHypercube.html

31
What does sharing hypercubes and the same line items term between structures achieve? Well, first
you save having to create a new hypercube and the line items terms; you simple have to create them
once and use them many times which reduces the number of terms you must define.
Second, it forces one to use the network to physically identify the structure. Because each hypercube
has the same name, it is useless in the identification of which structure you are referring to.
Third, because you use the same hypercube name the creator of XBRL taxonomies is forced to only use
one hypercube per network. Why? If you only have one hypercube to use and you put them in the
same network, then conflicts will occur when associations between terms are defined within a network
for hypercubes that have the same name. The vast majority of XBRL-based reports already have only
one hypercube her network; this forces every report to use this approach.
Fourth, when you do want to extract information from a report and you want to leverage a hypercube
for doing so but each hypercube has the same name plus network identifiers are of no help because
both the SEC and ESMA require reporting entities to define and use their own network identifiers (as
contrast to each company having to use a network identifier defined by the FASB or IASCF or SEC or
ESMA) how can you possibly extract information from a report for a specific structure?
Well, that is an excellent question! The answer to that important question is to use what is known as
prototype theory29 which is beyond the scope of this introduction. In a nutshell, you use the parts of a
structure to identify the structure as contrast to a unique name that identifies each structure.
Best Approach for Representing Structures And so this begs the question: What is the best approach for representing structures? Using Networks,
Hypercubes, or both? Well, the answer to the question is not that simple and depends on your
perspective.
In order to define a proper XBRL taxonomy for, say, US GAAP or IFRS; you would have to know 100% of
the hypercubes in advance in order to use a hypercube to identify each possible disclosure structure.
While that is possible, it is challenging.
Today, most quality creators of XBRL-based reports for the SEC are using hypercubes to represent all
information in a report. For example, the Microsoft 10-K30 has 128 Networks, 128 hypercubes (a.k.a.
Tables), and 194 structures. Every structure is represented within a hypercube, but the hypercubes are
not uniquely named (i.e. that hypercube us-gaap:StatementTable is used numerous times to identify
numerous structures). Therefore, hypercubes are useless for extracting information.
Internally within the enterprise, I would speculate that people would find it easier to deal with unique
hypercubes for each unique disclosure.
29 Understanding Prototype Theory, http://xbrl.squarespace.com/journal/2013/12/21/understanding-prototype-theory.html 30 Microsoft XBRL-based Report Analysis, http://xbrl.squarespace.com/journal/2020/4/13/microsoft-xbrl-based-report-analysis.html