Embed Size (px)
Citation preview
Genomic Tools And Strategies For Studying Hereditary
Conditions In Horses
Sofia Mikko, L.S. Andersson, S. Eriksson, J. Axelsson, and G. Lindgren
Dept. of Animal Breeding and Genetics, SLU, Uppsala, Sweden
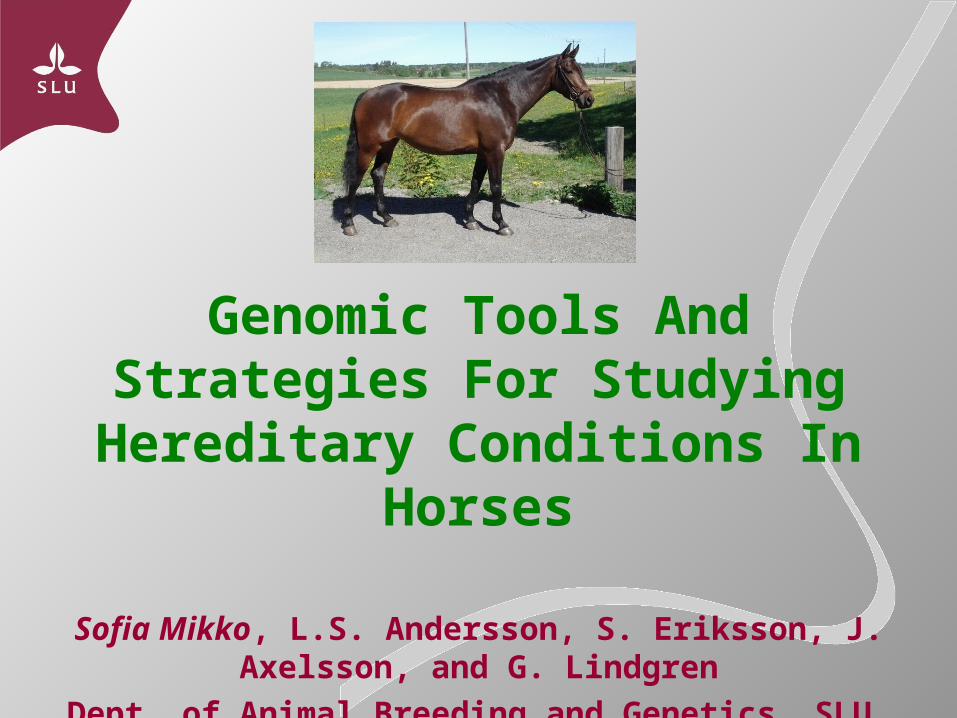
The Horse Genome Project http://www.uky.edu/Ag/Horsemap/welcome.html
Started in Kentucky 1995
Approx.100 researchers from more than 20 countries
Meetings are sponsered by Dorothy Russell Havemeyer Foundation
Strong collaboration to make a genetic map, and to sequence the horse genome
"Twilight" was selected as the representative horse
The sequence was publicly available in January 2007 (http://genome.ucsc.edu/)
"Twilight" - Equus caballusPhoto courtesy of NHGRI
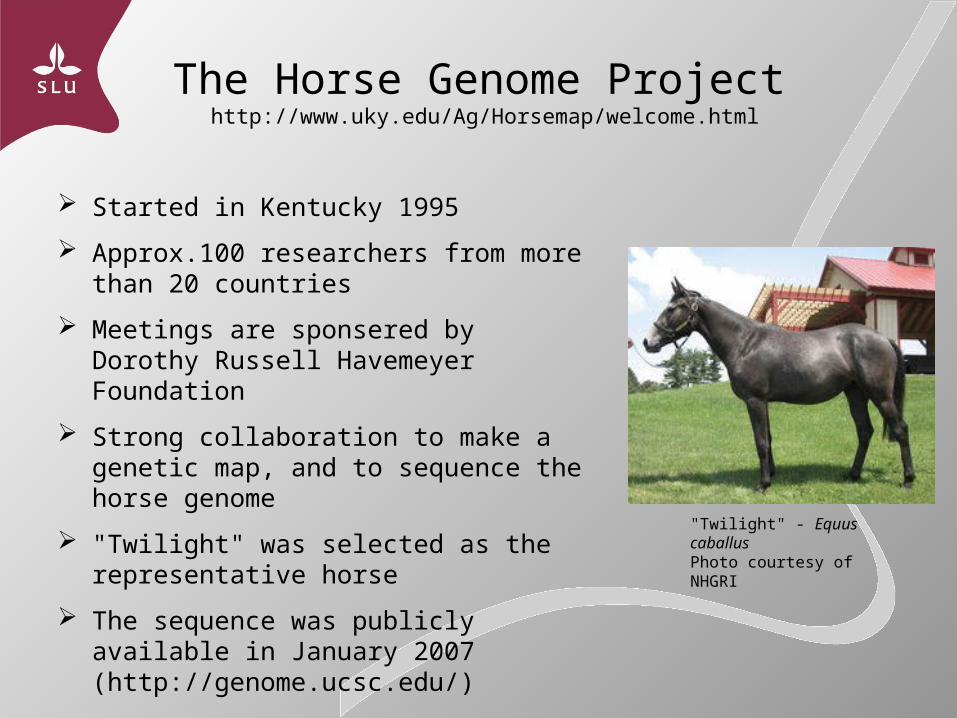
The Horse Genome Sequence http://www.broadinstitute.org/mammals/horse
EquCab2 is a Whole Genome Shotgun (WGS) assembly at 6.8X
The assembly is 2.68 Gb
The final gene-set comprises
20,436 protein-coding genes
4400 pseudogenes (including retrotranposed genes)
Bravo is a male Thoroughbred, closely related to Twilight. DNA from his blood cells was cut into large fragments to make a “BAC Library”.
The Equine Genome – EquCab2Wade et al., Science vol 326, 2009
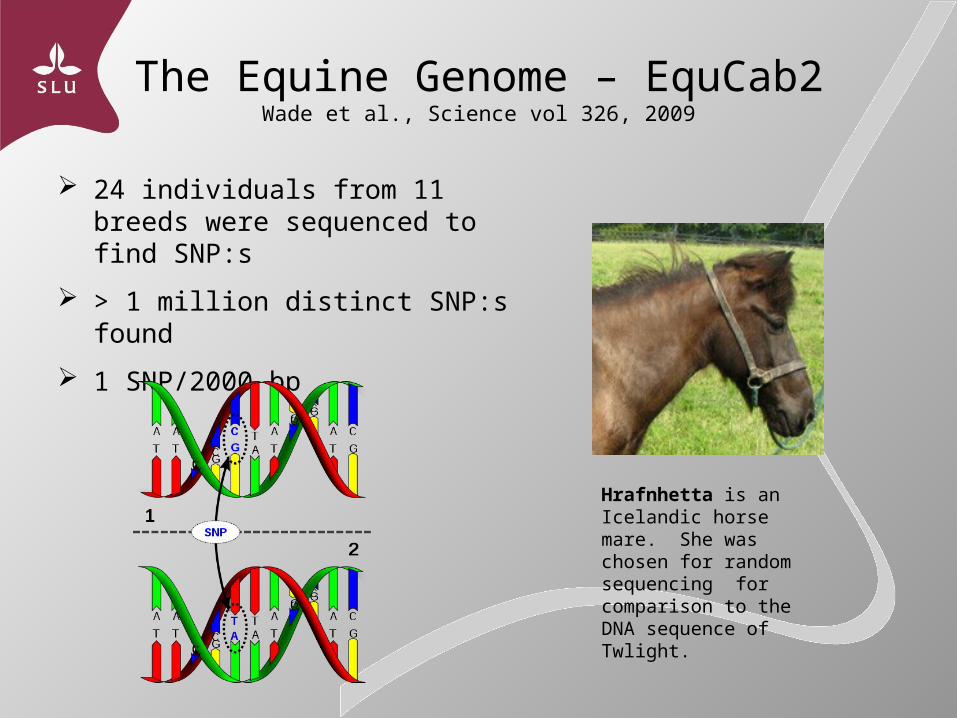
24 individuals from 11 breeds were sequenced to find SNP:s
> 1 million distinct SNP:s found
1 SNP/2000 bp
Hrafnhetta is an Icelandic horse mare. She was chosen for random sequencing for comparison to the DNA sequence of Twlight.
EqCab2 50K SNP chipWade et al., Science vol 326, 2009
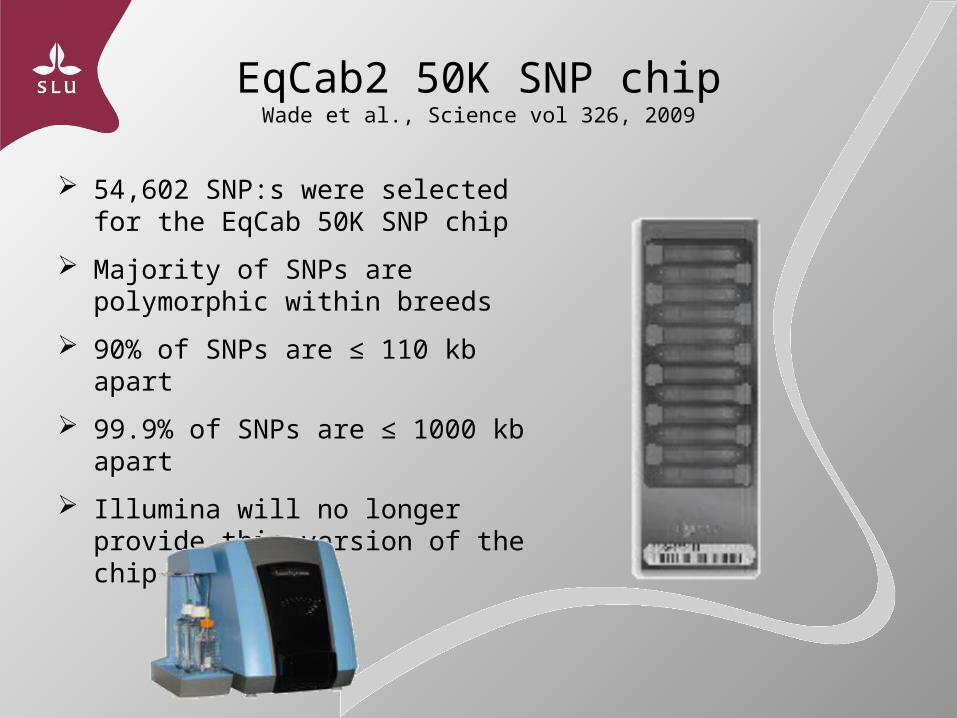
54,602 SNP:s were selected for the EqCab 50K SNP chip
Majority of SNPs are polymorphic within breeds
90% of SNPs are ≤ 110 kb apart
99.9% of SNPs are ≤ 1000 kb apart
Illumina will no longer provide this version of the chip
The Equine Genome – EquCab2Wade et al., Science vol 326, 2009
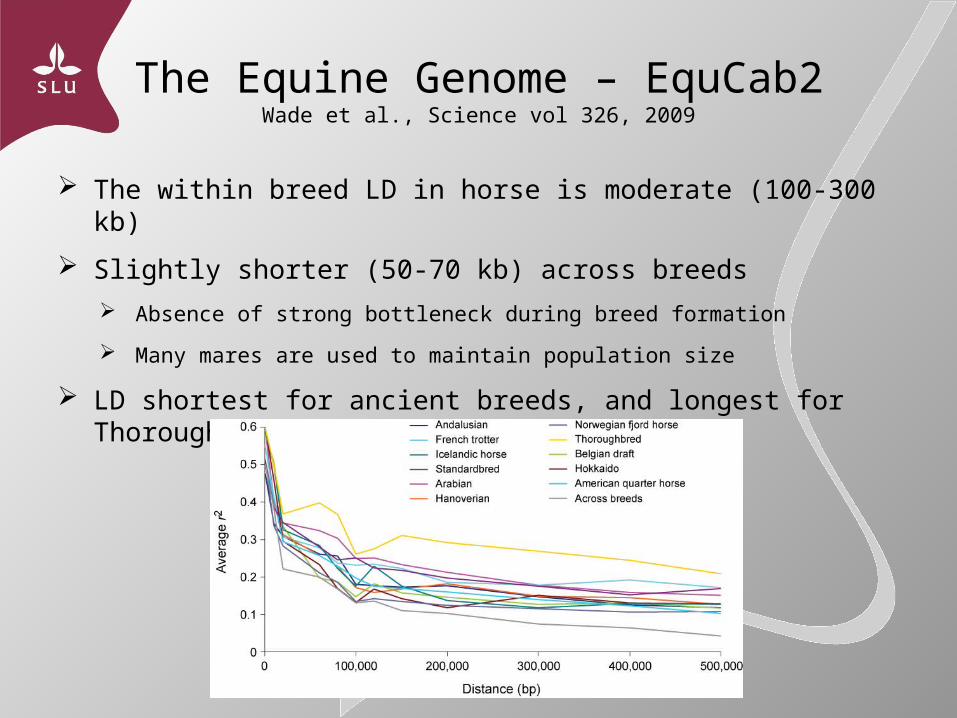
The within breed LD in horse is moderate (100-300 kb)
Slightly shorter (50-70 kb) across breeds
Absence of strong bottleneck during breed formation
Many mares are used to maintain population size
LD shortest for ancient breeds, and longest for Thoroughbred
The Equine Genome – EquCab2Wade et al., Science vol 326, 2009
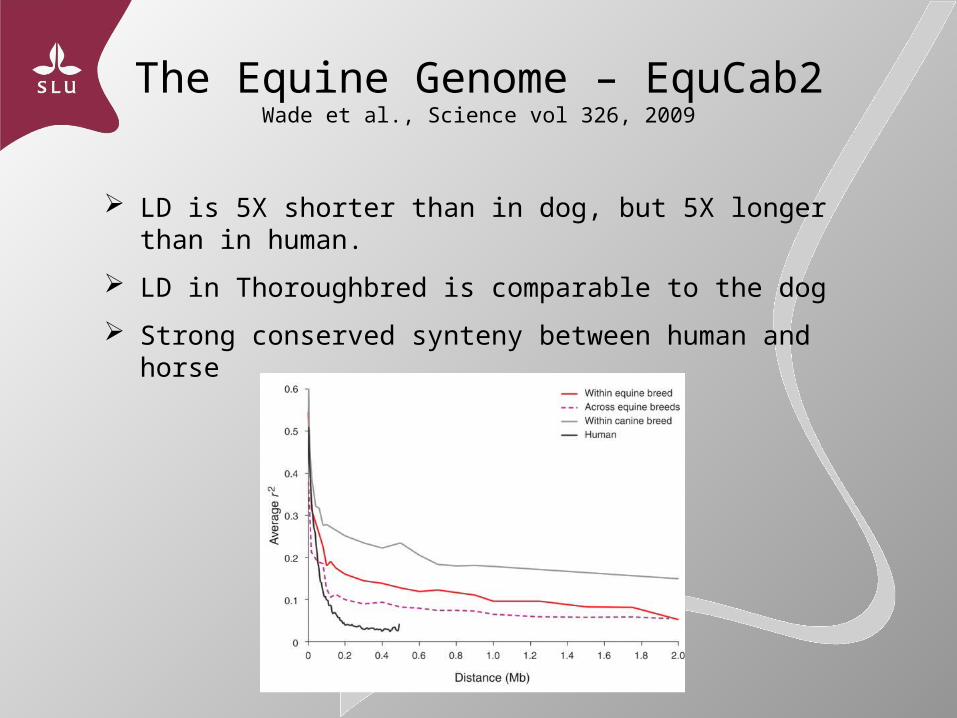
LD is 5X shorter than in dog, but 5X longer than in human.
LD in Thoroughbred is comparable to the dog
Strong conserved synteny between human and horse
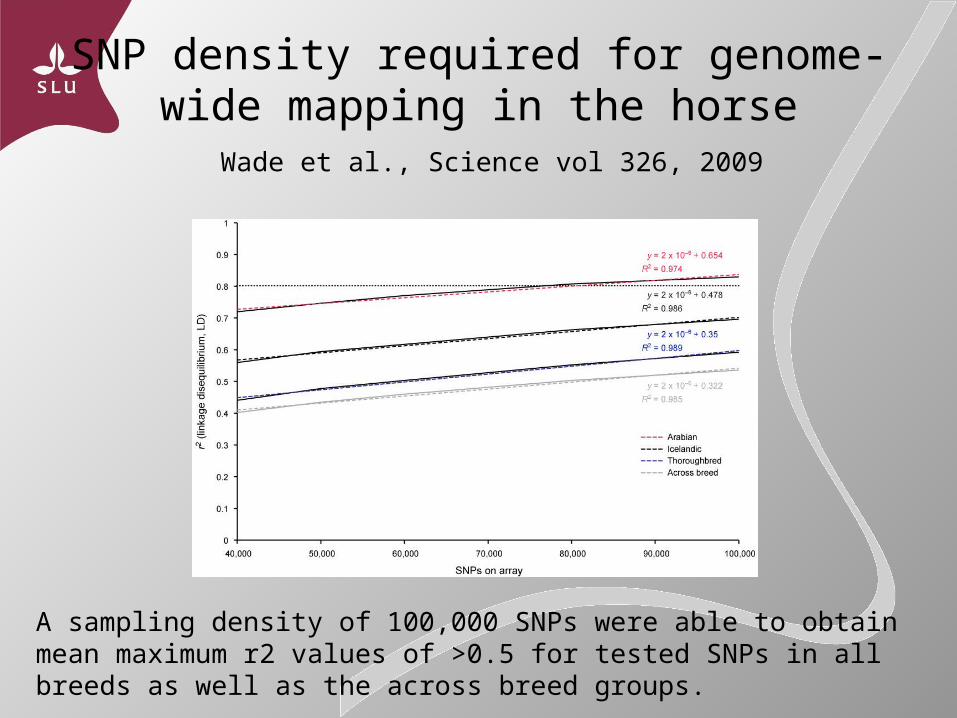
SNP density required for genome-wide mapping in the horse
Wade et al., Science vol 326, 2009
A sampling density of 100,000 SNPs were able to obtain mean maximum r2 values of >0.5 for tested SNPs in all breeds as well as the across breed groups.
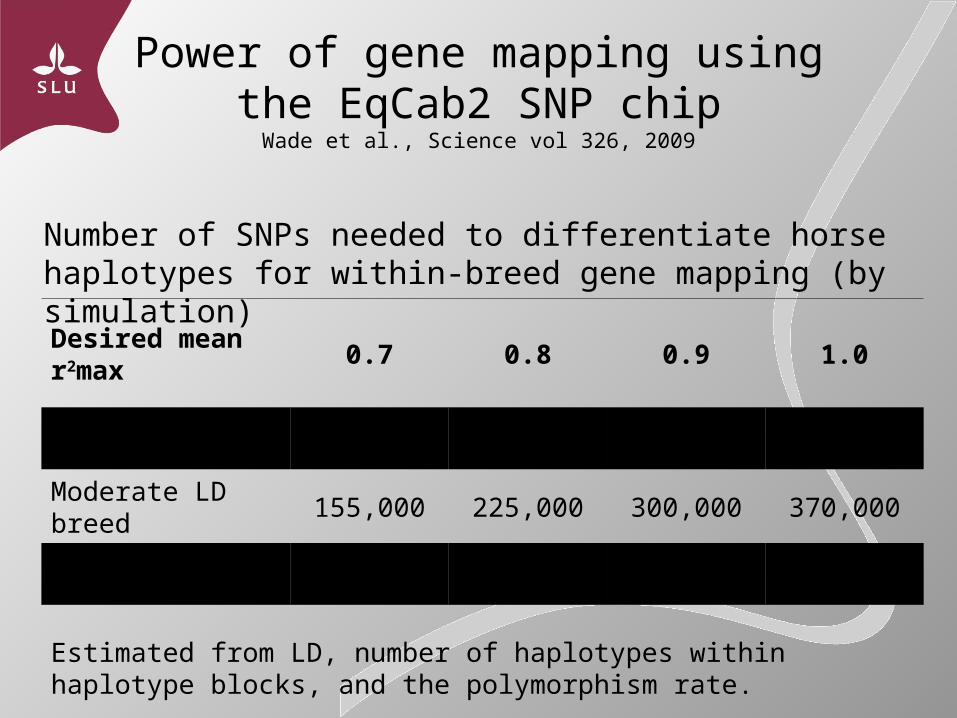
Power of gene mapping usingthe EqCab2 SNP chip
Wade et al., Science vol 326, 2009
Number of SNPs needed to differentiate horse haplotypes for within-breed gene mapping (by simulation)
Desired mean r2max
0.7 0.8 0.9 1.0
High LD breed 30,000 100,000 175,000 245,000
Moderate LD breed 155,000 225,000 300,000 370,000
Low LD breed 250,000 320,000 390,000 460,000
Estimated from LD, number of haplotypes within haplotype blocks, and the polymorphism rate.
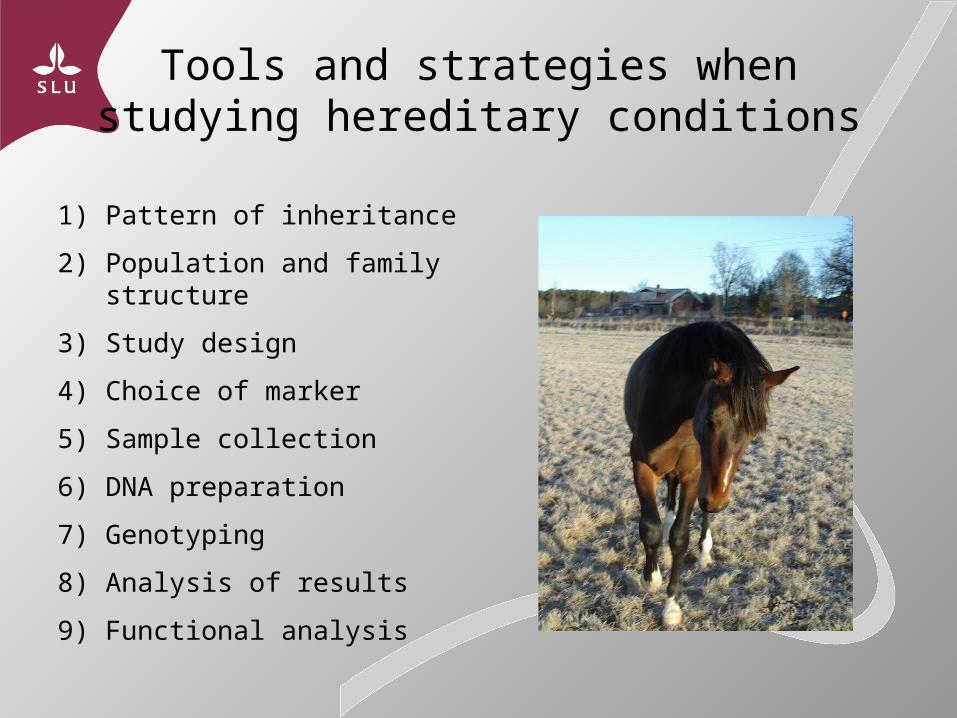
Tools and strategies when studying hereditary conditions
1) Pattern of inheritance
2) Population and family structure
3) Study design
4) Choice of marker
5) Sample collection
6) DNA preparation
7) Genotyping
8) Analysis of results
9) Functional analysis
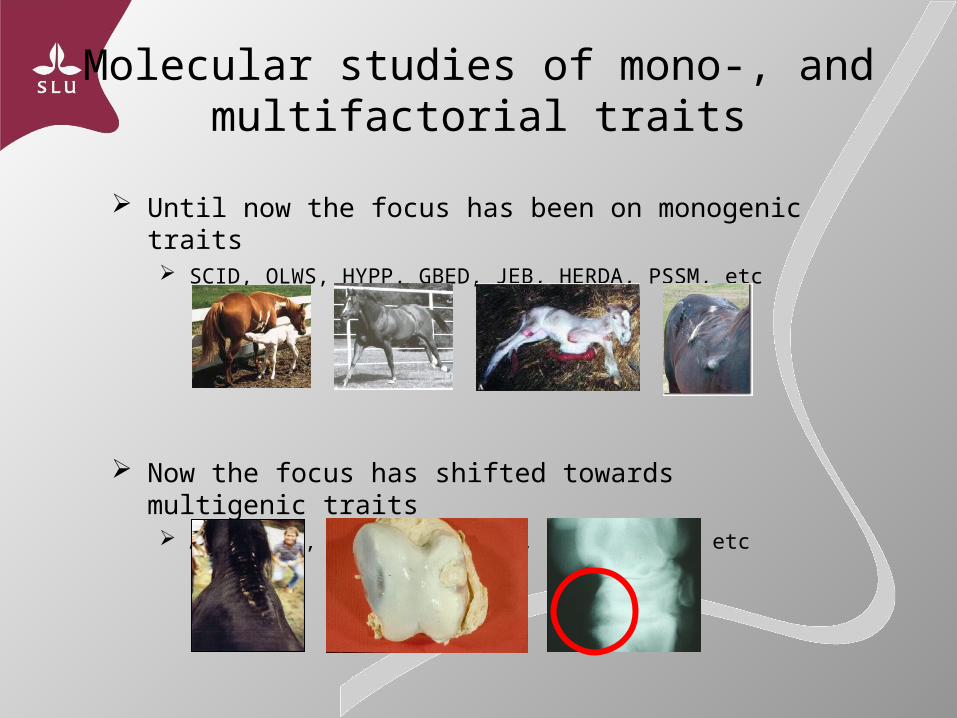
Molecular studies of mono-, and multifactorial traits
Until now the focus has been on monogenic traits SCID, OLWS, HYPP, GBED, JEB, HERDA, PSSM, etc
Now the focus has shifted towards multigenic traits Allergies, Osteochondrosis, Bone spavin, etc
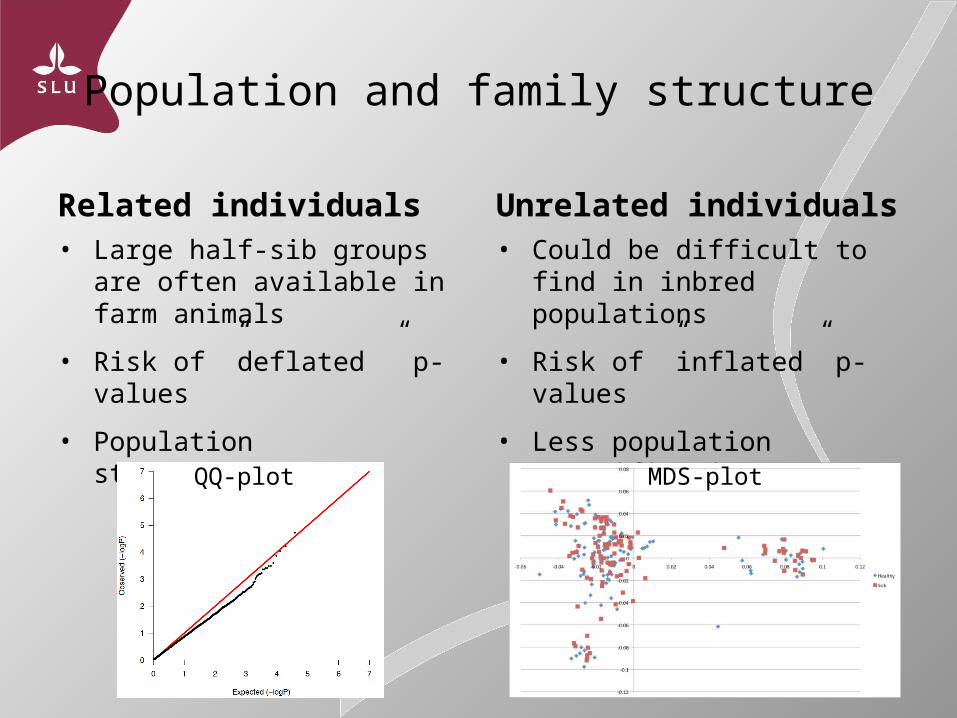
Population and family structure
Related individuals• Large half-sib groups are often
available in farm animals
• Risk of ”deflated ” p-values
• Population stratification
Unrelated individuals• Could be difficult to find in
inbred populations
• Risk of ”inflated” p-values
• Less population stratification
QQ-plot MDS-plot
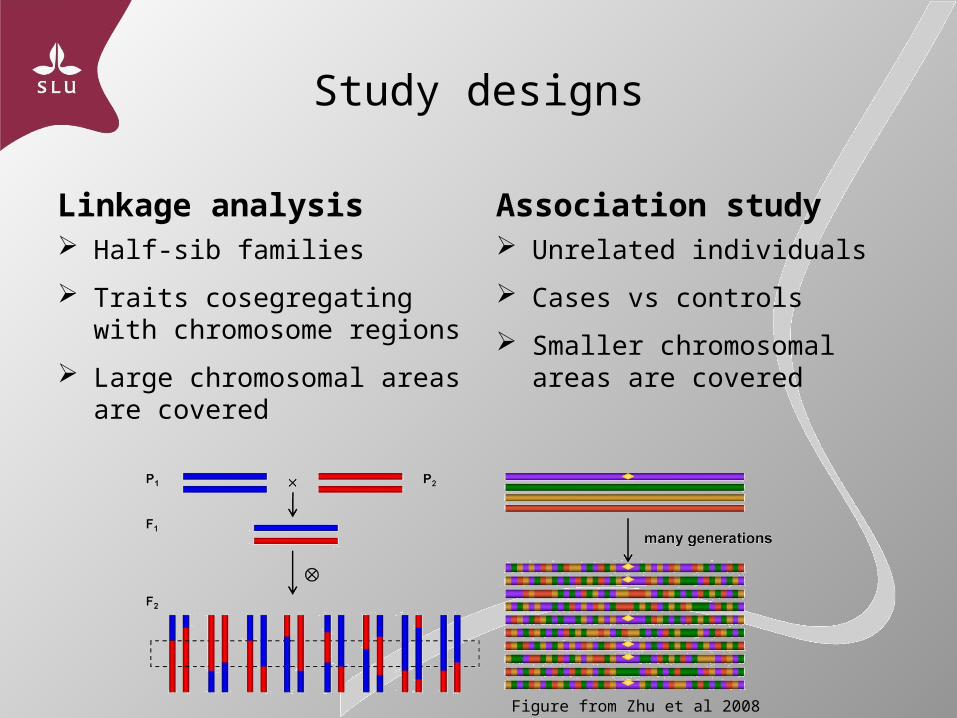
Study designs
Linkage analysis Half-sib families
Traits cosegregating with chromosome regions
Large chromosomal areas are covered
Association study Unrelated individuals
Cases vs controls
Smaller chromosomal areas are covered
Figure from Zhu et al 2008
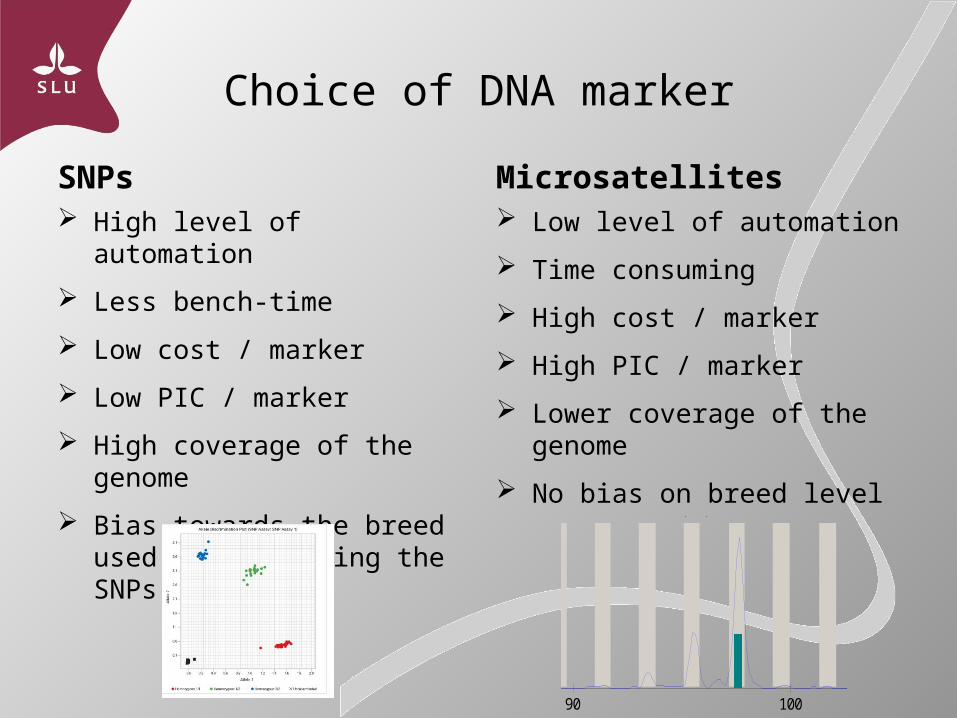
Choice of DNA marker
SNPs High level of automation
Less bench-time
Low cost / marker
Low PIC / marker
High coverage of the genome
Bias towards the breed used for selecting the SNPs
Microsatellites Low level of automation
Time consuming
High cost / marker
High PIC / marker
Lower coverage of the genome
No bias on breed level
E02 Eq020912_2 308088 Q Score : 5.3 Allele 1 : 97.5 ( M )
80 90 100 1100
1000
2000
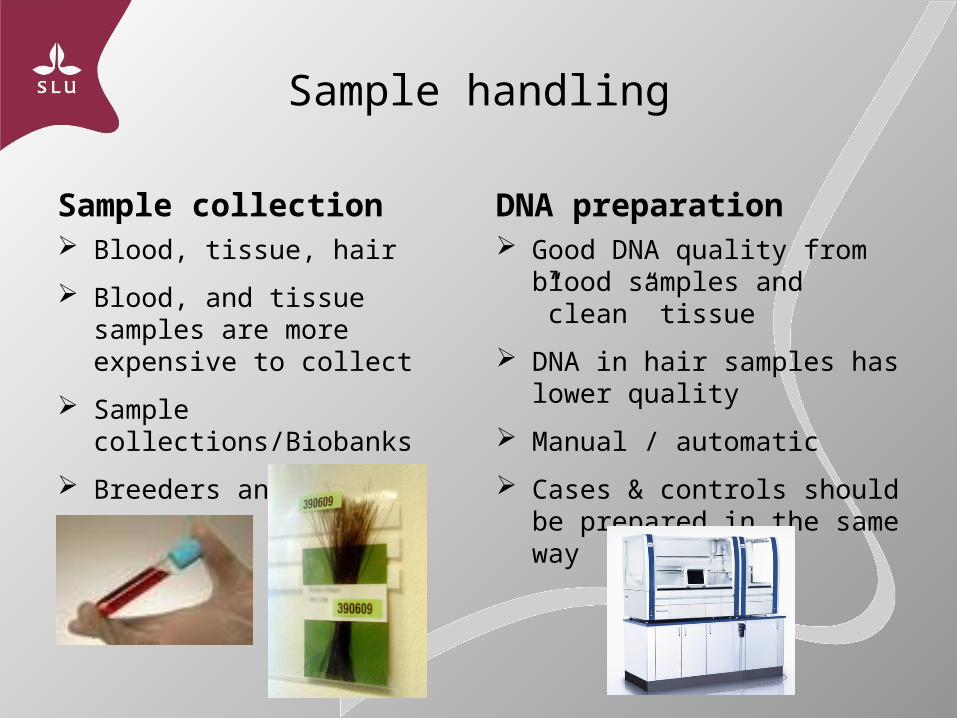
Sample handling
Sample collection Blood, tissue, hair
Blood, and tissue samples are more expensive to collect
Sample collections/Biobanks
Breeders and horse owners are helpful
DNA preparation Good DNA quality from blood
samples and ”clean” tissue
DNA in hair samples has lower quality
Manual / automatic
Cases & controls should be prepared in the same way
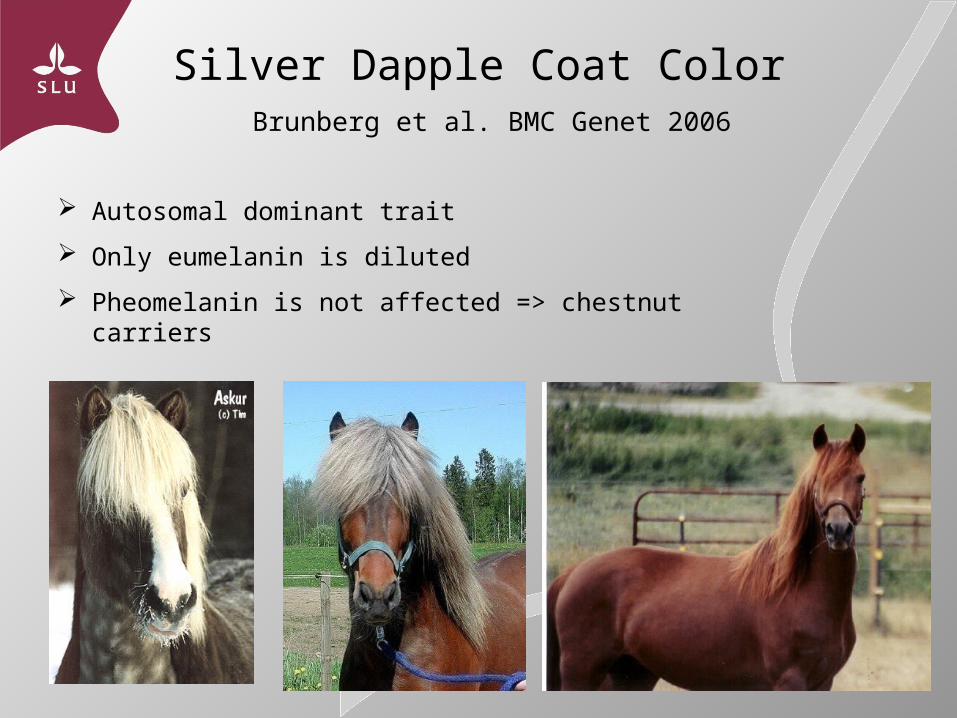
Silver Dapple Coat Color Brunberg et al. BMC Genet 2006
Autosomal dominant trait
Only eumelanin is diluted
Pheomelanin is not affected => chestnut carriers
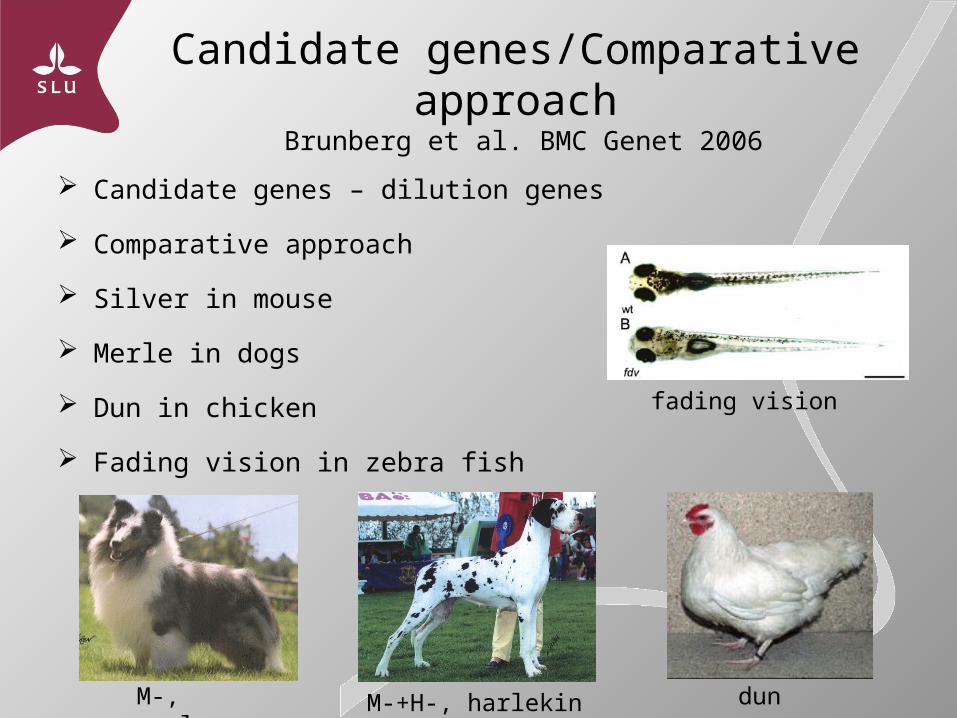
Candidate genes/Comparative approach Brunberg et al. BMC Genet 2006
Candidate genes – dilution genes
Comparative approach
Silver in mouse
Merle in dogs
Dun in chicken
Fading vision in zebra fish
M-, merle M-+H-, harlekin dun
fading vision
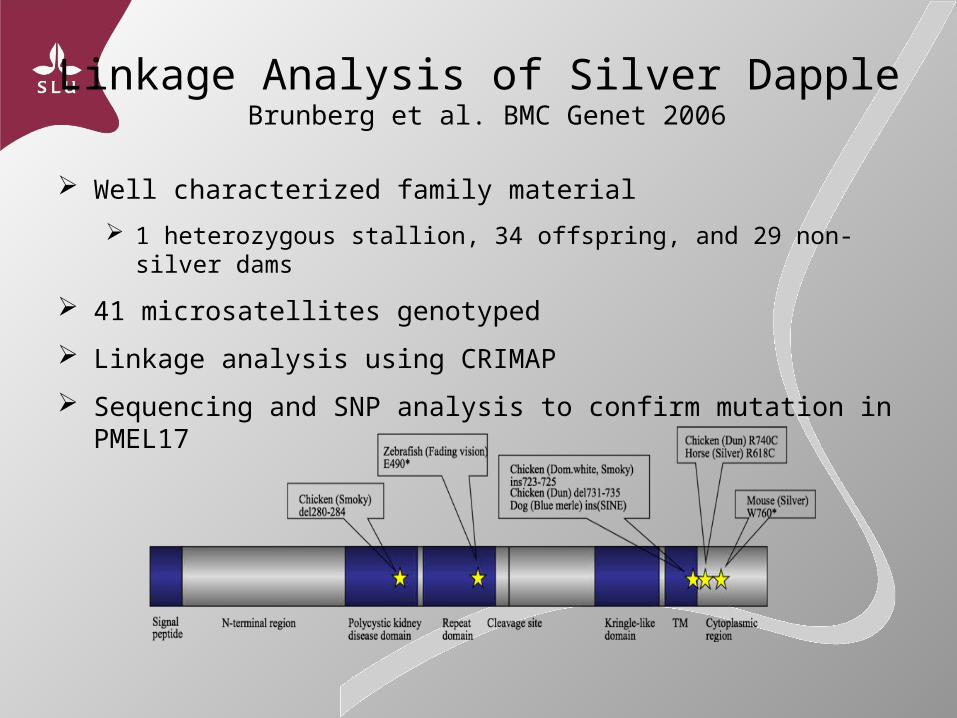
Linkage Analysis of Silver Dapple Brunberg et al. BMC Genet 2006
Well characterized family material
1 heterozygous stallion, 34 offspring, and 29 non-silver dams
41 microsatellites genotyped
Linkage analysis using CRIMAP
Sequencing and SNP analysis to confirm mutation in PMEL17
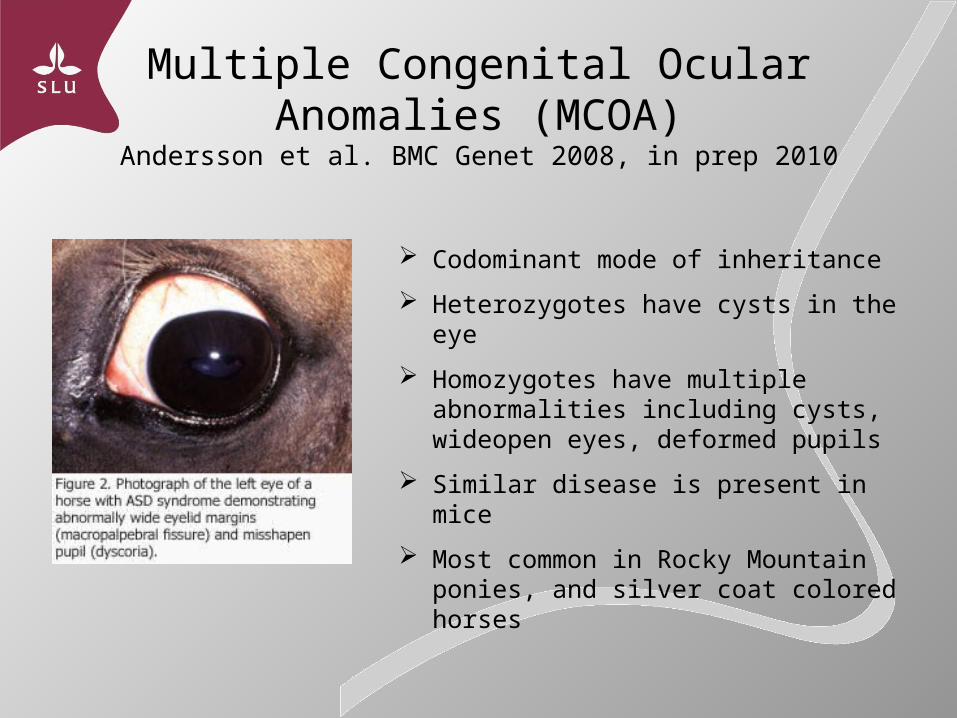
Multiple Congenital Ocular Anomalies (MCOA)
Andersson et al. BMC Genet 2008, in prep 2010
Codominant mode of inheritance
Heterozygotes have cysts in the eye
Homozygotes have multiple abnormalities including cysts, wideopen eyes, deformed pupils
Similar disease is present in mice
Most common in Rocky Mountain ponies, and silver coat colored horses
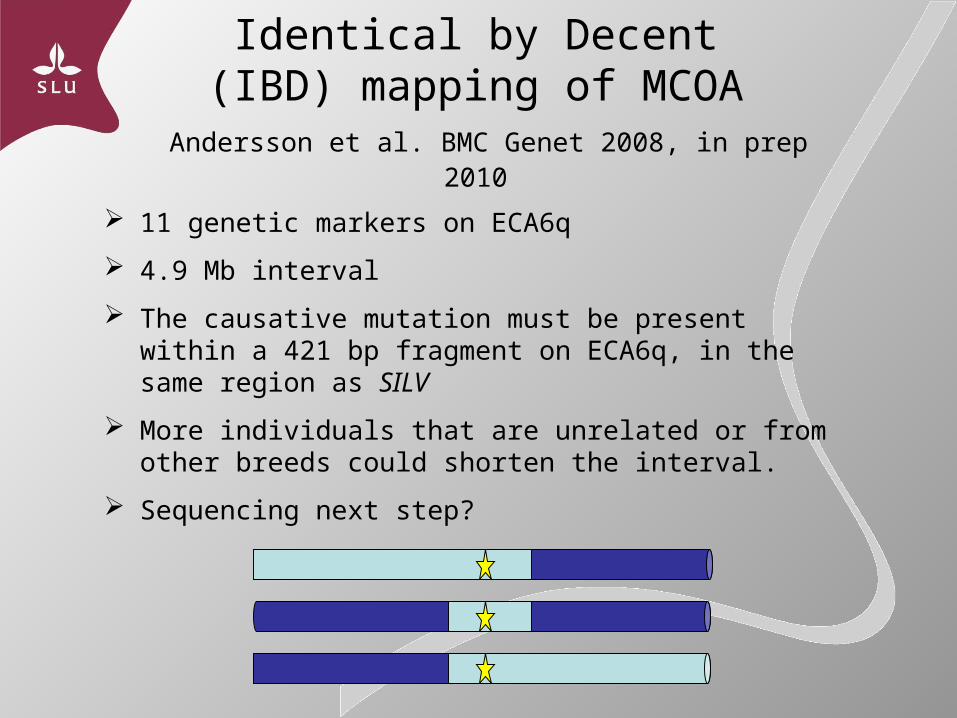
”Identical by Decent” (IBD) mapping of MCOA
Andersson et al. BMC Genet 2008, in prep 2010
11 genetic markers on ECA6q
4.9 Mb interval
The causative mutation must be present within a 421 bp fragment on ECA6q, in the same region as SILV
More individuals that are unrelated or from other breeds could shorten the interval.
Sequencing next step?
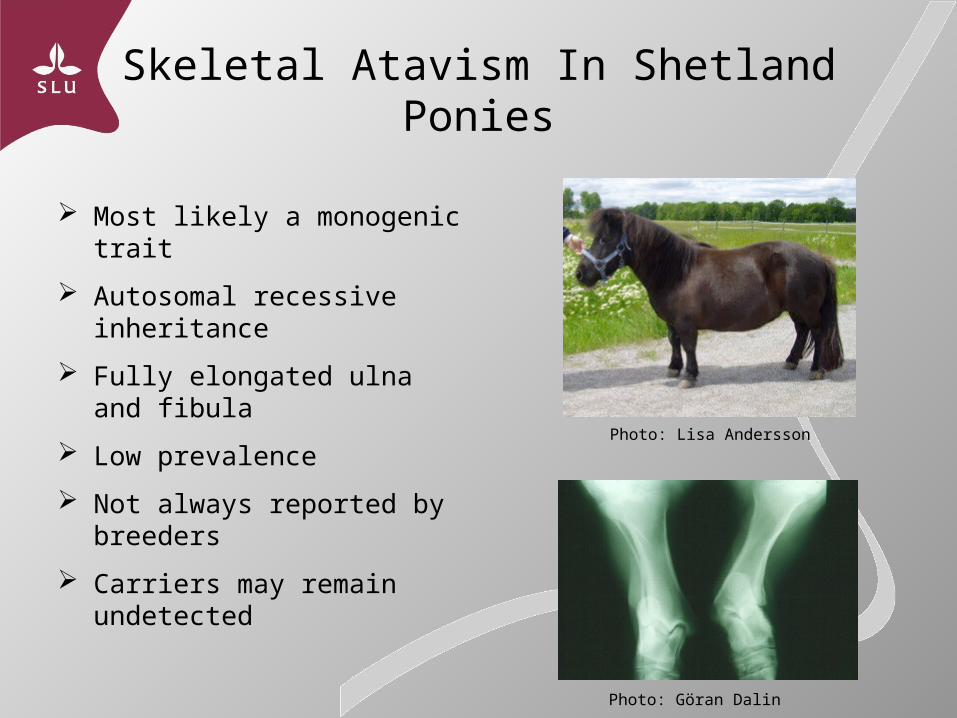
Skeletal Atavism In Shetland Ponies
Most likely a monogenic trait
Autosomal recessive inheritance
Fully elongated ulna and fibula
Low prevalence
Not always reported by breeders
Carriers may remain undetected
Photo: Lisa Andersson
Photo: Göran Dalin
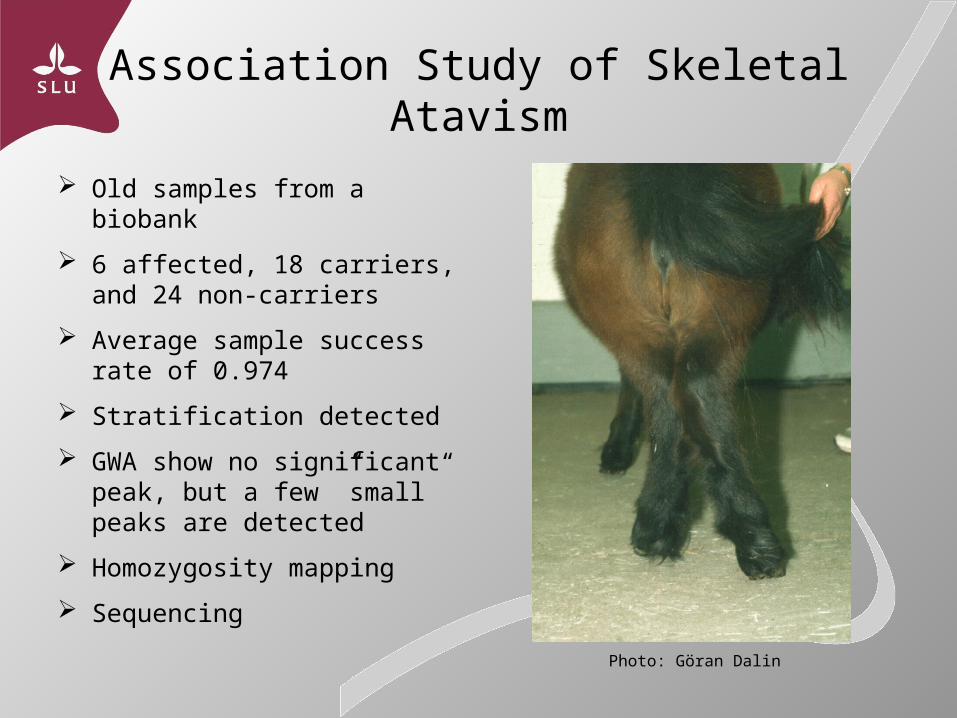
Association Study of Skeletal Atavism
Old samples from a biobank
6 affected, 18 carriers, and 24 non-carriers
Average sample success rate of 0.974
Stratification detected
GWA show no significant peak, but a few ”small” peaks are detected
Homozygosity mapping
Sequencing
Photo: Göran Dalin
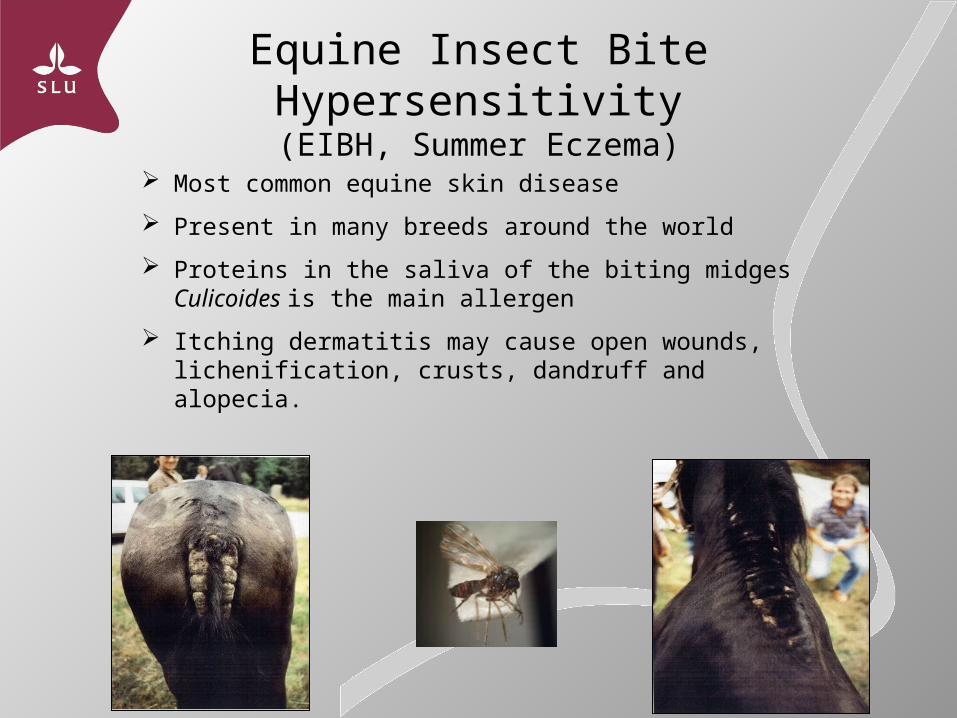
Equine Insect Bite Hypersensitivity(EIBH, Summer Eczema)
Most common equine skin disease
Present in many breeds around the world
Proteins in the saliva of the biting midges Culicoides is the main allergen
Itching dermatitis may cause open wounds, lichenification, crusts, dandruff and alopecia.
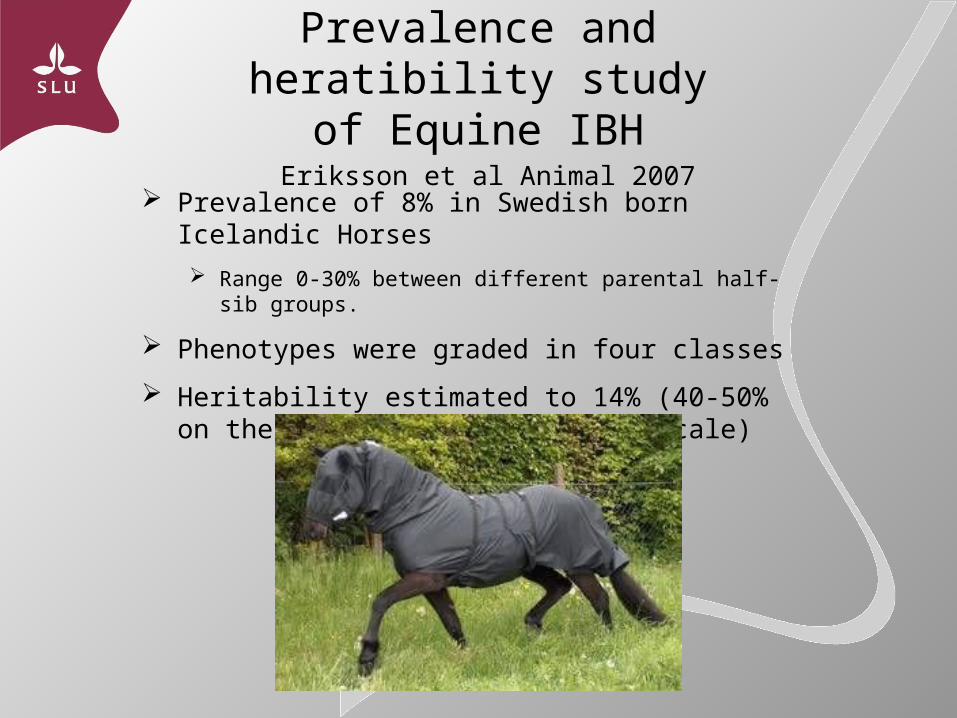
Prevalence and heratibility study of Equine IBH
Eriksson et al Animal 2007
Prevalence of 8% in Swedish born Icelandic Horses
Range 0-30% between different parental half-sib groups.
Phenotypes were graded in four classes
Heritability estimated to 14% (40-50% on the underlying, continuous scale)
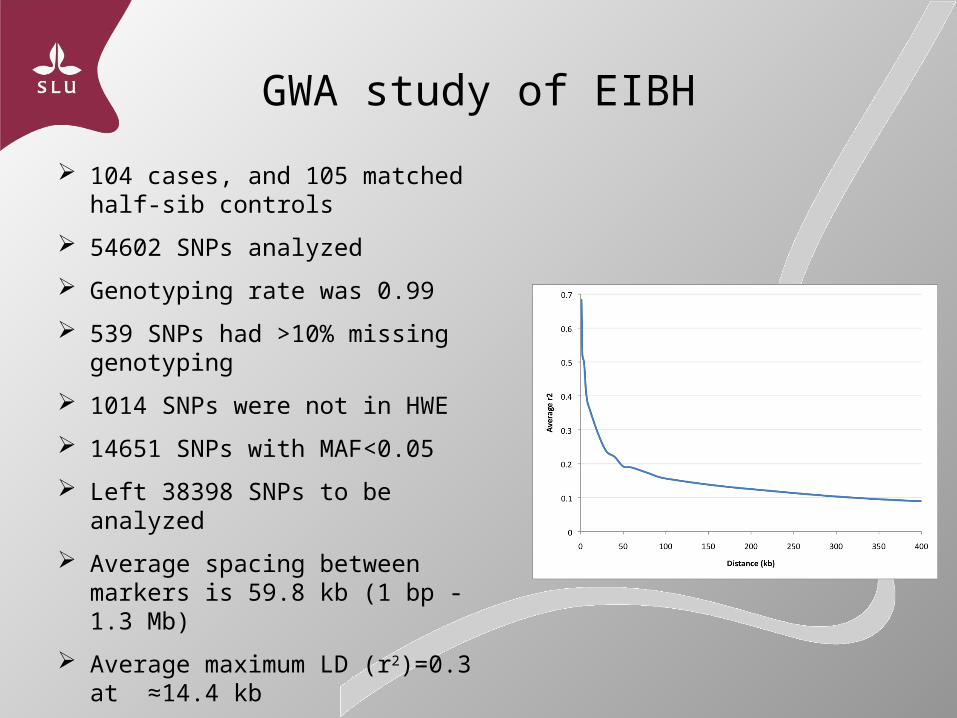
GWA study of EIBH
104 cases, and 105 matched half-sib controls
54602 SNPs analyzed
Genotyping rate was 0.99
539 SNPs had >10% missing genotyping
1014 SNPs were not in HWE
14651 SNPs with MAF<0.05
Left 38398 SNPs to be analyzed
Average spacing between markers is 59.8 kb (1 bp - 1.3 Mb)
Average maximum LD (r2)=0.3 at ≈14.4 kb
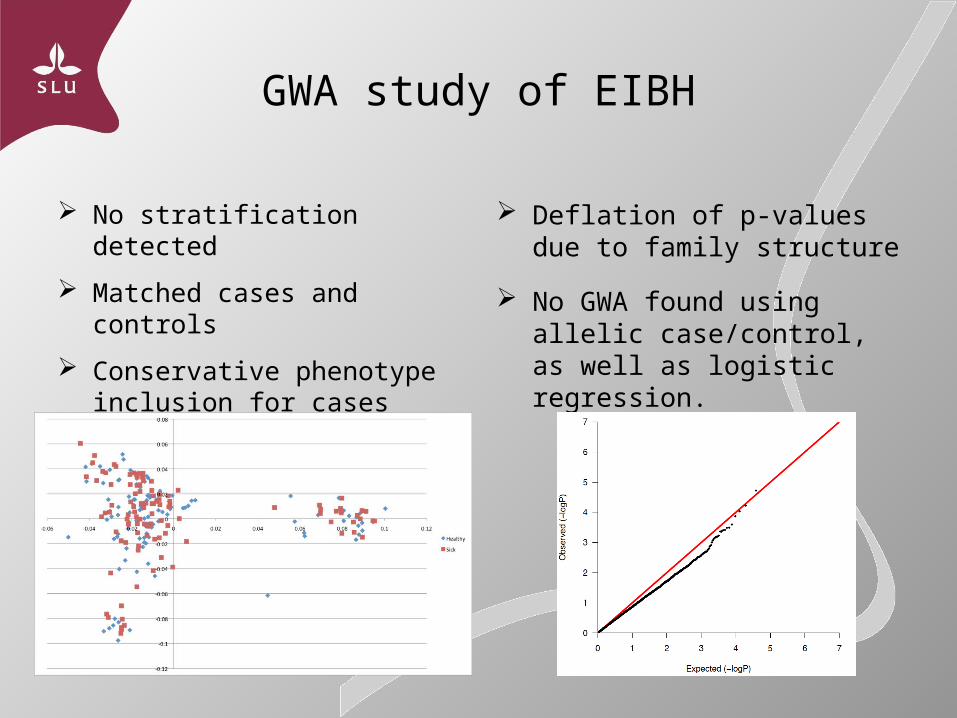
GWA study of EIBH
No stratification detected
Matched cases and controls
Conservative phenotype inclusion for cases
Deflation of p-values due to family structure
No GWA found using allelic case/control, as well as logistic regression.
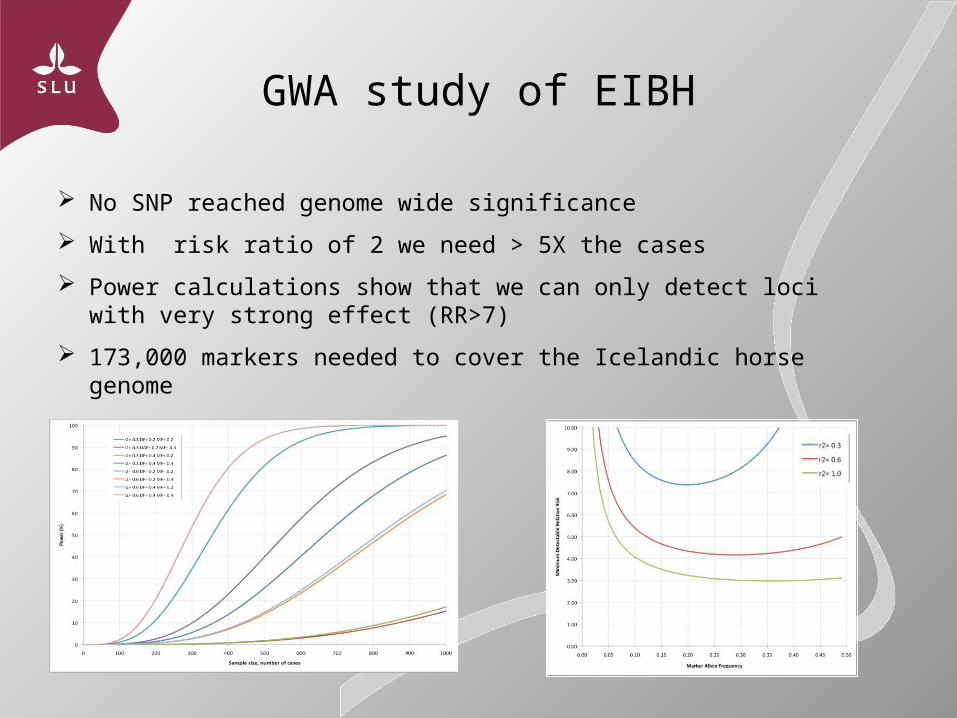
GWA study of EIBH
No SNP reached genome wide significance
With risk ratio of 2 we need > 5X the cases
Power calculations show that we can only detect loci with very strong effect (RR>7)
173,000 markers needed to cover the Icelandic horse genome
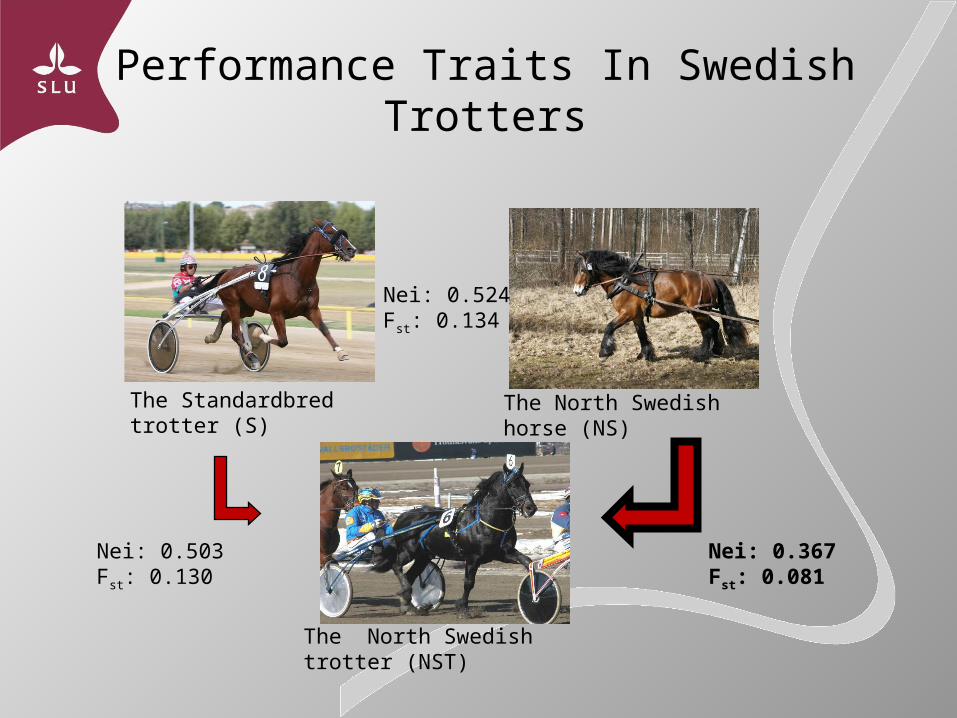
Performance Traits In Swedish Trotters
The Standardbred trotter (S) The North Swedish horse (NS)
Nei: 0.524Fst: 0.134
Nei: 0.503Fst: 0.130
Nei: 0.367Fst: 0.081
The North Swedish trotter (NST)
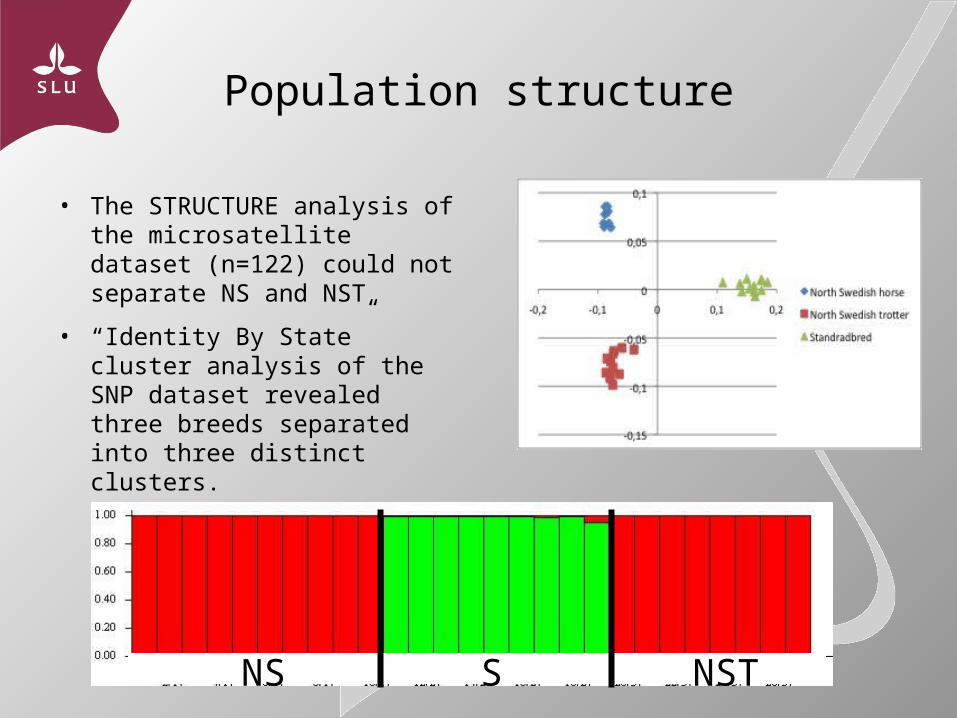
Population structure
• The STRUCTURE analysis of the microsatellite dataset (n=122) could not separate NS and NST
• “Identity By State” cluster analysis of the SNP dataset revealed three breeds separated into three distinct clusters.
NS S NST
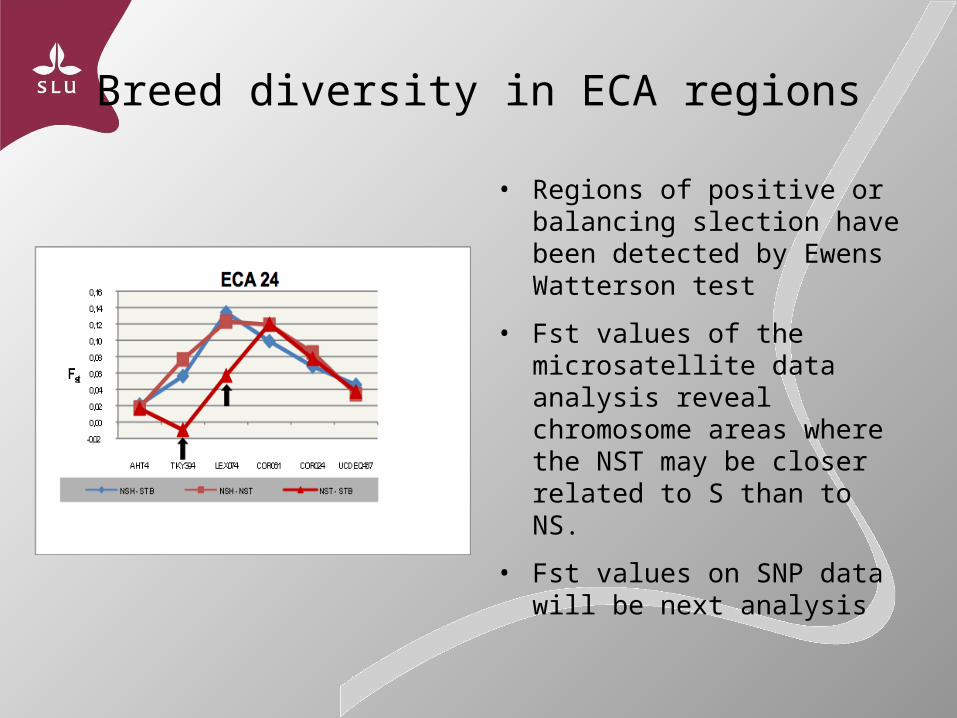
Breed diversity in ECA regions
• Regions of positive or balancing slection have been detected by Ewens Watterson test
• Fst values of the microsatellite data analysis reveal chromosome areas where the NST may be closer related to S than to NS.
• Fst values on SNP data will be next analysis
Funding
Formas
ATG
SSH
Carl Trygger
Helge Axelsson-Johnsson
Strömsholm Animal Hospital
SLU:s Animal Hospital (UDS)
Mälarkliniken Animal Hospital
Collaborators
• Swedish Univ of Agricultural Sciences (SLU):
– Leif Andersson
– Lisa Andersson
– Jeanette Axelsson
– Hans Broström
– Emma Brunberg
– Göran Dalin
– Björn Ekesten
– Susanne Eriksson
– Freddy Fikse
– Katja Grandinsson
– Ingrid Jacobsson
– Gabriella Lindgren
– Jennifer Meadows
– Sofia Mikko
– Aneta Ringholm
– Kaj Sandberg
– Hanna Smedstad
– Gunilla Thyreen
• Norsholms Animal Hospital:– Rebecka Frey
• Östra Greda Research Group:– Marie Sundquist
• Texas A&M:– Gus Cothran
– Rytis Juras
• Michigan State Univ.:– Jessica Eason-Butler
– Susan Ewart
– David Ramsey
• Norwegian School of Veterinary Science:
– Knut Röed