Embed Size (px)
Citation preview

Genomic signatures based on the NCI60 cell lines do notpredict patient response to chemotherapy
Kevin R. Coombes1, Jing Wang1, and Keith A. Baggerly1
1Department of Bioinformatics and Computational Biology, University of Texas M.D. An-derson Cancer Center, Houston TX 77030 USA
We have systematically attempted to use in vitro drug sensitivity data coupledwith Affymetrix microarray data to develop genomic signatures that predictsensitivity to individual chemotherapeutic agents. By randomly selecting celllines, we have found that signatures developed using the most sensitive and mostresistant NCI60 cell lines do not perform better than chance on patient data.Thus, our result fails to reproduce a previous report in Nature Medicine. Wediscuss some of the reasons for this failure, and discuss methods for improvingthe reproducibility of analyses of large data sets.
Predicting whether a tumor will respond well to therapy remains one of the biggestopportunities in clinical oncology, allowing us to realize the promise of personalized treatmentwith improved outcomes and decreased toxicity. Recently, Potti and colleagues 1 publishedan article in Nature Medicine that appeared to offer a significant breakthrough on this front.Using publicly available data, they assembled microarray profiles from the NCI60 cancer celllines with known in vitro sensitivity or resistance to a particular drug. They then used theseprofiles to predict in vivo chemotherapeutic response. They reported good success using thisapproach with seven drugs. Unfortunately, our group has been unable to reproduce theirfindings. The purpose of this paper is to examine the causes of this apparent irreproducibility,and to demonstrate a method for reporting a reproducible analysis of similar data.
Potti and colleagues broadly outlined a plausible strategy for trying to discover andvalidate genomic signatures of drug sensitivity. Conceptually, the plan is straightforward:
1. Cell line selection: Choose cell lines, using dose response data, to represent theextremes of sensitivity and resistance.
2. Feature selection: Select genes to include in a model, using microarray profiles ofthe chosen cell lines, by ranking the genes based on univariate t-tests between sensitiveand resistant cell lines.
3. Model training: Train a probit regression model for predicting sensitivity on the
1
chosen cell lines, using principal components of the selected features as predictors.
4. Model testing: Test the model on an independent data set to determine if the cellline data can predict clinical outcomes.
The challenge is to report the implementation of these steps in sufficient detail that anindependent reader can reproduce—or discover flaws in—the reported analysis. Potti andcolleagues described their methods in words (rather than equations or computer code) inthe published paper and in an online supplement. At each step, when we could not repro-duce their results, we were uncertain if we had correctly interpreted their descriptions. Werepeatedly contacted the authors and obtained clarification, but remained unable to repro-duce their results. For our own analysis, we have made every effort to provide unambiguousdescriptions. In addition, in case our written descriptions fail, the full source code for eachanalysis step is available so that other researchers can reproduce and evaluate our methodscarefully—and, we hope, improve upon them.
Ultimately, we believe that the methods we used are a reasonable interpretation ofthe ones presented by Potti and colleagues. The failure of these methods suggests that theapproach used to interpret genomic signatures based only on the NCI60 cell lines cannot besuccessfully applied in this fashion to predict patient response to chemotherapy.
RESULTS
The GI50 values of their sensitive and resistant cell lines overlap (cell line selec-tion).
In their original paper, Potti and colleagues did not report which cell lines were usedto define individual drug sensitivity signatures. But, in response to inquiries, they kindlyposted additional information on their web site. For docetaxel, they found seven sensitivecell lines:
HL-60(TB), HOP-62, HT29, NCI-H522, SF-539, SK-MEL-2, SK-MEL-5
and seven resistant cell lines:
786-0, CAKI-1, EKVX, IGROV1, OVCAR-4, SN12C, TK-10
2

We have used these cell lines with their software to reproduce the docetaxel heatmap intheir paper (Supplementary Report SR9), confirming that these are the cell lines used intheir analysis.
Here, we are trying to understand how they chose those cell lines, and whether themethod is reproducible. At the Nature Medicine web site∗, Potti and colleagues postedSupplementary Methods (P-SM). In that document, they say: “[W]e chose cell lines . . . thatwould represent the extremes of sensitivity to a given chemotherapeutic agent (mean GI50±1 SD). . .. [T]he log transformed TGI and LC50 dose . . . was then correlated with therespective GI50 data. . .. Cell lines with low GI50 . . . also needed to have a low LC50 andTGI. . ..”
To apply this description, we downloaded the dose response data from the DTP web site(see Methods and Supplementary Report SR1). The web site contains data on three sets ofdose response experiments for docetaxel. These experiments differ based on the (maximum)starting concentration used, which was either 10−4 M, 10−6 M, or 10−7 M. For each of thethree starting concentrations, we began with cell lines whose GI50 values were 1 SD above or1 SD below the mean. We only kept cell lines for which the LC50 and TGI values were bothabove (resp., below) their median levels whenever the GI50 value was above (resp., below)the mean ±1 SD cutoff. Using this interpretation, we found no cell lines that were resistantto docetaxel and only one cell line (COLO 205) that was sensitive. If we weakened the criteriato allow the inclusion of cell lines for which the TGI or LC50 was equal to its median value,then more cell lines were found but none of the experiments produced lists of cell lines thatmatched the ones reported by Potti and colleagues (Supplementary Report SR3).
To improve upon this result, we looked more carefully at the drug response data. Thetwo lower starting concentrations provided no useful information about the LC50 values ofthe cell lines. Moreover, 41 of the 59 cell lines tested have LC50 values greater than thehighest starting concentration of 10−4 M (SR3). As a result, we decided to ignore the LC50data for docetaxel. Similarly, the lower starting concentration experiments were not usefulfor estimating TGI (SR3). So, we used the experiment with starting concentration 10−4 M toestimate TGI values for docetaxel. Both of the lower concentration experiments appeared togive reasonable (although not perfectly congruent) estimates of GI50 values for the responseof cell lines to docetaxel. We averaged these estimates to provide pooled estimates of GI50.
Although the GI50 values appeared to be normally distributed, the TGI values werehighly skewed. Consequently, we chose to work with distribution-free descriptions (i.e., me-
∗http://www.nature.com/nm/journal/v12/n11/extref/nm1491-S9.pdf
3

●
●●
●●
● ●
●
●
●
●
●
●
●
●●
●
●● ●
●●●
●
●
●
●
●
●
●
●
●
●
●
●
●●
●
●
●
●
●
●
●
●
●
●●
●
●
●●
●
●
●
●
6 7 8 9
45
67
8
NLOG GI50
NLO
G T
GI
●
●
●
●
●
●
●
● ●●●
● ●●
●
●
●
SensitiveResistantSensitive (Potti)Resistant (Potti)Other Cell Lines
Sensitivity or resistance to docetaxel
Figure 1: Scatter plot of the negative base-ten logarithm (NLOG) of the GI50 and TGIvalues for 59 cell lines. The observed values were separated into thirds. Genes selected assensitive (resp., resistant) were in the highest (resp., lowest) NLOG concentration third onboth measures.
4
dian and quantile) rather than parametric descriptions (e.g., mean and standard deviation).Specifically, we divided both the GI50 data and the TGI into thirds (Figure 1). Cell linesthat were in the highest third for both negative base-ten log (NLOG) TGI and NLOG GI50concentrations were called sensitive, and cell lines that were in the lowest third for bothNLOG TGI and NLOG GI50 were called resistant. Using these definitions, we found thateight cell lines were sensitive:
COLO 205, HCC-2998, HL-60(TB), HT29, MDA-MB-435, NCI-H522, RPMI-8226, SF-539
and seven cell lines were resistant:
786-0, ACHN, CAKI-1, EKVX, IGROV1, OVCAR-4, SF-268
We found similar results (12 or 13 of the 15 selected lines) using the unpooled GI50 valuesfrom the experiment with starting concentration 10−6 M or 10−7 M to select cell lines.
While our approach generates lists of resistant and sensitive cell lines that are similarin size to the ones selected by Potti’s group, we have poor agreement with the actual linesthey selected, with only 4 or 5 of 7 overlapping. In Figure 1, the NCI60 cell lines are plottedaccording to our TGI and GI50 values. Our cell lines are indicated in color and the Pottigroup’s cell lines are circled. Two of the lines they called sensitive have smaller NLOG GI50values than half of the lines they called resistant. In addition, the most sensitive line (COLO205), based on both GI50 and TGI scores, was not included in their set.
Differentially expressed probe sets vary depending on the microarray data set(feature selection).
Novartis ran each cell line on three Affymetrix U95Av2 microarrays (see Methods).These three sets of replicates can be grouped into series “A”, “B”, and “C” using the labelingsupplied. Examining the data posted on the Duke web site, we determined that Potti andcolleagues selected features from the A series of Novartis experiments (Supplementary ReportSR2), where “a variance fixed t-test was used to calculate significance” (P-SM).
We selected genes that were differentially expressed between the sensitive and resistantcell lines that we chose in the previous section. We used two-sample t-tests to analyze the
5

A, B, and C series, both separately and jointly. In the joint analysis, we first averaged thereplicates and then performed a t-test on the averages. For every analysis, a beta-uniformmixture (BUM) model of the p-values2 showed evidence of substantial differences in geneexpression between the docetaxel-sensitive cell lines and the docetaxel-resistant cell lines. Intheir published analysis, Potti and colleagues selected the 50 most significant genes to usein model building. The number of genes they selected varied for different chemotherapeuticagents, and criteria for choosing these numbers were not given. Following their lead, weselected the 50 most significant genes from each analysis.
The sets of top 50 genes varied from data set to data set; the numbers of genes in theintersections are listed in Table 1. Using the BUM model to estimate the false discoveryrate (FDR)2,3, we found that the 50 genes from the series A experiments correspond toFDR = 4.0%; series B, FDR = 13.0%; series C, FDR = 28.4%; and the average analysis,FDR = 7.9%. As a result, we decided to use both the list of 50 genes selected from theaverage data and the 50 from Series A for our further analysis.
We repeated this analysis using the cell lines chosen by Potti and colleagues. The vari-ability of the gene lists was comparable (Supplementary Report SR4). Potti and colleaguesalso provided lists of the features selected for each drug treatment, indexed by Affymetrixprobe set ID and annotated with gene names, symbols, and descriptions. These lists areavailable on the Nature Medicine web site as Supplementary Table 1. The lists as initiallyreported are wrong, because of an off-by-one indexing error that we discovered (Supplemen-tary Report SR9). After correcting for this error, their list of genes for docetaxel has 29 genesin common with the Series A list we derived using the cell lines that they chose, and 33 oftheir 50 reported genes have small enough p-values that minor changes in the normalizationprocedure could account for the difference. The remaining 17 genes, however, have largep-values in our analysis, and we cannot explain how they were selected.
The first principal component suffices to separate resistant from sensitive celllines (model training).
In P-SM, Potti and colleagues wrote: “The individual drug sensitivity and resistancedata from the selected solid tumor NCI60 cell lines was then used in a supervised analysisusing binary regression methodologies . . . to develop models predictive of chemotherapeuticresponse. . .. Each signature summarizes its constituent genes as a single expression profile,and is here derived as the top principal component of that set of genes.”
We used singular value decomposition (SVD) to perform principal component analysis
6

(PCA) on the cell lines and features that we selected, using all replicates in the Novartisdata. We used an implementation of the algorithm in version 1.3 of the ClassComparison
package that is part of a suite of tools for Object-Oriented Microarray and Proteomic Analysis(OOMPA) in R, which we developed and which is available from our web site†. Based ona plot of the first two principal components (Figure 2), the first principal component byitself is more than adequate to completely separate the resistant from the sensitive lines.This finding is consistent with the description of the methods in the paper by Potti andcolleagues.
We then built a binary probit prediction model using all components except the first totry to predict sensitivity in the selected NCI60 cell lines. None of the higher components werestatistically significant; the smallest individual p-value was 0.292 (Supplementary ReportSR5). We then built another predictive model, including the first principal component, andusing the Akaike Information Criterion (AIC) in a step-wise procedure to select the bestmodel incorporating multiple principal components. Only the first principal component wasincluded in the model (SR5). We repeated this entire analysis using features selected fromthe Novartis Series A experiments, and also did the same thing using the cell lines chosenby Potti and colleagues. The results were comparable (SR5).
The predictions do not validate on a clinical breast cancer data set (model test-ing).
Potti and colleagues wrote: “Chang and colleagues have published expression . . . dataand objective response information to docetaxel. Of the 24 patients reported in their study,there were 13 patients with docetaxel sensitivity and 11 patients with resistance. Thisdataset was used to validate the in vitro predictive model and generate a complementaryin vivo model. . .. Gene selection and identification is based on the training data, and thenmetagene values are computed using the principal components of the training data andadditional cell line or tumor expression data. Bayesian fitting of binary probit regressionmodels to the training data then permits an assessment of the relevance of the metagenesignatures” (P-SM; emphasis added).
We downloaded the Chang breast cancer data set (GSE349 and GSE350) from the GeneExpression Omnibus (GEO) web site (Supplementary Report SR6). Interestingly, the Changpaper4 states that there were 13 resistant and 11 sensitive patients (which is the opposite ofthe numbers used by Potti). Moreover, the data in GEO seems to contain 14 resistant and10 sensitive samples. Susan Hilsenbeck (personal communication) has informed us that one
†http://bioinformatics.mdanderson.org/software.html
7

sample (#377, GSM4913) was misidentified as resistant when uploaded to GEO, confirmingthe numbers from the original article.
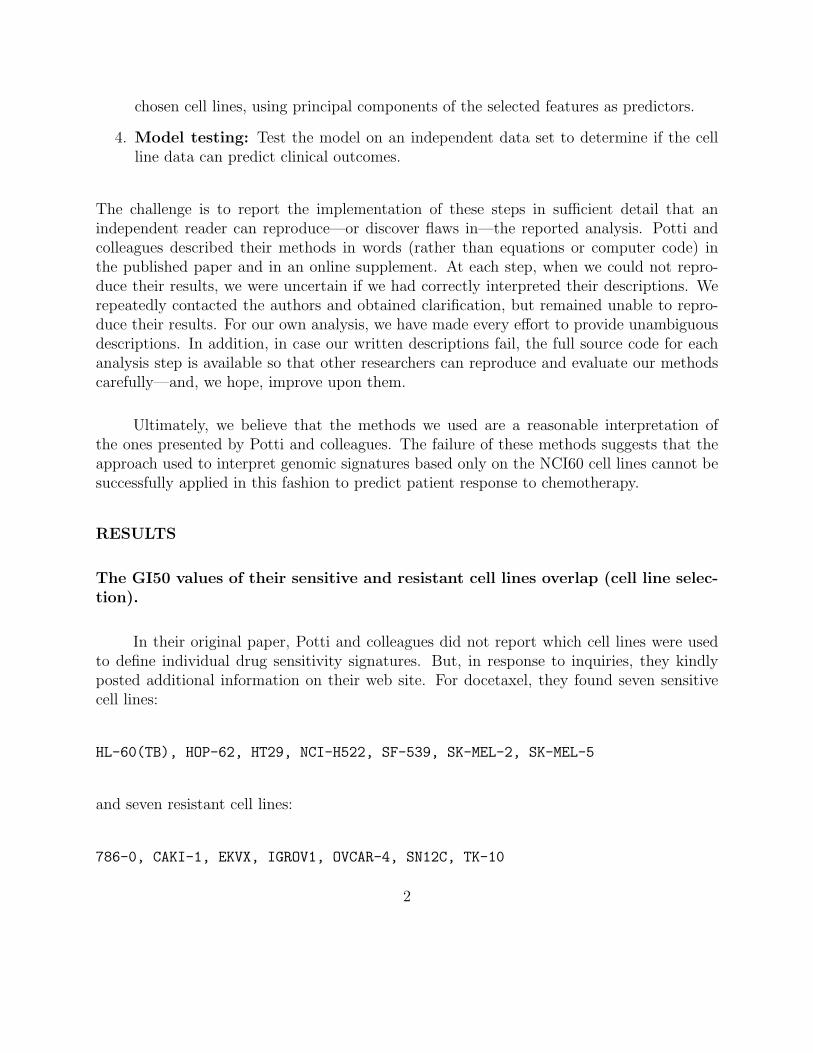
The Chang data was originally processed using DNA Chip Analyzer (dChip) using thePM −MM algorithm developed by Li and Wong.5 We processed the CEL files ourselves,using dchip2006.exe and the PM -only model. We performed quantile normalization tomap the feature intensity distributions in the Chang data onto the same quantiles used tonormalize the NCI60 cell line data. We then projected the breast tumor samples from theChang study onto the principal component (PC) space defined by the docetaxel sensitive andresistant NCI60 cell lines (Figure 2). The tumor samples were projected into the center ofthe PC space (largely intermediate between the sensitive and resistant cell lines). Moreover,the sensitive tumor samples almost completely overlap the resistant tumor samples, showingno signs of separation and being effectively randomly distributed. This figure suggested thatno prediction method based on the first (or even the first and second) principal componentfrom the cell line data could possibly make accurate predictions on the breast tumor data.
To test this, we applied the predictive probit binomial models based on (i) just the firstand (ii) the optimal set of principal components chosen from the NCI60 data using AIC.Both results were the same, and were not very convincing (Table 2). We performed similaranalyses using models based on all combinations of (a) the cell lines we chose or the celllines Potti and colleagues chose; (b) features selected from the Novartis A arrays or fromthe averaged Novartis data; and (c) using our quantifications of the Chang CEL files or theposted quantifications from GEO. None of these eight variants produced results comparableto the ones reported in the paper by Potti and colleagues (Supplementary Report SR7).
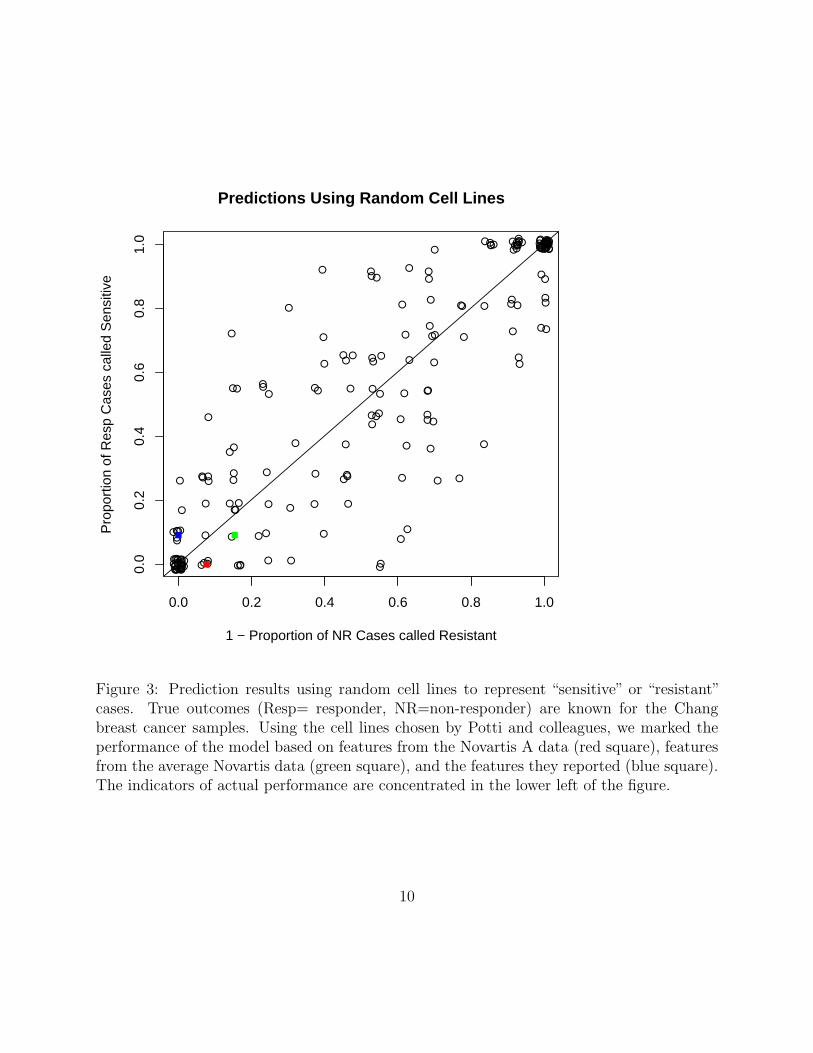
The predictions are no better than those made using random cell lines.
At the heart of the paper by Potti and colleagues is the hypothesis that selectingcell lines that represent the extremes of sensitivity and resistance by multiple measuresshould make it possible to discover genomic signatures of chemotherapeutic response. Thishypothesis can be tested by selecting the same number of cell lines randomly, arbitrarilylabeling them as “sensitive” or “resistant”, and then applying the same methods to discoverand validate signatures.
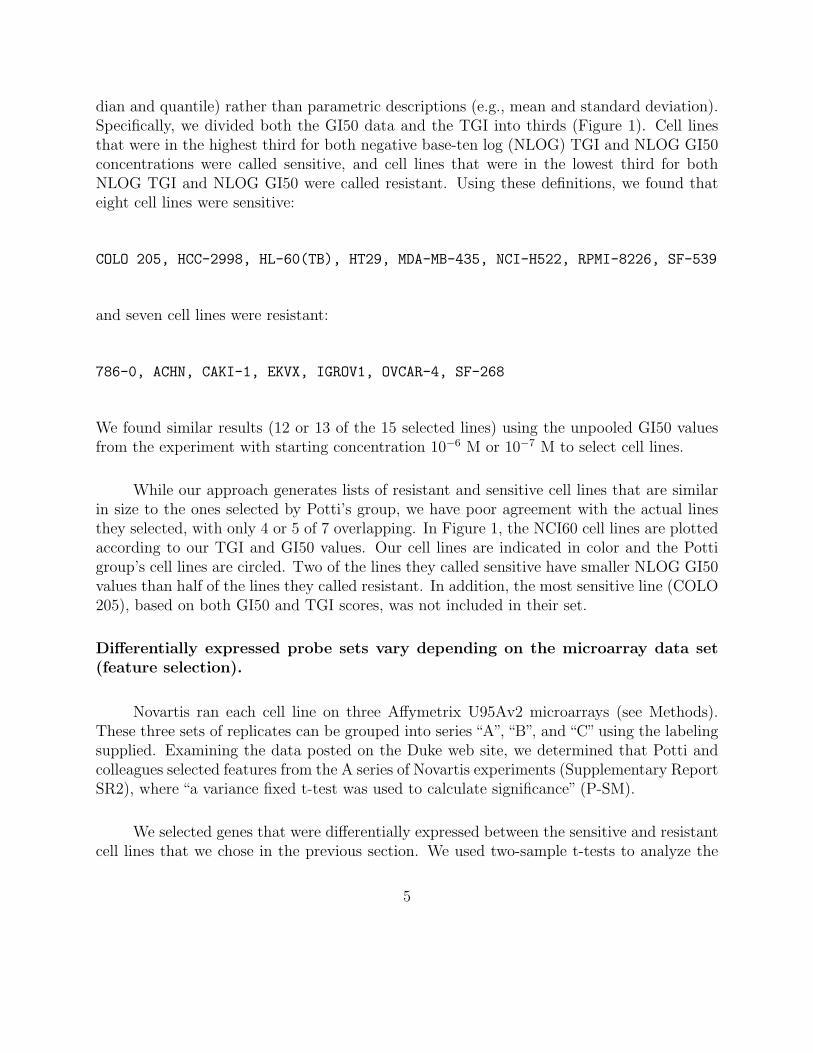
We performed this random cell line selection 200 times, selecting 7 cell lines to callresistant and 7 to call sensitive. The results are displayed in Figure 3, which is analogousto the usual plot of an ROC curve. We can summarize the performance of models derivedfrom each set of random cell lines using the average of the two proportions, which can be
8

−10 −5 0 5 10
−5
05
Projecting Test Data Into Training Space
Component 1
Com
pone
nt 2
●●
●
●
● ●
●
●
●●
●
●●
● ●●
●
●
●●
●
●
●
●
●
●
NCI60 SensitiveNCI60 ResistantChang Sensitive (Resp)Chang Resistant (NR)
Figure 2: Plot of the first two principal components from the NCI60 training set, into whichthe Chang validation set has been projected.
9
0.0 0.2 0.4 0.6 0.8 1.0
0.0
0.2
0.4
0.6
0.8
1.0
Predictions Using Random Cell Lines
1 − Proportion of NR Cases called Resistant
Pro
port
ion
of R
esp
Cas
es c
alle
d S
ensi
tive
●
●
●
●
●
●
●
●
●
● ●
●
●
●
●
●
●
●
●
●
●
●
●●
●
●
●
●
●
●
●
●●
●
●
●
●●
●●●
●
●
●
●
●
●
●
●
●
●
●
●●
●
●
●
●
●
●
●
●
●
●
●
●
●
●
●
●
●
●
●
●
●
●
●
●
●
●
●
●
●
●
●
● ●
● ●
●
●●●
●
●
●
● ●
●
●
●
●
●●
●● ●
●●
●
●
●
●
●
●
●
●●
●
●
●
●
●
●●
●
●
●
●
●
●
●
●
●
●
●
●
●
●
●
●
●
●●
●●
●
●
●
●
●
●
●
●
●
●
●
●
●
●
●●
●
●
●
●
●
●
●
●
●
●
●
●
●
●
●
●
●
●
●
●
●
●
●
●●
●●●●
●
●●
●
●●
●
●
●
Figure 3: Prediction results using random cell lines to represent “sensitive” or “resistant”cases. True outcomes (Resp= responder, NR=non-responder) are known for the Changbreast cancer samples. Using the cell lines chosen by Potti and colleagues, we marked theperformance of the model based on features from the Novartis A data (red square), featuresfrom the average Novartis data (green square), and the features they reported (blue square).The indicators of actual performance are concentrated in the lower left of the figure.
10

interpreted either as the expected accuracy or as the area under an ROC curve (AUC) onwhich we have only observed one point. The fraction of random data sets with larger AUCvalues provides an empirical p-value for the observed performance. In the case of featuresselected using the Novartis A data on the cell lines chosen by Potti and colleagues, thisp-value is 0.74 (Supplementary Report SR8).
Their software may use information from the test set while training the model.
We were puzzled by the disparities between our findings and those reported by Potti andcolleagues. We were also concerned by the phrase emphasized above, which suggested thatinformation from“additional cell line or tumor expression data”was used during training. Tounderstand what this meant, we reviewed the MATLAB source code from the software thatPotti and colleagues posted on the Duke web site. This code performed SVD on the trainingand test data combined. The Duke group also provided a newer experimental version of thecode, which performed SVD on the training data alone, as we did above.
We first ran both versions of their software using just their reported cell line training setsfor the 7 drugs studied in their original paper. The results were the same for both versions ofthe software. We perfectly matched 6 of the published heatmaps; the exception was cytoxanwhich we could not match at all. We also perfectly matched the list of reported features (aftercorrecting for the off-by-one error) for three drugs (5-fluorouracil, topotecan, and etoposide)and matched 75/80 for adriamycin, 28/35 for paclitaxel, and 31/50 for docetaxel (SR9).We cannot explain the disparities in the feature lists, since the accompanying heatmaps areidentical. Of the 19 unexplained genes for docetaxel that appear on their reported list, 14are listed as useful discriminators in the supplement to the paper by Chang and colleagues.4
We then tried to reproduce their predictions for the Chang test data using their selectedNovartis A cell line data for training (Figure 4). The top panels of the figure show the twoprincipal components that are most significant in a model built to separate sensitive (blue)from resistant (red) cell lines. The bottom panels show the predicted probability of resistanceon the test data.
When only the training data is used in the SVD (experimental software; right panels),the first principal component (Factor 1, y-axis) is the most important factor for separatingthe two groups. However, the predictions on the test data for this model put all the samplesin the same category, providing no power to separate responders from non-responders. Thesefindings are consistent with our own analysis presented above.
11

By contrast, when both training and test data are used in the SVD (original software;left panels), the second principal component (Factor 2, y-axis) becomes the most important.Using this model, the predictions appear to separate the test samples. Performing the SVDon the joint data set has produced a drastically different model. The model apparentlychanges because information from the test samples “leaks” into the model during fitting.
DISCUSSION
Niels Bohr reportedly quipped that “Prediction is hard, especially when it involves the fu-ture.” In the realm of medical applications of microarrays, we believe that he has a validpoint. Developing a predictive model from one microarray study and applying it successfullyto an independent microarray study is very difficult. The difficulty arises, in part, becausethe analysis is inherently complex, requiring a complicated sequence of steps with numerouschoices of algorithms and parameters at each step. These analyses are also extremely fragile,in the sense that a single error at any one of the steps can invalidate the conclusions. Ofcourse, complexity by itself need not lead to fragility. Living cells, for instance, are highlycomplex, but they manage to respond succesfully to rapidly changing environmental condi-tions. Cells and organisms rely on feedback loops, alternate pathways, and homeostasis toachieve a level of robustness that appears to be lacking, as yet, in the analysis of large datasets.
In order to provide feedback on analyses, published results must be reviewed with an eyetoward their reproducibility. In the present instance, we found that relying on the writtendescription of the methods, either in the published paper or in the online SupplementaryMethods, compounded the difficulties. When we could not reproduce the published results,it was initially unclear if those results were wrong or if we were simply misinterpreting ormisunderstanding the descriptions of the methods. We repeatedly contacted the authors andobtained clarification, but were still unable to reproduce their results.
For our own analysis, we have taken what is, perhaps, an extreme view on reproducibil-ity. Our analysis was performed using Sweave, a package that allows analysts to combine thesource code (in R, a statistical programming enviroment6) and the documentation (in LaTeX,a software tool for text preparation7) in the same file. Our source code is freely available;anyone can download it and run it. Moreover, running the code not only reproduces theresults; it also generates the figures, tables, and a complete PDF version of this manuscript.
12

Figure 4: PCA plots for docetaxel training data (top; blue = sensitive, red = resistant)and prediction probabilities on test data (bottom). Panels on the left are from the originalversion of the software, which performs SVD on the combined training and test data. Panelson the right are from an experimental version of the software, which performs SVD only onthe training data.
13
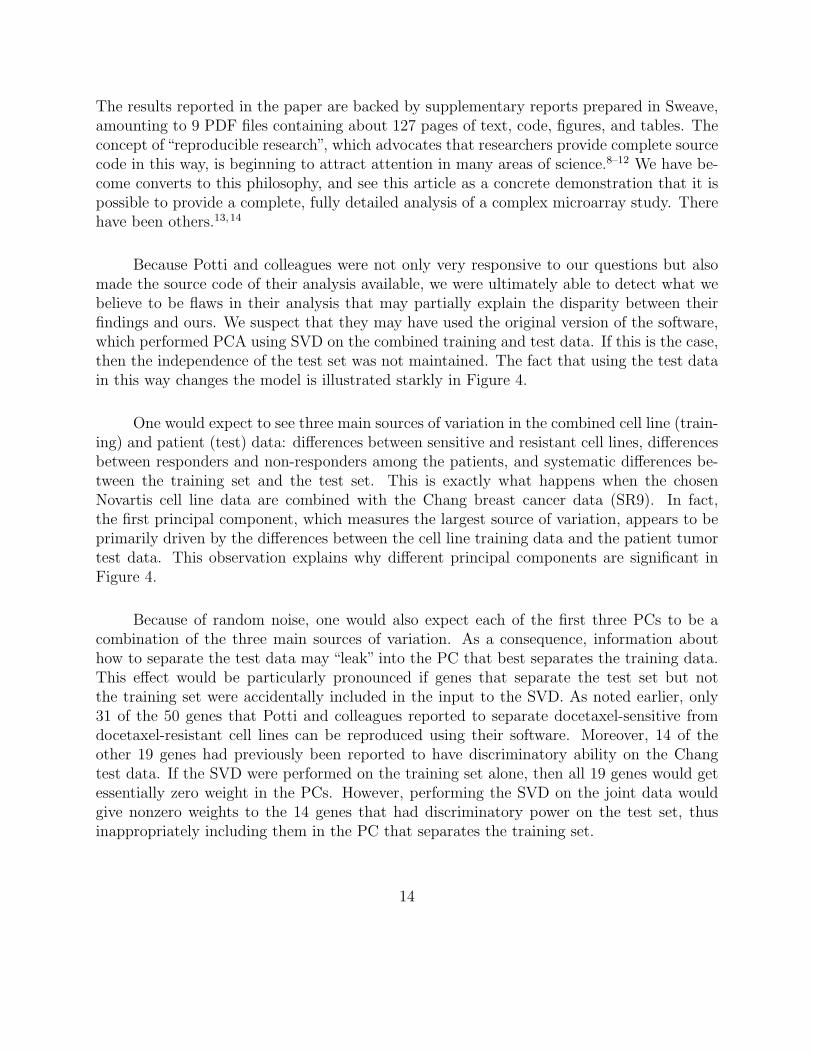
The results reported in the paper are backed by supplementary reports prepared in Sweave,amounting to 9 PDF files containing about 127 pages of text, code, figures, and tables. Theconcept of “reproducible research”, which advocates that researchers provide complete sourcecode in this way, is beginning to attract attention in many areas of science.8–12 We have be-come converts to this philosophy, and see this article as a concrete demonstration that it ispossible to provide a complete, fully detailed analysis of a complex microarray study. Therehave been others.13,14
Because Potti and colleagues were not only very responsive to our questions but alsomade the source code of their analysis available, we were ultimately able to detect what webelieve to be flaws in their analysis that may partially explain the disparity between theirfindings and ours. We suspect that they may have used the original version of the software,which performed PCA using SVD on the combined training and test data. If this is the case,then the independence of the test set was not maintained. The fact that using the test datain this way changes the model is illustrated starkly in Figure 4.
One would expect to see three main sources of variation in the combined cell line (train-ing) and patient (test) data: differences between sensitive and resistant cell lines, differencesbetween responders and non-responders among the patients, and systematic differences be-tween the training set and the test set. This is exactly what happens when the chosenNovartis cell line data are combined with the Chang breast cancer data (SR9). In fact,the first principal component, which measures the largest source of variation, appears to beprimarily driven by the differences between the cell line training data and the patient tumortest data. This observation explains why different principal components are significant inFigure 4.
Because of random noise, one would also expect each of the first three PCs to be acombination of the three main sources of variation. As a consequence, information abouthow to separate the test data may “leak” into the PC that best separates the training data.This effect would be particularly pronounced if genes that separate the test set but notthe training set were accidentally included in the input to the SVD. As noted earlier, only31 of the 50 genes that Potti and colleagues reported to separate docetaxel-sensitive fromdocetaxel-resistant cell lines can be reproduced using their software. Moreover, 14 of theother 19 genes had previously been reported to have discriminatory ability on the Changtest data. If the SVD were performed on the training set alone, then all 19 genes would getessentially zero weight in the PCs. However, performing the SVD on the joint data wouldgive nonzero weights to the 14 genes that had discriminatory power on the test set, thusinappropriately including them in the PC that separates the training set.
14

Because these combinations can be driven by random noise, it is also possible thatone can get “better than chance” predictions that point the wrong way. This appears tohave happened in the paper by Potti and colleagues. Their Figure 2c, center panel, containspredictions for a set of pediatric patients with acute lymphocytic leukemia (ALL) treatedwith “adriamycin” (actually, daunorubicin; see GEO datasets GSE650 and GSE651, whichPotti and colleagues1 list as their data source on page 1296). That figure shows 99 resistantsamples and 23 sensitive samples. The paper that originally reported on these samples15,consistent with our knowledge about the success rate for treating pediatric ALL, claims thatthere are 28 resistant and 94 sensitive samples.
The important question, however, is not whether the analysis by Potti and colleagueswas flawed, but whether it is possible to learn genomic signatures of chemoresponse fromthe NCI60 cell lines and apply them to predict which patients will respond to chemotherapy.In this article, we have shown that a specific analytical approach does not work. Otherapproaches, which may use a more sophisticated method for feature selection or an alternativealgorithm for training models, might conceivably work. Critically, we have also employed amethod for testing other approaches. The method of comparing cell lines chosen based onthe dose response data to random cell lines can be used to compute empirical p-values forany statistical method that claims to build predictive models.
We have not shown that it is impossible to take signatures from any cell lines and applythem to human samples. We do, admittedly, find it biologically implausible that a signaturederived from a relatively small set of cell lines (like the NCI60) that spans numerous tissuetypes could produce a robust chemosensitivity signature that would be visible above thevariability arising from the heterogeneity of tissue origins. We do think it possible, however,that a signature derived from a large panel of non-small-cell lung cancer cell lines could berelevant for predicting response in lung cancer patients, for example.
METHODS
Public data sources. Table 3 lists the data sets that were used by Potti and colleagues,along with links to the web sites where they could be located as of December, 2006. Notethat the web site at http://data.cgt.duke.edu/Combo1.php, which is referenced in thesupplementary material on the Nature Medicine web site, has since been removed, and dif-ferent files have been posted at http://data.cgt.duke.edu/NatureMedicine.php. In thisarticle, we used (i) individual array data from replicated Novartis experiments on the NCI60cell lines using Affymetrix U95Av2 microarrays as training data, and (ii) the neoadjuvantbreast tumor data set from the Lancet article by Chang and colleagues4 as test data. Note
15

that the Novartis data set, as of December 2006, contains an error: the data for probe set“100 g at” is duplicated; we removed the duplicate before starting our analysis (SR1).
We also used the summary table data on 50% growth inhibition (GI50), total growthinhibition (TGI), and 50% lethal concentration (LC50) from the website of the DevelopmentalTherapeutics Program (DTP) at the National Cancer Institute (NCI). The drug responsedata from this source is indexed by NSC number, not by the name of the compound. Table 4lists the NSC numbers and the names of the drugs studied by Potti and colleagues. In thisreport, we focus on docetaxel (taxotere), whose NSC number is 628503.
Statistical analysis. All analysis was performed using version 2.4.0 of the statistical pro-gramming environment R6 on a machine with four Xeon 2.80 GHz CPUs and 3.5 GB ofRAM, running Windows XP with Service Pack 2. We also used the R packages xtable
(version 1.4-2), cluster (version 1.11.2), and colorspace (version 0.9), which are availablefrom the Comprehensive R Archive Network (http://cran.r-project.org/). We used threeR packages from BioConductor (http://www.bioconductor.org/); these were Biobase (ver-sion 1.12.2), affyio (version 1.2.0), and affy (version 1.12.0). Finally, we used version 1.3of the packages oompaBase, PreProcess, ClassDiscovery and ClassComparison from theObject-Oriented Microarray and Proteomic Analysis project (available from our web site,http://bioinformatics.mdanderson.org/software.html).
The binreg software from the Duke web site was run using version 7.0.1 of MATLAB(The Mathworks Inc., Natick MA) on a 1GHz PowerPC G4 Mac PowerBook laptop runningMac OS X version 10.3.9. The Chang breast cancer data was processed using the defaultsettings for the PM -only model in the DNA Chip Analyzer (dchip2006.exe; available fromhttp://biosun1.harvard.edu/complab/dchip/).5
The complete Sweave source code for this analysis is available at the web site
http://bioinformatics.mdanderson.org/Supplements/ReproRsch-Chemo/index.html.
All additional parameter settings for the software used in the analysis are specified in thesource code.
ACKNOWLEDGEMENTS
We sincerely thank Dr. Anil Potti and Dr. Joseph Nevins of Duke University for their
16

patient cooperation while we asked them numerous questions about their analysis. Theywere consistently open and forthcoming, making every effort to supply us with the detailswe requested. Our failure to reproduce their results, in the face of their good faith effortto help us, points out the inherent difficulties in describing these kinds of analyses withoutsupplying source code.
We thank Zoltan Szallasi, Jane Fridlyand, Lajos Pusztai, Gordon Mills, and DavidStivers for helpful discussions during this work. We also thank Sarah Edmonson for herdetailed comments on an early draft of the manuscript.
This work was partially supported by NIH/NCI grants P50-CA116199, P50-CA070907,and P50-CA083639.
17
1. Potti, A., et al. Genomic signatures to guide the use of chemotherapeutics. Nat Med12, 1294–300 (2006).
2. Pounds, S., Morris, S.W. Estimating the occurrence of false positives and false negativesin microarray studies by approximating and partitioning the empirical distribution ofp-values. Bioinformatics 19, 1236–42 (2003).
3. Benjamini, Y., Hochberg, Y. Controlling the false discovery rate: a practical and pow-erful approach to multiple testing. JRSS (B) 57, 289–300 (1995).
4. Chang, J.C., et al. Gene expression profiling for the prediction of therapeutic responseto docetaxel in patients with breast cancer. Lancet 362, 362–9 (2003).
5. Li, C., Wong, W.H. Model-based analysis of oligonucleotide arrays: expression indexcomputation and outlier detection. Proc Natl Acad Sci U S A 98, 31–6 (2001).
6. R Development Core Team. R: A Language and Environment for Statistical Computing(R Foundation for Statistical Computing, Vienna, Austria, 2006).
7. Lamport, L. LaTeX: A document preparation system (Addison Wesley, Boston, 1994).
8. Laine, C., Goodman, S.N., Griswold, M.E., Sox, H.C. Reproducible research: movingtoward research the public can really trust. Ann Intern Med 146, 450–3 (2007).
9. Leisch, F., Rossini, A.J. Reproducible statistical research. Chance 16, 46–50 (2003).
10. Buckheit, J., Donoho, D.L. Wavelab and reproducible research. In: A. Antoniadis, ed.,Wavelets and Statistics (Springer-Verlag, Berlin,. New York, 1995).
11. Schwab, M., Karrenbach, M., Claerbout, J. Making scientific computations reproducible.Computing in Science and Engineering 2, 61–67 (2000).
12. Peng, R.D., Dominici, F., Zeger, S.L. Reproducible epidemiologic research. AmericanJournal of Epidemiology 163, 783–789 (2006).
13. Gentleman, R. Reproducible research: a bioinformatics case study. Stat Appl Genet MolBiol 4, Article 2 (2005).
14. Mansmann, U., Ruschhaupt, M., Huber, W. Reproducible statistical analysis in mi-croarray profiling studies. Methods Inf Med 45, 139–45 (2006).
15. Holleman, A., et al. Gene-expression patterns in drug-resistant acute lymphoblasticleukemia cells and response to treatment. N Engl J Med 351, 533–42 (2004).
18

16. Gyorffy, B., et al. Gene expression profiling of 30 cancer cell lines predicts resistancetowards 11 anticancer drugs at clinically achieved concentrations. Int J Cancer 118,1699–712 (2006).
17. Gemma, A., et al. Anticancer drug clustering in lung cancer based on gene expressionprofiles and sensitivity database. BMC Cancer 6, 174 (2006).
18. Rouzier, R., et al. Breast cancer molecular subtypes respond differently to preoperativechemotherapy. Clin Cancer Res 11, 5678–85 (2005).
19. Rouzier, R., et al. Microtubule-associated protein tau: a marker of paclitaxel sensitivityin breast cancer. Proc Natl Acad Sci U S A 102, 8315–20 (2005).
19

Table 1: Size of the overlap in the top 50 genes using different sets of replicate microarrays.Average A B C
Average 50 12 17 10A 12 50 7 4B 17 7 50 7C 10 4 7 50
Table 2: Predictions of sensitivity or resistance on the test samples using the optimal set ofprincipal components (Resp = responder, NR = non-responder).
NR RespResistant 3 1Sensitive 10 10
20

Table 3: Data sets and sources used in the paper by Potti et al.
Data Set Platform Web SiteNCI60 Drug Response http://dtp.nci.nih.gov/docs/cancer/cancer data.html
(Oct 2006 release)NCI60 expression, Novartis U95Av2 http://dtp.nci.nih.gov/mtargets/download.html24 breast tumors, docetaxel4 U95Av2 GSE349, GSE350, GDS36017 lung, 13 ovarian cell lines16 U133A http://www.mrw.interscience.wiley.com/jpages
/0020-7136/suppmat/ijc.21570.html29 lung cancer cell lines17 U133A GSE4127Adriamycin treated ALL 15 U133A GSE650, GSE65151 breast tumor, TFAC18,19 U133A http://data.cgt.duke.edu/Combo1.php45 breast tumor, FAC U95Av2 subset of GSE3143171 breast tumor U95Av2 GSE314391 lung tumor U133Plus2.0 GSE3141119 ovarian tumor U133A GSE3149binreg (MATLAB) software http://data.cgt.duke.edu/Combo1.php
Table 4: NSC numbers of drugs studied by Potti and colleagues.
NSC Number Drug628503 Docetaxel (Taxotere)123127 Adriamycin (Doxorubicin)26271 Cytoxan (Cyclophosphamide)141540 Etoposide125973 Paclitaxel (Taxol)19893 5-Fluorouracil609699 Topotecan
21