Embed Size (px)
Citation preview

PONTIFICIA UNIVERSIDAD CATOLICA DE CHILE
ESCUELA DE INGENIERIA
GENOME-SCALE METABOLIC
MODELING OF THE HUMAN MILK
OLIGOSACCHARIDE UTILIZATION
METABOLISM BY BIFIDOBACTERIUM
LONGUM SUBSP. INFANTIS
LORETO ANDREA ROMÁN LAGOS
Thesis submitted to the Office of Research and Graduate Studies in partial
fulfillment of the requirements for the Degree of Master of Science in
Engineering
Advisor:
DANIEL GARRIDO CORTÉS
Santiago de Chile, (September, 2021)
2021, Loreto Román
ii
PONTIFICIA UNIVERSIDAD CATOLICA DE CHILE
ESCUELA DE INGENIERIA
GENOME-SCALE METABOLIC MODELING OF
THE HUMAN MILK OLIGOSACCHARIDE
UTILIZATION METABOLISM BY
BIFIDOBACTERIUM LONGUM SUBSP.
INFANTIS
LORETO ANDREA ROMÁN LAGOS
Members of the Committee:
DANIEL GARRIDO C.
PEDRO SAA H.
ANGÉLICA REYES J.
LUIS ALARCÓN C.
Thesis submitted to the Office of Research and Graduate Studies in partial
fulfillment of the requirements for the Degree of Master of Science in
Engineering
Santiago de Chile, (September, 2021)

iii
(To my parents, my husband, and my
sons, thank you all for your support)

iv
ACKNOWLEDGEMENTS
I want to thank my supervisor Daniel Garrido for all his support during the elaboration of
this thesis, and overall, during the process of getting this master.
I also want to thank my parents for all their unconditional love and support throughout
these difficult years.
Special thanks to my husband Jurgen Heysen, for being a thoughtful partner and loving
parent to our kids.
Finally, I want to thank my sons Joaquín and Mathias for being my most unconditional
cheerleaders and the reason for doing this master.
INDEX
Pg.
DEDICATION ............................................................................................................. ii
ACKNOWLEDGEMENTS ........................................................................................ iv
Table index ................................................................................................................. vii
Figures index ............................................................................................................. viii
RESUMEN .................................................................................................................. ix
ABSTRACT ................................................................................................................. x
1. Introduction ......................................................................................................... 1
1.1. Carbohydrate Metabolism in Bifidobacterium ........................................... 1
1.2. Human Milk Oligosaccharides: Characteristics and Utilization ................ 3
1.3. Importance of Genome-Scale Metabolic Models ....................................... 4
1.4. Motivation .................................................................................................. 5
1.5. Hypothesis and Objectives ......................................................................... 5
1.5.1. Hypothesis........................................................................................ 5
1.5.2. Objectives ........................................................................................ 5
2. Materials and Methods........................................................................................ 6
2.1. iLR554 metabolic network reconstruction ................................................. 6
2.2. Biomass reaction ........................................................................................ 7
2.3. Growth simulation by flux balance analysis (FBA) ................................... 7
2.4. Validation of model expansion .................................................................. 9
2.5. Identification of essential genes ................................................................. 9
2.6. Transcriptomic integration ......................................................................... 9
2.7. Flux distribution maps and gene expression maps ................................... 10
3. Results ............................................................................................................... 11
3.1. Reconstruction and curation of a genome scale metabolic model for B. longum
subsp. infantis ........................................................................................... 11
3.2. Model validation: inputs and outputs ....................................................... 14
3.3. Comparison of central metabolism of iLR554 for each carbon source .... 16
3.4. Transcriptomic integration with metabolic modeling .............................. 22
3.5. Essential genes and reactions ................................................................... 30
4. Discussion ......................................................................................................... 35
4.1. Difficulties of constructing GSMMs ........................................................ 35
4.2. Comparison to other Bifidobacterium reconstructions ............................. 36
4.3. What we have learnt ................................................................................. 37
5. Conclusions ....................................................................................................... 38
Bibliography ............................................................................................................... 39
Appendix .................................................................................................................... 46
Appendix A: Medium composition ............................................................................ 47
Appendix B: RPKM distribution for each carbon source .......................................... 49
Appendix C: Genes that Should be expressed ........................................................... 55
Appendix D: Predicted Essential Genes..................................................................... 57
Appendix E: GIMME maps ....................................................................................... 62
Appendix F: Flux vs. RPKM correlation ................................................................... 66

vii
TABLE INDEX
Pg.
Table III-1: Summary of reactions for major steps in the curation process. ....................... 13 Table III-2: Experimental and in silico growth rates by FBA before RNA seq integration
for B. infantis using different carbon sources. .................................................................... 14 Table III-3. Production of major metabolites (mmol gDW-1hr-1) before transcriptomic
integration............................................................................................................................ 15 Table III-4: Experimental (Garrido et al., 2013) and in silico growth rates after RNA seq
integration for B. infantis using different carbon sources ................................................... 23 Table III-5: Production of major metabolites (mmol gDW-1hr-1) after transcriptomic
integration............................................................................................................................ 23 Table III-6: Number of genes for all six substrates predicted by single-gene knockout to be
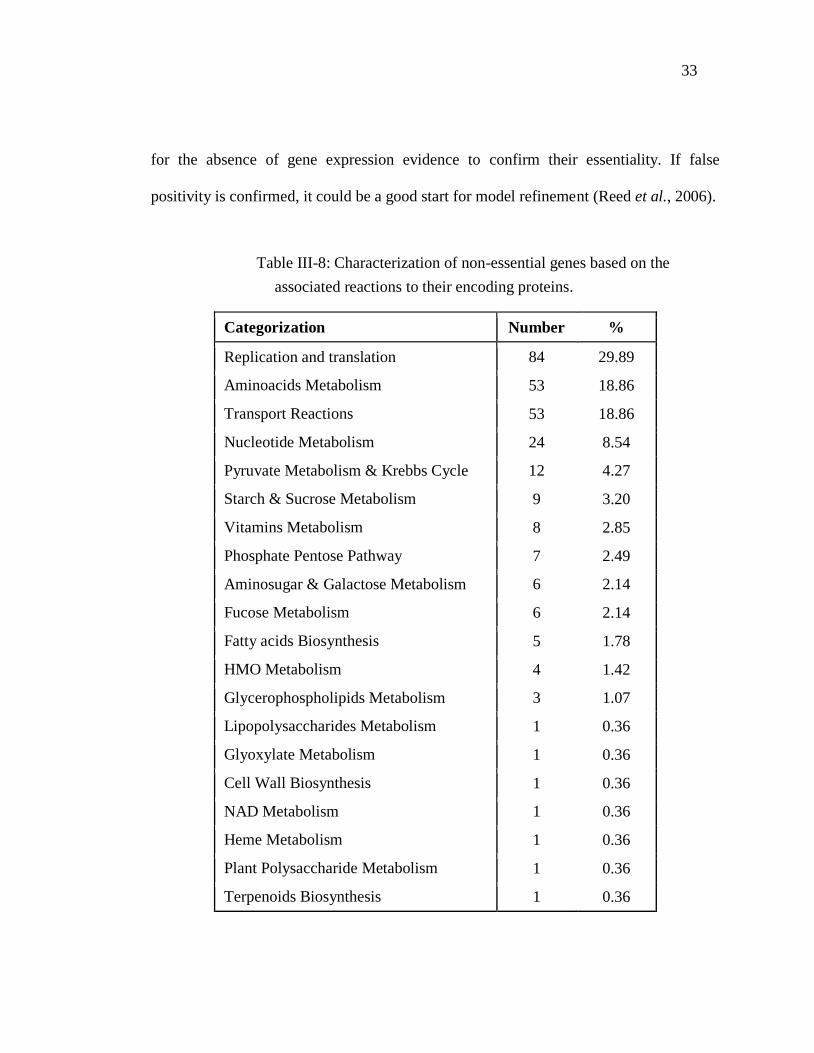
essential, non-essential or non-lethal with reduced growth. ............................................... 31 Table III-7: Characterization of essential genes based on the associated reactions to their
encoding proteins. ............................................................................................................... 32 Table III-8: Characterization of non-essential genes based on the associated reactions to
their encoding proteins. ....................................................................................................... 33 Table A.1: Metabolites present in simulated modified MRS. ............................................. 47 Table C-1: Reactions that should be expressed based on transcriptomics data. ................. 55 Table D-1: Essential genes with reactions associated and subsystems. .............................. 57

viii
FIGURES INDEX
Pg.
Figure 1-1: Carbohydrate metabolism network map with bifid shunt reactions in B.
infantis. .................................................................................................................................. 1 Figure 1-2: Representative structure of HMOs. .................................................................... 3 Figure 3-1. Workflow diagram of reconstruction and curation of iLR554 for B. infantis. . 11 Figure 3-2: Flux distribution map of central metabolism for B. infantis for maximum flux
of lactose (limiting substrate) by FBA. ............................................................................... 17 Figure 3-3: Flux distribution map of central metabolism for B. infantis for maximum flux
of 3-fucosyllactose (limiting substrate) by FBA. ................................................................ 19 Figure 3-4: Flux distribution map of central metabolism for B. infantis for maximum flux
of 6-sialyllactose (limiting substrate) by FBA. ................................................................... 20 Figure 3-5: Flux distribution map of central metabolism for B. infantis for maximum flux
of lacto-N-tetraose (limiting substrate) by FBA. ................................................................ 21 Figure 3-6: Flux distribution maps integrated to transcriptomic data for maximum flux of
lactose (limiting substrate) by FBA. ................................................................................... 25 Figure 3-7: Flux distribution maps integrated to transcriptomic data for maximum flux of
3-fucosyllactose (limiting substrate) by FBA. .................................................................... 26 Figure 3-8: Flux distribution maps integrated to transcriptomic data for maximum flux of
lacto-N-tetraose (limiting substrate) by FBA. ..................................................................... 28 Figure 3-9: Flux distribution maps integrated to transcriptomic data for maximum flux of
6-sialyllactose (limiting substrate) by FBA . ...................................................................... 29 Figure B-1: RPKM histogram with pareto line for lactose ................................................. 49 Figure B-2: RPKM histogram with pareto line for LNT .................................................... 50 Figure B-3: RPKM histogram with pareto line for LNnT .................................................. 51 Figure B-4: RPKM histogram with pareto line for 2FL...................................................... 52 Figure B-5: RPKM histogram with pareto line for 3FL...................................................... 53 Figure B-6: RPKM histogram with pareto line for 6SL...................................................... 54 Figure E-1: Flux distribution map and gene expression map for 2FL. ............................... 62 Figure E-2: Flux distribution map and gene expression map for 3FL. ............................... 63 Figure D-3: Flux distribution map and gene expression map for lactose. .......................... 63 Figure E-4: Flux distribution map and gene expression map for 6SL. ............................... 64 Figure E-5: Flux distribution map and gene expression map for LNT. .............................. 64 Figure E-6: Flux distribution map and gene expression map for LNnT. ............................ 65 Figure F-1: RPKM vs. Flux graph for 2FL. ........................................................................ 66 Figure F-2: RPKM vs. Flux graph for 3FL. ........................................................................ 67 Figure F-3: RPKM vs. Flux graph for lactose. .................................................................... 68 Figure F-4: RPKM vs. Flux graph for 6SL. ........................................................................ 69 Figure F-5: RPKM vs. Flux graph for LNT. ....................................................................... 70 Figure F-6: RPKM vs. Flux graph for LNnT. ..................................................................... 71
ix
RESUMEN
Los modelos metabólicos a escala genómica (GSMMs por su sigla en inglés) son
representaciones matemáticas de la estequiometría de las reacciones metabólicas,
desarrollados para simular condiciones de crecimiento e interacciones. Bifidobacterium
longum subsp. infantis es una de las especies mas representativas del intestino infantil,
asociada a una buena salud en el recién nacido y reconocida como una bacteria
beneficiosa. Este organismo depende de su actividad sacarolítica para obtener fuentes de
carbono, y es considerado un organismo modelo de utilización de oligosacáridos de
leche humana (HMOs por su sigla en inglés). HMOs son moléculas diversas incluyendo
lactosa, lacto-N-tetraosa (LNT), lacto-N-neotetraosa (LNnT), 2-fucosil lactosa (2FL), 3-
fucosil lactosa (3FL) y 6-sialil lactosa (6SL). Los detalles moleculares respecto a la
utilización de HMO son bien entendidos. Sin embargo, las vías metabólicas expresadas
para el uso de cada carbohidrato y sus consecuencias metabólicas no han sido del todo
abordadas. En este estudio, reconstruimos el metabolismo de este microorganismo
utilizando la anotación de B. infantis ATCC 15967 desde AGORA, además se realizó
una revisión de los genomas anotados y la literatura actual. La reconstrucción (iLR554)
cuenta con 554 genes, 1078 reacciones (747 reacciones asociadas a genes) y 933
metabolitos. La curación fue hecha usando información de RNA-seq para cerrar los gaps
del modelo. Los datos de transcriptómica fueron luego integrados en la simulación
extrayendo modelos específicos para fuentes de carbono mediante el algoritmo GIMME.
iLR554 fue capaz de evidenciar varias diferencias en el metabolismo de HMOs
dependiendo de las características funcionales de los compuestos. La producción de
metabolitos importantes como lactato y acetato fue común a todos los sustratos. Sin
embargo, nuestro modelo predijo pequeñas producciones de succinato, formiato y
etanol. Si bien los datos de RNA-seq fueron útiles, se observó una baja correlación entre
los flujos metabólicos y datos transcripcionales. Este trabajo es una plataforma útil para
simular el metabolismo de una bacteria prominente en el intestino infantil, y diseñar
simbióticos comerciales o consorcios bacterianos que contengan especies del género
Bifidobacterium.
Palabras Claves: Modelo metabólico a escala genómica, integración transcriptómica.

x
ABSTRACT
Genome scale metabolic models (GSMMs) are mathematical representations of
metabolic reactions stoichiometries, developed for simulating growth conditions and
interactions. Bifidobacterium longum subsp. infantis is one of the most representative
species in the infant gut, being associated with good overall health and considered as a
beneficial microbe. This organism relies on saccharolytic activity for dietary sources and
is regarded as a microbial model for understanding human milk oligosaccharides
(HMOs) utilization. HMOs are diverse molecules including lactose, lacto-N-tetraose
(LNT), lacto-N-neotetraose (LNnT), 2-fucosyllactose (2FL), 3-fucosyllactose (3FL) and
6-sialyllactose (6SL). However, the metabolic pathways expressed for the use of each
carbohydrate and metabolic consecuences have not been addressed. In this study we
reconstructed the metabolism of this microorganism using GSMs, which were also
coupled with RNA-seq data during utilization of different HMO. The reconstruction
used the annotation of B. infantis ATCC 15967 from AGORA and an extensive revision
of genome annotations, and current literature was performed. The reconstruction
(iLR554) accounts for 554 genes, 1078 reactions (747 gene associated reactions) and
933 metabolites. Curation was done using RNA-seq data for closing reaction gaps, and
later it was integrated into the GSMM by extracting carbon source-specific models
through the GIMME algorithm. iLR554 was able to evidence several differences in
HMOs metabolism depending on functional characteristics of the compounds, especially
FL which had a more divergent metabolism due to a fucose moiety. The production of
major metabolites such as lactate and acetate was common to all substrates, however our
model predicted small productions of succinate, formate and ethanol. While RNA-seq
data was useful, a low correlation between metabolic fluxes and transcriptional data was
observed. This work is a useful platform to simulate the metabolism of a prominent
infant gut microbe, and to design commercial symbiotics or bacterial consortia
containing species in the Bifidobacterium genus.
Keywords: Genome scale metabolic models, GSM, GSMM, Bifidobacterium longum
subsp. infantis, RNA-seq, transcriptomic integration.

1
1. INTRODUCTION
1.1. Carbohydrate Metabolism in Bifidobacterium
Bifidobacterium species are important microorganisms, which are early colonizers of the
infant gut microbiota (Yatsunenko et al., 2012). This genus includes Gram-positive, rod-
shaped anaerobic and non-motile bacteria that are usually regarded as beneficial for the
host (Lee & O'Sullivan, 2010). Certain bifidobacteria are used as probiotics in the food
industry (Medina et al., 2007).
Figure 1-1: Carbohydrate metabolism network map with bifid shunt reactions
in B. infantis.

2
These microorganisms have a saccharolytic lifestyle, being able to ferment several
monosaccharides, especially oligo and some dietary polysaccharides (Pokusaeva et al.,
2011). Infant gut associated bifidobacteria are able to utilize human milk
oligosaccharides (HMO) and structurally similar mucin oligosaccharides (Ward et al.,
2006). Adult bifidobacteria are able to consume fructans such as inulin, arabinoxylans
and other substrates (Rossi et al., 2005) (Laere et al., 1997). The Bifidobacterium genus
relies on the bifid shunt for central metabolism (Figure 1-1). This pathway is
characterized by the presence of fructose-6-phosphate phosphoketolase, and it allows
Bifidobacterium to get more ATP per fermented glucose (2.5 ATP) than fermentative
pathways in other bacteria (2 ATP in lactic acid bacteria). Glucose 6-phospate goes to
fructose 6-phosphate through isomerization (PGI). Then, it continues through fructose 6-
phosphate eritrose 4-phosphate lyase (F6PE4PL), transaldolase (TALA) and
transketolases (TKT1 and TKT2) until ribose 5-phosphate is formed. Lastly, through
ribose 5-phosphate isomerase (RPI) and epimerase (RPE), xylulose 5-phosphate is
formed, ready to go through the phosphoketolase (PKL) (Pokusaeva et al., 2011).
Bifidobacterium metabolism theoretically predicts a ratio 3:2 of production of acetate to
lactate as end-products. This ratio is actually variable and depends on the nature of the
substrate used for fermentation (Garrido et al., 2013).
Bifidobacterium genomes are well known for having an enrichment in exo- and
endoglycolytic enzymes that target complex carbohydrates, ABC transporters and feeder
pathways derive carbohydrates into the bifid shunt (Thomson et al., 2017). Genomic and
functional studies have shown that these microorganisms have co-evolved with the host
3
and display an extensive array of adaptations for utilization of different carbohydrates
(Turroni et al., 2017).
1.2. Human Milk Oligosaccharides: Characteristics and Utilization
Human milk contains an estimated concentration of about 5-15 g/L of oligosaccharides
(HMOs) (Samuel et al., 2019). They represent a diverse family of structures with a
degree of polymerization from 3 up to 15. HMOs represent a high-energy investment
from the mother, resulting in the provision of a healthy microbiota to the newborn,
supporting the dominance of Bifidobacterium species (Sánchez et al., 2021).
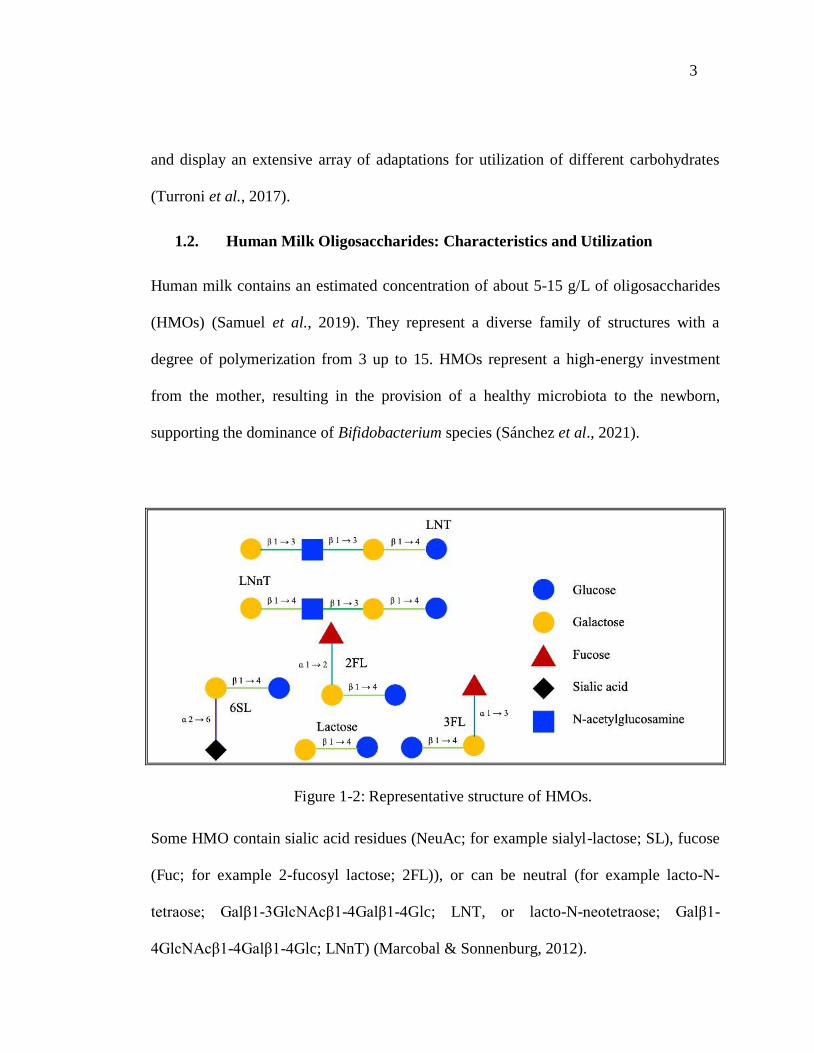
Figure 1-2: Representative structure of HMOs.
Some HMO contain sialic acid residues (NeuAc; for example sialyl-lactose; SL), fucose
(Fuc; for example 2-fucosyl lactose; 2FL)), or can be neutral (for example lacto-N-
tetraose; Galβ1-3GlcNAcβ1-4Galβ1-4Glc; LNT, or lacto-N-neotetraose; Galβ1-
4GlcNAcβ1-4Galβ1-4Glc; LNnT) (Marcobal & Sonnenburg, 2012).

4
Bifidobacterium longum subsp. infantis is one of the most studied microorganisms for its
ability to utilize different HMOs. It possesses several genomic and functional
adaptations for accessing and degrading intracellularly small HMO (2FL, SL), or longer
HMO (Sela et al., 2008). It contains different ABC transporters that import HMO inside
the cell, and a variety of glycosyl hydrolases including α-fucosidases and α-sialidases
are known in this subspecies (Sela et al., 2011) (Kiyohara et al., 2010). These genomic
patterns are well conserved in the subspecies infantis, and they have been described in
other species such as Bifidobacterium bifidum, Bifidobacterium breve and some strains
of B. longum subsp. longum (Thomson & Garrido, 2017).
1.3. Importance of Genome-Scale Metabolic Models
Genome-Scale Metabolic Models (GSMMs) are useful structures that provide a
mathematical representation of cell metabolism. They start with a genome sequence,
which is annotated in terms of the metabolic enzymes capable of performing
biochemical reactions. A curation process with literature information helps in improving
the reconstruction. A matrix of reactions allows the optimization of metabolic fluxes,
enabling assessment of their values and variability. There are important automatic and
semi-automatic reconstructions that are key resources in the study of gut microbes
(Magnúsdóttir et al., 2016). Only a few studies have addressed the bifidobacterial
metabolism using GSMMs. The interaction of Bifidobacterium adolescentis and butyrate
producing bacteria is one of the few (El-Semman et al., 2014).
5
1.4. Motivation
B. infantis is an important model microorganism for HMO utilization and a probiotic.
However, no systems biology modeling techniques have been applied to describe its
global metabolism, the metabolic pathways expressed during HMO utilization, nor the
excretion profile of fermented metabolites. In this study, we reconstructed the
metabolism of this microorganism using GSMMs aided with RNA-seq data to study the
utilization of five different HMOs.
1.5. Hypothesis and Objectives
1.5.1. Hypothesis
Coupling transcriptomic data to GSMM reconstructions of Bifidobacterium longum
subsp. infantis metabolism provides a more detailed representation of the metabolism of
this microorganism during the utilization of HMOs.
1.5.2. Objectives
The general objective of this study was to integrate RNA-seq data to a reconstructed
GSMM for B. infantis to improve our understanding of the metabolism of this bacterium
during HMO utilization.
Specific objectives were to:
1. Reconstruct B. infantis GSMM, validate the reconstruction with experimental
data.
2. Integrate RNA-seq data to GSSM and validate new contextualized GSSMs with
experimental data.

6
2. MATERIALS AND METHODS
2.1. iLR554 metabolic network reconstruction
The reconstruction of B. longum subsp. infantis metabolic network involved multiple
steps. The first step was data collection from multiple databases to establish gene-
protein-reaction (GPR) relationships. The curation process started with AGORA
(Assembly of Gut Organisms through Reconstruction and Analysis) model
Bifidobacterium_longum_infantis_ATCC_15697 version 1.03 (Magnúsdóttir et al.,
2016), and the genome annotation of the strain ATCC 15697 performed by JGI (Chen et
al., 2020). Model reconstruction was performed using COBRA toolbox v3.0 (Heirendt et
al., 2019) for MATLAB (2018). Genes were manually translated from PEG to Blon
annotation using the SEED database (Disz et al., 2010). Six genes had at least two PEG
annotations, so they were left as the same gene in different Gene IDs. Fifteen
metabolites and 21 reactions were added according to Sela et al. (2008), LoCascio et al.
(2008), Sela et al. (2011), Garrido et al. (2013) and Dedon et al. (2020) for the
utilization of HMO by Bifidobacterium longum subsp. infantis. To evaluate the quality
of the reconstruction, transcriptomic data of Garrido et al. (2015) was used to check if
certain genes should or should not be expressed by FBA, according to a threshold for
each carbon source. 22 metabolites and 51 metabolic reactions were manually added
until the list of ‘Should be expressed’ only had 20 unique genes common to all carbon
sources. The reactions associated to those 20 genes did not have at least one metabolite
present in the model, and experimental data culture medium did not support its presence.

7
The model was named following rules by Reed et al. (2003), starting with i to denote in
silico, LR for first author’s first and last initials, and the number of genes in the model
(554).
2.2. Biomass reaction
To test the accuracy of a model, the biomass reaction flux should be positive under
conditions known to sustain growth. Given that iLR554 is based on an AGORA
reconstruction (Magnúsdóttir et al., 2016), the biomass reaction used is a generalized
microbial biomass reaction that has a fractional contribution of biomass precursors to
synthesize new cells. The biomass reaction is not curated for B. infantis ATCC 15967
for the lack of strain-specific experimental information.
2.3. Growth simulation by flux balance analysis (FBA)
The second step is the flux balance analysis (FBA) to simulate B. longum subsp. infantis
metabolism, using the COBRA toolbox v3.0 (Heirendt et al., 2019) and Gurobi 9.0.1
(Gurobi, 2021) as a linear programming solver under MATLAB (2018) programming
environment. Given the stoichiometric matrix (S), FBA solves an optimization problem
whose objective is to maximize the biomass reaction of the model. Equation 2.1
describes the formulation of FBA where V is a vector of flux values for all reactions and
C is a weight vector for each flux in vector V. In the C vector, only the biomass reaction
is set to one, while the other weight values are set in zero. UB is the upper bound for the
flux and LB is the lower bound. The model is supposed to grow in a growth medium

8
(GM), with certain exchange reactions carrying flux from medium (Vd) with a known
maximum uptake rate (gd) for metabolite d.
Max Z=CTV
S.t.
S.V = 0
V UB
-V -LB
Vd = gd, d GM
(2.1)
Since the model is simulating growth against transcriptomic information obtained from a
growth assay that lasts hours, a quasi-steady state is assumed (S.v=0).
The medium used for growth simulation was set to simulate a defined modified MRS
medium, which contains 2% w/v of carbon source as sugar. The carbon sources used
were lactose and five human milk oligosaccharides (HMOs): lacto-N-tetraose (LNT),
lacto-N-neotetraose (LNnT), 2-fucosyllactose (2FL), 3-fucosyllactose (3FL) and 6-
sialyllactose (6SL). To contrast the results with transcriptomic information, total moles
of each limiting substrate were calculated in 200 μL, and later normalized by the moles
of lactose (Table A-1 in Appendix). By this strategy, all predictions are in function of
the maximum consuming flux of lactose (experimentally, the preferred growth limiting
substrate). Maximum yields are fixed by the lower yields of limiting substrate for each
growth condition. Lower bounds of amino acids, vitamins and nucleotides were fixed to

9
match the normalization. Lower bounds of other possible carbon sources, that were not
supposed to be present in the experiments were fixed to zero.
2.4. Validation of model expansion
The third step was the validation of the model by comparing intake and output of
exchange metabolites to literature and experimental data. Growth in all different carbon
sources was validated against experimental data (Garrido et al., 2015) and literature
(Thompson et al. 2018). Data of metabolite consumption and production of Garrido et
al. (2013) was used to corroborate the predictions obtained from the model. This step
was done with the iLR554 and with the GIMME submodels for each carbon source.
2.5. Identification of essential genes
An essential gene list was generated using the single gene deletion function in the
COBRA toolbox v3.0 for MATLAB. The function was first applied to iLR554 for
lactose as a carbon source, and then it was applied to the GIMME submodels for each
carbon source. An essential gene was defined as a gene when knocked out caused null
growth. The corresponding reactions to these genes were identified as essential
reactions.
2.6. Transcriptomic integration
The fourth step was the integration of transcriptomics data to build carbon source-
specific models from the iLR554 model. The gene expression data used came from the
10
work of Garrido et. al (2015), where the authors generated transcriptomics for
Bifidobacterium (in particular B. infantis ATCC 15697) growing in carbon sources such
as lactose and five HMOs. The GIMME algorithm (Becker & Palsson, 2008) was then
used to extract six context-specific models using the transcriptomic data. This algorithm
uses a RPKM (reads per kilobase per million) threshold to determine if a gene has a low
or high expression, and it minimizes the usage of low-expression reactions as it
maximizes the biomass. The RPKM threshold set for each carbon source was set in the
40th percentile. This percentile is based in the distribution of RNA-seq data, being the
percentile for around 200 RPKM for each substrate (Garrido et al., 2015) For reactions
with OR gene-protein-reaction (GPR) association, the algorithm evaluates the higher
RPKM gene, and for AND GPR association it evaluates the lower RPKM gene.
2.7. Flux distribution maps and gene expression maps
The flux distribution maps were generated by Escher (King et al., 2015a), an online
application for visualization of flux and transcriptomic data in pathways in a JSON
model. The MAT models were translated into JSON models by Python 3 (Van Rossum
& Drake, 2009), and then uploaded to Escher, along with flux and transcriptomic data
tables, to generate a metabolic network and gene-expression maps. Maps with both
metabolic networks and gene expression were manually generated.

11
3. RESULTS
3.1. Reconstruction and curation of a genome scale metabolic model for
B. longum subsp. infantis
In this work, we combined metabolic modeling and transcriptomics to reconstruct and
curate the metabolism of B. infantis during the utilization of five HMOs and lactose, as
the sole carbon source.
Figure 3-1. Workflow diagram of reconstruction and curation of iLR554 for B.
infantis. Contextualized models in the right of the figure are from top to bottom for
lactose (lcts), lacto-N-tetraose (lnt), lacto-N-neotetraose (lnnt), 2-fucosyllactose (2fl),
3-fucosyllactose (3fl) and 6-sialyllactose (6sl).
The overall workflow is presented in Figure 3-1. iLR554 was generated as a functional
GSSM able to produce biomass for B. infantis, with lactose as main substrate and
anaerobic conditions. The model was reconstructed and curated from the type strain
annotation (ATCC 15697) from JGI (Chen et al., 2020), and it is based on the AGORA
12
(Assembly of Gut Organisms through Reconstruction and Analysis) model for B.
infantis ATCC 15697 v1.03 (Magnúsdóttir et al., 2016). The initial AGORA model had
541 genes in PEG annotation, 1005 reactions and 889 metabolites in two different
compartments. To integrate the genome-scale model with the transcriptomics data
(Garrido et al. 2015), the PEG annotation was translated to Blon annotation manually
using the SEED database (Disz et al., 2010).
Genes Blon_0602, Blon_0748, Blon_0796, Blon_0852, Blon_1877 and Blon_2316 had
two different PEG annotations each, so they were left with the same name but different
gene IDs. One PEG gene did not have a match in the Blon annotation, but it had a match
in another B. infantis genome (BLIJ_2570, 'pbiosynthesis'). This reaction had several
genes in OR association, so it was not assumed important. Later, reactions with
associated genes and metabolites were added to match human milk oligosaccharides
uptake and metabolism found in the literature (Sela et al., 2008) (LoCascio et al., 2008)
(Sela et al., 2011) (Garrido et al., 2013) (Dedon et al., 2020). This addition expanded the
gene list to 553 genes, with 1026 reactions and 905 metabolites.

13
Table III-1: Summary of reactions for major steps in the curation
process.
Reactions AGORA v1.03 Draft Model v2.0 iLR554
Gene Associated 689 704 747
No Gene Associated
(metabolism) 103 103 107
No Gene Associated
(transport) 61 62 64
Exchange 158 163 171
For the initial integration of the model with transcriptomics data (Garrido et al. (2015)),
we set a threshold RPKM (reads per kilobase per million) from the gene list of AGORA
model, for each carbon source. We decided to use the 40th percentile of the RPKM
distribution for each carbon source because in that percentile the numbers were around
200 RPKM (Figures B-1, B-2, B-3, B-4, B-5 and B-6 in Appendix). In Garrido et al.
(2015), genes with less than 200 RPKM were excluded from analysis. Then, reactions
associated with each high expressing gene were subjected to minimization and
maximization of the objective function (biomass) to check if they were blocked. The
next step was to compare blocked reactions for each carbon source, identifying those
common to all substrates. The list was checked manually, and reactions and metabolites
were added based on KEGG pathways (Kanehisa et al., 2016) and BiGG Models (King
et al., 2015b). The list contained 20 genes associated with 33 reactions. These reactions
are blocked in the model but should be present (Table C-1 in Appendix). The resulting
metabolic model was labeled as iLR554, containing 554 genes, 1078 reactions (747

14
associated to a gene) and 933 metabolites. Exchange reactions represent 15.86% of total
reactions, and reactions not associated to a gene related to metabolism represent 9.93%
(Table III-1).
3.2. Model validation: inputs and outputs
The first step to validate the model was to check biomass production in anaerobic
conditions. Growth data from a previous study using six different carbon sources
(Garrido et al. 2015) was obtained and growth rates during exponential phase were
calculated and compared to those obtained by Flux Balance Analysis (FBA) with the
iLR554 model.
Table III-2: Experimental and in silico growth rates by FBA before RNA
seq integration for B. infantis using different carbon sources. In experimental data
each substrate is 2% w/v in modified MRS. In silico, maximum substrate flux are 1
mmol gDW-1 h-1 for lactose, 0.48 mmol gDW-1 h-1 for LNT and LNnT, 0.7 mmol
gDW-1 h-1 for 2FL and 3FL, and 0.54 mmol gDW-1 h-1 for 6SL.
Does it grow in…? Experiment
[h-1]
In silico before
integration
[h-1mol-1 lactose]
Lactose 0.171 0.080
LNT 0.101 0.096
LNnT 0.098 0.096
2FL 0.031 0.081
3FL 0.031 0.081
6SL 0.043 0.091

15
Experimental growth rates were similar for LNT and LNnT, and more than twice for
2FL, 3FL and 6SL. This result is expected considering these molecules are isomers, and
the model replicates the similarity in other scales. Experimental growth rates of LNT,
LNnT, 6SL, 2FL and 3FL were in descending order, similar to rates obtained by FBA.
The only exception was lactose, which should have the highest experimental growth rate
but had the lowest rate in silico (Table III-2).
Table III-3. Production of major metabolites (mmol gDW-1hr-1) before
transcriptomic integration. Green indicates cases where metabolite production is
consistent with evidence. Red indicates metabolite production is not consistent with
evidence. In black are the metabolites with no experimental data to correlate with. [1]
Garrido et al. (2013). [2] Van der Meulen et al. (2006) [3] Cheng et al. (2020).
Does it produce… in…
before integration? LCTS LNT LNnT 2FL 3FL 6SL
Acetate 3.357[1] 3.386[1] 3.386 2.894 2.894 3.333
Lactate 2.238[1] 2.258[1] 5.258 1.929 1.929 2.222
Ethanol 0.034[2] 0.034 0.034 0.029 0.029 0.033
Succinate 0.000[2] 0.000 0.000 0.000 0.000 0.000
Formate 0.034[1] 0.034[1] 0.034 0.029 0.029 0.033
1,2 Propanediol 0.000 0.000 0.000 0.700[3] 0.700[3] 0.000
The following step for model validation was to evaluate the production of major
metabolic products such as lactate, acetate, ethanol, and succinate (Table III-3). A
theoretical ratio of 3:2 is expected for acetate to lactate in the B. infantis metabolism
(Garrido et al., 2013). However, production of exchange metabolites depends on several
factors including the carbon source.

16
LNT, LNnT, 2FL, 3FL, and 6SL are HMOs that contain lactose as building block.
Hence, it is expected that the production of lactate and acetate during metabolism of
these substrates be near 1.5. This ratio was fixed for every carbon source, for lack of
enough experimental production data for each of the substrates (Table III.3). Production
of ethanol and succinate was reported for Bifidobacterium cultured in lactose (Van der
Meulen et al., 2006), and the FBA results are consistent with experimental data. Fucose
metabolism in Bifidobacterium uniquely results in pyruvate and 1,2 propanediol as end
product (Cheng et al., 2016) (Dedon et al., 2020). 1,2 propanediol and formate are end-
products that were released by B. infantis in silico.
3.3. Comparison of central metabolism of iLR554 for each carbon source
FBA was used for validation of growth and major metabolite production. We later
analyzed the central metabolism in B. infantis, generating flux distribution maps for all
six carbon sources.

17
Figure 3-2: Flux distribution map of central metabolism for B. infantis for
maximum flux of lactose (limiting substrate) by FBA.
Figure 3-2 shows the flux distribution for central pathways in B. infantis during
utilization of lactose, the simplest of the substrates evaluated. Lactose is predicted to be
imported by a lactose permease and hydrolyzed by a β-galactosidase. The fluxes of these
reactions, as well as a galactokinase, showed an intermediate flux value (Figure 3-2).
Galactose and glucose are derived into central metabolism by feeder pathways such as

18
the Leloir pathway, which includes gene products such as UDPG4R, GALU and UGLT.
The fluxes of these intermediate reactions were predicted to be at very high values
(Figure 3-2).
As expected, reactions in the bifid shunt presented medium and high flux values during
lactose utilization. They include enzymes such as fructose-6-P erythrose-4-P lyase
(F6PE4PL, or F6PPK), transaldolases (TKK1 and TKK2), and a phosphoketolase
(PKL). Main products of the bifid shunt, acetyl-P and GA3P, are further metabolized
into acetate and lactate. Fluxes in the metabolic reactions producing ethanol and formate
were very low.
Interestingly, the FBA analysis showed a low metabolic activity in the Krebs cycle.
Finally, two high fluxes were predicted for enzymes GF6PTA (glutamine-fructose-6P
transaminase) and G6PDA (glucose-6-P dehydrogenase). They start and end at F6P.
Combining their reactions, the net result is the deamination of glutamine for NH4+
release. It is possible that in this simulation this reaction provides ammonia to the cell
for amino acid biosynthesis, but it remains to be validated its importance in vivo.

19
Figure 3-3: Flux distribution map of central metabolism for B. infantis for
maximum flux of 3-fucosyllactose (limiting substrate) by FBA.
20
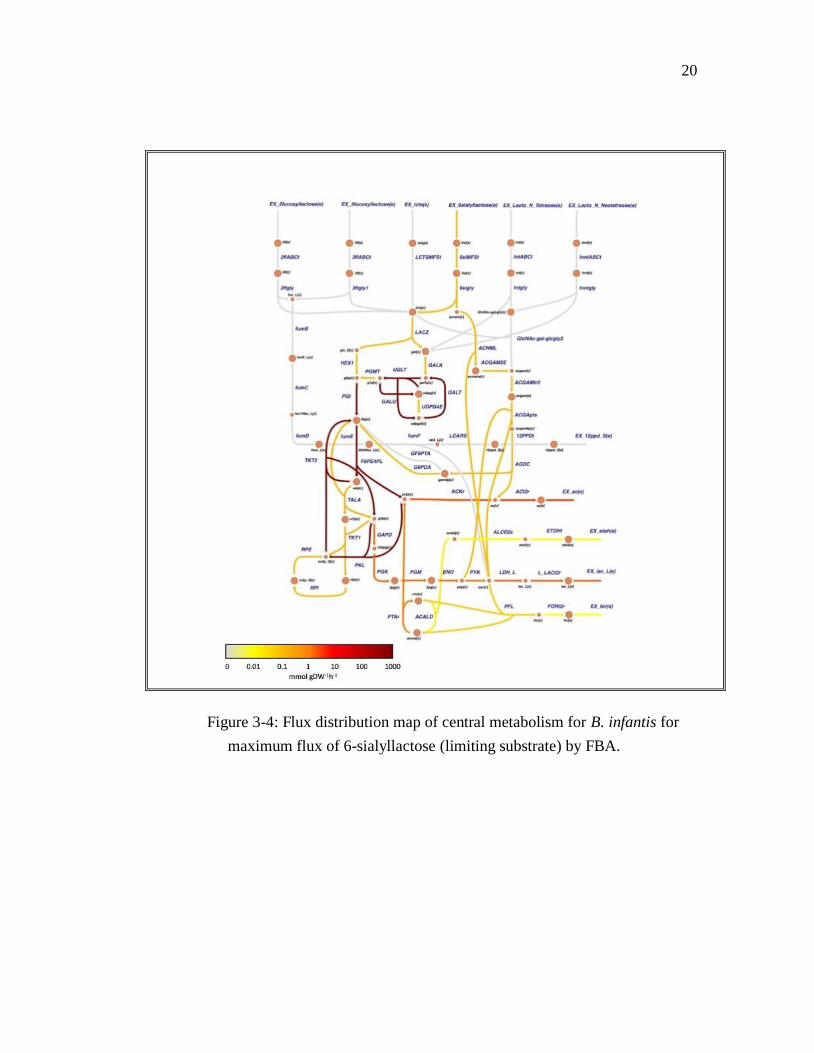
Figure 3-4: Flux distribution map of central metabolism for B. infantis for
maximum flux of 6-sialyllactose (limiting substrate) by FBA.

21
Figure 3-5: Flux distribution map of central metabolism for B. infantis for
maximum flux of lacto-N-tetraose (limiting substrate) by FBA.
For all different HMOs, flux is favored through the bifid shunt pathway, with differences
in carbohydrate modifying reactions depending on the nature of the compound. In the
pre-bifid shunt phase, specific enzymes with activities such as fucosidase (Figure 3-3),
sialidase (Figure 3-4) and hexosaminidase and galactosidase (Figure 3-5), remove all
functional groups from the hexose sugars through specific feeder pathways. 2FL and
22
3FL had an identical flux distribution as expected, as is the case for LNT and LNnT.
From all four flux distribution maps, it can be seen that carbon flux goes from sources to
products, favoring the production of lactate and acetate in 2:3 ratio (Garrido et al.,
2013). There are some reactions active in Krebs cycle, with predominantly low flux, for
production of formate. Each functional group starts its own metabolic pathway to create
sub products such as 1,2 propanediol in fucosylated compounds or N-acetylglucosamine
in sialylated 6SL, LNT and LNnT. All substrates appeared to have an active Leloir
pathway for galactose metabolism, and the GF6PTA/G6PDA cycle was only maintained
in 3FL.
3.4. Transcriptomic integration with metabolic modeling
Metabolic models specific for each carbon source were obtained from the model iLR554
and coupled with transcriptomic data on each carbon source (Garrido et al., 2015). This
was accomplished by deleting reactions associated with low-expressing genes using the
GIMME algorithm (Becker & Palsson, 2008). This integration resulted in six carbon
source-specific models for lactose, LNT, LNnT, 2FL, 3FL and 6SL (Figure 3.1). Among
554 original genes of the iLR554 model, 20 were supposed to be expressed, but
reactions associated with them were blocked since their metabolites were not present in
the medium.

23
Table III-4: Experimental (Garrido et al., 2013) and in silico growth
rates after RNA seq integration for B. infantis using different carbon sources. In
experimental data each substrate is 2% w/v in modified MRS. In silico, maximum
substrate flux are 1 mmol gDW-1 h-1 for lactose, 0.48 mmol gDW-1 h-1 for LNT and
LNnT, 0.7 mmol gDW-1 h-1 for 2FL and 3FL, and 0.54 mmol gDW-1 h-1 for 6SL.
Does it grow in…? Experiment
[h-1]
In silico before
integration
[h-1mol-1 lactose]
In silico after
integration
[h-1mol-1 lactose]
Lactose 0.171 0.080 0.073
Lacto-N-tetraose 0.101 0.096 0.087
Lacto-N-neotetraose 0.098 0.096 0.092
2-Fucosyllactose 0.031 0.081 0.073
3-Fucosyllactose 0.031 0.081 0.076
6-Sialyllactose 0.043 0.091 0.084
Table III-5: Production of major metabolites (mmol gDW-1hr-1) after
transcriptomic integration. In green, metabolite production is validated by evidence.
In red, metabolite production was not validated by evidence. In black are the
metabolites with no experimental data to correlate with. [1] Garrido et al. (2013). [2]
Van der Meulen et al. (2006) [3] Cheng et al. (2020).
Does it produce… in…
after integration? LCTS LNT LNnT 2FL 3FL 6SL
Acetate 3.046[1] 3.053[1] 3.062 2.381 2.491 3.034
Lactate 2.031[1] 2.036[1] 2.041 1.587 1.661 2.023
Ethanol 0.030[2] 0.031 0.031 0.024 0.025 0.030
Succinate 0.016[2] 0.019 0.017 0.016 0.012 0.018
Formate 0.030[1] 0.031[1] 0.031 0.024 0.025 0.030
1,2 Propanediol 0.000 0.000 0.000 0.554[3] 0.700[3] 0.000

24
The highest number of deactivated reactions was observed in the 2FL model with 207
reactions, then the lactose and 3FL models, with 204 reactions each other, then the 6SL
model with 202 reactions, then the LNT model with 195 reactions and lastly the LNnT
model with 191 deactivated reactions. Contextualized models had slightly lower growth
rates than iLR554 (Table III-4) and were validated against the same literature sources as
iLR554 (Table III-5).

25
Figure 3-6: Flux distribution maps integrated to transcriptomic data for
maximum flux of lactose (limiting substrate) by FBA.
Comparing the fluxes and transcriptomic data during lactose utilization, a basal
expression of HMO transporters was observed, however their fluxes were zero. The high
activity of GF6PTA and G6PDA was not sustained by RNA-seq. Metabolic activity of
most all bifid shunt and lower glycolysis enzymes matched well transcriptomics data.
26
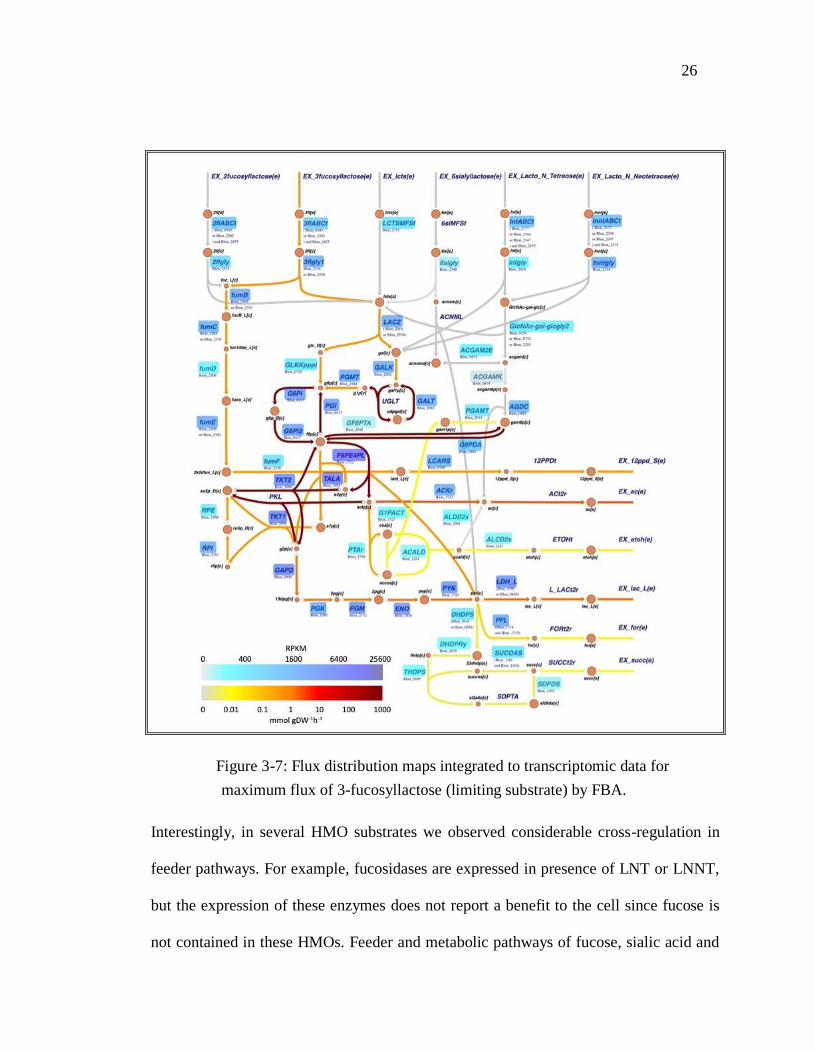
Figure 3-7: Flux distribution maps integrated to transcriptomic data for
maximum flux of 3-fucosyllactose (limiting substrate) by FBA.
Interestingly, in several HMO substrates we observed considerable cross-regulation in
feeder pathways. For example, fucosidases are expressed in presence of LNT or LNNT,
but the expression of these enzymes does not report a benefit to the cell since fucose is
not contained in these HMOs. Feeder and metabolic pathways of fucose, sialic acid and

27
N-acetylglucosamine appeared to have overlapping transcription (Garrido et al., 2015).
For example, when LNT is the carbon source (Figure 3-8), we can see high gene
expression in pathways related to fucose metabolization. And when 3FL (Figure 3-7) is
the carbon source, we can see high gene expression on ABC transporters for LNT and
LNNT as well as the pathways related to their metabolization. This cross-regulation
could be explained by the simultaneous presence of several HMO types in breast milk,
and therefore gut microbes responding to more than one HMO or constituent
carbohydrate at the time.

28
Figure 3-8: Flux distribution maps integrated to transcriptomic data for
maximum flux of lacto-N-tetraose (limiting substrate) by FBA.

29
Figure 3-9: Flux distribution maps integrated to transcriptomic data for
maximum flux of 6-sialyllactose (limiting substrate) by FBA.
The model extracted for lactose (Figure 3-6) shows an increasing flux-RPKM relation
for reactions from the entry of lactose through lactose permease, to the bifid shunt until
production of lactate and acetate. High fluxes through bifid shunt can be seen across all
HMOs, related almost directly to high gene expression. Blon_2152 (phosphoglycerate

30
mutase, PGM) is a predicted essential gene for B. infantis (Devika & Raman, 2019), and
is predicted to be a nonlethal gene with higher than 50% reduced growth by single
knockout performed over iLR554. Galactose metabolism can be seen with similar fluxes
and gene expression for all HMOs. Formate and succinate production is lower than
acetate and lactate production, and related to a lower gene expression in Blon_1714
AND Blon_1715 (pyruvate formate lyase, PFL) and Blon_2035 (dihydrodipicolinate
synthase, DHDPS) respectively. Fucose from 2FL and 3FL is metabolized into
lactaldehyde and pyruvate (fumB, fumC, fumD, fumE and fumF reactions), and then
lactaldehyde is reduced into 1,2-propanediol (LCARS). This pathway is associated with
high expression only for fucosylated HMOs (Figure 3-7), with Blon_2306 (L-
fuconolactone hydrolase, fumD) being below threshold for other HMOs. Sialic acid
utilization results in pyruvate and acetate, with high gene expression related to GlcNAc
metabolism (Figure 3-8 and 3-9). Overall, fluxes in central metabolism are well
correlated with gene expression, meaning transcriptomic integration improves model
accuracy. The other carbon sources are presented in appendix E.
3.5. Essential genes and reactions
Genes are predicted to be essential when its deletion in silico generates no
measurable biomass. According to Metris et al. (2011), accuracy of predicting essential
genes in microorganisms with less studied metabolisms could be 60% to 80%. This
analysis could however provide useful information for the model.

31
Table III-6: Number of genes for all six substrates by single-gene
knockout, predicted to be essential, non-essential or non-lethal with reduced growth.
Number of… Lactose LNT LNnT 2FL 3FL 6SL
Essential Genes 99 107 98 103 99 103
94 common to all (105 Reactions)
Non Essential
Genes
309 307 306 309 308 307
281 common to all (290 Reactions)
Non-Lethal with
Reduced Growth 42 50 58 55 57 55
iLR554 was used as a framework to predict essential genes for B. infantis. From the 554
genes of iLR554, 94 (16.97%) were predicted to be essential, common to all carbon
sources (Table III-6).

32
Table III-7: Characterization of essential genes based on the associated
reactions to their encoding proteins.
Categorization Number %
Replication and translation 26 27.66
Nucleotides Metabolism 18 19.15
Cell Wall Biosynthesis 11 11.70
Aminoacids Metabolism 9 9.57
Terpenoids Biosynthesis 8 8.51
Transport Reactions 7 7.45
Vitamins Metabolism 4 4.26
NAD Metabolism 3 3.19
Krebbs Cycle 6 6.38
Miscellaneous 1 1.06
Sulfur Metabolism 1 1.06
As expected, most predicted genes were related to essential cellular reactions (Table III-
7) such as replication and translation (27.66%), nucleotides metabolism (19.15%), cell
wall biosynthesis (11.7%) and aminoacids metabolism (9.57%). Some low expression
genes are predicted as essential, such as Blon_0034 (Carboxylic acid dissociation),
Blon_0166 (Aspartate-semialdehyde dehydrogenase), Blon_0171 (Peptidoglycan
subunit synthesis), Blon_0768 (Glutamate racemase), Blon_1757 and Blon_1758 (Zinc
transport via ABC system), Blon_1759 (2-C-Methyl-D-erythritol 2,4-cyclodiphosphate
synthase), Blon_2013 (Phosphopantothenate-cysteine ligase), and Blon_2014
(Pantothenate kinase) (Table D-1). These genes might be falsely predicted as essential,
33
for the absence of gene expression evidence to confirm their essentiality. If false
positivity is confirmed, it could be a good start for model refinement (Reed et al., 2006).
Table III-8: Characterization of non-essential genes based on the
associated reactions to their encoding proteins.
Categorization Number %
Replication and translation 84 29.89
Aminoacids Metabolism 53 18.86
Transport Reactions 53 18.86
Nucleotide Metabolism 24 8.54
Pyruvate Metabolism & Krebbs Cycle 12 4.27
Starch & Sucrose Metabolism 9 3.20
Vitamins Metabolism 8 2.85
Phosphate Pentose Pathway 7 2.49
Aminosugar & Galactose Metabolism 6 2.14
Fucose Metabolism 6 2.14
Fatty acids Biosynthesis 5 1.78
HMO Metabolism 4 1.42
Glycerophospholipids Metabolism 3 1.07
Lipopolysaccharides Metabolism 1 0.36
Glyoxylate Metabolism 1 0.36
Cell Wall Biosynthesis 1 0.36
NAD Metabolism 1 0.36
Heme Metabolism 1 0.36
Plant Polysaccharide Metabolism 1 0.36
Terpenoids Biosynthesis 1 0.36

34
In the same set of results from single-gene knockout, 281 genes (50.72%) were predicted
to have no effect in the final biomass production, independent of the carbon source.
From those, 29.89% were related to replication and translation and 18.86% to transport
reactions. Most of the metabolites related to these transport reactions were not present in
the growth medium. Therefore, the prediction of the lack of effect on biomass might
depend on which metabolites are available in the medium. 18.86% of non essential
genes are related to aminoacids metabolism and 8.54% to nucleotides metabolism, in
contrast with essential gene predictions for same categories (9.57% and 19.15%
respectively). Aminoacids and nucleotides are present in simulated growth medium, and
probably these predictions are due to redundant reactions that guarantee the presence of
important metabolites. Because single gene knockout is done deleting genes one by one,
HMO metabolism (1.42%) and fucose metabolism (2.14%) genes are predicted as non
essential, but this is explained by the GPR rules in OR association. If one of these
important genes are knocked out, the others will fulfill the role.
Some genes were predicted to be not lethal, but they cause a reduction in the growth rate
of the mutant relative to the wild type growth. There were 42 nonlethal genes for lactose
(7.58%), 50 for LNT (9.03%), 58 for LNnT (10.47%), 55 for 2FL (9.93%), 57 for 3FL
(10.29%) and 55 for 6SL (9.93%). Genes predicted to be non-lethal with reduced growth
rate are related to carbon source-specific pathways, ATP production, bifid shunt
enzymes and biomass demanding metabolites.

35
4. DISCUSSION
In this study, we presented a reconstructed and functional genome-scale metabolic
model (GSMM) for Bifidobacterium longum subsp. infantis through integration of
modeling with transcriptomics data. The reconstruction was used to extract six carbon
source-specific models for HMOs lactose, LNT, LNnT, 2FL, 3FL and 6SL, based on
experimental transcriptional information. Genome-scale single-gene deletion analysis
was performed on the contextualized models to determine the essentiality of reactions
supported by transcriptomic data.
4.1. Difficulties of constructing GSMMs
One of the most difficult things for reconstructing the model for B. infantis was the lack
of experimental information regarding cell composition for biomass formulation, and
metabolite production in different growth media for validation. Most experimental data
available for B. infantis is based on a black box model under highly specific
fermentation conditions. Biomass reaction in model is from a generalized microbe
biomass reaction, stated by the AGORA project (Magnúsdóttir et al., 2016), for lack of
available data. Also, gene annotation is mostly based on orthology, assuming orthologs
will have the same biological function in different species (Fang et al., 2010). But
because some Bifidobacterium species had co-evolved with the host, it is hard to
generalize gene functionality across species (Turroni et al., 2011). This work also
underlined gaps where our understanding of B. infantis metabolism is incomplete, like in
cell wall biosynthesis. Besides metabolic knowledge, GSMMs simulate a phenotype

36
over a specific environment based on known compounds. For unspecified medium
compounds like yeast extract, researchers need to make approximations in order to detail
the metabolites and their quantities. This adds a layer of uncertainty (Bernstein et al.,
2021), because we cannot compare a simulated production with experimental data if the
simulation is deprived of some key compounds. Even when experimental information is
available, like transcriptomics data in this work, there is not necessarily a correlation
between level of gene expression and flux through the reaction associated with the
aforementioned gene (Figures F-1, F-2, F-3, F-4, F-5 and F-6) (Åkesson, Förster &
Nielsen, 2004) (Machado & Herrgård, 2014).
4.2. Comparison to other Bifidobacterium reconstructions
When compared to other reconstructions for B. infantis or other Bifidobacterium, Devika
et al. (2019) used the AGORA model for B. infantis, and added reactions for sialic acid
and N-acetylglucosamine utilization; El-Semman et al. (2014) made a reconstruction for
B. adolescentis with 454 genes, and 699 reactions. Since iLR554 is based on the
AGORA model, from all three known reconstructions, iLR554 is the one with the most
associated genes. With the fucose pathway from Dedon et al. (2020), feeder reactions
for HMOs from Sela et al. (2008), LoCascio et al. (2008), Sela et al. (2011) and Garrido
et al. (2013) and transcriptomics data from Garrido et al. (2015), we estimate that
iLR554 is the most complete model until now for usage of HMOs.

37
4.3. What we have learnt
By reconstructing this model, we have learnt how the different HMOs used as carbon
sources are assimilated by B. infantis, and how the functional groups of these HMOs
directly affect major metabolite production as well as biomass formation.
Transcriptomics information made carbon source-specific constraints for each HMO,
providing an optimized assimilation route. Following steps to make a better curation of
B. infantis GSMM are formulating a tailored biomass function based on cell composition
(Bernstein et al., 2021), validating predicted essential genes in vivo for better metabolite
production prediction (Thiele et al., 2005), and expanding transcriptomics data to
multiple HMOs consumption at once. It would also be beneficial to further understand
the cross activation of metabolic pathways for different HMOs than the one being
consumed, as it would provide information of carbon source preference in utilization.

38
5. CONCLUSIONS
Bifidobacterium species are important members of gut microbiome. Their main
characteristic is their saccharolytic lifestyle that enables them to thrive on different
carbon sources. Bifidobacterium longum subsp. infantis is one of the most studied
microorganisms for its ability to utilize different human milk oligosaccharides because
of their genomic and functional adaptations, including ABC transporters and
saccharolytic enzymes. The modeling of these adaptations within its metabolism,
through genome-scale metabolic models (GSMMs), could provide better understanding
of its physiological response to different HMOs and support the design of probiotics.
In this study, we reconstructed the GSMMs of B. infantis, with special interest in the
information provided by transcriptomic data for five different HMOs and lactose. This
reconstruction (iLR554) was able to evidence several differences in HMOs metabolism
depending on the functional characteristics of the compounds. The production of major
metabolites like acetate and lactate was common to all substrates, with small production
of succinate, formate and ethanol. Differential production of compounds like 1,2-
propanediol was observed in fucosylated substrates.
iLR554 is a useful platform to simulate the metabolism of B. infantis on different HMOs
as carbon sources. However, it can be curated even further with the addition of a tailored
biomass function and validation of essential genes prediction through experimental data.
This reconstruction might be a useful tool to design commercial symbiotics or bacterial
consortia containing species in the Bifidobacterium genus.

39
BIBLIOGRAPHY
Åkesson, M., Förster, J., & Nielsen, J. (2004). Integration of gene expression data into
genome-scale metabolic models. Metabolic Engineering, 6(4), 285-293. doi:
10.1016/j.ymben.2003.12.002
Becker, S., & Palsson, B. (2008). Context-Specific Metabolic Networks Are Consistent
with Experiments. Plos Computational Biology, 4(5), e1000082. doi:
10.1371/journal.pcbi.1000082
Bernstein, D., Sulheim, S., Almaas, E., & Segrè, D. (2021). Addressing uncertainty in
genome-scale metabolic model reconstruction and analysis. Genome Biology, 22(1). doi:
10.1186/s13059-021-02289-z
Chen, I., Chu, K., Palaniappan, K., Ratner, A., Huang, J., & Huntemann, M. et al.
(2020). The IMG/M data management and analysis system v.6.0: new tools and
advanced capabilities. Nucleic Acids Research, 49(D1), D751-D763. doi:
10.1093/nar/gkaa939
Cheng, C., Duar, R., Lin, X., Perez-Munoz, M., Tollenaar, S., & Oh, J. et al. (2020).
Ecological Importance of Cross-Feeding of the Intermediate Metabolite 1,2-Propanediol
between Bacterial Gut Symbionts. Applied And Environmental Microbiology, 86(11).
doi: 10.1128/aem.00190-20
Devika, N., & Raman, K. (2019). Deciphering the metabolic capabilities of
Bifidobacteria using genome-scale metabolic models. Scientific Reports, 9(1). doi:
10.1038/s41598-019-54696-9

40
Disz, T., Akhter, S., Cuevas, D., Olson, R., Overbeek, R., & Vonstein, V. et al. (2010).
Accessing the SEED Genome Databases via Web Services API: Tools for Programmers.
BMC Bioinformatics, 11(1), 319. doi: 10.1186/1471-2105-11-319
Dedon, L., Özcan, E., Rani, A., & Sela, D. (2020). Bifidobacterium infantis Metabolizes
2′Fucosyllactose-Derived and Free Fucose Through a Common Catabolic Pathway
Resulting in 1,2-Propanediol Secretion. Frontiers In Nutrition, 7. doi:
10.3389/fnut.2020.583397
El-Semman, I., Karlsson, F., Shoaie, S., Nookaew, I., Soliman, T., & Nielsen, J. (2014).
Genome-scale metabolic reconstructions of Bifidobacterium adolescentis L2-32 and
Faecalibacterium prausnitzii A2-165 and their interaction. BMC Systems Biology, 8(1).
doi: 10.1186/1752-0509-8-41
Fang, G., Bhardwaj, N., Robilotto, R., & Gerstein, M. (2010). Getting Started in Gene
Orthology and Functional Analysis. Plos Computational Biology, 6(3), e1000703. doi:
10.1371/journal.pcbi.1000703
Garrido, D., Ruiz-Moyano, S., Jimenez-Espinoza, R., Eom, H., Block, D., & Mills, D.
(2013). Utilization of galactooligosaccharides by Bifidobacterium longum subsp.
infantis isolates. Food Microbiology, 33(2), 262-270. doi: 10.1016/j.fm.2012.10.003
Garrido, D., Ruiz-Moyano, S., Lemay, D., Sela, D., German, J., & Mills, D. (2015).
Comparative transcriptomics reveals key differences in the response to milk
oligosaccharides of infant gut-associated bifidobacteria. Scientific Reports, 5(1). doi:
10.1038/srep13517
Gurobi Optimization, LLC. (2021). Gurobi (Version 9.0.1). Beaverton, Oregon.

41
Heirendt, L., Arreckx, S., Pfau, T., Mendoza, S., Richelle, A., & Heinken, A. et al.
(2019). Creation and analysis of biochemical constraint-based models using the COBRA
Toolbox v.3.0. Nature Protocols, 14(3), 639-702. doi: 10.1038/s41596-018-0098-2
Kanehisa, M., Furumichi, M., Tanabe, M., Sato, Y., & Morishima, K. (2016). KEGG:
new perspectives on genomes, pathways, diseases and drugs. Nucleic Acids Research,
45(D1), D353-D361. doi: 10.1093/nar/gkw1092
King, Z., Dräger, A., Ebrahim, A., Sonnenschein, N., Lewis, N., & Palsson, B. (2015a).
Escher: A Web Application for Building, Sharing, and Embedding Data-Rich
Visualizations of Biological Pathways. PLOS Computational Biology, 11(8), e1004321.
doi: 10.1371/journal.pcbi.1004321
King, Z., Lu, J., Dräger, A., Miller, P., Federowicz, S., & Lerman, J. et al. (2015b).
BiGG Models: A platform for integrating, standardizing and sharing genome-scale
models. Nucleic Acids Research, 44(D1), D515-D522. doi: 10.1093/nar/gkv1049
Kiyohara, M., Tanigawa, K., Chaiwangsri, T., Katayama, T., Ashida, H., & Yamamoto,
K. (2010). An exo-α-sialidase from bifidobacteria involved in the degradation of
sialyloligosaccharides in human milk and intestinal
glycoconjugates. Glycobiology, 21(4), 437-447. doi: 10.1093/glycob/cwq175
Laere, K., Beldman, G., & Voragen, A. (1997). A new arabinofuranohydrolase from
Bifidobacterium adolescentis able to remove arabinosyl residues from double-
substituted xylose units in arabinoxylan. Applied Microbiology And Biotechnology,
47(3), 231-235. doi: 10.1007/s002530050918
Lee, J., & O'Sullivan, D. (2010). Genomic Insights into Bifidobacteria. Microbiology
And Molecular Biology Reviews, 74(3), 378-416. doi: 10.1128/mmbr.00004-10

42
LoCascio, R., Niñonuevo, M., Kronewitter, S., Freeman, S., German, J., Lebrilla, C., &
Mills, D. (2008). A versatile and scalable strategy for glycoprofiling bifidobacterial
consumption of human milk oligosaccharides. Microbial Biotechnology, 2(3), 333-342.
doi: 10.1111/j.1751-7915.2008.00072.x
Machado, D., & Herrgård, M. (2014). Systematic Evaluation of Methods for Integration
of Transcriptomic Data into Constraint-Based Models of Metabolism. Plos
Computational Biology, 10(4), e1003580. doi: 10.1371/journal.pcbi.1003580
Magnúsdóttir, S., Heinken, A., Kutt, L., Ravcheev, D., Bauer, E., & Noronha, A. et al.
(2016). Generation of genome-scale metabolic reconstructions for 773 members of the
human gut microbiota. Nature Biotechnology, 35(1), 81-89. doi: 10.1038/nbt.3703
Marcobal, A., & Sonnenburg, J. (2012). Human milk oligosaccharide consumption by
intestinal microbiota. Clinical Microbiology And Infection, 18, 12-15. doi:
10.1111/j.1469-0691.2012.03863.x
The MathWorks Inc. (2018). MATLAB (Version 9.4.0.813654 (R2018a) [Mac]. Natick,
Massachusetts.
Medina, M., Izquierdo, E., Ennahar, S., & Sanz, Y. (2007). Differential
immunomodulatory properties of Bifidobacterium logum strains: relevance to probiotic
selection and clinical applications. Clinical & Experimental Immunology, 150(3), 531-
538. doi: 10.1111/j.1365-2249.2007.03522.x
Metris, A., Reuter, M., Gaskin, D., Baranyi, J., & van Vliet, A. (2011). In vivo and in
silico determination of essential genes of Campylobacter jejuni. BMC Genomics, 12(1).
doi: 10.1186/1471-2164-12-535

43
Pokusaeva, K., Fitzgerald, G., & van Sinderen, D. (2011). Carbohydrate metabolism in
Bifidobacteria. Genes & Nutrition, 6(3), 285-306. doi: 10.1007/s12263-010-0206-6
Reed, J., Vo, T., Schilling, C., & Palsson, B. (2003). Genome Biology, 4(9), R54. doi:
10.1186/gb-2003-4-9-r54
Reed, J., Patel, T., Chen, K., Joyce, A., Applebee, M., & Herring, C. et al. (2006).
Systems approach to refining genome annotation. Proceedings Of The National
Academy Of Sciences, 103(46), 17480-17484. doi: 10.1073/pnas.0603364103
Rossi, M., Corradini, C., Amaretti, A., Nicolini, M., Pompei, A., Zanoni, S., &
Matteuzzi, D. (2005). Fermentation of Fructooligosaccharides and Inulin by
Bifidobacteria: a Comparative Study of Pure and Fecal Cultures. Applied And
Environmental Microbiology, 71(10), 6150-6158. doi: 10.1128/aem.71.10.6150-
6158.2005
Samuel, T., Binia, A., de Castro, C., Thakkar, S., Billeaud, C., & Agosti, M. et al.
(2019). Impact of maternal characteristics on human milk oligosaccharide composition
over the first 4 months of lactation in a cohort of healthy European mothers. Scientific
Reports, 9(1). doi: 10.1038/s41598-019-48337-4
Sánchez, C., Fente, C., Regal, P., Lamas, A., & Lorenzo, M. (2021). Human Milk
Oligosaccharides (HMOs) and Infant Microbiota: A Scoping Review. Foods, 10(6),
1429. doi: 10.3390/foods10061429
Sela, D., Chapman, J., Adeuya, A., Kim, J., Chen, F., & Whitehead, T. et al. (2008). The
genome sequence of Bifidobacterium longum subsp. infantis reveals adaptations for

44
milk utilization within the infant microbiome. Proceedings Of The National Academy Of
Sciences, 105(48), 18964-18969. doi: 10.1073/pnas.0809584105
Sela, D., Garrido, D., Lerno, L., Wu, S., Tan, K., & Eom, H. et al. (2011).
Bifidobacterium longum subsp. infantis ATCC 15697 α-Fucosidases Are Active on
Fucosylated Human Milk Oligosaccharides. Applied And Environmental Microbiology,
78(3), 795-803. doi: 10.1128/aem.06762-11
Thiele, I., Vo, T., Price, N., & Palsson, B. (2005). Expanded Metabolic Reconstruction
of Helicobacter pylori ( i IT341 GSM/GPR): an In Silico Genome-Scale
Characterization of Single- and Double-Deletion Mutants. Journal Of Bacteriology,
187(16), 5818-5830. doi: 10.1128/jb.187.16.5818-5830.2005
Thomson, P., & Garrido, D. (2017). Human Milk Oligosaccharides and Health
Promotion Through the Gut Microbiome. Dairy In Human Health And Disease Across
The Lifespan, 73-86. doi: 10.1016/b978-0-12-809868-4.00005-4
Turroni, F., Milani, C., van Sinderen, D., & Ventura, M. (2011). Genetic strategies for
mucin metabolism inBifidobacterium bifidumPRL2010: An example of possible human-
microbe co-evolution. Gut Microbes, 2(3), 183-189. doi: 10.4161/gmic.2.3.16105
Turroni, F., Milani, C., Duranti, S., Ferrario, C., Lugli, G., & Mancabelli, L. et al.
(2017). Bifidobacteria and the infant gut: an example of co-evolution and natural
selection. Cellular And Molecular Life Sciences, 75(1), 103-118. doi: 10.1007/s00018-
017-2672-0
Van der Meulen, R., Adriany, T., Verbrugghe, K., & De Vuyst, L. (2006). Kinetic
Analysis of Bifidobacterial Metabolism Reveals a Minor Role for Succinic Acid in the

45
Regeneration of NAD + through Its Growth-Associated Production. Applied And
Environmental Microbiology, 72(8), 5204-5210. doi: 10.1128/aem.00146-06
Van Rossum, G., & Drake, F. L. (2009). Python 3 Reference Manual. Scotts Valley, CA:
CreateSpace.
Ward, R., Niñonuevo, M., Mills, D., Lebrilla, C., & German, J. (2006). In Vitro
Fermentation of Breast Milk Oligosaccharides by Bifidobacterium infantis and
Lactobacillus gasseri. Applied And Environmental Microbiology, 72(6), 4497-4499. doi:
10.1128/aem.02515-05
Yatsunenko, T., Rey, F., Manary, M., Trehan, I., Dominguez-Bello, M., & Contreras, M.
et al. (2012). Human gut microbiome viewed across age and geography. Nature,
486(7402), 222-227. doi: 10.1038/nature11053

46
APPENDIX

47
APPENDIX A: MEDIUM COMPOSITION
Table A.1: Metabolites present in simulated modified MRS. [1] Values of
Lactobacilli MRS Broth from United States Biological.
Metabolite g/L[1] mol/200 uL Normalization
Lactose 2101 0.00117 1
Lacto-N-tetraose 2101 0.00057 0.48
Lacto-N-neotetraose 2101 0.00057 0.48
2-Fucosyllactose 2101 0.00082 0.70
3-Fucosyllactose 2101 0.00082 0.70
6-Sialyllactose 2101 0.00063 0.54
Urea 510-1 1.6610-4 0.14
GABA 110-1 1.9410-5 0.02
Alanine 210-1 4.4910-5 0.04
Arginine 210-1 2.3010-5 0.02
Asparagine 110-1 1.5110-5 0.01
Aspartic acid 310-1 4.5110-5 0.04
Cysteine 610-1 9.9010-5 0.08
Glutamic acid 310-1 4.0810-5 0.04
Glycine 210-1 5.3310-5 0.05
Histidine 210-1 2.0910-5 0.02
Isoleucine 110-1 1.5210-5 0.01
Leucine 210-1 3.0510-5 0.03
Lysine 210-1 2.1910-5 0.02
Methionine 110-1 1.3410-5 0.01
Phenylalanine 110-1 1.2110-5 0.01
Proline 210-1 3.4810-5 0.03
Serine 110-1 1.9010-5 0.02
Threonine 110-1 1.6810-5 0.01
Tryptophan 110-1 9.7910-5 0.01
Tyrosine 110-1 1.1010-5 0.01
Valine 110-1 1.7110-5 0.01
Aminobenzoic 210-4 2.9210-8 210-5

48
Biotin 110-3 8.1910-8 710-5
Cyanocobalamin 210-5 2.9510-10 310-7
Folic acid 210-4 9.0610-9 110-5
Myo inositol 110-2 1.1110-6 110-3
Nicotinic acid 110-2 1.6210-6 110-3
Pantothenate 110-2 4.2010-7 410-4
Pyridoxal 110-2 9.8210-7 810-4
Riboflavin 110-2 5.3110-7 510-4
Cytidine 110-1 8.2910-6 710-3
Adenosine 110-1 7.9610-6 710-3
Uridine 110-1 8.7610-6 810-3
Guanine 110-1 1.3210-5 110-2

49
APPENDIX B: RPKM DISTRIBUTION FOR EACH CARBON SOURCE
Figure B-1: RPKM histogram with pareto line for lactose

50
Figure B-2: RPKM histogram with pareto line for LNT

51
Figure B-3: RPKM histogram with pareto line for LNnT

52
Figure B-4: RPKM histogram with pareto line for 2FL

53
Figure B-5: RPKM histogram with pareto line for 3FL

54
Figure B-6: RPKM histogram with pareto line for 6SL

55
APPENDIX C: GENES THAT SHOULD BE EXPRESSED
Table C-1: Reactions that should be expressed based on transcriptomics data.
Genes Reaction Tag Reaction Name
Blon_0029 FERO Ferroxidase
Blon_0070 GLCP3 Glycogen phosphorylase
Blon_0083 ADNCYC Adenylate Cyclase
Blon_0116 FRDOr Ferredoxin oxidoreductase
Blon_0794 HMPK1 Hydroxymethylpyrimidine kinase (ATP)
PMPK Phosphomethylpyrimidine kinase
Blon_0971 GTPDPK GTP diphosphokinase
Blon_1453 GCDCHOLBHSe Glycochenodeoxycholate hydrolysis by bile salt
hydrolase (EC 3.5.1.24)
GCHOLBHSe
Glycocholate hydrolysis by bile salt hydrolase
(EC 3.5.1.24)
TCDCHOLBHSe
Taurochenodeoxycholate hydrolysis by bile salt
hydrolase (EC 3.5.1.24, EC 3.5.1.74)
TCHOLBHSe
Taurocholate hydrolysis by bile salt hydrolase (EC
3.5.1.24)
Blon_1585 UP4GH P1,P4-Bis(5-nucleosyl)-tetraphosphate
nucleotidohydrolase
Blon_1893 GLNSP1 Glutamine synthetase (uaaAgld)
GLNSP2 Glutamine synthetase (uaaGgla)
GLNSP3 Glutamine synthetase (uaagmda)
Blon_1905 BGLA 1,4-beta-D-Glucan glucohydrolase
BGLAr 1,4-beta-D-Glucan glucohydrolase, reversible
MADGBG Beta-glucosidase (methyl-alpha-D-glucoside)
MBDGBG Beta-glucosidase
Blon_1996 NTPTP1 Nucleoside triphosphate tripolyhydrolase
Blon_2073 GCCb Glycine cleavage complex
GCCc Glycine-cleavage complex
Blon_2077 THIORDXi Hydrogen peroxide reductase (thioredoxin)
Blon_2246 AMALT1 Amylomaltase (maltotriose)
AMALT2 Amylomaltase (maltotetraose)
AMALT3 Amylomaltase (maltopentaose)

56
AMALT4 Amylomaltase (maltohexaose)
Blon_2260 FTHFCL 5-Formethyltetrahydrofolate Cyclo-Ligase
Blon_2386 TECAAE Teichoic acid D-alanine substituted export
TECAGE Teichoic acid glucose substituted export
TECAUE Teichoic acid unsubstituted export
Blon_2390 TDPGDH DTDPglucose 4, 6-Dehydratase
Blon_2447 FMNRx2 FMN reductase

57
APPENDIX D: PREDICTED ESSENTIAL GENES
Table D-1: Essential genes with reactions associated and subsystems.
Genes Reaction Subsystem
'Blon_0001' 'dreplication' 'Exchange/demand reaction'
'Blon_0006' 'dreplication' 'Exchange/demand reaction'
'Blon_0007' 'dreplication' 'Exchange/demand reaction'
'Blon_0034' 'H2CO3D' 'Miscellaneous'
'Blon_0160' 'dreplication' 'Exchange/demand reaction'
'Blon_0166' 'ASAD' 'Glycine, serine, alanine, and
threonine metabolism'
'Blon_0171' 'PEPGLY' 'Cell wall biosynthesis'
'Blon_0173' 'dreplication' 'Exchange/demand reaction'
'Blon_0174' 'DTMPK' 'Nucleotide interconversion'
'Blon_0175' 'dreplication' 'Exchange/demand reaction'
'Blon_0320' ALAALA' 'Alanine and aspartate
metabolism'
'Blon_0350' 'rtranscription' 'Exchange/demand reaction'
'Blon_0353' 'MEPCT' 'Terpenoid backbone
biosynthesis'
'Blon_0400' 'rtranscription' 'Exchange/demand reaction'
'Blon_0404' 'PTPAT' 'CoA synthesis'
'Blon_0444' 'MNt2' 'Transport, extracellular'
'Blon_0595' 'THDPS' 'Lysine metabolism'
'Blon_0681' 'ADSL1r' 'Purine synthesis'
'ADSL2r' 'Purine synthesis'
'ARGSL'
'Alanine and aspartate
metabolism'
'Blon_0730' 'dreplication' 'Exchange/demand reaction'
'Blon_0740' 'DGK1' 'Nucleotide interconversion'
'GK1' 'Nucleotide interconversion'
'GK2' 'Nucleotide interconversion'
'Blon_0768' 'GLUR' 'Glutamate metabolism'
'Blon_0769' 'DAPE' 'Lysine metabolism'
'Blon_0779' 'DXPRIr' 'Terpenoid backbone
biosynthesis'

58
'Blon_0780' 'MECDPDH2' 'Terpenoid backbone
biosynthesis'
'Blon_0783' 'FT' 'Cholesterol metabolism'
'IPDPUPT'
'Terpenoid backbone
biosynthesis'
'Blon_0851' 'UAAGDS' 'Cell wall biosynthesis'
'Blon_0853' 'PAPPT2' 'Cell wall biosynthesis'
'PAPPT3' 'Cell wall biosynthesis'
'Blon_0854' 'UAMAGS' 'Cell wall biosynthesis'
'Blon_0856' 'UAGPT2' 'Cell wall biosynthesis'
'UAGPT3' 'Cell wall biosynthesis'
'Blon_0857' 'UAMAS' 'Cell wall biosynthesis'
'Blon_0891' 'dreplication' 'Exchange/demand reaction'
'Blon_0898' 'DMPPS' 'Terpenoid backbone
biosynthesis'
'DMPPS2r'
'Terpenoid backbone
biosynthesis'
'IPDPS'
'Terpenoid backbone
biosynthesis'
'IPDPS2'
'Terpenoid backbone
biosynthesis'
'Blon_0907' 'dreplication' 'Exchange/demand reaction'
'Blon_0908' 'dreplication' 'Exchange/demand reaction'
'Blon_0960' 'rtranscription' 'Exchange/demand reaction'
'Blon_0961' 'dreplication' 'Exchange/demand reaction'
'Blon_0966' 'dreplication' 'Exchange/demand reaction'
'Blon_1010' 'COBALTt5' 'Transport, extracellular'
'MGt5' 'Transport, extracellular'
'Blon_1015' 'dreplication' 'Exchange/demand reaction'
'Blon_1058' 'UMPK' 'Nucleotide interconversion'
'URIDK3' 'Nucleotide interconversion'
'Blon_1151' 'UDCPDP' 'Cell wall biosynthesis'
'Blon_1161' 'SUCOAS' 'Citric acid cycle'
'Blon_1162' 'SUCOAS' 'Citric acid cycle'
'Blon_1164' 'AICART' 'Purine synthesis'
'IMPC' 'Purine synthesis'
'Blon_1167' 'CYTDK3' 'Nucleotide interconversion'
'CYTK1' 'Nucleotide interconversion'
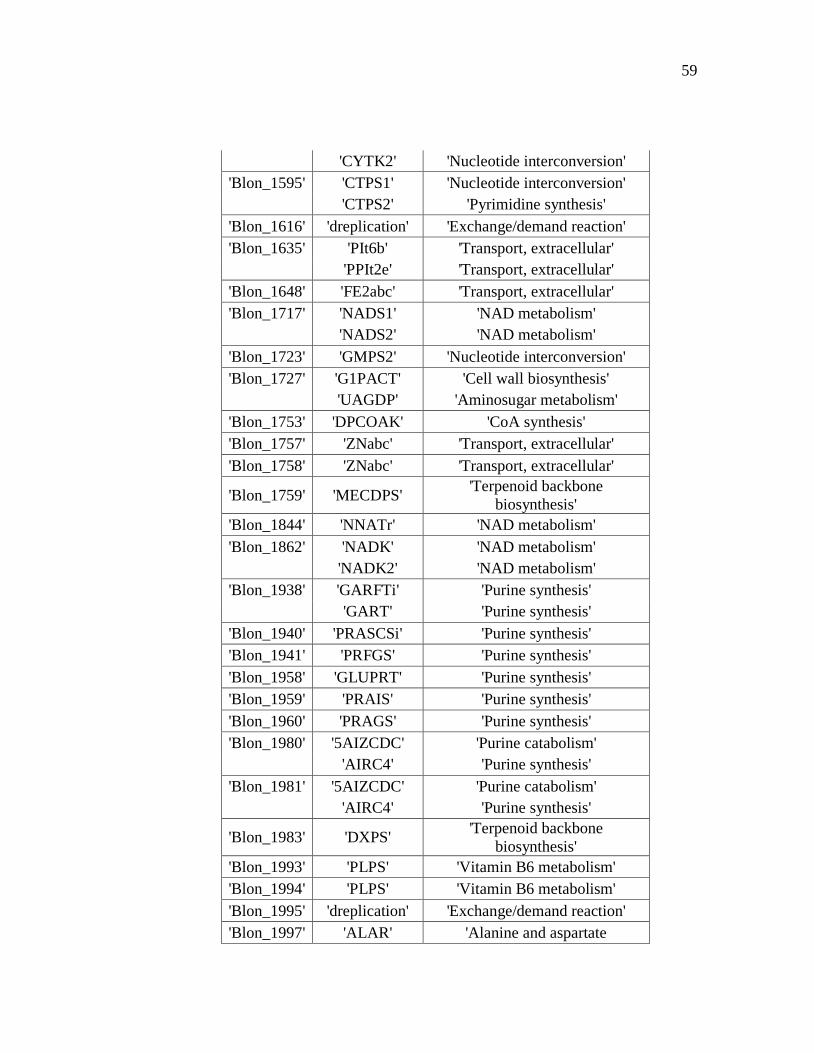
59
'CYTK2' 'Nucleotide interconversion'
'Blon_1595' 'CTPS1' 'Nucleotide interconversion'
'CTPS2' 'Pyrimidine synthesis'
'Blon_1616' 'dreplication' 'Exchange/demand reaction'
'Blon_1635' 'PIt6b' 'Transport, extracellular'
'PPIt2e' 'Transport, extracellular'
'Blon_1648' 'FE2abc' 'Transport, extracellular'
'Blon_1717' 'NADS1' 'NAD metabolism'
'NADS2' 'NAD metabolism'
'Blon_1723' 'GMPS2' 'Nucleotide interconversion'
'Blon_1727' 'G1PACT' 'Cell wall biosynthesis'
'UAGDP' 'Aminosugar metabolism'
'Blon_1753' 'DPCOAK' 'CoA synthesis'
'Blon_1757' 'ZNabc' 'Transport, extracellular'
'Blon_1758' 'ZNabc' 'Transport, extracellular'
'Blon_1759' 'MECDPS' 'Terpenoid backbone
biosynthesis'
'Blon_1844' 'NNATr' 'NAD metabolism'
'Blon_1862' 'NADK' 'NAD metabolism'
'NADK2' 'NAD metabolism'
'Blon_1938' 'GARFTi' 'Purine synthesis'
'GART' 'Purine synthesis'
'Blon_1940' 'PRASCSi' 'Purine synthesis'
'Blon_1941' 'PRFGS' 'Purine synthesis'
'Blon_1958' 'GLUPRT' 'Purine synthesis'
'Blon_1959' 'PRAIS' 'Purine synthesis'
'Blon_1960' 'PRAGS' 'Purine synthesis'
'Blon_1980' '5AIZCDC' 'Purine catabolism'
'AIRC4' 'Purine synthesis'
'Blon_1981' '5AIZCDC' 'Purine catabolism'
'AIRC4' 'Purine synthesis'
'Blon_1983' 'DXPS' 'Terpenoid backbone
biosynthesis'
'Blon_1993' 'PLPS' 'Vitamin B6 metabolism'
'Blon_1994' 'PLPS' 'Vitamin B6 metabolism'
'Blon_1995' 'dreplication' 'Exchange/demand reaction'
'Blon_1997' 'ALAR' 'Alanine and aspartate

60
metabolism'
'Blon_2013' 'PPCDC' 'CoA synthesis'
'PPNCL3' 'CoA synthesis'
'r0671' 'CoA synthesis'
'Blon_2014' 'PNTK' 'CoA synthesis'
'Blon_2031' 'PGAMT' 'Cell wall biosynthesis'
'Blon_2035' 'DHDPRy' 'Lysine metabolism'
'Blon_2048' 'rtranscription' 'Exchange/demand reaction'
'Blon_2049' 'rtranscription' 'Exchange/demand reaction'
'Blon_2052' 'rtranscription' 'Exchange/demand reaction'
'Blon_2131' 'dreplication' 'Exchange/demand reaction'
'Blon_2136' 'METAT' 'Methionine and cysteine
metabolism'
'Blon_2141' 'DHFOR2' 'Folate metabolism'
'DHFR' 'Folate metabolism'
'Blon_2142' 'TMDS' 'Nucleotide interconversion'
'Blon_2195' 'FMNAT' 'Vitamin B2 metabolism'
'RBFK' 'Vitamin B2 metabolism'
'Blon_2199' 'rtranscription' 'Exchange/demand reaction'
'Blon_2211' 'rtranscription' 'Exchange/demand reaction'
'Blon_2216' 'ADK1' 'Nucleotide interconversion'
'ADK10' 'Nucleotide interconversion'
'ADK11' 'Nucleotide interconversion'
'ADK2' 'Nucleotide interconversion'
'ADK3' 'Nucleotide interconversion'
'ADK5' 'Nucleotide interconversion'
'ADK7' 'Nucleotide interconversion'
'ADK8' 'Nucleotide interconversion'
'ADK9' 'Nucleotide interconversion'
'UTPATPT' 'Nucleotide interconversion'
'r0345' 'Nucleotide interconversion'
'Blon_2254' 'UAPGR' 'Cell wall biosynthesis'
'Blon_2303' 'SDPDS' 'Lysine metabolism'
'Blon_2321' 'UAGCVT_r' 'Aminosugar metabolism'
'Blon_2439' 'PHEt2r' 'Transport, extracellular'
'TRPt2r' 'Transport, extracellular'
'TYRt2r' 'Transport, extracellular'
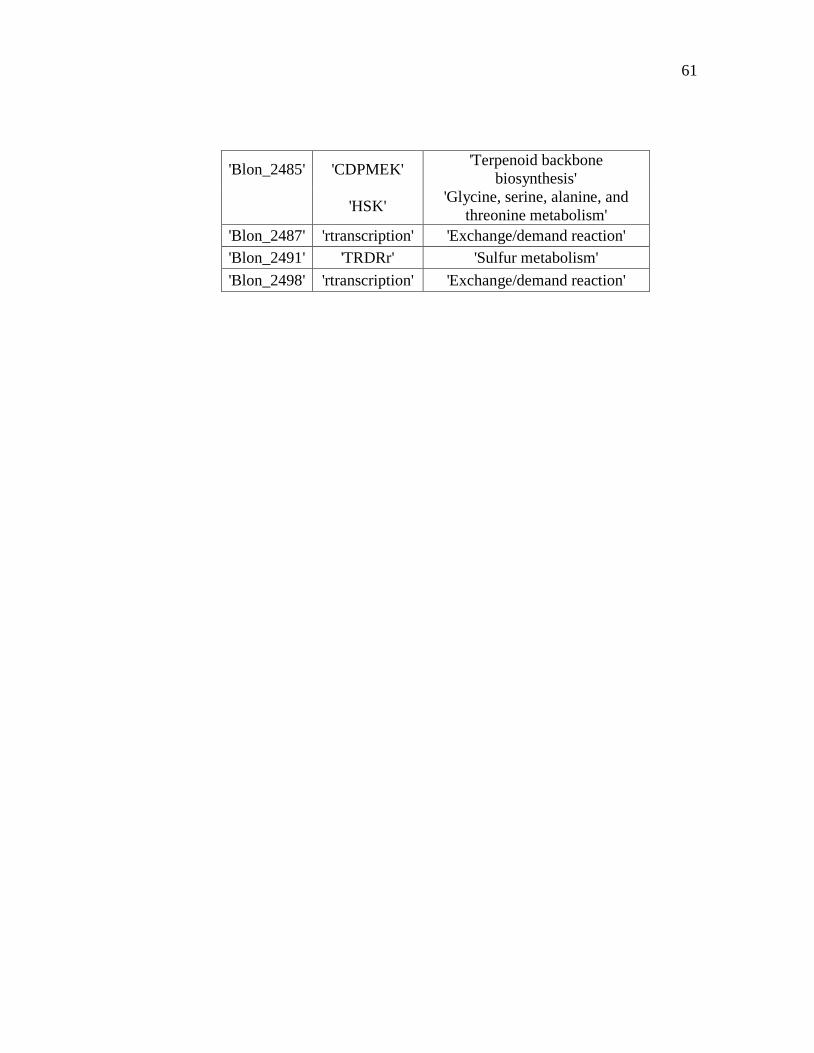
61
'Blon_2485' 'CDPMEK' 'Terpenoid backbone
biosynthesis'
'HSK'
'Glycine, serine, alanine, and
threonine metabolism'
'Blon_2487' 'rtranscription' 'Exchange/demand reaction'
'Blon_2491' 'TRDRr' 'Sulfur metabolism'
'Blon_2498' 'rtranscription' 'Exchange/demand reaction'

62
APPENDIX E: GIMME MAPS
Figure E-1: Flux distribution map and gene expression map for 2FL.

63
Figure E-2: Flux distribution map and gene expression map for 3FL.
Figure D-3: Flux distribution map and gene expression map for lactose.
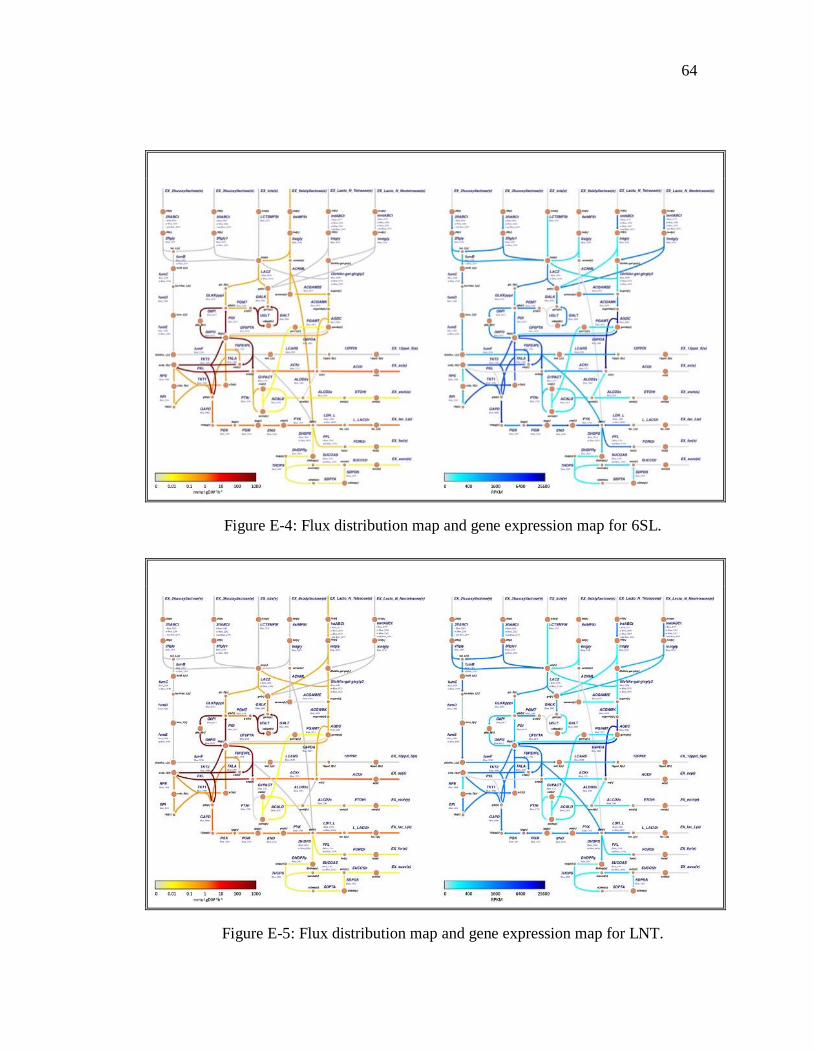
64
Figure E-4: Flux distribution map and gene expression map for 6SL.
Figure E-5: Flux distribution map and gene expression map for LNT.
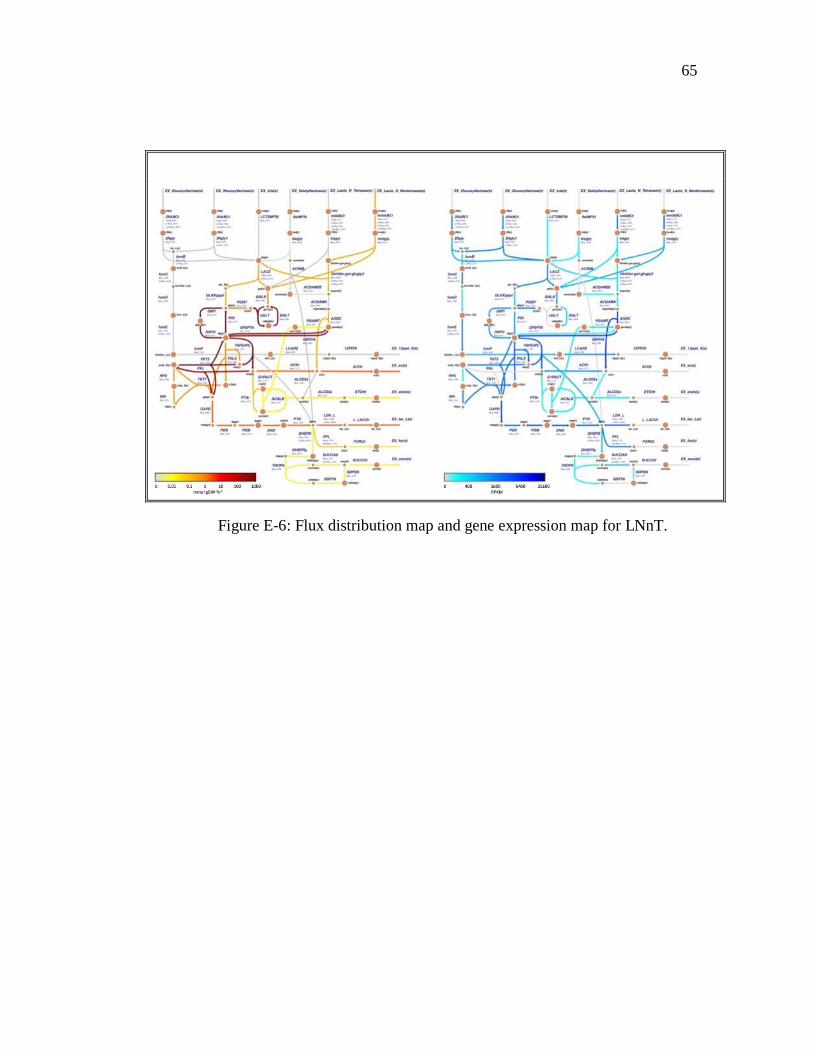
65
Figure E-6: Flux distribution map and gene expression map for LNnT.

66
APPENDIX F: FLUX VS. RPKM CORRELATION
Figure F-1: RPKM vs. Flux graph for 2FL.

67
Figure F-2: RPKM vs. Flux graph for 3FL.

68
Figure F-3: RPKM vs. Flux graph for lactose.

69
Figure F-4: RPKM vs. Flux graph for 6SL.

70
Figure F-5: RPKM vs. Flux graph for LNT.

71
Figure F-6: RPKM vs. Flux graph for LNnT.