Embed Size (px)
Citation preview
Reconstruction and Validationof a Genome-Scale Metabolic
Model for the Filamentous FungusNeurospora crassa Using FARM
The Harvard community has made thisarticle openly available. Please share howthis access benefits you. Your story matters
Citation Dreyfuss, Jonathan M., Jeremy D. Zucker, Heather M. Hood,Linda R. Ocasio, Matthew S. Sachs, and James E. Galagan.2013. “Reconstruction and Validation of a Genome-ScaleMetabolic Model for the Filamentous Fungus Neurospora crassaUsing FARM.” PLoS Computational Biology 9 (7): e1003126.doi:10.1371/journal.pcbi.1003126. http://dx.doi.org/10.1371/journal.pcbi.1003126.
Published Version doi:10.1371/journal.pcbi.1003126
Citable link http://nrs.harvard.edu/urn-3:HUL.InstRepos:11855753
Terms of Use This article was downloaded from Harvard University’s DASHrepository, and is made available under the terms and conditionsapplicable to Other Posted Material, as set forth at http://nrs.harvard.edu/urn-3:HUL.InstRepos:dash.current.terms-of-use#LAA

Reconstruction and Validation of a Genome-ScaleMetabolic Model for the Filamentous Fungus Neurosporacrassa Using FARMJonathan M. Dreyfuss1., Jeremy D. Zucker2,3,4., Heather M. Hood5, Linda R. Ocasio4, Matthew S. Sachs6,
James E. Galagan1,2,3*
1 Graduate Program in Bioinformatics, Boston University, Boston, Massachusetts, United States of America, 2 Department of Biomedical Engineering, Boston University,
Boston, Massachusetts, United States of America, 3 Broad Institute of MIT and Harvard, Cambridge, Massachusetts, United States of America, 4 Tardigrade Biotechnologies,
Jamaica Plain, Massachusetts, United States of America, 5 Institute of Environmental Health, Oregon Health & Science University, Portland, Oregon, United States of
America, 6 Department of Biology, Texas A&M University, College Station, Texas, United States of America
Abstract
The filamentous fungus Neurospora crassa played a central role in the development of twentieth-century genetics,biochemistry and molecular biology, and continues to serve as a model organism for eukaryotic biology. Here, we havereconstructed a genome-scale model of its metabolism. This model consists of 836 metabolic genes, 257 pathways, 6cellular compartments, and is supported by extensive manual curation of 491 literature citations. To aid our reconstruction,we developed three optimization-based algorithms, which together comprise Fast Automated Reconstruction ofMetabolism (FARM). These algorithms are: LInear MEtabolite Dilution Flux Balance Analysis (limed-FBA), which predictsflux while linearly accounting for metabolite dilution; One-step functional Pruning (OnePrune), which removes blockedreactions with a single compact linear program; and Consistent Reproduction Of growth/no-growth Phenotype (CROP),which reconciles differences between in silico and experimental gene essentiality faster than previous approaches. Againstan independent test set of more than 300 essential/non-essential genes that were not used to train the model, the modeldisplays 93% sensitivity and specificity. We also used the model to simulate the biochemical genetics experiments originallyperformed on Neurospora by comprehensively predicting nutrient rescue of essential genes and synthetic lethalinteractions, and we provide detailed pathway-based mechanistic explanations of our predictions. Our model provides areliable computational framework for the integration and interpretation of ongoing experimental efforts in Neurospora, andwe anticipate that our methods will substantially reduce the manual effort required to develop high-quality genome-scalemetabolic models for other organisms.
Citation: Dreyfuss JM, Zucker JD, Hood HM, Ocasio LR, Sachs MS, et al. (2013) Reconstruction and Validation of a Genome-Scale Metabolic Model for theFilamentous Fungus Neurospora crassa Using FARM. PLoS Comput Biol 9(7): e1003126. doi:10.1371/journal.pcbi.1003126
Editor: Costas D. Maranas, The Pennsylvania State University, United States of America
Received January 2, 2013; Accepted May 20, 2013; Published July 18, 2013
Copyright: � 2013 Dreyfuss et al. This is an open-access article distributed under the terms of the Creative Commons Attribution License, which permitsunrestricted use, distribution, and reproduction in any medium, provided the original author and source are credited.
Funding: Funding came from National Institutes of Health grant PO1 GM068087. The funders had no role in study design, data collection and analysis, decisionto publish, or preparation of the manuscript.
Competing Interests: The authors have declared that no competing interests exist.
* E-mail: [email protected]
. These authors contributed equally to this work.
Introduction
First discovered as an orange mold infestation of Paris bakeries
in 1843 [1], the filamentous fungus Neurospora crassa has become a
model organism for eukaryotic biology and the cornerstone of a
vibrant research community [2]. Work on Neurospora has led to
essential discoveries in circadian rhythms [3], epigenetics [4],
genome defense [5], mitochondrial biology [6], post-transcription-
al gene silencing [7] and DNA repair [8]. Most famously, work in
the 1940’s by Beadle and Tatum led to the Nobel Prize-winning
‘one-gene-one-enzyme’ hypothesis that established the fundamen-
tal link between genes and proteins in all organisms [9,10]. Work
on Neurospora thus paved the way for modern genetics and
molecular biology.
Of equal consequence, the work by Beadle and Tatum ushered
in a new era in the study of biochemistry and cellular metabolism.
The genetic facility of Neurospora, coupled with its ability to grow
on minimal media, simplified the isolation of mutants with
additional nutrient requirements. The first such auxotrophic
mutants established the universal link among genes, enzymes,
and the ordering of reactions in biosynthetic pathways. Work over
subsequent decades led to a compilation of hundreds of such
mutants, shedding light on most major biosynthetic pathways [11–
13]. With the sequencing and annotation of the Neurospora genome
[14,15], these genetic data could be organized on a physical
scaffold, genetic markers could be assigned to specific genes with
predicted biochemical functions, genes could be assigned to
previously orphaned biochemical reactions, and a global map of
Neurospora metabolism could begin to emerge.
Genome-scale metabolic models have been constructed for over
100 organisms spanning bacteria to mammalian cells [16]. These
network models capture information about all known metabolic
reactions and the genes that encode enzymes for these reactions in
a computationally structured manner. More than simply a catalog
PLOS Computational Biology | www.ploscompbiol.org 1 July 2013 | Volume 9 | Issue 7 | e1003126

of reactions, network models capture biochemical relationships
between reactions and pathways, afford a framework for
integrating genomic measurements, and provide constraints for
computational inference. One widely used method for computa-
tional inference using metabolic network models is Flux Balance
Analysis (FBA) [17]. FBA calculates the flux of metabolites
through a network under the assumption that metabolism is at
steady state on the time-scales of interest. Using constraint-based
modeling methods like FBA [18], it is possible to predict the
growth rate of organisms under different conditions [19], the rate
of production of metabolites of interest [20], the phenotypic
consequences of gene knockouts, and the metabolic impact of
different gene expression programs [21,22]. Constraint-based
methods are also being used to guide metabolic engineering
efforts by calculating the modifications required to optimize the
production of desired metabolites [23–26].
The wealth of genetic and metabolic data available for
Neurospora, along with ongoing efforts to knock-out and pheno-
typically characterize all ,10,000 genes in the genome [27],
provides a strong foundation for the development of a genome-
scale metabolic model. A metabolic model would, in turn,
complement experimental efforts by integrating data from
experiments on single genes into a coherent genome-wide
metabolic framework, providing potential mechanistic insight
into experimental phenotypic observations, and enabling the
comprehensive modeling of perturbations that could not be
feasibly performed in the lab. A genome-scale model is also a
requirement for the rational and efficient use of Neurospora as a
potential biofuels organism [28–32].
We report here the construction and validation of a high-quality
genome-scale metabolic model for Neurospora crassa. To guide the
process of model construction, we developed a novel suite of
algorithms called Fast Automated Reconstruction of Metabolism (FARM).
We validated the model against an independent gene essentiality
test set, and achieved 93% sensitivity and specificity. We applied
the validated model to comprehensively predict nutrient rescue of
essential genes and synthetic lethal interactions. With these
predictions, we provide potential mechanistic insight into known
mutant phenotypes, and testable hypotheses for novel mutant
phenotypes. More generally, the model provides a framework for
integrating and interpreting ongoing experimental efforts that
continue extend the rich history of biochemical research on
Neurospora.
Results
Modeling processWe reconstructed, validated and performed computational
predictions with the Neurospora metabolic network model in a
process consisting of four stages, as shown in Figure 1. Below we
summarize the steps of the process, then we describe the
optimization-based algorithms we developed to guide the process.
Stage 1: Pathway-directed curation. We integrated the
Neurospora genome and literature to generate an initial draft of the
metabolic network. This process was initiated by computing the
probability that each enzyme activity is encoded in the genome
sequence [14] using the EFICAz enzyme function predictor [33].
These predicted enzyme activities were then automatically
assembled into experimentally elucidated pathways taken from
MetaCyc [34] using the Pathologic pathway prediction algorithm
[35]. Complementing this automated approach, we manually
curated Neurospora-specific literature to identify experimentally
determined enzymes, assign Gene Ontology terms to proteins,
distinguish isozymes from enzyme complexes, catalog growth
observations, and estimate the biomass composition [15,27,36].
Each assertion in the database was labeled with an evidence code
to specify the type of experiment or computation performed to
support its inclusion in the metabolic network [37].
Stage 2: Phenotype-directed curation. We iteratively
improved the initial metabolic model with a manually curated
training set of experimentally observed viability phenotypes on
minimal and supplemented media. We used FARM on this set to
suggest reaction additions/removals that would improve predic-
tion accuracy. These changes were manually reviewed and
accepted only if consistent with published experimental evidence.
Stage 3: Independent validation of model predictions. To
confirm that the final model was not over-fit to a single training set
and to ensure that the predictions of the model could generalize to
new phenotypes, we validated the model using an independent test
set of experimentally observed viability phenotypes.
Stage 4: Comprehensive viability phenotype prediction. We
applied the final model to generate three sets of predictions. Firstly,
we predicted the essentiality of all genes in our model. Secondly, we
predicted which nutrient supplements would rescue a manually
curated set of inviable mutants, and provided mechanistic
explanations for each rescue. Thirdly, we systematically performed
in silico double knockout experiments to predict synthetic lethal
interactions. In all three cases, published observations were
available that validated the accuracy of the predictions. The
metabolic model extends these published observations in a manner
that would be difficult experimentally by assaying a comprehensive
set of conditions, providing novel testable hypotheses, and providing
potential mechanistic insight into these predictions.
FARMA number of significant challenges remain in the reconstruction
of high-quality genome-scale metabolic models [38]. Although
bioinformatic methods exist that can automate the generation of
draft metabolic models [39], extensive manual adjustment and
Author Summary
Few organisms have been as foundational to the devel-opment of modern genetics and cellular metabolism asNeurospora crassa. Given the wealth of knowledgeavailable for this filamentous fungus, the effort requiredto manually curate a high-quality genome-scale metabolicreconstruction would be daunting. To aid the reconstruc-tion process, we developed three optimization-basedalgorithms. The first algorithm predicts flux while linearlyaccounting for metabolite dilution; the second algorithmremoves blocked reactions with one compact linearprogram; and the third algorithm reconciles differencesbetween in silico predictions and experimental observa-tions of mutant viability. We have used these algorithms todevelop the first genome-scale metabolic model forNeurospora. We have validated the accuracy of our modelagainst an independent test set of more than 300 growth/no-growth phenotypes, and our model displays 93%sensitivity and specificity. Simulating the biochemicalgenetics experiments originally performed on Neurospora,we comprehensively predicted essential genes, nutrientrescues of auxotroph mutants and synthetic lethalinteractions. With these predictions, we provide potentialmechanistic insight into known mutant phenotypes, andtestable hypotheses for novel mutant phenotypes. Themodel, the algorithms and the testable hypothesesprovide a computational foundation for the study ofNeurospora crassa metabolism.
Neurospora crassa Metabolic Model Using FARM
PLOS Computational Biology | www.ploscompbiol.org 2 July 2013 | Volume 9 | Issue 7 | e1003126

literature curation remains essential for generating high-quality
models. The assessment of model accuracy through independent
empirical validation is also critical if the predictions of the model
are to be trusted. Although a number of methods have been
developed to aid in this task [40–51], substantial manual effort is
also still required.
To facilitate the automation of metabolic network reconstruc-
tion, we developed three optimization-based algorithms, which
together comprise Fast Automated Reconstruction of Metabolism
(FARM). These algorithms are: LInear MEtabolite Dilution Flux
Balance Analysis (limed-FBA), which predicts flux while linearly
accounting for metabolite dilution; Consistent Reproduction Of growth/
no-growth Phenotype (CROP), which reconciles differences between in
silico and experimental gene essentiality faster than previous
approaches; and One-step functional Pruning (OnePrune), which
removes blocked reactions with a single compact linear program.
LInear MEtabolite Dilution Flux Balance Analysis (limed-
FBA). Flux balance analysis is a widely used method for
predicting metabolic capabilities using genome-scale metabolic
network models [17]. FBA represents a metabolic network by
capturing the stoichiometries of constituent reactions in a
stoichiometric matrix, S. The matrix S and the set of reaction
constraints lb and ub define the set of all possible flux
configurations v at steady state. By defining a metabolic objective
function cTv that represents all the essential biomass components
necessary for growth, linear programming can be used to predict
whether the model supports growth under a given nutrient
condition. The linear programming problem is:
Figure 1. Modeling process. The process used for the reconstruction and validation of the metabolic model is described in four stages. In the firststage, pathway-directed curation, the genome sequence annotation [14,15] , metabolic pathways derived from MetaCyc [34,111] and experimentalevidence from the Neurospora bibliome [37] were used to construct the first draft of the NeurosporaCyc Pathway/Genome database [112]. For thesecond stage, iterative phenotype-directed curation, we utilized FARM to suggest changes to the metabolic network based on a training set ofexperimentally observed growth phenotypes. These suggestions were reviewed manually, and accepted into the final model only if they wereconsistent with published experimental evidence. In the third stage, we independently validated the model based on a test set of experimentallyobserved viability phenotypes that were not utilized during model construction. In the fourth stage, we comprehensively predicted the phenotypes ofall essential genes, nutrient rescues, and synthetic lethal interactions.doi:10.1371/journal.pcbi.1003126.g001
Neurospora crassa Metabolic Model Using FARM
PLOS Computational Biology | www.ploscompbiol.org 3 July 2013 | Volume 9 | Issue 7 | e1003126
maxv
cT v
Sv~0
lbƒvƒub
FBA can be used to predict gene essentiality by blocking reactions
that correspond to the gene knockout and checking if the model
can still support growth [18,52](see Methods).
A known shortcoming of FBA is that it does not account for
dilution of metabolites involved in active reactions [53]. These
metabolites are referred to as active metabolites. Consequently, FBA
can fail to require the biosynthesis of known essential compounds.
For example, the Saccharomyces cerevisiae model [54] suffers its
highest error rate in predicting growth of mutants deficient in
quinone biosynthesis. The reason for this error is that FBA allows
quinones to be recycled in silico, whereas biologically quinones
must be replenished by S. cerevisiae to overcome their growth-
associated dilution. To account for growth-associated dilution of
active metabolites, we developed limed-FBA.
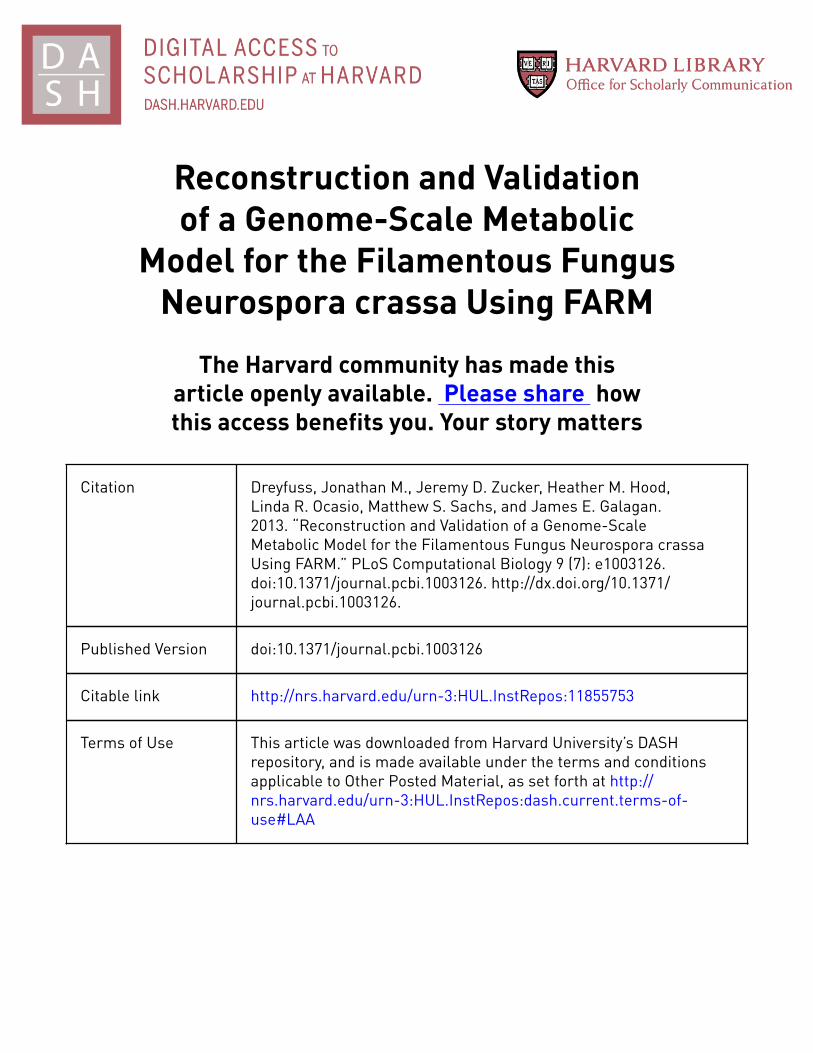
The limed-FBA method works by forcing active metabolites to
dilute through an additional small dilution flux (see Methods). We
illustrate the difference between limed-FBA and FBA in Figure 2.
As shown, FBA does not account for metabolite dilution; it allows
metabolic cycles that lack an input flux (Figure 2A). In contrast,
limed-FBA forces dilution of active metabolites. This dilution
necessitates a counteracting input flux, so limed-FBA disallows
metabolic cycles that lack an input flux, as shown in Figure 2B. A
specific example for Neurospora is shown in Figure 2C, which
focuses on the gene arg-14 that encodes acetylglutamate synthase.
This enzyme acts as an input flux to arginine biosynthesis and is
required for growth [55]. FBA uses the arginine biosynthesis
pathway without input flux from acetylglutamate synthase, and
thus incorrectly predicts arg-14 is not essential. In contrast, limed-
FBA forces dilution of the metabolites in the acetyl cycle, thus
preventing these compounds from being produced without an
input flux. As a consequence, limed-FBA correctly predicts that
arg-14 is essential.
A heuristic that is used in FBA to account for metabolite
dilution is to add a small ‘‘drain’’ of diluted metabolites to the
biomass composition. The issue with this heuristic is that it
requires knowing a priori which metabolites are diluted, whereas
limed-FBA determines which metabolites are diluted based on the
flux. For example if this heuristic was used to add a metabolite in
the cycle of Figure 2, such as N-acetyl-L-glutamate, to biomass,
then FBA would correctly predict the essentiality of arg-14.
However, then FBA would also predict that the arg-14 knockout
cannot be rescued by arginine. In fact, arginine does rescue Darg-
14 experimentally, as correctly predicted by limed-FBA.
Importantly, we designed limed-FBA as a linear program.
Linear programs can be solved robustly and quickly, making
limed-FBA a practical solution to account for metabolite dilution.
An alternative method that has been developed is Metabolite Dilution
FBA (MD-FBA) [53]. MD-FBA accounts for metabolite dilution by
forcing a preset level of dilution for active metabolites. MD-FBA
was shown to predict mutant growth more accurately than FBA
[53], but it has two major drawbacks. (1) MD-FBA places a lower
bound but no upper bound on dilution, so it effectively allows
unlimited export of all metabolites, which is not biologically
plausible; and (2) MD-FBA requires a computationally expensive
mixed integer linear program (MILP), which severely limits its
practicality [53].
Consistent Reproduction Of growth/no-growth Phenotype
(CROP). During stage 2 of our process, we iteratively improved
the ability of the metabolic network model to predict gene knockout
phenotypes. A number of computational algorithms have been
described to maximize consistency between predicted and exper-
imental growth/no-growth phenotypes [39–42,44,49]. These algo-
rithms are typically designed to optimize a MILP, because they
include binary variables to represent whether each reaction should
or should not be included in the metabolic model. One such MILP-
based algorithm is the Model SEED [39,40], which is a fully-
automated model reconstruction process for prokaryotes only.
Another is GrowMatch [41,42], which was designed to make small
changes to models, such as adding or removing up to three
reactions. One limitation of these approaches is that they do not
account for the diverse evidence for reactions available for
Neurospora, including enzyme function predictions, thermodynamic
estimates, literature references, and pathway information, in a
disciplined manner.
To quickly and accurately reconcile inconsistencies between
predicted and experimental growth/no-growth phenotypes, we
developed Consistent Reproduction Of growth/no-growth Phenotype
(CROP). CROP solved inconsistencies while accounting for diverse
evidence. This evidence included (1) whether we had manually
Figure 2. limed-FBA vs FBA. (A) FBA does not require an input flux for cycles because it does not account for dilution of metabolites thatparticipate in active reactions. (B) limed-FBA requires an input flux for cycles to compensate for dilution of metabolites that participate in activereactions. (C) FBA fails to correctly predict arg-14 gene essentiality because without an input flux, metabolite dilution prevents the isolated acetylcycle compounds from being produced (side compounds not shown).doi:10.1371/journal.pcbi.1003126.g002
Neurospora crassa Metabolic Model Using FARM
PLOS Computational Biology | www.ploscompbiol.org 4 July 2013 | Volume 9 | Issue 7 | e1003126

curated a reaction with experimental evidence from the literature,
(2) what pathways a reaction was part of, and whether these
pathways were predicted to be in Neurospora [35], (3) thermodynamic
estimates of Gibbs free energy, and (4) probabilistic estimates of
enzyme function. This evidence was mathematically integrated on a
probabilistic scale to assign each reaction a weight. Our approach to
derive weights in a disciplined manner was motivated by the
statistical maximum a posteriori estimator. Thus, the weights have a
direct probabilistic interpretation: they depend on the product of the
probabilities that the reaction is biochemically and thermodynam-
ically plausible. These weights guided CROP’s growth reconcilia-
tion toward metabolic network changes that were most consistent
with available evidence. To achieve consistency when the model
incorrectly predicts growth, CROP suggests reactions from the
model to remove. To do this, CROP applies MILP. To achieve
consistency when the model incorrectly predicts no-growth, CROP
suggests reactions to add from a database of metabolic reactions,
such as MetaCyc. A detailed comparison of CROP with previous
methods is available in Text S3.
One-step functional pruning (OnePrune). After iteratively
applying CROP to improve the model, reactions can be present
that cannot carry flux under any nutrient condition. These
reactions are referred to as blocked reactions. The removal of blocked
reactions is a process known as functional pruning [56]. Blocked
reactions are often identified according to Flux Variability Analysis
[57,58], however this requires optimizing each reaction separately.
An alternative approach [51] identifies blocked reactions by
successive linear programs, although it is unknown in general how
many LPs are necessary. We developed an algorithm to perform
functional pruning with a single compact linear program,
OnePrune. Conceptually, OnePrune is based on the optimization
approach called goal programming [59]. We include a detailed
account of OnePrune in Methods and in Discussion.
Overview of Neurospora metabolic network modelHere we describe the results of our genome-scale metabolic
reconstruction and its application as a predictive steady-state
model. Following the accepted nomenclature [60] for naming
metabolic models, we call the model N. crassa iJDZ836. N. crassa
iJDZ836 is available in the Systems Biology Markup Language
(SBML) in Dataset S1.
The model contains 836 genes that encode 1027 unique
enzymatic activities. Of these enzyme-catalyzed reactions, 694 are
supported by experimental evidence from 491 publications
addressing Neurospora-specific enzymes. This level of evidence
compares favorably with other highly curated models [61–63] as
shown in Table 1. In addition, 16 spontaneous reactions and 331
orphan reactions were included based on the literature [64–66].
Our model contains 737 chemically unique metabolites. Of these
metabolites, 673 have a defined structure that permits estimates of
Gibbs free energy [67,68]. Using these Gibbs free energy
estimates, 1046 biochemical reactions were thermodynamically
constrained to be irreversible, while the remaining 328 were
assumed to be reversible. Of the 294 biochemical reactions that
were associated with multiple proteins, 47 were manually curated
as being catalyzed by an enzyme complex; we assumed the rest
were catalyzed by isozymes. There are 257 metabolic pathways in
the model. Of these, 134 are biosynthesis pathways, 96 are
degradation/utilization/assimilation pathways, and 27 are path-
ways involved in the generation of precursor metabolites and
energy. An overview of the pathways is displayed in Figure 3 and a
zoomable metabolic map of the pathways is shown in Figure S3.
Cellular compartments in the model include the cytosol, the
extracellular space, and 4 organelles: the glyoxysome, the vacuole,
the nucleus, and the mitochondrion. The 299 transport reactions
of the model enabled not only uptake and export of 137
metabolites, but also the exchange of metabolites between the
cytosol and each organelle.
The model’s growth objective was based on a modular biomass
composition [69,70]. Biomass modules were separately defined for
DNA, RNA, amino acids, cell wall, lipids, sterols, essential
cofactors, and secondary metabolites. This modular decomposi-
tion allowed for different goals in different applications of the
model. For example, wild-type biomass contains substantial
amounts of secondary metabolites, such as sphingolipids, ergos-
terol and carotenoids (which give Neurospora its characteristic
orange color), so we included the secondary metabolites module in
the biomass composition when predicting wild-type fluxes. On the
other hand, secondary metabolites are not strictly required for
viability, so we removed this module from the biomass compo-
sition when predicting viability.
The model quantitatively captures the growth rate of Neuros-
pora. To illustrate this, we have plotted a range of glucose uptake
rates against the model’s predicted doubling times, and several
data points extracted from the experimental literature [71–73]
(Figure S4). The figure shows that our predictions closely match
the experimental data.
Model validation using gene essentialityTo validate the accuracy of the N. crassa iJDZ836 model, we
manually curated a collection of mutant viability phenotypes from
the literature. We split this collection into a training set, which we
used with FARM to construct the model; and an independent test
set, which we used to validate the final model. Both of these
collections are available in Table S1. To simulate gene knockout
experiments, we removed reactions from the model that depend
on the gene, applied limed-FBA, and predicted whether or not the
perturbed model could grow. We then compared experimental
observations to the model’s in silico predictions. Accuracy was
measured as two quantities: sensitivity and specificity. Sensitivity
was defined as the proportion of experimentally viable mutants
that were predicted to be viable in silico. Specificity was defined as
the proportion of experimentally inviable mutants that were
predicted to be inviable in silico.
The final model’s predictive accuracy using limed-FBA is shown
in Figure 4A. On the training set, we correctly predicted growth in
Table 1. Comparison of curation level among selected metabolic models.
N.crassa iJDZ836 Aspergillus niger iMA871 Yeast 5.0 E.coli iJO1366
Number of organism-specific citations 491 371 385 447
Coverage 47% 47% 37% 46%
Coverage is the percentage of enzyme-catalyzed reactions that are supported by organism-specific experimental evidence.doi:10.1371/journal.pcbi.1003126.t001
Neurospora crassa Metabolic Model Using FARM
PLOS Computational Biology | www.ploscompbiol.org 5 July 2013 | Volume 9 | Issue 7 | e1003126

107 of 108 experimentally viable gene knockouts (sensitivi-
ty = 99.1%), and we correctly predicted no-growth in 44 of 47
experimentally lethal mutants (specificity = 93.6%). On the test set,
we correctly predicted 270 of 289 experimentally viable gene
knockouts (sensitivity = 93.4%), and we correctly predicted 13 of
14 experimentally lethal mutants (specificity = 92.9%).
The final model’s predictive accuracy on the test and training
sets using FBA and MD-FBA is shown in Figure 4B. Both of these
methods are generally outperformed by limed-FBA.
The differences between FBA and limed-FBA can reveal subtle
issues with existing experimental data. For example, because FBA
allows recycling of coenzyme A and the biosynthesis of coenzyme
A requires pan-2 [74], the essentiality of pan-2 is missed by FBA. In
contrast, limed-FBA correctly predicts essentiality of pan-2.
Similarly, three other genes involved in coenzyme A biosynthesis
(NCU08925 and pan-3) and mitochondrial transport (mic-30) were
predicted to be essential by limed-FBA, but not by FBA.
Surprisingly, these three genes were in our test set of non-essentials.
A potential explanation for these inconsistencies is that the
function of these genes can be performed by an isozyme that was
not captured in our model. In addition to these three genes, there
is one more gene from our test set of non-essentials where limed-
FBA predicted essentiality, but FBA predicted non-essentiality.
This gene is pab-1. Like arg-14 (Figure 2C), pab-1 serves as input to
a metabolic cycle, so pab-1 is not required by FBA. However,
consistent with limed-FBA’s prediction, the pab-1 gene was
reported to be essential by Beadle and Tatum’s original
publication [9,10].
In the left panel of Figure 4C, we compared the N. crassa
iJDZ836 gene essentiality accuracy statistics on the training set to
the reported accuracies Escherichia coli and S. cerevisiae models that
were optimized using experimental observations of gene essenti-
ality [41,42]. In the right panel of Figure 4C, we compared the N.
crassa iJDZ836 gene essentiality accuracy statistics on the test set to
the accuracy statistics reported in the most recently published
models of E. coli [63] and S. cerevisiae [62]. In all cases, the N. crassa
iJDZ836 model prediction accuracies compare favorably,
outperforming the specificities of the extensively trained models
for E. coli and S. cerevisiae.
The prediction of gene essentiality for all genes in the model is
available in Table S2.
Experimentally observed inviable mutants that were
predicted viable. There were four inconsistencies where the
model predicted viability and experimental data indicated
lethality; these were thi-4, ace-7, and ace-8 in the training set, and
arg-4 in the test set. The gene thi-4 is required for its role in the
thiamin diphosphate (TPP) biosynthesis pathway. However, this
pathway includes the eukaryotic thiazole synthase, and to the best
of our knowledge its reaction has not been characterized. Thus,
this pathway was not included in the model. The incorrect
prediction of the ace-7 and ace-8 mutants from the training set is
likely due to regulatory effects, which our model does not capture.
ace-7 encodes a subunit of glucose-6-phosphate dehydrogenase,
and it has been experimentally shown that glucose-6-phosphate
dehydrogenase tightly controls NADPH regeneration [29,75–78].
But since the model predicts that NADPH can be regenerated by
many enzymes, we were unable to capture the essentiality of ace-7.
The gene ace-8 encodes pyruvate kinase, which is known to
partially control glycolysis [79]. Thus, loss of ace-8 could inhibit
glycolysis in vivo, which would be lethal. But since the model
predicts that pyruvate kinase’s function can be circumvented by
other enzyme activities, the model was unable to capture the
essentiality of ace-8.
The only inconsistency in the test set where the model predicted
viability was arg-4, which encodes acetylornithine-glutamate
transacetylase. Upon closer examination, it turned out this mutant
was experimentally observed to have some growth, albeit very little
[80]. The model mechanistically explains viability by predicting
that loss of acetylornithine-glutamate transacetylase activity can be
compensated by acetylornithine deacetylase activity encoded by
arg-11. Furthermore we do predict that the double knockout Darg-
4Darg-11 is synthetically lethal (see Figure S1).
Experimentally observed viable mutants that were
predicted inviable. There was only one inconsistency in the
Figure 3. Metabolic overview of Neurospora crassa. The 257 metabolic pathways of Neurospora are divided into the 35 color-coded pathwayclasses. Biosynthetic pathways are displayed on the left, energy metabolism in the center, and degradation pathways are on the right. In addition tothe cytosol and extracellular space, the model also contains 4 organelles: these are the vacuole, the nucleus, and the mitochondrion. The 299transport reactions enable uptake and excretion of 137 metabolites and also exchange between the cytosol and each organelle.doi:10.1371/journal.pcbi.1003126.g003
Neurospora crassa Metabolic Model Using FARM
PLOS Computational Biology | www.ploscompbiol.org 6 July 2013 | Volume 9 | Issue 7 | e1003126

training set where the model predicted lethality and the
experimental data indicated viability, and this prediction revealed
an error in the underlying experimental data. The experimental
phenotyping for the Derg-14 knockout indicated growth, and hence
we included this gene in the non-essential training set. In contrast,
the model predicted that the Derg-14 knockout was blocked in the
production of mevalonate, which is a necessary precursor for the
sterol component of biomass. Moreover, previous attempts to
phenotype temperature-sensitive mutants of erg-14 revealed severe
morphological defects that were expected to be lethal in the full
knockout [81]. Driven by these inconsistencies, a re-examination
of the Derg-14 knockout strain revealed this mutant used was in
fact a heterokaryon that retained a copy of the erg-14 gene rather
than a homokaryon that contained no erg-14 gene, as originally
thought. Thus the predictions of the model were sufficient to
correct an error in metadata associated with a publically available
knockout strain.
We identified 19 inconsistencies in the test set where the model
predicted inviability and experimental data [82] indicated
viability. We describe these in Text S1.
Prediction of nutrient rescueTo validate the ability of the N. crassa iJDZ836 model to predict
nutrient supplements that would rescue auxotroph mutants, we
manually curated a collection of nutrient rescue conditions from
the literature. We split this collection into a training set, which we
used with FARM to construct the model; and an independent test
set, which we used to validate the final model. Both of these
collections are available in Table S1. The predictions of nutrient
rescues are available in Table S2. To simulate nutrient rescue
experiments, we took a mutant that was predicted to be inviable
on minimal media, supplemented the media with different
nutrients, and applied limed-FBA to predict whether or not the
mutant could grow in the supplemented media. We then
Figure 4. Minimal media gene essentiality predictions. We curated a collection of mutant viability observations on minimal media andseparated the collection into a training set, where knowledge of the viability phenotype was used to improve the model; and a test set, where theviability phenotype was hidden from the model. (A) Training and test set mutant viability observations were used to measure the sensitivity andspecificity of the limed-FBA gene knockout viability predictions. While some inconsistencies were due to model error, several were resolved in themodel’s favor, as discussed in the text. (B) Using the same model, training and test sets, limed-FBA outperforms FBA and MD-FBA. (C) For comparison,we display the mutant viability prediction accuracies of previously published FBA models for S. cerevisiae and E. coli. Prediction accuracies ofexperimentally observed viability phenotypes that were used to optimize the model are displayed on the left panel [41,42]. Prediction accuracies ofviability phenotypes that were not explicitly used to construct the model are displayed on the right panel [62,63].doi:10.1371/journal.pcbi.1003126.g004
Neurospora crassa Metabolic Model Using FARM
PLOS Computational Biology | www.ploscompbiol.org 7 July 2013 | Volume 9 | Issue 7 | e1003126

compared experimental observations to the model’s in silico
predictions.
Of the 77 experimentally observed nutrient rescue conditions
that we used as a training set, the model correctly predicted 74
(sensitivity = 96.1%)(Figure 5A; left panel). On the independent
test set of 19 nutrient rescue conditions, the model correctly
predicted 17 (sensitivity = 89.5%)(Figure 5A; right panel).
Experimentally observed nutrient rescues that were not
predicted. In the training set, the only auxotrophs we were
unable to correctly rescue were due to condition-specific
regulation that our model does not capture. According to
experimental observation, mutants in ace-2, ace-3 and ace-4 can
grow in acetate minimal media, because the enzymes in the
glyoxysome are induced when extracellular acetate is present in
the medium [83]. Conversely, ace-2, ace-3 and ace-4 mutants
cannot grow in sucrose minimal media, even though sucrose can
be converted to acetate intracellularly, because the glyoxysomal
enzymes are not expressed in this condition [1]. Because the
acetate-dependent regulation of the glyoxysome is not included in
our model, we could not successfully predict both their inviability
in sucrose minimal media and their rescue by acetate supplemen-
tation.
In the test set, we were unable to correctly rescue ad-5 by
hypoxanthine or adenine due to large amounts of experimentally
observed accumulation of AICAR [84], which neither FBA nor
limed-FBA allow. When we relaxed the in silico constraint on
Figure 5. Prediction of nutrient rescue. We curated a collection of conditions in which an auxotroph was rescued when minimal media wassupplemented with a nutrient. We separated the collection into a training set, where knowledge of the rescue phenotype was used to improve themodel, and a test set, where the rescue phenotype was hidden from the model. Because we only collected data on which nutrients rescued theauxotrophs, we could only measure sensitivity, not specificity. (A) Tables showing the sensitivity of limed-FBA predictions on nutrient rescue trainingand test sets. (B) Heatmap showing the growth phenotype of each mutant when minimal media is supplemented with each nutrient used in thetraining and test sets. Only mutants whose minimal media gene essentiality was correctly predicted are included. The minimal media used wasVogel’s with sucrose as the carbon source except in the following cases: acu-3,5,6 genes are essential when acetate is the sole carbon source; oxD isessential when D-methionine is the sole sulfur source; nit-3 is essential when nitrate is the sole nitrogen source. Green squares indicate that themodel’s predictions were consistent with experiment; red squares indicate that the model failed to correctly predict growth; blue squares indicatepotentially novel rescues; white squares indicate predictions of non-rescue. Striped squares show that the multi-substrate case does not containadditional information beyond the single-substrate case, e.g. methionine is predicted to rescue the cys-4 mutant, so methionine+threonine is alsopredicted to rescue cys-4.doi:10.1371/journal.pcbi.1003126.g005
Neurospora crassa Metabolic Model Using FARM
PLOS Computational Biology | www.ploscompbiol.org 8 July 2013 | Volume 9 | Issue 7 | e1003126

intracellular accumulation of AICAR, the hypoxanthine and
adenine rescues of ad-5 were correctly predicted.
Mechanistic insight of nutrient rescue. Simulating the
biochemical genetics experiments originally performed on Neuros-
pora, we predicted 175 nutrient rescues of 58 auxotroph mutants.
These predictions are shown in Figure 5B. In addition to
predicting the nutrient conditions that rescue selected mutants,
the model also provides a potential mechanistic explanation for the
rescue.
Most of the predictions can be explained by the general
principle that supplementing a metabolic pathway downstream of
a knockout will often rescue the mutant, while supplementing the
pathway upstream of the knockout typically does not [9]. This is
illustrated in Figure 6, where the model correctly predicts that cys-
5, cys-9, and cys-11 mutants can be rescued when the downstream
nutrients sulfite and thiosulfate are provided in the media [85].
Similarly, the model correctly predicts that met-2, met-5, met-6, met-
7 and met-8 mutants are rescued by L-methionine; met-2, met-5 and
met-7 mutants are rescued by L-homocysteine; and met-5 and met-7
mutants are rescued by L-cystathione [86,87].
This principle provides a testable hypothesis for the novel
predictions that hom-1 and all cys mutants can be rescued by the
downstream supplements L-cystathione, L-homocysteine and L-
methionine (see Figure 6). Conversely, we also predict that the cys-
4 mutant is not rescued by either upstream supplements sulfite or
thiosulfate.
Using this principle, Figure 7 shows how the nutrient rescue of
acu mutants can be explained by examining the connection
between the glyoxylate cycle and gluconeogenesis. acu-3, acu-5 and
acu-6 mutants are known to be lethal when acetate is the sole
carbon source, because the glyoxylate cycle is blocked [88]. We
correctly predict these mutants can be rescued by sucrose [89],
and we additionally predict they can be rescued when supple-
mented with fructofuranose and glucose, because the enzymes
encoded by acu-3, acu-5, and acu-6 are upstream of these sugars in
the gluconeogenesis pathway.
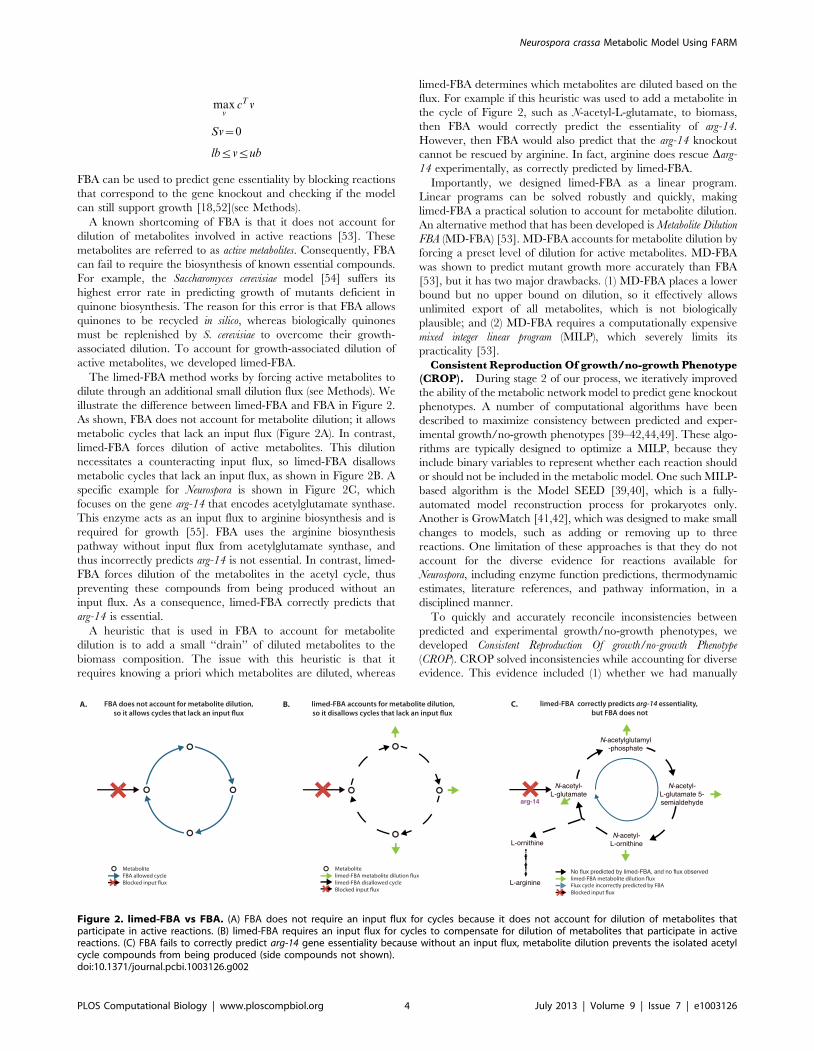
Some novel nutrient rescue predictions can be explained by the
existence of an alternate pathway from the nutrient to an essential
metabolite that could not otherwise be produced. For example,
Figure 8 shows that the ace-2, ace-3, and ace-4 gene products are all
components of the pyruvate dehydrogenase complex, which
synthesizes acetyl-CoA from pyruvate, and that this activity leads
to the production of the essential metabolite 2-oxoglutarate
(a-ketoglutarate) via the TCA cycle. The model also predicts that
ace-2,3,4 mutants can be rescued by L-citrulline, L-arginine, L-
ornithine, and L-glutamine, because each of these nutrients can
produce 2-oxoglutarate via amino acid degradation pathways.
Prediction of synthetic lethal interactionsPairwise synthetic lethality arises when two mutants with single
gene knockouts are viable, but the double knockout mutant is
inviable. Synthetic lethality can reveal cross-pathway dependen-
cies that provide valuable insights into metabolism at the genome
scale, but an experimental approach to comprehensively perform
double knockouts to identify synthetic lethals is currently infeasible
for Neurospora. Computational models provide a mechanism to
rapidly and comprehensively test all interactions as a way to
prioritize subsequent experimental verification. To predict syn-
thetic lethality using the model, we simulated all pairs of knockouts
of non-essential genes and predicted viability on minimal media.
Of the roughly 700,000 double knockouts in the metabolic
model, the model predicted 230 to be synthetically lethal on
minimal media. The mechanisms underlying these predicted
synthetic lethal interactions fall into three classes: those that
encode isozymes of a common reaction, those that encode
enzymes of a common pathway, and those that encode enzymes
of interacting pathways. This list contains 22 isozyme pairs, 4 gene
pairs in the same pathway, and 204 gene pairs in interacting
pathways. All of these pairs are tabulated in Table S2. The non-
isozyme gene pairs and a previously known isozyme pair are
displayed in a symmetric interaction map in Figure 9. This
interaction map classifies each synthetic lethal pair by whether or
not the two genes are in a common pathway or interacting
pathways.
Mechanistic insight of synthetic lethal interactions. To
validate the ability of the model to predict synthetic lethality, we
manually curated a small number of experimentally observed
synthetic lethal interactions. Some of these interactions involved
the arg-2 mutant, which is known to be ‘‘leaky’’ [55]. We used the
remaining synthetic lethal interactions to validate our results. Of
these 5 experimentally observed synthetic lethal interactions, the
model correctly predicts 4.
The single known interaction not predicted by the model is for
the double mutant pho-4:pho-5 [90]. Both of these genes are high-
affinity phosphate transporters, but the model also includes a
known low-affinity phosphate transporter. The model treats each
of these transporters equally, because it lacks kinetics, so it predicts
the pho-4:pho-5 mutant is viable.
Figure 10 shows three known synthetic lethal interactions that
we correctly predict. Figure 10A provides an example of synthetic
lethality arising from mutations in a common pathway. The
nitrogen assimilation pathway fixes the nutrient nitrate into the
essential metabolite glutamine. Both the am and en(am)-2 mutants
are viable, because they represent the two alternate routes to
synthesize glutamine. However, the double mutant am:en(am)-2 is
blocked in both routes, so it is inviable, unless the nutrient media is
supplemented with glutamate.
Figure 10B provides an example of synthetic lethality arising
from mutations in two interacting pathways. The pathways for
proline biosynthesis and arginine degradation both synthesize
glutamate-semialdehyde, which is a precursor to the essential
metabolite L-proline. Both the pro-3 (glutamate-5-semialdehyde
dehydrogenase) mutant in proline biosynthesis, and the ota
(acetylornithine transaminase) mutant in arginine degradation
are viable, because they represent the two alternate routes to
synthesize L-proline. However, the double mutant pro-3:ota is
blocked in both routes, so it is inviable, unless the nutrient media is
supplemented with L-proline.
Figure 10C provides another example of synthetic lethality
arising from two interacting pathways. On uracil-containing
media, the uridine-59-phosphate synthesis pathway and the path
from uracil to uridine-59-phosphate (UMP) both synthesize the
essential UMP. So on uracil-containing media, both pyr-1
(dihydroorotate dehydrogenase) in uridine-59-phosphate synthesis
and uc-5 (uracil permease) are viable, because they represent the
two alternate routes to synthesize UMP. Consequently, the double
mutant pyr-1:uc-5 on uracil-containing media is blocked in both
routes, so it is inviable. Further, the pyr-1:uc-5 mutant can be
rescued by uridine, since uridine can be phosphorylated to UMP.
The novel predictions of synthetic lethality provide testable
hypotheses for further experimentation. For example, the model
predicts synthetic lethality between NCU02726 (ethanolamine
kinase) and gsl-3 (3-dehydrosphinganine reductase). The products
of these two genes catalyze reactions in two different pathways that
lead to the production of the essential metabolite phosphoryl-
ethanolamine. Ethanolamine kinase converts ethanolamine to
phosphoryl-ethanolamine in a single reaction. Without ethanol-
amine kinase, the model predicts that phosphoryl-ethanolamine
Neurospora crassa Metabolic Model Using FARM
PLOS Computational Biology | www.ploscompbiol.org 9 July 2013 | Volume 9 | Issue 7 | e1003126

must be produced from the sphingolipid metabolism pathway.
This requires the activity of gsl-3, which is an upstream member of
this pathway.
Figure S2 illustrates the potential mechanism underlying the
predicted synthetic lethality between the suc gene (pyruvate
carboxylase) and subunits of mitochondrial complex I (NADH:
Figure 6. Mechanistic insight into the nutrient rescue of cysteine and methionine metabolism. The model correctly predicts that cys-5,cys-9, and cys-11 mutants can be rescued when the downstream nutrients sulfite and thiosulfate are provided in the media. Similarly, the modelcorrectly predicts that met-2, met-5, met-6, met7 and met-8 mutants are rescued by L-methionine; met-2, met-5 and met-7 mutants are rescued byL-homocysteine; and met-5 and met-7 mutants are rescued by L-cystathione. The model makes the potentially novel predictions that hom-1 and allcys mutants can be rescued by the downstream supplements L-cystathione, L-homocysteine and L-methionine. The model also makes the potentiallynovel prediction that cys-4 is not rescued by either upstream nutrient supplements sulfite or thiosulfate.doi:10.1371/journal.pcbi.1003126.g006
Neurospora crassa Metabolic Model Using FARM
PLOS Computational Biology | www.ploscompbiol.org 10 July 2013 | Volume 9 | Issue 7 | e1003126

Figure 7. Connection between glyoxylate cycle and gluconeogenesis reveals mechanistic insight into the nutrient rescue of acumutants. acu-3, acu-5 and acu-6 mutants are known to be lethal when acetate is the sole carbon source, because the glyoxylate cycle is blocked [88].We correctly predict these mutants can be rescued by sucrose, and we additionally predict they can be rescued when supplemented withfructofuranose and glucose, because the enzymes encoded by acu-3, acu-5, and acu-6 are upstream of these sugars in the gluconeogenesis pathway.doi:10.1371/journal.pcbi.1003126.g007
Neurospora crassa Metabolic Model Using FARM
PLOS Computational Biology | www.ploscompbiol.org 11 July 2013 | Volume 9 | Issue 7 | e1003126
ubiquinone oxidoreductase). Under normal circumstances,
NADH produced in the mitochondrial TCA cycle is oxidized to
NAD in the electron transport chain via NADH:ubiquinone
oxidoreductase. Yet, the loss of complex I is known to be non-
lethal in Neurospora [91]. This places a metabolic burden on the rest
of mitochondrial metabolism to oxidize the NADH. The model
predicts that in the absence of complex I, NADH is oxidized by
malate dehydrogenase in the reverse direction of the normal TCA
cycle flux. To maintain this flux, the mitochondrion requires a
steady source of oxaloacetate, which can only be supplied from
pyruvate carboxylase, encoded by suc. This synthetic interaction is
particularly noteworthy, because S. cerevisiae lacks complex I,
making Neurospora a prime model for studying its interactions.
Discussion
Building on its long history as a genetic model organism for
biochemical genetics and cellular metabolism, we report here the
first genome-scale metabolic network model for Neurospora crassa.
We assessed the Neurospora metabolic model’s ability to predict the
impact of gene deletions, nutrient supplements that would rescue
essential gene deletions, and synthetic lethal interactions. In each
case, computational predictions were validated against a curated
dataset of experimentally observed mutant viability phenotypes.
Importantly, to ensure that our model was not over-fit, we
separated the experimental data into a training and test set.
Whereas training data was used in the development of the model,
the test set was reserved to assess the accuracy of the final model.
The final accuracy assessment was thus independent of any data
used during model training.
The prediction of the growth phenotype of gene deletions is a
canonical test of metabolic model accuracy and a useful benchmark
for assessing the quality of different models [92]. The accuracy of
our model compares favorably to extensively curated models such as
S. cerevisiae and E. coli. Moreover, at 93% sensitivity and specificity
on a test set of 303 phenotyped gene knockouts, the Neurospora model
displays high absolute accuracy that lends confidence to the ability
of the model to make accurate novel predictions.
The N. crassa iJDZ836 model also demonstrates high accuracy
in predicting the ability of different nutrients to rescue essential
gene knockouts and in predicting synthetic lethal interactions. In
the former case, the model displays nearly 90% accuracy on an
independent test set of nutrient rescue experiments. In the latter
case, we were only able to curate a handful of experimentally
verified synthetic lethal interactions. Nonetheless, although no
synthetic lethal data was used during model training, the model
was able to correctly identify four out of five known synthetic lethal
interactions.
Genome-scale metabolic models complement experimental
investigations, and one role of metabolic modeling is to rapidly
Figure 8. Supplementing with nutrients in alternate pathways can rescue some mutants. The model makes the novel prediction that ace-2, ace-3, and ace-4 mutants (purple) in the TCA cycle can be rescued by supplementing minimal media with L-citrulline, L-arginine, L-ornithine, or L-glutamine (light blue) because each of these nutrients provide an alternate route via amino acid pathways to the essential metabolite 2-oxoglutarate(red).doi:10.1371/journal.pcbi.1003126.g008
Neurospora crassa Metabolic Model Using FARM
PLOS Computational Biology | www.ploscompbiol.org 12 July 2013 | Volume 9 | Issue 7 | e1003126

generate and prioritize testable predictions that can be used to
guide subsequent experimentation. As important as the predictions
themselves, metabolic models also provide potential mechanistic
explanations for the results. The explanations provide an
important check on the overlying predictions. During the
validation of models, these explanations ensure that not only are
correct answers given, they are given for valid underlying reasons.
For novel predictions, mechanistic explanations can provide
potential insight into the results as well as tangible avenues to
experimental validation. To illustrate the last point, in Text S4 and
Figure S5 we simulate the observed physiological effect of oxygen
limitation on ethanol production when grown on xylose.
Therefore, our model can be used to simulate perturbations that
optimize ethanol yield, which can then be verified experimentally.
As with all previous modeling efforts, errors in predicting known
experimental results highlight limitations in either the model itself
or the modeling framework. In terms of the model, the quality will
only be as good as the information that was used to develop it. In
the case of Neurospora, the extraordinarily rich literature for this
well-studied model organism was the foundation that enabled a
model to be generated that performed with high accuracy.
Nonetheless, certain areas of the model remain less well developed,
and one value of model construction is the objective measure it can
provide on the relative information available for different aspects
of metabolism. This can be used to target areas that are less well
understood. For example, the substrates of certain reactions in the
thiamin diphosphate and neurosporaxanthin biosynthesis path-
ways and the fate of the end-product in the histidine degradation
pathway cannot be included with confidence in any metabolic
model, because they are open biochemical questions [93].
More generally, the constraint-based modeling framework we
used here is known to suffer from certain limitations. As with
similar models, this accounts for a significant portion of the
prediction errors in the Neurospora model. In particular, our model
does not account for regulation of either enzyme expression or
activity. These factors sometimes acted in combination. An
illustrative example is gln-1 and gln-2, which code for the alpha
and beta subunit, respectively, of glutamine synthetase [94]. Our
model requires both subunits for enzyme catalysis. However, it
was experimentally shown that concentration of extracellular
ammonium regulates this enzyme’s subunit composition, which
can include both subunits, only alpha subunits, or only beta
Figure 9. Synthetic lethality interaction map. This gene-by-gene interaction map shows synthetic lethal predictions on Vogel’s minimal media,except the double mutant pyr-1:uc-5 is on Vogel’s+uracil. Shown are non-isozyme pairs, except the previously known isozyme pair cys-13:cys-14. Ifboth synthetic lethal genes of a pair are in a common pathway, the square is cyan; if they are in interacting pathways, then it is colored orange.Validated synthetic lethal predictions have a black border.doi:10.1371/journal.pcbi.1003126.g009
Neurospora crassa Metabolic Model Using FARM
PLOS Computational Biology | www.ploscompbiol.org 13 July 2013 | Volume 9 | Issue 7 | e1003126

subunits [95]. This metabolic complexity highlights the need for
the future incorporation of kinetics and regulation.
In one instance, however, a prediction initially thought to be an
error provided the means to identify an issue with an experimen-
tally observed knockout. The viability phenotype experiment for
Derg-14 was performed on a knockout strain originally designated
as a homokaryon. Experimental observations of this strain
revealed a normal growth phenotype. In contrast, the model
predicted that the Derg-14 mutant was blocked in the production of
mevalonate, which is a necessary precursor for the sterol
component of biomass. Moreover, previous efforts to phenotype
temperature-sensitive mutants of erg-14 revealed severe morpho-
logical defects that were expected to be lethal in the full knockout
[81]. Driven by these inconsistencies, a re-examination of the Derg-
14 knockout revealed that the mutant used was in fact a
heterokaryon. This prediction, in effect, served as a blind control
that highlighted the predictive value of the model.
The construction of genome-scale metabolic models remains a
daunting task. Even aided by sophisticated tools for the
management and visualization of pathway knowledge, a metabolic
reconstruction still requires substantial manual review of the
corresponding literature [38]. Moreover, it is desirable that the
model construction process be guided by objective and quantita-
tive measures of predictive accuracy. Incorporating this require-
ment into the model generation process increases the complexity
of the task by requiring iterative cycles of data curation, model
improvement, and accuracy assessment. To facilitate the process
of model improvement, a number of tools have been developed
[39–47,49,51]. We contribute to this set of tools with the
development of a set of optimization-based algorithms, which
together comprise Fast Automated Reconstruction of Metabolism
(FARM).
Two of the three FARM algorithms specifically facilitate the
process of model construction. Consistent Reproduction Of growth/no-
growth Phenotype (CROP) assists in automating the process of adding
and subtracting reactions from a model to improve predictive
accuracy. CROP integrates diverse evidence for pathways into a
probabilistic framework that assigns a weight to each reaction
Figure 10. Mechanistic insight into three experimentally validated synthetic lethal auxotrophs and their nutrient rescue. (A) Thenitrogen assimilation pathway contains two alternate routes that convert a-ketoglutarate into the essential metabolite L-glutamine (red). (A1) Theen(am)-2 mutant is viable, because a-ketoglutarate can be aminated to L-glutamate via am. (A2) The am mutant is viable, because a-ketoglutarateand L-glutamine can be converted to 2 L-glutamate via en(am)-2. (A3) The double mutant am:en(am)-2 is lethal when ammonium is the nitrogensource because both routes to L-glutamine are blocked, but (A4) can be rescued when the media is supplemented with L-glutamate (A4). (B) The onlytwo routes for the synthesis of the essential metabolite L-proline are through arginine degradation and proline biosynthesis. (B1) The pro-3 mutant isblocked in proline biosynthesis, but can obtain L-proline through arginine degradation. (B2) The ota mutant is blocked in arginine degradation, butcan obtain L-proline through proline biosynthesis. (B3) The double mutant pro-3:ota is blocked in both routes, but can be rescued when the nutrientmedia is supplemented with L-proline (B4). (C) There are only two biosynthetic routes to the essential metabolite uridine-59-phosphate. (C1) The pyr-1mutant can still obtain uridine-59-phosphate from extracellular uracil, and the uc-5 mutant can obtain uridine-59-phosphate from (S)-dihydroorotate(C2), but the pyr-1:uc-5 double mutant is blocked in both routes (C3). However, it can be rescued when the nutrient media is supplemented withuridine through its conversion to uridine-59-phosphate in the pyrimidine salvage pathways (C4). Side compounds not shown.doi:10.1371/journal.pcbi.1003126.g010
Neurospora crassa Metabolic Model Using FARM
PLOS Computational Biology | www.ploscompbiol.org 14 July 2013 | Volume 9 | Issue 7 | e1003126

associated with the likelihood that the reaction is present in the
network. These weights are then used to guide the selection of
reactions to add or remove. Previous methods to achieve in silico
growth used mixed integer linear programming (MILP), and thus
required substantial compute time [39,42,44]. For CROP, we
utilize LP relaxation, which is faster by orders-of-magnitude.
Additional details for this algorithm along with comparisons to
GrowMatch [41,42] and Model SEED [39,40] are available in
Text S3.
OnePrune was developed to efficiently solve the problem of
removing reactions that are blocked. OnePrune utilizes the goal
programming optimization framework to achieve multiple com-
peting objectives. The advantage of this framework is that once an
individual objective is achieved, the optimization can pursue other
objectives. OnePrune’s goals are to send flux through as many
reactions as possible, so once a reaction has achieved a nonzero
flux, OnePrune is free to pursue flux through other reactions.
Thus, OnePrune identified which reactions could carry flux with a
single compact linear program.
The third FARM algorithm, limed-FBA, is an enhancement to
the FBA method that improves predictive accuracy. limed-FBA
accounts for the dilution of active metabolites that is ignored by
FBA (Figure 2B), so limed-FBA is able to correctly identify the
essentiality of reactions that are typically missed by standard FBA.
For example, FBA predicted that pab-1 was not essential, because
pab-1 serves as input to a metabolic cycle; however, limed-FBA
predicted that pab-1 was essential. In fact, essentiality of pab-1 was
shown by the original experiment of Beadle and Tatum on
Neurospora crassa [9,10].
Methods
Metabolic reconstruction protocolThe metabolic reconstruction of Neurospora crassa was performed
in accordance with previously described protocols [96,97], and is
detailed in Text S2.
Creation and curation of NeurosporaCycFrom the Neurospora crassa genome assembly NC10, gene
boundaries were predicted using the Calhoun annotation system
[14]. For all enzymes, we obtained the probability that the enzyme
catalyzes a particular biochemical reaction, characterized by its
Enzyme Commission (EC) number, from the enzyme function
prediction software EFICAz [33].
We used the Pathway Tools software suite [93] to create the
NeurosporaCyc Pathway/Genome Database (PGDB) and to
manage curated data. We added functional gene annotations
with associated Gene Ontology (GO) terms [36] and literature
citations that were manually curated by the Community Anno-
tation Project [27]. EC numbers, GO terms, and functional
annotations were used as input to Pathologic [35] to automatically
infer pathways from MetaCyc. These pathways comprised the
initial NeurosporaCyc PGDB. Reaction directions were based on
the Gibbs free energy predictions using the group contribution
method [67]. Enzyme complexes were manually curated using the
Pathway Tools protein complex editor and evidence from the
Neurospora literature [93]. Transporters were automatically pre-
dicted from the genome sequence by the Transporter Automatic
Annotation Pipeline (TransAAP) from TransportDB [98], and
from the genome annotation using the Transport Identification
Parser (TIP) [99]. Cellular compartment information was described
using the Cellular Component Ontology (CCO), available at
http://bioinformatics.ai.sri.com/CCO/. Neurospora-specific enzyme
kinetics, allosteric regulation, biomass composition, and growth
media were added during manual curation of the experimental
evidence in the literature.
Before the NeurosporaCyc PGDB could be used to generate a
working model, a number of data-cleaning steps were performed.
Reactions were mass balanced, and the individual metabolites
were protonated to the intracellular pH of 7.2 [100]. For reactions
containing compound classes (e.g. ‘‘an alcohol’’), the compound
class was replaced by its instances (e.g. ‘‘ethanol’’) that render the
equation mass-balanced. Polymerization pathways such as fatty
acid beta oxidation were either lumped into a summary reaction,
or instantiated into a chain of individual polymerization steps. For
polymerization reactions, we specified an arbitrary maximum
polymer size n and created a lumped reaction that was
stoichiometrically equivalent to n steps of the polymerization.
The NeurosporaCyc Pathway/Genome Database can be down-
loaded from the PGDB registry at http://biocyc.org/registry.html
and is available online at http://neurosporacyc.broadinstitute.org.
Curation of growth rate dataTo curate our growth rate data, we identified several
manuscripts that included glucose concentrations for Neurospora
grown on glucose minimal medium where doubling times could be
inferred from growth curves [71] or were given [72,73]. The
glucose concentrations were converted to glucose uptake rates
using data for the derepressed system in Figure 1 of Schneider and
Wiley [101].
Curation of viability phenotype dataTo curate our viability phenotype data, we primarily relied on
two resources. The first was The Neurospora crassa e-Compendium,
curated by Alan Radford. The e-Compendium contains .2,400
citations and .3,000 gene entries. Numerous gene entries have
associated mutant phenotypes extracted from the literature. In
some cases, these phenotypes also include supplements that rescue
no-growth mutants. Because this resource primarily lists pheno-
types from mutants that are not knockouts, viability of a mutant
could be due to non-essentiality of a mutated gene or to partial
efficacy of a mutated enzyme. Thus, this resource did not clearly
identify non-essential genes. The second resource was knockouts
from the Neurospora Genome Project [27]. Knockouts that did not
germinate and grow in a short time were not further evaluated to
determine whether they showed low growth or no growth, so this
project did not clearly identify essential genes.
To collect the essential gene sets, we first identified inviable
mutants in the e-Compendium, and only retained genes for which
we could manually verify their essentiality in the literature. To split
the essential genes into a training set and a test set we intersected
the list of inviable mutants in the e-Compendium with the list of
heterokaryon knockouts from the Neurospora Genome Project
(http://www.dartmouth.edu/,neurosporagenome/knockouts_
completed.html). Genes that were in the intersection became
the test set, and the rest remained in the training set.
To collect the non-essential gene sets, we used the homokaryon
knockouts from the Neurospora Genome Project [82], all of which
were experimentally observed to be viable in Vogel’s minimal
media [102]. A subset of these homokaryons were extensively
phenotyped, and these were available at the Neurospora crassa
Database at the Broad Institute (http://www.broadinstitute.org/
annotation/genome/neurospora/Phenotypes.html). This subset
became our non-essential training set, while the rest of the
homokaryon knockouts became our non-essential test set.
Homokaryon knockouts that were in the essential gene set were
discarded.
Neurospora crassa Metabolic Model Using FARM
PLOS Computational Biology | www.ploscompbiol.org 15 July 2013 | Volume 9 | Issue 7 | e1003126

Both the supplemental nutrient rescue training and test sets
were initially identified from the e-Compendium and from the
book Neurospora: Contributions of a Model Organism [1]. They were
then confirmed through manual curation of the associated
citations. We also used this protocol to identify and confirm
known synthetic lethal mutations.
Comparison of experimental to predicted phenotypedata
We simulated Vogel’s minimal media (http://www.fgsc.net/
methods/vogels.html) [13] with sucrose by including exchange
reactions for each metabolite in the media, and limiting sucrose
uptake to 1.5 mmol/(gram Dry Weight * hour). Alternative media
were formulated in silico by adding/removing exchange reactions.
Supplemental nutrients were limited to a flux of 3 mmol/(gram
Dry Weight * hour).
We simulated gene knockouts by removing reactions that require
knocked-out genes. Biomass flux was predicted using limed-FBA,
except where stated otherwise. In silico growth phenotypes were
regarded as viable if the biomass flux exceeded 0.02, and inviable
otherwise. FBA was run using the optimizeCbModel function from the
COBRA Toolbox 2.0.5 [103] using Gurobi 5.0 in Matlab (Math-
Works, Natick, MA). MD-FBA was run using Matlab code
downloaded from Tomer Shlomi’s Research Group’s website
(http://www.cs.technion.ac.il/,tomersh/methods.html) with Tom-
lab v7.9 and CPLEX 12.2. This code was modified for our model: all
MD-FBA constraints could be satisfied by wild-type on Vogel’s
minimal media, so we did not need to apply their addNewExReactions
function. This code allowed 400 seconds per optimization.
FARMAvailability. FARM was originally written in the R language
and environment (www.r-project.org). Optimizations utilized the
Rcplex package in R to call IBM ILOG CPLEX Optimization
Studio 12.2 (IBM, Armonk, New York). However, code to
reproduce all of our predictions has been made available in
MATLAB (MathWorks, Natick, MA). This code is integrated with
the COBRA Toolbox 2.0.5 [103]. The MATLAB code is freely
available at https://code.google.com/p/fast-automated-recon-
metabolism/.
limed-FBA. limed-FBA is a linear method which requires a
metabolite’s concentration to dilute slightly if and only if it is used
in active reactions. We model this dilution implicitly by forcing
metabolites to compensate for their dilution through accumulation.
This accumulation can be modeled mathematically using the
formalism of FBA, as follows.
Let S be a stoichiometric matrix of irreversible reactions (where
reversible reactions are represented as two irreversible reactions in
opposite directions), v be a vector of (non-negative) steady-state
metabolic fluxes, and b represent a vector of the associated
metabolite concentrations changes. Then
Sv~b:
To linearly account for metabolite accumulation, we would like to
construct b as a linear function of v so that bi is positive but small
when metabolite i participates in active reactions, and bi is zero
otherwise.
To construct such a b, we first introduce the binary
stoichiometric matrix, Sbinary [92], whose element at row i and
column j is 1 if and only if the corresponding element of S?0. Now
consider Sbinaryv for a particular metabolite i (this is row i of Sbinary
multiplied by v). Because Sbinary and v are both non-negative,
element i of Sbinaryv represents the sum of the absolute values of the
fluxes that produce and consume metabolite i. This quantity is
twice the turnover of metabolite i. Thus, if metabolite i does not
participate in active reactions, then element i of Sbinaryv is zero.
Otherwise, if metabolite i does participate in active reactions, then
element i of Sbinaryv is positive.
To ensure that the dilution is small when metabolite i
participates in active reactions, we multiply Sbinaryv by e, where
e is a diagonal matrix whose number of rows and columns is the
number of metabolites, and its elements, eii, are small non-negative
constants that correspond to each metabolite i.
Thus, we set
b~eSbinaryv:
We then implement limed-FBA according to
Sv~eSbinaryv:
Note that this equation does not hold for all v; rather, it only holds
for those v that are feasible in limed-FBA. This equation can be
simplified to
(S{eSbinary)v~Slimedv~0:
We assign e so that no metabolite’s dilution rate can exceed a pre-
chosen constant. Here, we set dilution to never exceed 0.1; this
choice gives dilution rates on par with those theoretically
prescribed by MD-FBA. In general, we assign eii to be
eii~0:1
vmax
Pj
sbinaryij
:
where vmax is the overall upper bound on the fluxes. We used
vmax = 1000.
Metabolites in biomass already dilute according to FBA. So that
we do not double-dilute biomass metabolites, metabolites whose
growth-associated dilution is already captured in the pre-defined
biomass (e.g. DNA, RNA, protein) are assigned eii = 0.
The use of small numbers such as eii can create numerical
difficulties for optimization solvers, such as IBM ILOG CPLEX.
We found that these errors were rare, only occurred when growth
was impossible, and disappeared when trying an alternate linear
programming solution method (e.g. the simplex method instead of
a barrier method). An alternative that we didn’t try is to use an
exact solver or one with more precision [104].
As a consequence of limed-FBA’s linearity, limed-FBA allows
more dilution for metabolites with more flux. This is associated
with a potential pitfall. Consider a metabolite that is produced as a
by-product of growth, but is not connected to an exporter. To
maximize growth, this metabolite would need to be depleted. To
deplete this metabolite, limed-FBA could potentially ‘‘cheat’’: it
could create a high-flux loop that includes the metabolite, so that
the metabolite is allowed to dilute more. If a reaction includes
multiple metabolites, then including it in a loop is more likely to
have system-wide effects; conversely, reactions with fewer metab-
olites are less likely to have system-wide effects. In accord with this,
we found that limed-FBA used simple transport reactions (e.g. L-
glutamine[cytosol]«L-glutamine[nucleus]) to ‘‘cheat.’’ To address
this, we disallow simple transport reactions from contributing
towards dilution. We define these simple transport reactions as
those that transport metabolites, but involve no chemical change.
Neurospora crassa Metabolic Model Using FARM
PLOS Computational Biology | www.ploscompbiol.org 16 July 2013 | Volume 9 | Issue 7 | e1003126
This disallowance is implemented mathematically by assigning
columns in Sbinary that correspond to these simple transport
reactions to be all zeroes.CROP. This algorithm is extensively detailed and compared
to similar approaches in Text S3.OnePrune. OnePrune’s goal is to send flux through as many
reactions as possible given an unlimited amount of the available
nutrients. Mathematically, it’s defined as a linear goal program:
maxt
Xn
i~1
ti
Sv~0
tƒv
0ƒtƒ1
where S is a stoichiometric matrix consisting of n irreversible
reactions. This program does not contain upper bounds on the
available nutrient sources, so the only factor limiting reaction flux
is connectivity. Thus, in the optimal solution, all ti’s should be
binary: reactions with ti of one can carry flux, while the other
reactions are blocked.
OnePrune requires an irreversible stoichiometric matrix, but
any reversible stoichiometric matrix can be transformed into an
irreversible one (by splitting reversible reactions into two
irreversible reactions of opposite direction) so this method is
completely general. This requirement exists because direct
inclusion of a reversible stoichiometric matrix would force
OnePrune to deal with absolute values of reaction flux in a
manner not amenable to linear programming [105]. Moreover,
only an irreversible stoichiometric matrix allows OnePrune to
distinguish between different directions of the same reaction.
The set of blocked reactions of an irreversible stoichiometric
matrix may differ slightly from those of a reversible stoichiometric
matrix. For example, consider a reversible reaction between two
metabolites disconnected from the metabolic network: A«B. In
an irreversible stoichiometric matrix, this would be modeled as
two reactions: ARB and A r B. Thus, the reversible reaction is
blocked, whereas the two irreversible reactions could carry flux as
part of a flux cycle according to FBA. To address this, we
implemented OnePrune according to limed-FBA by using Slimed as
the stoichiometric matrix. This implementation disallows cycles
that lack an input flux, so it disallows the cycle of ARB and A r B.
However, limed-FBA does allow some cycles—namely, those not
penalized in Slimed and those that have an input flux. Thus,
reversible reactions that form such cycles (e.g. A[cytosol]«A[ex-
tracellular]) will not be pruned by OnePrune. However, these
reversible reactions can be identified a priori and addressed with Flux
Variability Analysis [57,58] or the method of Jerby et al. [51].
Furthermore, reversible reactions that form such cycles are rare,
and we found that OnePrune’s determination of blocked reactions
was identical to that of Flux Variability Analysis in practice.
To apply OnePrune to achieve our final pruned model, we
allowed all extracellular metabolites in our model to be treated as
nutrients.
Creation of COBRA-compatible SBML modelWe exported the model to the COBRA-compatible subset of the
Systems Biology Markup Language (SBML) [106,107]. All SBML
identifiers were based on NeurosporaCyc Frame IDs. To avoid
using characters disallowed in SBML identifiers, we implemented
a substitution scheme. We substituted disallowed characters with
their ASCII equivalent, demarcated on both sides by two
underscores. For example, ‘‘[’’ has ASCII value 91, so it was
substituted by ‘‘__91__’’. Identifiers beginning with a number
were given a prefix of underscore; e.g. ‘‘1diacyl’’ became
‘‘_1diacyl’’. So that our SBML file can be reversed-transformed
into its original character encoding, we wrote an extension to the
COBRA toolbox in Matlab. This extension is available at http://
code.google.com/p/fast-automated-recon-metabolism. SBML Notes
fields contain COBRA-compliant gene associations, pathways,
EC numbers, Pubmed IDs, chemical formulae, charge, and
NeurosporaCyc and KEGG identifiers [107]. SBML Annotation
fields contain MIRIAM-compliant links to InChI identifiers
[108,109].
Model availabilityThe metabolic model (Dataset S1) has been deposited at the
BioModels Database [110] with accession MODEL1212060001,
and is available on the web at http://neurosporacyc.
broadinstitute.org.
Supporting Information
Dataset S1 iJDZ836 SBML.
(XML)
Figure S1 The mechanistic explanation for the Darg-4Darg-11
synthetic lethal prediction is that two alternate routes exist for
generating L-ornithine. (A) When arg-4 is blocked, L-ornithine can
be generated from arg-11. (B) When arg-11 is blocked, L-ornithine
can be generated via arg-4.
(EPS)
Figure S2 The mechanistic explanation for the DsucDcomplex I
synthetic lethal prediction is that two alternate routes exist in the
mitochondrion for regenerating NAD+ from NADH. (A) The first
route utilizes the ubiquinone:NADH oxidoreductase enzyme
encoded by complex I. (B) When ubiquinone:NADH oxidoreduc-
tase activity is blocked, NAD+ still can be regenerated by driving
the malate dehydrogenase reaction backwards via the pyruvate
carboxylase activity encoded by suc. When both routes are
blocked, the mitochondria unable to regenerate NAD+ from
NADH and the resulting double mutant is inviable.
(EPS)
Figure S3 Zoomable metabolic map of Neurospora crassa.
(EPS)
Figure S4 Plots glucose uptake rate (in millimoles per gram dry
weight per hour) against doubling time (in hours). The black curve
depicts the model’s predictions using FBA, where doubling time is
calculated as ln(2)/growth rate [113], and the blue diamonds
depict data points extracted from the experimental literature.
(EPS)
Figure S5 Simulating the effect of oxygen limitation on xylose
fermentation. In the first step, xylose is reduced to xylitol via a
xylose reductase that has a strong cofactor preference for for
NADPH (XR-NADPH) and a weaker preference for NADH (XR-
NADH) [114]. In the second step, xylitol is either excreted into the
medium or oxidized to xylulose via a NAD+-dependent xylitol
dehydrogenase (XDH) [115]. Xylulose is then phosphorylated and
enters the pentose phosphate pathway, followed by glycolysis to
pyruvate, and is either excreted as ethanol or enters the
mitochondria to be oxidized via the TCA cycle [29]. (A) Under
anaerobic conditions, our model predicts that XR-NADH is the
only source of NAD+ for XDH, so the excess xylitol generated by
XR-NADPH is exported, resulting in lower ethanol yields. (B)
Under fully aerobic conditions, our model predicts that XDH no
Neurospora crassa Metabolic Model Using FARM
PLOS Computational Biology | www.ploscompbiol.org 17 July 2013 | Volume 9 | Issue 7 | e1003126

longer acts as a bottleneck because NAD+ is regenerated by
oxygen via the glycerol phosphate shuttle. Furthermore, enough
oxygen is present to generate the NAD+ required by the TCA
cycle, which converts all the pyruvate to CO2 and water, resulting
in no ethanol production. (C) This figure shows the critical oxygen
level where just enough NAD+ is regenerated via the glycerol
phosphate shuttle to allow XDH to catalyze all the xylitol, but
there is no NAD+ left over to power the TCA cycle, resulting in
optimal ethanol yield and productivity. All three predictions of
xylitol and ethanol yields are consistent with experimental
observation [29].
(EPS)
Table S1 Describes our evidence source for our growth/no-
growth annotation of mutants, nutrient rescues, and synthetic
lethals.
(XLSX)
Table S2 Comprehensive set of our predicted essential genes,
supplemental rescues, and synthetic lethal gene pairs.
(XLS)
Text S1 Describes the 19 inconsistencies between the test set of
non-essential genes and the essential gene predictions.
(DOCX)
Text S2 Compares the steps we completed to reconstruct this
model to those in the Palsson lab’s 96 step protocol [38].
(DOCX)
Text S3 Details the CROP algorithm and compares it to
GrowMatch and the Model SEED. This has three sections: 1.
objective function, 2. resolving incorrect predictions by restoring
growth, and 3. resolving incorrect predictions by suppressing
growth.
(DOCX)
Text S4 Simulating the effect of oxygen limitation on xylose
fermentation.
(DOCX)
Acknowledgments
We thank Joe Sturino, Rani Menon, Ying Zhang, Ron Caspi, Mario
Latendresse, Peter Karp, Alan Radford, Katherine Borkovich, Sara
Tucker, Leslie Gaffney, Anna Lyubetskaya, Antonio Luiz, Andrew
Krueger, and Christopher Garay for helpful discussions. We are grateful
to Peter Sisk, Jonathan Goldberg, Matthew Pearson and Qiandong Zheng
for improving the Neurospora genome annotations in response to our
feedback. We appreciate Areejit Samal and Nicholas Chia for providing
curations to NeurosporaCyc. We acknowledge Christian Stolte for initial
help with the figures.
Author Contributions
Conceived and designed the experiments: JEG. Performed the experi-
ments: JMD JDZ HMH. Analyzed the data: JMD JDZ HMH.
Contributed reagents/materials/analysis tools: MSS. Wrote the paper:
JMD JDZ LRO MSS JEG.
References
1. Davis R (2000) Neurospora contributions of a model organism. New York:
Oxford University Press.
2. Perkins DD (1992) Neurospora: the organism behind the molecular revolution.
Genetics 130: 687–701.
3. Baker C, Loros J, Dunlap J (2012) The circadian clock of Neurospora crassa.
FEMS Microbiology Reviews 36: 95–110.
4. Rountree MR, Selker EU (2010) DNA methylation and the formation of
heterochromatin in Neurospora crassa. Heredity (Edinb) 105: 38–44.
5. Selker EU, Cambareri EB, Jensen BC, Haack KR (1987) Rearrangement of
duplicated DNA in specialized cells of Neurospora. Cell 51: 741–752.
6. Nargang FE, Rapaport D (2007) Neurospora crassa as a model organism for
mitochondrial biogenesis. Methods Mol Biol 372: 107–123.
7. Romano N, Macino G (1992) Quelling: transient inactivation of gene
expression in Neurospora crassa by transformation with homologous
sequences. Mol Microbiol 6: 3343–3353.
8. Inoue H (2011) Exploring the processes of DNA repair and homologous
integration in Neurospora. Mutat Res 728: 1–11.
9. Beadle GW, Tatum EL (1941) Genetic Control of Biochemical Reactions in
Neurospora. Proceedings of the National Academy of Sciences of the United
States of America 27: 499–506.
10. Tatum EL, Beadle GW (1942) Genetic Control of Biochemical Reactions in
Neurospora: An ‘‘Aminobenzoicless’’ Mutant. Proc Natl Acad Sci U S A 28:
234–243.
11. Perkins D, Radford A, Sachs M (2001) The Neurospora Compendium:
Chromosomal Loci. San Diego: Academic Press.
12. Radford A (2004) Metabolic highways of Neurospora crassa revisited. Adv
Genet 52: 165–207.
13. McCluskey K, Wiest A, Plamann M (2010) The Fungal Genetics Stock Center:
a repository for 50 years of fungal genetics research. Journal of biosciences 35:
119–126.
14. Galagan J, Calvo S, Borkovich K, Selker E, Read N, et al. (2003) The genome
sequence of the filamentous fungus Neurospora crassa. Nature 422: 859–868.
15. Borkovich K, Alex L, Yarden O, Freitag M, Turner G, et al. (2004) Lessons
from the Genome Sequence of Neurospora crassa: Tracing the Path from
Genomic Blueprint to Multicellular Organism. Microbiol Mol Biol Rev 68: 1–
108.
16. Feist AM, Herrgard MJ, Thiele I, Reed JL, Palsson BO (2009) Reconstruction
of biochemical networks in microorganisms. Nat Rev Microbiol 7: 129–143.
17. Orth JD, Thiele I, Palsson BO (2010) What is flux balance analysis? Nat
Biotechnol 28: 245–248.
18. Lewis N, Nagarajan H, Palsson B (2012) Constraining the metabolic genotype-
phenotype relationship using a phylogeny of in silico methods. Nat Rev Micro
10: 291–305.
19. Varma A, Palsson BO (1994) Stoichiometric flux balance models quantitatively
predict growth and metabolic by-product secretion in wild-type Escherichia coli
W3110. Appl Environ Microbiol 60: 3724–3731.
20. Plata G, Hsiao T-L, Olszewski K, LlinasManuel, Vitkup D (2010)
Reconstruction and flux-balance analysis of the Plasmodium falciparum
metabolic network. Molecular Systems Biology 6: 408.
21. Brandes A, Lun DS, Ip K, Zucker J, Colijn C, et al. (2012) Inferring carbon
sources from gene expression profiles using metabolic flux models. PLoS One
7: e36947.
22. Colijn C, Brandes A, Zucker J, Lun DS, Weiner B, et al. (2009) Interpreting
expression data with metabolic flux models: predicting Mycobacterium
tuberculosis mycolic acid production. PLoS Comput Biol 5: e1000489.
23. Lun D, Rockwell G, Guido N, Baym M, Kelner J, et al. (2009) Large-scale
identification of genetic design strategies using local search. Molecular Systems
Biology 5: 296.
24. Patil K, Rocha I, Forster J, Nielsen J (2005) Evolutionary programming as a
platform for in silico metabolic engineering. BMC Bioinformatics 6: 308.
25. Burgard AP, Pharkya P, Maranas CD (2003) Optknock: a bilevel programming
framework for identifying gene knockout strategies for microbial strain
optimization. Biotechnol Bioeng 84: 647–657.
26. Pharkya P, Burgard A, Maranas C (2004) OptStrain: A computational
framework for redesign of microbial production systems. Genome Research 14:
2367–2376.
27. Dunlap J, Borkovich K, Henn M, Turner G, Sachs M, et al. (2007) Enabling a
community to dissect an organism: overview of the Neurospora functional
genomics project. Adv Genet 57: 49–96.
28. Tian C, Beeson W, Iavarone A, Sun J, Marletta M, et al. (2009) Systems
analysis of plant cell wall degradation by the model filamentous fungus
Neurospora crassa. Proceedings of the National Academy of Sciences 106:
22157–22162.
29. Zhang Z, Qu Y, Zhang X, Lin J (2008) Effects of oxygen limitation on xylose
fermentation, intracellular metabolites, and key enzymes of Neurospora crassa
AS3.1602. Applied Biochemistry and Biotechnology 145: 39–51.
30. Deshpande V, Keskar S, Mishra C, Rao M (1986) Direct conversion of
cellulose/hemicellulose to ethanol by Neurospora crassa. Enzyme and
Microbial Technology 8: 149–152.
31. Rao M, Deshpande V, Keskar S, Srinivasan MC (1983) Cellulase and ethanol
production from cellulose by Neurospora crassa. Enzyme and Microbial
Technology 5: 133–136.
32. Znameroski E, Coradetti S, Roche C, Tsai J, Iavarone A, et al. (2012)
Induction of lignocellulose-degrading enzymes in Neurospora crassa by
cellodextrins. Proceedings of the National Academy of Sciences 109: 6012–
6017.
Neurospora crassa Metabolic Model Using FARM
PLOS Computational Biology | www.ploscompbiol.org 18 July 2013 | Volume 9 | Issue 7 | e1003126

33. Arakaki A, Huang Y, Skolnick J (2009) EFICAz2: enzyme function inference
by a combined approach enhanced by machine learning. BMC Bioinformatics
10: 107.
34. Caspi R, Altman T, Dreher K, Fulcher C, Subhraveti P, et al. (2012) The
MetaCyc database of metabolic pathways and enzymes and the BioCyc
collection of pathway/genome databases. Nucleic Acids Research 40: D742–
D753.
35. Dale J, Popescu L, Karp P (2010) Machine learning methods for metabolic
pathway prediction. BMC Bioinformatics 11: 15.
36. Ashburner M, Ball CA, Blake JA, Botstein D, Butler H, et al. (2000) Gene
ontology: tool for the unification of biology. The Gene Ontology Consortium.
Nature Genetics 25: 25–29.
37. Karp PD, Paley S, Krieger CJ, Zhang P (2004) An evidence ontology for use in
pathway/genome databases. Pacific Symposium on Biocomputing Pacific
Symposium on Biocomputing: 190–201.
38. Thiele I, Palsson B (2010) A protocol for generating a high-quality genome-
scale metabolic reconstruction. Nature Protocols 5: 93–121.
39. Henry C, DeJongh M, Best A, Frybarger P, Linsay B, et al. (2010) High-
throughput generation, optimization and analysis of genome-scale metabolic
models. Nat Biotech 28: 977–982.
40. Henry C, Zinner J, Cohoon M, Stevens R (2009) iBsu1103: a new genome-
scale metabolic model of Bacillus subtilis based on SEED annotations. Genome
Biology 10: R69.
41. Zomorrodi A, Maranas C (2010) Improving the iMM904 S. cerevisiae
metabolic model using essentiality and synthetic lethality data. BMC Systems
Biology 4: 178.
42. Kumar V, Maranas C (2009) GrowMatch: An Automated Method for
Reconciling In Silico/In Vivo Growth Predictions. PLoS Comput Biol 5:
e1000308.
43. Kumar V, Dasika M, Maranas C (2007) Optimization based automated
curation of metabolic reconstructions. BMC Bioinformatics 8: 212.
44. Reed J, Patel T, Chen K, Joyce A, Applebee M, et al. (2006) Systems approach
to refining genome annotation. Proceedings of the National Academy of
Sciences 103: 17480–17484.
45. Elloumi M, Kung J, Linial M, Murphy R, Schneider K, et al. (2008) A
computational method for reconstructing gapless metabolic networks. In
Bioinformatics Research and Development: Springer Berlin Heidelberg: Berlin.
pp. 288–302.
46. Christian N, May P, Kempa S, Handorf T, Ebenhoh O (2009) An integrative
approach towards completing genome-scale metabolic networks. Mol BioSyst
5: 1889–1903.
47. Agren R, Bordel S, Mardinoglu A, Pornputtapong N, Nookaew I, et al. (2012)
Reconstruction of Genome-Scale Active Metabolic Networks for 69 Human
Cell Types and 16 Cancer Types Using INIT. PLoS Comput Biol 8: e1002518.
48. Vitkin E, Shlomi T (2012) MIRAGE: a functional genomics-based approach
for metabolic network model reconstruction and its application to cyanobac-
teria networks. Genome Biology 13: R111.
49. Latendresse M, Krummenacker M, Trupp M, Karp P (2012) Construction and
completion of flux balance models from pathway databases. Bioinformatics 28:
388–396.
50. Mintz-Oron S, Meir S, Malitsky S, Ruppin E, Aharoni A, et al. (2012)
Reconstruction of Arabidopsis metabolic network models accounting for
subcellular compartmentalization and tissue-specificity. Proceedings of the
National Academy of Sciences 109: 339–344.
51. Jerby L, Shlomi T, Ruppin E (2010) Computational reconstruction of tissue-
specific metabolic models: application to human liver metabolism. Molecular
Systems Biology 6: 401.
52. Chang R, Ghamsari L, Manichaikul A, Hom E, Balaji S, et al. (2011)
Metabolic network reconstruction of Chlamydomonas offers insight into light-
driven algal metabolism. Molecular Systems Biology 7: 518.
53. Benyamini T, Folger O, Ruppin E, Shlomi T (2010) Flux balance analysis
accounting for metabolite dilution. Genome Biology 11: R43.
54. Duarte N, Herrgard M, Palsson B (2004) Reconstruction and Validation of
Saccharomyces cerevisiae iND750, a Fully Compartmentalized Genome-Scale
Metabolic Model. Genome Research 14: 1298–1309.
55. Davis RH (1979) Genetics of arginine biosynthesis in Neurospora crassa.
Genetics 93: 557–575.
56. Hoffmann S, Hoppe A, Holzhutter H-G (2007) Pruning genome-scale
metabolic models to consistent ad functionem networks. Genome informatics
International Conference on Genome Informatics 18: 308–319.
57. Mahadevan R, Schilling CH (2003) The effects of alternate optimal solutions in
constraint-based genome-scale metabolic models. Metabolic Engineering 5:
264–276.
58. Gudmundsson S, Thiele I (2010) Computationally efficient flux variability
analysis. BMC Bioinformatics 11: 489.
59. Tamiz M, Jones DF, El-Darzi E (1995) A review of Goal Programming and its
applications. Annals of Operations Research 58: 39–53.
60. Reed JL, Vo TD, Schilling CH, Palsson BO (2003) An expanded genome-scale
model of Escherichia coli K-12 (iJR904 GSM/GPR). Genome Biology 4: R54.
61. Andersen M, Nielsen M, Nielsen J (2008) Metabolic model integration of the
bibliome, genome, metabolome and reactome of Aspergillus niger. Molecular
Systems Biology 4: 178.
62. Heavner B, Smallbone K, Barker B, Mendes P, Walker L (2012) Yeast 5 - anexpanded reconstruction of the Saccharomyces Cerevisiae metabolic network.
BMC Systems Biology 6: 55.
63. Orth J, Conrad T, Na J, Lerman J, Nam H, et al. (2011) A comprehensive
genome-scale reconstruction of Escherichia coli metabolism—2011. MolecularSystems Biology 7: 535.
64. Chen L, Vitkup D (2006) Predicting genes for orphan metabolic activities using
phylogenetic profiles. Genome Biology 7: R17.
65. Chen L, Vitkup D (2007) Distribution of orphan metabolic activities. Trends in
Biotechnology 25: 343–348.
66. Karp P (2004) Call for an enzyme genomics initiative. Genome Biology 5: 401.
67. Jankowski M, Henry C, Broadbelt L, Hatzimanikatis V (2008) Group
Contribution Method for Thermodynamic Analysis of Complex MetabolicNetworks. Biophysical Journal 95: 1487–1499.
68. Noor E, Bar-Even A, Flamholz A, Lubling Y, Davidi D, et al. (2012) An
integrated open framework for thermodynamics of reactions that combines
accuracy and coverage. Bioinformatics (Oxford, England) 28: 2037–2044.
69. Feist A, Palsson B (2010) The biomass objective function. Current opinion inmicrobiology 13: 344–349.
70. Beste D, Hooper T, Stewart G, Bonde B, Avignone-Rossa C, et al. (2007)GSMN-TB: a web-based genome-scale network model of Mycobacterium
tuberculosis metabolism. Genome Biology 8: R89.
71. Neville MM, Subkind SR, Roseman S (1971) A Derepressible Active Transport
System for Glucose in Neurospora crassa. Journal of Biological Chemistry 246:1294–1301.
72. Schneider RP, Wiley WR (1971) Regulation of Sugar Transport in Neurospora
crassa. Journal of bacteriology 106: 487–492.
73. Courtright JB (1975) Characteristics of a glycerol utilization mutant of
Neurospora crassa. Journal of bacteriology 124: 497–502.
74. Lakin-Thomas PL, Brody S (1985) A pantothenate derivative is covalently
bound to mitochondrial proteins in Neurospora crassa. European journal ofbiochemistry/FEBS 146: 141–147.
75. Scott WA, Tatum EL (1970) Glucose-6-phosphate dehydrogenase and
Neurospora morphology. Proc Natl Acad Sci U S A 66: 515–522.
76. Nishikawa K, Kuwana H (1985) Deficiency of glucose-6-phosphate dehydro-
genase in ace-7 strains of Neurospora crassa. The Japanese journal of genetics60: 39–52.
77. Scott WA (1971) Physical properties of glucose 6-phosphate dehydrogenasefrom Neurospora crassa. J Biol Chem 246: 6353–6359.
78. Brody S, Tatum EL (1966) The primary biochemical effect of a morphological
mutation in Neurospora crassa. Proceedings of the National Academy ofSciences of the United States of America 56: 1290–1297.
79. Thompson J, Torchia DA (1984) Use of 31P nuclear magnetic resonancespectroscopy and 14C fluorography in studies of glycolysis and regulation of
pyruvate kinase in Streptococcus lactis. Journal of bacteriology 158: 791–800.
80. Srb A, Horowitz NH (1944) The ornithine cycle in neurospora and its genetic
control. Journal of Biological Chemistry 154: 129–139.
81. Seiler S, Plamann M (2003) The genetic basis of cellular morphogenesis in thefilamentous fungus Neurospora crassa. Mol Biol Cell 14: 4352–4364.
82. Colot H, Park G, Turner G, Ringelberg C, Crew C, et al. (2006) A high-throughput gene knockout procedure for Neurospora reveals functions for
multiple transcription factors. Proceedings of the National Academy of Sciences103: 10352–10357.
83. Kuwana H, Okumura R (1979) Genetics and some characteristics of acetate-requiring strains in neurospora crassa. The Japanese journal of genetics 54:
235–244.
84. Bernstein H (1961) Imidazole Compounds Accumulated by Purine Mutants of
Neurospora crassa. Journal of general microbiology 25: 41–46.
85. Murray NE (1965) Cysteine mutant strains of Neurospora. Genetics 52: 801–808.
86. Murray N (1960) The distribution of methionine loci in Neurospora crassa.Heredity 15: 199–206.
87. Horowitz NH (1947) Methionine synthesis in Neurospora. The isolation of
cystathionine 171: 255–264.
88. Beever RE, Fincham JR (1973) Acetate-nonutilizing mutants of Neurospora
crassa: acu-6, the structural gene for PEP carboxykinase and inter-alleliccomplementation at the acu-6 locus. Mol Gen Genet 126: 217–226.
89. Flavell RB, Fincham JR (1968) Acetate-onutilizing mutants of Neurospora
crassa. I. Mutant isolation, complementation studies, and linkage relationships.
J Bacteriol 95: 1056–1062.
90. Versaw WK (1995) A phosphate-repressible, high-affinity phosphate permeaseis encoded by the pho-5+ gene of Neurospora crassa. Gene 153: 135–139.
91. Videira A (1998) Complex I from the fungus Neurospora crassa. Biochimica etbiophysica acta 1364: 89–100.
92. Becker S, Palsson B (2008) Three factors underlying incorrect in silico
predictions of essential metabolic genes. BMC Systems Biology 2: 14.
93. Karp P, Paley S, Krummenacker M, Latendresse M, Dale J, et al. (2010)
Pathway Tools version 13.0: integrated software for pathway/genomeinformatics and systems biology. Brief Bioinform 11: 40–79.
94. Davila G, Brom S, Mora Y, Palacios R, Mora J (1983) Genetic andbiochemical characterization of glutamine synthetase from Neurospora crassa
glutamine auxotrophs and their revertants. J Bacteriol 156: 993–1000.
95. Mora J (1990) Glutamine metabolism and cycling in Neurospora crassa.
Microbiological reviews 54: 293–304.
Neurospora crassa Metabolic Model Using FARM
PLOS Computational Biology | www.ploscompbiol.org 19 July 2013 | Volume 9 | Issue 7 | e1003126

96. Segre D, Zucker J, Katz J, Lin X, D’Haeseleer P, et al. (2003) From annotated
genomes to metabolic flux models and kinetic parameter fitting. OMICS 7:301–316.
97. Thiele I, Palsson B (2010) A protocol for generating a high-quality genome-
scale metabolic reconstruction. Nature Protocols 5: 93–121.98. Ren Q, Chen K, Paulsen I (2007) TransportDB: a comprehensive database
resource for cytoplasmic membrane transport systems and outer membranechannels. Nucleic Acids Research 35: D274–D279.
99. Lee T, Paulsen I, Karp P (2008) Annotation-based inference of transporter
function. Bioinformatics 24: i259–i267.100. Legerton T, Kanamori K, Weiss R, Roberts J (1983) Measurements of
cytoplasmic and vacuolar pH in Neurospora using nitrogen-15 nuclearmagnetic resonance spectroscopy. Biochemistry 22: 899–903.
101. Schneider RP, Wiley WR (1971) Kinetic characteristics of the two glucosetransport systems in Neurospora crassa. Journal of bacteriology 106: 479–486.
102. Alberghina FAM (1973) Growth regulation in Neurospora crassa effects of
nutrients and of temperature. Archives of Microbiology 89: 83–94.103. Becker S, Feist A, Mo M, Hannum G, Palsson B, et al. (2007) Quantitative
prediction of cellular metabolism with constraint-based models: the COBRAToolbox. Nature Protocols 2: 727–738.
104. Lerman J, Hyduke D, Latif H, Portnoy V, Lewis N, et al. (2012) In silico
method for modelling metabolism and gene product expression at genomescale. Nature communications 3: 929.
105. Shanno D, Weil R (1971) Technical note—‘‘Linear’’ programming withabsolute-value functionals. Operations Research 19: 120–124.
106. Hucka M, Finney A, Sauro HM, Bolouri H, Doyle JC, et al. (2003) The systemsbiology markup language (SBML): a medium for representation and exchange
of biochemical network models. Bioinformatics 19: 524–531.
107. Schellenberger J, Que R, Fleming RM, Thiele I, Orth JD, et al. (2011)
Quantitative prediction of cellular metabolism with constraint-based models:
the COBRA Toolbox v2.0. Nat Protoc 6: 1290–1307.
108. Le Novere N, Finney A, Hucka M, Bhalla US, Campagne F, et al. (2005)
Minimum information requested in the annotation of biochemical models
(MIRIAM). Nat Biotechnol 23: 1509–1515.
109. Heller S, McNaught A, Stein S, Tchekhovskoi D, Pletnev I (2013) InChI - the
worldwide chemical structure identifier standard. J Cheminform 5: 7.
110. Li C, Donizelli M, Rodriguez N, Dharuri H, Endler L, et al. (2010) BioModels
Database: An enhanced, curated and annotated resource for published
quantitative kinetic models. BMC Systems Biology 4: 92.
111. Karp P, Paley S, Romero P (2002) The Pathway Tools software. Bioinformatics
(Oxford, England) 18 Suppl 1: S225–S232.
112. Karp P, Ouzounis C, Moore-Kochlacs C, Goldovsky L, Kaipa P, et al. (2005)
Expansion of the BioCyc collection of pathway/genome databases to 160
genomes. Nucleic Acids Research 33: 6083–6089.
113. Ibarra R, Edwards J, Palsson B (2002) Escherichia coli K-12 undergoes
adaptive evolution to achieve in silico predicted optimal growth. Nature 420:
186–189.
114. Woodyer R, Simurdiak M, van der Donk WA, Zhao H (2005) Heterologous
expression, purification, and characterization of a highly active xylose reductase
from Neurospora crassa. Appl Environ Microbiol 71: 1642–1647.
115. Phadtare SU, Rawat UB, Rao MB (1997) Purification and characterisation of
xylitol dehydrogenase from Neurospora crassa NCL communication No. 6347.
FEMS Microbiology Letters 146: 79–83.
Neurospora crassa Metabolic Model Using FARM
PLOS Computational Biology | www.ploscompbiol.org 20 July 2013 | Volume 9 | Issue 7 | e1003126