Embed Size (px)
Citation preview

A Genome-Scale Metabolic Reconstruction ofMycoplasma genitalium, i PS189Patrick F. Suthers1, Madhukar S. Dasika1, Vinay Satish Kumar2, Gennady Denisov3, John I. Glass3,
Costas D. Maranas1*
1 Department of Chemical Engineering, The Pennsylvania State University, University Park, Pennsylvania, United States of America, 2 Department of Industrial Engineering,
The Pennsylvania State University, University Park, Pennsylvania, United States of America, 3 J. Craig Venter Institute, Rockville, Maryland, United States of America
Abstract
With a genome size of ,580 kb and approximately 480 protein coding regions, Mycoplasma genitalium is one of thesmallest known self-replicating organisms and, additionally, has extremely fastidious nutrient requirements. The reducedgenomic content of M. genitalium has led researchers to suggest that the molecular assembly contained in this organismmay be a close approximation to the minimal set of genes required for bacterial growth. Here, we introduce a systematicapproach for the construction and curation of a genome-scale in silico metabolic model for M. genitalium. Key challengesincluded estimation of biomass composition, handling of enzymes with broad specificities, and the lack of a definedmedium. Computational tools were subsequently employed to identify and resolve connectivity gaps in the model as wellas growth prediction inconsistencies with gene essentiality experimental data. The curated model, M. genitalium iPS189 (262reactions, 274 metabolites), is 87% accurate in recapitulating in vivo gene essentiality results for M. genitalium. Approachesand tools described herein provide a roadmap for the automated construction of in silico metabolic models of otherorganisms.
Citation: Suthers PF, Dasika MS, Kumar VS, Denisov G, Glass JI, et al. (2009) A Genome-Scale Metabolic Reconstruction of Mycoplasma genitalium, iPS189. PLoSComput Biol 5(2): e1000285. doi:10.1371/journal.pcbi.1000285
Editor: Herbert M. Sauro, University of Washington, United States of America
Received May 28, 2008; Accepted January 2, 2009; Published February 13, 2009
Copyright: � 2009 Suthers et al. This is an open-access article distributed under the terms of the Creative Commons Attribution License, which permitsunrestricted use, distribution, and reproduction in any medium, provided the original author and source are credited.
Funding: This work was supported by the Department of Energy grant DE-FG02-05ER25684.
Competing Interests: The authors have declared that no competing interests exist.
* E-mail: [email protected]
Introduction
Genome-scale metabolic reconstructions are already in place or
under development for a growing number of organisms including
eukaryotic, prokaryotic and archaeal species [1]. Metabolic
pathway reconstructions are increasingly being queried by systems
engineering approaches to refine the quality of the resulting
metabolic models [2]. Curated metabolic models are indispensable
for computationally driving engineering interventions in microbial
strains for targeted overproductions [3–6], elucidating the
organizing principles of metabolism [7–10] and even pinpointing
drug targets [11,12]. Currently, over 700 genomes have been fully
sequenced [13] whereas only about 20 organism-specific genome-
scale metabolic models have been constructed [1,14,15]. Figure 1
pictorially demonstrates, in logarithmic space, the widening gap
between organism-specific metabolic models and fully sequenced
genomes over the past twelve years. It appears that metabolic
model generation can only keep pace with about 1% of the fully
sequenced genomes.
In response to this flood of present and future genomic
information, automated tools such as Pathway Tools [16] and
SimPheny (Genomatica) have been developed that, using
homology comparisons, allow for the automated generation of
draft organism-specific metabolic reconstructions that can subse-
quently be upgraded into metabolic models. All of these models
remain to some extent incomplete as manifested by the presence of
unreachable metabolites [17] and some growth inconsistencies
between model predictions and observed in vivo behavior [2]. In
particular, optimization-based techniques for automatically iden-
tifying metabolites disconnected from the rest of metabolism (i.e.,
GapFind) and hypotheses generators (i.e., GapFill) for reconnect-
ing them have recently been introduced [17]. In order to resolve
substrate utilization prediction inconsistencies, Reed et al. [2]
introduced a novel approach for identifying what reactions to add
to the genome-scale metabolic models of E. coli to correct some of
the in silico growth predictions. In our group, we have taken the
next step for gene deletion data by attempting to correct all such
growth inconsistencies by allowing not just additions but also
eliminations of functionalities in the model (i.e., GrowMatch)
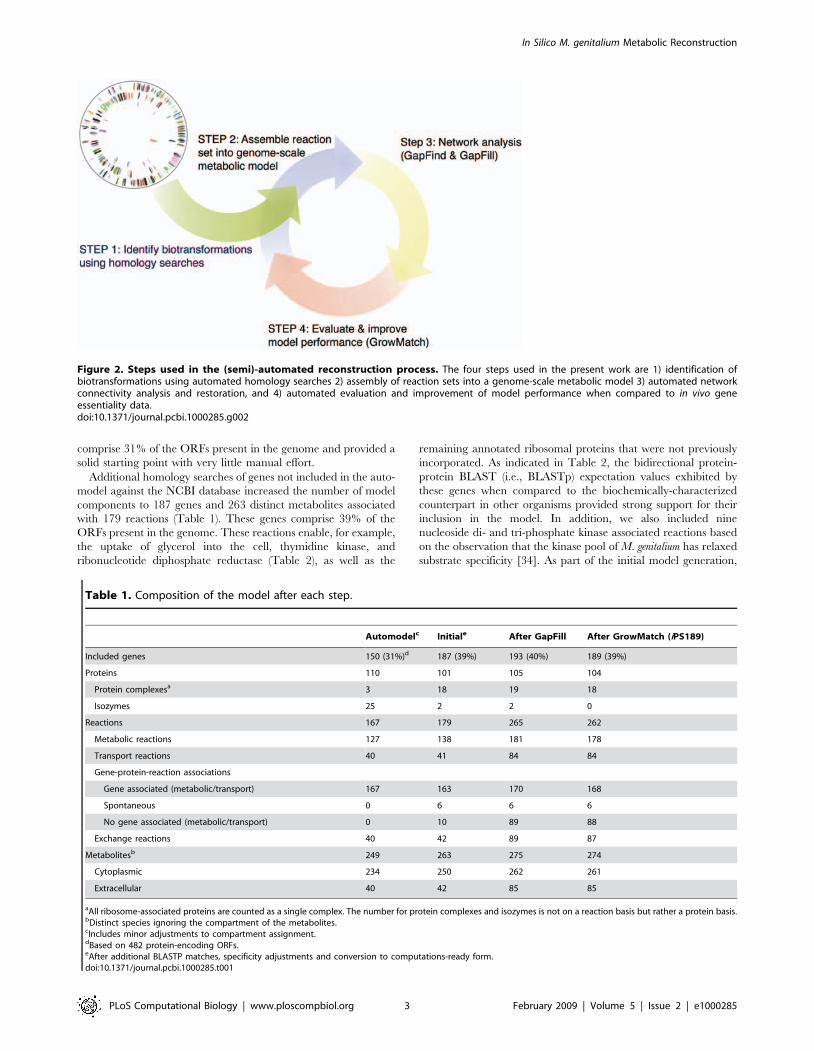
(Satish Kumar and Maranas, submitted). As outlined in Figure 2,
in this work, we describe the application of these automated
methodologies during the Mycoplasma genitalium model construction
process (as opposed to an a posteriori mode of deployment).
M. genitalium has received considerable attention as it is the
smallest organism that can be grown in pure culture, having a
genome size of ,580 kb and approximately 480 protein coding
regions [18,19]. An examination of its genome content revealed
limited metabolic capabilities [20], leading researchers to suggest it
may be a close approximation to the minimal set of genes required
for bacterial growth [19,21]. Several researchers have carried out
genomic and proteomic analysis of M. genitalium to quantify this
minimal set. For example, Mushegian and Koonin have carried
out a detailed comparison of M. genitalium and H. influenzae proteins
to derive a set of 256 genes that they suggested are necessary for
viability [22]. Further, genomic analyses of these species revealed
that Mycoplasma genes encode for several catabolic and
PLoS Computational Biology | www.ploscompbiol.org 1 February 2009 | Volume 5 | Issue 2 | e1000285

metabolite transport proteins but for only a limited number of
anabolic proteins suggesting that Mycoplasma species need to
scavenge for the required nutrients from the surrounding
environment [20]. More recently, Glass and co-workers performed
global transposon mutagenesis and established that 382 of the 482
protein coding sequences are essential genes for this minimal
bacterium [19]. These gene sets and essential gene analyses,
however, have not been put into context of a complete functional
metabolic model.
Mycoplasma genitalium is not only the closest known approxima-
tion of a minimal cell but also an important sexually transmitted
human pathogen. It is a cause of nongonococcal urethritis in men
and is associated with genital tract inflammatory diseases in
women, including endometritis, cervicitis, pelvic inflammatory
disease, and tubal factor infertility (for a recent review see [23]).
Additionally, evidence suggests that M. genitalium infection
increases the risk of contracting HIV-1 [24–26]. Mycoplasmas,
the generic name for the bacteria that comprise the Mollicutes
taxon, evolved from the low G+C Gram positive bacteria through
a process of massive genome reduction [27]. Their salient
characteristics in addition to small genomes are a lack of a cell
wall, and an almost complete inability to synthesize the building
blocks of DNA, RNA, proteins, and cell membranes.
The above underlines the importance of investigating the
molecular biology of mycoplasma and M. genitalium in particular.
However, a major hindrance to M. genitalium research and
laboratory diagnosis of infection has been their cultivation in vitro.
While defined media are present for some mycoplasmas [28–30],
researchers have often had to resort to complex media to cultivate
most mycoplasmas, including M. genitalium. M. genitalium, and
many other mycoplasmas are cultured in vitro in SP-4 medium.
This extremely rich medium contains several undefined additives
including peptones, yeast hydrolysate, yeast extract and 17% fetal
bovine serum [31]. The use of complex undefined growth media
has interfered with the molecular definition of mycoplasma
metabolic pathways, genetic analyses, estimation of growth
requirements, characterization of auxotrophic mutants and
examining the nutritional control of bacterial pathogenecity.
In this paper, we highlight the development of an in silico model
of metabolism of M. genitalium. It was subjected to network
connectivity gap detection and reconnection as well as restoration
of consistency with in vivo gene essentiality experiments [19]. We
subsequently used the model to pinpoint components in the
growth medium that are needed for the production of all
components of biomass in an effort to eventually eliminate the
need for non-defined components such as serum in the growth
medium.
Results
The metabolic model reconstruction process is subdivided into
four steps. These four steps are summarized in Figure 2 and
include (1) identification of biotransformations using homology
searches, (2) assembly of reaction sets into a genome-scale
metabolic model, (3) network connectivity analysis and restoration,
and (4) evaluation and improvement of model performance when
compared to in vivo gene essentiality data. Model construction is
followed by minimal defined medium component elucidation.
Reconstruction ContentThe metabolic reconstruction of M. genitalium was carried out in
a series of successive refinements (see Figure 2 and Materials and
Methods). Of the 482 predicted open reading frames (ORFs), 113
(23%) only have annotations of (conserved) putative or hypothet-
ical proteins. Of the remainder, 369 ORFs have well-defined
annotations, with functions either shown biochemically or
predicted for 272 of them (42%) [18,19]. From these well-
annotated genes, 82 (17%) are not involved in specific metabolic
transformations, but rather encode proteins whose roles include
DNA/RNA polymerization, DNA repair, protein folding and
adhesion. The model construction process started with the
application of an automated procedure for creating a draft
metabolic reconstruction from the genome sequence of M.
genitalium (see Materials and Methods) [32,33]. This auto-
generated model contained 150 genes and 249 unique metabolites
associated with 167 reactions (see Table 1). The 150 genes
Author Summary
There is growing interest in elucidating the minimalnumber of genes needed for life. This challenge isimportant not just for fundamental but also practicalconsiderations arising from the need to design microor-ganisms exquisitely tuned for particular applications. Thegenome of the pathogen Mycoplasma genitalium isbelieved to be a close approximation to the minimal setof genes required for bacterial growth. In this paper, weconstructed a genome-scale metabolic model of M.genitalium that mathematically describes a unified charac-terization of its biochemical capabilities. The modelaccounts for 189 of the 482 genes listed in the latestgenome annotation. We used computational tools duringthe process to bridge network gaps in the model andrestore consistency with experimental data that deter-mined which gene deletions led to cell death (i.e., areessential). We achieved 87% correct model predictions foressential genes and 89% for non-essential genes. Wesubsequently used the metabolic model to determinecomponents that must be part of the growth medium. Theapproaches and tools described here provide a roadmapfor the automated metabolic reconstruction of otherorganisms. This task is becoming increasingly critical asgenome sequencing for new organisms is proceeding atan ever-accelerating pace.
Figure 1. Gap between sequenced genomes and generatedmodels. The numbers of both metabolic models and completedgenome sequences have been growing exponentially. Despite theincrease in the number of metabolic models, their total remains smallerthan 1% of that of sequenced genomes.doi:10.1371/journal.pcbi.1000285.g001
In Silico M. genitalium Metabolic Reconstruction
PLoS Computational Biology | www.ploscompbiol.org 2 February 2009 | Volume 5 | Issue 2 | e1000285
comprise 31% of the ORFs present in the genome and provided a
solid starting point with very little manual effort.
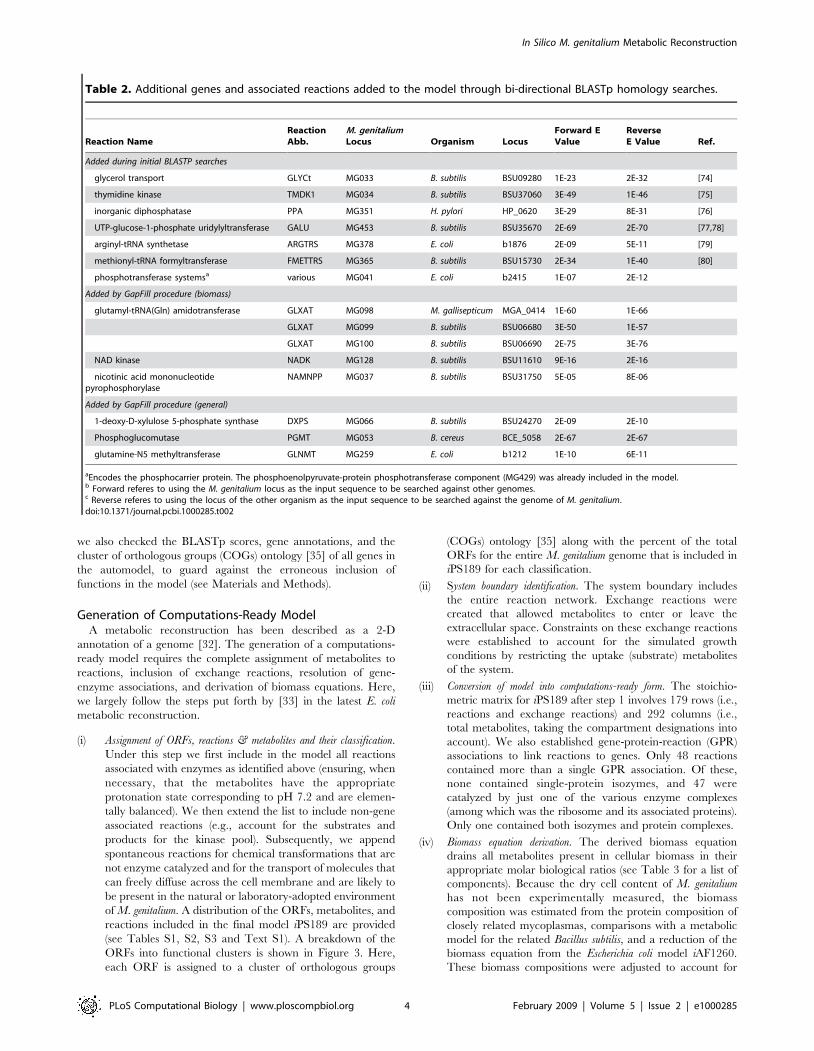
Additional homology searches of genes not included in the auto-
model against the NCBI database increased the number of model
components to 187 genes and 263 distinct metabolites associated
with 179 reactions (Table 1). These genes comprise 39% of the
ORFs present in the genome. These reactions enable, for example,
the uptake of glycerol into the cell, thymidine kinase, and
ribonucleotide diphosphate reductase (Table 2), as well as the
remaining annotated ribosomal proteins that were not previously
incorporated. As indicated in Table 2, the bidirectional protein-
protein BLAST (i.e., BLASTp) expectation values exhibited by
these genes when compared to the biochemically-characterized
counterpart in other organisms provided strong support for their
inclusion in the model. In addition, we also included nine
nucleoside di- and tri-phosphate kinase associated reactions based
on the observation that the kinase pool of M. genitalium has relaxed
substrate specificity [34]. As part of the initial model generation,
Figure 2. Steps used in the (semi)-automated reconstruction process. The four steps used in the present work are 1) identification ofbiotransformations using automated homology searches 2) assembly of reaction sets into a genome-scale metabolic model 3) automated networkconnectivity analysis and restoration, and 4) automated evaluation and improvement of model performance when compared to in vivo geneessentiality data.doi:10.1371/journal.pcbi.1000285.g002
Table 1. Composition of the model after each step.
Automodelc Initiale After GapFill After GrowMatch (iPS189)
Included genes 150 (31%)d 187 (39%) 193 (40%) 189 (39%)
Proteins 110 101 105 104
Protein complexesa 3 18 19 18
Isozymes 25 2 2 0
Reactions 167 179 265 262
Metabolic reactions 127 138 181 178
Transport reactions 40 41 84 84
Gene-protein-reaction associations
Gene associated (metabolic/transport) 167 163 170 168
Spontaneous 0 6 6 6
No gene associated (metabolic/transport) 0 10 89 88
Exchange reactions 40 42 89 87
Metabolitesb 249 263 275 274
Cytoplasmic 234 250 262 261
Extracellular 40 42 85 85
aAll ribosome-associated proteins are counted as a single complex. The number for protein complexes and isozymes is not on a reaction basis but rather a protein basis.bDistinct species ignoring the compartment of the metabolites.cIncludes minor adjustments to compartment assignment.dBased on 482 protein-encoding ORFs.eAfter additional BLASTP matches, specificity adjustments and conversion to computations-ready form.doi:10.1371/journal.pcbi.1000285.t001
In Silico M. genitalium Metabolic Reconstruction
PLoS Computational Biology | www.ploscompbiol.org 3 February 2009 | Volume 5 | Issue 2 | e1000285
we also checked the BLASTp scores, gene annotations, and the
cluster of orthologous groups (COGs) ontology [35] of all genes in
the automodel, to guard against the erroneous inclusion of
functions in the model (see Materials and Methods).
Generation of Computations-Ready ModelA metabolic reconstruction has been described as a 2-D
annotation of a genome [32]. The generation of a computations-
ready model requires the complete assignment of metabolites to
reactions, inclusion of exchange reactions, resolution of gene-
enzyme associations, and derivation of biomass equations. Here,
we largely follow the steps put forth by [33] in the latest E. coli
metabolic reconstruction.
(i) Assignment of ORFs, reactions & metabolites and their classification.
Under this step we first include in the model all reactions
associated with enzymes as identified above (ensuring, when
necessary, that the metabolites have the appropriate
protonation state corresponding to pH 7.2 and are elemen-
tally balanced). We then extend the list to include non-gene
associated reactions (e.g., account for the substrates and
products for the kinase pool). Subsequently, we append
spontaneous reactions for chemical transformations that are
not enzyme catalyzed and for the transport of molecules that
can freely diffuse across the cell membrane and are likely to
be present in the natural or laboratory-adopted environment
of M. genitalium. A distribution of the ORFs, metabolites, and
reactions included in the final model iPS189 are provided
(see Tables S1, S2, S3 and Text S1). A breakdown of the
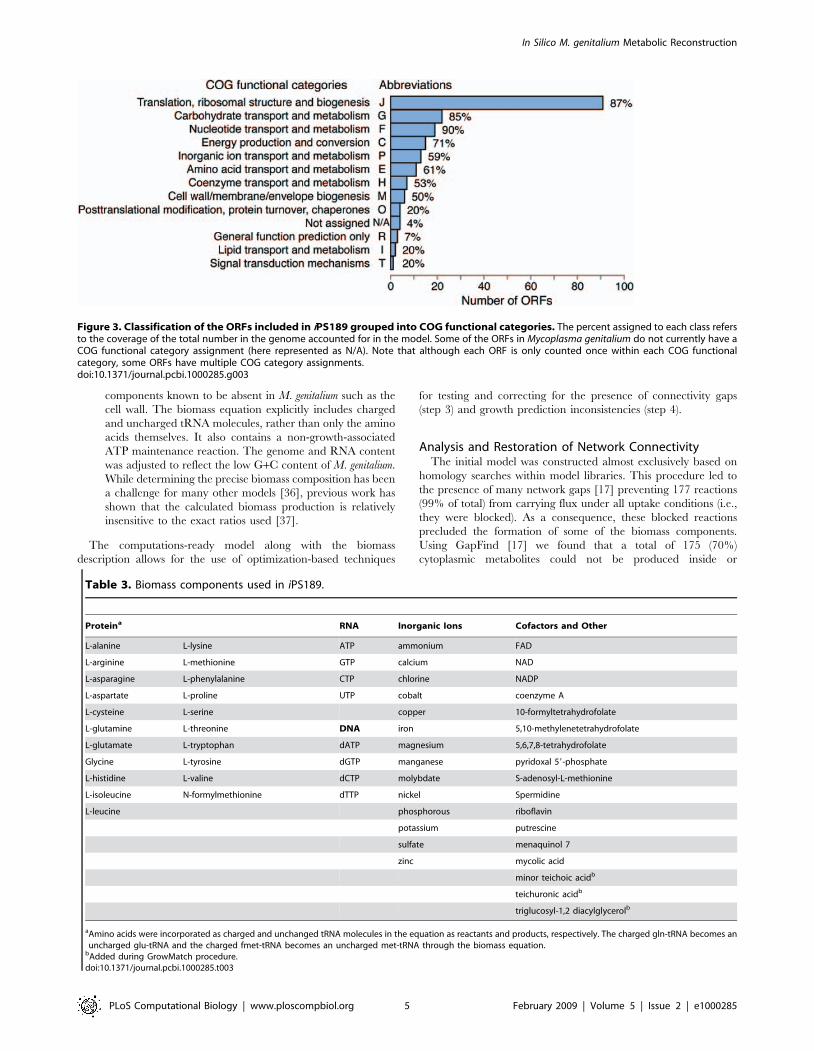
ORFs into functional clusters is shown in Figure 3. Here,
each ORF is assigned to a cluster of orthologous groups
(COGs) ontology [35] along with the percent of the total
ORFs for the entire M. genitalium genome that is included in
iPS189 for each classification.
(ii) System boundary identification. The system boundary includes
the entire reaction network. Exchange reactions were
created that allowed metabolites to enter or leave the
extracellular space. Constraints on these exchange reactions
were established to account for the simulated growth
conditions by restricting the uptake (substrate) metabolites
of the system.
(iii) Conversion of model into computations-ready form. The stoichio-
metric matrix for iPS189 after step 1 involves 179 rows (i.e.,
reactions and exchange reactions) and 292 columns (i.e.,
total metabolites, taking the compartment designations into
account). We also established gene-protein-reaction (GPR)
associations to link reactions to genes. Only 48 reactions
contained more than a single GPR association. Of these,
none contained single-protein isozymes, and 47 were
catalyzed by just one of the various enzyme complexes
(among which was the ribosome and its associated proteins).
Only one contained both isozymes and protein complexes.
(iv) Biomass equation derivation. The derived biomass equation
drains all metabolites present in cellular biomass in their
appropriate molar biological ratios (see Table 3 for a list of
components). Because the dry cell content of M. genitalium
has not been experimentally measured, the biomass
composition was estimated from the protein composition of
closely related mycoplasmas, comparisons with a metabolic
model for the related Bacillus subtilis, and a reduction of the
biomass equation from the Escherichia coli model iAF1260.
These biomass compositions were adjusted to account for
Table 2. Additional genes and associated reactions added to the model through bi-directional BLASTp homology searches.
Reaction NameReactionAbb.
M. genitaliumLocus Organism Locus
Forward EValue
ReverseE Value Ref.
Added during initial BLASTP searches
glycerol transport GLYCt MG033 B. subtilis BSU09280 1E-23 2E-32 [74]
thymidine kinase TMDK1 MG034 B. subtilis BSU37060 3E-49 1E-46 [75]
inorganic diphosphatase PPA MG351 H. pylori HP_0620 3E-29 8E-31 [76]
UTP-glucose-1-phosphate uridylyltransferase GALU MG453 B. subtilis BSU35670 2E-69 2E-70 [77,78]
arginyl-tRNA synthetase ARGTRS MG378 E. coli b1876 2E-09 5E-11 [79]
methionyl-tRNA formyltransferase FMETTRS MG365 B. subtilis BSU15730 2E-34 1E-40 [80]
phosphotransferase systemsa various MG041 E. coli b2415 1E-07 2E-12
Added by GapFill procedure (biomass)
glutamyl-tRNA(Gln) amidotransferase GLXAT MG098 M. gallisepticum MGA_0414 1E-60 1E-66
GLXAT MG099 B. subtilis BSU06680 3E-50 1E-57
GLXAT MG100 B. subtilis BSU06690 2E-75 3E-76
NAD kinase NADK MG128 B. subtilis BSU11610 9E-16 2E-16
nicotinic acid mononucleotidepyrophosphorylase
NAMNPP MG037 B. subtilis BSU31750 5E-05 8E-06
Added by GapFill procedure (general)
1-deoxy-D-xylulose 5-phosphate synthase DXPS MG066 B. subtilis BSU24270 2E-09 2E-10
Phosphoglucomutase PGMT MG053 B. cereus BCE_5058 2E-67 2E-67
glutamine-N5 methyltransferase GLNMT MG259 E. coli b1212 1E-10 6E-11
aEncodes the phosphocarrier protein. The phosphoenolpyruvate-protein phosphotransferase component (MG429) was already included in the model.b Forward referes to using the M. genitalium locus as the input sequence to be searched against other genomes.c Reverse referes to using the locus of the other organism as the input sequence to be searched against the genome of M. genitalium.doi:10.1371/journal.pcbi.1000285.t002
In Silico M. genitalium Metabolic Reconstruction
PLoS Computational Biology | www.ploscompbiol.org 4 February 2009 | Volume 5 | Issue 2 | e1000285
components known to be absent in M. genitalium such as the
cell wall. The biomass equation explicitly includes charged
and uncharged tRNA molecules, rather than only the amino
acids themselves. It also contains a non-growth-associated
ATP maintenance reaction. The genome and RNA content
was adjusted to reflect the low G+C content of M. genitalium.
While determining the precise biomass composition has been
a challenge for many other models [36], previous work has
shown that the calculated biomass production is relatively
insensitive to the exact ratios used [37].
The computations-ready model along with the biomass
description allows for the use of optimization-based techniques
for testing and correcting for the presence of connectivity gaps
(step 3) and growth prediction inconsistencies (step 4).
Analysis and Restoration of Network ConnectivityThe initial model was constructed almost exclusively based on
homology searches within model libraries. This procedure led to
the presence of many network gaps [17] preventing 177 reactions
(99% of total) from carrying flux under all uptake conditions (i.e.,
they were blocked). As a consequence, these blocked reactions
precluded the formation of some of the biomass components.
Using GapFind [17] we found that a total of 175 (70%)
cytoplasmic metabolites could not be produced inside or
Figure 3. Classification of the ORFs included in iPS189 grouped into COG functional categories. The percent assigned to each class refersto the coverage of the total number in the genome accounted for in the model. Some of the ORFs in Mycoplasma genitalium do not currently have aCOG functional category assignment (here represented as N/A). Note that although each ORF is only counted once within each COG functionalcategory, some ORFs have multiple COG category assignments.doi:10.1371/journal.pcbi.1000285.g003
Table 3. Biomass components used in iPS189.
Proteina RNA Inorganic Ions Cofactors and Other
L-alanine L-lysine ATP ammonium FAD
L-arginine L-methionine GTP calcium NAD
L-asparagine L-phenylalanine CTP chlorine NADP
L-aspartate L-proline UTP cobalt coenzyme A
L-cysteine L-serine copper 10-formyltetrahydrofolate
L-glutamine L-threonine DNA iron 5,10-methylenetetrahydrofolate
L-glutamate L-tryptophan dATP magnesium 5,6,7,8-tetrahydrofolate
Glycine L-tyrosine dGTP manganese pyridoxal 59-phosphate
L-histidine L-valine dCTP molybdate S-adenosyl-L-methionine
L-isoleucine N-formylmethionine dTTP nickel Spermidine
L-leucine phosphorous riboflavin
potassium putrescine
sulfate menaquinol 7
zinc mycolic acid
minor teichoic acidb
teichuronic acidb
triglucosyl-1,2 diacylglycerolb
aAmino acids were incorporated as charged and unchanged tRNA molecules in the equation as reactants and products, respectively. The charged gln-tRNA becomes anuncharged glu-tRNA and the charged fmet-tRNA becomes an uncharged met-tRNA through the biomass equation.
bAdded during GrowMatch procedure.doi:10.1371/journal.pcbi.1000285.t003
In Silico M. genitalium Metabolic Reconstruction
PLoS Computational Biology | www.ploscompbiol.org 5 February 2009 | Volume 5 | Issue 2 | e1000285

transported into the intracellular space. These metabolites
included a number of biomass precursor metabolites (e.g., some
amino acids, cofactors and metal ions) that had not been assigned
uptake reactions. Of all the blocked metabolites, thirteen were
involved in nucleotide metabolism and eight were metal ions
without an identified transporter. We also note that 40 of these
metabolites are charged/uncharged tRNA molecules, which are
active in closed reaction cycles used in forming the protein
component of biomass.
Through the use of GapFill [17] we subsequently sought to
bridge these network gaps through the addition of reactions,
transport pathways and relaxation of irreversibilities of reactions
already in the model. Reactions known not to be present in M.
genitalium (e.g., an incomplete TCA cycle) were excluded as gap
filling candidates. We first applied GapFill to unblock constituents
of biomass guided by the known components in the growth
medium. We unblocked biomass production by adding 65
reactions, for which most (i.e., 43) were involved in metabolite
transport, such as for the uptake of amino acids (14), folate,
riboflavin, metal ions (8), and cofactors such as CoA. Among the
remaining reactions were those responsible for the hydrolysis of
dipeptides (15) and eight reactions involving other biotransforma-
tions. We performed an additional round of BLASTp comparisons
of genes annotated with these reactions against the M. genitalium
genome to determine if we could associate any of these reactions
with specific genes in M. genitalium. We found five proteins
catalyzing these reactions that had BLASTp scores smaller than
1025 (see Table 2). For example, GapFill suggested the addition of
reaction glutamyl-tRNA(Gln) amidotransferase in the model to
allow the formation of the gln-tRNA molecule. BLASTp searches
allowed us to link this activity with the genes encoding for the three
subunits (MG098, MG099 and MG100). Note that these three
genes (and others added during this step) were not added earlier
(steps 1 and 2) on account of their ambiguous functional
characterization. By bringing to bear both homology (though
BLASTp) and connectivity restoration (through GapFill), here we
rely on multiple pieces of evidence when appending a new
functionality and corresponding genes to the model.
Even after unblocking biomass formation, 43 metabolites
remained blocked and were subsequently analyzed by GapFill.
The results from GapFill are summarized in Figure 4. We were
able to reconnect three metabolites by treating three reactions as
reversible. We also found that the originally assigned (based on the
auto-model) directionality of 1-acyl-sn-glycerol-3-phosphate acyl-
transferase was incorrect. It was subsequently reversed and found
to be in accordance with both KEGG and MetaCyc entries. An
additional 21 metabolites were reconnected by adding 18 reactions
from the KEGG and MetaCyc databases (see Materials and
Methods). The addition of these 18 reactions also introduced an
additional nine metabolites (three of which were involved in
glycerolipid metabolism) to the model. Finally the incorporation of
uptake/transport reactions reconnected an additional four metab-
olites. We performed an additional round of BLASTp compar-
isons and we were able to associate three out of 22 reactions with
specific genes (see Table 2). We found that the associated gene (i.e.
MG066) for 1-deoxy-D-xylulose 5-phosphate synthase was already
included in the model but with a different functionality (i.e.,
transketolase). The secondary synthase functionality, revealed by
GapFill/BLASTp, was subsequently associated with gene MG066
in the model. A similar situation occurred with MG053, which was
already associated with phosphomannomutase in the model. In
addition, gene MG259 (annotated as ‘‘modification methylase,
HemK family’’ in the Comprehensive Microbial Resource,
http://cmr.jcvi.org) was added to the model to carry out the
glutamine-N5 methyltransferase activity elucidated by GapFill/
BLASTp. The model statistics after correcting for network gaps
are summarized in Table 1.
Model Correction Using In Vivo Gene Essentiality DataBased on in vivo gene essentiality data [19] we deduced that
there are 174 essential genes and 19 non-essential genes among the
193 genes provisionally present in the model (after steps 1, 2, and
3). We note that the in vivo gene essentiality experiments were
performed using non-defined medium containing serum and yeast
hydrolysate among other rich components. During the in silico
model predictions/comparisons, we allowed the uptake of all
extracellular metabolites with transport reactions, except for
sugars other than glucose, in order to computationally approxi-
mate this medium.
Using a recently proposed diagnostic of the percentage of
correctly-identified essential genes [38,39], we found that the
model correctly identified 137 out of a total of 174 essential genes
(i.e., specificity of 79%) and 16 out of a total of 19 non-essential
genes (i.e., sensitivity of 84%). This implies that the model (after
steps 1, 2, and 3) was 79% correct in its overall accuracy in growth
predictions (i.e., 153 of 193). Most of the mismatches (92%) were
over-predictions of the metabolic capabilities (i.e., predicting
growth when none is observed in vivo) instead of under-predictions
(i.e., predicting no growth when growth is observed in vivo). We
subsequently deployed the GrowMatch method (Satish Kumar
and Maranas, submitted) to rectify as many as possible of the
erroneous essentiality predictions by the model. GrowMatch
functions by identifying the minimal number of model modifica-
tions required to restore consistency between growth predictions
and gene essentiality experiments (see Materials and Methods).
Model under-predictions include mutants (MG410 and
MG411), which encode the subunits for the phosphate transporter,
preventing in both cases the uptake of phosphate. This implies that
M. genitalium must have an additional uptake route of phosphates.
Even though GrowMatch suggested a number of phosphate
uptake alternatives to resolve this conflict and Glass and coworkers
[19] had posited the activity of a putative phosphonate transporter
(MG289, MG290, and MG291), we decided not to add them to
the model as no direct evidence exists to ascertain their presence.
For instance, the putative phosphonate transporter might be
nonspecific thus also enabling uptake of phosphate. Alternatively,
the unidentified phosphonate substrate might be catabolized to
Figure 4. Summary of the GapFind and GapFill proceduresafter biomass unblocking. During biomass formation unblocking,most metabolites that could not be produced (disconnected metab-olites) were reconnected through the addition of transport reactions.Metabolites not directly connected to biomass were mostly reconnect-ed through the addition of reactions from KEGG and Metacyc.doi:10.1371/journal.pcbi.1000285.g004
In Silico M. genitalium Metabolic Reconstruction
PLoS Computational Biology | www.ploscompbiol.org 6 February 2009 | Volume 5 | Issue 2 | e1000285
yield phosphate through a number of reactions. The other
incorrect under-prediction involved MG138 (homologous to
elongation factor 4 in E. coli), which had been associated with
macromolecule formation during the automodel construction. We
observed that deletion mutants of the homolog in E. coli (lepA) are
viable [40]. Based on this information, we removed this gene and
its erroneous association as an essential component of the biomass
equation from the model.
Interestingly, three of the 37 erroneous over-predictions were
corrected by adding three membrane components to the biomass
equation (see Table 3). These components were not added during
the initial model construction because it was not clear which (if
any) of this class of metabolites were essential. An additional three
erroneous predictions of non-essentiality were corrected by
suppressing two reactions. One of these reactions, inosine kinase,
was added during GapFill but not linked to an associated gene.
Suppression of this reaction corrected two over-predictions but did
not invalidate any correct model predictions, suggesting that the
reaction activity is unlikely to be present in vivo, at least under the
experimental conditions, and perhaps is not an activity encoded by
M. genitalium. An additional six over-predictions involved two metal
ion ABC transporters. GrowMatch identified each transporter to
be essential when the other one was suppressed. We rejected co-
regulation of the two transporters as a model restoration
mechanism. Instead, we restored consistency for three of the six
genes by assigning the cobalt uptake to the complex with a better
homology to characterized cobalt transporters (MG179, MG180,
MG181). The remaining three genes were removed from the
model. An alternative interpretation of the GrowMatch results is
that some other ion uptake reaction(s) are uniquely associated with
these transporters and are thus responsible for the in vivo
phenotype.
Overall, the application of GrowMatch to the metabolic model
led to the generation of a number of testable hypotheses regarding
the presence or absence of specific functionalities and emphasized
the importance of determining the substrate specificity of the
transporters. We also identified reactions that had to be
inactivated only for certain knock-outs suggesting their depen-
dence on the genetic background in addition to the specific
environmental conditions. For example, MG112 (ribulose-phos-
phate 3-epimerase) had to be suppressed in conjunction with two
single gene deletions (i.e., conditional suppressions) to restore
consistency with the in vivo data, suggesting possible regulation
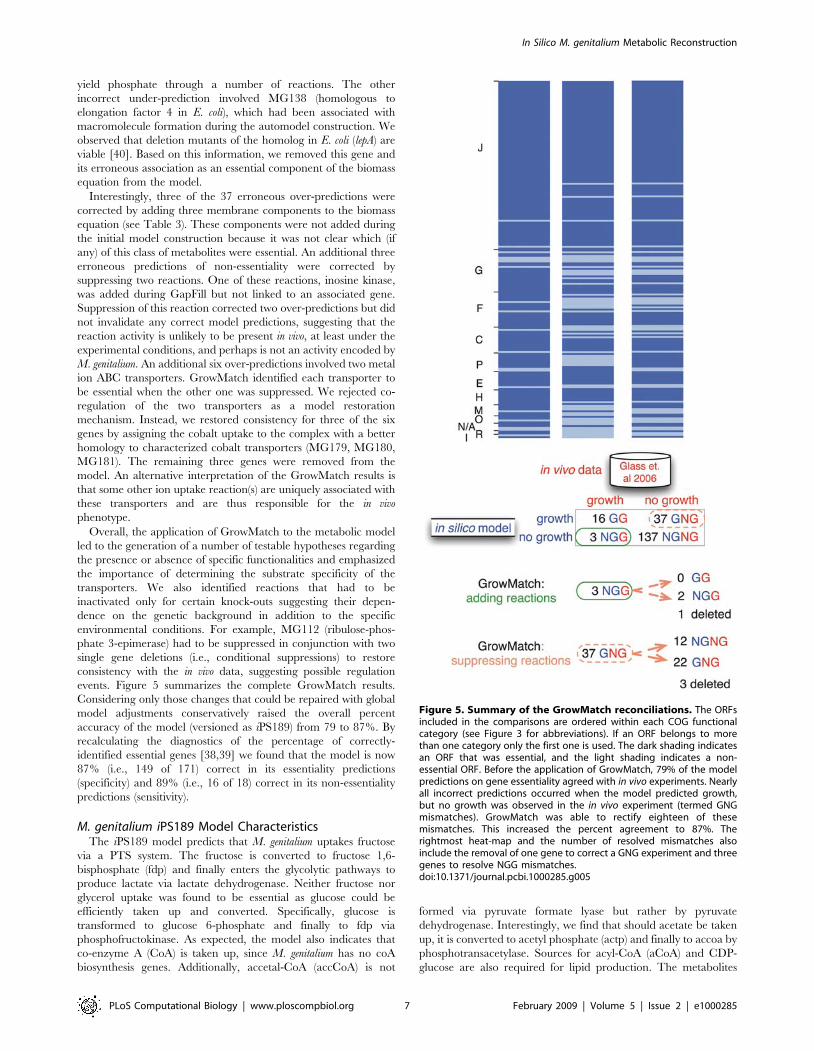
events. Figure 5 summarizes the complete GrowMatch results.
Considering only those changes that could be repaired with global
model adjustments conservatively raised the overall percent
accuracy of the model (versioned as iPS189) from 79 to 87%. By
recalculating the diagnostics of the percentage of correctly-
identified essential genes [38,39] we found that the model is now
87% (i.e., 149 of 171) correct in its essentiality predictions
(specificity) and 89% (i.e., 16 of 18) correct in its non-essentiality
predictions (sensitivity).
M. genitalium iPS189 Model CharacteristicsThe iPS189 model predicts that M. genitalium uptakes fructose
via a PTS system. The fructose is converted to fructose 1,6-
bisphosphate (fdp) and finally enters the glycolytic pathways to
produce lactate via lactate dehydrogenase. Neither fructose nor
glycerol uptake was found to be essential as glucose could be
efficiently taken up and converted. Specifically, glucose is
transformed to glucose 6-phosphate and finally to fdp via
phosphofructokinase. As expected, the model also indicates that
co-enzyme A (CoA) is taken up, since M. genitalium has no coA
biosynthesis genes. Additionally, accetal-CoA (accCoA) is not
formed via pyruvate formate lyase but rather by pyruvate
dehydrogenase. Interestingly, we find that should acetate be taken
up, it is converted to acetyl phosphate (actp) and finally to accoa by
phosphotransacetylase. Sources for acyl-CoA (aCoA) and CDP-
glucose are also required for lipid production. The metabolites
Figure 5. Summary of the GrowMatch reconciliations. The ORFsincluded in the comparisons are ordered within each COG functionalcategory (see Figure 3 for abbreviations). If an ORF belongs to morethan one category only the first one is used. The dark shading indicatesan ORF that was essential, and the light shading indicates a non-essential ORF. Before the application of GrowMatch, 79% of the modelpredictions on gene essentiality agreed with in vivo experiments. Nearlyall incorrect predictions occurred when the model predicted growth,but no growth was observed in the in vivo experiment (termed GNGmismatches). GrowMatch was able to rectify eighteen of thesemismatches. This increased the percent agreement to 87%. Therightmost heat-map and the number of resolved mismatches alsoinclude the removal of one gene to correct a GNG experiment and threegenes to resolve NGG mismatches.doi:10.1371/journal.pcbi.1000285.g005
In Silico M. genitalium Metabolic Reconstruction
PLoS Computational Biology | www.ploscompbiol.org 7 February 2009 | Volume 5 | Issue 2 | e1000285
riboflavin and nicotinic acid (niacin) are taken up for synthesis of
the cofactors FAD and NAD, respectively.
In addition, both spermidine and putrescene are directly
imported as biomass components. Similarly, we also found that
D-ribose (rib-D) is needed to fuel the truncated pentose phosphate
pathway. Examination of fluxes indicated that the uptake of rib-D
results in production of 5-phospho-a-D-ribose 1-diphosphate,
which enables the conversion of adenine to amp. We also deduced
that only adenine and cytidine are precursors to nucleotides and
nucleosides (CTP, dCTP, UTP, dUTP, dTTP). Interestingly, the
model required the direct uptake of GTP and could not be
produced through the uptake of guanine. Model modifications
that eliminate this requirement using GrowMatch resulted in a
number of incorrect gene essentiality predictions. The need for the
direct uptake of GTP is consistent with the fact that in M. mycoides
the guanine nucleotide pathways depend on transport of
preformed guanine derivatives [34], and that a number of other
Mycoplasmas are not able to grow on medium that only contains
guanine as a nucleobase [41]. In addition, all amino acids are
imported directly from the environment as either monomers or
dipeptides. Unlike many other mycoplasmas, M. genitalium is an
arginine nonfermenting species, and not surprisingly arginine
deiminase activity was not present in the model. Furthermore, in
iPS189, the only participation of the amino acid arginine is its
direct incorporation into biomass. Finally, flux predictions
revealed that lactate is the main product of M. genitalium
fermentation.
Identifying Necessary Components of a Defined MediumA key targeted application of the iPS189 metabolic model is to
drive the development of a defined growth medium. As noted
above, gene essentiality experiments were performed using a non-
defined medium, SP-4, which contains beef heart infusion,
peptone supplemented with yeast extract and fetal bovine serum.
The use of an undefined medium can confound the characteriza-
tion of gene essentiality, as the exact environmental conditions are
not fully specified. Furthermore, the lack of a defined growth
medium complicates the understanding of nutritional control and
regulation of pathologies, evaluation of drug susceptibility,
characterization of auxotrophic mutants and performing genetic
analysis.
Using trial-and-error researchers have already attempted to
formulate defined media by systematically deleting components
from an undefined or complex media [28]. For example, defined
media have been constructed for the growth of Mycoplasma
capricolum [42], Acholeplasma laidlawii [43], Spiroplasmas [44], and a
semi-defined medium was recently formulated for two Mycoplasma
mycoides subspecies [45]. However such approaches do not take
into account the balance and availability of chemical species in
cellular metabolic pathways to systematically guide medium
design. Genome-scale models of metabolism provide maps for
tracing missing components needed for biomass formation, redox
potential and ATP maintenance [46–48]. These models have
already been successfully employed to establish minimal reaction
sets needed for growth under several uptake environments [49],
elucidate substrate uptake requirements for several microbial
organisms such as Helicobacter pylori [50] and Haemophilus influenzae
[50] and more recently design complete growth media [51–53].
Motivated by these medium-associated shortcomings, we used
the iPS189 metabolic model as a roadmap of the available
transporters, metabolites and internal interconversions to seek out
the minimum number of growth medium components necessary
for biomass production. We used as a starting point the
components of the C5 medium (Rodwell, 1983), which is used
as a component of SP-4, with the addition of folate and biotin and
the replacement of thiamine by the four individual deoxynucleo-
sides (see Table S4). By minimizing the total number of additional
components that are needed for growth (see Materials and
Methods), a number of additional components were identified as
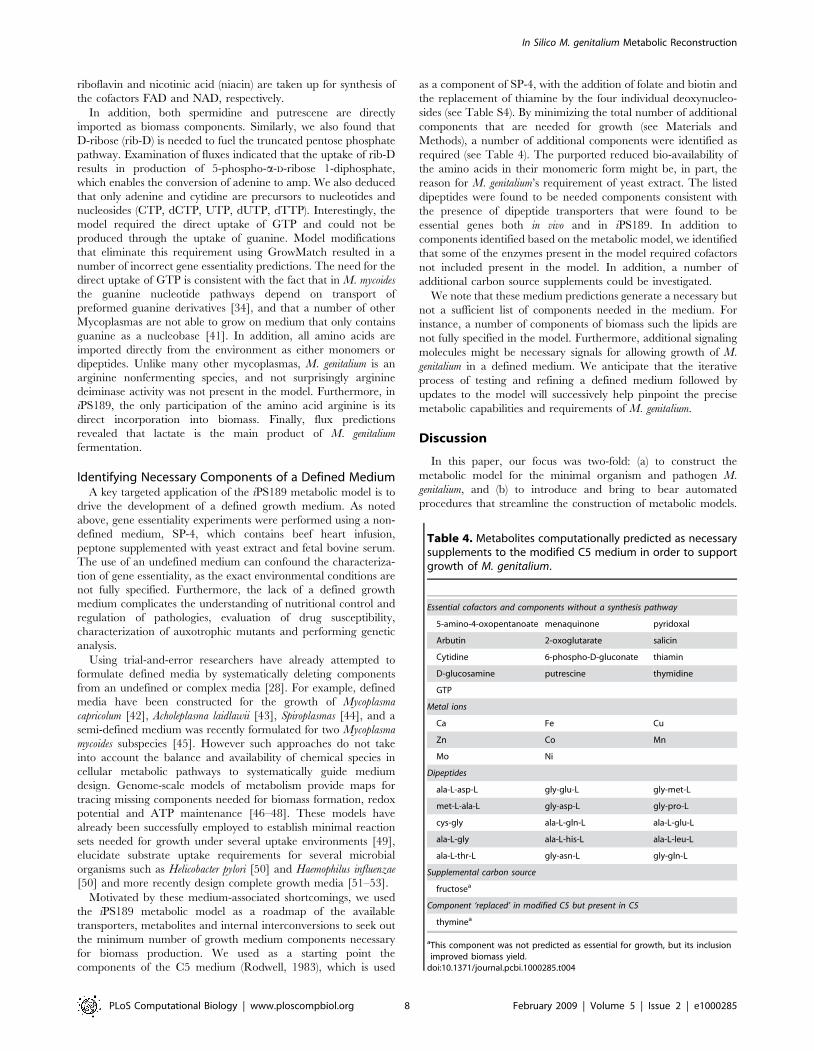
required (see Table 4). The purported reduced bio-availability of
the amino acids in their monomeric form might be, in part, the
reason for M. genitalium’s requirement of yeast extract. The listed
dipeptides were found to be needed components consistent with
the presence of dipeptide transporters that were found to be
essential genes both in vivo and in iPS189. In addition to
components identified based on the metabolic model, we identified
that some of the enzymes present in the model required cofactors
not included present in the model. In addition, a number of
additional carbon source supplements could be investigated.
We note that these medium predictions generate a necessary but
not a sufficient list of components needed in the medium. For
instance, a number of components of biomass such the lipids are
not fully specified in the model. Furthermore, additional signaling
molecules might be necessary signals for allowing growth of M.
genitalium in a defined medium. We anticipate that the iterative
process of testing and refining a defined medium followed by
updates to the model will successively help pinpoint the precise
metabolic capabilities and requirements of M. genitalium.
Discussion
In this paper, our focus was two-fold: (a) to construct the
metabolic model for the minimal organism and pathogen M.
genitalium, and (b) to introduce and bring to bear automated
procedures that streamline the construction of metabolic models.
Table 4. Metabolites computationally predicted as necessarysupplements to the modified C5 medium in order to supportgrowth of M. genitalium.
Essential cofactors and components without a synthesis pathway
5-amino-4-oxopentanoate menaquinone pyridoxal
Arbutin 2-oxoglutarate salicin
Cytidine 6-phospho-D-gluconate thiamin
D-glucosamine putrescine thymidine
GTP
Metal ions
Ca Fe Cu
Zn Co Mn
Mo Ni
Dipeptides
ala-L-asp-L gly-glu-L gly-met-L
met-L-ala-L gly-asp-L gly-pro-L
cys-gly ala-L-gln-L ala-L-glu-L
ala-L-gly ala-L-his-L ala-L-leu-L
ala-L-thr-L gly-asn-L gly-gln-L
Supplemental carbon source
fructosea
Component ‘replaced’ in modified C5 but present in C5
thyminea
aThis component was not predicted as essential for growth, but its inclusionimproved biomass yield.
doi:10.1371/journal.pcbi.1000285.t004
In Silico M. genitalium Metabolic Reconstruction
PLoS Computational Biology | www.ploscompbiol.org 8 February 2009 | Volume 5 | Issue 2 | e1000285

The procedure does not require a fully annotated genome and can
serve to complement existing annotations [2] by generating
testable hypotheses of functionality. We made use of BLASTp to
associate functionality to ORFs in the multiple stages, but alternate
methods of determining enzymatic function, such as profile-based
approaches [54,55] could provide additional or alternative
assignments. Hypothesizing novel pathways [56] will also likely
become increasingly important as metabolic reconstructions for
more diverse organisms are carried out.
Many genome annotation errors are caused [57] by the use of
non-specific reaction compound associations or partially qualified
Enzyme Commission numbers [58]. For instance, a comparative
study identified an 8% difference in ORFs across three different
functional annotations of M. genitalium [59]. Therefore, the direct
use of genome-annotation derived reconstructions (e.g., KEGG
and Pathway Tools generated models) can lead to inaccurate
descriptions of metabolic behavior [60]. Specifically, a recent study
has shown that a permissive inclusion of pathways from these
reconstructions can lead to models that overpredict the metabolic
capabilities of Lactococcus lactis [61]. To safeguard against this issue,
we have used manually curated metabolic models as libraries of
biotransformations. We note that this procedure allows for the
straightforward incorporation of reactions that are charge and
elementally balanced, which is not the case with many reactions in
KEGG [62]. Earlier efforts have examined the general metabolism
of Mycoplasmas [63] or targeted some specific subsections such as
purine and pyrimidine metabolism [41,64]. Although there is an
overlap between the reaction set in our reconstruction and those
available in previous studies, developing a M. genitalium specific
model with growth requirement as a constraint revealed novel
uptake and non-gene associated reactions that previous studies
were unable to identify.
The identification of which metabolites are produced internally
or transported directly from the extracellular environment was
complicated by the lack of a defined medium for M. genitalium and its
fastidious growth-requirements. Notably, no other metabolic model
reconstruction efforts to date were complicated by the lack of both a
well-defined biomass composition and a defined growth medium.
Here, we allowed the uptake of all metabolites known to be present
in the current medium. We also included metabolites either with
identified transporters or those necessary for reconnecting blocked
metabolites/reactions. Even though missing metabolites and
pathways still exist in iPS189, we were able to achieve a high
degree of agreement between the model predictions and in vivo gene
essentiality data (87%). We note that the most recent iteration of the
metabolic model for E. coli, an organism which has both a well-
defined biomass composition as well as chemically defined growth
media, has an overall agreement with in vivo gene essentiality data of
91% under aerobic glucose conditions [33]. Becker and Palsson [38]
have recently reported that most in silico models correctly predict less
than 45% of essential genes (called specificity in [39]); for the most-
recent E. coli model this diagnostic was 66%. iPS189 has similar
performance on both the overall accuracy in growth predictions and
specificity (both 87%) because of, in part, the much higher
percentage of essential genes in M. genitalium but also its careful
construction. Additional in vivo gene essentiality studies using a fully
defined medium could usher a more accurate elucidation of the true
metabolic capabilities of M. genitalium, as well as suggest improve-
ments to the reconstruction.
The metabolic model iPS189 is smaller than the 256 genes
suggested as a minimal gene set based on comparison of M.
genitalium and H. influenzae proteins [22]. In large part, this seeming
discrepancy results from the intentional exclusion from the model
of many genes that are essential (e.g., those encoding DNA and
RNA polymerases) though not directly related to metabolic
processes. If such genes were included, the model size would
increase by (at least) 59 genes to 248. In addition, 68 genes that are
essential in vivo have unknown function, and thus cannot (yet) be
incorporated into the model. It is possible that they could, in part,
carry out some of the non-gene associated reactions that were
proposed during the GapFill procedure. Determining their
metabolic function through biochemical and molecular biology
techniques, as well as determining the substrate specificity for non-
characterized transporters, would improve subsequent metabolic
models.
Looking to the future, we note that it was recently shown that it
is feasible to transplant the genome from one mycoplasma species
to another [65], thus opening the door to the transplantation of a
perhaps completely synthetic genome. Furthermore, the recent
announcement of the de novo synthesis and assembly of the
complete M. genitalium genome [66] brings closer to reality the ab
initio design of microbes from scratch that are exquisitely tuned for
specific biotechnological applications. The constructed metabolic
model iPS189 could serve as a core of metabolic functions to add
upon so as to bring about the desired biological functionalities
and/or production capabilities.
Materials and Methods
The general principles of the metabolic reconstruction process
have been previously outlined [1,51]. In the following section, the
specific methods used in the reconstruction of M. genitalium are
detailed.
Initial Reconstruction ContentThe first step in our reconstruction of the genome-scale model
of metabolism of M. genitalium involved analyzing the annotated M.
genitalium G-37 genome sequence with the SimPheny automated
model generation platform developed by Genomatica (San Diego,
CA). This automated procedure leveraged the content contained
in Genomatica’s manually curated models to expedite the initial
reconstruction of M. genitalium metabolism. For the M. genitalium
model, reconstructions for E. coli, Haemophilus influenzae, Geobacter
sulfurreducens, B. subtilis, and Saccharomyces cerevisiae were used in the
comparisons. Subsequently genes-protein-reaction (GPR) associa-
tions were established based on the evidence provided by
homology identity provided by sequence analysis and annotation
information. Specifically, forward and reverse protein-protein
BLAST (BLASTp) comparisons were carried out to identify genes
in the library of manually curated models that most closely
resemble those in M. genitalium. In the forward BLASTp step, each
M. genitalium ORF was compared against each gene in the
manually curated models. Then, in the reverse BLASTp step, the
best hit from manually curated models was compared against the
M. genitalium genome ORFs. The top hits for each of the searches
were stored, and a third list was compiled consisting of the cases in
which the top hits are identical in both the forward and reverse
BLASTp searches. For only these pairs, the GPR association(s)
from the manually curated model was used as a template to assign
those in the M. genitalium model. This two-way BLASTp search
procedure improves the likelihood that M. genitalium orthologs, not
paralogs, to genes in the manually curated models are identified
and assigned by the automodel process.
Although the automated genome-model comparisons enabled a
fast generation of a draft model, the auto-generated reconstruction
was extended by searches for relevant reactions not included in the
library of curated models. First, all high-quality annotated ‘‘non-
metabolic’’ genes, such as those encoding transcription factors and
In Silico M. genitalium Metabolic Reconstruction
PLoS Computational Biology | www.ploscompbiol.org 9 February 2009 | Volume 5 | Issue 2 | e1000285
proteins involved in replication and repair, were excluded from
subsequent searches. We then extracted the remaining sequences
of all the ORFs not yet included in the M. genitalium model and
performed BLASTp analysis to identify additional proteins with
biochemically characterized functionalities in other organisms. The
target database was the nr (non-redundant) database at NCBI
(http://www.ncbi.nlm.nih.gov/blast). Next, all target proteins that
the BLASTp search reported Expect (E) values less than 1025
were further investigated for biochemical characterization. Next,
we carried out a reverse BLASTp analysis of each of these
characterized proteins against sequences in the M. genitalium
genome. If the initial M. genitalium gene was ranked with the best
score and had an acceptable E value (less than 1025) at the end of
this step, that gene and its associated reactions were included in
the model as with the library of curated models.
During the construction of the initial model, all of the reactions
added during the auto-generated reconstruction were also
subsequently examined for internal consistency. For example,
reactions involving compartments (which are not present in the
bacterium M. genitalium) were updated to occur in the cytosol,
three reactions for ATP synthase were merged, and two
macromolecule synthesis reactions were combined and their
GPR associations were manually updated. We also added GPR
associations for missed characterized members of complexes (e.g.,
a component of an ABC transporter system) when the automodel
associated the other members, as well as corrected those GPR
associations for proteins that were misidentified as isozymes
instead of complexes. Furthermore, we investigated the cluster of
orthologous groups (COGs) ontology [35] of all genes in the
automodel, as well as examined all ORFs using the NCBI nr
database as an added guard against the erroneous transfer of a
functionality into the M. genitalium model. Those having classifi-
cation within non-metabolic classifications, such as transcription
(K); replication, recombination and repair (L); general function
prediction only (R); function unknown (S); or none assigned (N/A)
were inspected further. Although most of the ORFs within (R) and
(N/A) were retained, we removed all those within (K), (L), and (S)
from the model (see Table S3). All reactions, including those
added from the BLASTp searches and subsequent additions, were
checked and corrected whenever necessary for charge balance
(protonation state) and elemental balance.
Generation of the Biomass EquationThe biomass equation was generated by accounting for as many
as possible of the constituents that form the cellular biomass of M.
genitalium. Unfortunately, no complete compilation is available in
the open literature for M. genitalium, however some information on
the soluble protein composition of it [67] and data on closely
related mycoplasmas is available. Therefore, we started with the
biomass equation from the Gram positive B. subtilis model [68]
and the core biomass equation from the E. coli iAF1260 metabolic
model [33] and subsequently modified them accordingly. First, all
components related to the cell wall were removed as M. genitalium
lacks one. Next, the amount of precursor molecules involved in
DNA production were adjusted by altering their ratios in
accordance with the lower G+C content in M. genitalium (31.7%)
as compared to E. coli (49.8%) and B. subtilis (40.9%) and its
smaller genome size. The amino acid relative percentages were
likewise adjusted based on utilization patterns and codon biases.
Amino acid utilization was incorporated as charged and
uncharged tRNA molecules in the biomass equation as reactants
and products, respectively. Note that the charged gln-tRNA
becomes an uncharged glu-tRNA and the charged fmet-tRNA
becomes an uncharged met-tRNA through the biomass equation.
Metal ions known to be present in the active sites of catalytic
enzymes were also included in the biomass equation. Various
membrane and lipid components were subsequently added in
accordance with the GrowMatch predictions.
Generation of Computations-Ready ModelTesting the metabolic model using optimization-based ap-
proaches requires the definition of a number of sets and
parameters.
Sets:
I~ if g~set of metabolites
J~ jf g~set of reactions
JR(J~set of reversible reactions
IE(I~metabolites that can cross cell boundaries
either directionð Þ
IF(I~metabolites present in growth medium
Parameters:
Sij~stoichiometic matrix
LBj~lower bound of flux of reaction j
UBj~upper bound of flux of reaction j
Variables:
nj~flux of reaction j
Upper and lower bounds, UBj and LBj, were chosen as not to
exclude any physiologically relevant metabolic flux values. The upper
bound for all reactions was set to 1,000. The lower bound was set
equal to zero for irreversible reactions and to 21,000 for reversible
reactions. The non-growth associated ATP maintenance limit was set
to LBj = 8.4 gDW21 h21. The maximum transport rate into the cell
was 5 mmol gDW21 h21 for any external carbon containing
metabolite (i.e., LBj = 25). The lower bound for the remaining source
exchange reactions was 220 mmol gDW21 h21 [33].
Using the principle of stoichiometric analysis along with the
application of a pseudo-steady-state hypothesis to the intracellular
metabolites [69], an overall flux balance can be written as follows:
Xj
Sij:nj~0, V i[I ð1Þ
When constructing the model, we also generated the gene-
protein-reaction (GPR) associations that link the ORFs to the
reactions that are catalyzed by their gene products using standard
conventions [70].
Analysis and Restoration of Network ConnectivityOnce a mathematical representation of the metabolic model
was generated, we first determined using GapFind [17] which
metabolites could not be produced (i.e., cannot carry any net
In Silico M. genitalium Metabolic Reconstruction
PLoS Computational Biology | www.ploscompbiol.org 10 February 2009 | Volume 5 | Issue 2 | e1000285
influx), given the availability of all substrates supported by the
model. We next applied GapFill to modify the existing genome-
scale model in order to reconnect these metabolites to the model.
The reaction source databases used by GapFill in this work were
the KEGG [71] and MetaCyc [72] databases. These reactions
were provisionally added to the model, after evaluating charge and
elemental balancing. We also performed additional homology
searches to try to identify any additional GPR associations. Care
was taken when applying GapFill so as not to introduce
functionalities known to be absent in M. genitalium (e.g., incomplete
TCA cycle and disconnected pentose-phosphate pathway).
Model Correction Using In Vivo Gene Essentiality DataThe introduction of the GPR associations introduces additional
complexity in that an additional layer of detail is needed to fully
characterize the network when a single gene is deleted. We made
the following definitions to this end:
Sets:
K~ kf g~set of genes
Parameters:
Gjk~1, if gene k is necessary for reaction j to be active
0, otherwise,
(
V j[J, k[K
Variables:
wj~1, if reaction j is active
0, otherwise, V j[J
�
Set K contains all ORFs (genes) that are included in the
metabolic reconstruction. We used a fictitious gene s0001, as in
[33], to map and track spontaneous reactions that are known to be
non-enzymatic (e.g., diffusion of CO2 across the cell boundaries),
but this fictitious gene was not included when enumerating the
total genes included in the model, nor could it be knocked out.
Note that a gene k may have more than one GPR association
when it is involved with more than one reaction. Likewise, a
reaction j may be involved in more than one GPR association, as is
the case with isozymes or multi-protein complexes. We restricted
reaction fluxes, vj, using the binary variable wj as follows:
LBj:wjƒnjƒUBj
:wj , V j[J ð2Þ
Equation (2) ensures that the flux in reaction j can take a non-zero
value only if the reaction is active (i.e., wj = 1).
Parameter Gjk describes the impact of the deletion of gene k on
reaction j. For instance, if only a single gene k1 is associated with
reaction j, then we assign Gjk1~1. On the other hand, if two genes
k1 and k2 encode isozymes that catalyze reaction j, then we assign
Gjk1~Gjk2~0. However, if two genes k1 and k2 are required for
the formation of a multi-protein complex that catalyzes reaction j,
we set both Gjk1 and Gjk2 equal to one. More complex associations
were handled in a similar manner.
We tested the in silico growth predictions of the M. genitalium
metabolism network by examining the flux of the biomass
equation. Given the deletion of a single gene k, we solved the
following formulation:
Maximize vbiomass ð3Þ
subject to
Xj
Sij:nj~0, V i[I ð1Þ
LBj:wjƒnjƒUBj
:wj , V j[J ð2Þ
wj~0, V j[J with Gjk~1 ð4Þ
Equation (4) ensures that the flux in reaction j is zero when the
gene k that is necessary for its activity is deleted. Note that this
equation takes advantage of the fact that in this work we only
examined single gene deletions and thus needed not write more
complicated GPR-related constraints. This formulation was solved
for each gene j in the model using CPLEX version 11 accessed
within the GAMS modeling environment. The predictions were
compared against in vivo gene essentiality data [19]. Because the
experiments were performed in a non-defined rich medium [19],
all metabolites that had identified transporters or were known to
be able to cross the membrane into the cell in a non-mediated way
were allowed to have exchange reactions to enter the system.
Exceptions were the metabolites known not to be present in the
growth medium: sugars other than glucose, as well as acetate and
lactate. In this study, we used the growth cutoff was that proposed
in the recent study [73] which is defined as one–third of the average
growth exhibited by all the single gene deletions under
consideration. However, we found that the in silico growth
predictions for iPS189 were insensitive to this value.
We next applied the GrowMatch method to reconcile
inconsistencies between in silico and in vivo growth predictions
across single gene deletion mutants (Satish Kumar and Maranas,
in preparation). To this end, we first classified growth prediction
inconsistencies into two categories: (a) a mutant is termed a
‘‘Grow/NoGrow’’ (GNG) mutant if the in silico model predicts
growth whereas there is no observed growth in vivo and (b) a
mutant is termed a ‘‘No Grow/Grow’’ (NGG) mutant if the in silico
model predicts no growth in contrast with observed in vivo growth.
In GNG mutants, the model overpredicts the metabolic
capabilities of the organism. GrowMatch automatically restores
consistency in these mutants by suppressing reaction activities to
prevent in silico growth (i.e., by identifying erroneously added
reactions or missing regulation). Conversely, in NGG mutants, the
model underpredicts the metabolic capabilities of the organism.
GrowMatch restores consistency in these mutants by adding
functionalities that ensure in silico growth consistent with in vivo
data. As when GapFill was applied, the additional reactions were
carefully monitored. In all cases, GrowMatch operates so as not to
perturb any correct growth predictions.
Model-Guided Identification of Necessary MediumComponents
We pose the problem of identifying the minimum number of
added components to the growth medium so as to allow for the
formation of all biomass constituents as an optimization problem.
In Silico M. genitalium Metabolic Reconstruction
PLoS Computational Biology | www.ploscompbiol.org 11 February 2009 | Volume 5 | Issue 2 | e1000285
To this end, we introduce the following additional sets and
variables:
Sets:
SUB(J~set of exchange reactions allowing
the importation of substrate
Variables:
uj~
1, if exchange reaction j is activated to allow
the uptake of the corresponding metabolite
0, otherwise
8>><>>: ,
Vj[SUB
We minimized the total number of activated substrate exchange
reactions that enable the uptake of growth medium components
through the use of the following optimization formulation:
MinimizeX
j[SUB
uj ð5Þ
subject to
Xj
Sij:nj~0, V i[I ð1Þ
LBjƒnjƒUBj, V j[J\SUB ð6Þ
LBj:yjƒnjƒUBj , V j[SUB ð7Þ
vbiomass§vcutoffbiomass ð8Þ
Equation (6) ensures that the fluxes for all reactions that are not
associated with the uptake of a substrate are within the bounds
defined earlier. When an exchange reaction j is active (uj = 1),
Equation (7) permits its flux to assume non-zero negative values,
thus allowing the uptake of the corresponding substrate.
Conversely, when an exchange reaction j is inactive (uj = 0),
Equation (7) ensures that the exchange reaction can only remove
the corresponding product from the extracellular environment
(i.e., its flux can only assume positive values). Constraint (8) ensures
a minimum amount of biomass formation, with the cutoff set to be
the same as that used for the gene essentiality predictions above
(i.e., one–third of the average maximum biomass flux exhibited by
all the single gene deletions). This MILP problem was also solved
using CPLEX version 11 accessed within the GAMS modeling
environment.
Supporting Information
Table S1 Reconstruction metabolite and reaction content
Found at: doi:10.1371/journal.pcbi.1000285.s001 (0.15 MB XLS)
Table S2 Composition of the biomass equation
Found at: doi:10.1371/journal.pcbi.1000285.s002 (0.03 MB XLS)
Table S3 Gene content of the model during each step of the
reconstruction
Found at: doi:10.1371/journal.pcbi.1000285.s003 (0.05 MB XLS)
Table S4 Components included in modified C5 medium
Found at: doi:10.1371/journal.pcbi.1000285.s004 (0.02 MB XLS)
Text S1 iPS189 in SBML format
Found at: doi:10.1371/journal.pcbi.1000285.s005 (0.02 MB ZIP)
Acknowledgments
We thank Anthony P. Burgard and Tom Fahland for help during the
SimPheny automodel generation and for discussion during the reconstruc-
tion process.
Author Contributions
Conceived and designed the experiments: JIG CDM. Performed the
experiments: PFS MSD VSK. Analyzed the data: PFS GD. Contributed
reagents/materials/analysis tools: CDM. Wrote the paper: PFS MSD.
Edited the paper: JIG CDM.
References
1. Reed JL, Famili I, Thiele I, Palsson BO (2006) Towards multidimensional
genome annotation. Nat Rev Genet 7: 130–141.
2. Reed JL, Patel TR, Chen KH, Joyce AR, Applebee MK, et al. (2006) Systems
approach to refining genome annotation. Proc Natl Acad Sci U S A 103:
17480–17484.
3. Burgard AP, Pharkya P, Maranas CD (2003) Optknock: a bilevel programming
framework for identifying gene knockout strategies for microbial strain
optimization. Biotechnol Bioeng 84: 647–657.
4. Oliveira AP, Nielsen J, Forster J (2005) Modeling Lactococcus lactis using a
genome-scale flux model. BMC Microbiol 5: 39.
5. Alper H, Jin YS, Moxley JF, Stephanopoulos G (2005) Identifying gene targets
for the metabolic engineering of lycopene biosynthesis in Escherichia coli. Metab
Eng 7: 155–164.
6. Pharkya P, Maranas CD (2006) An optimization framework for identifying
reaction activation/inhibition or elimination candidates for overproduction in
microbial systems. Metab Eng 8: 1–13.
7. Almaas E, Kovacs B, Vicsek T, Oltvai ZN, Barabasi AL (2004) Global
organization of metabolic fluxes in the bacterium Escherichia coli. Nature 427:
839–843.
8. Burgard AP, Nikolaev EV, Schilling CH, Maranas CD (2004) Flux coupling
analysis of genome-scale metabolic network reconstructions. Genome Res 14:
301–312.
9. Motter AE, Gulbahce N, Almaas E, Barabasi AL (2008) Predicting synthetic
rescues in metabolic networks. Mol Syst Biol 4: 168.
10. Jin YS, Jeffries TW (2004) Stoichiometric network constraints on xylose
metabolism by recombinant Saccharomyces cerevisiae. Metab Eng 6: 229–238.
11. Lee DY, Fan LT, Park S, Lee SY, Shafie S, et al. (2005) Complementary
identification of multiple flux distributions and multiple metabolic pathways.
Metab Eng 7: 182–200.
12. Jamshidi N, Palsson BO (2007) Investigating the metabolic capabilities of
Mycobacterium tuberculosis H37Rv using the in silico strain iNJ661 and
proposing alternative drug targets. BMC Syst Biol 1: 26.
13. Liolios K, Tavernarakis N, Hugenholtz P, Kyrpides NC (2006) The Genomes
On Line Database (GOLD) v.2: a monitor of genome projects worldwide.
Nucleic Acids Res 34: D332–D334.
14. Kim HU, Kim TY, Lee SY (2008) Metabolic flux analysis and metabolic
engineering of microorganisms. Mol Biosyst 4: 113–120.
15. Feist AM, Herrgard MJ, Thiele I, Reed JL, Palsson BØ (2008) Reconstruction of
biochemical networks in microorganisms. Nat Rev Microbiol; In press.
doi:10.1038/nrmicro1949.
16. Karp PD, Paley S, Romero P (2002) The Pathway Tools software.
Bioinformatics 18: S225–S232.
17. Satish Kumar V, Dasika MS, Maranas CD (2007) Optimization based
automated curation of metabolic reconstructions. BMC Bioinformatics 8: 212.
In Silico M. genitalium Metabolic Reconstruction
PLoS Computational Biology | www.ploscompbiol.org 12 February 2009 | Volume 5 | Issue 2 | e1000285

18. Fraser C, Gocayne J, White O, Adams M, Clayton R, et al. (1995) The minimal
gene complement of Mycoplasma genitalium. Science 270: 397–403.
19. Glass J, Assad-Garcia N, Alperovich N, Yooseph S, Lewis M, et al. (2006)
Essential genes of a minimal bacterium. Proc Natl Acad Sci U S A 103:
425–430.
20. Dybvig K, Voelker L (1996) Molecular biology of mycoplasmas. Annu Rev
Microbiol 50: 25–57.
21. Koonin EV (2000) How many genes can make a cell: the minimal-gene-set
concept. Annu Rev Genomics Hum Genet 1: 99–116.
22. Mushegian AR, Koonin EV (1996) A minimal gene set for cellular life derived
by comparison of bacterial genomes. Proc Natl Acad Sci U S A 93:
10268–10273.
23. Jensen JS (2006) Mycoplasma genitalium infections. Diagnosis, clinical aspects,
and pathogenesis. Dan Med Bull 53: 1–27.
24. Kapiga SH, Sam NE, Mlay J, Aboud S, Ballard RC, et al. (2006) The
epidemiology of HIV-1 infection in northern Tanzania: results from a
community-based study. AIDS Care 18: 379–387.
25. Perez G, Skurnick JH, Denny TN, Stephens R, Kennedy CA, et al. (1998)
Herpes simplex type II and Mycoplasma genitalium as risk factors for
heterosexual HIV transmission: report from the heterosexual HIV transmission
study. Int J Infect Dis 3: 5–11.
26. Manhart LE, Mostad SB, Baeten JM, Astete SG, Mandaliya K, et al. (2008)
High Mycoplasma genitalium organism burden is associated with shedding of
HIV-1 DNA from the cervix. J Infect Dis 197: 733–736.
27. Maniloff J (2002) Phylogeny and Evolution. In: Molecular Biology and
Pathogenicity of Mycoplasmas. Razin S, Herrmann R, eds. New York: Kluwer
Academic/Plenum Publishers. pp 31–43.
28. Hackett KJ, Ginsberg AS, Rottem S, Henegar RB, Whitcomb RF (1987) A
defined medium for a fastidious Spiroplasma. Science 237: 525–527.
29. Rodwell AW (1969) A defined medium for Mycoplasma strain Y. J Gen
Microbiol 58: 39–47.
30. Tourtellotte ME, Morowitz HJ, Kasimer P (1964) Defined medium for
Mycoplasma laidlawii. J Bacteriol 88: 11–15.
31. Tully JG, Rose DL, Whitcomb RF, Wenzel RP (1979) Enhanced isolation of
Mycoplasma pneumoniae from throat washings with a newly-modified culture
medium. J Infect Dis 139: 478–482.
32. Palsson B (2004) Two-dimensional annotation of genomes. Nat Biotechnol 22:
1218–1219.
33. Feist AM, Henry CS, Reed JL, Krummenacker M, Joyce AR, et al. (2007) A
genome-scale metabolic reconstruction for Escherichia coli K-12 MG1655 that
accounts for 1260 ORFs and thermodynamic information. Mol Syst Biol 3: 121.
34. Pollack JD, Myers MA, Dandekar T, Herrmann R (2002) Suspected utility of
enzymes with multiple activities in the small genome Mycoplasma species: the
replacement of the missing ‘‘household’’ nucleoside diphosphate kinase gene and
activity by glycolytic kinases. Omics 6: 247–258.
35. Tatusov RL, Fedorova ND, Jackson JD, Jacobs AR, Kiryutin B, et al. (2003)
The COG database: an updated version includes eukaryotes. BMC Bioinfor-
matics 4: 41.
36. Becker SA, Palsson BO (2005) Genome-scale reconstruction of the metabolic
network in Staphylococcus aureus N315: an initial draft to the two-dimensional
annotation. BMC Microbiol 5: 8.
37. Varma A, Palsson BO (1995) Parametric sensitivity of stoichiometric flux
balance models applied to wild-type Escherichia coli metabolism. Biotechnol
Bioeng 45: 69–79.
38. Becker SA, Palsson BO (2008) Three factors underlying incorrect in silico
predictions of essential metabolic genes. BMC Syst Biol 2: 14.
39. Nookaew I, Jewett MC, Meechai A, Thammarongtham C, Laoteng K, et al.
(2008) The genome-scale metabolic model iIN800 of Saccharomyces cerevisiae
and its validation: a scaffold to query lipid metabolism. BMC Syst Biol 2: 71.
40. Dibb NJ, Wolfe PB (1986) lep operon proximal gene is not required for growth
or secretion by Escherichia coli. J Bacteriol 166: 83–87.
41. Bizarro CV, Schuck DC (2007) Purine and pyrimidine nucleotide metabolism in
mollicutes. Genet Mol Biol 30: 190–201.
42. Rodwell AW (1983) Defined or partly defined media. In: Methods in
Mycoplasmology. Razin S, Tully JG, eds. New York: Academic Press. Vol 1.
pp 163–172.
43. Rodwell AW, Mitchell A (1979) Nutrition, Growth and Reporduction.
Barile MF, Razin S, eds. London: Academic Press.
44. Chang C, Chen T (1982) Spiroplasmas: cultivation in chemically defined
medium. Science 215: 1121–1122.
45. Ramirez AS, Fleitas JL, Rosales RS, Poveda C, de la Fe C, et al. (2008) A semi-
defined medium without serum for small ruminant mycoplasmas. Vet J 178:
149–152.
46. Varma A, Palsson BO (1994) Metabolic flux balancing: basic concepts, scientific
and practical use. Nat Biotechnol 12: 994–998.
47. Edwards JS, Palsson BO (2000) Metabolic flux balance analysis and the in silico
analysis of Escherichia coli K-12 gene deletions. BMC Bioinformatics 1: 1.
48. Edwards JS, Covert M, Palsson B (2002) Metabolic modelling of microbes: the
flux-balance approach. Environ Microbiol 4: 133–140.
49. Burgard A, Vaidyaraman S, Maranas C (2001) Minimal reaction sets for
Escherichia coli metabolism under different growth requirements and uptake
environments. Biotechnol Prog 17: 791–797.
50. Schilling CH, Covert MW, Famili I, Church GM, Edwards JS, et al. (2002)
Genome-scale metabolic model of Helicobacter pylori 26695. J Bacteriol 184:
4582–4593.
51. Feist AM, Scholten JC, Palsson BO, Brockman FJ, Ideker T (2006) Modeling
methanogenesis with a genome-scale metabolic reconstruction of Methanosar-
cina barkeri. Mol Syst Biol 2: 2006.0004.
52. Baart GJ, Zomer B, de Haan A, van der Pol LA, Beuvery EC, et al. (2007)
Modeling Neisseria meningitidis metabolism: from genome to metabolic fluxes.
Genome Biol 8: R136.
53. Song H, Kim TY, Choi BK, Choi SJ, Nielsen LK, et al. (2008) Development of
chemically defined medium for Mannheimia succiniciproducens based on its
genome sequence. Appl Microbiol Biotechnol 79: 263–272.
54. Claudel-Renard C, Chevalet C, Faraut T, Kahn D (2003) Enzyme-specific
profiles for genome annotation: PRIAM. Nucleic Acids Res 31: 6633–6639.
55. Tian W, Arakaki AK, Skolnick J (2004) EFICAz: a comprehensive approach for
accurate genome-scale enzyme function inference. Nucleic Acids Res 32:
6226–6239.
56. Hatzimanikatis V, Li C, Ionita JA, Henry CS, Jankowski MD, et al. (2005)
Exploring the diversity of complex metabolic networks. Bioinformatics 21:
1603–1609.
57. Devos D, Valencia A (2001) Intrinsic errors in genome annotation. Trends
Genet 17: 429–431.
58. Green ML, Karp PD (2005) Genome annotation errors in pathway databases
due to semantic ambiguity in partial EC numbers. Nucleic Acids Res 33:
4035–4039.
59. Brenner SE (1999) Errors in genome annotation. Trends Genet 15: 132–133.
60. Francke C, Siezen RJ, Teusink B (2005) Reconstructing the metabolic network
of a bacterium from its genome. Trends Microbiol 13: 550–558.
61. Notebaart RA, van Enckevort FH, Francke C, Siezen RJ, Teusink B (2006)
Accelerating the reconstruction of genome-scale metabolic networks. BMC
Bioinformatics 7: 296.
62. Pharkya P, Burgard AP, Maranas CD (2004) OptStrain: a computational
framework for redesign of microbial production systems. Genome Res 14:
2367–2376.
63. Pollack JD, Williams MV, McElhaney RN (1997) The comparative metabolism
of the mollicutes (Mycoplasmas): the utility for taxonomic classification and the
relationship of putative gene annotation and phylogeny to enzymatic function in
the smallest free-living cells. Crit Rev Microbiol 23: 269–354.
64. Pollack JD (2002) The necessity of combining genomic and enzymatic data to
infer metabolic function and pathways in the smallest bacteria: amino acid,
purine and pyrimidine metabolism in Mollicutes. Front Biosci 7: d1762–d1781.
65. Lartigue C, Glass JI, Alperovich N, Pieper R, Parmar PP, et al. (2007) Genome
transplantation in bacteria: changing one species to another. Science 317:
632–638.
66. Gibson DG, Benders GA, Andrews-Pfannkoch C, Denisova EA, Baden-
Tillson H, et al. (2008) Complete chemical synthesis, assembly, and cloning of
a Mycoplasma genitalium genome. Science 319: 1215–1220.
67. Wasinger VC, Pollack JD, Humphery-Smith I (2000) The proteome of
Mycoplasma genitalium. Chaps-soluble component. Eur J Biochem 267:
1571–1582.
68. Oh YK, Palsson BO, Park SM, Schilling CH, Mahadevan R (2007) Genome-
scale reconstruction of metabolic network in Bacillus subtilis based on high-
throughput phenotyping and gene essentiality data. J Biol Chem 282:
28791–28799.
69. Vallino JJ, Stephanopoulos G (1993) Metabolic flux distributions in Corynebac-
terium glutamicum during growth and lysine overproduction. Biotechnol Bioeng 41:
633–646.
70. Reed JL, Vo TD, Schilling CH, Palsson BO (2003) An expanded genome-scale
model of Escherichia coli K-12 (iJR904 GSM/GPR). Genome Biol 4: R54.
71. Kanehisa M, Araki M, Goto S, Hattori M, Hirakawa M, et al. (2008) KEGG for
linking genomes to life and the environment. Nucleic Acids Res 36: D480–D484.
72. Caspi R, Foerster H, Fulcher CA, Kaipa P, Krummenacker M, et al. (2008) The
MetaCyc Database of metabolic pathways and enzymes and the BioCyc
collection of Pathway/Genome Databases. Nucleic Acids Res 36: D623–D631.
73. Joyce AR, Reed JL, White A, Edwards R, Osterman A, et al. (2006)
Experimental and computational assessment of conditionally essential genes in
Escherichia coli. J Bacteriol 188: 8259–8271.
74. Beijer L, Nilsson RP, Holmberg C, Rutberg L (1993) The glpP and glpF genes of
the glycerol regulon in Bacillus subtilis. J Gen Microbiol 139: 349–359.
75. Saito H, Tomioka H (1984) Thymidine kinase of bacteria: activity of the enzyme
in actinomycetes and related organisms. J Gen Microbiol 130: 1863–1870.
76. Oliva G, Romero I, Ayala G, Barrios-Jacobo I, Celis H (2000) Characterization
of the inorganic pyrophosphatase from the pathogenic bacterium Helicobacter
pylori. Arch Microbiol 174: 104–110.
77. Foster SJ, Popham DV (2002) Structure and synthesis of cell wall, spore cortex,
teichoic acids, S-layers, and capsules. In: Bacillus subtilis and Its Closest
Relatives: From Genes to Cells. Sonenshein AL, Hoch JA, Losick R, eds.
Washington, D.C.: ASM Press. pp 21–41.
78. Deutscher J, Galinier A, Martin-Verstraete I (2002) Carbohydrate uptake and
metabolism. In: Bacillus subtilis and Its Closest Relatives: From Genes to Cells.
Sonenshein AL, Hoch JA, Losick R, eds. Washington, D.C.: ASM Press. pp
129–150.
In Silico M. genitalium Metabolic Reconstruction
PLoS Computational Biology | www.ploscompbiol.org 13 February 2009 | Volume 5 | Issue 2 | e1000285

79. Charlier J, Gerlo E (1979) Arginyl-tRNA synthetase from Escherichia coli K12.
Purification, properties, and sequence of substrate addition. Biochemistry 18:3171–3178.
80. Kobayashi K, Ehrlich SD, Albertini A, Amati G, Andersen KK, et al. (2003)
Essential Bacillus subtilis genes. Proc Natl Acad Sci U S A 100: 4678–4683.
In Silico M. genitalium Metabolic Reconstruction
PLoS Computational Biology | www.ploscompbiol.org 14 February 2009 | Volume 5 | Issue 2 | e1000285