Embed Size (px)
Citation preview
Generation of spatially and temporally consistent pollution data over urban areas via unified remote sensing image fusion
Huang, Bo
Institute of Space and Earth Information ScienceDepartment of Geography & Resource Management
The Chinese University of Hong KongE-mail: [email protected]
Outline
• Remote sensing (RS)• Previous and current work
– Unified RS image fusion– Generation of high resolution air pollution data– Pollution data access using mobile phones
• Future intended work
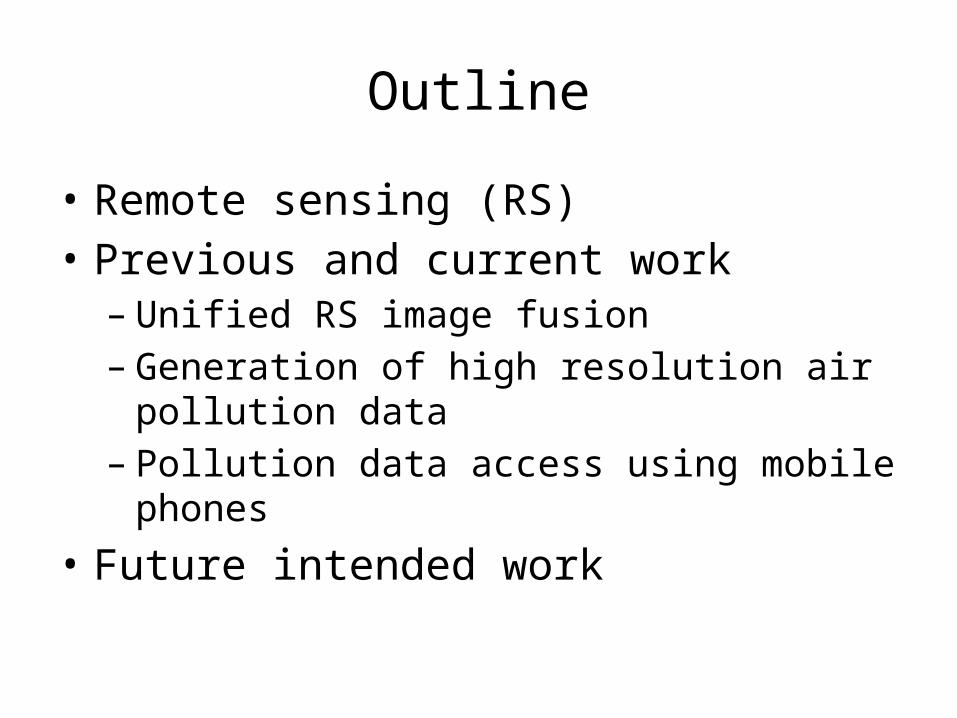
NASA’s Polar-Orbiting Satellites
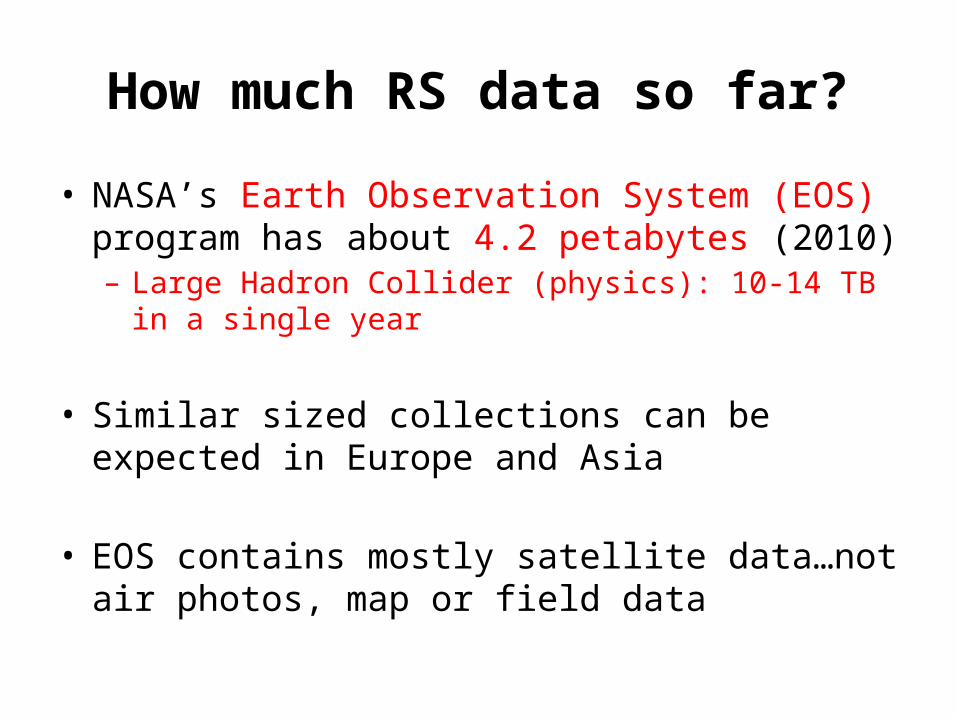
How much RS data so far?
• NASA’s Earth Observation System (EOS) program has about 4.2 petabytes (2010)– Large Hadron Collider (physics): 10-14 TB in a single year
• Similar sized collections can be expected in Europe and Asia
• EOS contains mostly satellite data…not air photos, map or field data
Researchers and users often use the data they can get, not the data they truly need.
遙感研究者與使用者只能使用它們能得到的数据,而不是他們真正想要的数据。
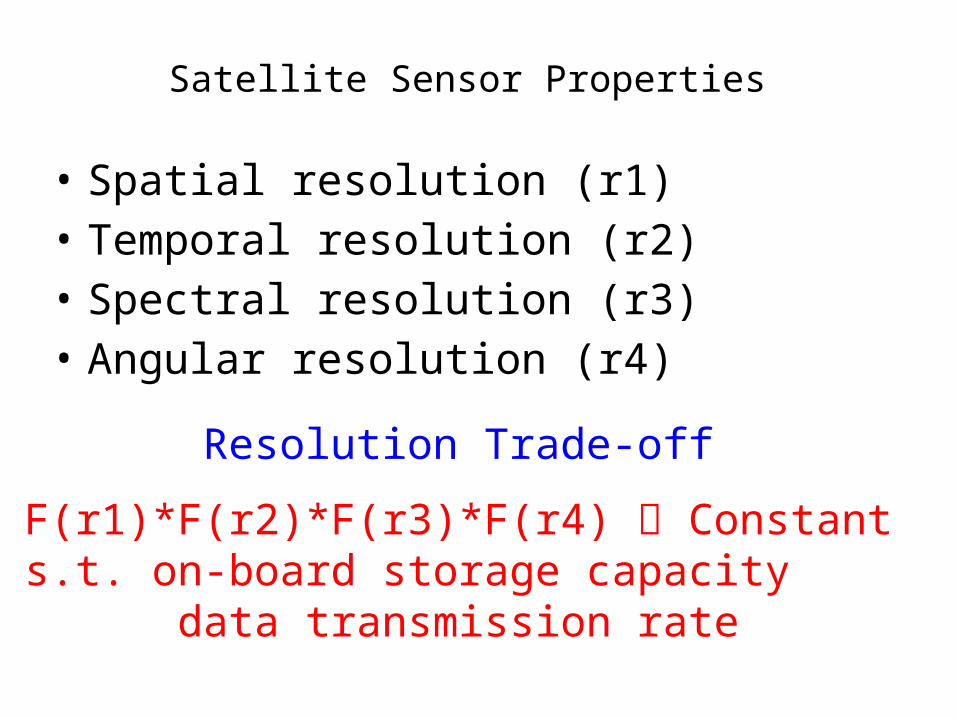
Satellite Sensor Properties
• Spatial resolution (r1)• Temporal resolution (r2)• Spectral resolution (r3)• Angular resolution (r4)
F(r1)*F(r2)*F(r3)*F(r4) Constants.t. on-board storage capacity data transmission rate
Resolution Trade-off
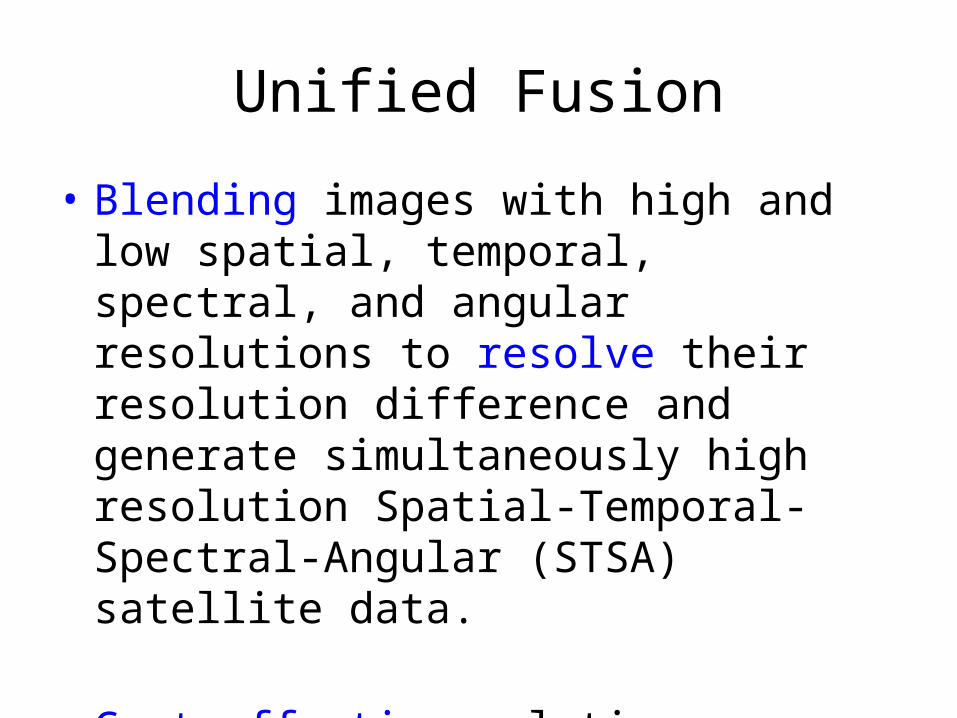
Unified Fusion
• Blending images with high and low spatial, temporal, spectral, and angular resolutions to resolve their resolution difference and generate simultaneously high resolution Spatial-Temporal-Spectral-Angular (STSA) satellite data.
• Cost-effective solution.
?
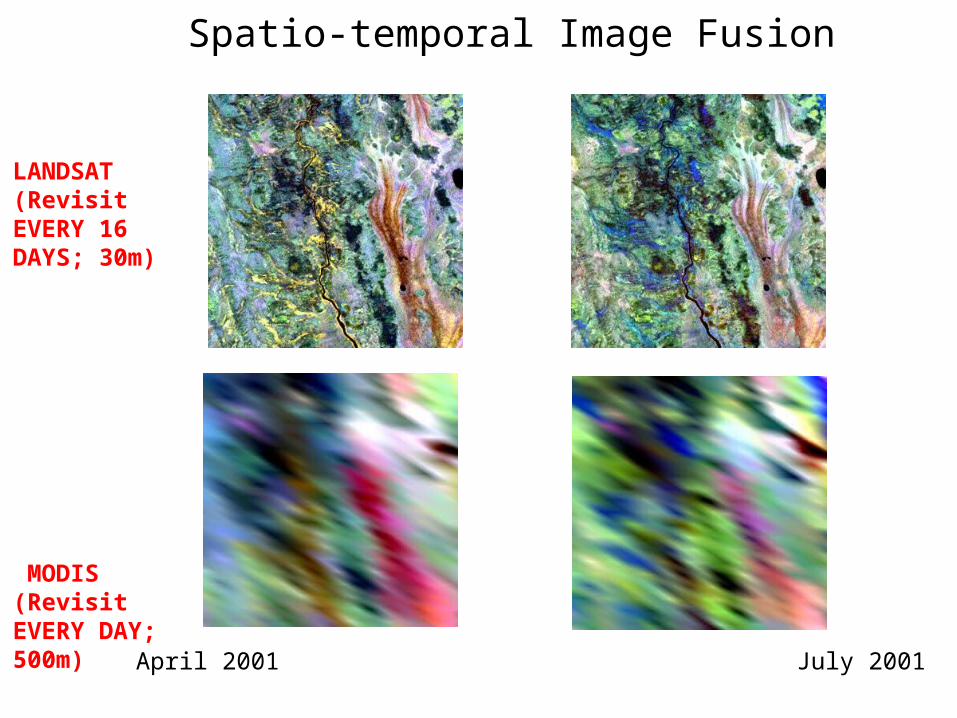
Spatio-temporal Image Fusion
April 2001 July 2001
LANDSAT (Revisit EVERY 16 DAYS; 30m)
MODIS (Revisit EVERY DAY; 500m)
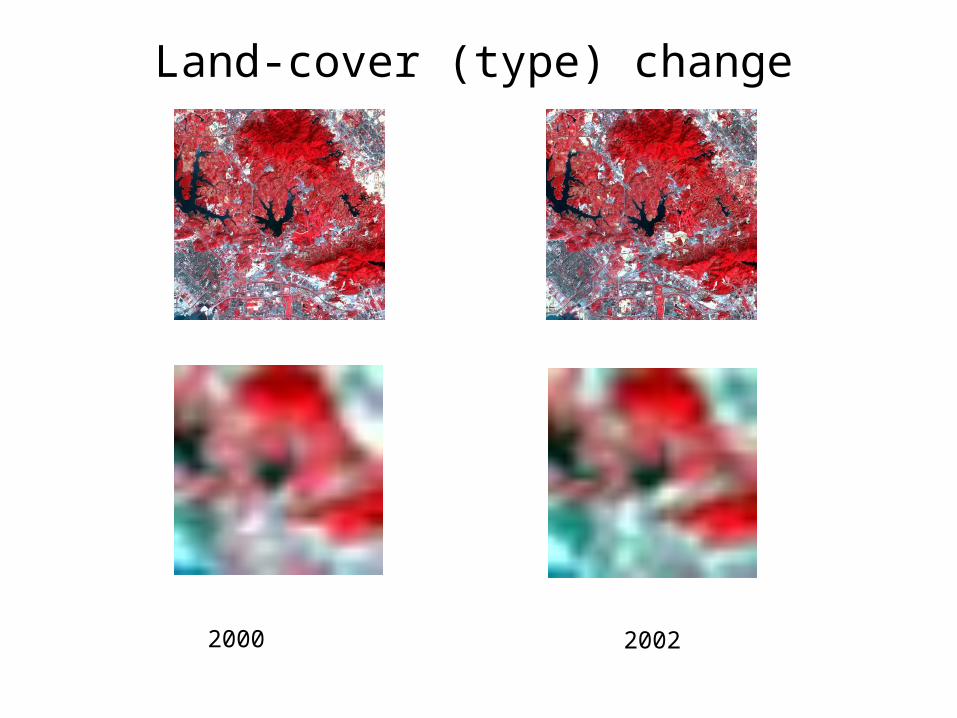
Land-cover (type) change
?
2000 2002
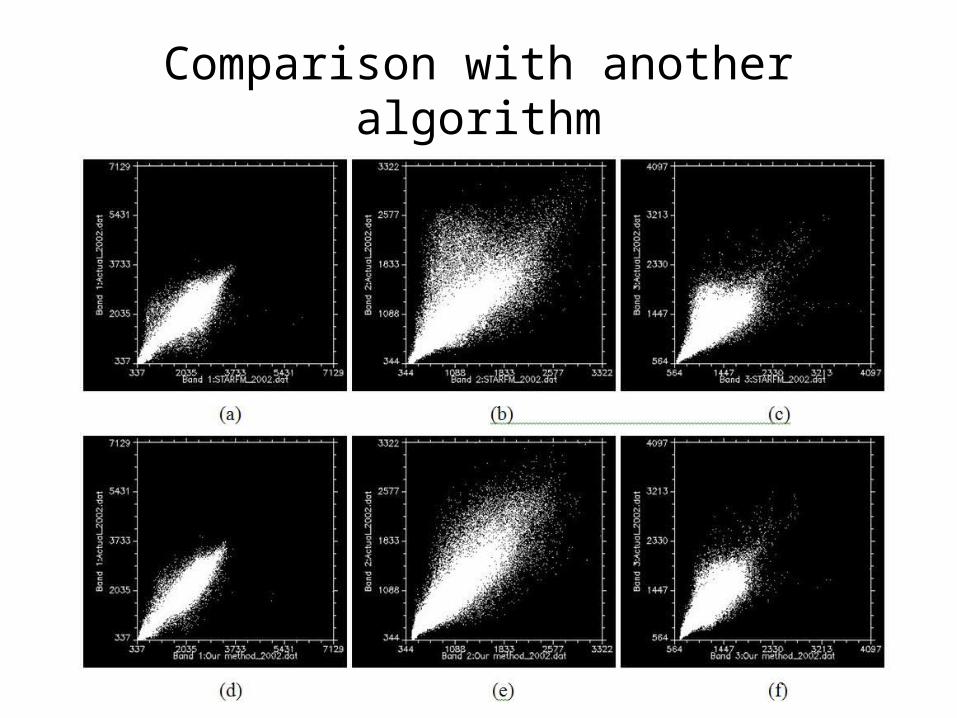
Comparison with another algorithm
……
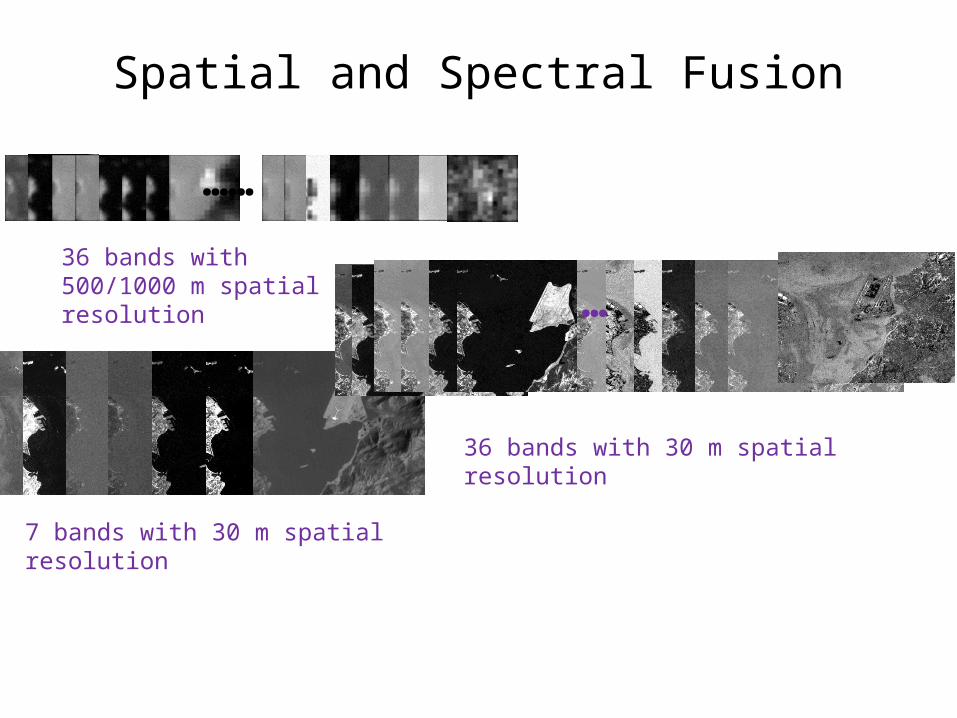
…36 bands with 500/1000 m spatial resolution
7 bands with 30 m spatial resolution
36 bands with 30 m spatial resolution
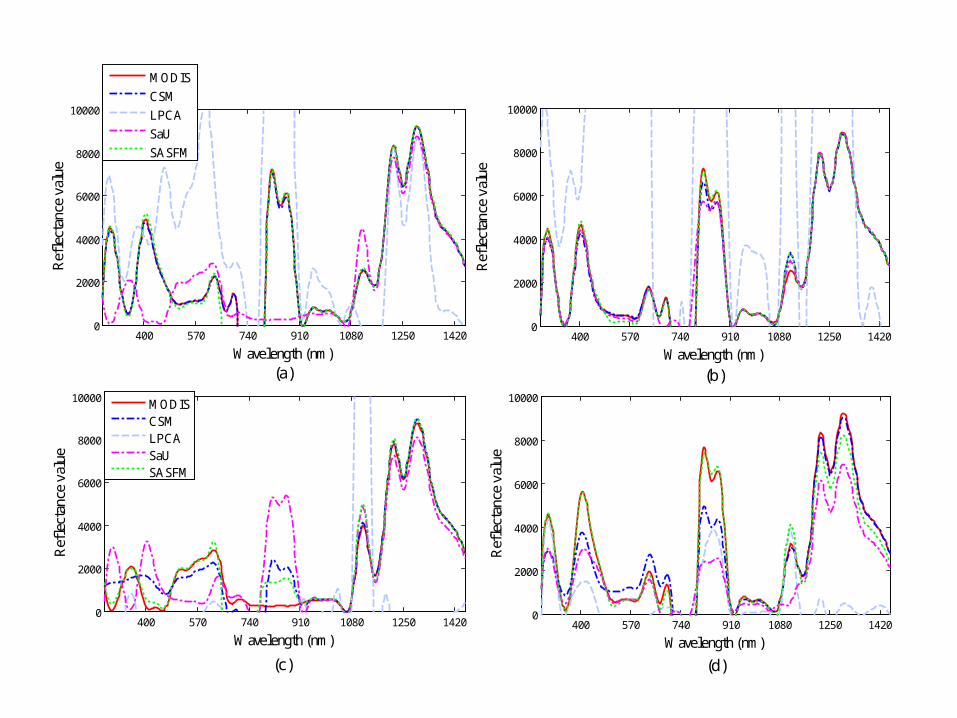
Spatial and Spectral Fusion
400 570 740 910 1080 1250 14200
2000
4000
6000
8000
10000
Wavelength (nm)
Ref
lect
ance
val
ue
400 570 740 910 1080 1250 14200
2000
4000
6000
8000
10000
Wavelength (nm)
Ref
lect
ance
val
ue
MODIS
CSM
LPCA
SaU
SASFM
400 570 740 910 1080 1250 14200
2000
4000
6000
8000
10000
Wavelength (nm)
Ref
lect
ance
val
ue
MODISCSMLPCASaUSASFM
400 570 740 910 1080 1250 14200
2000
4000
6000
8000
10000
Wavelength (nm)
Ref
lect
ance
val
ue
(b)(a)
(c) (d)
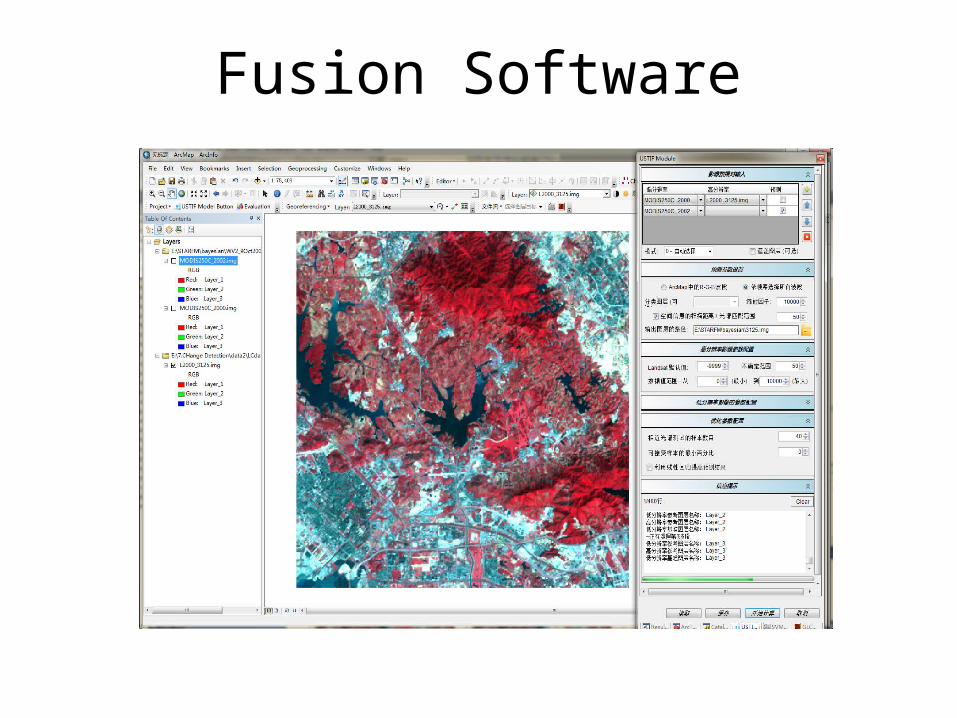
Fusion Software
Retrieval of Air Pollutants from Fused Satellite Imagery
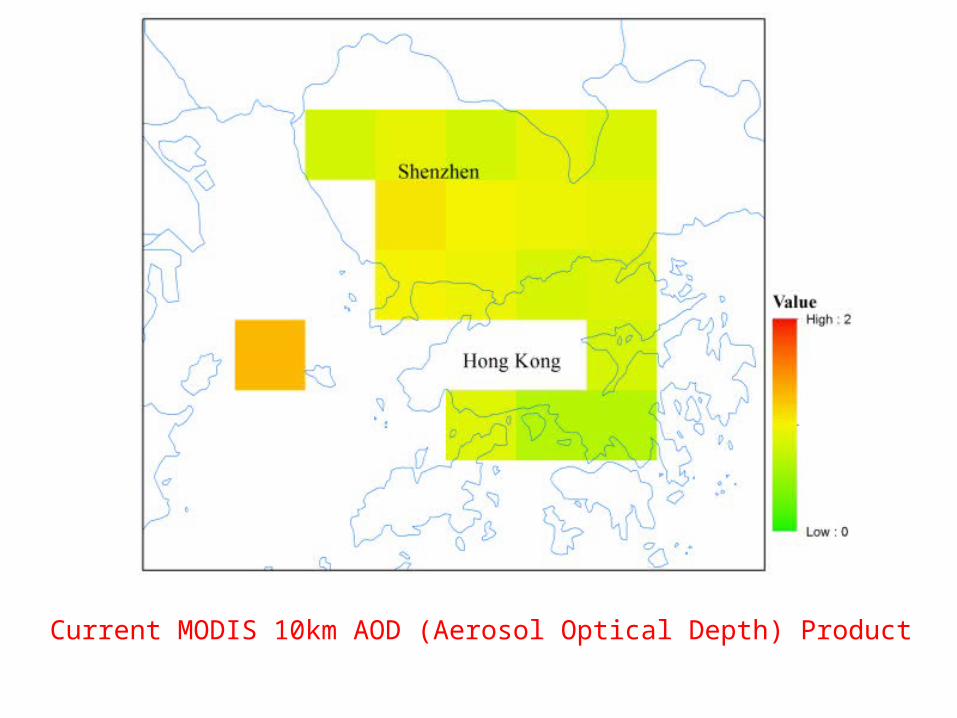
Current MODIS 10km AOD (Aerosol Optical Depth) Product
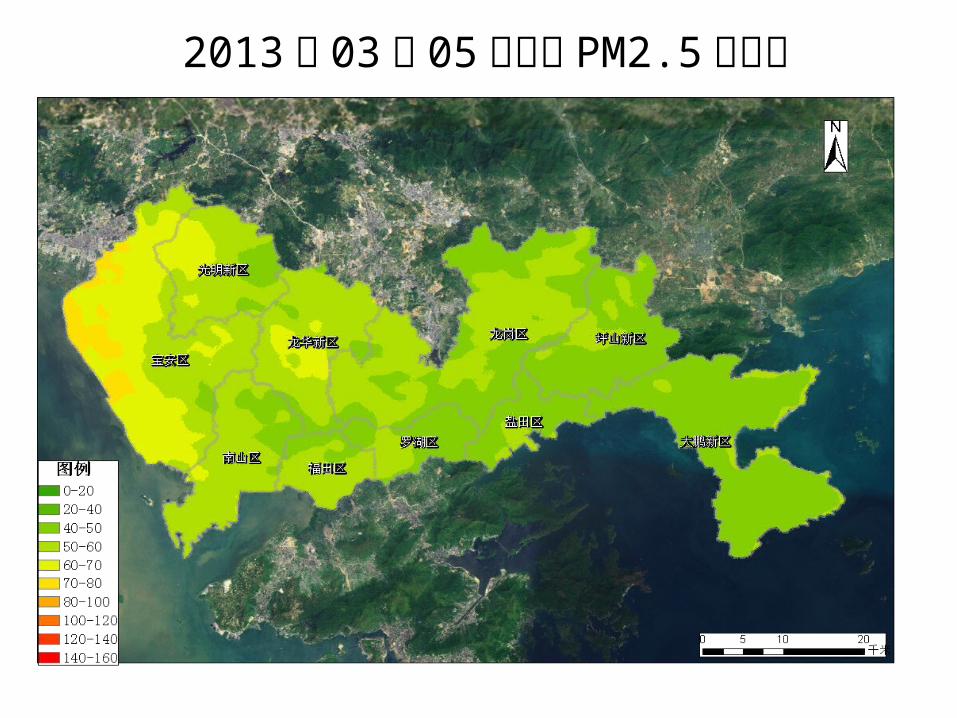
2013 年 03 月 05 日深圳 PM2.5 反演图
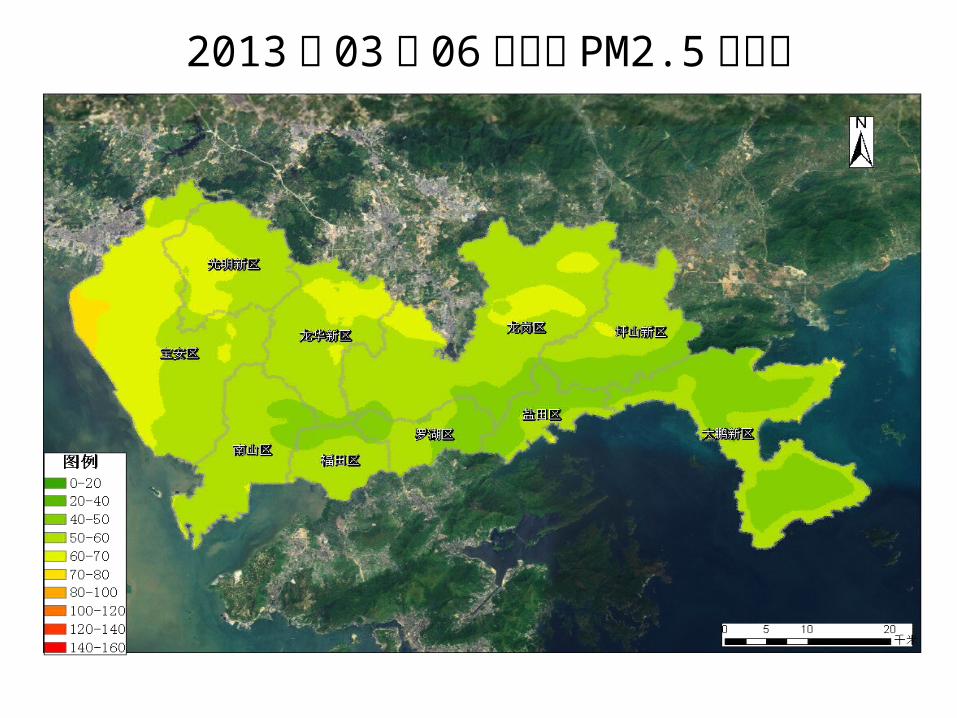
2013 年 03 月 06 日深圳 PM2.5 反演图
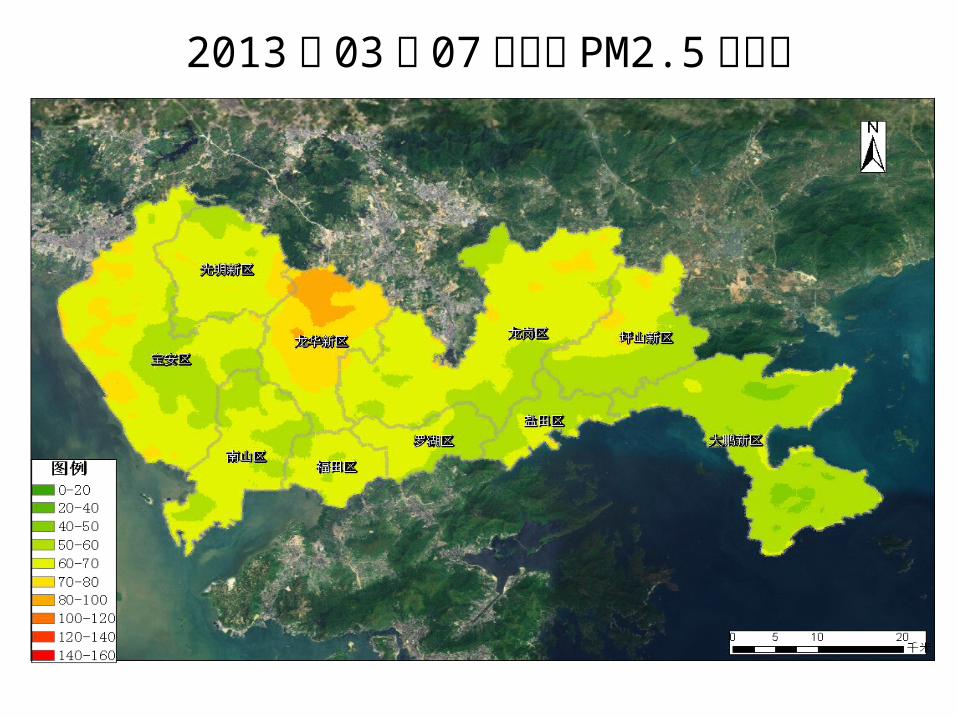
2013 年 03 月 07 日深圳 PM2.5 反演图
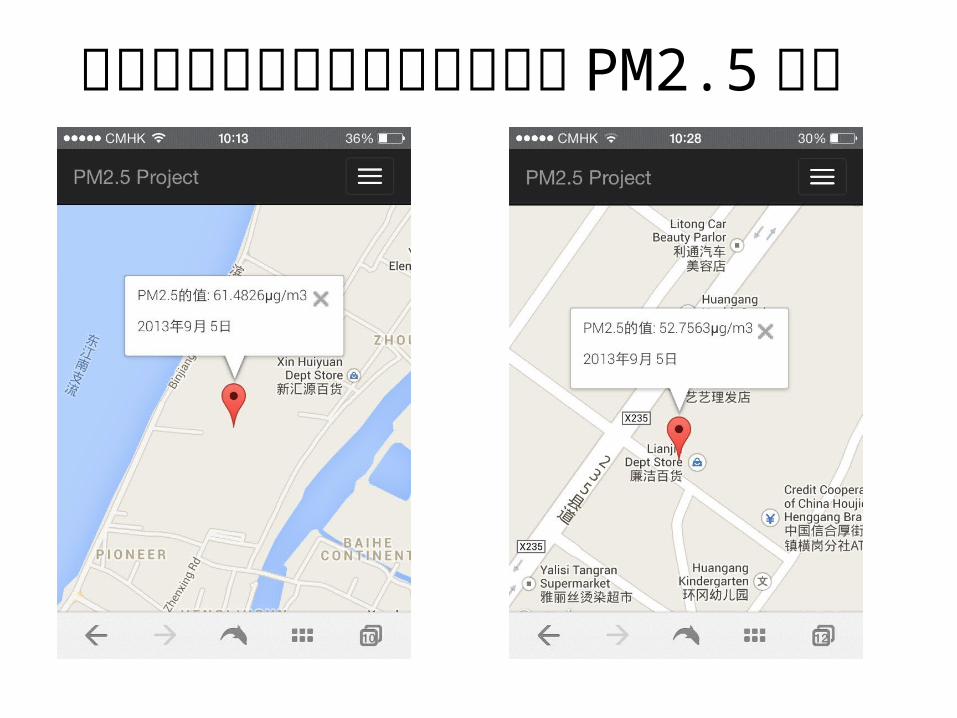
智能手机应用程序获取指定位置 PM2.5的值
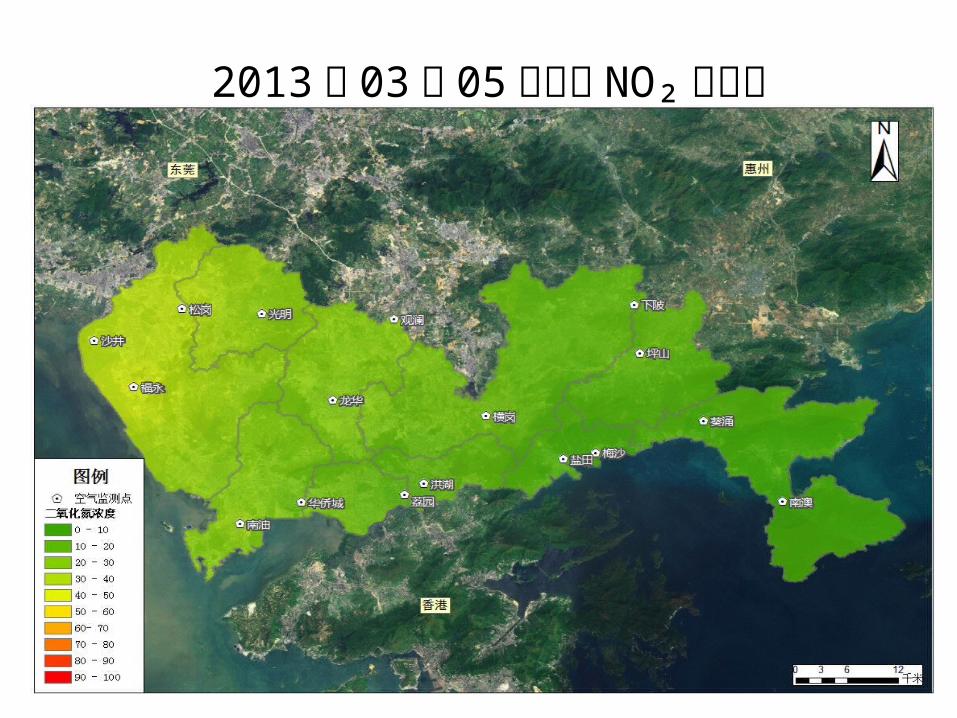
2013 年 03 月 05 日深圳 NO₂ 反演图
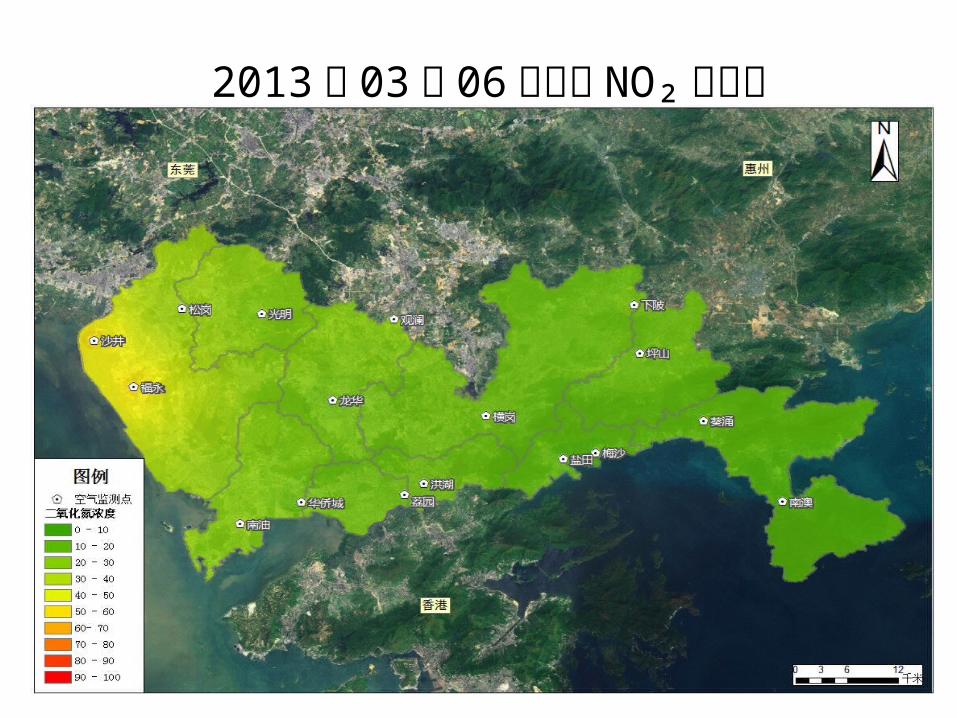
2013 年 03 月 06 日深圳 NO₂ 反演图
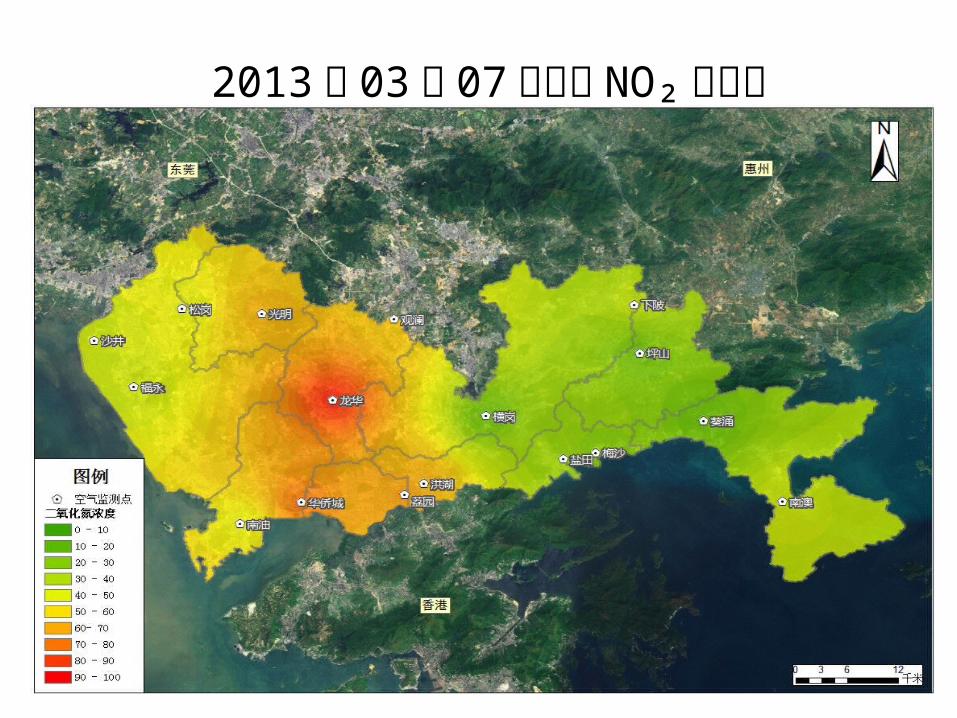
2013 年 03 月 07 日深圳 NO₂ 反演图
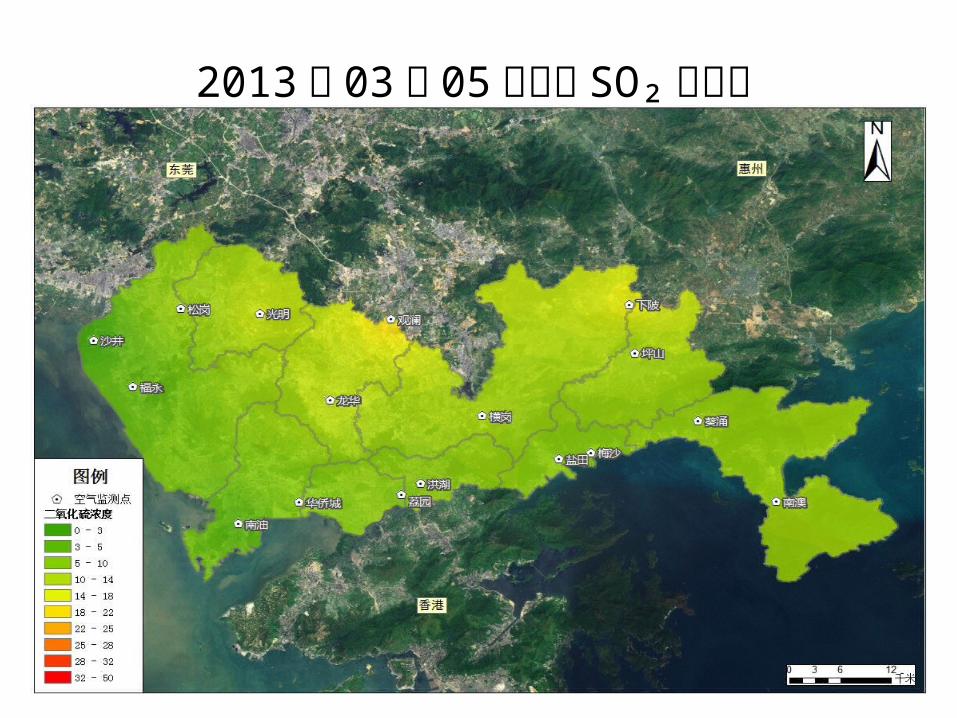
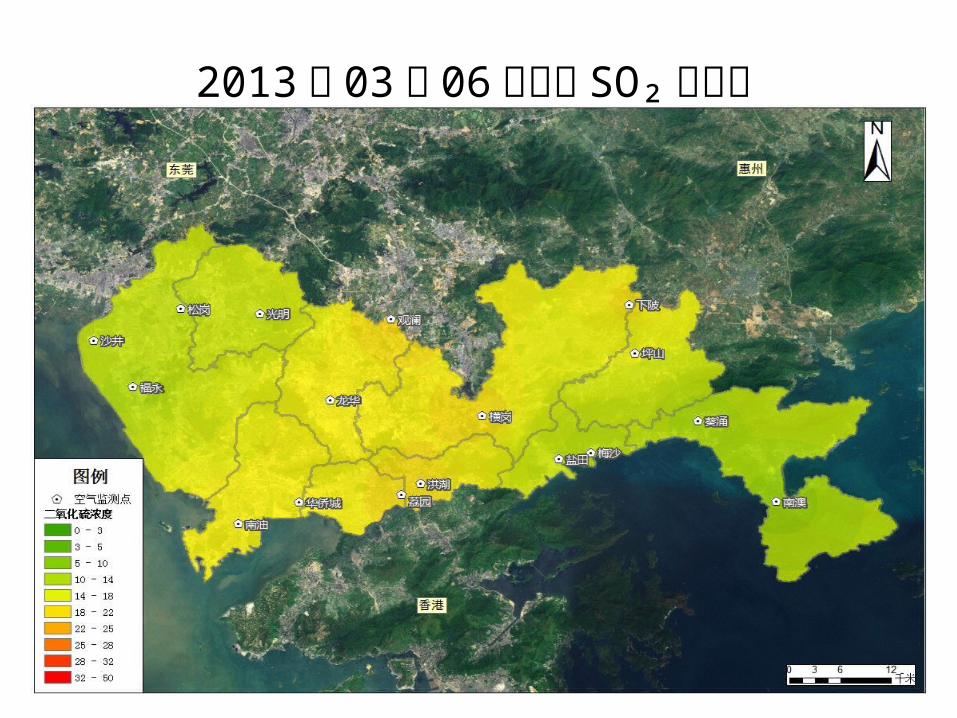
2013 年 03 月 05 日深圳 SO₂ 反演图
2013 年 03 月 06 日深圳 SO₂ 反演图
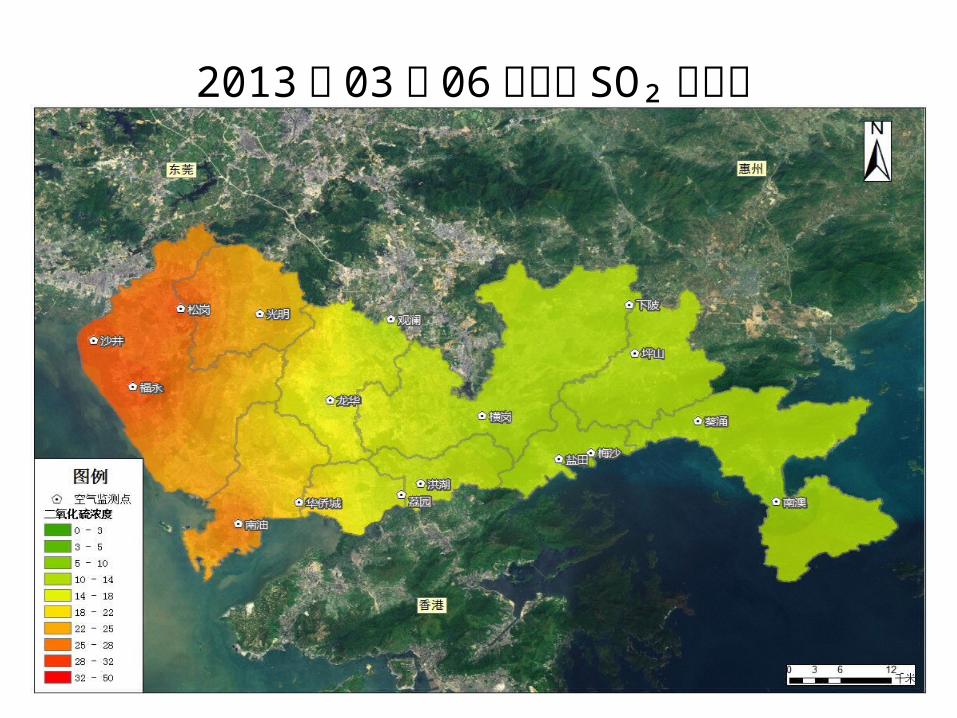
2013 年 03 月 06 日深圳 SO₂ 反演图
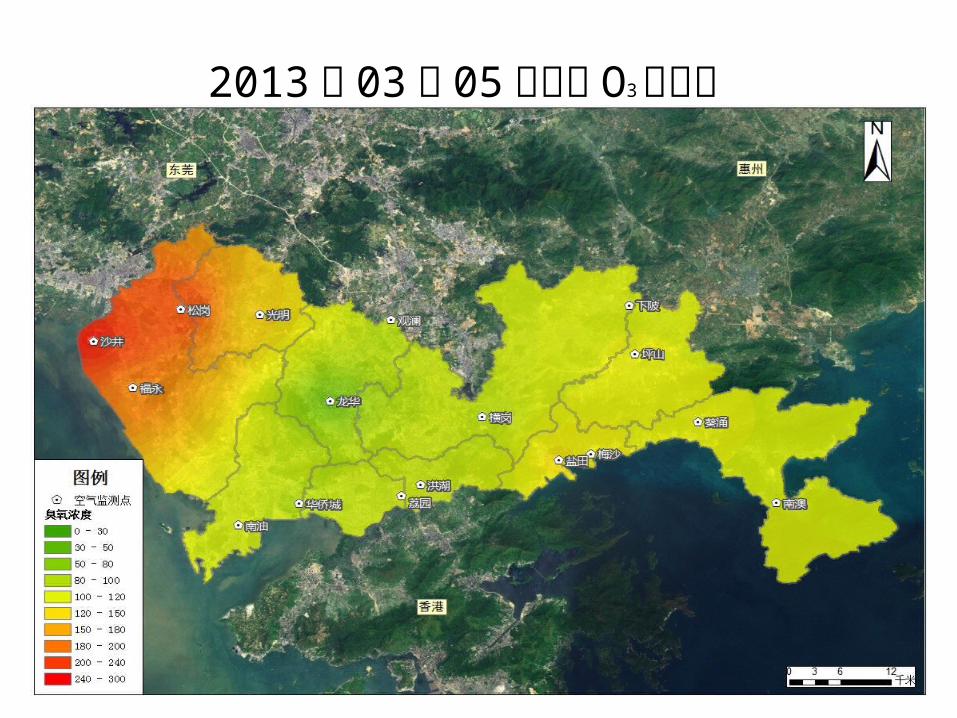
2013 年 03 月 05 日深圳 O3 反演图
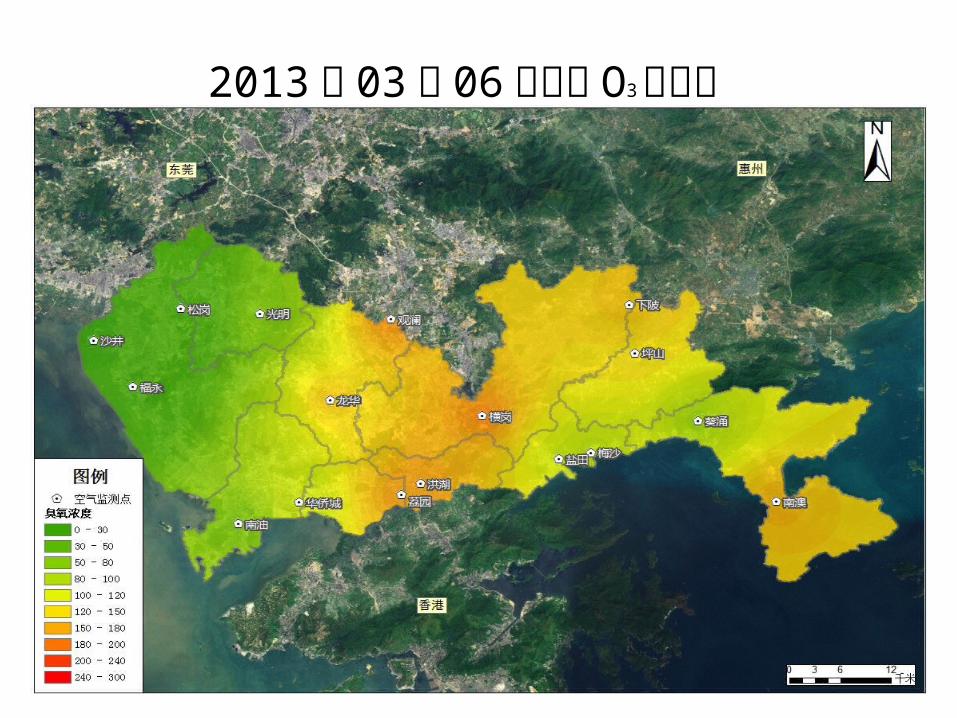
2013 年 03 月 06 日深圳 O3 反演图
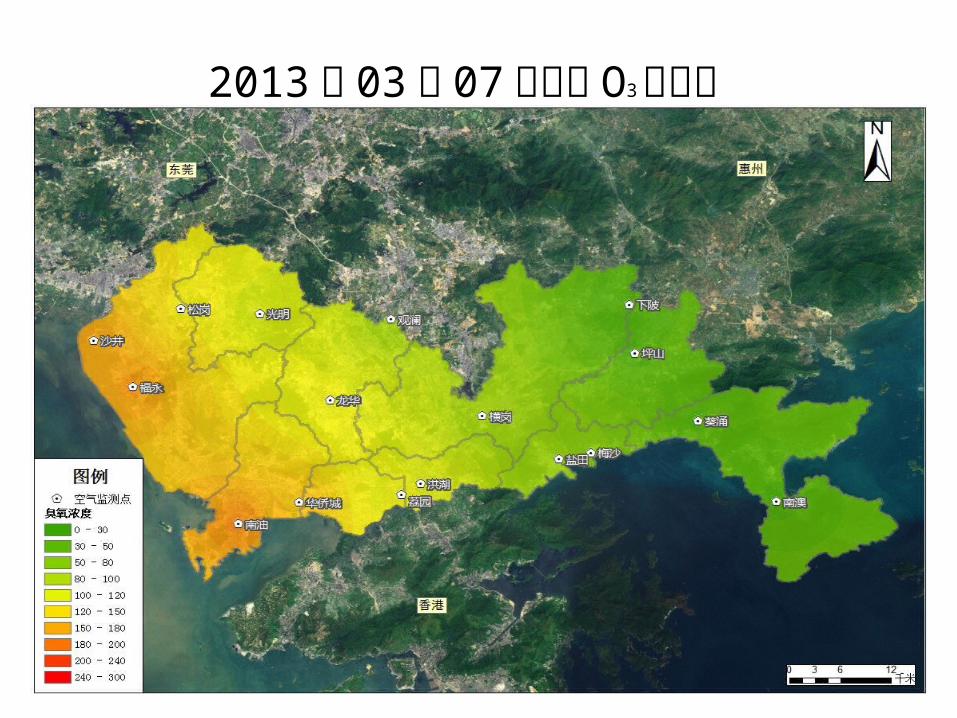
2013 年 03 月 07 日深圳 O3 反演图
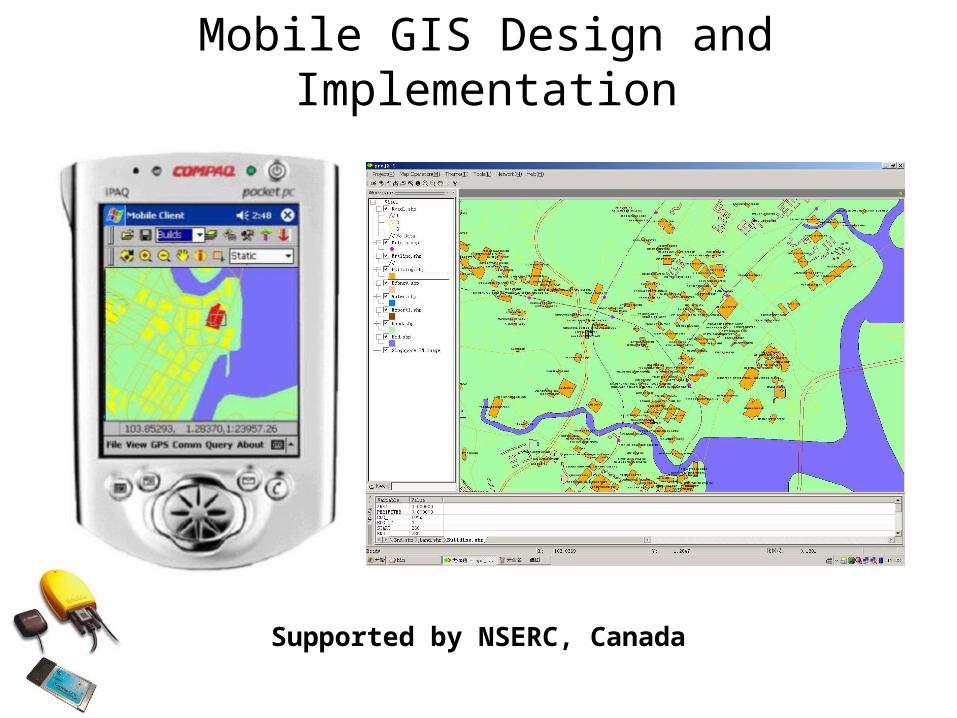
Mobile GIS Design and Implementation
Supported by NSERC, Canada
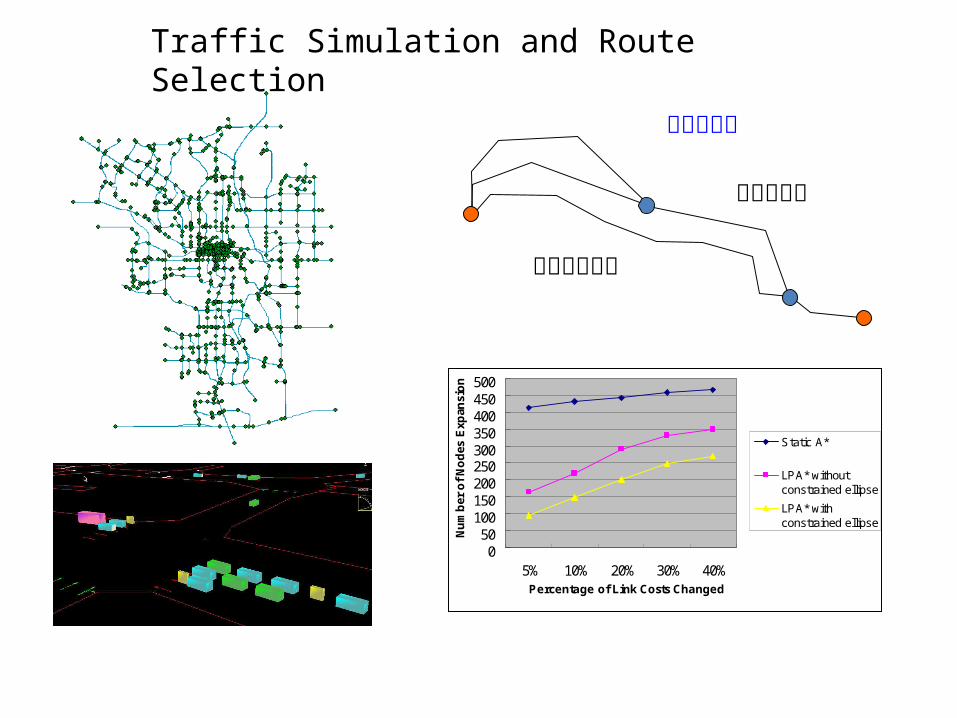
初始优化路径
改变的路径
050
100150200250300350400450500
5% 10% 20% 30% 40%Percentage of Link Costs Changed
Nu
mb
er o
f N
od
es E
xpan
sio
n
Static A*
LPA* withoutconstrained ellipse
LPA* withconstrained ellipse
渐进式优化
Traffic Simulation and Route Selection
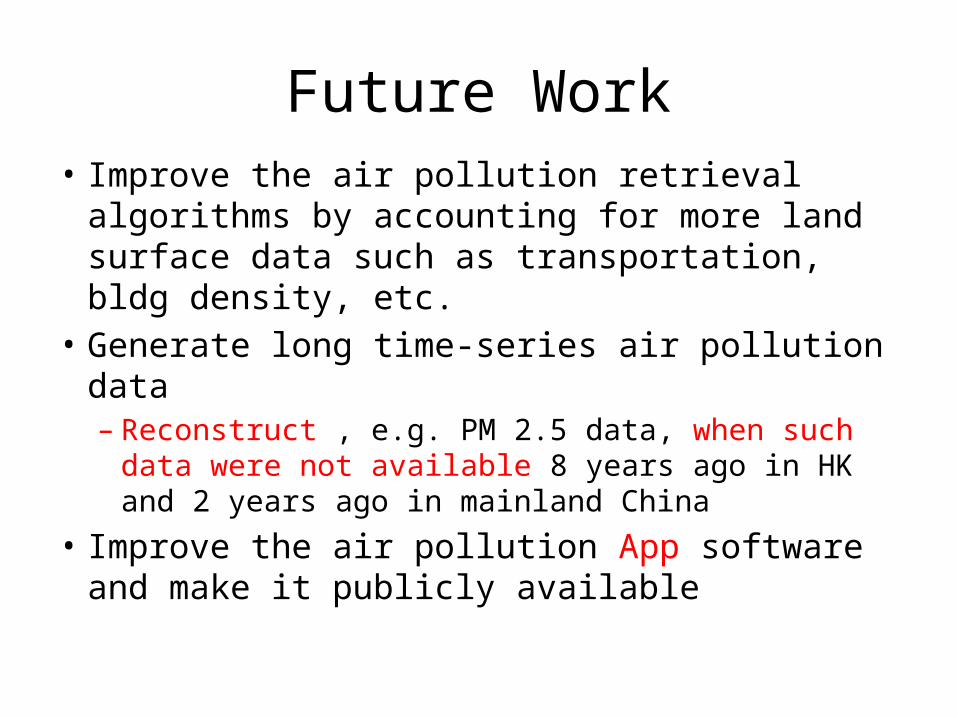
Future Work• Improve the air pollution retrieval algorithms
by accounting for more land surface data such as transportation, bldg density, etc.
• Generate long time-series air pollution data– Reconstruct , e.g. PM 2.5 data, when such data
were not available 8 years ago in HK and 2 years ago in mainland China
• Improve the air pollution App software and make it publicly available

Thank you!